Cayuga, OK Map & Demographics
Cayuga Map
Cayuga Overview
$28,757
PER CAPITA INCOME
$88,125
AVG FAMILY INCOME
$69,688
AVG HOUSEHOLD INCOME
27.6%
WAGE / INCOME GAP [ % ]
72.4¢/ $1
WAGE / INCOME GAP [ $ ]
0.32
INEQUALITY / GINI INDEX
150
TOTAL POPULATION
66
MALE POPULATION
84
FEMALE POPULATION
78.57
MALES / 100 FEMALES
127.27
FEMALES / 100 MALES
44.3
MEDIAN AGE
3.3
AVG FAMILY SIZE
3.1
AVG HOUSEHOLD SIZE
70
LABOR FORCE [ PEOPLE ]
56.5%
PERCENT IN LABOR FORCE
8.6%
UNEMPLOYMENT RATE
Income in Cayuga
Income Overview in Cayuga
Per Capita Income in Cayuga is $28,757, while median incomes of families and households are $88,125 and $69,688 respectively.
| Characteristic | Number | Measure |
| Per Capita Income | 150 | $28,757 |
| Median Family Income | 44 | $88,125 |
| Mean Family Income | 44 | $89,175 |
| Median Household Income | 49 | $69,688 |
| Mean Household Income | 49 | $83,124 |
| Income Deficit | 44 | $0 |
| Wage / Income Gap (%) | 150 | 27.63% |
| Wage / Income Gap ($) | 150 | 72.37¢ per $1 |
| Gini / Inequality Index | 150 | 0.32 |
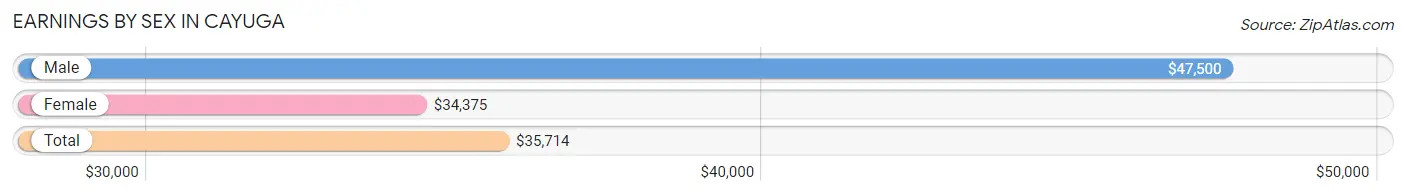
Earnings by Sex in Cayuga
Average Earnings in Cayuga are $35,714, $47,500 for men and $34,375 for women, a difference of 27.6%.
| Sex | Number | Average Earnings |
| Male | 36 (56.2%) | $47,500 |
| Female | 28 (43.8%) | $34,375 |
| Total | 64 (100.0%) | $35,714 |
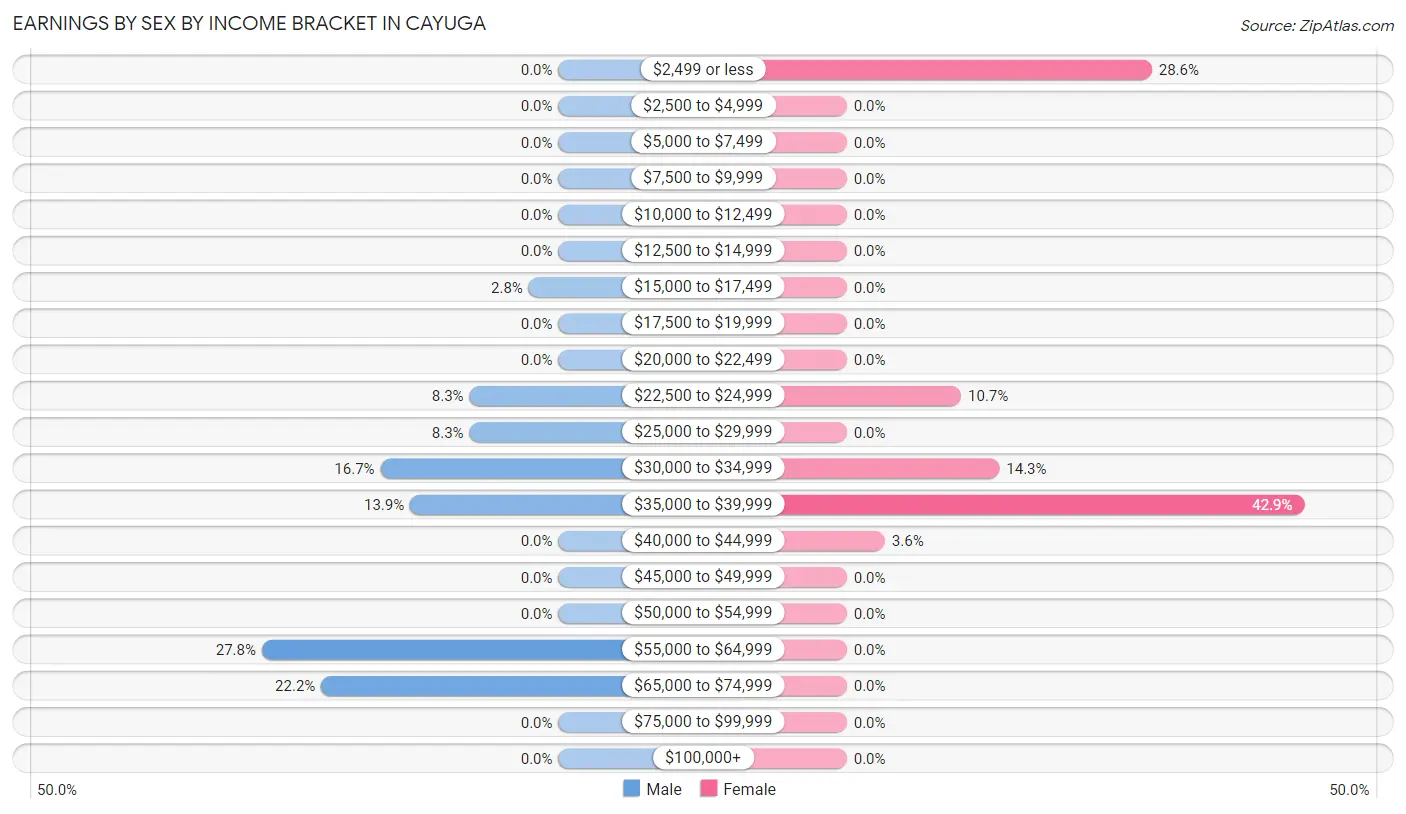
Earnings by Sex by Income Bracket in Cayuga
The most common earnings brackets in Cayuga are $55,000 to $64,999 for men (10 | 27.8%) and $35,000 to $39,999 for women (12 | 42.9%).
| Income | Male | Female |
| $2,499 or less | 0 (0.0%) | 8 (28.6%) |
| $2,500 to $4,999 | 0 (0.0%) | 0 (0.0%) |
| $5,000 to $7,499 | 0 (0.0%) | 0 (0.0%) |
| $7,500 to $9,999 | 0 (0.0%) | 0 (0.0%) |
| $10,000 to $12,499 | 0 (0.0%) | 0 (0.0%) |
| $12,500 to $14,999 | 0 (0.0%) | 0 (0.0%) |
| $15,000 to $17,499 | 1 (2.8%) | 0 (0.0%) |
| $17,500 to $19,999 | 0 (0.0%) | 0 (0.0%) |
| $20,000 to $22,499 | 0 (0.0%) | 0 (0.0%) |
| $22,500 to $24,999 | 3 (8.3%) | 3 (10.7%) |
| $25,000 to $29,999 | 3 (8.3%) | 0 (0.0%) |
| $30,000 to $34,999 | 6 (16.7%) | 4 (14.3%) |
| $35,000 to $39,999 | 5 (13.9%) | 12 (42.9%) |
| $40,000 to $44,999 | 0 (0.0%) | 1 (3.6%) |
| $45,000 to $49,999 | 0 (0.0%) | 0 (0.0%) |
| $50,000 to $54,999 | 0 (0.0%) | 0 (0.0%) |
| $55,000 to $64,999 | 10 (27.8%) | 0 (0.0%) |
| $65,000 to $74,999 | 8 (22.2%) | 0 (0.0%) |
| $75,000 to $99,999 | 0 (0.0%) | 0 (0.0%) |
| $100,000+ | 0 (0.0%) | 0 (0.0%) |
| Total | 36 (100.0%) | 28 (100.0%) |
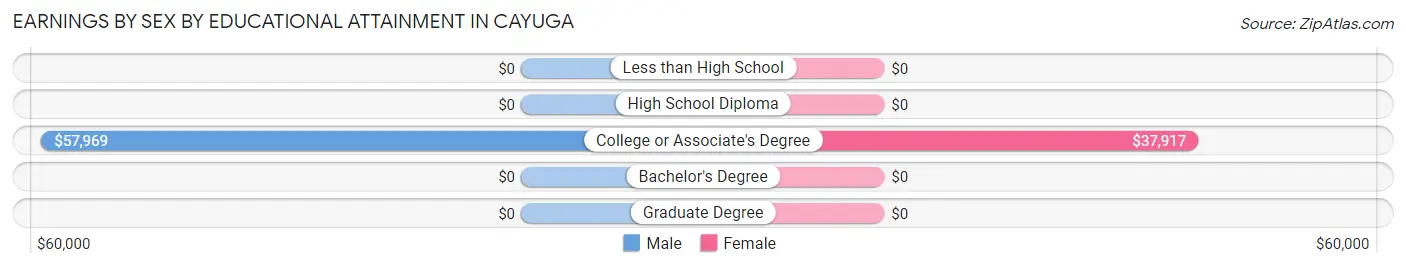
Earnings by Sex by Educational Attainment in Cayuga
Average earnings in Cayuga are $57,969 for men and $34,063 for women, a difference of 41.2%. Men with an educational attainment of college or associate's degree enjoy the highest average annual earnings of $57,969, while those with college or associate's degree education earn the least with $57,969. Women with an educational attainment of college or associate's degree earn the most with the average annual earnings of $37,917, while those with college or associate's degree education have the smallest earnings of $37,917.
| Educational Attainment | Male Income | Female Income |
| Less than High School | - | - |
| High School Diploma | - | - |
| College or Associate's Degree | $57,969 | $37,917 |
| Bachelor's Degree | - | - |
| Graduate Degree | - | - |
| Total | $57,969 | $34,063 |
Family Income in Cayuga
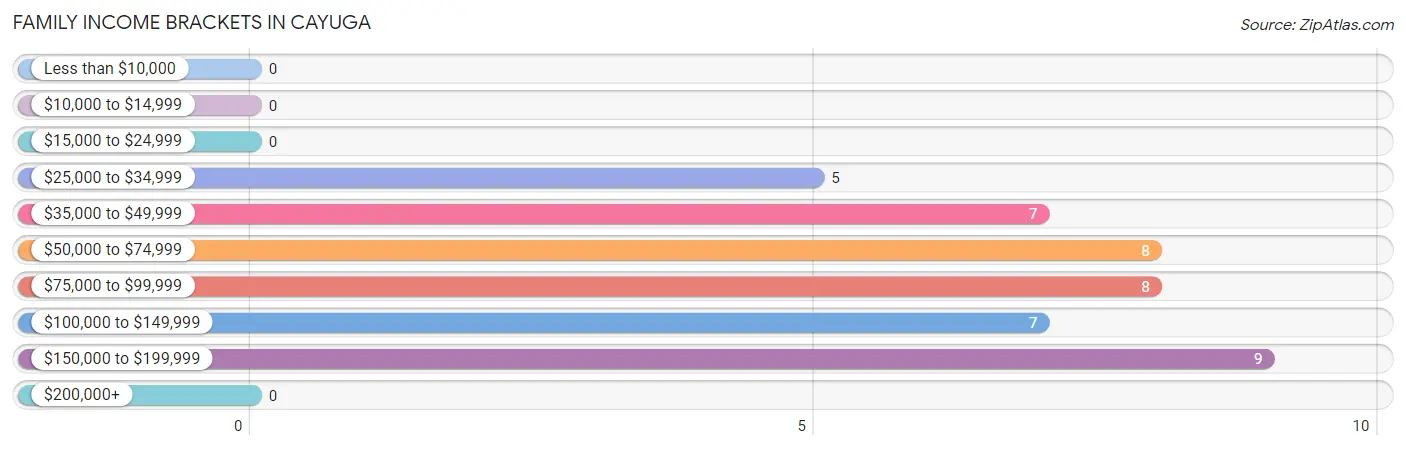
Family Income Brackets in Cayuga
According to the Cayuga family income data, there are 9 families falling into the $150,000 to $199,999 income range, which is the most common income bracket and makes up 20.4% of all families.
| Income Bracket | # Families | % Families |
| Less than $10,000 | 0 | 0.0% |
| $10,000 to $14,999 | 0 | 0.0% |
| $15,000 to $24,999 | 0 | 0.0% |
| $25,000 to $34,999 | 5 | 11.4% |
| $35,000 to $49,999 | 7 | 15.9% |
| $50,000 to $74,999 | 8 | 18.2% |
| $75,000 to $99,999 | 8 | 18.2% |
| $100,000 to $149,999 | 7 | 15.9% |
| $150,000 to $199,999 | 9 | 20.5% |
| $200,000+ | 0 | 0.0% |
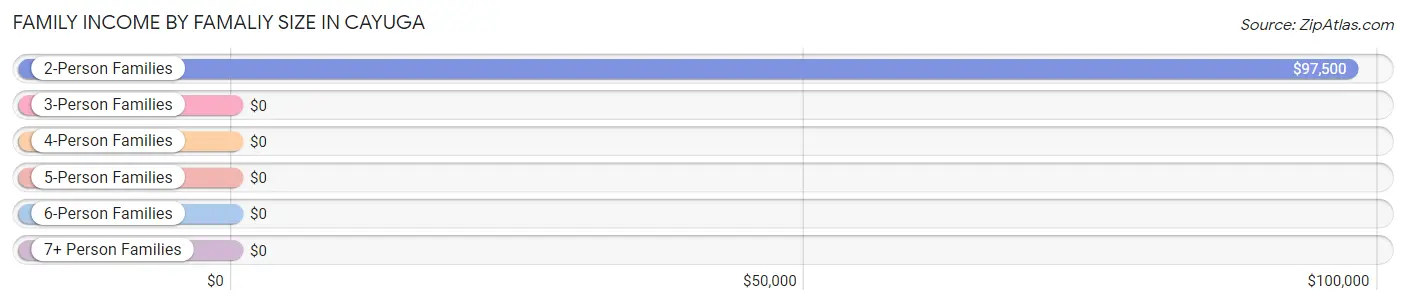
Family Income by Famaliy Size in Cayuga
2-person families (26 | 59.1%) account for the highest median family income in Cayuga with $97,500 per family, while 2-person families (26 | 59.1%) have the highest median income of $48,750 per family member.
| Income Bracket | # Families | Median Income |
| 2-Person Families | 26 (59.1%) | $97,500 |
| 3-Person Families | 4 (9.1%) | $0 |
| 4-Person Families | 8 (18.2%) | $0 |
| 5-Person Families | 0 (0.0%) | $0 |
| 6-Person Families | 3 (6.8%) | $0 |
| 7+ Person Families | 3 (6.8%) | $0 |
| Total | 44 (100.0%) | $88,125 |
Family Income by Number of Earners in Cayuga
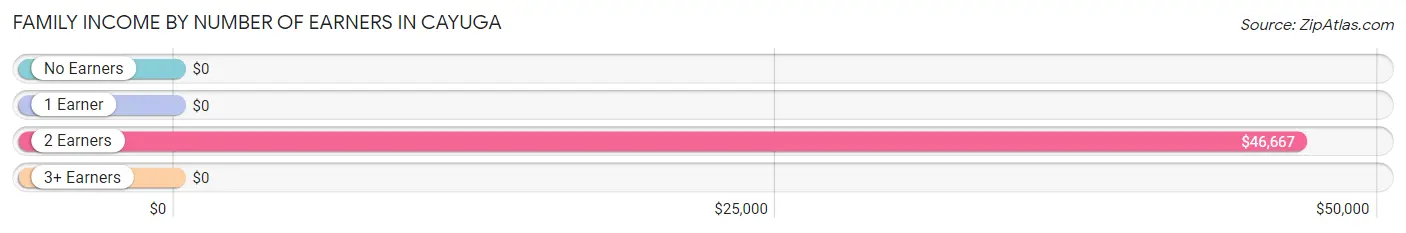
| Number of Earners | # Families | Median Income |
| No Earners | 8 (18.2%) | $0 |
| 1 Earner | 19 (43.2%) | $0 |
| 2 Earners | 14 (31.8%) | $46,667 |
| 3+ Earners | 3 (6.8%) | $0 |
| Total | 44 (100.0%) | $88,125 |
Household Income in Cayuga
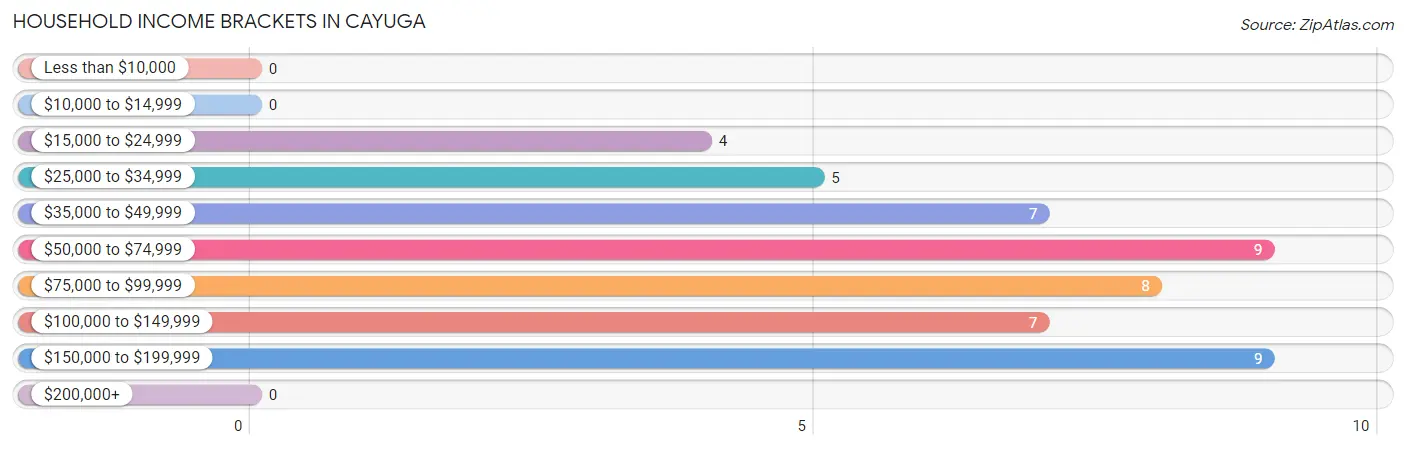
Household Income Brackets in Cayuga
With 9 households falling in the category, the $50,000 to $74,999 income range is the most frequent in Cayuga, accounting for 18.4% of all households.
| Income Bracket | # Households | % Households |
| Less than $10,000 | 0 | 0.0% |
| $10,000 to $14,999 | 0 | 0.0% |
| $15,000 to $24,999 | 4 | 8.2% |
| $25,000 to $34,999 | 5 | 10.2% |
| $35,000 to $49,999 | 7 | 14.3% |
| $50,000 to $74,999 | 9 | 18.4% |
| $75,000 to $99,999 | 8 | 16.3% |
| $100,000 to $149,999 | 7 | 14.3% |
| $150,000 to $199,999 | 9 | 18.4% |
| $200,000+ | 0 | 0.0% |
Household Income by Householder Age in Cayuga
The median household income in Cayuga is $69,688, with the highest median household income of $88,594 found in the 45 to 64 years age bracket for the primary householder. A total of 31 households (63.3%) fall into this category.
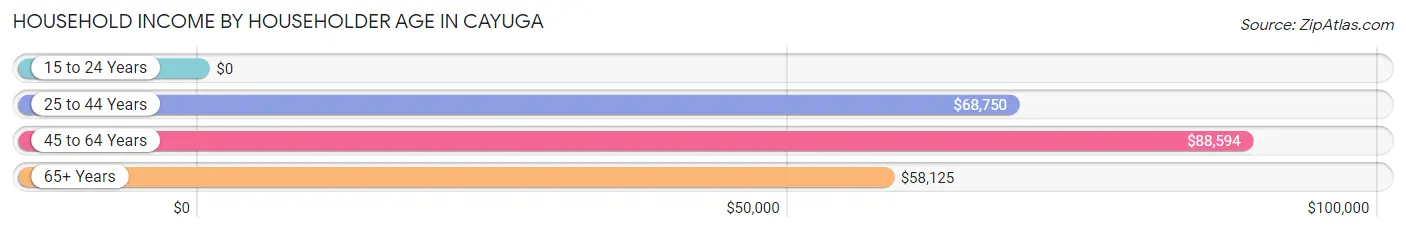
| Income Bracket | # Households | Median Income |
| 15 to 24 Years | 0 (0.0%) | $0 |
| 25 to 44 Years | 9 (18.4%) | $68,750 |
| 45 to 64 Years | 31 (63.3%) | $88,594 |
| 65+ Years | 9 (18.4%) | $58,125 |
| Total | 49 (100.0%) | $69,688 |
Poverty in Cayuga
Income Below Poverty by Sex and Age in Cayuga
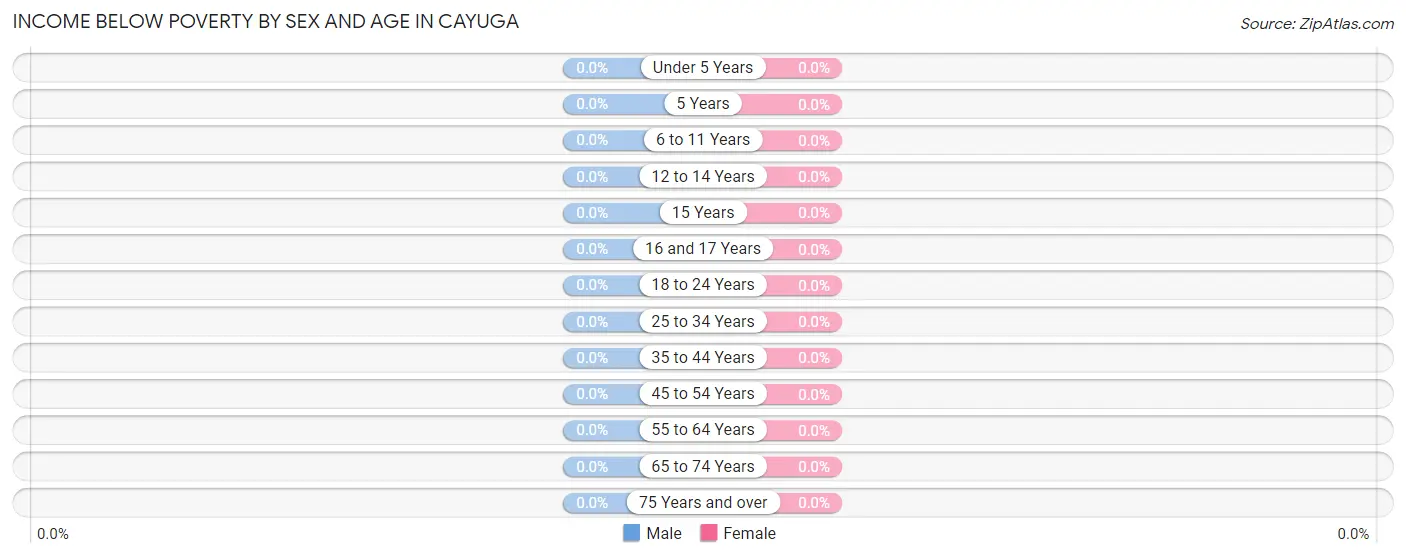
| Age Bracket | Male | Female |
| Under 5 Years | 0 (0.0%) | 0 (0.0%) |
| 5 Years | 0 (0.0%) | 0 (0.0%) |
| 6 to 11 Years | 0 (0.0%) | 0 (0.0%) |
| 12 to 14 Years | 0 (0.0%) | 0 (0.0%) |
| 15 Years | 0 (0.0%) | 0 (0.0%) |
| 16 and 17 Years | 0 (0.0%) | 0 (0.0%) |
| 18 to 24 Years | 0 (0.0%) | 0 (0.0%) |
| 25 to 34 Years | 0 (0.0%) | 0 (0.0%) |
| 35 to 44 Years | 0 (0.0%) | 0 (0.0%) |
| 45 to 54 Years | 0 (0.0%) | 0 (0.0%) |
| 55 to 64 Years | 0 (0.0%) | 0 (0.0%) |
| 65 to 74 Years | 0 (0.0%) | 0 (0.0%) |
| 75 Years and over | 0 (0.0%) | 0 (0.0%) |
| Total | 0 (0.0%) | 0 (0.0%) |
Income Above Poverty by Sex and Age in Cayuga
According to the poverty statistics in Cayuga, males aged under 5 years and females aged under 5 years are the age groups that are most secure financially, with 100.0% of males and 100.0% of females in these age groups living above the poverty line.
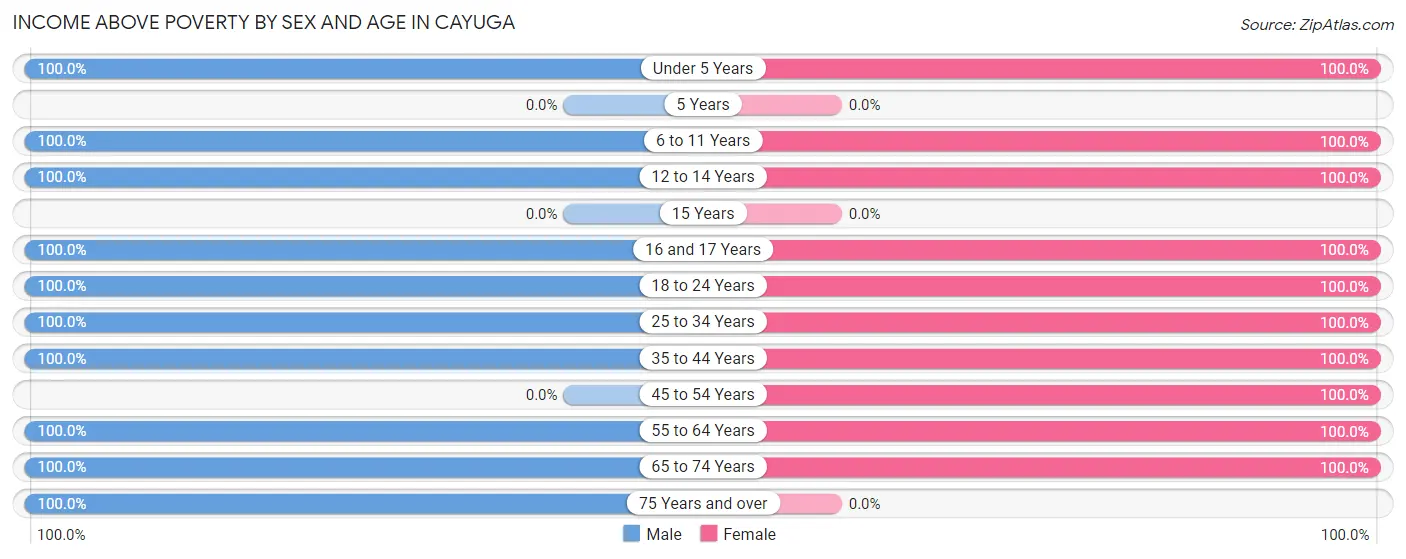
| Age Bracket | Male | Female |
| Under 5 Years | 2 (100.0%) | 10 (100.0%) |
| 5 Years | 0 (0.0%) | 0 (0.0%) |
| 6 to 11 Years | 5 (100.0%) | 3 (100.0%) |
| 12 to 14 Years | 4 (100.0%) | 2 (100.0%) |
| 15 Years | 0 (0.0%) | 0 (0.0%) |
| 16 and 17 Years | 7 (100.0%) | 2 (100.0%) |
| 18 to 24 Years | 5 (100.0%) | 17 (100.0%) |
| 25 to 34 Years | 3 (100.0%) | 6 (100.0%) |
| 35 to 44 Years | 5 (100.0%) | 6 (100.0%) |
| 45 to 54 Years | 0 (0.0%) | 9 (100.0%) |
| 55 to 64 Years | 19 (100.0%) | 22 (100.0%) |
| 65 to 74 Years | 14 (100.0%) | 7 (100.0%) |
| 75 Years and over | 2 (100.0%) | 0 (0.0%) |
| Total | 66 (100.0%) | 84 (100.0%) |
Income Below Poverty Among Married-Couple Families in Cayuga
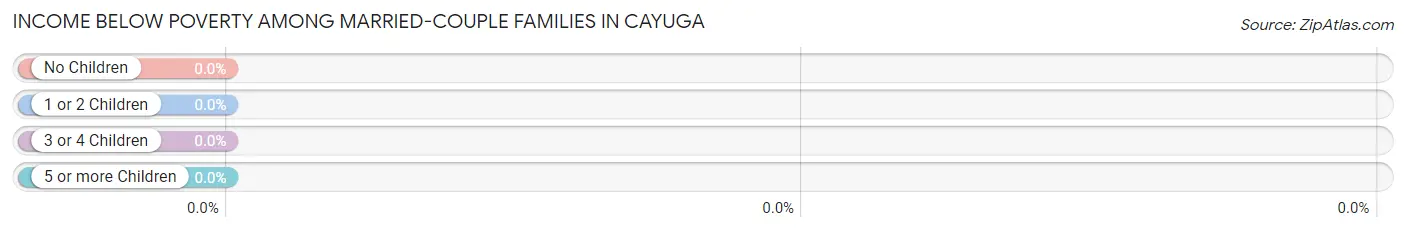
| Children | Above Poverty | Below Poverty |
| No Children | 28 (100.0%) | 0 (0.0%) |
| 1 or 2 Children | 8 (100.0%) | 0 (0.0%) |
| 3 or 4 Children | 3 (100.0%) | 0 (0.0%) |
| 5 or more Children | 3 (100.0%) | 0 (0.0%) |
| Total | 42 (100.0%) | 0 (0.0%) |
Income Below Poverty Among Single-Parent Households in Cayuga
| Children | Single Father | Single Mother |
| No Children | 0 (0.0%) | 0 (0.0%) |
| 1 or 2 Children | 0 (0.0%) | 0 (0.0%) |
| 3 or 4 Children | 0 (0.0%) | 0 (0.0%) |
| 5 or more Children | 0 (0.0%) | 0 (0.0%) |
| Total | 0 (0.0%) | 0 (0.0%) |
Income Below Poverty Among Married-Couple vs Single-Parent Households in Cayuga
| Children | Married-Couple Families | Single-Parent Households |
| No Children | 0 (0.0%) | 0 (0.0%) |
| 1 or 2 Children | 0 (0.0%) | 0 (0.0%) |
| 3 or 4 Children | 0 (0.0%) | 0 (0.0%) |
| 5 or more Children | 0 (0.0%) | 0 (0.0%) |
| Total | 0 (0.0%) | 0 (0.0%) |
Race in Cayuga
The most populous races in Cayuga are White / Caucasian (87 | 58.0%), Native / Alaskan (58 | 38.7%), and Hispanic or Latino (17 | 11.3%).
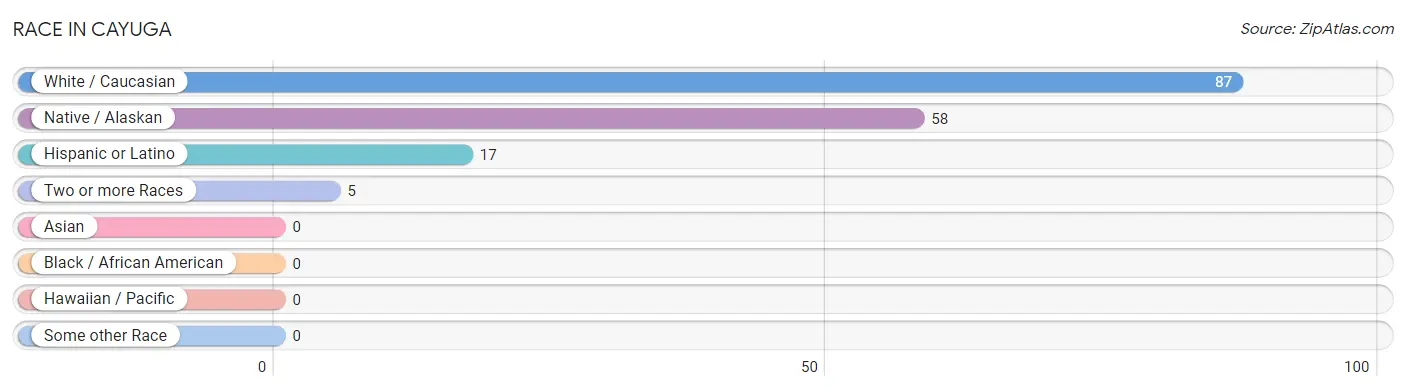
| Race | # Population | % Population |
| Asian | 0 | 0.0% |
| Black / African American | 0 | 0.0% |
| Hawaiian / Pacific | 0 | 0.0% |
| Hispanic or Latino | 17 | 11.3% |
| Native / Alaskan | 58 | 38.7% |
| White / Caucasian | 87 | 58.0% |
| Two or more Races | 5 | 3.3% |
| Some other Race | 0 | 0.0% |
| Total | 150 | 100.0% |
Ancestry in Cayuga
The most populous ancestries reported in Cayuga are Cherokee (63 | 42.0%), Scottish (21 | 14.0%), English (10 | 6.7%), Mexican (9 | 6.0%), and Puerto Rican (8 | 5.3%), together accounting for 74.0% of all Cayuga residents.
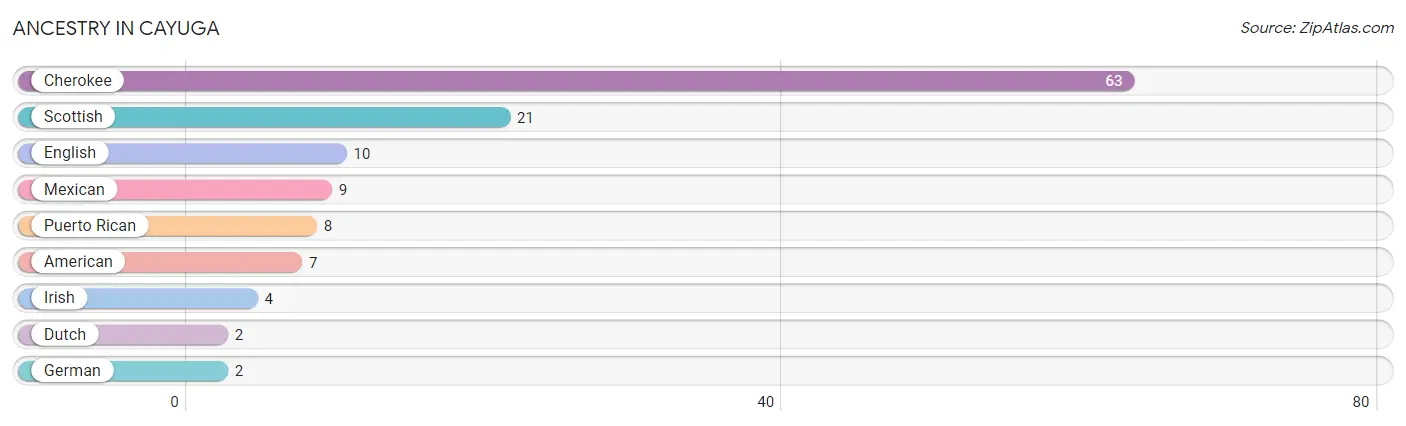
| Ancestry | # Population | % Population |
| American | 7 | 4.7% |
| Cherokee | 63 | 42.0% |
| Dutch | 2 | 1.3% |
| English | 10 | 6.7% |
| German | 2 | 1.3% |
| Irish | 4 | 2.7% |
| Mexican | 9 | 6.0% |
| Puerto Rican | 8 | 5.3% |
| Scottish | 21 | 14.0% | View All 9 Rows |
Immigrants in Cayuga

| Immigration Origin | # Population | % Population | View All 0 Rows |
Sex and Age in Cayuga
Sex and Age in Cayuga
The most populous age groups in Cayuga are 60 to 64 Years (19 | 28.8%) for men and 60 to 64 Years (21 | 25.0%) for women.
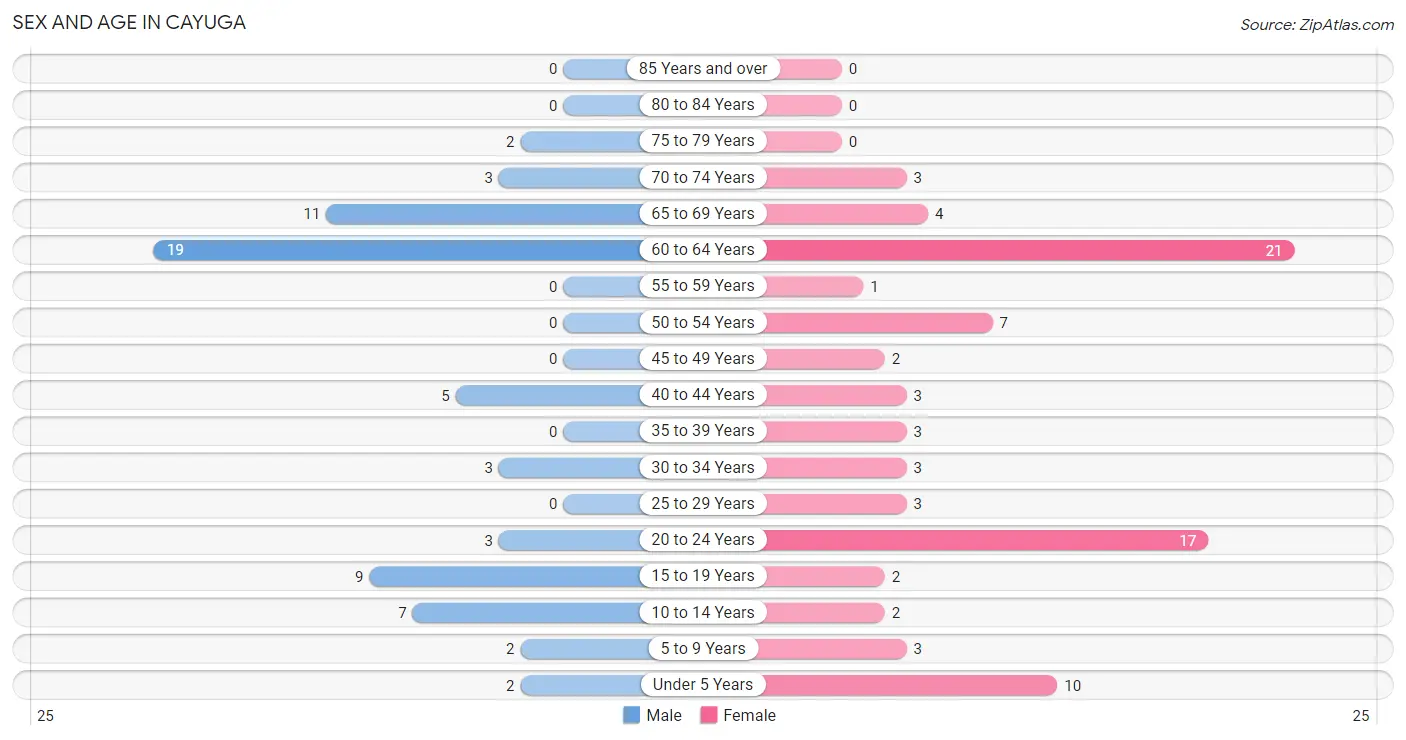
| Age Bracket | Male | Female |
| Under 5 Years | 2 (3.0%) | 10 (11.9%) |
| 5 to 9 Years | 2 (3.0%) | 3 (3.6%) |
| 10 to 14 Years | 7 (10.6%) | 2 (2.4%) |
| 15 to 19 Years | 9 (13.6%) | 2 (2.4%) |
| 20 to 24 Years | 3 (4.5%) | 17 (20.2%) |
| 25 to 29 Years | 0 (0.0%) | 3 (3.6%) |
| 30 to 34 Years | 3 (4.5%) | 3 (3.6%) |
| 35 to 39 Years | 0 (0.0%) | 3 (3.6%) |
| 40 to 44 Years | 5 (7.6%) | 3 (3.6%) |
| 45 to 49 Years | 0 (0.0%) | 2 (2.4%) |
| 50 to 54 Years | 0 (0.0%) | 7 (8.3%) |
| 55 to 59 Years | 0 (0.0%) | 1 (1.2%) |
| 60 to 64 Years | 19 (28.8%) | 21 (25.0%) |
| 65 to 69 Years | 11 (16.7%) | 4 (4.8%) |
| 70 to 74 Years | 3 (4.5%) | 3 (3.6%) |
| 75 to 79 Years | 2 (3.0%) | 0 (0.0%) |
| 80 to 84 Years | 0 (0.0%) | 0 (0.0%) |
| 85 Years and over | 0 (0.0%) | 0 (0.0%) |
| Total | 66 (100.0%) | 84 (100.0%) |
Families and Households in Cayuga
Median Family Size in Cayuga
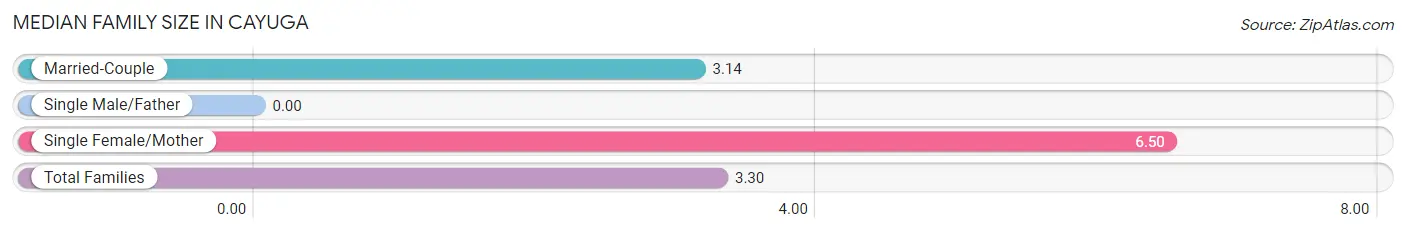
| Family Type | # Families | Family Size |
| Married-Couple | 42 (95.5%) | 3.14 |
| Single Male/Father | 0 (0.0%) | - |
| Single Female/Mother | 2 (4.5%) | 6.50 |
| Total Families | 44 (100.0%) | 3.30 |
Median Household Size in Cayuga
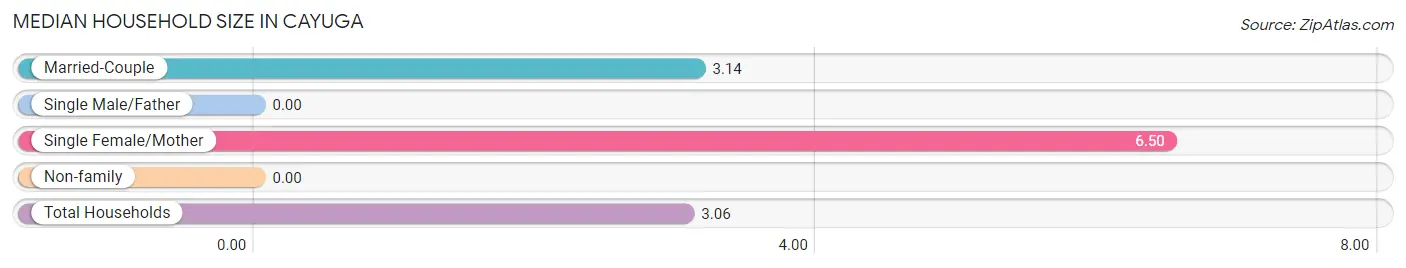
| Household Type | # Households | Household Size |
| Married-Couple | 42 (85.7%) | 3.14 |
| Single Male/Father | 0 (0.0%) | - |
| Single Female/Mother | 2 (4.1%) | 6.50 |
| Non-family | 5 (10.2%) | - |
| Total Households | 49 (100.0%) | 3.06 |
Household Size by Marriage Status in Cayuga
Out of a total of 49 households in Cayuga, 44 (89.8%) are family households, while 5 (10.2%) are nonfamily households. The most numerous type of family households are 2-person households, comprising 26, and the most common type of nonfamily households are 1-person households, comprising 5.
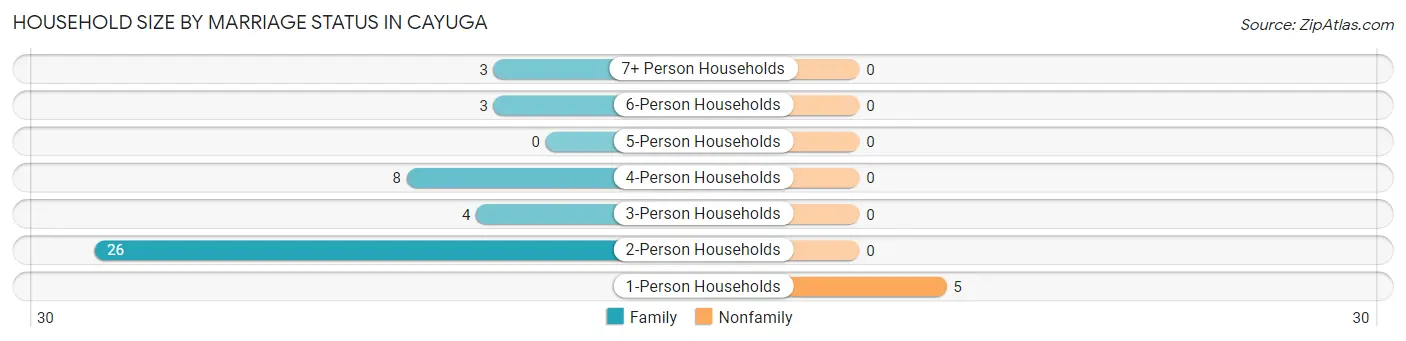
| Household Size | Family Households | Nonfamily Households |
| 1-Person Households | - | 5 (10.2%) |
| 2-Person Households | 26 (53.1%) | 0 (0.0%) |
| 3-Person Households | 4 (8.2%) | 0 (0.0%) |
| 4-Person Households | 8 (16.3%) | 0 (0.0%) |
| 5-Person Households | 0 (0.0%) | 0 (0.0%) |
| 6-Person Households | 3 (6.1%) | 0 (0.0%) |
| 7+ Person Households | 3 (6.1%) | 0 (0.0%) |
| Total | 44 (89.8%) | 5 (10.2%) |
Female Fertility in Cayuga
Fertility by Age in Cayuga
| Age Bracket | Women with Births | Births / 1,000 Women |
| 15 to 19 years | 0 (0.0%) | 0.0 |
| 20 to 34 years | 0 (0.0%) | 0.0 |
| 35 to 50 years | 0 (0.0%) | 0.0 |
| Total | 0 (0.0%) | 0.0 |
Fertility by Age by Marriage Status in Cayuga
| Age Bracket | Married | Unmarried |
| 15 to 19 years | 0 (0.0%) | 0 (0.0%) |
| 20 to 34 years | 0 (0.0%) | 0 (0.0%) |
| 35 to 50 years | 0 (0.0%) | 0 (0.0%) |
| Total | 0 (0.0%) | 0 (0.0%) |
Fertility by Education in Cayuga
| Educational Attainment | Women with Births | Births / 1,000 Women |
| Less than High School | 0 (0.0%) | 0.0 |
| High School Diploma | 0 (0.0%) | 0.0 |
| College or Associate's Degree | 0 (0.0%) | 0.0 |
| Bachelor's Degree | 0 (0.0%) | 0.0 |
| Graduate Degree | 0 (0.0%) | 0.0 |
| Total | 0 (0.0%) | 0.0 |
Fertility by Education by Marriage Status in Cayuga
| Educational Attainment | Married | Unmarried |
| Less than High School | 0 (0.0%) | 0 (0.0%) |
| High School Diploma | 0 (0.0%) | 0 (0.0%) |
| College or Associate's Degree | 0 (0.0%) | 0 (0.0%) |
| Bachelor's Degree | 0 (0.0%) | 0 (0.0%) |
| Graduate Degree | 0 (0.0%) | 0 (0.0%) |
| Total | 0 (0.0%) | 0 (0.0%) |
Employment Characteristics in Cayuga
Employment by Class of Employer in Cayuga
Among the 61 employed individuals in Cayuga, private company employees (47 | 77.0%), state government employees (8 | 13.1%), and self-employed (not incorporated) (6 | 9.8%) make up the most common classes of employment.
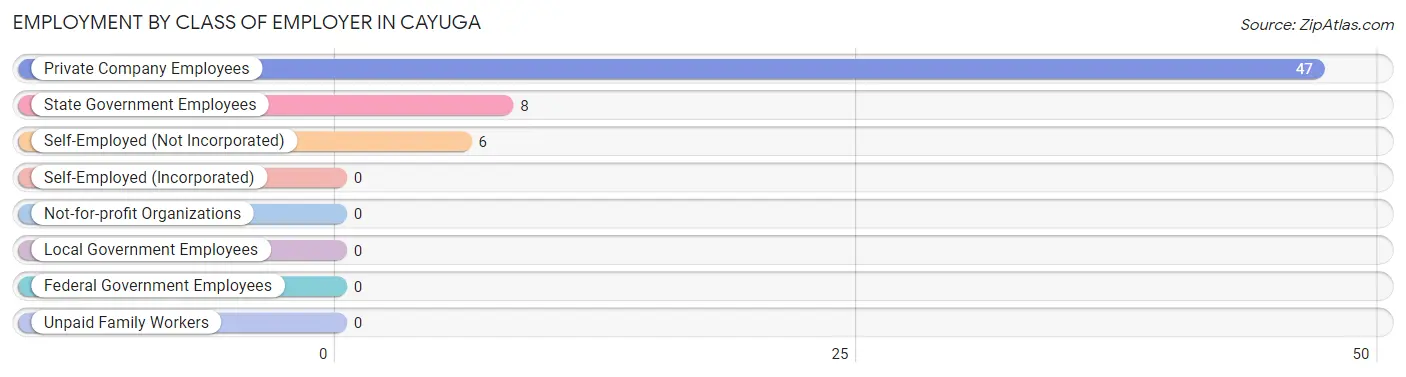
| Employer Class | # Employees | % Employees |
| Private Company Employees | 47 | 77.0% |
| Self-Employed (Incorporated) | 0 | 0.0% |
| Self-Employed (Not Incorporated) | 6 | 9.8% |
| Not-for-profit Organizations | 0 | 0.0% |
| Local Government Employees | 0 | 0.0% |
| State Government Employees | 8 | 13.1% |
| Federal Government Employees | 0 | 0.0% |
| Unpaid Family Workers | 0 | 0.0% |
| Total | 61 | 100.0% |
Employment Status by Age in Cayuga
According to the labor force statistics for Cayuga, out of the total population over 16 years of age (124), 56.5% or 70 individuals are in the labor force, with 8.6% or 6 of them unemployed. The age group with the highest labor force participation rate is 20 to 24 years, with 100.0% or 20 individuals in the labor force. Within the labor force, the 16 to 19 years age range has the highest percentage of unemployed individuals, with 100.0% or 6 of them being unemployed.
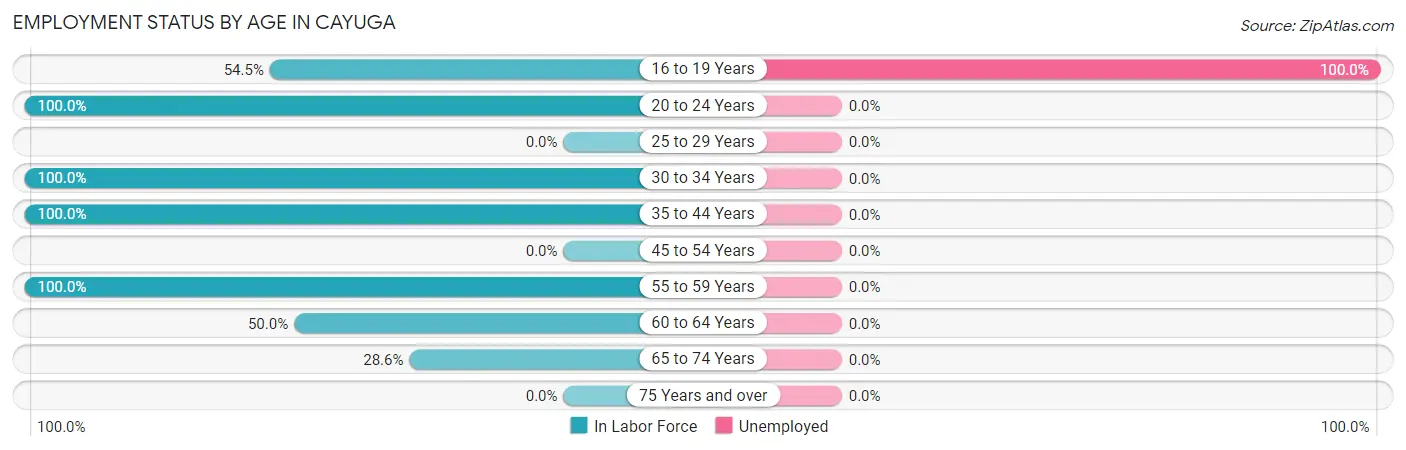
| Age Bracket | In Labor Force | Unemployed |
| 16 to 19 Years | 6 (54.5%) | 6 (100.0%) |
| 20 to 24 Years | 20 (100.0%) | 0 (0.0%) |
| 25 to 29 Years | 0 (0.0%) | 0 (0.0%) |
| 30 to 34 Years | 6 (100.0%) | 0 (0.0%) |
| 35 to 44 Years | 11 (100.0%) | 0 (0.0%) |
| 45 to 54 Years | 0 (0.0%) | 0 (0.0%) |
| 55 to 59 Years | 1 (100.0%) | 0 (0.0%) |
| 60 to 64 Years | 20 (50.0%) | 0 (0.0%) |
| 65 to 74 Years | 6 (28.6%) | 0 (0.0%) |
| 75 Years and over | 0 (0.0%) | 0 (0.0%) |
| Total | 70 (56.5%) | 6 (8.6%) |
Employment Status by Educational Attainment in Cayuga
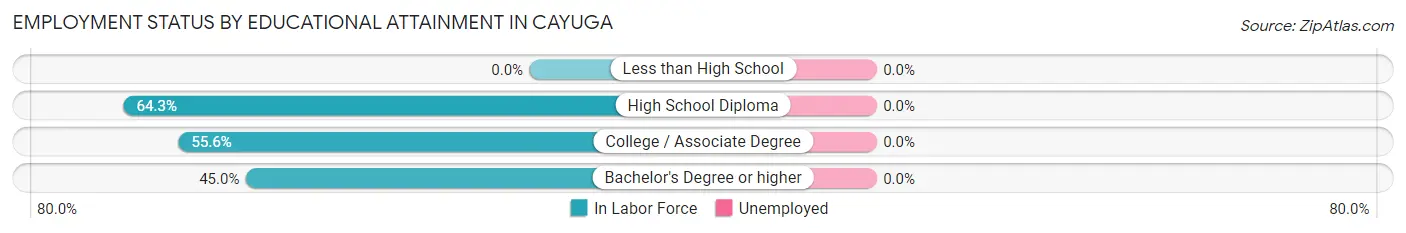
| Educational Attainment | In Labor Force | Unemployed |
| Less than High School | 0 (0.0%) | 0 (0.0%) |
| High School Diploma | 9 (64.3%) | 0 (0.0%) |
| College / Associate Degree | 20 (55.6%) | 0 (0.0%) |
| Bachelor's Degree or higher | 9 (45.0%) | 0 (0.0%) |
| Total | 38 (54.3%) | 0 (0.0%) |
Employment Occupations by Sex in Cayuga
Management, Business, Science and Arts Occupations
The most common Management, Business, Science and Arts occupations in Cayuga are Management (8 | 12.5%), Business & Financial (8 | 12.5%), and Health Diagnosing & Treating (4 | 6.2%).
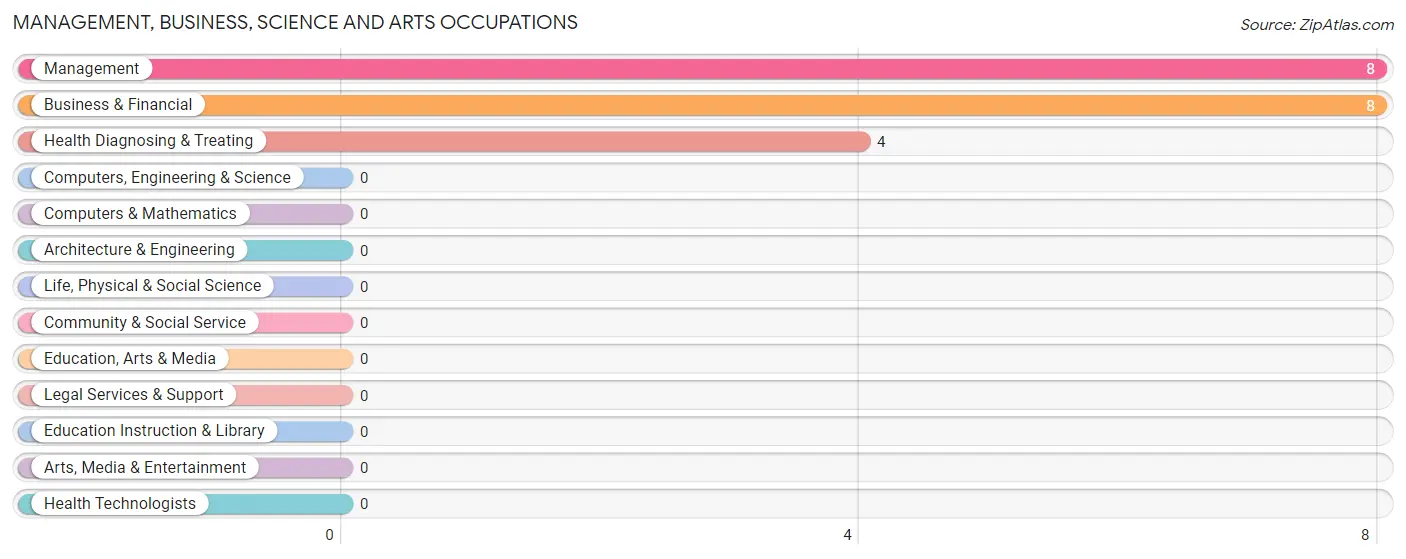
Management, Business, Science and Arts Occupations by Sex
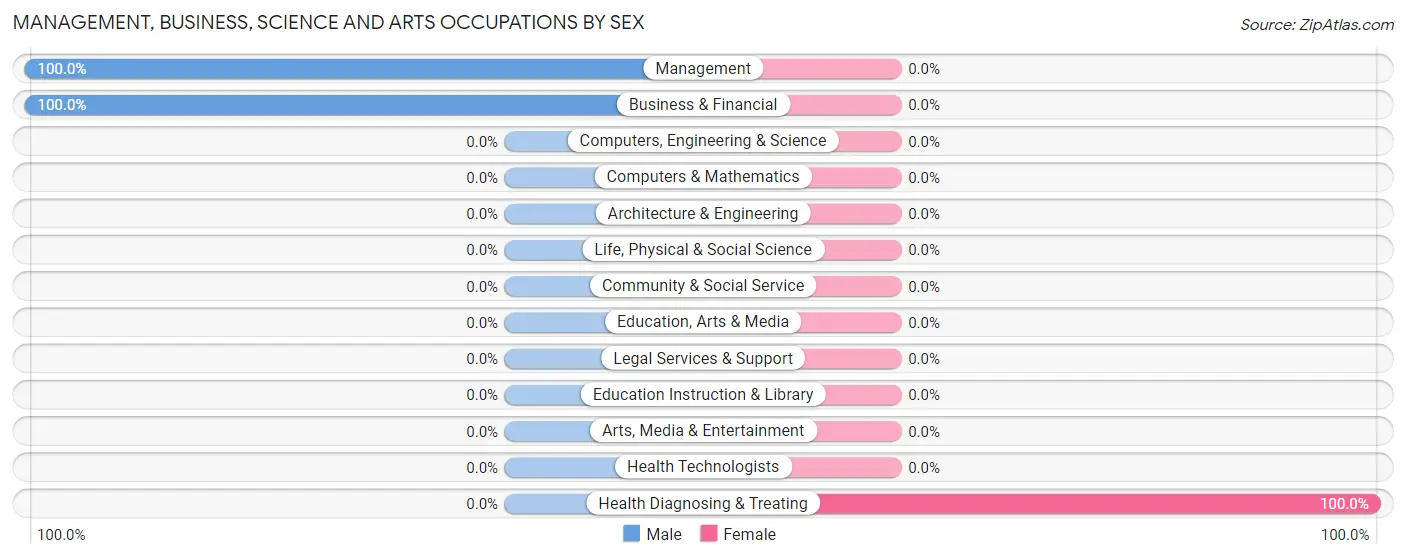
| Occupation | Male | Female |
| Management | 8 (100.0%) | 0 (0.0%) |
| Business & Financial | 8 (100.0%) | 0 (0.0%) |
| Computers, Engineering & Science | 0 (0.0%) | 0 (0.0%) |
| Computers & Mathematics | 0 (0.0%) | 0 (0.0%) |
| Architecture & Engineering | 0 (0.0%) | 0 (0.0%) |
| Life, Physical & Social Science | 0 (0.0%) | 0 (0.0%) |
| Community & Social Service | 0 (0.0%) | 0 (0.0%) |
| Education, Arts & Media | 0 (0.0%) | 0 (0.0%) |
| Legal Services & Support | 0 (0.0%) | 0 (0.0%) |
| Education Instruction & Library | 0 (0.0%) | 0 (0.0%) |
| Arts, Media & Entertainment | 0 (0.0%) | 0 (0.0%) |
| Health Diagnosing & Treating | 0 (0.0%) | 4 (100.0%) |
| Health Technologists | 0 (0.0%) | 0 (0.0%) |
| Total (Category) | 16 (80.0%) | 4 (20.0%) |
| Total (Overall) | 36 (56.2%) | 28 (43.8%) |
Services Occupations
The most common Services occupations in Cayuga are Security & Protection (3 | 4.7%), Firefighting & Prevention (3 | 4.7%), and Food Preparation & Serving (3 | 4.7%).
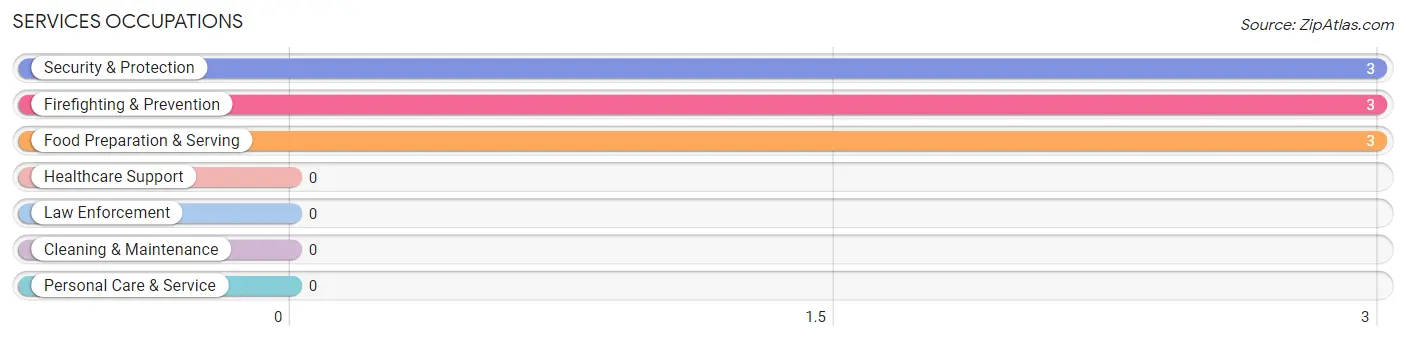
Services Occupations by Sex
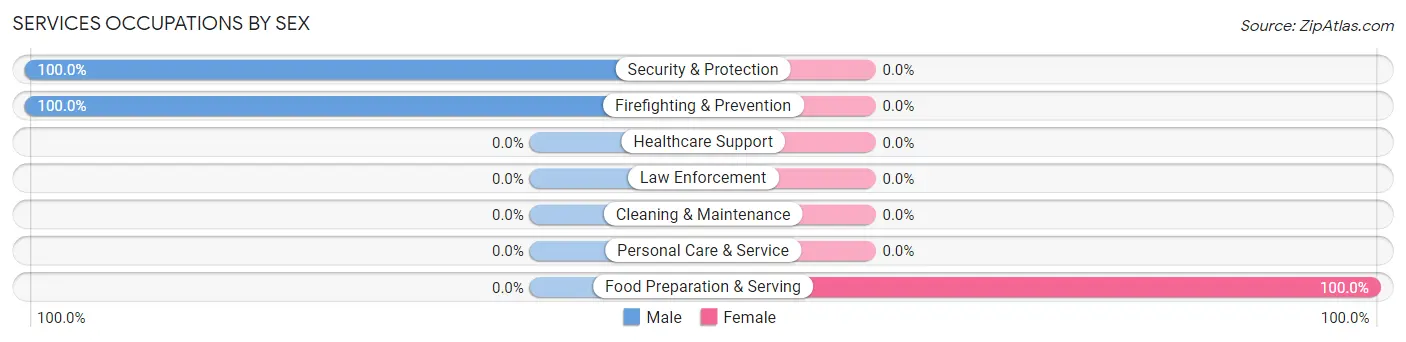
| Occupation | Male | Female |
| Healthcare Support | 0 (0.0%) | 0 (0.0%) |
| Security & Protection | 3 (100.0%) | 0 (0.0%) |
| Firefighting & Prevention | 3 (100.0%) | 0 (0.0%) |
| Law Enforcement | 0 (0.0%) | 0 (0.0%) |
| Food Preparation & Serving | 0 (0.0%) | 3 (100.0%) |
| Cleaning & Maintenance | 0 (0.0%) | 0 (0.0%) |
| Personal Care & Service | 0 (0.0%) | 0 (0.0%) |
| Total (Category) | 3 (50.0%) | 3 (50.0%) |
| Total (Overall) | 36 (56.2%) | 28 (43.8%) |
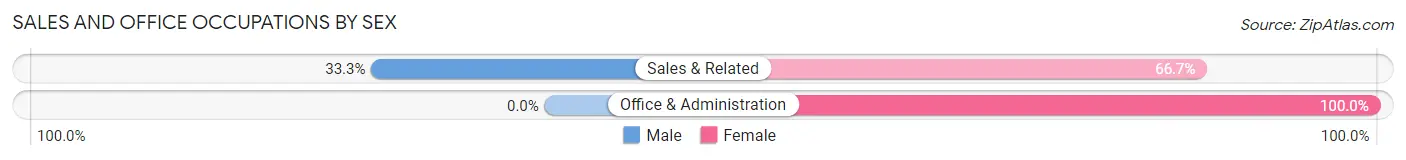
Sales and Office Occupations
The most common Sales and Office occupations in Cayuga are Sales & Related (18 | 28.1%), and Office & Administration (9 | 14.1%).
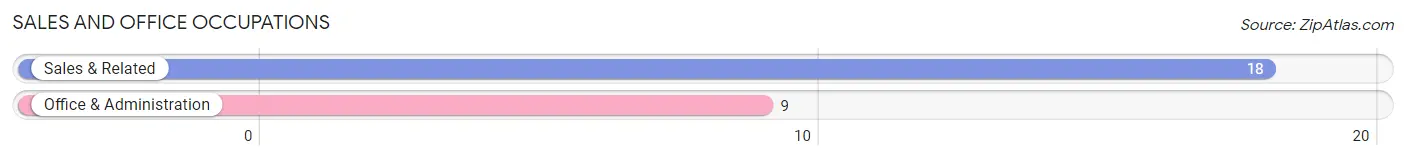
Sales and Office Occupations by Sex
| Occupation | Male | Female |
| Sales & Related | 6 (33.3%) | 12 (66.7%) |
| Office & Administration | 0 (0.0%) | 9 (100.0%) |
| Total (Category) | 6 (22.2%) | 21 (77.8%) |
| Total (Overall) | 36 (56.2%) | 28 (43.8%) |
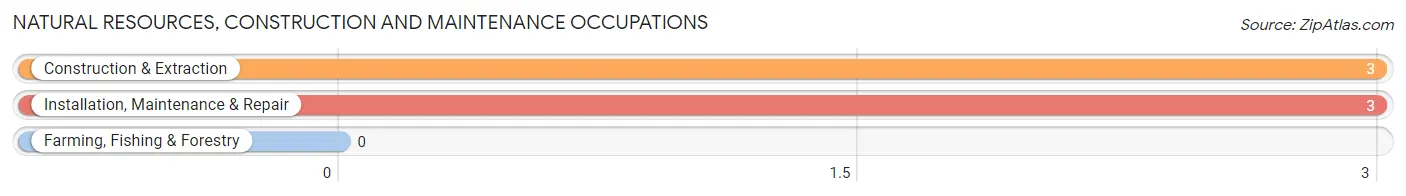
Natural Resources, Construction and Maintenance Occupations
The most common Natural Resources, Construction and Maintenance occupations in Cayuga are Construction & Extraction (3 | 4.7%), and Installation, Maintenance & Repair (3 | 4.7%).
Natural Resources, Construction and Maintenance Occupations by Sex
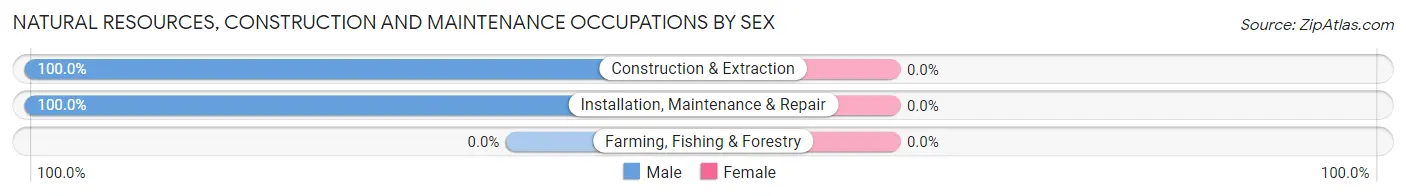
| Occupation | Male | Female |
| Farming, Fishing & Forestry | 0 (0.0%) | 0 (0.0%) |
| Construction & Extraction | 3 (100.0%) | 0 (0.0%) |
| Installation, Maintenance & Repair | 3 (100.0%) | 0 (0.0%) |
| Total (Category) | 6 (100.0%) | 0 (0.0%) |
| Total (Overall) | 36 (56.2%) | 28 (43.8%) |
Production, Transportation and Moving Occupations
The most common Production, Transportation and Moving occupations in Cayuga are , and Material Moving (5 | 7.8%).
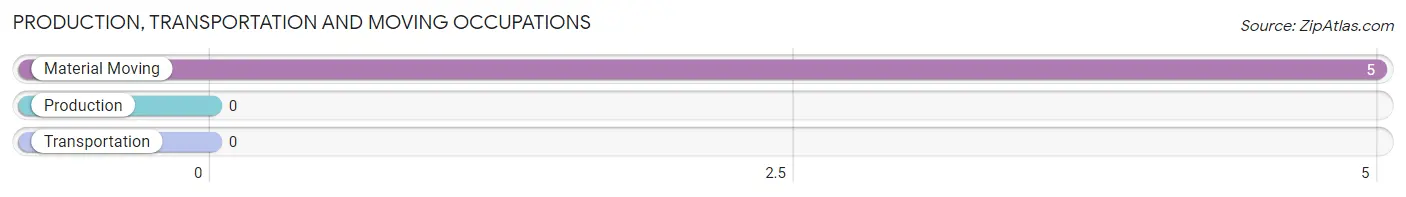
Production, Transportation and Moving Occupations by Sex
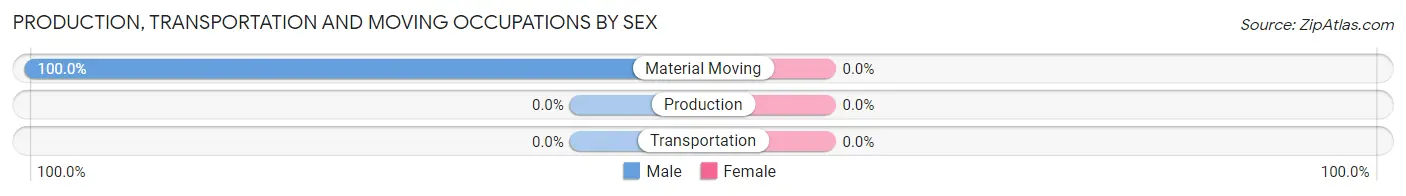
| Occupation | Male | Female |
| Production | 0 (0.0%) | 0 (0.0%) |
| Transportation | 0 (0.0%) | 0 (0.0%) |
| Material Moving | 5 (100.0%) | 0 (0.0%) |
| Total (Category) | 5 (100.0%) | 0 (0.0%) |
| Total (Overall) | 36 (56.2%) | 28 (43.8%) |
Employment Industries by Sex in Cayuga
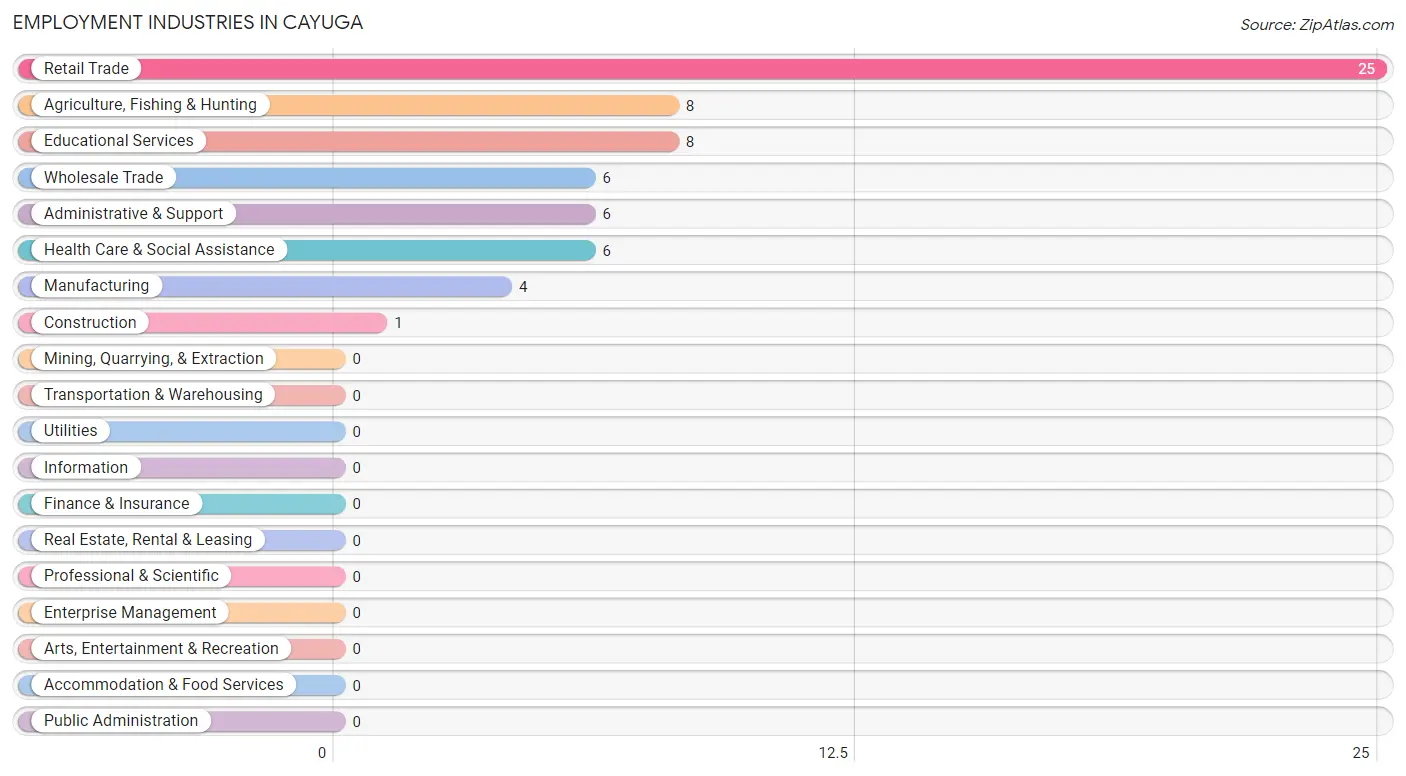
Employment Industries in Cayuga
The major employment industries in Cayuga include Retail Trade (25 | 39.1%), Agriculture, Fishing & Hunting (8 | 12.5%), Educational Services (8 | 12.5%), Wholesale Trade (6 | 9.4%), and Administrative & Support (6 | 9.4%).
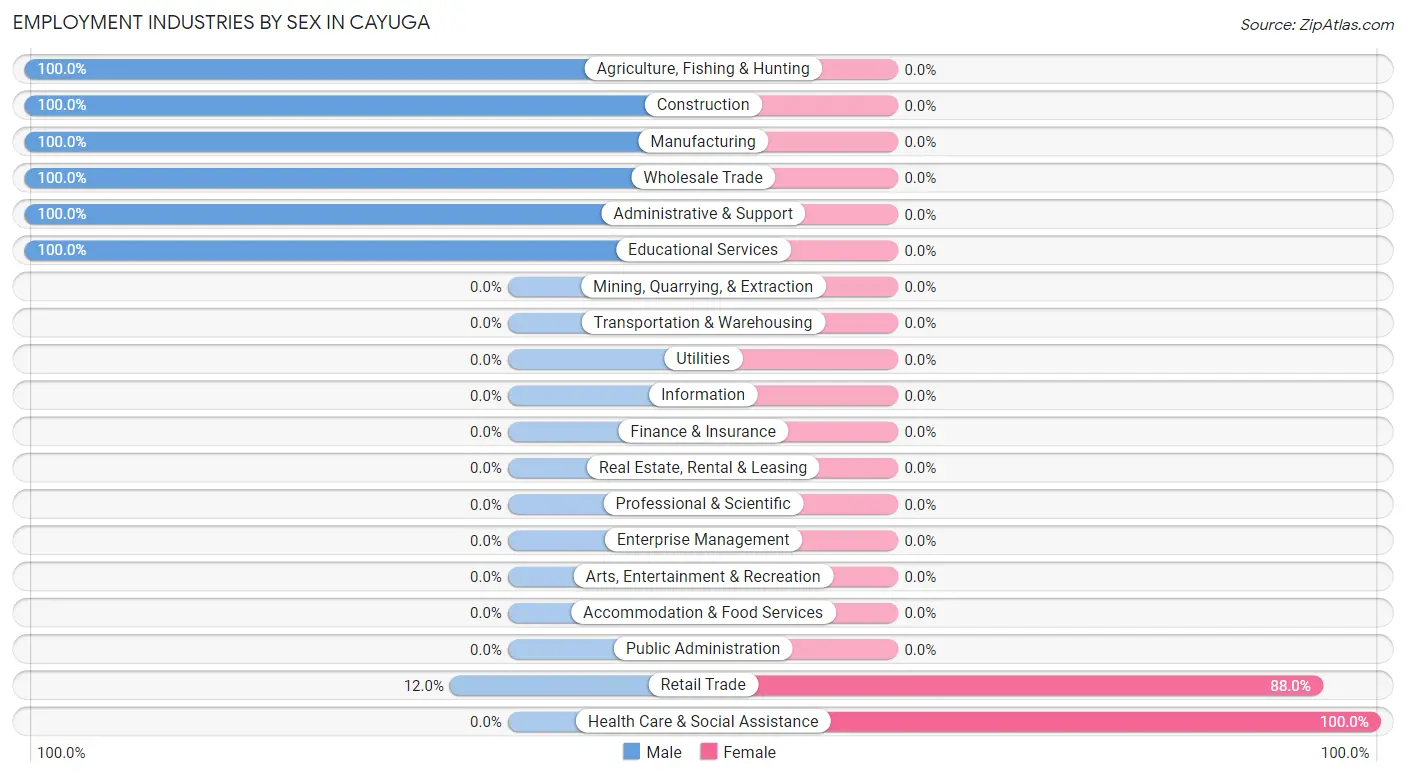
Employment Industries by Sex in Cayuga
The Cayuga industries that see more men than women are Agriculture, Fishing & Hunting (100.0%), Construction (100.0%), and Manufacturing (100.0%), whereas the industries that tend to have a higher number of women are Health Care & Social Assistance (100.0%), and Retail Trade (88.0%).
| Industry | Male | Female |
| Agriculture, Fishing & Hunting | 8 (100.0%) | 0 (0.0%) |
| Mining, Quarrying, & Extraction | 0 (0.0%) | 0 (0.0%) |
| Construction | 1 (100.0%) | 0 (0.0%) |
| Manufacturing | 4 (100.0%) | 0 (0.0%) |
| Wholesale Trade | 6 (100.0%) | 0 (0.0%) |
| Retail Trade | 3 (12.0%) | 22 (88.0%) |
| Transportation & Warehousing | 0 (0.0%) | 0 (0.0%) |
| Utilities | 0 (0.0%) | 0 (0.0%) |
| Information | 0 (0.0%) | 0 (0.0%) |
| Finance & Insurance | 0 (0.0%) | 0 (0.0%) |
| Real Estate, Rental & Leasing | 0 (0.0%) | 0 (0.0%) |
| Professional & Scientific | 0 (0.0%) | 0 (0.0%) |
| Enterprise Management | 0 (0.0%) | 0 (0.0%) |
| Administrative & Support | 6 (100.0%) | 0 (0.0%) |
| Educational Services | 8 (100.0%) | 0 (0.0%) |
| Health Care & Social Assistance | 0 (0.0%) | 6 (100.0%) |
| Arts, Entertainment & Recreation | 0 (0.0%) | 0 (0.0%) |
| Accommodation & Food Services | 0 (0.0%) | 0 (0.0%) |
| Public Administration | 0 (0.0%) | 0 (0.0%) |
| Total | 36 (56.2%) | 28 (43.8%) |
Education in Cayuga
School Enrollment in Cayuga
The most common levels of schooling among the 23 students in Cayuga are high school (9 | 39.1%), elementary school (8 | 34.8%), and middle school (6 | 26.1%).
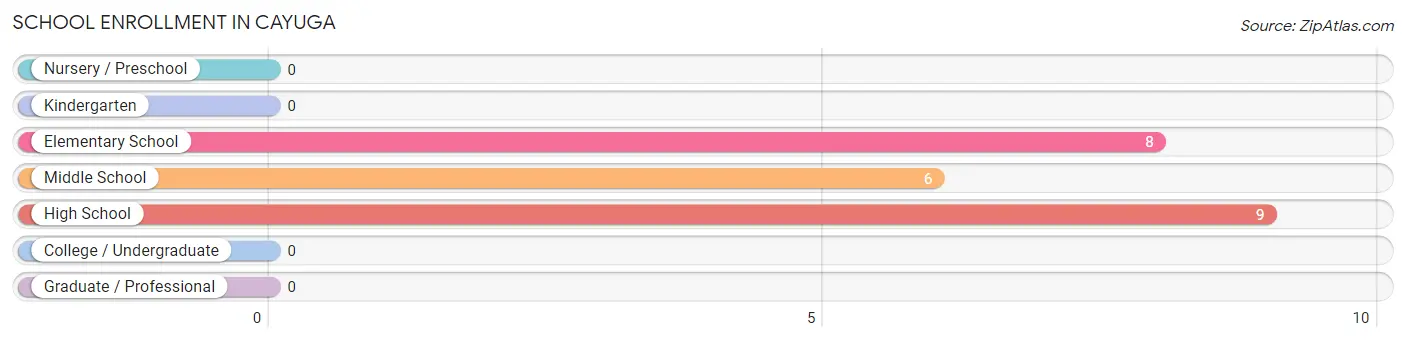
| School Level | # Students | % Students |
| Nursery / Preschool | 0 | 0.0% |
| Kindergarten | 0 | 0.0% |
| Elementary School | 8 | 34.8% |
| Middle School | 6 | 26.1% |
| High School | 9 | 39.1% |
| College / Undergraduate | 0 | 0.0% |
| Graduate / Professional | 0 | 0.0% |
| Total | 23 | 100.0% |
School Enrollment by Age by Funding Source in Cayuga
Out of a total of 23 students who are enrolled in schools in Cayuga, 19 (82.6%) attend a private institution, while the remaining 4 (17.4%) are enrolled in public schools. The age group of 5 to 9 year old has the highest likelihood of being enrolled in private schools, with 5 (100.0% in the age bracket) enrolled. Conversely, the age group of 15 to 17 year olds has the lowest likelihood of being enrolled in a private school, with 4 (44.4% in the age bracket) attending a public institution.
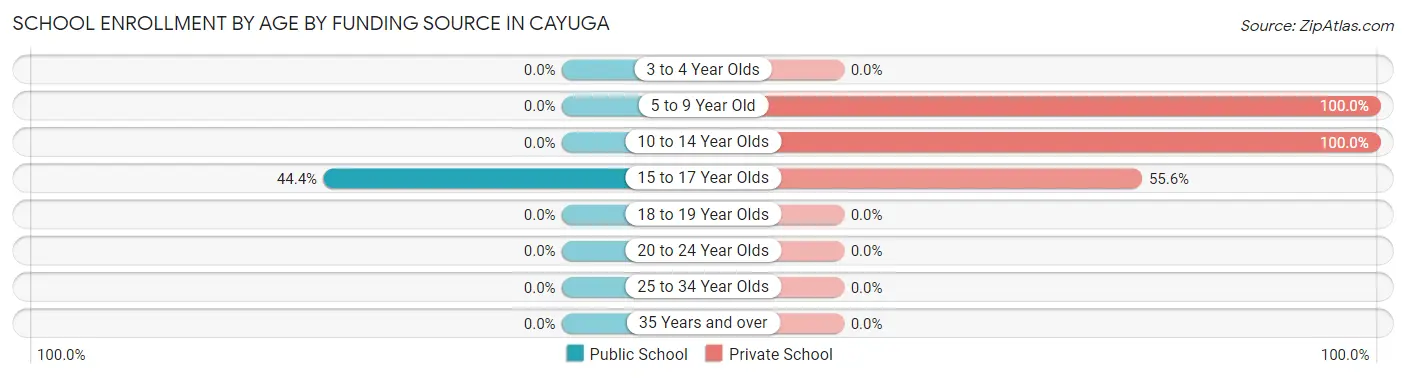
| Age Bracket | Public School | Private School |
| 3 to 4 Year Olds | 0 (0.0%) | 0 (0.0%) |
| 5 to 9 Year Old | 0 (0.0%) | 5 (100.0%) |
| 10 to 14 Year Olds | 0 (0.0%) | 9 (100.0%) |
| 15 to 17 Year Olds | 4 (44.4%) | 5 (55.6%) |
| 18 to 19 Year Olds | 0 (0.0%) | 0 (0.0%) |
| 20 to 24 Year Olds | 0 (0.0%) | 0 (0.0%) |
| 25 to 34 Year Olds | 0 (0.0%) | 0 (0.0%) |
| 35 Years and over | 0 (0.0%) | 0 (0.0%) |
| Total | 4 (17.4%) | 19 (82.6%) |
Educational Attainment by Field of Study in Cayuga
Communications (9 | 39.1%), education (8 | 34.8%), social sciences (3 | 13.0%), engineering (2 | 8.7%), and business (1 | 4.3%) are the most common fields of study among 23 individuals in Cayuga who have obtained a bachelor's degree or higher.
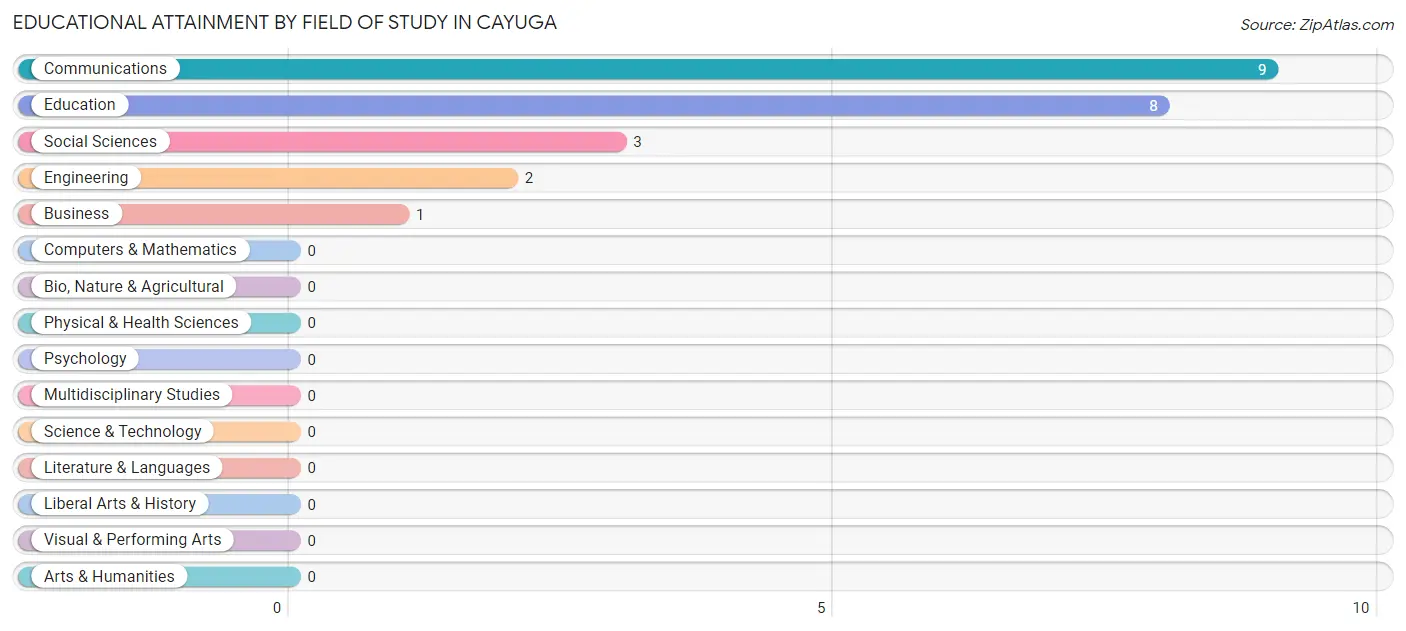
| Field of Study | # Graduates | % Graduates |
| Computers & Mathematics | 0 | 0.0% |
| Bio, Nature & Agricultural | 0 | 0.0% |
| Physical & Health Sciences | 0 | 0.0% |
| Psychology | 0 | 0.0% |
| Social Sciences | 3 | 13.0% |
| Engineering | 2 | 8.7% |
| Multidisciplinary Studies | 0 | 0.0% |
| Science & Technology | 0 | 0.0% |
| Business | 1 | 4.3% |
| Education | 8 | 34.8% |
| Literature & Languages | 0 | 0.0% |
| Liberal Arts & History | 0 | 0.0% |
| Visual & Performing Arts | 0 | 0.0% |
| Communications | 9 | 39.1% |
| Arts & Humanities | 0 | 0.0% |
| Total | 23 | 100.0% |
Transportation & Commute in Cayuga
Vehicle Availability by Sex in Cayuga
The most prevalent vehicle ownership categories in Cayuga are males with 1 vehicle (8, accounting for 24.2%) and females with 1 vehicle (0, making up 28.6%).
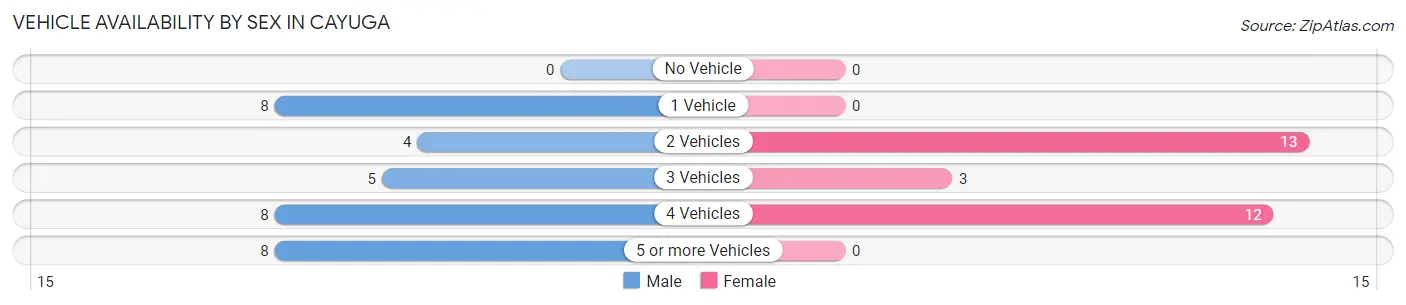
| Vehicles Available | Male | Female |
| No Vehicle | 0 (0.0%) | 0 (0.0%) |
| 1 Vehicle | 8 (24.2%) | 0 (0.0%) |
| 2 Vehicles | 4 (12.1%) | 13 (46.4%) |
| 3 Vehicles | 5 (15.1%) | 3 (10.7%) |
| 4 Vehicles | 8 (24.2%) | 12 (42.9%) |
| 5 or more Vehicles | 8 (24.2%) | 0 (0.0%) |
| Total | 33 (100.0%) | 28 (100.0%) |
Commute Time in Cayuga
The most frequently occuring commute durations in Cayuga are 20 to 24 minutes (18 commuters, 38.3%), 15 to 19 minutes (12 commuters, 25.5%), and less than 5 minutes (8 commuters, 17.0%).
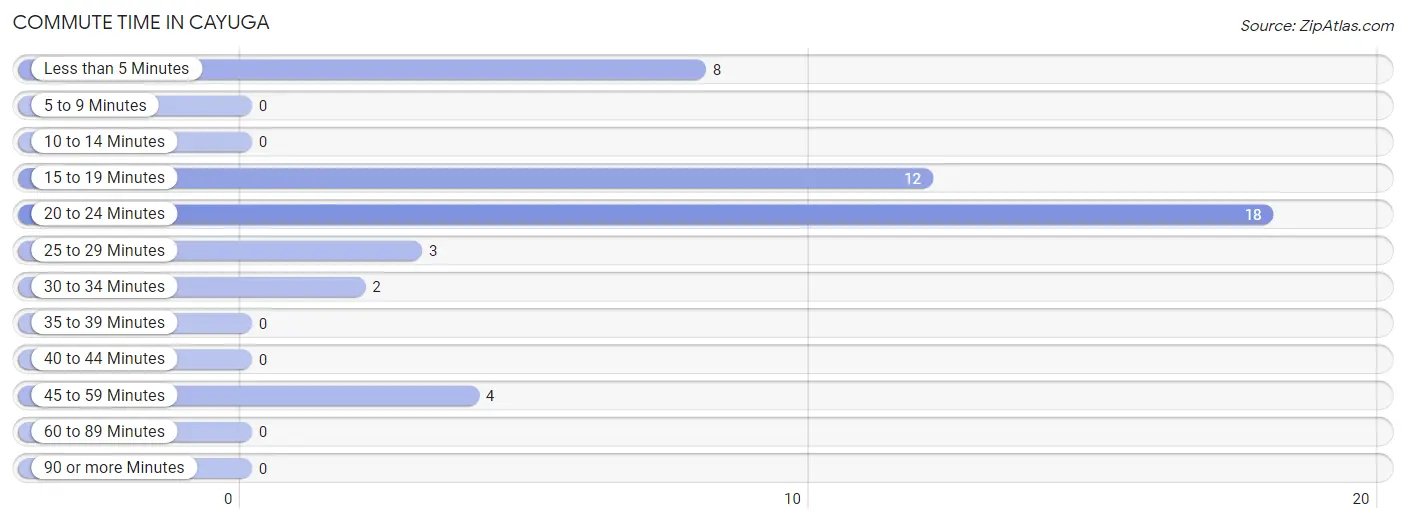
| Commute Time | # Commuters | % Commuters |
| Less than 5 Minutes | 8 | 17.0% |
| 5 to 9 Minutes | 0 | 0.0% |
| 10 to 14 Minutes | 0 | 0.0% |
| 15 to 19 Minutes | 12 | 25.5% |
| 20 to 24 Minutes | 18 | 38.3% |
| 25 to 29 Minutes | 3 | 6.4% |
| 30 to 34 Minutes | 2 | 4.3% |
| 35 to 39 Minutes | 0 | 0.0% |
| 40 to 44 Minutes | 0 | 0.0% |
| 45 to 59 Minutes | 4 | 8.5% |
| 60 to 89 Minutes | 0 | 0.0% |
| 90 or more Minutes | 0 | 0.0% |
Commute Time by Sex in Cayuga
The most common commute times in Cayuga are less than 5 minutes (8 commuters, 42.1%) for males and 20 to 24 minutes (18 commuters, 64.3%) for females.
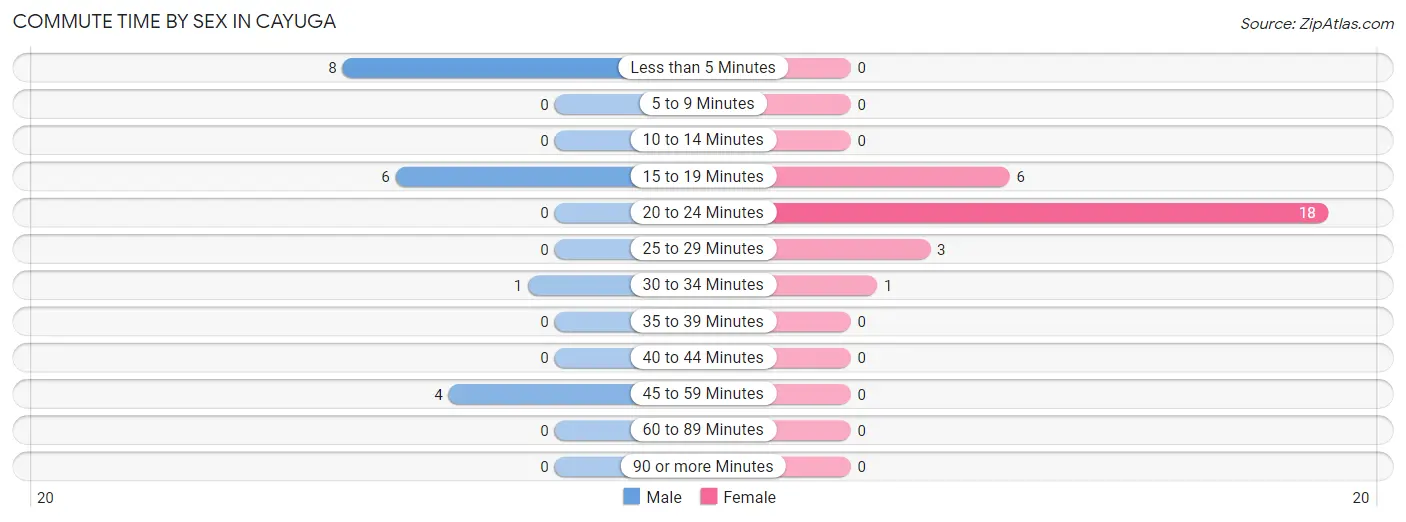
| Commute Time | Male | Female |
| Less than 5 Minutes | 8 (42.1%) | 0 (0.0%) |
| 5 to 9 Minutes | 0 (0.0%) | 0 (0.0%) |
| 10 to 14 Minutes | 0 (0.0%) | 0 (0.0%) |
| 15 to 19 Minutes | 6 (31.6%) | 6 (21.4%) |
| 20 to 24 Minutes | 0 (0.0%) | 18 (64.3%) |
| 25 to 29 Minutes | 0 (0.0%) | 3 (10.7%) |
| 30 to 34 Minutes | 1 (5.3%) | 1 (3.6%) |
| 35 to 39 Minutes | 0 (0.0%) | 0 (0.0%) |
| 40 to 44 Minutes | 0 (0.0%) | 0 (0.0%) |
| 45 to 59 Minutes | 4 (21.0%) | 0 (0.0%) |
| 60 to 89 Minutes | 0 (0.0%) | 0 (0.0%) |
| 90 or more Minutes | 0 (0.0%) | 0 (0.0%) |
Time of Departure to Work by Sex in Cayuga
The most frequent times of departure to work in Cayuga are 7:00 AM to 7:29 AM (8, 42.1%) for males and 9:00 AM to 9:59 AM (9, 32.1%) for females.
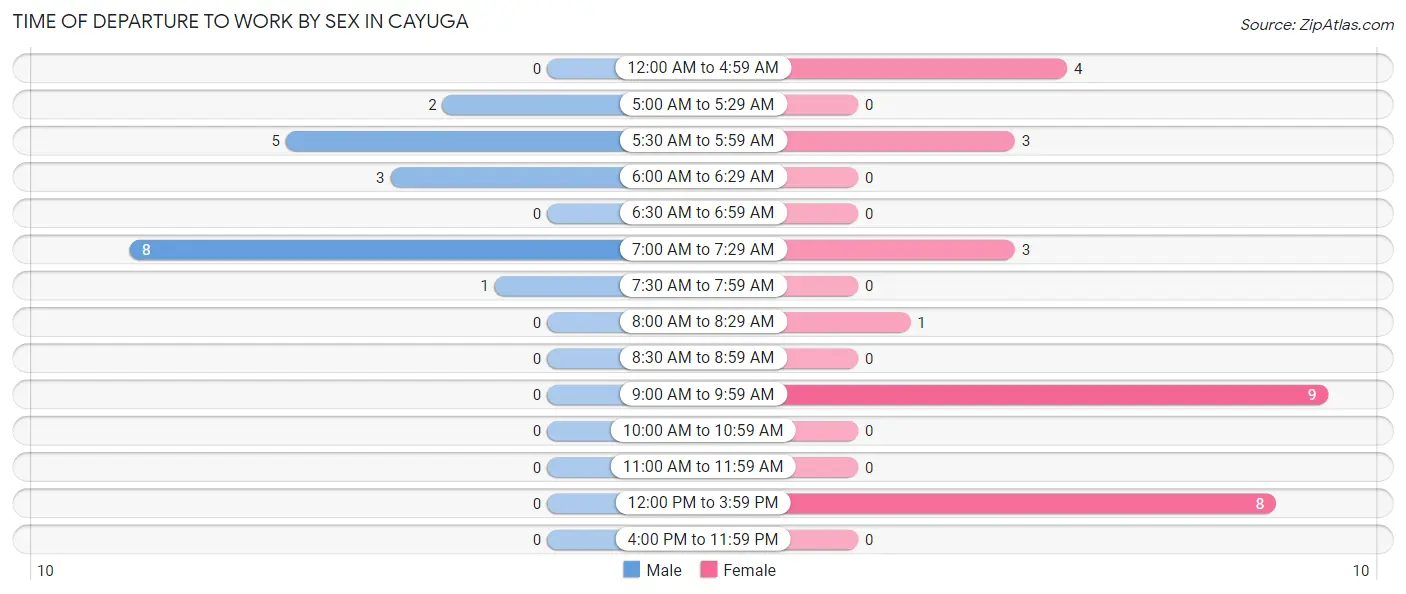
| Time of Departure | Male | Female |
| 12:00 AM to 4:59 AM | 0 (0.0%) | 4 (14.3%) |
| 5:00 AM to 5:29 AM | 2 (10.5%) | 0 (0.0%) |
| 5:30 AM to 5:59 AM | 5 (26.3%) | 3 (10.7%) |
| 6:00 AM to 6:29 AM | 3 (15.8%) | 0 (0.0%) |
| 6:30 AM to 6:59 AM | 0 (0.0%) | 0 (0.0%) |
| 7:00 AM to 7:29 AM | 8 (42.1%) | 3 (10.7%) |
| 7:30 AM to 7:59 AM | 1 (5.3%) | 0 (0.0%) |
| 8:00 AM to 8:29 AM | 0 (0.0%) | 1 (3.6%) |
| 8:30 AM to 8:59 AM | 0 (0.0%) | 0 (0.0%) |
| 9:00 AM to 9:59 AM | 0 (0.0%) | 9 (32.1%) |
| 10:00 AM to 10:59 AM | 0 (0.0%) | 0 (0.0%) |
| 11:00 AM to 11:59 AM | 0 (0.0%) | 0 (0.0%) |
| 12:00 PM to 3:59 PM | 0 (0.0%) | 8 (28.6%) |
| 4:00 PM to 11:59 PM | 0 (0.0%) | 0 (0.0%) |
| Total | 19 (100.0%) | 28 (100.0%) |
Housing Occupancy in Cayuga
Occupancy by Ownership in Cayuga
Of the total 49 dwellings in Cayuga, owner-occupied units account for 46 (93.9%), while renter-occupied units make up 3 (6.1%).
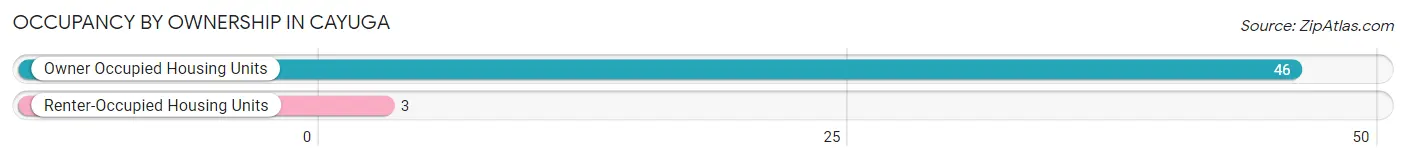
| Occupancy | # Housing Units | % Housing Units |
| Owner Occupied Housing Units | 46 | 93.9% |
| Renter-Occupied Housing Units | 3 | 6.1% |
| Total Occupied Housing Units | 49 | 100.0% |
Occupancy by Household Size in Cayuga
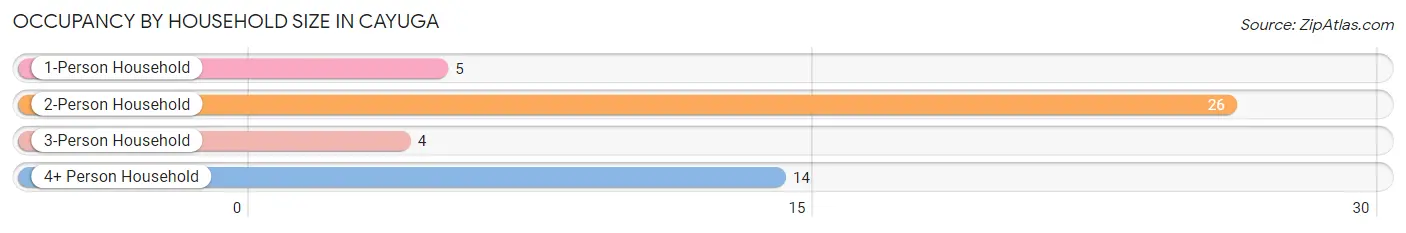
| Household Size | # Housing Units | % Housing Units |
| 1-Person Household | 5 | 10.2% |
| 2-Person Household | 26 | 53.1% |
| 3-Person Household | 4 | 8.2% |
| 4+ Person Household | 14 | 28.6% |
| Total Housing Units | 49 | 100.0% |
Occupancy by Ownership by Household Size in Cayuga
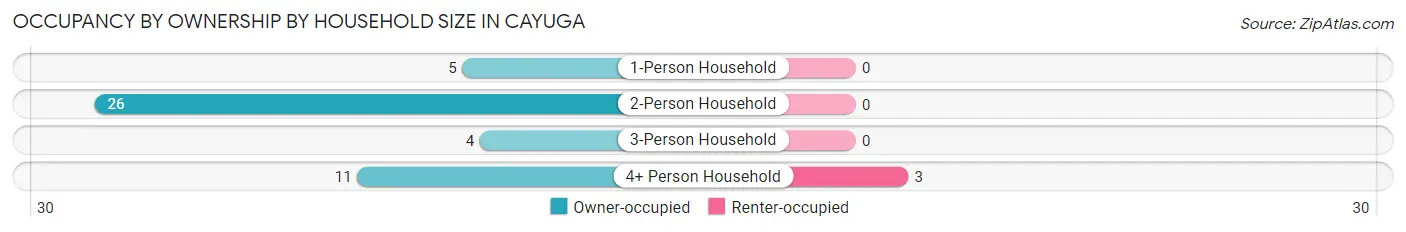
| Household Size | Owner-occupied | Renter-occupied |
| 1-Person Household | 5 (100.0%) | 0 (0.0%) |
| 2-Person Household | 26 (100.0%) | 0 (0.0%) |
| 3-Person Household | 4 (100.0%) | 0 (0.0%) |
| 4+ Person Household | 11 (78.6%) | 3 (21.4%) |
| Total Housing Units | 46 (93.9%) | 3 (6.1%) |
Occupancy by Educational Attainment in Cayuga
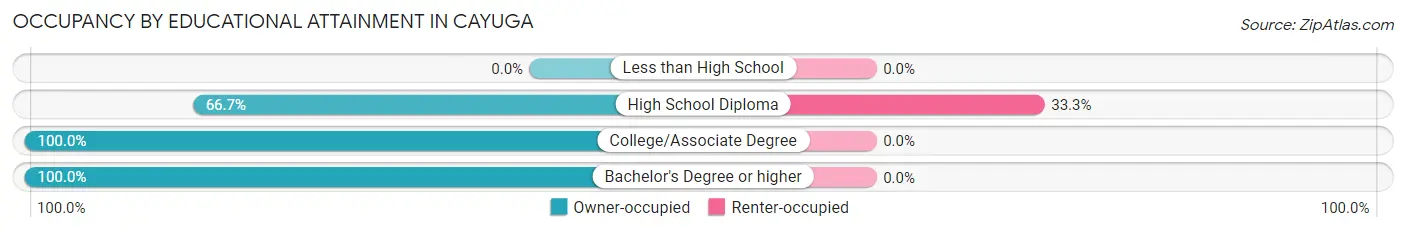
| Household Size | Owner-occupied | Renter-occupied |
| Less than High School | 0 (0.0%) | 0 (0.0%) |
| High School Diploma | 6 (66.7%) | 3 (33.3%) |
| College/Associate Degree | 25 (100.0%) | 0 (0.0%) |
| Bachelor's Degree or higher | 15 (100.0%) | 0 (0.0%) |
Occupancy by Age of Householder in Cayuga
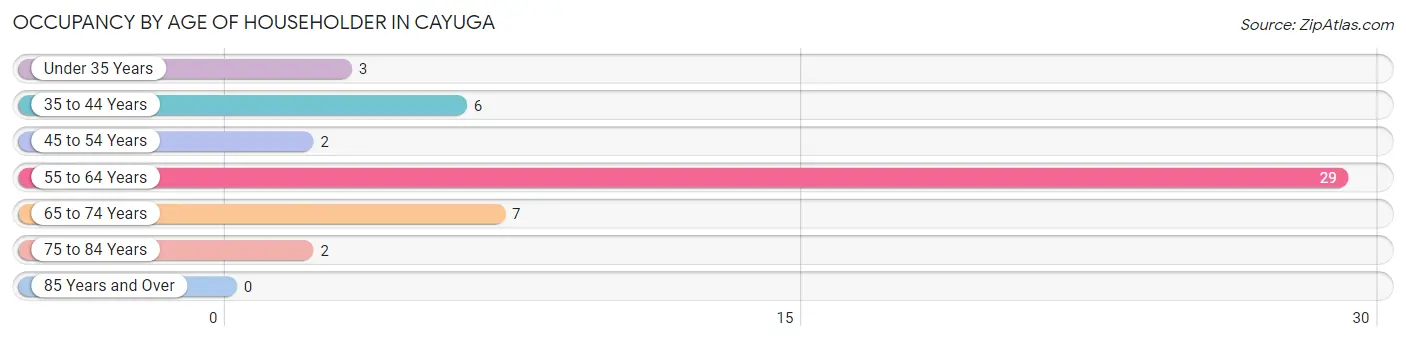
| Age Bracket | # Households | % Households |
| Under 35 Years | 3 | 6.1% |
| 35 to 44 Years | 6 | 12.2% |
| 45 to 54 Years | 2 | 4.1% |
| 55 to 64 Years | 29 | 59.2% |
| 65 to 74 Years | 7 | 14.3% |
| 75 to 84 Years | 2 | 4.1% |
| 85 Years and Over | 0 | 0.0% |
| Total | 49 | 100.0% |
Housing Finances in Cayuga
Median Income by Occupancy in Cayuga
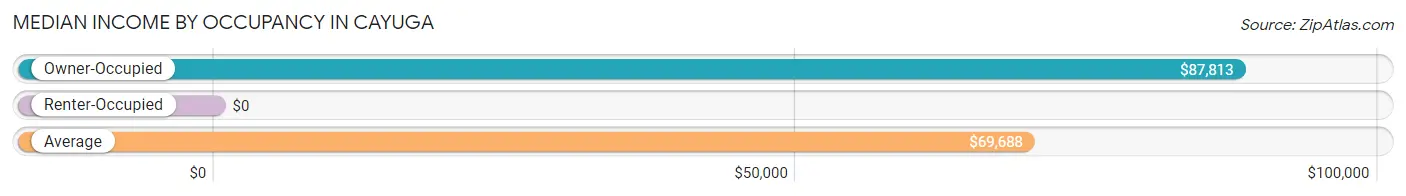
| Occupancy Type | # Households | Median Income |
| Owner-Occupied | 46 (93.9%) | $87,813 |
| Renter-Occupied | 3 (6.1%) | $0 |
| Average | 49 (100.0%) | $69,688 |
Occupancy by Householder Income Bracket in Cayuga
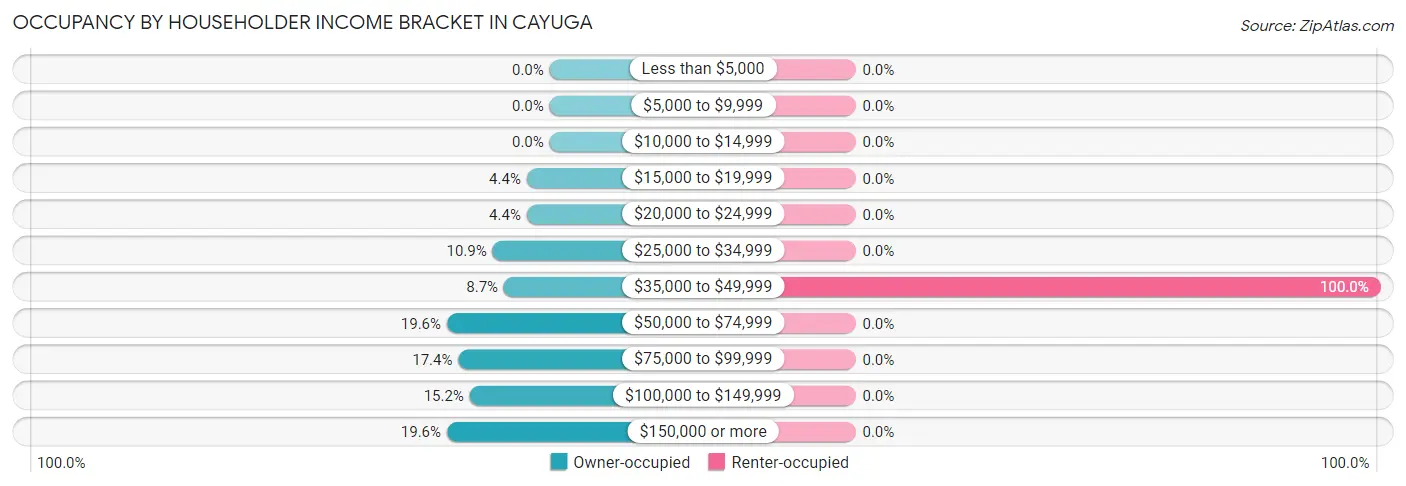
| Income Bracket | Owner-occupied | Renter-occupied |
| Less than $5,000 | 0 (0.0%) | 0 (0.0%) |
| $5,000 to $9,999 | 0 (0.0%) | 0 (0.0%) |
| $10,000 to $14,999 | 0 (0.0%) | 0 (0.0%) |
| $15,000 to $19,999 | 2 (4.3%) | 0 (0.0%) |
| $20,000 to $24,999 | 2 (4.3%) | 0 (0.0%) |
| $25,000 to $34,999 | 5 (10.9%) | 0 (0.0%) |
| $35,000 to $49,999 | 4 (8.7%) | 3 (100.0%) |
| $50,000 to $74,999 | 9 (19.6%) | 0 (0.0%) |
| $75,000 to $99,999 | 8 (17.4%) | 0 (0.0%) |
| $100,000 to $149,999 | 7 (15.2%) | 0 (0.0%) |
| $150,000 or more | 9 (19.6%) | 0 (0.0%) |
| Total | 46 (100.0%) | 3 (100.0%) |
Monthly Housing Cost Tiers in Cayuga
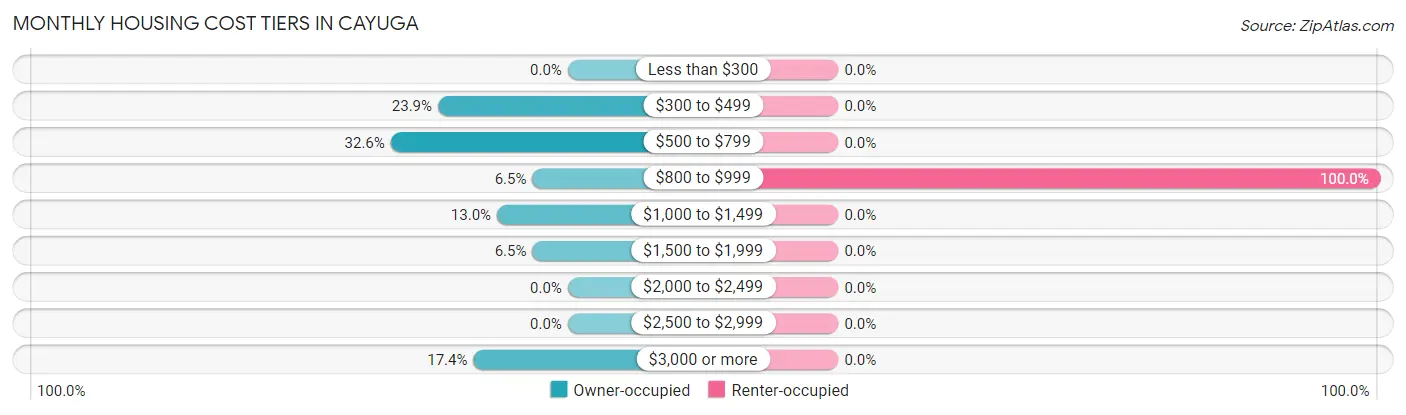
| Monthly Cost | Owner-occupied | Renter-occupied |
| Less than $300 | 0 (0.0%) | 0 (0.0%) |
| $300 to $499 | 11 (23.9%) | 0 (0.0%) |
| $500 to $799 | 15 (32.6%) | 0 (0.0%) |
| $800 to $999 | 3 (6.5%) | 3 (100.0%) |
| $1,000 to $1,499 | 6 (13.0%) | 0 (0.0%) |
| $1,500 to $1,999 | 3 (6.5%) | 0 (0.0%) |
| $2,000 to $2,499 | 0 (0.0%) | 0 (0.0%) |
| $2,500 to $2,999 | 0 (0.0%) | 0 (0.0%) |
| $3,000 or more | 8 (17.4%) | 0 (0.0%) |
| Total | 46 (100.0%) | 3 (100.0%) |
Physical Housing Characteristics in Cayuga
Housing Structures in Cayuga
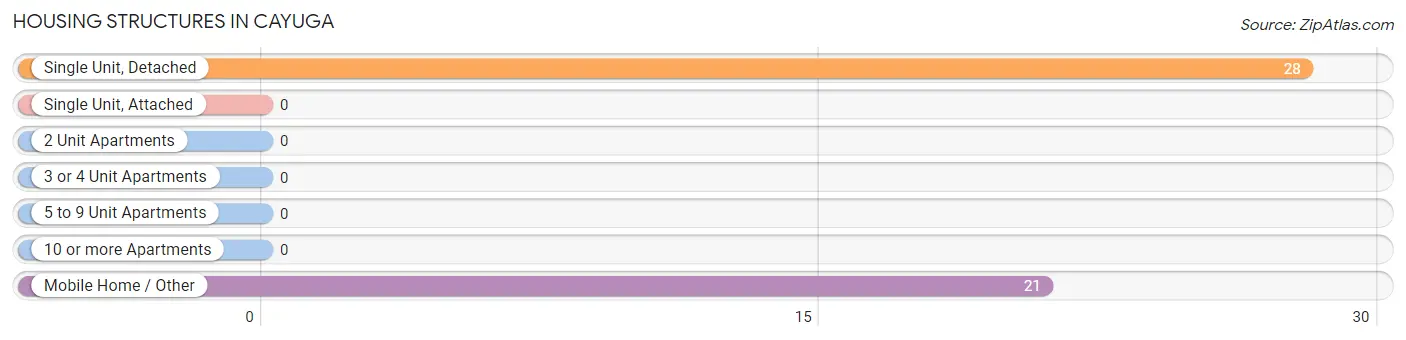
| Structure Type | # Housing Units | % Housing Units |
| Single Unit, Detached | 28 | 57.1% |
| Single Unit, Attached | 0 | 0.0% |
| 2 Unit Apartments | 0 | 0.0% |
| 3 or 4 Unit Apartments | 0 | 0.0% |
| 5 to 9 Unit Apartments | 0 | 0.0% |
| 10 or more Apartments | 0 | 0.0% |
| Mobile Home / Other | 21 | 42.9% |
| Total | 49 | 100.0% |
Housing Structures by Occupancy in Cayuga
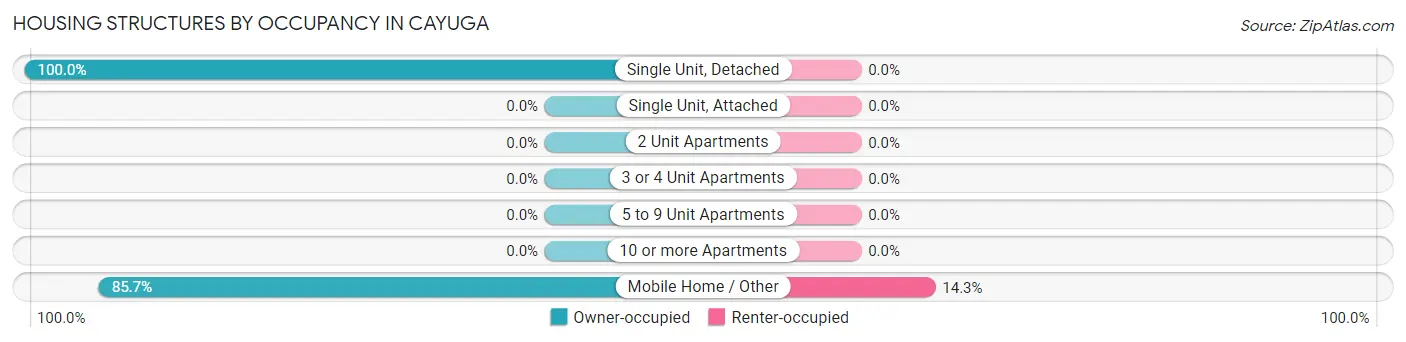
| Structure Type | Owner-occupied | Renter-occupied |
| Single Unit, Detached | 28 (100.0%) | 0 (0.0%) |
| Single Unit, Attached | 0 (0.0%) | 0 (0.0%) |
| 2 Unit Apartments | 0 (0.0%) | 0 (0.0%) |
| 3 or 4 Unit Apartments | 0 (0.0%) | 0 (0.0%) |
| 5 to 9 Unit Apartments | 0 (0.0%) | 0 (0.0%) |
| 10 or more Apartments | 0 (0.0%) | 0 (0.0%) |
| Mobile Home / Other | 18 (85.7%) | 3 (14.3%) |
| Total | 46 (93.9%) | 3 (6.1%) |
Housing Structures by Number of Rooms in Cayuga
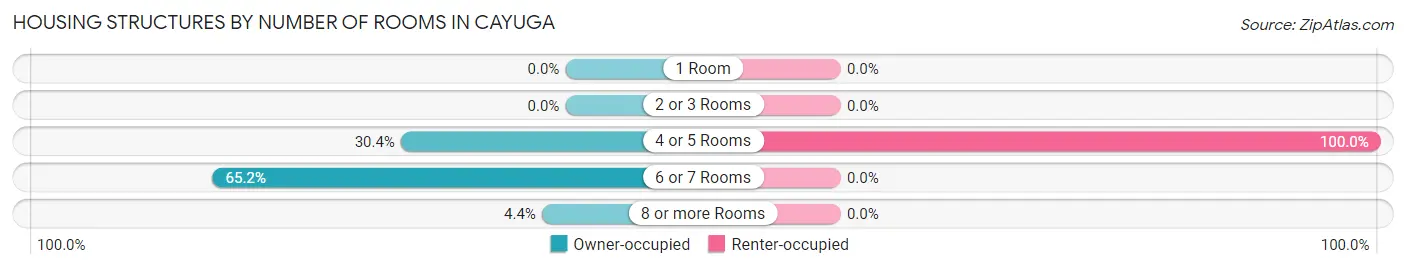
| Number of Rooms | Owner-occupied | Renter-occupied |
| 1 Room | 0 (0.0%) | 0 (0.0%) |
| 2 or 3 Rooms | 0 (0.0%) | 0 (0.0%) |
| 4 or 5 Rooms | 14 (30.4%) | 3 (100.0%) |
| 6 or 7 Rooms | 30 (65.2%) | 0 (0.0%) |
| 8 or more Rooms | 2 (4.3%) | 0 (0.0%) |
| Total | 46 (100.0%) | 3 (100.0%) |
Housing Structure by Heating Type in Cayuga
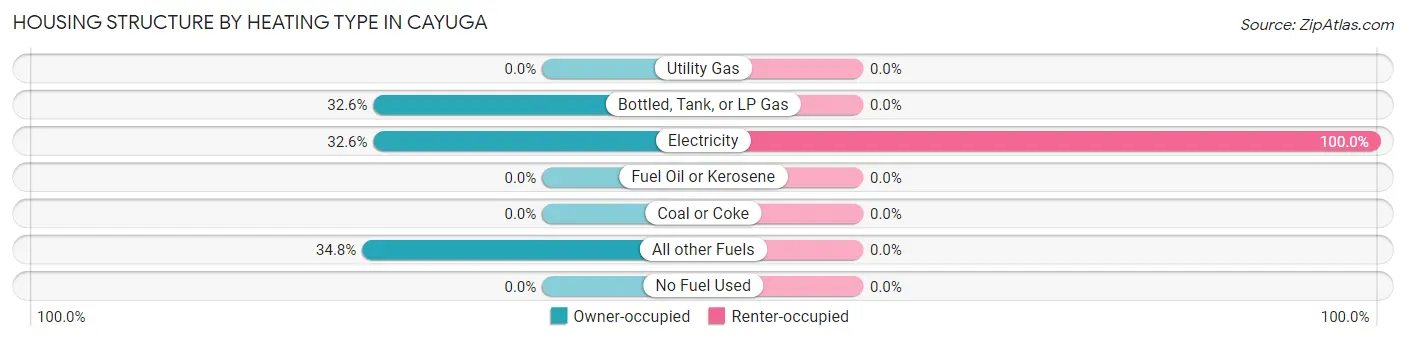
| Heating Type | Owner-occupied | Renter-occupied |
| Utility Gas | 0 (0.0%) | 0 (0.0%) |
| Bottled, Tank, or LP Gas | 15 (32.6%) | 0 (0.0%) |
| Electricity | 15 (32.6%) | 3 (100.0%) |
| Fuel Oil or Kerosene | 0 (0.0%) | 0 (0.0%) |
| Coal or Coke | 0 (0.0%) | 0 (0.0%) |
| All other Fuels | 16 (34.8%) | 0 (0.0%) |
| No Fuel Used | 0 (0.0%) | 0 (0.0%) |
| Total | 46 (100.0%) | 3 (100.0%) |
Household Vehicle Usage in Cayuga
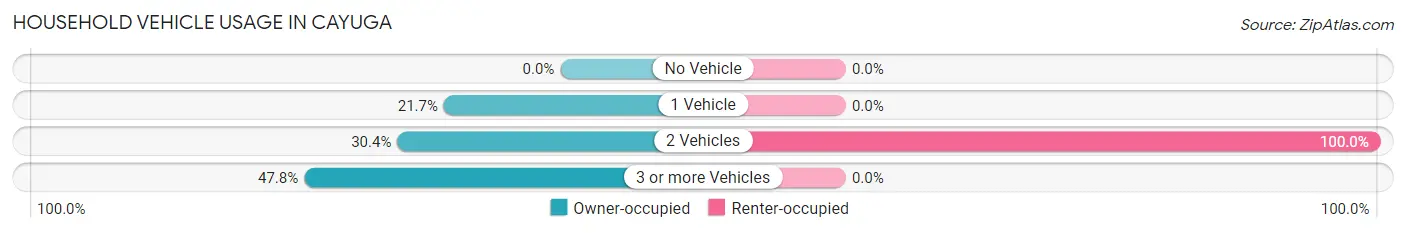
| Vehicles per Household | Owner-occupied | Renter-occupied |
| No Vehicle | 0 (0.0%) | 0 (0.0%) |
| 1 Vehicle | 10 (21.7%) | 0 (0.0%) |
| 2 Vehicles | 14 (30.4%) | 3 (100.0%) |
| 3 or more Vehicles | 22 (47.8%) | 0 (0.0%) |
| Total | 46 (100.0%) | 3 (100.0%) |
Real Estate & Mortgages in Cayuga
Real Estate and Mortgage Overview in Cayuga
| Characteristic | Without Mortgage | With Mortgage |
| Housing Units | 29 | 17 |
| Median Property Value | $210,700 | $0 |
| Median Household Income | $59,375 | $0 |
| Monthly Housing Costs | $588 | $8 |
| Real Estate Taxes | $1,188 | $2 |
Property Value by Mortgage Status in Cayuga
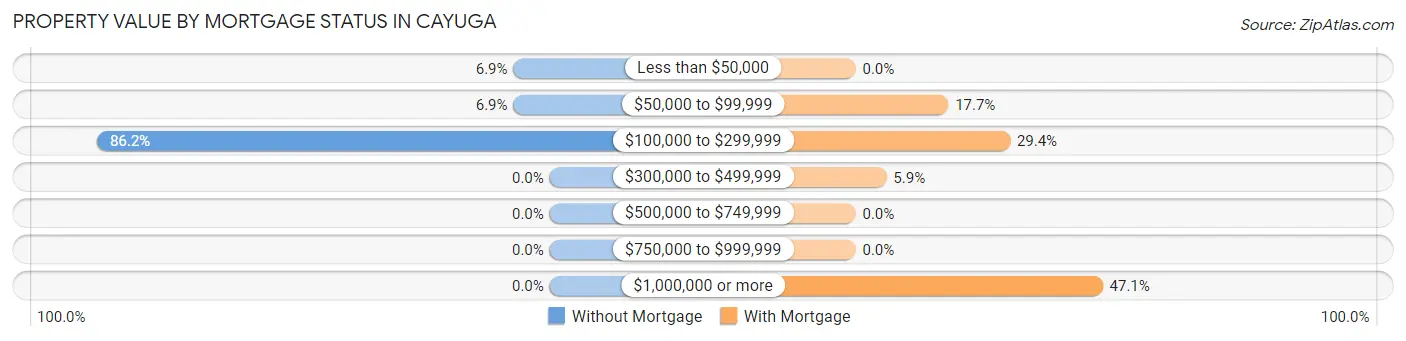
| Property Value | Without Mortgage | With Mortgage |
| Less than $50,000 | 2 (6.9%) | 0 (0.0%) |
| $50,000 to $99,999 | 2 (6.9%) | 3 (17.6%) |
| $100,000 to $299,999 | 25 (86.2%) | 5 (29.4%) |
| $300,000 to $499,999 | 0 (0.0%) | 1 (5.9%) |
| $500,000 to $749,999 | 0 (0.0%) | 0 (0.0%) |
| $750,000 to $999,999 | 0 (0.0%) | 0 (0.0%) |
| $1,000,000 or more | 0 (0.0%) | 8 (47.1%) |
| Total | 29 (100.0%) | 17 (100.0%) |
Household Income by Mortgage Status in Cayuga
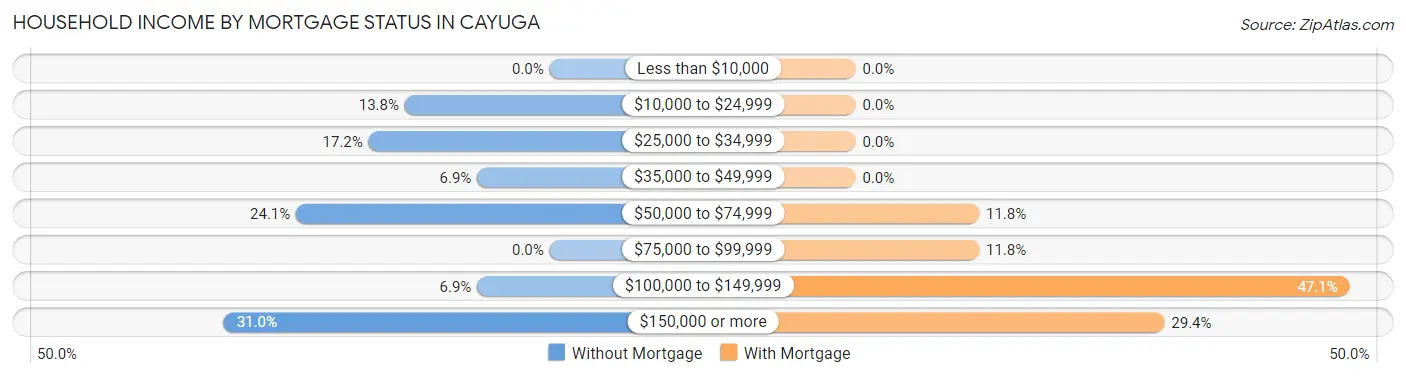
| Household Income | Without Mortgage | With Mortgage |
| Less than $10,000 | 0 (0.0%) | 0 (0.0%) |
| $10,000 to $24,999 | 4 (13.8%) | 0 (0.0%) |
| $25,000 to $34,999 | 5 (17.2%) | 0 (0.0%) |
| $35,000 to $49,999 | 2 (6.9%) | 0 (0.0%) |
| $50,000 to $74,999 | 7 (24.1%) | 2 (11.8%) |
| $75,000 to $99,999 | 0 (0.0%) | 2 (11.8%) |
| $100,000 to $149,999 | 2 (6.9%) | 8 (47.1%) |
| $150,000 or more | 9 (31.0%) | 5 (29.4%) |
| Total | 29 (100.0%) | 17 (100.0%) |
Property Value to Household Income Ratio in Cayuga
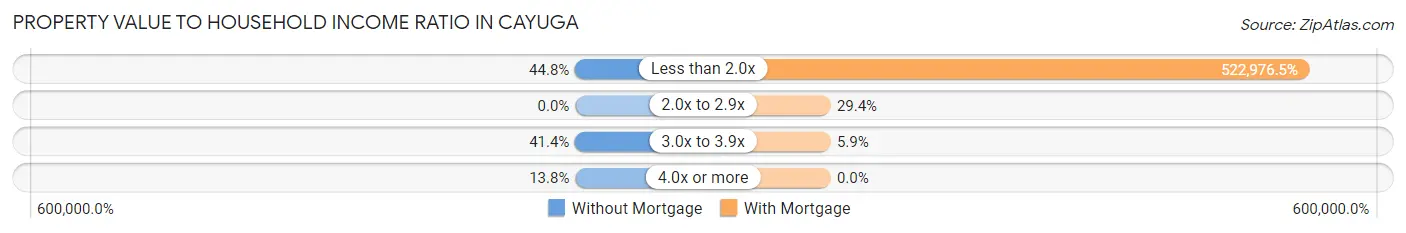
| Value-to-Income Ratio | Without Mortgage | With Mortgage |
| Less than 2.0x | 13 (44.8%) | 88,906 (522,976.5%) |
| 2.0x to 2.9x | 0 (0.0%) | 5 (29.4%) |
| 3.0x to 3.9x | 12 (41.4%) | 1 (5.9%) |
| 4.0x or more | 4 (13.8%) | 0 (0.0%) |
| Total | 29 (100.0%) | 17 (100.0%) |
Real Estate Taxes by Mortgage Status in Cayuga
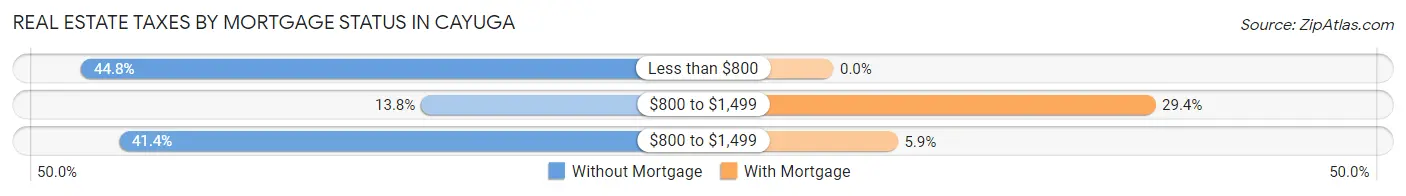
| Property Taxes | Without Mortgage | With Mortgage |
| Less than $800 | 13 (44.8%) | 0 (0.0%) |
| $800 to $1,499 | 4 (13.8%) | 5 (29.4%) |
| $800 to $1,499 | 12 (41.4%) | 1 (5.9%) |
| Total | 29 (100.0%) | 17 (100.0%) |
Health & Disability in Cayuga
Health Insurance Coverage by Age in Cayuga
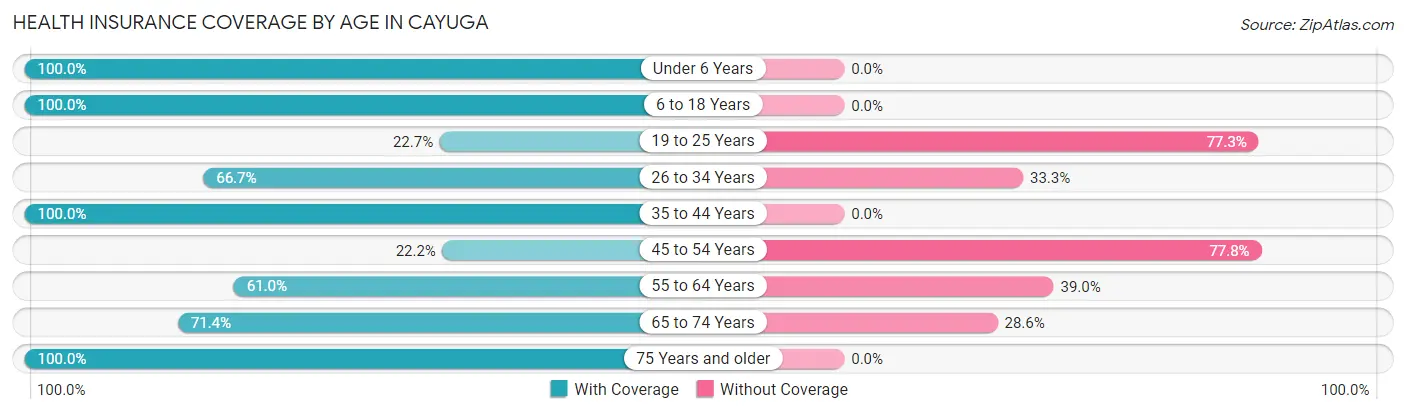
| Age Bracket | With Coverage | Without Coverage |
| Under 6 Years | 12 (100.0%) | 0 (0.0%) |
| 6 to 18 Years | 23 (100.0%) | 0 (0.0%) |
| 19 to 25 Years | 5 (22.7%) | 17 (77.3%) |
| 26 to 34 Years | 6 (66.7%) | 3 (33.3%) |
| 35 to 44 Years | 11 (100.0%) | 0 (0.0%) |
| 45 to 54 Years | 2 (22.2%) | 7 (77.8%) |
| 55 to 64 Years | 25 (61.0%) | 16 (39.0%) |
| 65 to 74 Years | 15 (71.4%) | 6 (28.6%) |
| 75 Years and older | 2 (100.0%) | 0 (0.0%) |
| Total | 101 (67.3%) | 49 (32.7%) |
Health Insurance Coverage by Citizenship Status in Cayuga
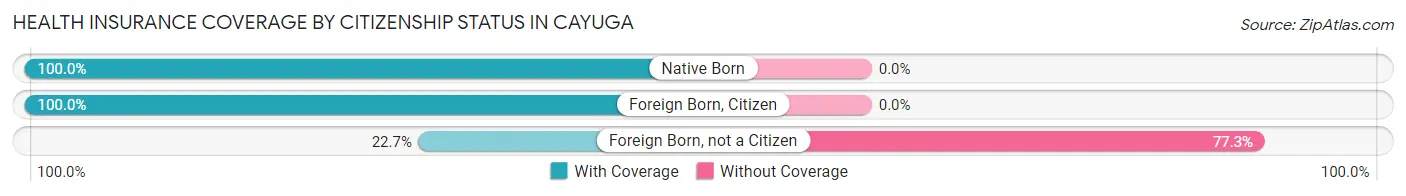
| Citizenship Status | With Coverage | Without Coverage |
| Native Born | 12 (100.0%) | 0 (0.0%) |
| Foreign Born, Citizen | 23 (100.0%) | 0 (0.0%) |
| Foreign Born, not a Citizen | 5 (22.7%) | 17 (77.3%) |
Health Insurance Coverage by Household Income in Cayuga
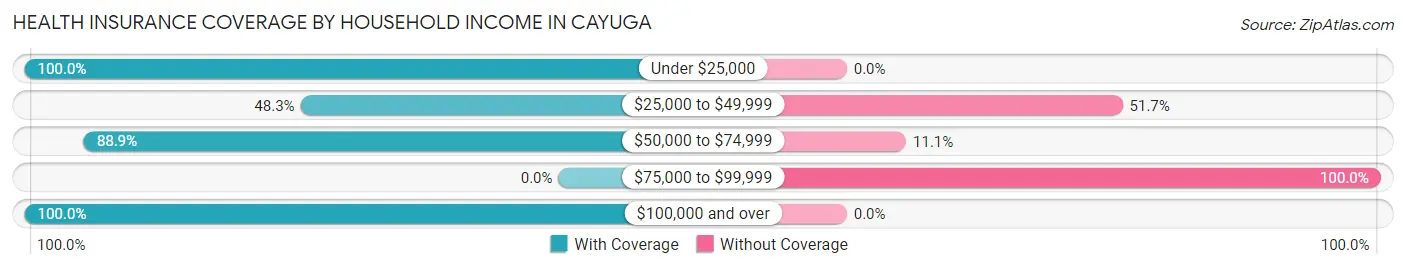
| Household Income | With Coverage | Without Coverage |
| Under $25,000 | 4 (100.0%) | 0 (0.0%) |
| $25,000 to $49,999 | 29 (48.3%) | 31 (51.7%) |
| $50,000 to $74,999 | 24 (88.9%) | 3 (11.1%) |
| $75,000 to $99,999 | 0 (0.0%) | 15 (100.0%) |
| $100,000 and over | 44 (100.0%) | 0 (0.0%) |
Public vs Private Health Insurance Coverage by Age in Cayuga
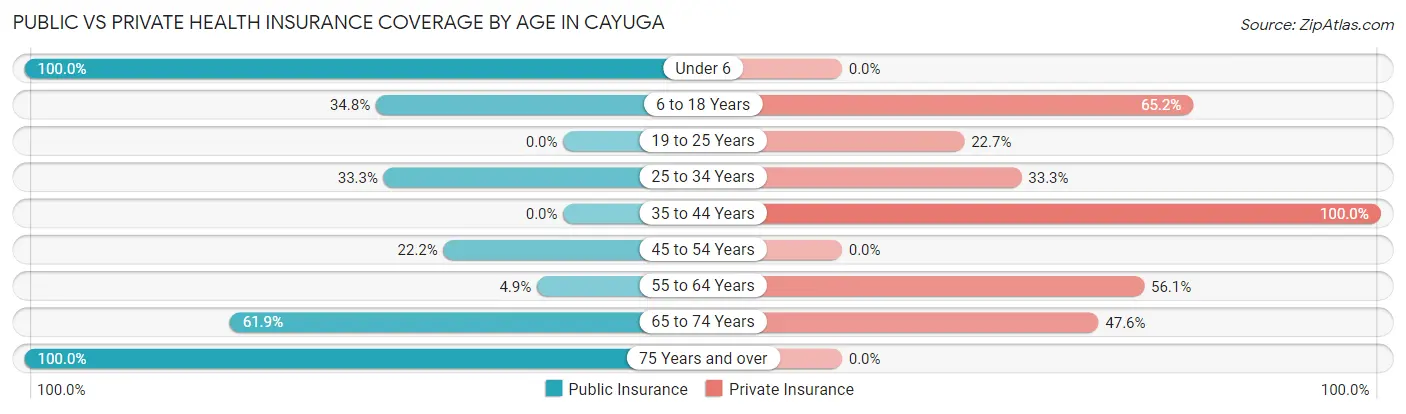
| Age Bracket | Public Insurance | Private Insurance |
| Under 6 | 12 (100.0%) | 0 (0.0%) |
| 6 to 18 Years | 8 (34.8%) | 15 (65.2%) |
| 19 to 25 Years | 0 (0.0%) | 5 (22.7%) |
| 25 to 34 Years | 3 (33.3%) | 3 (33.3%) |
| 35 to 44 Years | 0 (0.0%) | 11 (100.0%) |
| 45 to 54 Years | 2 (22.2%) | 0 (0.0%) |
| 55 to 64 Years | 2 (4.9%) | 23 (56.1%) |
| 65 to 74 Years | 13 (61.9%) | 10 (47.6%) |
| 75 Years and over | 2 (100.0%) | 0 (0.0%) |
| Total | 42 (28.0%) | 67 (44.7%) |
Disability Status by Sex by Age in Cayuga
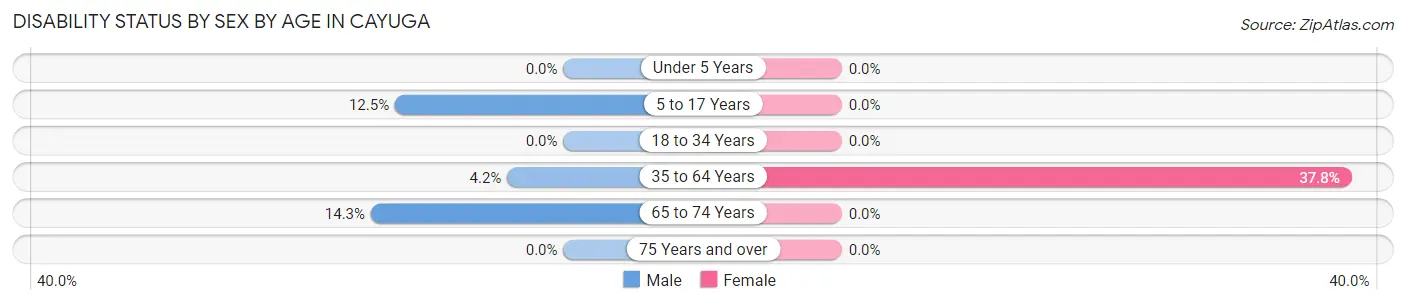
| Age Bracket | Male | Female |
| Under 5 Years | 0 (0.0%) | 0 (0.0%) |
| 5 to 17 Years | 2 (12.5%) | 0 (0.0%) |
| 18 to 34 Years | 0 (0.0%) | 0 (0.0%) |
| 35 to 64 Years | 1 (4.2%) | 14 (37.8%) |
| 65 to 74 Years | 2 (14.3%) | 0 (0.0%) |
| 75 Years and over | 0 (0.0%) | 0 (0.0%) |
Disability Class by Sex by Age in Cayuga
Disability Class: Hearing Difficulty
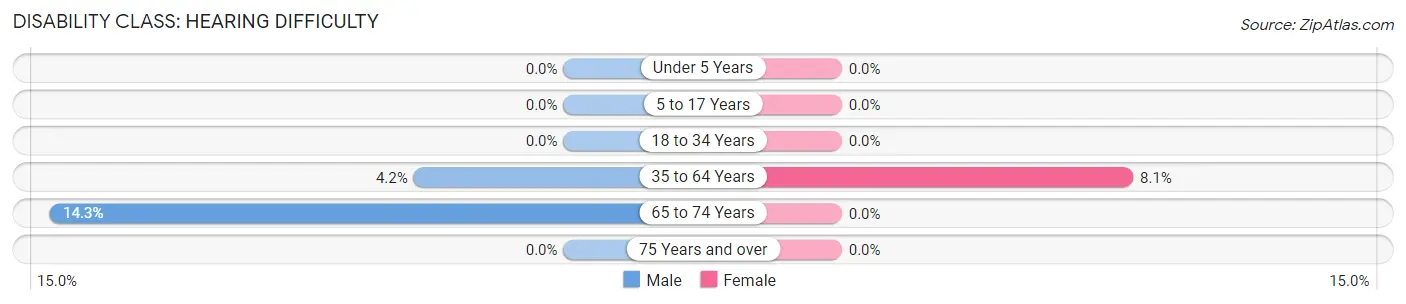
| Age Bracket | Male | Female |
| Under 5 Years | 0 (0.0%) | 0 (0.0%) |
| 5 to 17 Years | 0 (0.0%) | 0 (0.0%) |
| 18 to 34 Years | 0 (0.0%) | 0 (0.0%) |
| 35 to 64 Years | 1 (4.2%) | 3 (8.1%) |
| 65 to 74 Years | 2 (14.3%) | 0 (0.0%) |
| 75 Years and over | 0 (0.0%) | 0 (0.0%) |
Disability Class: Vision Difficulty
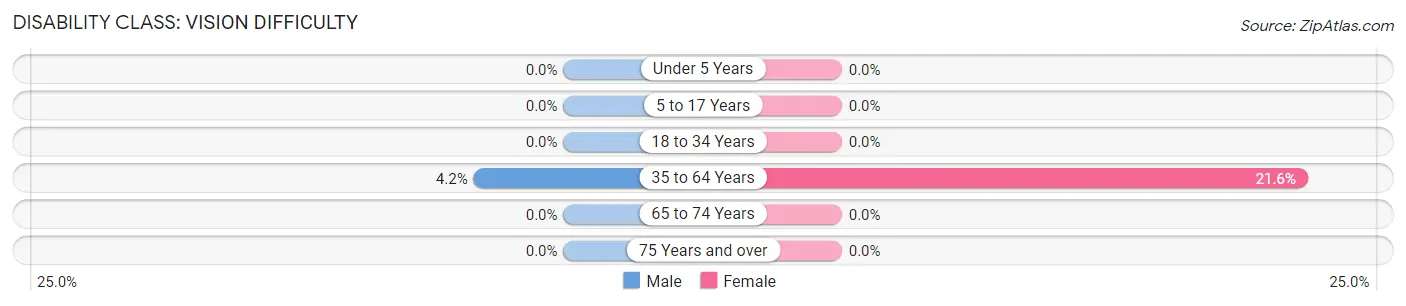
| Age Bracket | Male | Female |
| Under 5 Years | 0 (0.0%) | 0 (0.0%) |
| 5 to 17 Years | 0 (0.0%) | 0 (0.0%) |
| 18 to 34 Years | 0 (0.0%) | 0 (0.0%) |
| 35 to 64 Years | 1 (4.2%) | 8 (21.6%) |
| 65 to 74 Years | 0 (0.0%) | 0 (0.0%) |
| 75 Years and over | 0 (0.0%) | 0 (0.0%) |
Disability Class: Cognitive Difficulty
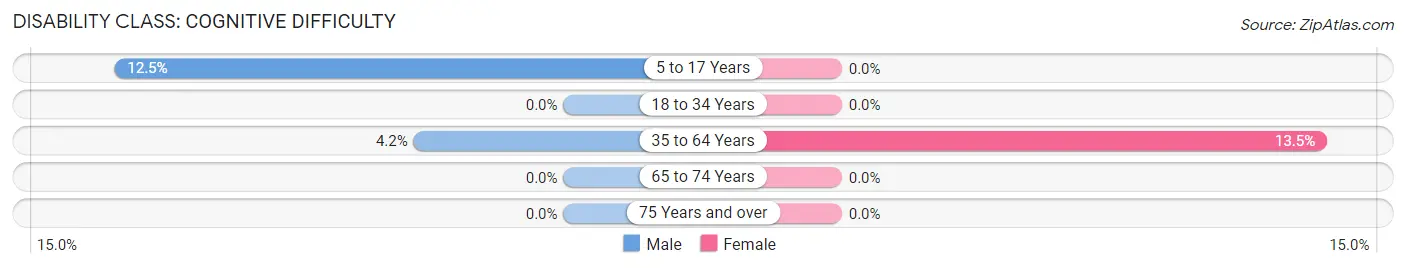
| Age Bracket | Male | Female |
| 5 to 17 Years | 2 (12.5%) | 0 (0.0%) |
| 18 to 34 Years | 0 (0.0%) | 0 (0.0%) |
| 35 to 64 Years | 1 (4.2%) | 5 (13.5%) |
| 65 to 74 Years | 0 (0.0%) | 0 (0.0%) |
| 75 Years and over | 0 (0.0%) | 0 (0.0%) |
Disability Class: Ambulatory Difficulty
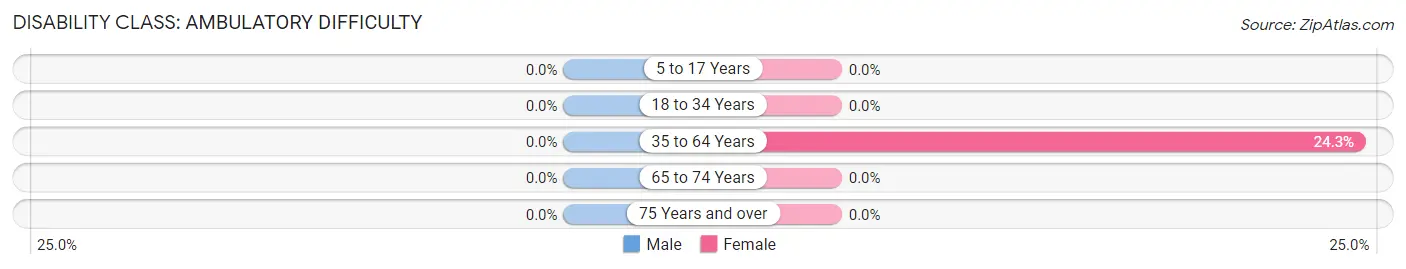
| Age Bracket | Male | Female |
| 5 to 17 Years | 0 (0.0%) | 0 (0.0%) |
| 18 to 34 Years | 0 (0.0%) | 0 (0.0%) |
| 35 to 64 Years | 0 (0.0%) | 9 (24.3%) |
| 65 to 74 Years | 0 (0.0%) | 0 (0.0%) |
| 75 Years and over | 0 (0.0%) | 0 (0.0%) |
Disability Class: Self-Care Difficulty
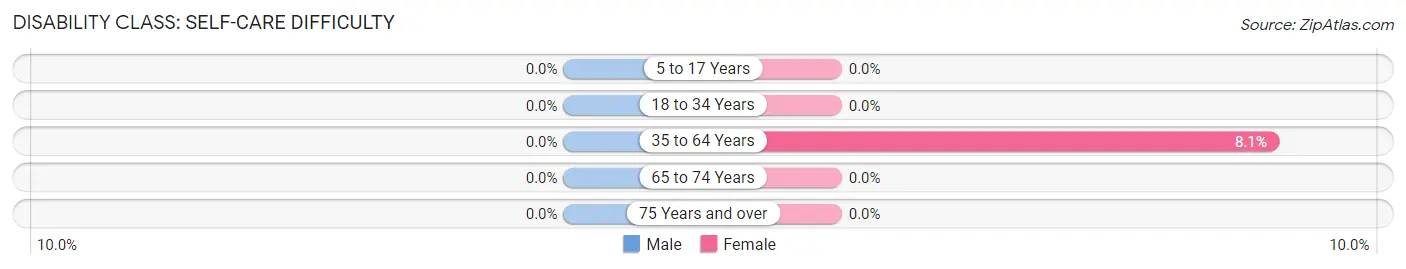
| Age Bracket | Male | Female |
| 5 to 17 Years | 0 (0.0%) | 0 (0.0%) |
| 18 to 34 Years | 0 (0.0%) | 0 (0.0%) |
| 35 to 64 Years | 0 (0.0%) | 3 (8.1%) |
| 65 to 74 Years | 0 (0.0%) | 0 (0.0%) |
| 75 Years and over | 0 (0.0%) | 0 (0.0%) |
Technology Access in Cayuga
Computing Device Access in Cayuga

| Device Type | # Households | % Households |
| Desktop or Laptop | 44 | 89.8% |
| Smartphone | 49 | 100.0% |
| Tablet | 32 | 65.3% |
| No Computing Device | 0 | 0.0% |
| Total | 49 | 100.0% |
Internet Access in Cayuga
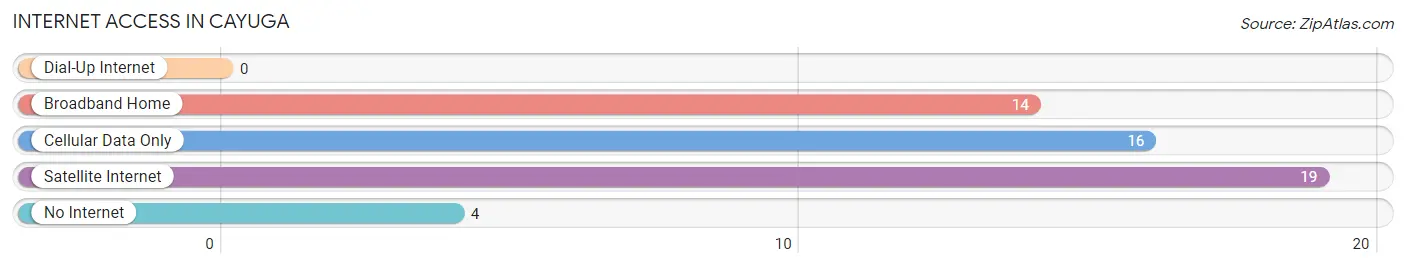
| Internet Type | # Households | % Households |
| Dial-Up Internet | 0 | 0.0% |
| Broadband Home | 14 | 28.6% |
| Cellular Data Only | 16 | 32.7% |
| Satellite Internet | 19 | 38.8% |
| No Internet | 4 | 8.2% |
| Total | 49 | 100.0% |
Cayuga Summary
Cayuga is a small town located in the southeastern corner of Oklahoma, in Pittsburg County. It is situated on the banks of the Kiamichi River, and is surrounded by the Ouachita National Forest. The town was founded in 1894, and was named after the Cayuga Indians, who were the original inhabitants of the area.
Geography
Cayuga is located at the intersection of U.S. Highway 271 and State Highway 2, approximately 20 miles south of McAlester and 40 miles north of Paris, Texas. The town is situated on the banks of the Kiamichi River, and is surrounded by the Ouachita National Forest. The town is located in a hilly, wooded area, and is known for its scenic beauty. The average elevation of the town is 590 feet above sea level.
Economy
The economy of Cayuga is largely based on agriculture and timber. The town is home to several small farms, and the surrounding area is known for its timber production. The town also has a few small businesses, including a grocery store, a hardware store, and a few restaurants.
Demographics
As of the 2010 census, the population of Cayuga was 545. The racial makeup of the town was 95.3% White, 0.2% African American, 0.7% Native American, 0.2% Asian, 0.2% from other races, and 3.4% from two or more races. Hispanic or Latino of any race were 1.3% of the population.
The median income for a household in the town was $25,000, and the median income for a family was $30,000. The per capita income for the town was $14,000. About 18.2% of families and 20.2% of the population were below the poverty line, including 28.3% of those under age 18 and 10.3% of those age 65 or over.
History
Cayuga was founded in 1894, and was named after the Cayuga Indians, who were the original inhabitants of the area. The town was originally a farming community, and the surrounding area was known for its timber production. In the early 1900s, the town was home to several sawmills and lumber companies.
In the 1920s, the town began to experience a period of growth, as the timber industry began to boom. The town was home to several sawmills and lumber companies, and the population began to grow. The town was also home to several stores, restaurants, and other businesses.
In the 1950s, the timber industry began to decline, and the town began to experience a period of economic decline. The population began to decline, and many of the businesses in the town closed. In the late 1970s, the town began to experience a period of revitalization, as new businesses began to open in the town.
Today, Cayuga is a small, rural town with a population of just over 500. The town is still largely dependent on agriculture and timber, and is known for its scenic beauty. The town is home to several small businesses, and is a popular destination for outdoor recreation.
Common Questions
What is Per Capita Income in Cayuga?
Per Capita income in Cayuga is $28,757.
What is the Median Family Income in Cayuga?
Median Family Income in Cayuga is $88,125.
What is the Median Household income in Cayuga?
Median Household Income in Cayuga is $69,688.
What is Income or Wage Gap in Cayuga?
Income or Wage Gap in Cayuga is 27.6%.
Women in Cayuga earn 72.4 cents for every dollar earned by a man.
What is Inequality or Gini Index in Cayuga?
Inequality or Gini Index in Cayuga is 0.32.
What is the Total Population of Cayuga?
Total Population of Cayuga is 150.
What is the Total Male Population of Cayuga?
Total Male Population of Cayuga is 66.
What is the Total Female Population of Cayuga?
Total Female Population of Cayuga is 84.
What is the Ratio of Males per 100 Females in Cayuga?
There are 78.57 Males per 100 Females in Cayuga.
What is the Ratio of Females per 100 Males in Cayuga?
There are 127.27 Females per 100 Males in Cayuga.
What is the Median Population Age in Cayuga?
Median Population Age in Cayuga is 44.3 Years.
What is the Average Family Size in Cayuga
Average Family Size in Cayuga is 3.3 People.
What is the Average Household Size in Cayuga
Average Household Size in Cayuga is 3.1 People.
How Large is the Labor Force in Cayuga?
There are 70 People in the Labor Forcein in Cayuga.
What is the Percentage of People in the Labor Force in Cayuga?
56.5% of People are in the Labor Force in Cayuga.
What is the Unemployment Rate in Cayuga?
Unemployment Rate in Cayuga is 8.6%.