Tuskahoma, OK Map & Demographics
Tuskahoma Map
Tuskahoma Overview
$28,525
PER CAPITA INCOME
$47,500
AVG HOUSEHOLD INCOME
0.45
INEQUALITY / GINI INDEX
64
TOTAL POPULATION
33
MALE POPULATION
31
FEMALE POPULATION
106.45
MALES / 100 FEMALES
93.94
FEMALES / 100 MALES
65.5
MEDIAN AGE
2.3
AVG FAMILY SIZE
2.0
AVG HOUSEHOLD SIZE
14
LABOR FORCE [ PEOPLE ]
22.6%
PERCENT IN LABOR FORCE
Tuskahoma Zip Codes
Tuskahoma Area Codes
Income in Tuskahoma
Income Overview in Tuskahoma
| Characteristic | Number | Measure |
| Per Capita Income | 64 | $28,525 |
| Median Family Income | 19 | $0 |
| Mean Family Income | 19 | $80,221 |
| Median Household Income | 32 | $47,500 |
| Mean Household Income | 32 | $58,794 |
| Income Deficit | 19 | $0 |
| Wage / Income Gap (%) | 64 | 0.00% |
| Wage / Income Gap ($) | 64 | 100.00¢ per $1 |
| Gini / Inequality Index | 64 | 0.45 |
Earnings by Sex in Tuskahoma
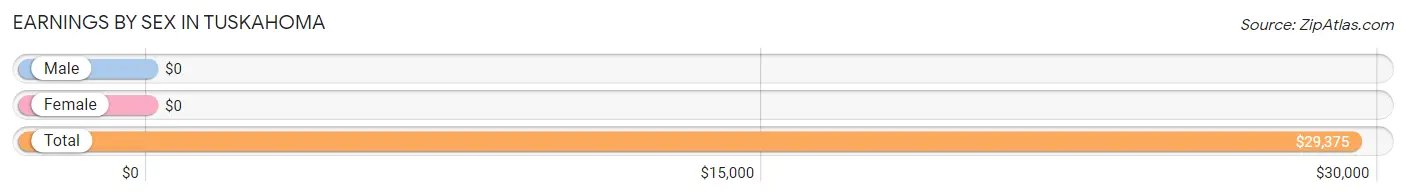
| Sex | Number | Average Earnings |
| Male | 5 (35.7%) | $0 |
| Female | 9 (64.3%) | $0 |
| Total | 14 (100.0%) | $29,375 |
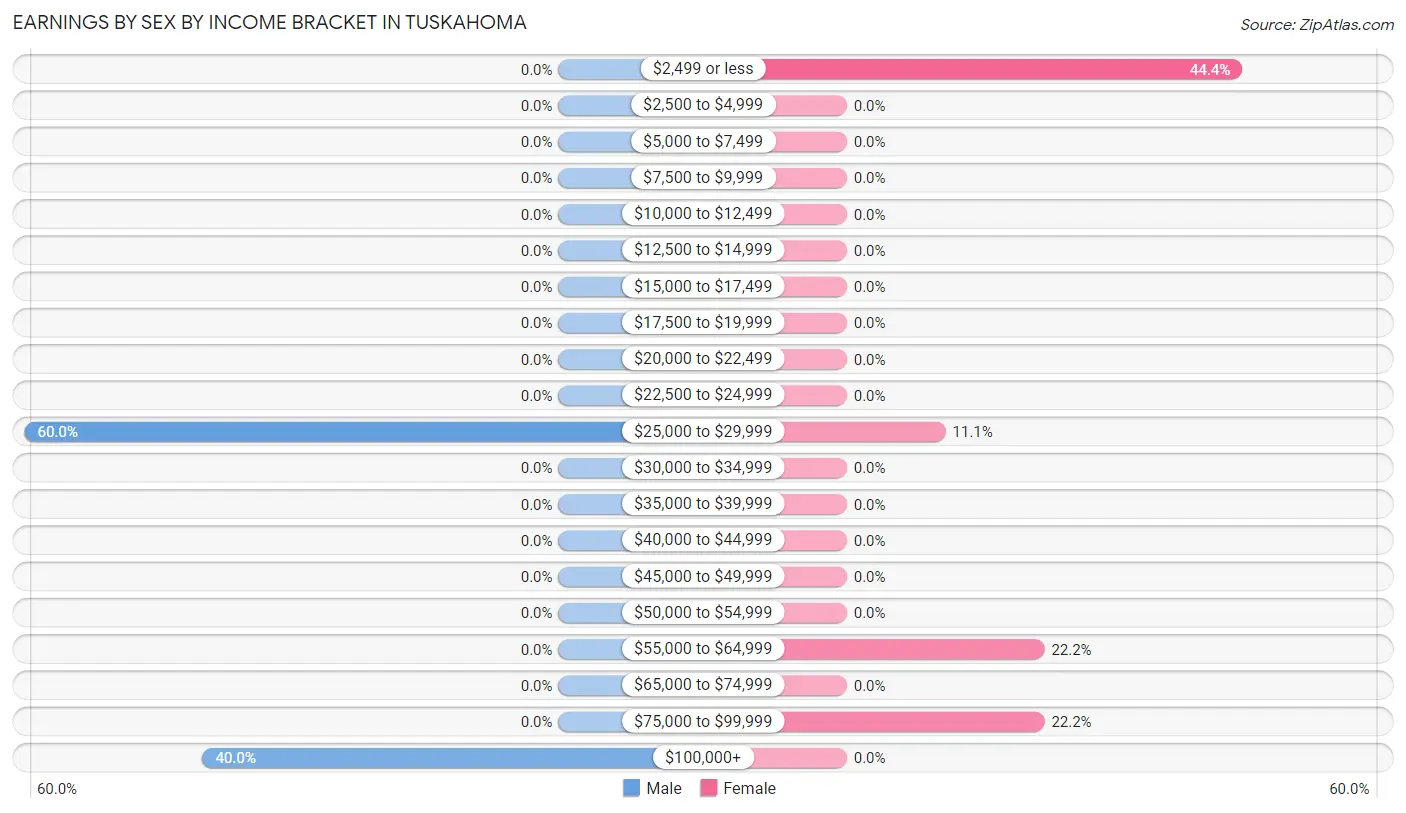
Earnings by Sex by Income Bracket in Tuskahoma
The most common earnings brackets in Tuskahoma are $25,000 to $29,999 for men (3 | 60.0%) and $2,499 or less for women (4 | 44.4%).
| Income | Male | Female |
| $2,499 or less | 0 (0.0%) | 4 (44.4%) |
| $2,500 to $4,999 | 0 (0.0%) | 0 (0.0%) |
| $5,000 to $7,499 | 0 (0.0%) | 0 (0.0%) |
| $7,500 to $9,999 | 0 (0.0%) | 0 (0.0%) |
| $10,000 to $12,499 | 0 (0.0%) | 0 (0.0%) |
| $12,500 to $14,999 | 0 (0.0%) | 0 (0.0%) |
| $15,000 to $17,499 | 0 (0.0%) | 0 (0.0%) |
| $17,500 to $19,999 | 0 (0.0%) | 0 (0.0%) |
| $20,000 to $22,499 | 0 (0.0%) | 0 (0.0%) |
| $22,500 to $24,999 | 0 (0.0%) | 0 (0.0%) |
| $25,000 to $29,999 | 3 (60.0%) | 1 (11.1%) |
| $30,000 to $34,999 | 0 (0.0%) | 0 (0.0%) |
| $35,000 to $39,999 | 0 (0.0%) | 0 (0.0%) |
| $40,000 to $44,999 | 0 (0.0%) | 0 (0.0%) |
| $45,000 to $49,999 | 0 (0.0%) | 0 (0.0%) |
| $50,000 to $54,999 | 0 (0.0%) | 0 (0.0%) |
| $55,000 to $64,999 | 0 (0.0%) | 2 (22.2%) |
| $65,000 to $74,999 | 0 (0.0%) | 0 (0.0%) |
| $75,000 to $99,999 | 0 (0.0%) | 2 (22.2%) |
| $100,000+ | 2 (40.0%) | 0 (0.0%) |
| Total | 5 (100.0%) | 9 (100.0%) |
Earnings by Sex by Educational Attainment in Tuskahoma
| Educational Attainment | Male Income | Female Income |
| Less than High School | - | - |
| High School Diploma | - | - |
| College or Associate's Degree | - | - |
| Bachelor's Degree | - | - |
| Graduate Degree | - | - |
| Total | - | - |
Family Income in Tuskahoma
Family Income Brackets in Tuskahoma
According to the Tuskahoma family income data, there are 5 families falling into the $100,000 to $149,999 income range, which is the most common income bracket and makes up 26.3% of all families.
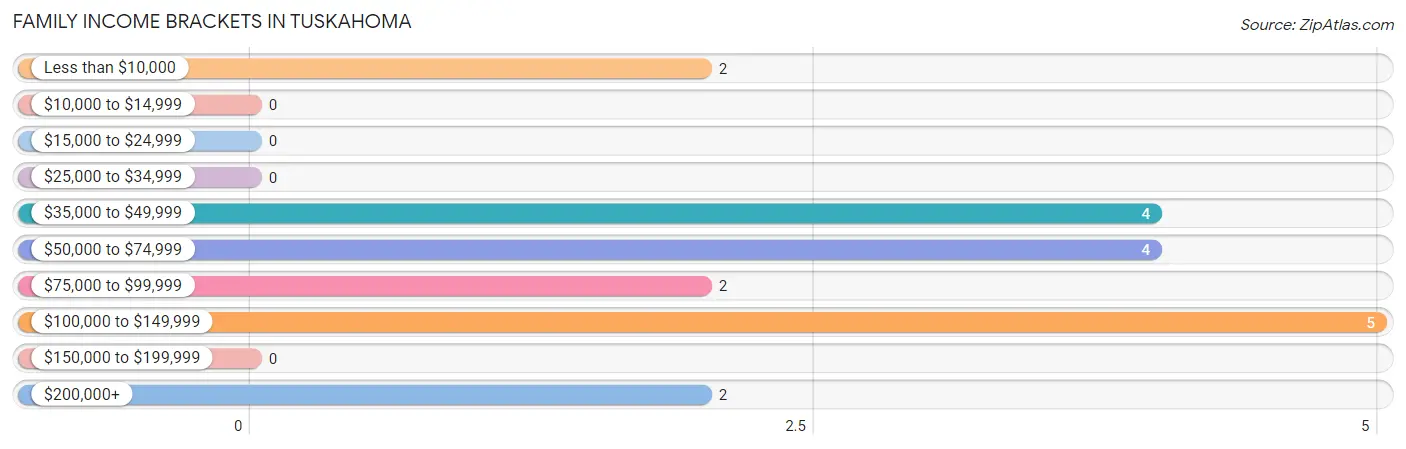
| Income Bracket | # Families | % Families |
| Less than $10,000 | 2 | 10.5% |
| $10,000 to $14,999 | 0 | 0.0% |
| $15,000 to $24,999 | 0 | 0.0% |
| $25,000 to $34,999 | 0 | 0.0% |
| $35,000 to $49,999 | 4 | 21.1% |
| $50,000 to $74,999 | 4 | 21.1% |
| $75,000 to $99,999 | 2 | 10.5% |
| $100,000 to $149,999 | 5 | 26.3% |
| $150,000 to $199,999 | 0 | 0.0% |
| $200,000+ | 2 | 10.5% |
Family Income by Famaliy Size in Tuskahoma
2-person families (17 | 89.5%) account for the highest median family income in Tuskahoma with $51,563 per family, while 2-person families (17 | 89.5%) have the highest median income of $25,782 per family member.
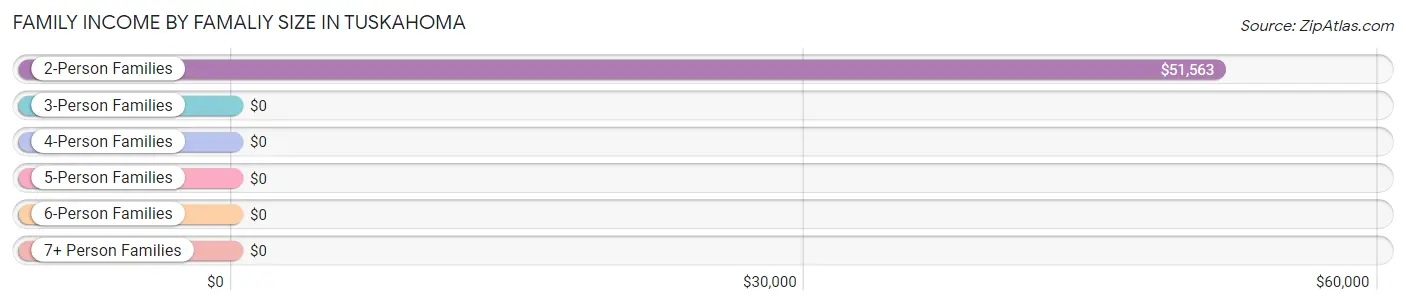
| Income Bracket | # Families | Median Income |
| 2-Person Families | 17 (89.5%) | $51,563 |
| 3-Person Families | 2 (10.5%) | $0 |
| 4-Person Families | 0 (0.0%) | $0 |
| 5-Person Families | 0 (0.0%) | $0 |
| 6-Person Families | 0 (0.0%) | $0 |
| 7+ Person Families | 0 (0.0%) | $0 |
| Total | 19 (100.0%) | $0 |
Family Income by Number of Earners in Tuskahoma
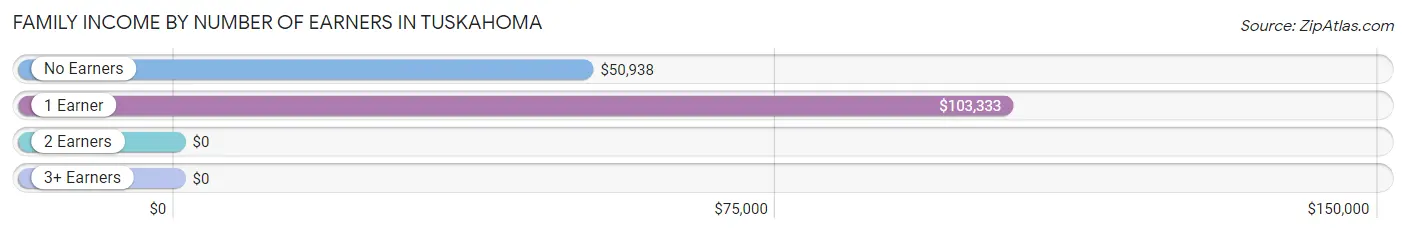
| Number of Earners | # Families | Median Income |
| No Earners | 9 (47.4%) | $50,938 |
| 1 Earner | 8 (42.1%) | $103,333 |
| 2 Earners | 2 (10.5%) | $0 |
| 3+ Earners | 0 (0.0%) | $0 |
| Total | 19 (100.0%) | $0 |
Household Income in Tuskahoma
Household Income Brackets in Tuskahoma
With 7 households falling in the category, the $50,000 to $74,999 income range is the most frequent in Tuskahoma, accounting for 21.9% of all households.
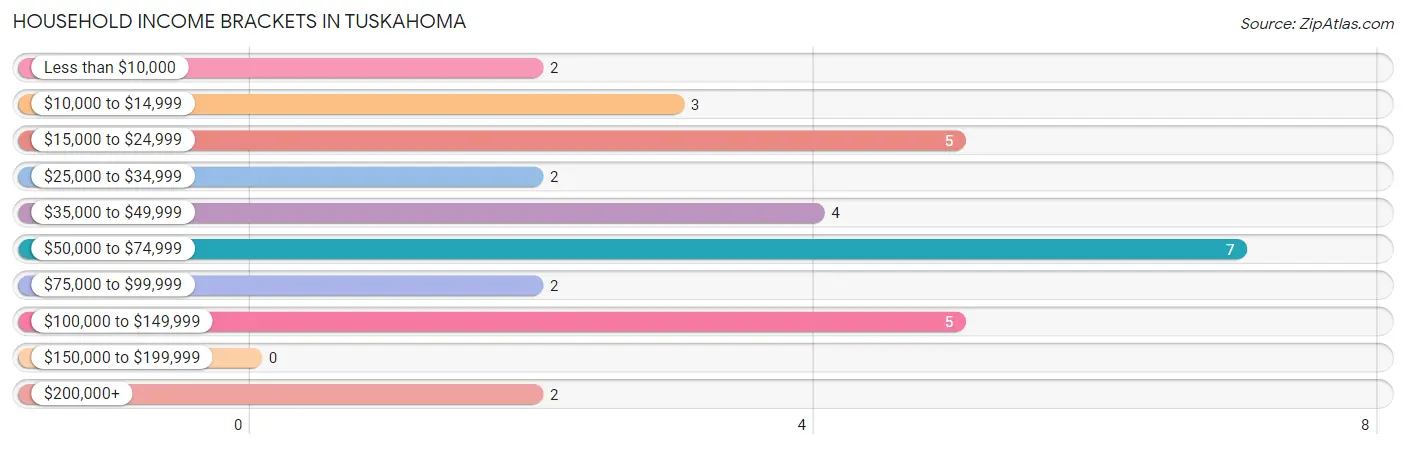
| Income Bracket | # Households | % Households |
| Less than $10,000 | 2 | 6.3% |
| $10,000 to $14,999 | 3 | 9.4% |
| $15,000 to $24,999 | 5 | 15.6% |
| $25,000 to $34,999 | 2 | 6.3% |
| $35,000 to $49,999 | 4 | 12.5% |
| $50,000 to $74,999 | 7 | 21.9% |
| $75,000 to $99,999 | 2 | 6.3% |
| $100,000 to $149,999 | 5 | 15.6% |
| $150,000 to $199,999 | 0 | 0.0% |
| $200,000+ | 2 | 6.3% |
Household Income by Householder Age in Tuskahoma
The median household income in Tuskahoma is $47,500, with the highest median household income of $56,667 found in the 45 to 64 years age bracket for the primary householder. A total of 12 households (37.5%) fall into this category.
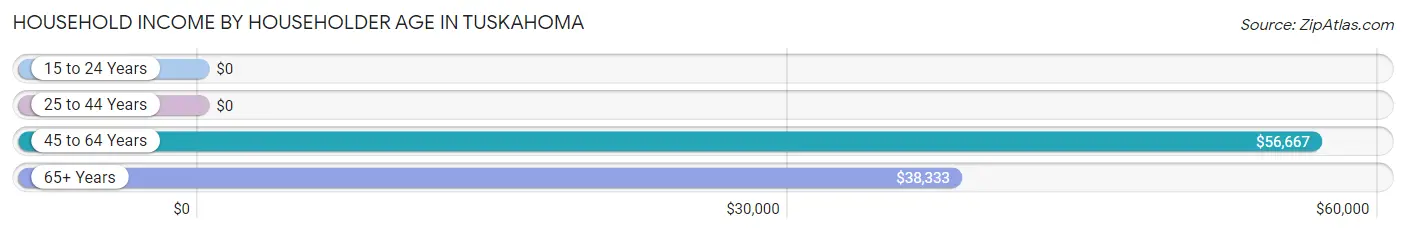
| Income Bracket | # Households | Median Income |
| 15 to 24 Years | 0 (0.0%) | $0 |
| 25 to 44 Years | 0 (0.0%) | $0 |
| 45 to 64 Years | 12 (37.5%) | $56,667 |
| 65+ Years | 20 (62.5%) | $38,333 |
| Total | 32 (100.0%) | $47,500 |
Poverty in Tuskahoma
Income Below Poverty by Sex and Age in Tuskahoma
With 18.2% poverty level for males and 19.4% for females among the residents of Tuskahoma, 55 to 64 year old males and 65 to 74 year old females are the most vulnerable to poverty, with 4 males (50.0%) and 5 females (71.4%) in their respective age groups living below the poverty level.
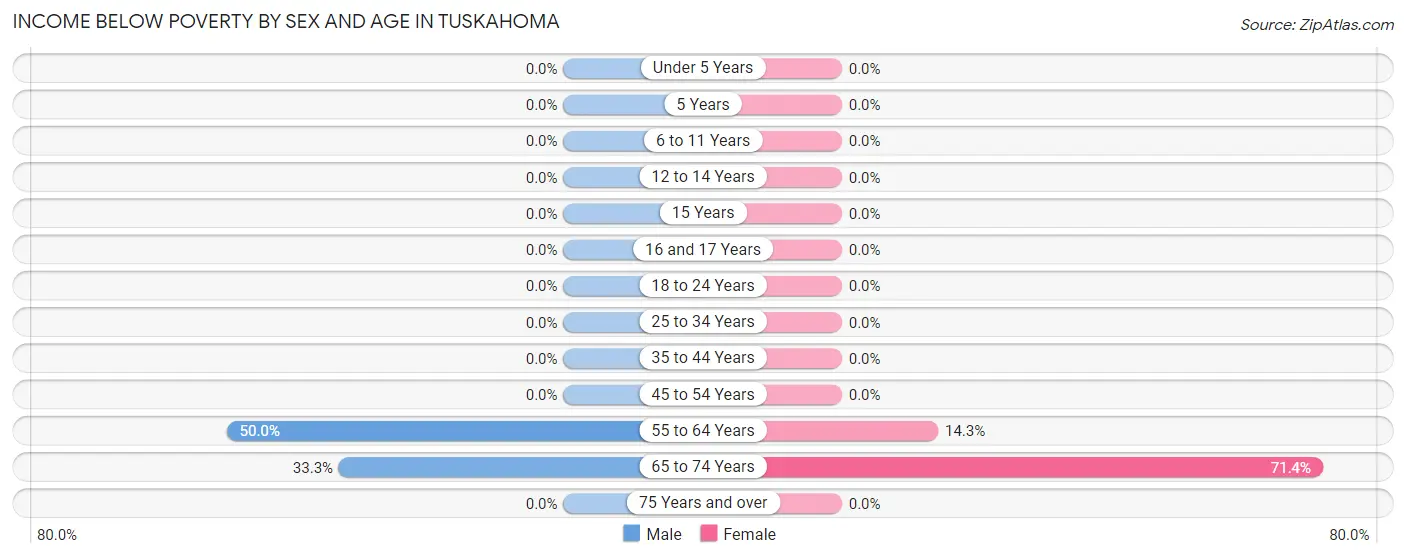
| Age Bracket | Male | Female |
| Under 5 Years | 0 (0.0%) | 0 (0.0%) |
| 5 Years | 0 (0.0%) | 0 (0.0%) |
| 6 to 11 Years | 0 (0.0%) | 0 (0.0%) |
| 12 to 14 Years | 0 (0.0%) | 0 (0.0%) |
| 15 Years | 0 (0.0%) | 0 (0.0%) |
| 16 and 17 Years | 0 (0.0%) | 0 (0.0%) |
| 18 to 24 Years | 0 (0.0%) | 0 (0.0%) |
| 25 to 34 Years | 0 (0.0%) | 0 (0.0%) |
| 35 to 44 Years | 0 (0.0%) | 0 (0.0%) |
| 45 to 54 Years | 0 (0.0%) | 0 (0.0%) |
| 55 to 64 Years | 4 (50.0%) | 1 (14.3%) |
| 65 to 74 Years | 2 (33.3%) | 5 (71.4%) |
| 75 Years and over | 0 (0.0%) | 0 (0.0%) |
| Total | 6 (18.2%) | 6 (19.4%) |
Income Above Poverty by Sex and Age in Tuskahoma
According to the poverty statistics in Tuskahoma, males aged 6 to 11 years and females aged 25 to 34 years are the age groups that are most secure financially, with 100.0% of males and 100.0% of females in these age groups living above the poverty line.
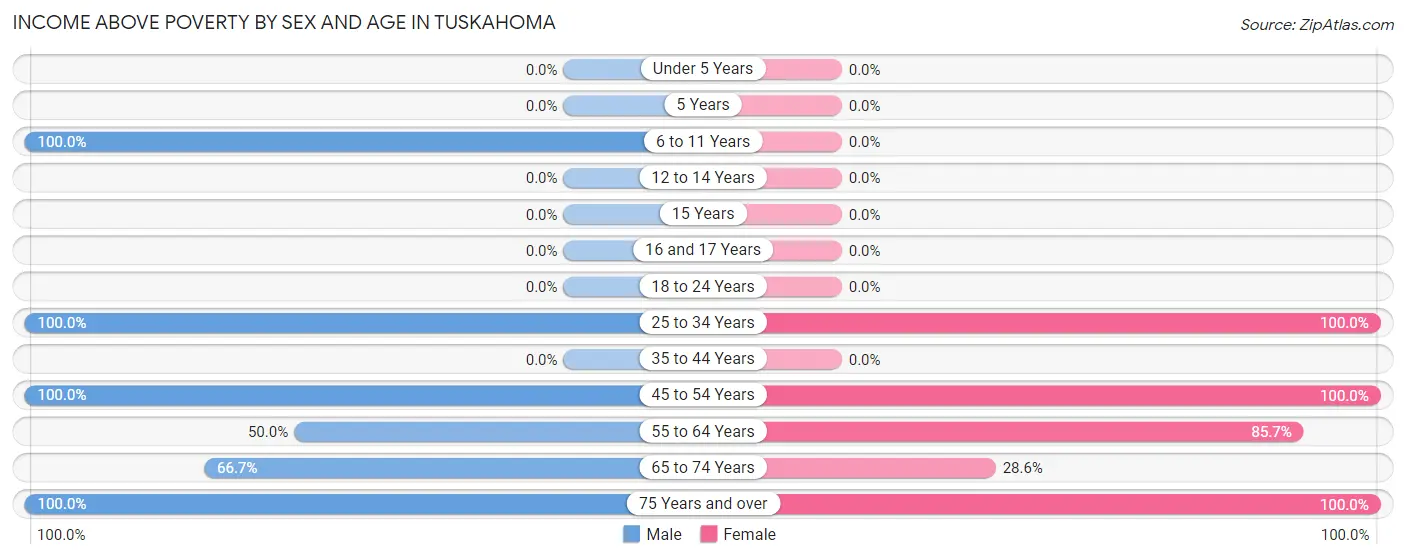
| Age Bracket | Male | Female |
| Under 5 Years | 0 (0.0%) | 0 (0.0%) |
| 5 Years | 0 (0.0%) | 0 (0.0%) |
| 6 to 11 Years | 2 (100.0%) | 0 (0.0%) |
| 12 to 14 Years | 0 (0.0%) | 0 (0.0%) |
| 15 Years | 0 (0.0%) | 0 (0.0%) |
| 16 and 17 Years | 0 (0.0%) | 0 (0.0%) |
| 18 to 24 Years | 0 (0.0%) | 0 (0.0%) |
| 25 to 34 Years | 5 (100.0%) | 4 (100.0%) |
| 35 to 44 Years | 0 (0.0%) | 0 (0.0%) |
| 45 to 54 Years | 2 (100.0%) | 3 (100.0%) |
| 55 to 64 Years | 4 (50.0%) | 6 (85.7%) |
| 65 to 74 Years | 4 (66.7%) | 2 (28.6%) |
| 75 Years and over | 10 (100.0%) | 10 (100.0%) |
| Total | 27 (81.8%) | 25 (80.6%) |
Income Below Poverty Among Married-Couple Families in Tuskahoma
The poverty statistics for married-couple families in Tuskahoma show that 12.5% or 2 of the total 16 families live below the poverty line. Families with no children have the highest poverty rate of 14.3%, comprising of 2 families. On the other hand, families with 1 or 2 children have the lowest poverty rate of 0.0%, which includes 0 families.
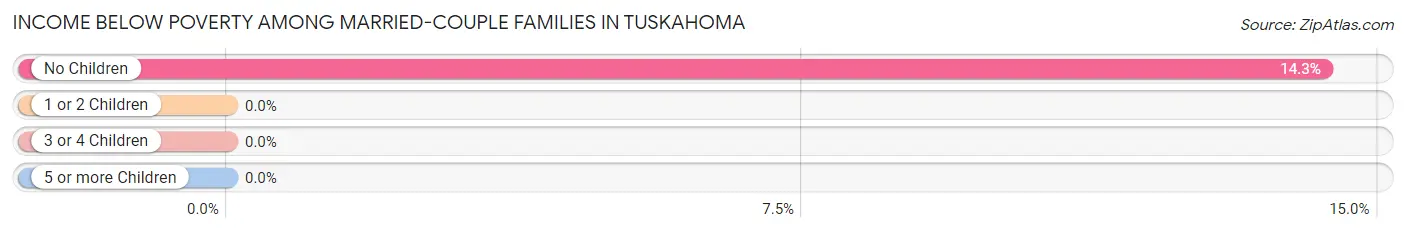
| Children | Above Poverty | Below Poverty |
| No Children | 12 (85.7%) | 2 (14.3%) |
| 1 or 2 Children | 2 (100.0%) | 0 (0.0%) |
| 3 or 4 Children | 0 (0.0%) | 0 (0.0%) |
| 5 or more Children | 0 (0.0%) | 0 (0.0%) |
| Total | 14 (87.5%) | 2 (12.5%) |
Income Below Poverty Among Single-Parent Households in Tuskahoma
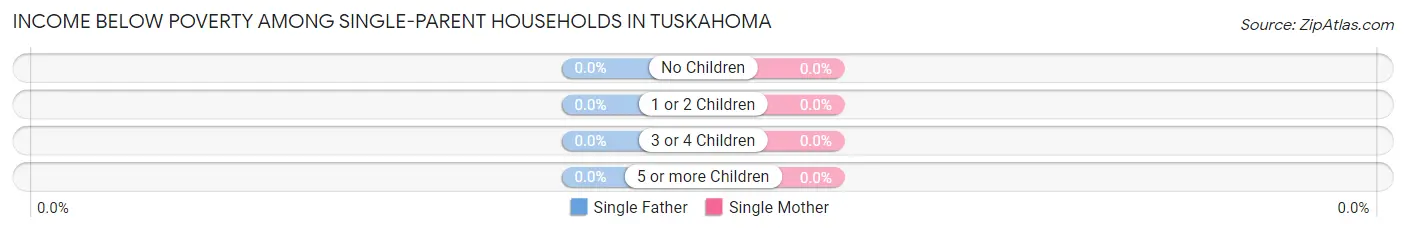
| Children | Single Father | Single Mother |
| No Children | 0 (0.0%) | 0 (0.0%) |
| 1 or 2 Children | 0 (0.0%) | 0 (0.0%) |
| 3 or 4 Children | 0 (0.0%) | 0 (0.0%) |
| 5 or more Children | 0 (0.0%) | 0 (0.0%) |
| Total | 0 (0.0%) | 0 (0.0%) |
Income Below Poverty Among Married-Couple vs Single-Parent Households in Tuskahoma
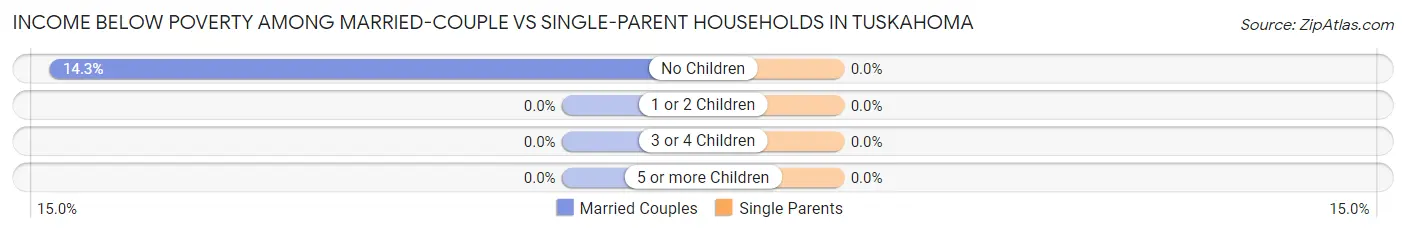
| Children | Married-Couple Families | Single-Parent Households |
| No Children | 2 (14.3%) | 0 (0.0%) |
| 1 or 2 Children | 0 (0.0%) | 0 (0.0%) |
| 3 or 4 Children | 0 (0.0%) | 0 (0.0%) |
| 5 or more Children | 0 (0.0%) | 0 (0.0%) |
| Total | 2 (12.5%) | 0 (0.0%) |
Race in Tuskahoma
The most populous races in Tuskahoma are White / Caucasian (37 | 57.8%), Native / Alaskan (15 | 23.4%), and Two or more Races (12 | 18.8%).
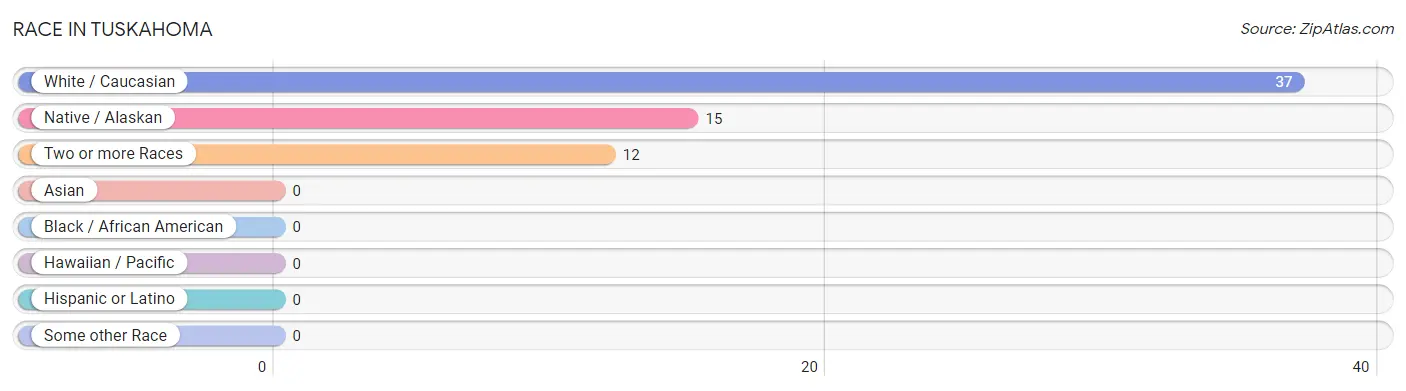
| Race | # Population | % Population |
| Asian | 0 | 0.0% |
| Black / African American | 0 | 0.0% |
| Hawaiian / Pacific | 0 | 0.0% |
| Hispanic or Latino | 0 | 0.0% |
| Native / Alaskan | 15 | 23.4% |
| White / Caucasian | 37 | 57.8% |
| Two or more Races | 12 | 18.8% |
| Some other Race | 0 | 0.0% |
| Total | 64 | 100.0% |
Ancestry in Tuskahoma
The most populous ancestries reported in Tuskahoma are Cherokee (14 | 21.9%), Irish (13 | 20.3%), American (9 | 14.1%), Scotch-Irish (9 | 14.1%), and Choctaw (8 | 12.5%), together accounting for 82.8% of all Tuskahoma residents.
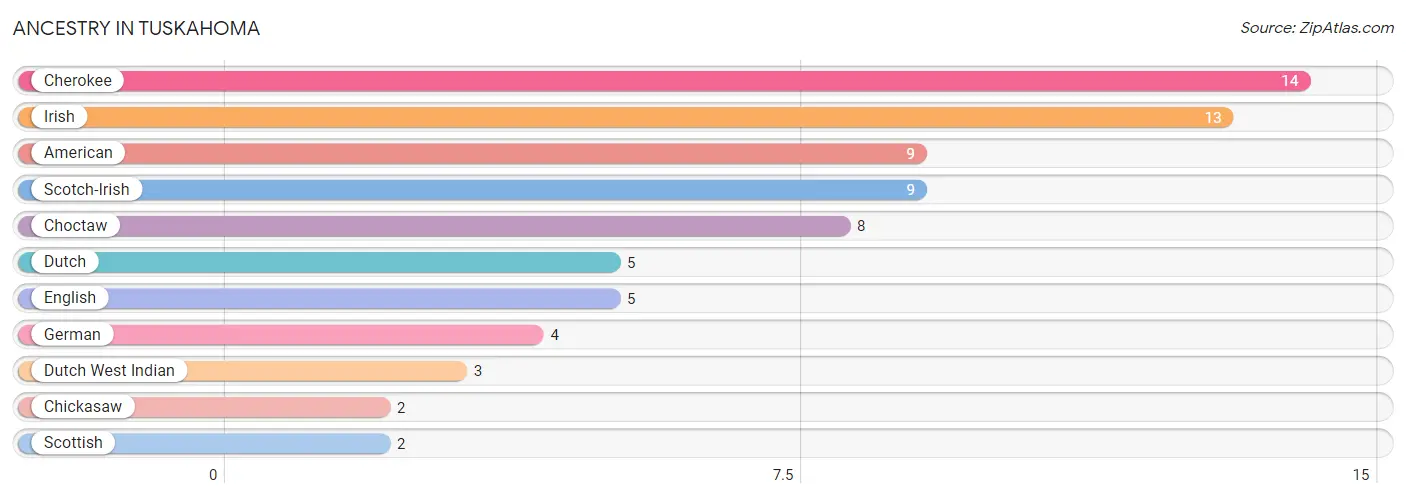
| Ancestry | # Population | % Population |
| American | 9 | 14.1% |
| Cherokee | 14 | 21.9% |
| Chickasaw | 2 | 3.1% |
| Choctaw | 8 | 12.5% |
| Dutch | 5 | 7.8% |
| Dutch West Indian | 3 | 4.7% |
| English | 5 | 7.8% |
| German | 4 | 6.2% |
| Irish | 13 | 20.3% |
| Scotch-Irish | 9 | 14.1% |
| Scottish | 2 | 3.1% | View All 11 Rows |
Immigrants in Tuskahoma

| Immigration Origin | # Population | % Population | View All 0 Rows |
Sex and Age in Tuskahoma
Sex and Age in Tuskahoma
The most populous age groups in Tuskahoma are 80 to 84 Years (7 | 21.2%) for men and 60 to 64 Years (5 | 16.1%) for women.
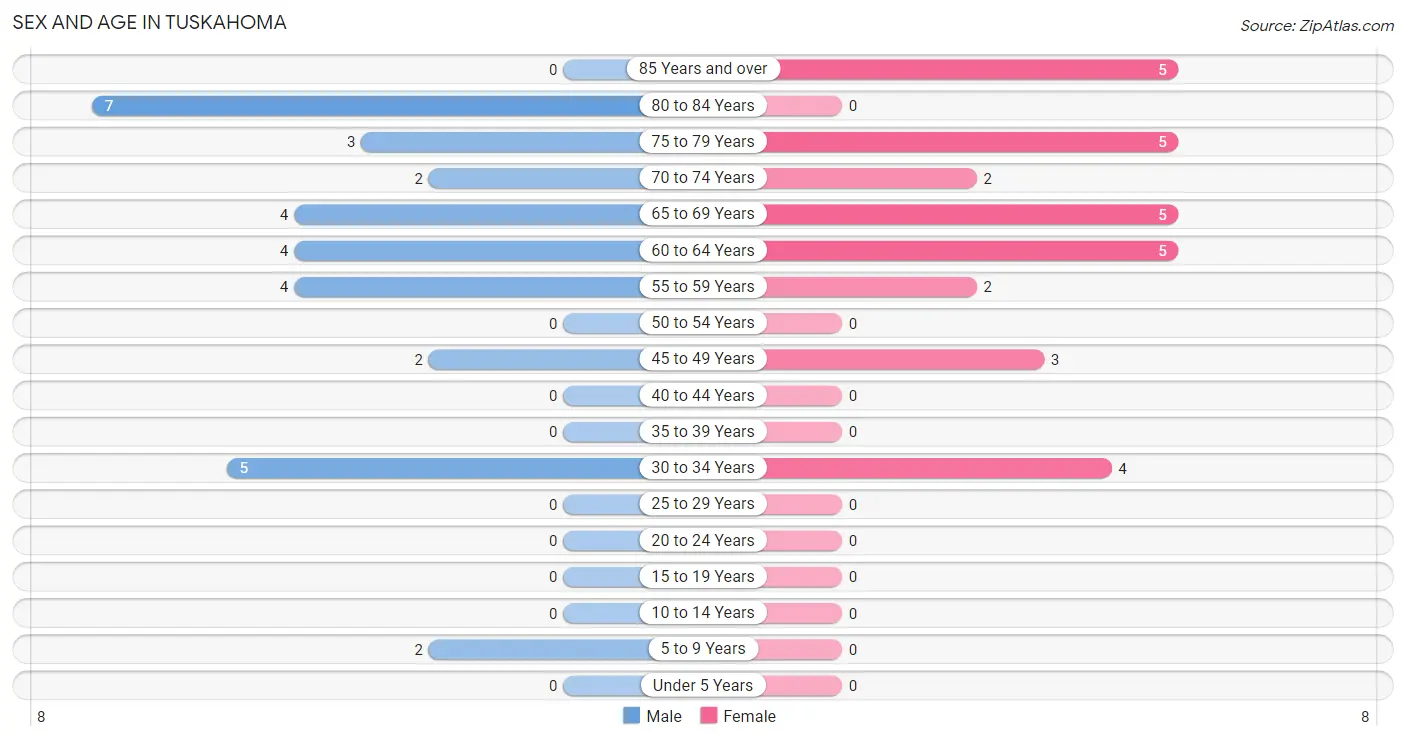
| Age Bracket | Male | Female |
| Under 5 Years | 0 (0.0%) | 0 (0.0%) |
| 5 to 9 Years | 2 (6.1%) | 0 (0.0%) |
| 10 to 14 Years | 0 (0.0%) | 0 (0.0%) |
| 15 to 19 Years | 0 (0.0%) | 0 (0.0%) |
| 20 to 24 Years | 0 (0.0%) | 0 (0.0%) |
| 25 to 29 Years | 0 (0.0%) | 0 (0.0%) |
| 30 to 34 Years | 5 (15.1%) | 4 (12.9%) |
| 35 to 39 Years | 0 (0.0%) | 0 (0.0%) |
| 40 to 44 Years | 0 (0.0%) | 0 (0.0%) |
| 45 to 49 Years | 2 (6.1%) | 3 (9.7%) |
| 50 to 54 Years | 0 (0.0%) | 0 (0.0%) |
| 55 to 59 Years | 4 (12.1%) | 2 (6.5%) |
| 60 to 64 Years | 4 (12.1%) | 5 (16.1%) |
| 65 to 69 Years | 4 (12.1%) | 5 (16.1%) |
| 70 to 74 Years | 2 (6.1%) | 2 (6.5%) |
| 75 to 79 Years | 3 (9.1%) | 5 (16.1%) |
| 80 to 84 Years | 7 (21.2%) | 0 (0.0%) |
| 85 Years and over | 0 (0.0%) | 5 (16.1%) |
| Total | 33 (100.0%) | 31 (100.0%) |
Families and Households in Tuskahoma
Median Family Size in Tuskahoma
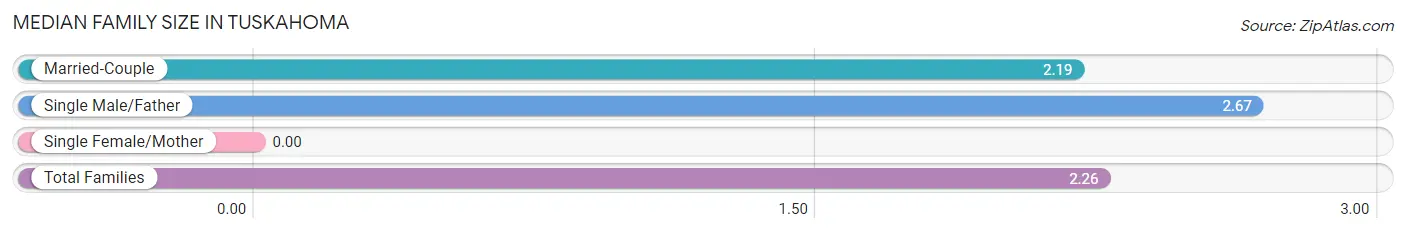
| Family Type | # Families | Family Size |
| Married-Couple | 16 (84.2%) | 2.19 |
| Single Male/Father | 3 (15.8%) | 2.67 |
| Single Female/Mother | 0 (0.0%) | - |
| Total Families | 19 (100.0%) | 2.26 |
Median Household Size in Tuskahoma
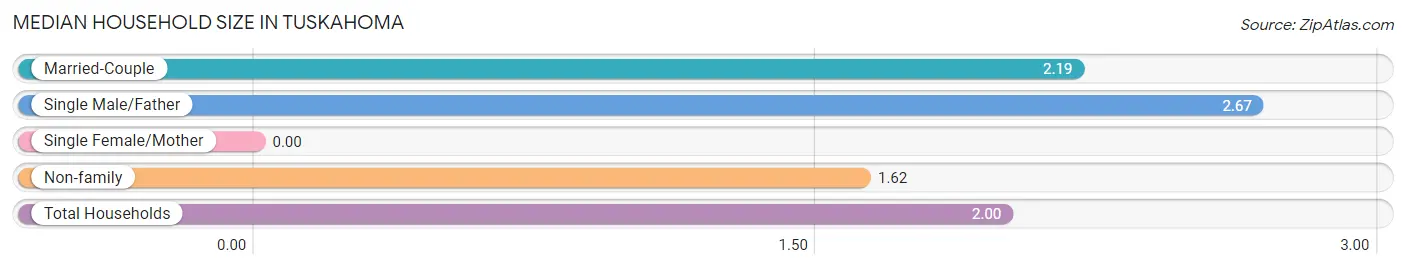
| Household Type | # Households | Household Size |
| Married-Couple | 16 (50.0%) | 2.19 |
| Single Male/Father | 3 (9.4%) | 2.67 |
| Single Female/Mother | 0 (0.0%) | - |
| Non-family | 13 (40.6%) | 1.62 |
| Total Households | 32 (100.0%) | 2.00 |
Household Size by Marriage Status in Tuskahoma
Out of a total of 32 households in Tuskahoma, 19 (59.4%) are family households, while 13 (40.6%) are nonfamily households. The most numerous type of family households are 2-person households, comprising 17, and the most common type of nonfamily households are 1-person households, comprising 10.
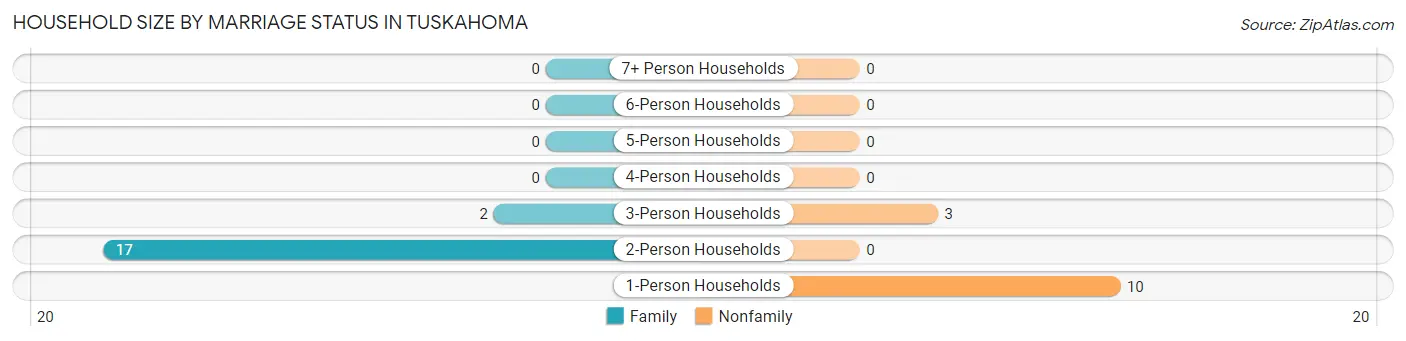
| Household Size | Family Households | Nonfamily Households |
| 1-Person Households | - | 10 (31.2%) |
| 2-Person Households | 17 (53.1%) | 0 (0.0%) |
| 3-Person Households | 2 (6.2%) | 3 (9.4%) |
| 4-Person Households | 0 (0.0%) | 0 (0.0%) |
| 5-Person Households | 0 (0.0%) | 0 (0.0%) |
| 6-Person Households | 0 (0.0%) | 0 (0.0%) |
| 7+ Person Households | 0 (0.0%) | 0 (0.0%) |
| Total | 19 (59.4%) | 13 (40.6%) |
Female Fertility in Tuskahoma
Fertility by Age in Tuskahoma
| Age Bracket | Women with Births | Births / 1,000 Women |
| 15 to 19 years | 0 (0.0%) | 0.0 |
| 20 to 34 years | 0 (0.0%) | 0.0 |
| 35 to 50 years | 0 (0.0%) | 0.0 |
| Total | 0 (0.0%) | 0.0 |
Fertility by Age by Marriage Status in Tuskahoma
| Age Bracket | Married | Unmarried |
| 15 to 19 years | 0 (0.0%) | 0 (0.0%) |
| 20 to 34 years | 0 (0.0%) | 0 (0.0%) |
| 35 to 50 years | 0 (0.0%) | 0 (0.0%) |
| Total | 0 (0.0%) | 0 (0.0%) |
Fertility by Education in Tuskahoma
| Educational Attainment | Women with Births | Births / 1,000 Women |
| Less than High School | 0 (0.0%) | 0.0 |
| High School Diploma | 0 (0.0%) | 0.0 |
| College or Associate's Degree | 0 (0.0%) | 0.0 |
| Bachelor's Degree | 0 (0.0%) | 0.0 |
| Graduate Degree | 0 (0.0%) | 0.0 |
| Total | 0 (0.0%) | 0.0 |
Fertility by Education by Marriage Status in Tuskahoma
| Educational Attainment | Married | Unmarried |
| Less than High School | 0 (0.0%) | 0 (0.0%) |
| High School Diploma | 0 (0.0%) | 0 (0.0%) |
| College or Associate's Degree | 0 (0.0%) | 0 (0.0%) |
| Bachelor's Degree | 0 (0.0%) | 0 (0.0%) |
| Graduate Degree | 0 (0.0%) | 0 (0.0%) |
| Total | 0 (0.0%) | 0 (0.0%) |
Employment Characteristics in Tuskahoma
Employment by Class of Employer in Tuskahoma
Among the 14 employed individuals in Tuskahoma, private company employees (9 | 64.3%), state government employees (4 | 28.6%), and local government employees (1 | 7.1%) make up the most common classes of employment.
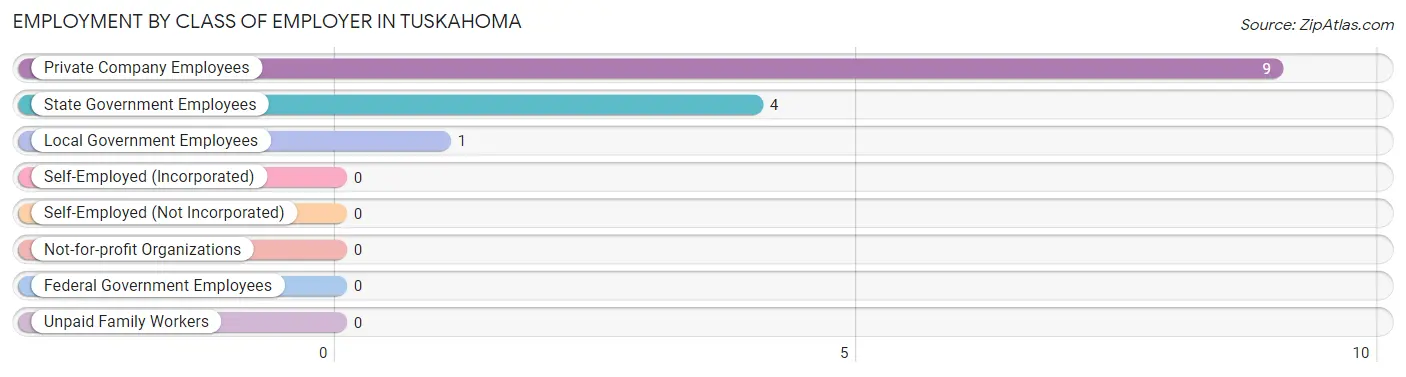
| Employer Class | # Employees | % Employees |
| Private Company Employees | 9 | 64.3% |
| Self-Employed (Incorporated) | 0 | 0.0% |
| Self-Employed (Not Incorporated) | 0 | 0.0% |
| Not-for-profit Organizations | 0 | 0.0% |
| Local Government Employees | 1 | 7.1% |
| State Government Employees | 4 | 28.6% |
| Federal Government Employees | 0 | 0.0% |
| Unpaid Family Workers | 0 | 0.0% |
| Total | 14 | 100.0% |
Employment Status by Age in Tuskahoma
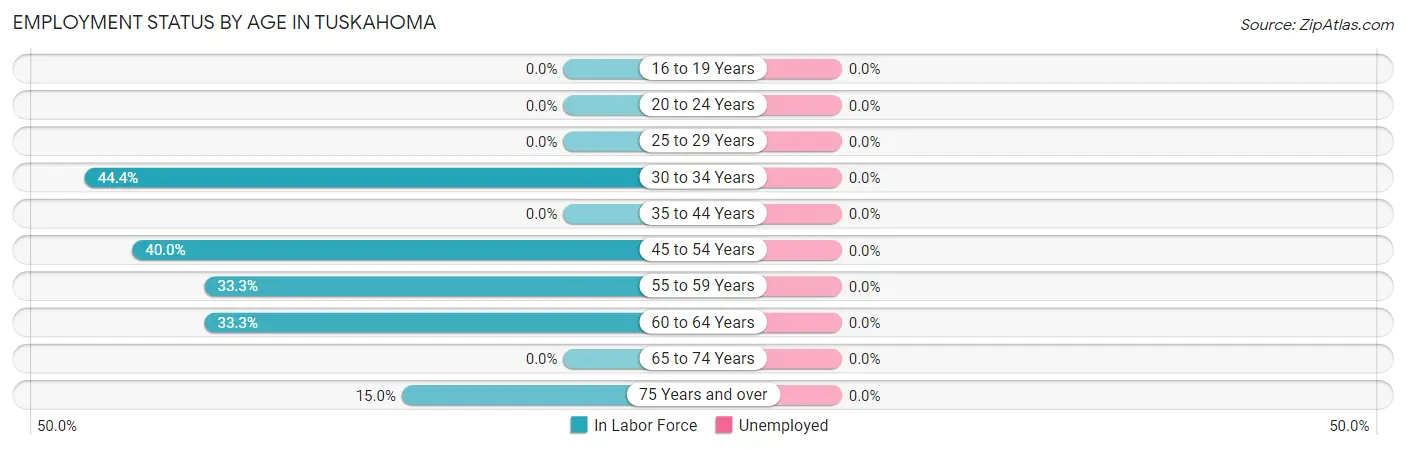
| Age Bracket | In Labor Force | Unemployed |
| 16 to 19 Years | 0 (0.0%) | 0 (0.0%) |
| 20 to 24 Years | 0 (0.0%) | 0 (0.0%) |
| 25 to 29 Years | 0 (0.0%) | 0 (0.0%) |
| 30 to 34 Years | 4 (44.4%) | 0 (0.0%) |
| 35 to 44 Years | 0 (0.0%) | 0 (0.0%) |
| 45 to 54 Years | 2 (40.0%) | 0 (0.0%) |
| 55 to 59 Years | 2 (33.3%) | 0 (0.0%) |
| 60 to 64 Years | 3 (33.3%) | 0 (0.0%) |
| 65 to 74 Years | 0 (0.0%) | 0 (0.0%) |
| 75 Years and over | 3 (15.0%) | 0 (0.0%) |
| Total | 14 (22.6%) | 0 (0.0%) |
Employment Status by Educational Attainment in Tuskahoma
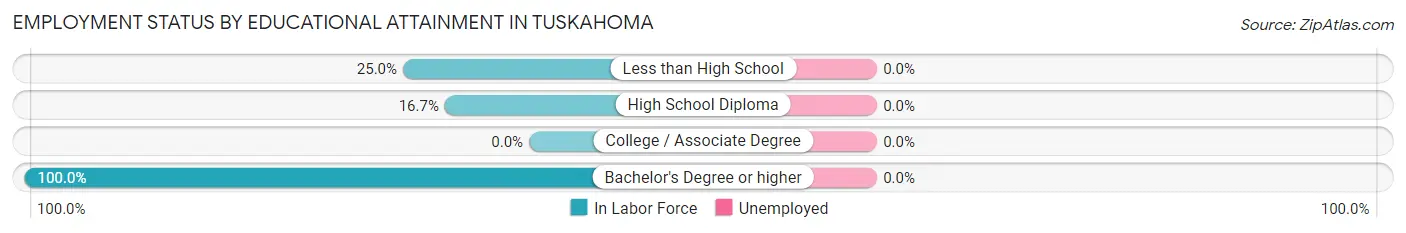
| Educational Attainment | In Labor Force | Unemployed |
| Less than High School | 2 (25.0%) | 0 (0.0%) |
| High School Diploma | 1 (16.7%) | 0 (0.0%) |
| College / Associate Degree | 0 (0.0%) | 0 (0.0%) |
| Bachelor's Degree or higher | 8 (100.0%) | 0 (0.0%) |
| Total | 11 (37.9%) | 0 (0.0%) |
Employment Occupations by Sex in Tuskahoma
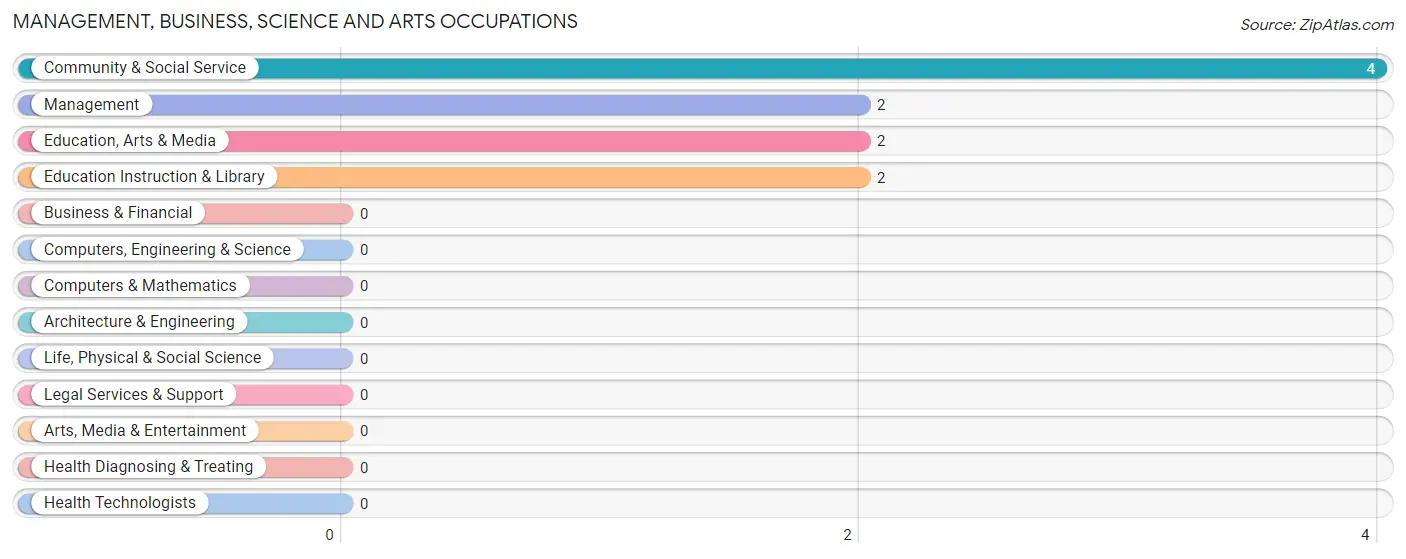
Management, Business, Science and Arts Occupations
The most common Management, Business, Science and Arts occupations in Tuskahoma are Community & Social Service (4 | 28.6%), Management (2 | 14.3%), Education, Arts & Media (2 | 14.3%), and Education Instruction & Library (2 | 14.3%).
Management, Business, Science and Arts Occupations by Sex
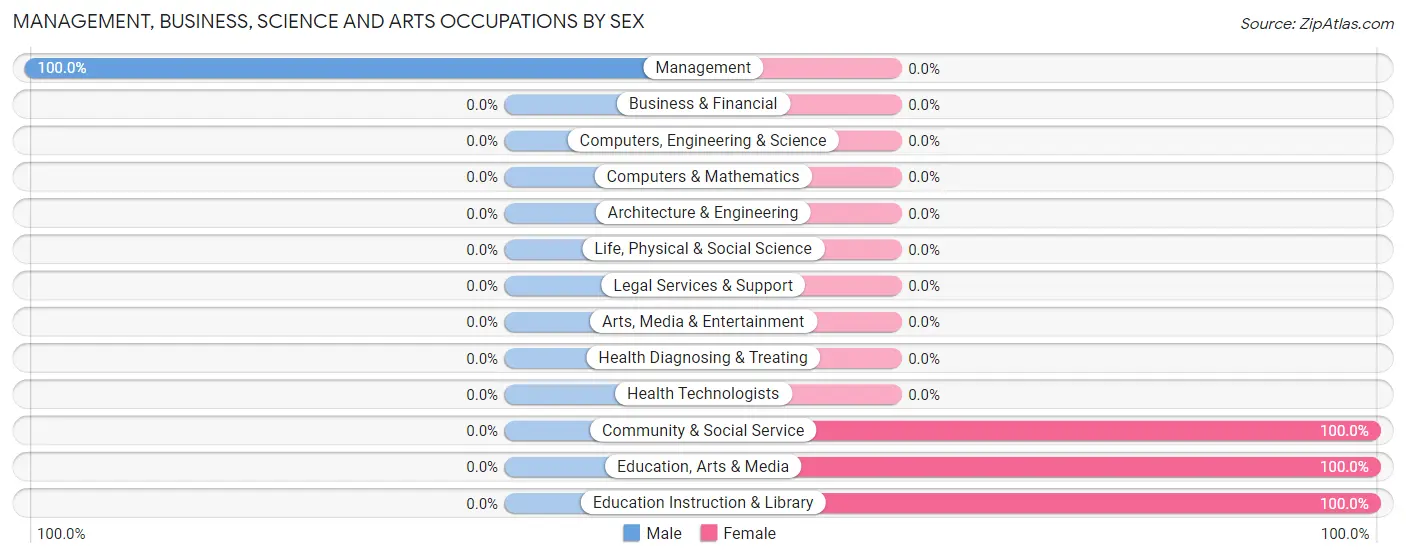
| Occupation | Male | Female |
| Management | 2 (100.0%) | 0 (0.0%) |
| Business & Financial | 0 (0.0%) | 0 (0.0%) |
| Computers, Engineering & Science | 0 (0.0%) | 0 (0.0%) |
| Computers & Mathematics | 0 (0.0%) | 0 (0.0%) |
| Architecture & Engineering | 0 (0.0%) | 0 (0.0%) |
| Life, Physical & Social Science | 0 (0.0%) | 0 (0.0%) |
| Community & Social Service | 0 (0.0%) | 4 (100.0%) |
| Education, Arts & Media | 0 (0.0%) | 2 (100.0%) |
| Legal Services & Support | 0 (0.0%) | 0 (0.0%) |
| Education Instruction & Library | 0 (0.0%) | 2 (100.0%) |
| Arts, Media & Entertainment | 0 (0.0%) | 0 (0.0%) |
| Health Diagnosing & Treating | 0 (0.0%) | 0 (0.0%) |
| Health Technologists | 0 (0.0%) | 0 (0.0%) |
| Total (Category) | 2 (33.3%) | 4 (66.7%) |
| Total (Overall) | 5 (35.7%) | 9 (64.3%) |
Services Occupations
The most common Services occupations in Tuskahoma are , and Healthcare Support (4 | 28.6%).
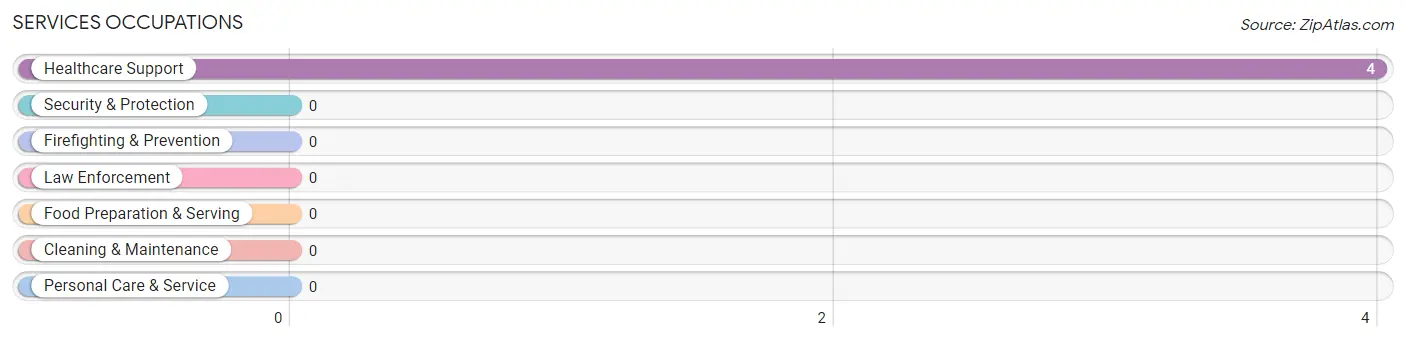
Services Occupations by Sex
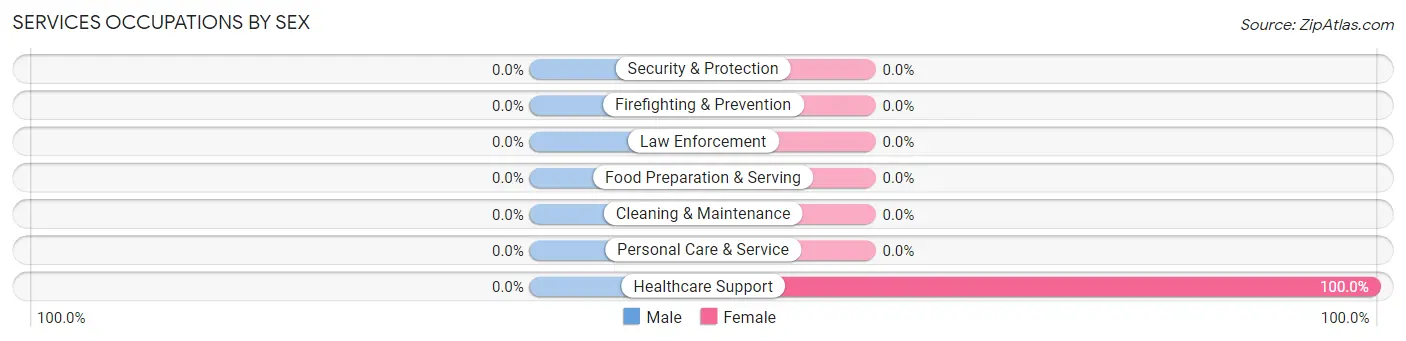
| Occupation | Male | Female |
| Healthcare Support | 0 (0.0%) | 4 (100.0%) |
| Security & Protection | 0 (0.0%) | 0 (0.0%) |
| Firefighting & Prevention | 0 (0.0%) | 0 (0.0%) |
| Law Enforcement | 0 (0.0%) | 0 (0.0%) |
| Food Preparation & Serving | 0 (0.0%) | 0 (0.0%) |
| Cleaning & Maintenance | 0 (0.0%) | 0 (0.0%) |
| Personal Care & Service | 0 (0.0%) | 0 (0.0%) |
| Total (Category) | 0 (0.0%) | 4 (100.0%) |
| Total (Overall) | 5 (35.7%) | 9 (64.3%) |
Sales and Office Occupations
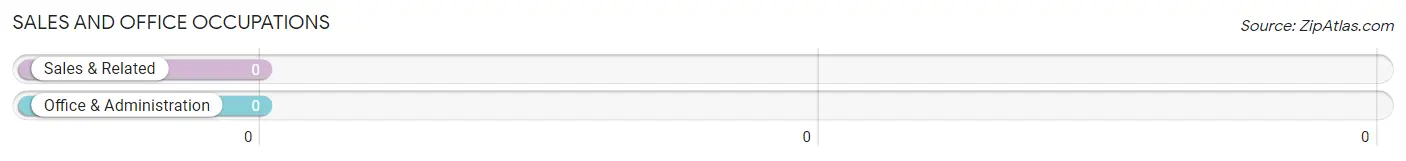
Sales and Office Occupations by Sex
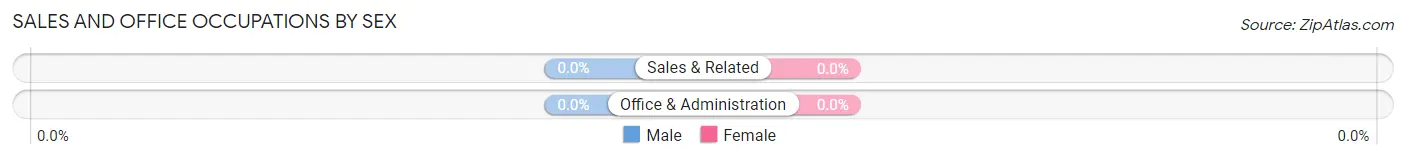
| Occupation | Male | Female |
| Sales & Related | 0 (0.0%) | 0 (0.0%) |
| Office & Administration | 0 (0.0%) | 0 (0.0%) |
| Total (Category) | 0 (0.0%) | 0 (0.0%) |
| Total (Overall) | 5 (35.7%) | 9 (64.3%) |
Natural Resources, Construction and Maintenance Occupations
Natural Resources, Construction and Maintenance Occupations by Sex
| Occupation | Male | Female |
| Farming, Fishing & Forestry | 0 (0.0%) | 0 (0.0%) |
| Construction & Extraction | 0 (0.0%) | 0 (0.0%) |
| Installation, Maintenance & Repair | 0 (0.0%) | 0 (0.0%) |
| Total (Category) | 0 (0.0%) | 0 (0.0%) |
| Total (Overall) | 5 (35.7%) | 9 (64.3%) |
Production, Transportation and Moving Occupations
The most common Production, Transportation and Moving occupations in Tuskahoma are , and Transportation (4 | 28.6%).
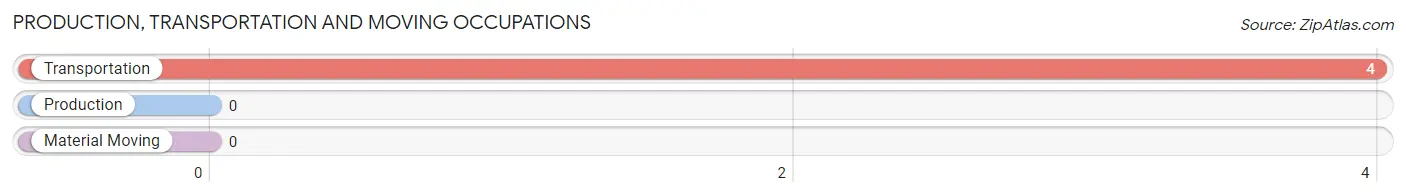
Production, Transportation and Moving Occupations by Sex
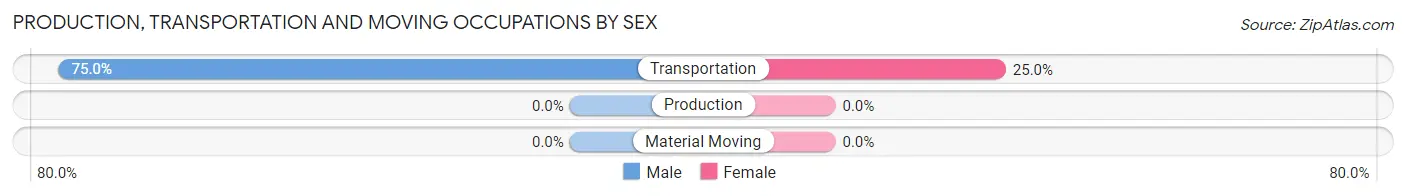
| Occupation | Male | Female |
| Production | 0 (0.0%) | 0 (0.0%) |
| Transportation | 3 (75.0%) | 1 (25.0%) |
| Material Moving | 0 (0.0%) | 0 (0.0%) |
| Total (Category) | 3 (75.0%) | 1 (25.0%) |
| Total (Overall) | 5 (35.7%) | 9 (64.3%) |
Employment Industries by Sex in Tuskahoma
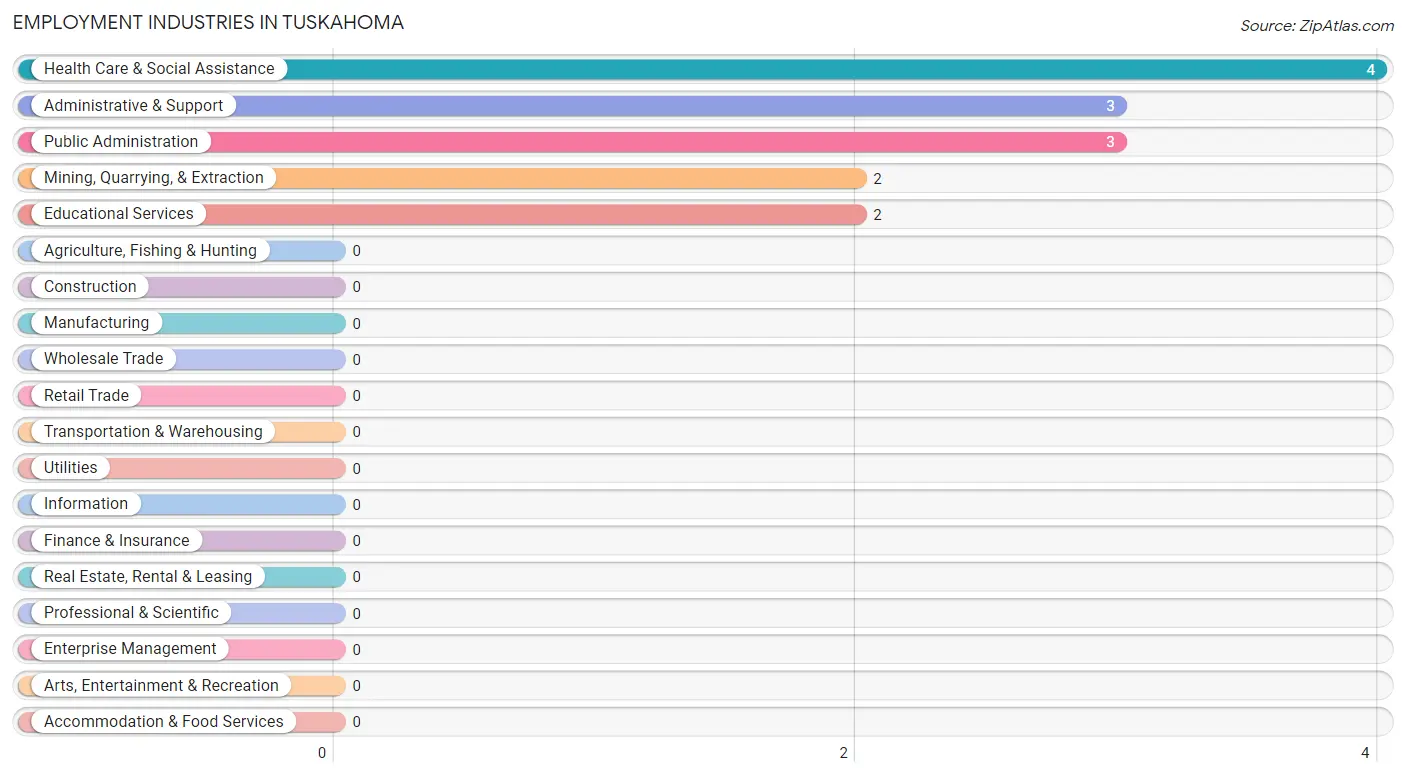
Employment Industries in Tuskahoma
The major employment industries in Tuskahoma include Health Care & Social Assistance (4 | 28.6%), Administrative & Support (3 | 21.4%), Public Administration (3 | 21.4%), Mining, Quarrying, & Extraction (2 | 14.3%), and Educational Services (2 | 14.3%).
Employment Industries by Sex in Tuskahoma
The Tuskahoma industries that see more men than women are Mining, Quarrying, & Extraction (100.0%), and Administrative & Support (100.0%), whereas the industries that tend to have a higher number of women are Educational Services (100.0%), Health Care & Social Assistance (100.0%), and Public Administration (100.0%).
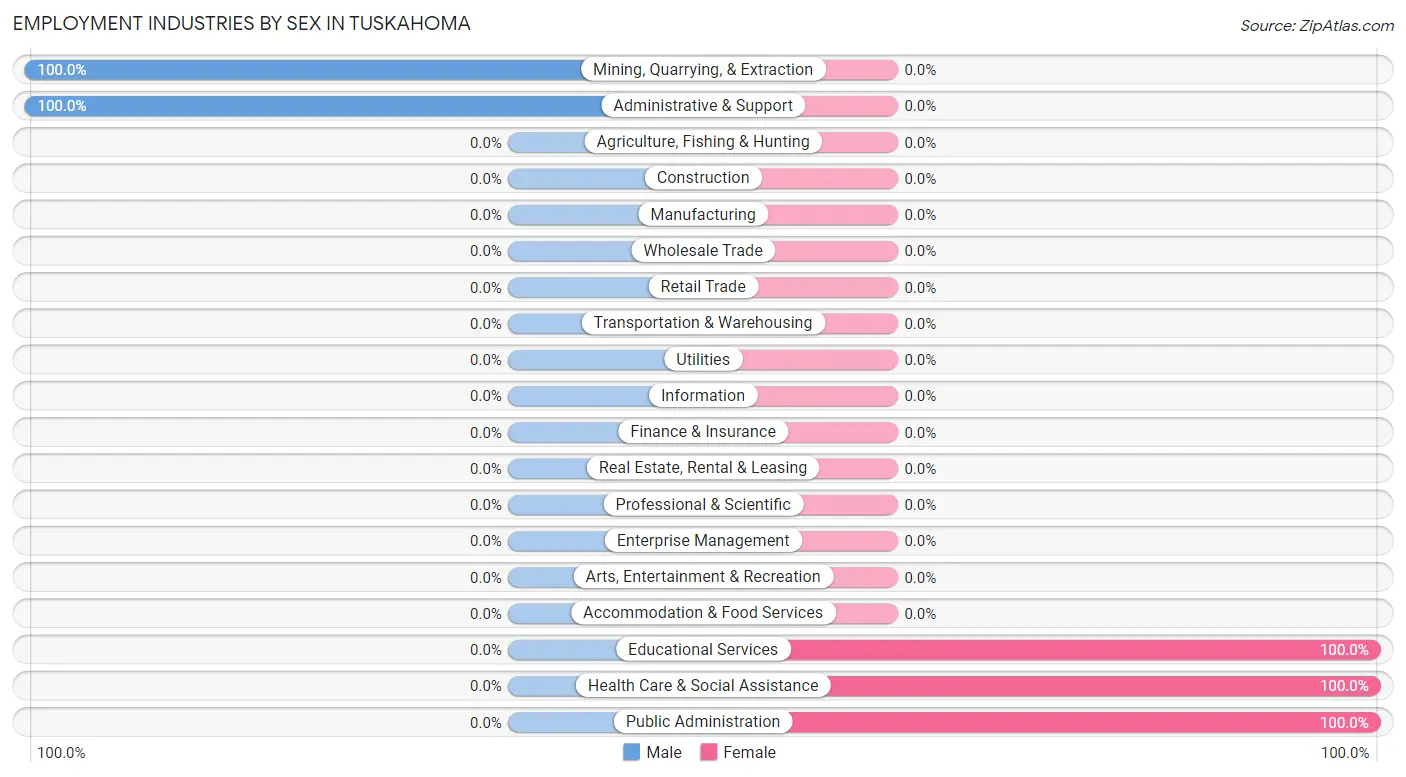
| Industry | Male | Female |
| Agriculture, Fishing & Hunting | 0 (0.0%) | 0 (0.0%) |
| Mining, Quarrying, & Extraction | 2 (100.0%) | 0 (0.0%) |
| Construction | 0 (0.0%) | 0 (0.0%) |
| Manufacturing | 0 (0.0%) | 0 (0.0%) |
| Wholesale Trade | 0 (0.0%) | 0 (0.0%) |
| Retail Trade | 0 (0.0%) | 0 (0.0%) |
| Transportation & Warehousing | 0 (0.0%) | 0 (0.0%) |
| Utilities | 0 (0.0%) | 0 (0.0%) |
| Information | 0 (0.0%) | 0 (0.0%) |
| Finance & Insurance | 0 (0.0%) | 0 (0.0%) |
| Real Estate, Rental & Leasing | 0 (0.0%) | 0 (0.0%) |
| Professional & Scientific | 0 (0.0%) | 0 (0.0%) |
| Enterprise Management | 0 (0.0%) | 0 (0.0%) |
| Administrative & Support | 3 (100.0%) | 0 (0.0%) |
| Educational Services | 0 (0.0%) | 2 (100.0%) |
| Health Care & Social Assistance | 0 (0.0%) | 4 (100.0%) |
| Arts, Entertainment & Recreation | 0 (0.0%) | 0 (0.0%) |
| Accommodation & Food Services | 0 (0.0%) | 0 (0.0%) |
| Public Administration | 0 (0.0%) | 3 (100.0%) |
| Total | 5 (35.7%) | 9 (64.3%) |
Education in Tuskahoma
School Enrollment in Tuskahoma
The most common levels of schooling among the 6 students in Tuskahoma are college / undergraduate (4 | 66.7%), and elementary school (2 | 33.3%).
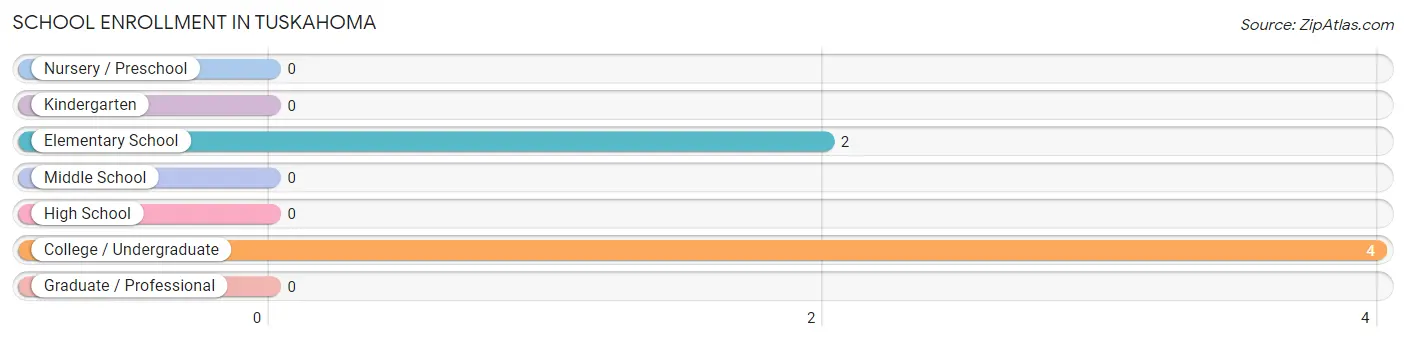
| School Level | # Students | % Students |
| Nursery / Preschool | 0 | 0.0% |
| Kindergarten | 0 | 0.0% |
| Elementary School | 2 | 33.3% |
| Middle School | 0 | 0.0% |
| High School | 0 | 0.0% |
| College / Undergraduate | 4 | 66.7% |
| Graduate / Professional | 0 | 0.0% |
| Total | 6 | 100.0% |
School Enrollment by Age by Funding Source in Tuskahoma
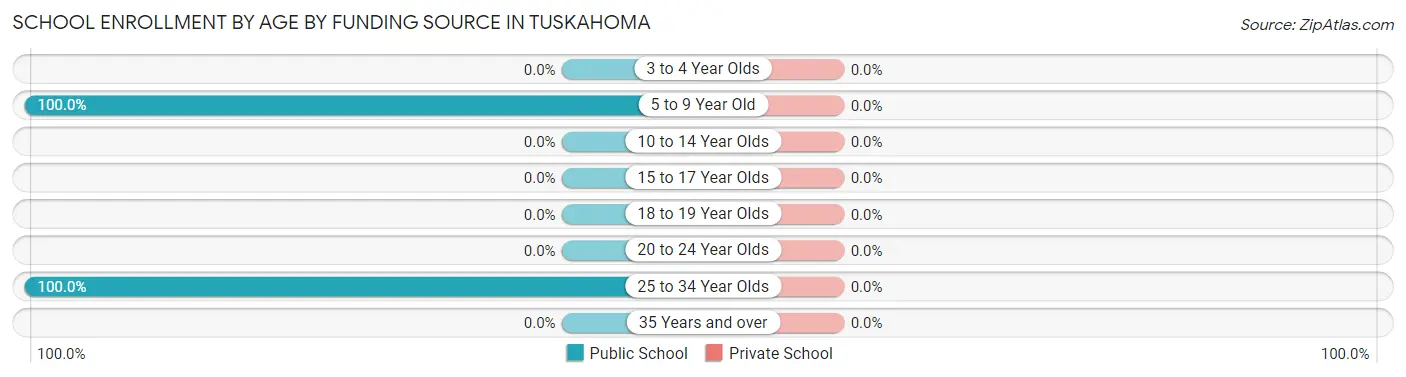
| Age Bracket | Public School | Private School |
| 3 to 4 Year Olds | 0 (0.0%) | 0 (0.0%) |
| 5 to 9 Year Old | 2 (100.0%) | 0 (0.0%) |
| 10 to 14 Year Olds | 0 (0.0%) | 0 (0.0%) |
| 15 to 17 Year Olds | 0 (0.0%) | 0 (0.0%) |
| 18 to 19 Year Olds | 0 (0.0%) | 0 (0.0%) |
| 20 to 24 Year Olds | 0 (0.0%) | 0 (0.0%) |
| 25 to 34 Year Olds | 4 (100.0%) | 0 (0.0%) |
| 35 Years and over | 0 (0.0%) | 0 (0.0%) |
| Total | 6 (100.0%) | 0 (0.0%) |
Educational Attainment by Field of Study in Tuskahoma
Education (7 | 33.3%), psychology (4 | 19.1%), engineering (4 | 19.1%), liberal arts & history (4 | 19.1%), and science & technology (2 | 9.5%) are the most common fields of study among 21 individuals in Tuskahoma who have obtained a bachelor's degree or higher.
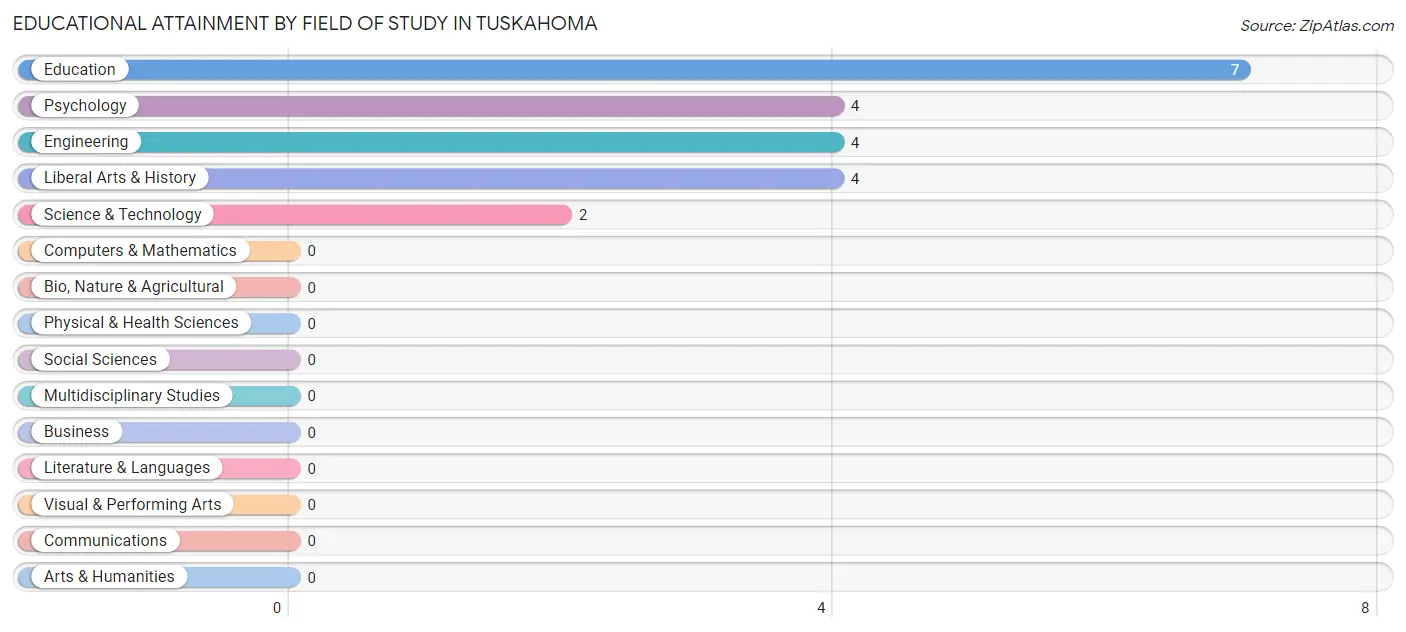
| Field of Study | # Graduates | % Graduates |
| Computers & Mathematics | 0 | 0.0% |
| Bio, Nature & Agricultural | 0 | 0.0% |
| Physical & Health Sciences | 0 | 0.0% |
| Psychology | 4 | 19.1% |
| Social Sciences | 0 | 0.0% |
| Engineering | 4 | 19.1% |
| Multidisciplinary Studies | 0 | 0.0% |
| Science & Technology | 2 | 9.5% |
| Business | 0 | 0.0% |
| Education | 7 | 33.3% |
| Literature & Languages | 0 | 0.0% |
| Liberal Arts & History | 4 | 19.1% |
| Visual & Performing Arts | 0 | 0.0% |
| Communications | 0 | 0.0% |
| Arts & Humanities | 0 | 0.0% |
| Total | 21 | 100.0% |
Transportation & Commute in Tuskahoma
Vehicle Availability by Sex in Tuskahoma
The most prevalent vehicle ownership categories in Tuskahoma are males with 3 vehicles (3, accounting for 60.0%) and females with 3 vehicles (0, making up 33.3%).
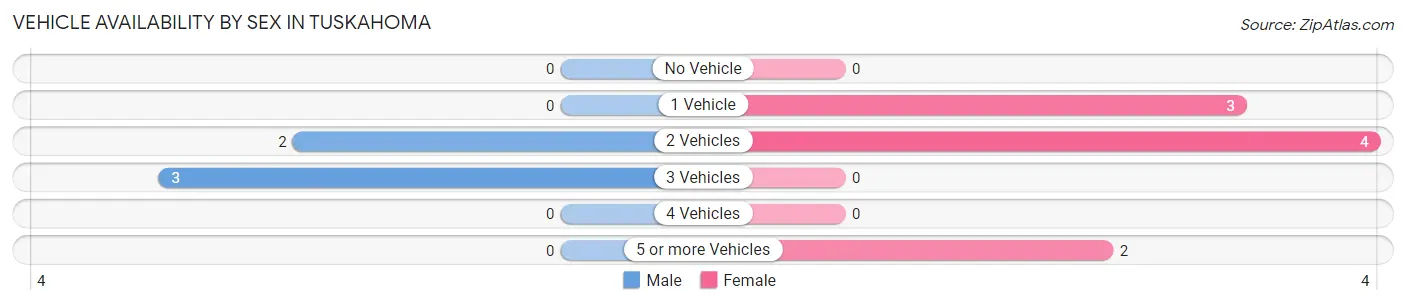
| Vehicles Available | Male | Female |
| No Vehicle | 0 (0.0%) | 0 (0.0%) |
| 1 Vehicle | 0 (0.0%) | 3 (33.3%) |
| 2 Vehicles | 2 (40.0%) | 4 (44.4%) |
| 3 Vehicles | 3 (60.0%) | 0 (0.0%) |
| 4 Vehicles | 0 (0.0%) | 0 (0.0%) |
| 5 or more Vehicles | 0 (0.0%) | 2 (22.2%) |
| Total | 5 (100.0%) | 9 (100.0%) |
Commute Time in Tuskahoma
The most frequently occuring commute durations in Tuskahoma are 35 to 39 minutes (5 commuters, 35.7%), 30 to 34 minutes (4 commuters, 28.6%), and 20 to 24 minutes (3 commuters, 21.4%).
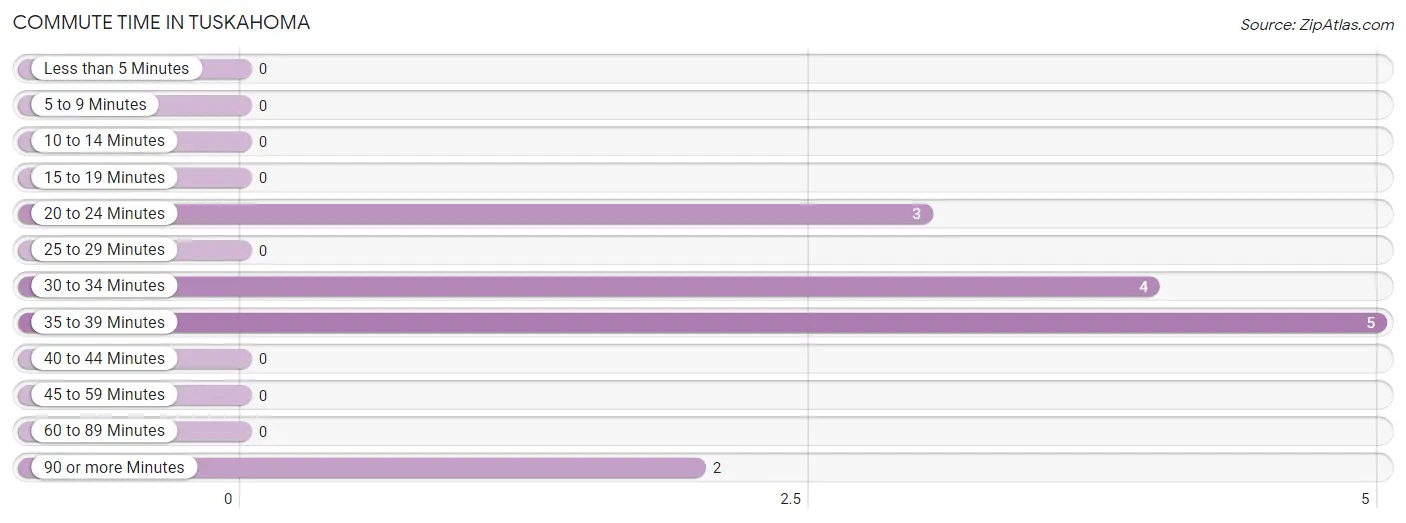
| Commute Time | # Commuters | % Commuters |
| Less than 5 Minutes | 0 | 0.0% |
| 5 to 9 Minutes | 0 | 0.0% |
| 10 to 14 Minutes | 0 | 0.0% |
| 15 to 19 Minutes | 0 | 0.0% |
| 20 to 24 Minutes | 3 | 21.4% |
| 25 to 29 Minutes | 0 | 0.0% |
| 30 to 34 Minutes | 4 | 28.6% |
| 35 to 39 Minutes | 5 | 35.7% |
| 40 to 44 Minutes | 0 | 0.0% |
| 45 to 59 Minutes | 0 | 0.0% |
| 60 to 89 Minutes | 0 | 0.0% |
| 90 or more Minutes | 2 | 14.3% |
Commute Time by Sex in Tuskahoma
The most common commute times in Tuskahoma are 35 to 39 minutes (3 commuters, 60.0%) for males and 30 to 34 minutes (4 commuters, 44.4%) for females.
| Commute Time | Male | Female |
| Less than 5 Minutes | 0 (0.0%) | 0 (0.0%) |
| 5 to 9 Minutes | 0 (0.0%) | 0 (0.0%) |
| 10 to 14 Minutes | 0 (0.0%) | 0 (0.0%) |
| 15 to 19 Minutes | 0 (0.0%) | 0 (0.0%) |
| 20 to 24 Minutes | 2 (40.0%) | 1 (11.1%) |
| 25 to 29 Minutes | 0 (0.0%) | 0 (0.0%) |
| 30 to 34 Minutes | 0 (0.0%) | 4 (44.4%) |
| 35 to 39 Minutes | 3 (60.0%) | 2 (22.2%) |
| 40 to 44 Minutes | 0 (0.0%) | 0 (0.0%) |
| 45 to 59 Minutes | 0 (0.0%) | 0 (0.0%) |
| 60 to 89 Minutes | 0 (0.0%) | 0 (0.0%) |
| 90 or more Minutes | 0 (0.0%) | 2 (22.2%) |
Time of Departure to Work by Sex in Tuskahoma
The most frequent times of departure to work in Tuskahoma are 8:30 AM to 8:59 AM (3, 60.0%) for males and 7:00 AM to 7:29 AM (6, 66.7%) for females.
| Time of Departure | Male | Female |
| 12:00 AM to 4:59 AM | 0 (0.0%) | 0 (0.0%) |
| 5:00 AM to 5:29 AM | 0 (0.0%) | 1 (11.1%) |
| 5:30 AM to 5:59 AM | 0 (0.0%) | 0 (0.0%) |
| 6:00 AM to 6:29 AM | 0 (0.0%) | 0 (0.0%) |
| 6:30 AM to 6:59 AM | 0 (0.0%) | 0 (0.0%) |
| 7:00 AM to 7:29 AM | 0 (0.0%) | 6 (66.7%) |
| 7:30 AM to 7:59 AM | 0 (0.0%) | 0 (0.0%) |
| 8:00 AM to 8:29 AM | 0 (0.0%) | 0 (0.0%) |
| 8:30 AM to 8:59 AM | 3 (60.0%) | 0 (0.0%) |
| 9:00 AM to 9:59 AM | 0 (0.0%) | 0 (0.0%) |
| 10:00 AM to 10:59 AM | 0 (0.0%) | 2 (22.2%) |
| 11:00 AM to 11:59 AM | 0 (0.0%) | 0 (0.0%) |
| 12:00 PM to 3:59 PM | 2 (40.0%) | 0 (0.0%) |
| 4:00 PM to 11:59 PM | 0 (0.0%) | 0 (0.0%) |
| Total | 5 (100.0%) | 9 (100.0%) |
Housing Occupancy in Tuskahoma
Occupancy by Ownership in Tuskahoma
Of the total 32 dwellings in Tuskahoma, owner-occupied units account for 30 (93.8%), while renter-occupied units make up 2 (6.2%).
| Occupancy | # Housing Units | % Housing Units |
| Owner Occupied Housing Units | 30 | 93.8% |
| Renter-Occupied Housing Units | 2 | 6.2% |
| Total Occupied Housing Units | 32 | 100.0% |
Occupancy by Household Size in Tuskahoma
| Household Size | # Housing Units | % Housing Units |
| 1-Person Household | 10 | 31.2% |
| 2-Person Household | 17 | 53.1% |
| 3-Person Household | 5 | 15.6% |
| 4+ Person Household | 0 | 0.0% |
| Total Housing Units | 32 | 100.0% |
Occupancy by Ownership by Household Size in Tuskahoma
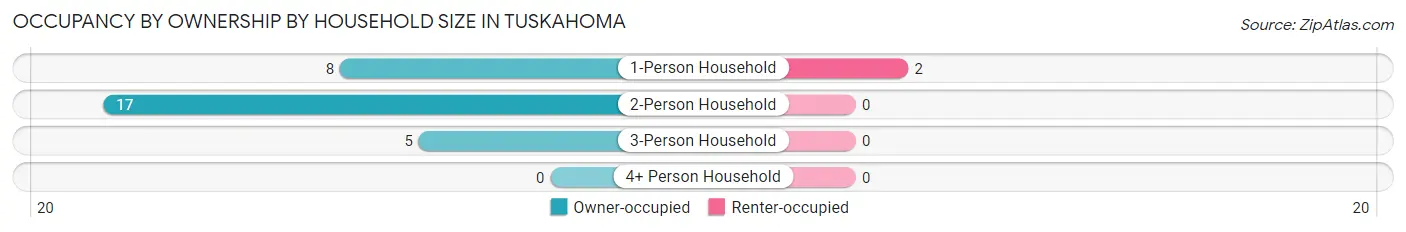
| Household Size | Owner-occupied | Renter-occupied |
| 1-Person Household | 8 (80.0%) | 2 (20.0%) |
| 2-Person Household | 17 (100.0%) | 0 (0.0%) |
| 3-Person Household | 5 (100.0%) | 0 (0.0%) |
| 4+ Person Household | 0 (0.0%) | 0 (0.0%) |
| Total Housing Units | 30 (93.8%) | 2 (6.2%) |
Occupancy by Educational Attainment in Tuskahoma
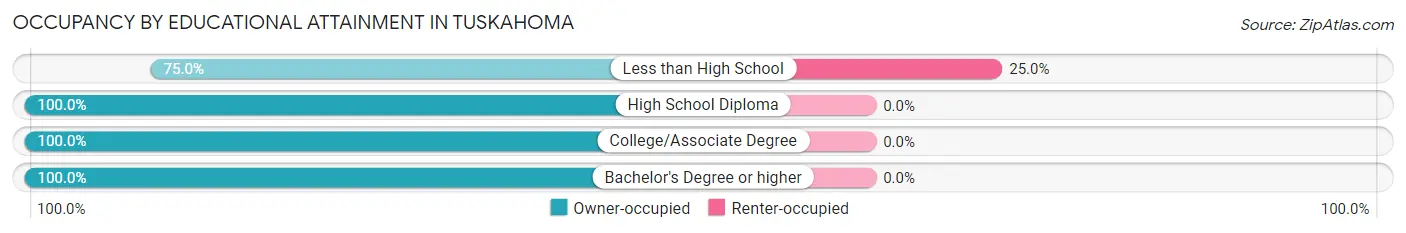
| Household Size | Owner-occupied | Renter-occupied |
| Less than High School | 6 (75.0%) | 2 (25.0%) |
| High School Diploma | 11 (100.0%) | 0 (0.0%) |
| College/Associate Degree | 9 (100.0%) | 0 (0.0%) |
| Bachelor's Degree or higher | 4 (100.0%) | 0 (0.0%) |
Occupancy by Age of Householder in Tuskahoma
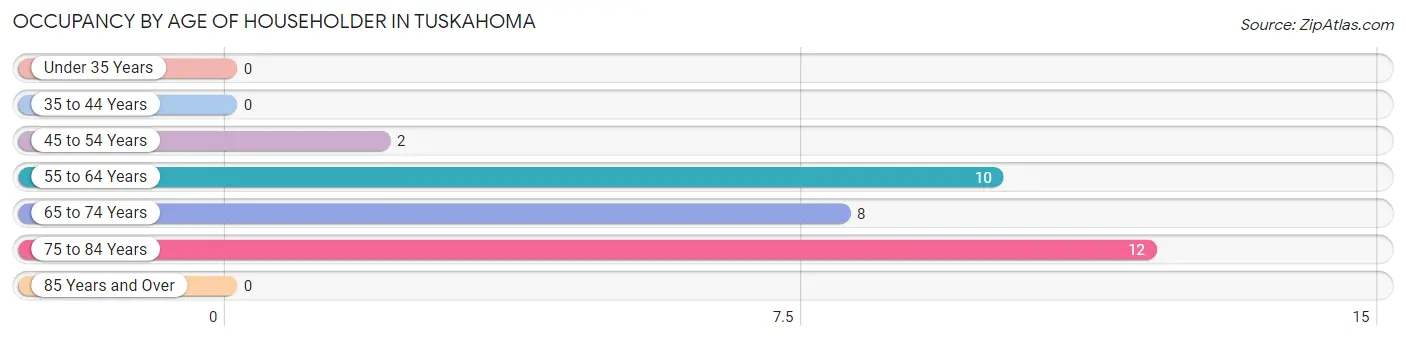
| Age Bracket | # Households | % Households |
| Under 35 Years | 0 | 0.0% |
| 35 to 44 Years | 0 | 0.0% |
| 45 to 54 Years | 2 | 6.2% |
| 55 to 64 Years | 10 | 31.2% |
| 65 to 74 Years | 8 | 25.0% |
| 75 to 84 Years | 12 | 37.5% |
| 85 Years and Over | 0 | 0.0% |
| Total | 32 | 100.0% |
Housing Finances in Tuskahoma
Median Income by Occupancy in Tuskahoma
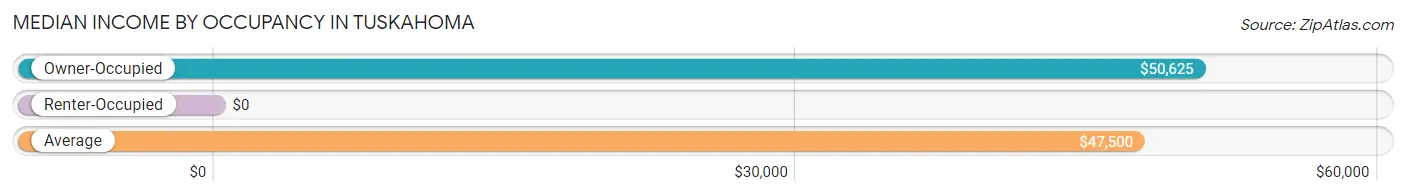
| Occupancy Type | # Households | Median Income |
| Owner-Occupied | 30 (93.8%) | $50,625 |
| Renter-Occupied | 2 (6.2%) | $0 |
| Average | 32 (100.0%) | $47,500 |
Occupancy by Householder Income Bracket in Tuskahoma
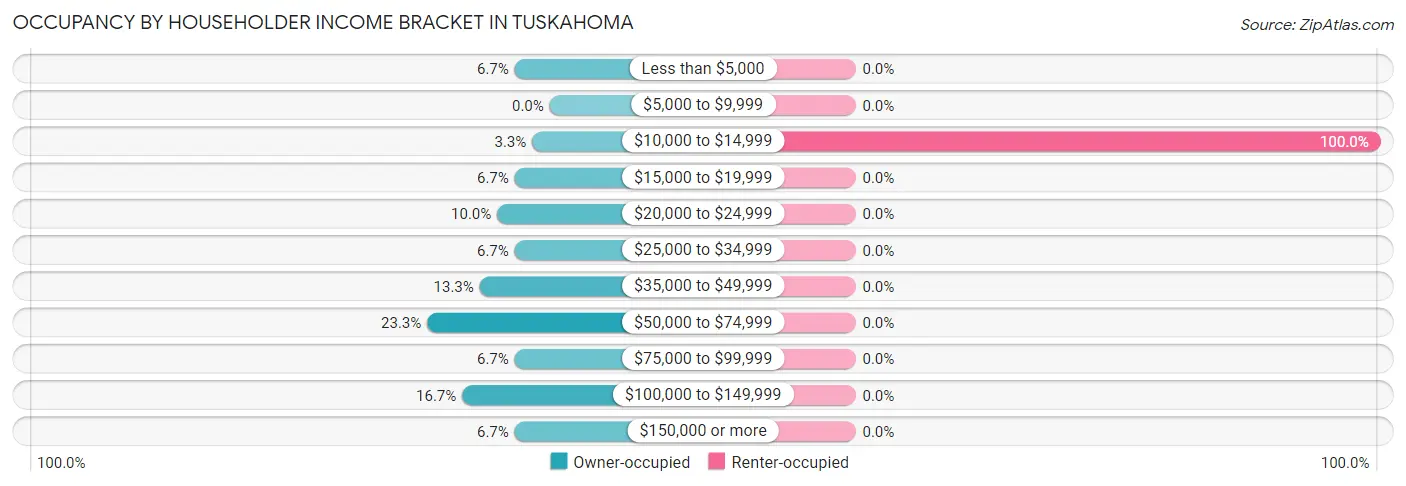
| Income Bracket | Owner-occupied | Renter-occupied |
| Less than $5,000 | 2 (6.7%) | 0 (0.0%) |
| $5,000 to $9,999 | 0 (0.0%) | 0 (0.0%) |
| $10,000 to $14,999 | 1 (3.3%) | 2 (100.0%) |
| $15,000 to $19,999 | 2 (6.7%) | 0 (0.0%) |
| $20,000 to $24,999 | 3 (10.0%) | 0 (0.0%) |
| $25,000 to $34,999 | 2 (6.7%) | 0 (0.0%) |
| $35,000 to $49,999 | 4 (13.3%) | 0 (0.0%) |
| $50,000 to $74,999 | 7 (23.3%) | 0 (0.0%) |
| $75,000 to $99,999 | 2 (6.7%) | 0 (0.0%) |
| $100,000 to $149,999 | 5 (16.7%) | 0 (0.0%) |
| $150,000 or more | 2 (6.7%) | 0 (0.0%) |
| Total | 30 (100.0%) | 2 (100.0%) |
Monthly Housing Cost Tiers in Tuskahoma
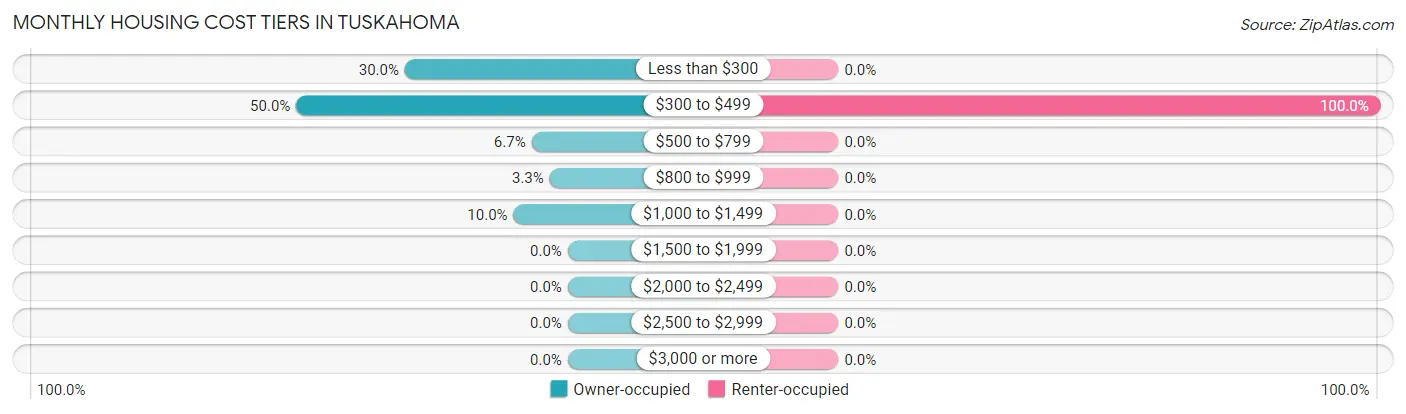
| Monthly Cost | Owner-occupied | Renter-occupied |
| Less than $300 | 9 (30.0%) | 0 (0.0%) |
| $300 to $499 | 15 (50.0%) | 2 (100.0%) |
| $500 to $799 | 2 (6.7%) | 0 (0.0%) |
| $800 to $999 | 1 (3.3%) | 0 (0.0%) |
| $1,000 to $1,499 | 3 (10.0%) | 0 (0.0%) |
| $1,500 to $1,999 | 0 (0.0%) | 0 (0.0%) |
| $2,000 to $2,499 | 0 (0.0%) | 0 (0.0%) |
| $2,500 to $2,999 | 0 (0.0%) | 0 (0.0%) |
| $3,000 or more | 0 (0.0%) | 0 (0.0%) |
| Total | 30 (100.0%) | 2 (100.0%) |
Physical Housing Characteristics in Tuskahoma
Housing Structures in Tuskahoma
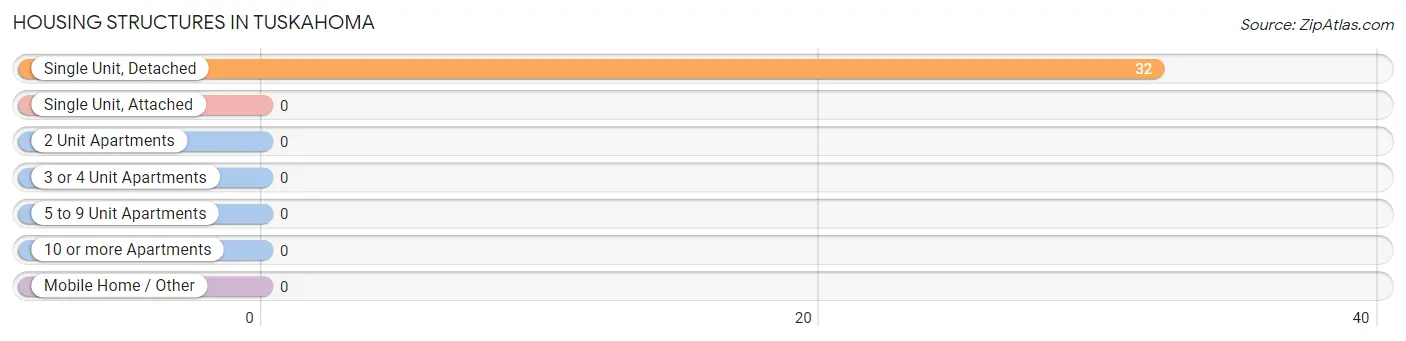
| Structure Type | # Housing Units | % Housing Units |
| Single Unit, Detached | 32 | 100.0% |
| Single Unit, Attached | 0 | 0.0% |
| 2 Unit Apartments | 0 | 0.0% |
| 3 or 4 Unit Apartments | 0 | 0.0% |
| 5 to 9 Unit Apartments | 0 | 0.0% |
| 10 or more Apartments | 0 | 0.0% |
| Mobile Home / Other | 0 | 0.0% |
| Total | 32 | 100.0% |
Housing Structures by Occupancy in Tuskahoma
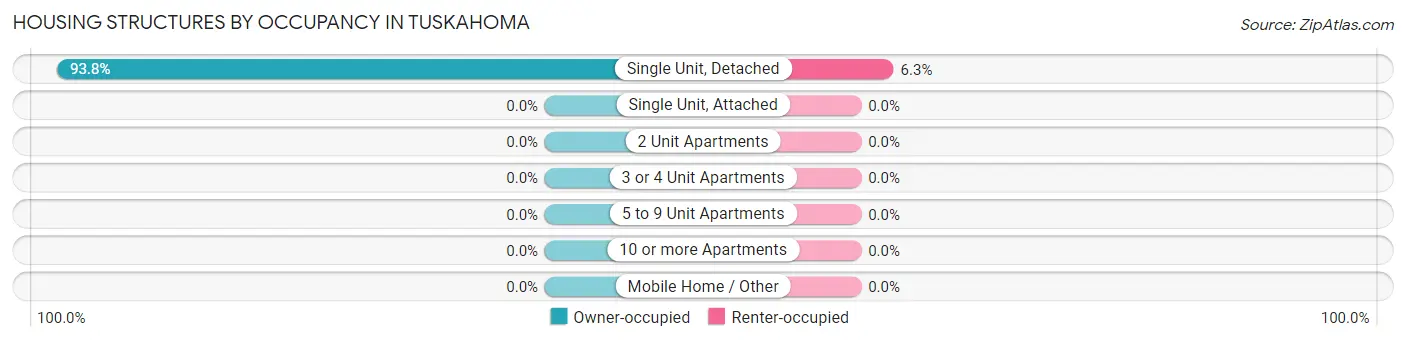
| Structure Type | Owner-occupied | Renter-occupied |
| Single Unit, Detached | 30 (93.8%) | 2 (6.2%) |
| Single Unit, Attached | 0 (0.0%) | 0 (0.0%) |
| 2 Unit Apartments | 0 (0.0%) | 0 (0.0%) |
| 3 or 4 Unit Apartments | 0 (0.0%) | 0 (0.0%) |
| 5 to 9 Unit Apartments | 0 (0.0%) | 0 (0.0%) |
| 10 or more Apartments | 0 (0.0%) | 0 (0.0%) |
| Mobile Home / Other | 0 (0.0%) | 0 (0.0%) |
| Total | 30 (93.8%) | 2 (6.2%) |
Housing Structures by Number of Rooms in Tuskahoma
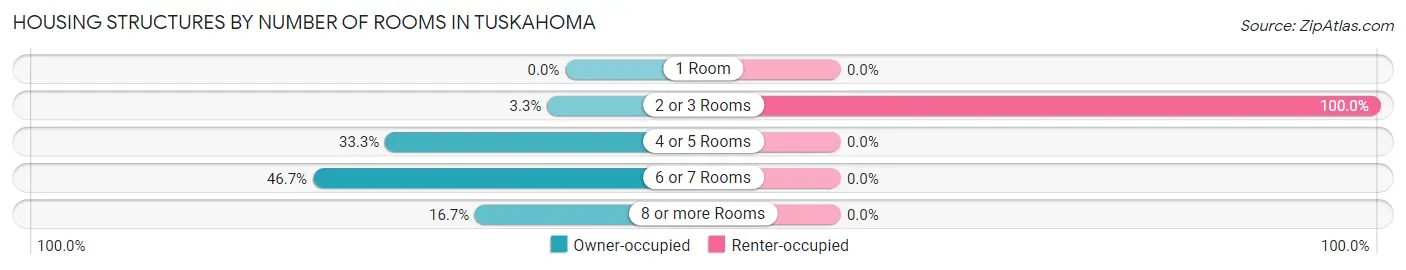
| Number of Rooms | Owner-occupied | Renter-occupied |
| 1 Room | 0 (0.0%) | 0 (0.0%) |
| 2 or 3 Rooms | 1 (3.3%) | 2 (100.0%) |
| 4 or 5 Rooms | 10 (33.3%) | 0 (0.0%) |
| 6 or 7 Rooms | 14 (46.7%) | 0 (0.0%) |
| 8 or more Rooms | 5 (16.7%) | 0 (0.0%) |
| Total | 30 (100.0%) | 2 (100.0%) |
Housing Structure by Heating Type in Tuskahoma
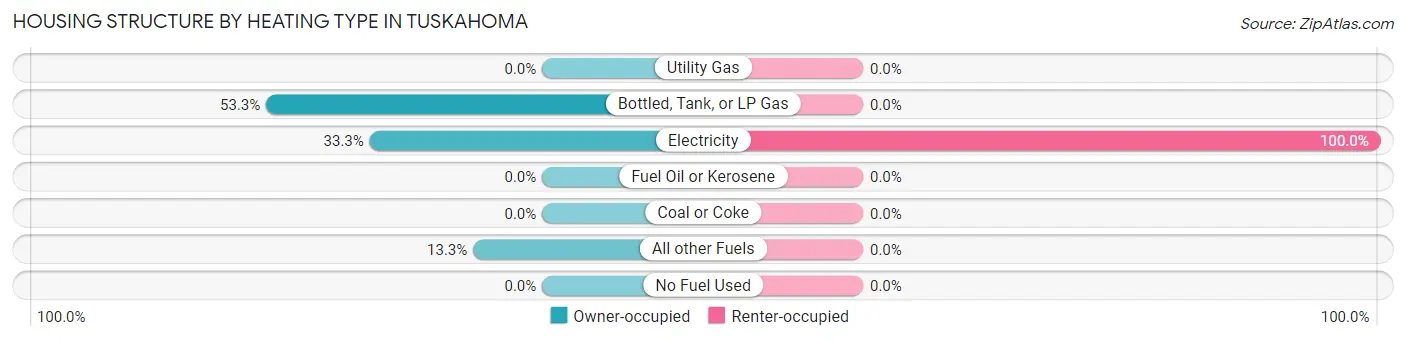
| Heating Type | Owner-occupied | Renter-occupied |
| Utility Gas | 0 (0.0%) | 0 (0.0%) |
| Bottled, Tank, or LP Gas | 16 (53.3%) | 0 (0.0%) |
| Electricity | 10 (33.3%) | 2 (100.0%) |
| Fuel Oil or Kerosene | 0 (0.0%) | 0 (0.0%) |
| Coal or Coke | 0 (0.0%) | 0 (0.0%) |
| All other Fuels | 4 (13.3%) | 0 (0.0%) |
| No Fuel Used | 0 (0.0%) | 0 (0.0%) |
| Total | 30 (100.0%) | 2 (100.0%) |
Household Vehicle Usage in Tuskahoma
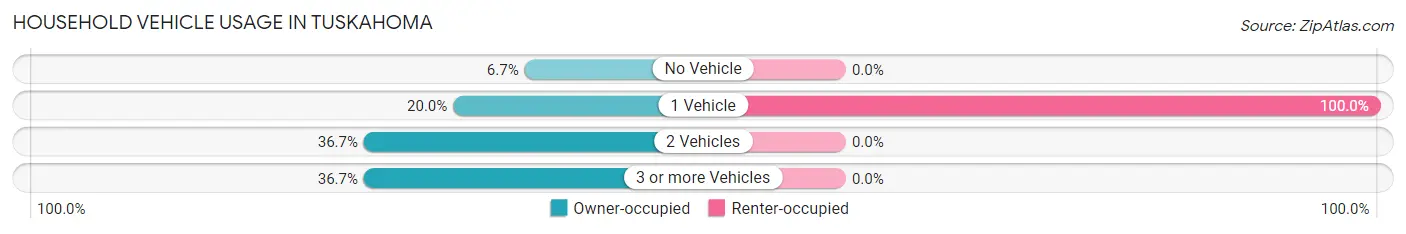
| Vehicles per Household | Owner-occupied | Renter-occupied |
| No Vehicle | 2 (6.7%) | 0 (0.0%) |
| 1 Vehicle | 6 (20.0%) | 2 (100.0%) |
| 2 Vehicles | 11 (36.7%) | 0 (0.0%) |
| 3 or more Vehicles | 11 (36.7%) | 0 (0.0%) |
| Total | 30 (100.0%) | 2 (100.0%) |
Real Estate & Mortgages in Tuskahoma
Real Estate and Mortgage Overview in Tuskahoma
| Characteristic | Without Mortgage | With Mortgage |
| Housing Units | 26 | 4 |
| Median Property Value | $76,000 | $0 |
| Median Household Income | $47,500 | $0 |
| Monthly Housing Costs | $329 | $0 |
| Real Estate Taxes | $300 | $0 |
Property Value by Mortgage Status in Tuskahoma
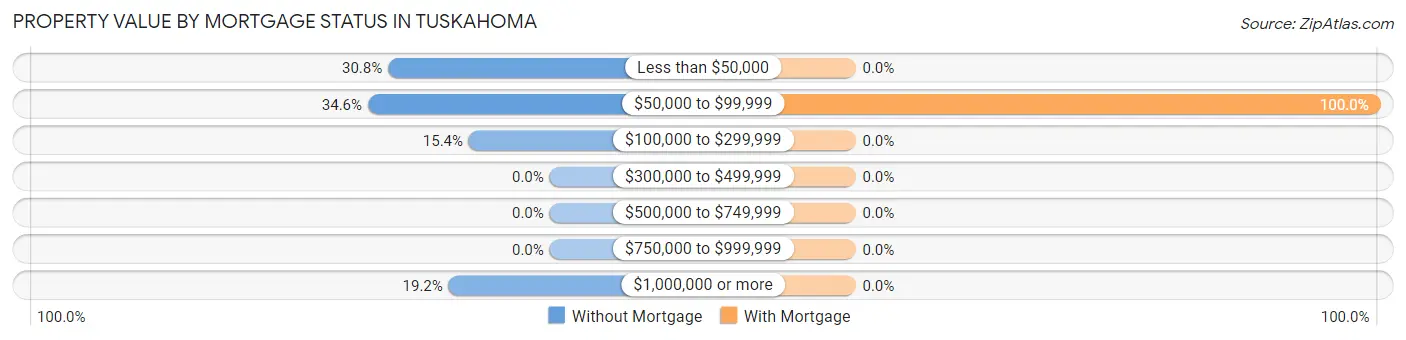
| Property Value | Without Mortgage | With Mortgage |
| Less than $50,000 | 8 (30.8%) | 0 (0.0%) |
| $50,000 to $99,999 | 9 (34.6%) | 4 (100.0%) |
| $100,000 to $299,999 | 4 (15.4%) | 0 (0.0%) |
| $300,000 to $499,999 | 0 (0.0%) | 0 (0.0%) |
| $500,000 to $749,999 | 0 (0.0%) | 0 (0.0%) |
| $750,000 to $999,999 | 0 (0.0%) | 0 (0.0%) |
| $1,000,000 or more | 5 (19.2%) | 0 (0.0%) |
| Total | 26 (100.0%) | 4 (100.0%) |
Household Income by Mortgage Status in Tuskahoma
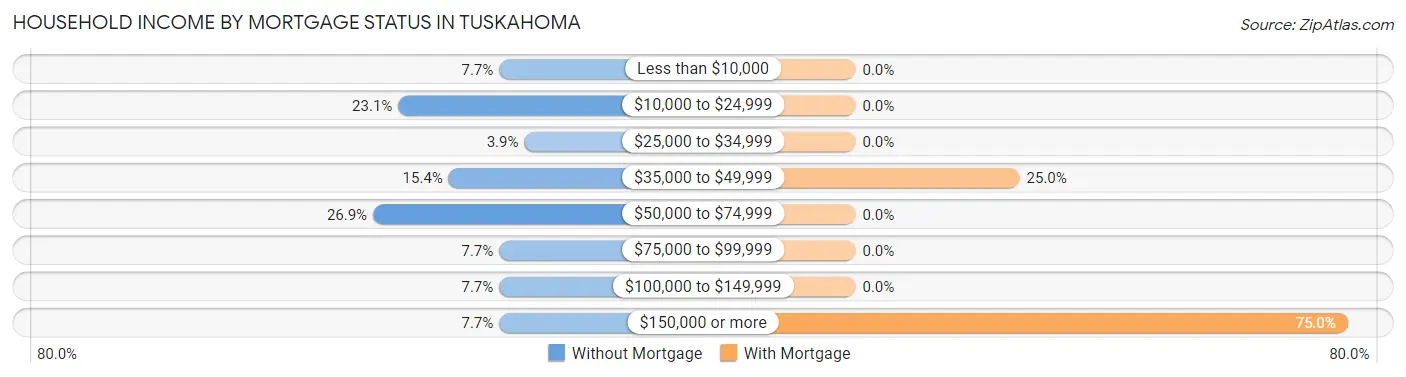
| Household Income | Without Mortgage | With Mortgage |
| Less than $10,000 | 2 (7.7%) | 0 (0.0%) |
| $10,000 to $24,999 | 6 (23.1%) | 0 (0.0%) |
| $25,000 to $34,999 | 1 (3.8%) | 0 (0.0%) |
| $35,000 to $49,999 | 4 (15.4%) | 1 (25.0%) |
| $50,000 to $74,999 | 7 (26.9%) | 0 (0.0%) |
| $75,000 to $99,999 | 2 (7.7%) | 0 (0.0%) |
| $100,000 to $149,999 | 2 (7.7%) | 0 (0.0%) |
| $150,000 or more | 2 (7.7%) | 3 (75.0%) |
| Total | 26 (100.0%) | 4 (100.0%) |
Property Value to Household Income Ratio in Tuskahoma
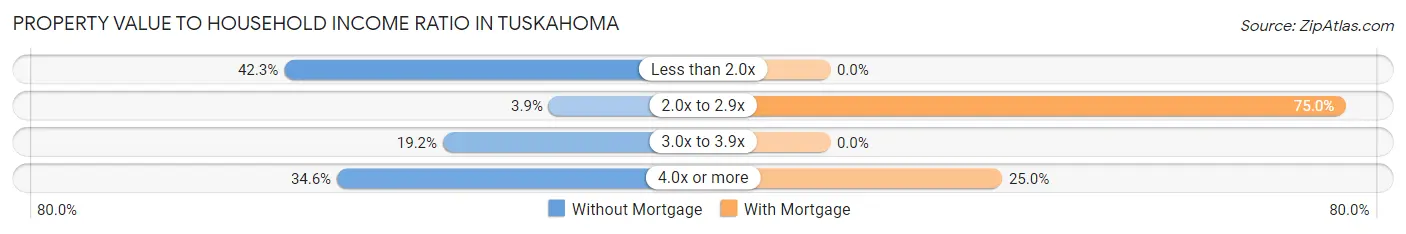
| Value-to-Income Ratio | Without Mortgage | With Mortgage |
| Less than 2.0x | 11 (42.3%) | 0 (0.0%) |
| 2.0x to 2.9x | 1 (3.8%) | 3 (75.0%) |
| 3.0x to 3.9x | 5 (19.2%) | 0 (0.0%) |
| 4.0x or more | 9 (34.6%) | 1 (25.0%) |
| Total | 26 (100.0%) | 4 (100.0%) |
Real Estate Taxes by Mortgage Status in Tuskahoma
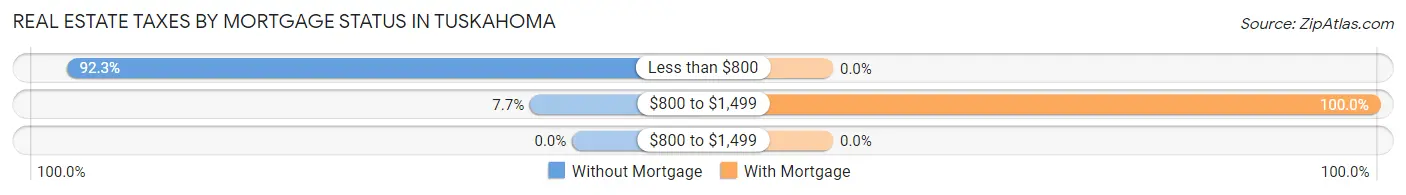
| Property Taxes | Without Mortgage | With Mortgage |
| Less than $800 | 24 (92.3%) | 0 (0.0%) |
| $800 to $1,499 | 2 (7.7%) | 4 (100.0%) |
| $800 to $1,499 | 0 (0.0%) | 0 (0.0%) |
| Total | 26 (100.0%) | 4 (100.0%) |
Health & Disability in Tuskahoma
Health Insurance Coverage by Age in Tuskahoma
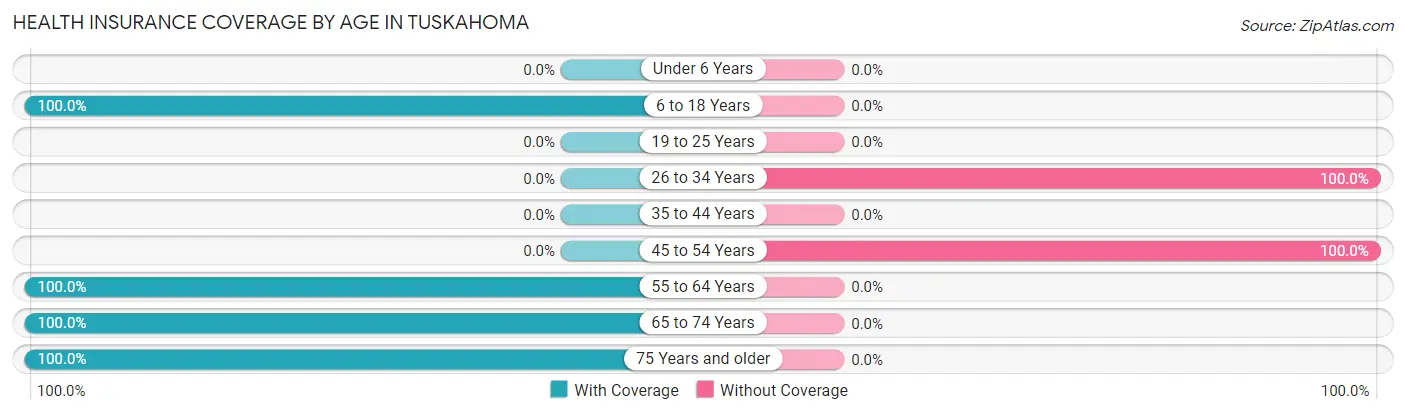
| Age Bracket | With Coverage | Without Coverage |
| Under 6 Years | 0 (0.0%) | 0 (0.0%) |
| 6 to 18 Years | 2 (100.0%) | 0 (0.0%) |
| 19 to 25 Years | 0 (0.0%) | 0 (0.0%) |
| 26 to 34 Years | 0 (0.0%) | 9 (100.0%) |
| 35 to 44 Years | 0 (0.0%) | 0 (0.0%) |
| 45 to 54 Years | 0 (0.0%) | 5 (100.0%) |
| 55 to 64 Years | 15 (100.0%) | 0 (0.0%) |
| 65 to 74 Years | 13 (100.0%) | 0 (0.0%) |
| 75 Years and older | 20 (100.0%) | 0 (0.0%) |
| Total | 50 (78.1%) | 14 (21.9%) |
Health Insurance Coverage by Citizenship Status in Tuskahoma
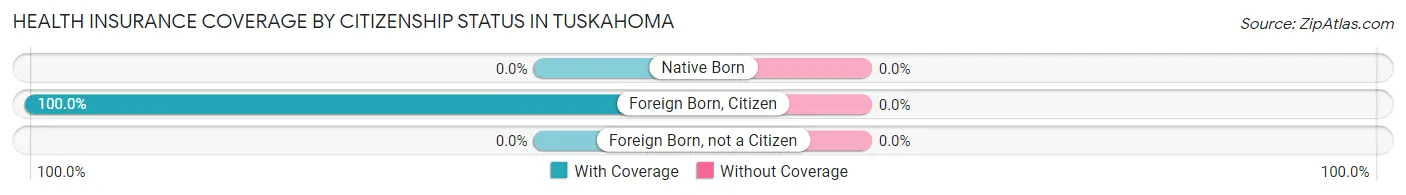
| Citizenship Status | With Coverage | Without Coverage |
| Native Born | 0 (0.0%) | 0 (0.0%) |
| Foreign Born, Citizen | 2 (100.0%) | 0 (0.0%) |
| Foreign Born, not a Citizen | 0 (0.0%) | 0 (0.0%) |
Health Insurance Coverage by Household Income in Tuskahoma
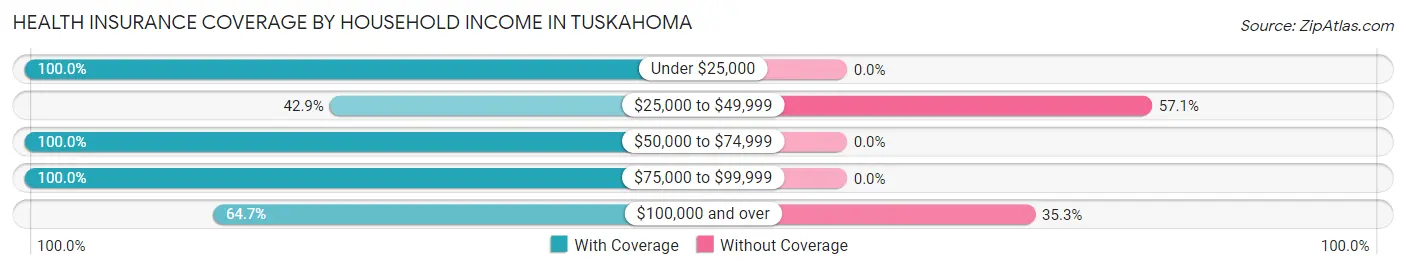
| Household Income | With Coverage | Without Coverage |
| Under $25,000 | 11 (100.0%) | 0 (0.0%) |
| $25,000 to $49,999 | 6 (42.9%) | 8 (57.1%) |
| $50,000 to $74,999 | 18 (100.0%) | 0 (0.0%) |
| $75,000 to $99,999 | 4 (100.0%) | 0 (0.0%) |
| $100,000 and over | 11 (64.7%) | 6 (35.3%) |
Public vs Private Health Insurance Coverage by Age in Tuskahoma
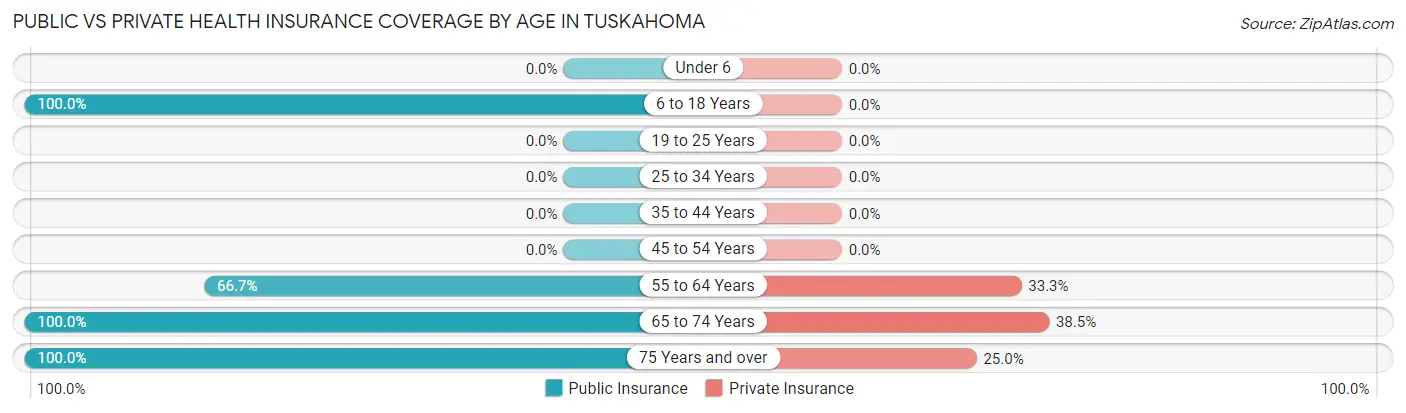
| Age Bracket | Public Insurance | Private Insurance |
| Under 6 | 0 (0.0%) | 0 (0.0%) |
| 6 to 18 Years | 2 (100.0%) | 0 (0.0%) |
| 19 to 25 Years | 0 (0.0%) | 0 (0.0%) |
| 25 to 34 Years | 0 (0.0%) | 0 (0.0%) |
| 35 to 44 Years | 0 (0.0%) | 0 (0.0%) |
| 45 to 54 Years | 0 (0.0%) | 0 (0.0%) |
| 55 to 64 Years | 10 (66.7%) | 5 (33.3%) |
| 65 to 74 Years | 13 (100.0%) | 5 (38.5%) |
| 75 Years and over | 20 (100.0%) | 5 (25.0%) |
| Total | 45 (70.3%) | 15 (23.4%) |
Disability Status by Sex by Age in Tuskahoma
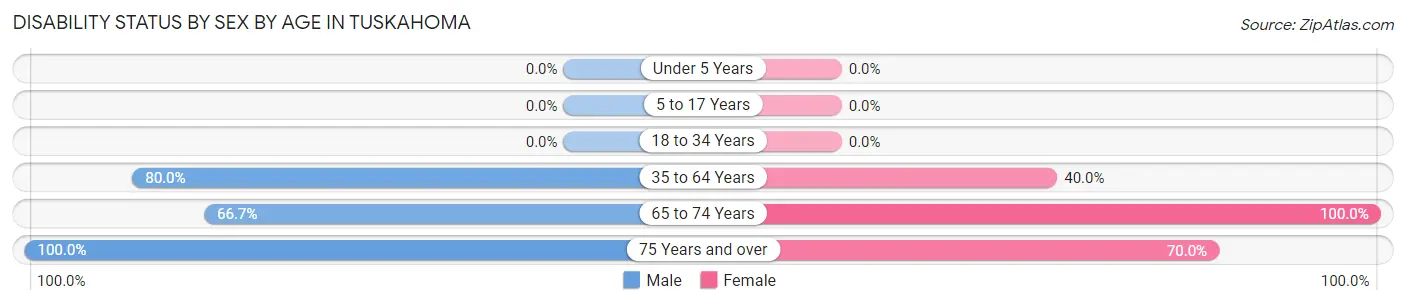
| Age Bracket | Male | Female |
| Under 5 Years | 0 (0.0%) | 0 (0.0%) |
| 5 to 17 Years | 0 (0.0%) | 0 (0.0%) |
| 18 to 34 Years | 0 (0.0%) | 0 (0.0%) |
| 35 to 64 Years | 8 (80.0%) | 4 (40.0%) |
| 65 to 74 Years | 4 (66.7%) | 7 (100.0%) |
| 75 Years and over | 10 (100.0%) | 7 (70.0%) |
Disability Class by Sex by Age in Tuskahoma
Disability Class: Hearing Difficulty
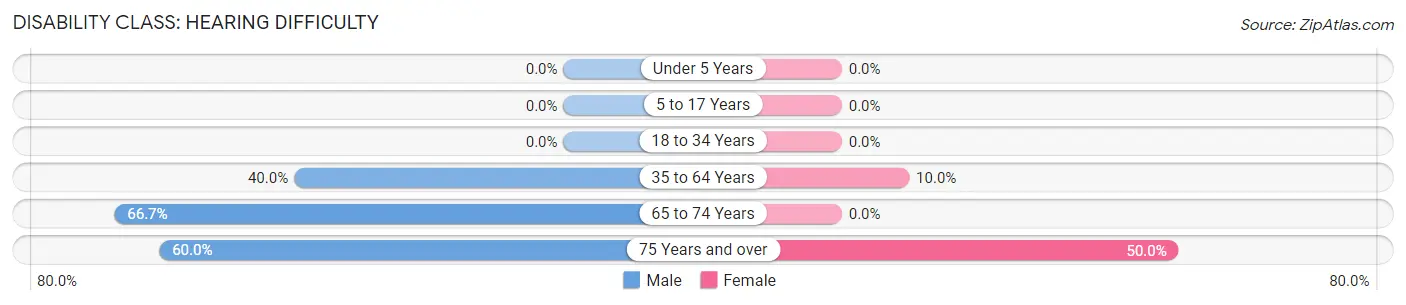
| Age Bracket | Male | Female |
| Under 5 Years | 0 (0.0%) | 0 (0.0%) |
| 5 to 17 Years | 0 (0.0%) | 0 (0.0%) |
| 18 to 34 Years | 0 (0.0%) | 0 (0.0%) |
| 35 to 64 Years | 4 (40.0%) | 1 (10.0%) |
| 65 to 74 Years | 4 (66.7%) | 0 (0.0%) |
| 75 Years and over | 6 (60.0%) | 5 (50.0%) |
Disability Class: Vision Difficulty
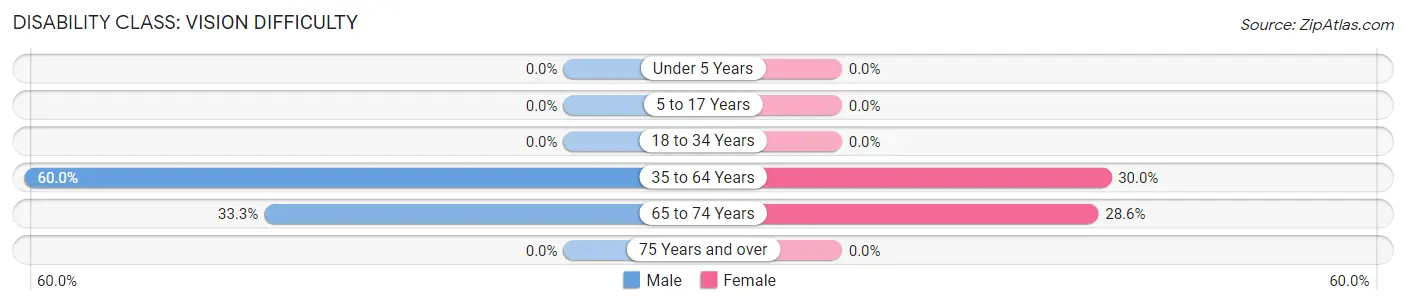
| Age Bracket | Male | Female |
| Under 5 Years | 0 (0.0%) | 0 (0.0%) |
| 5 to 17 Years | 0 (0.0%) | 0 (0.0%) |
| 18 to 34 Years | 0 (0.0%) | 0 (0.0%) |
| 35 to 64 Years | 6 (60.0%) | 3 (30.0%) |
| 65 to 74 Years | 2 (33.3%) | 2 (28.6%) |
| 75 Years and over | 0 (0.0%) | 0 (0.0%) |
Disability Class: Cognitive Difficulty
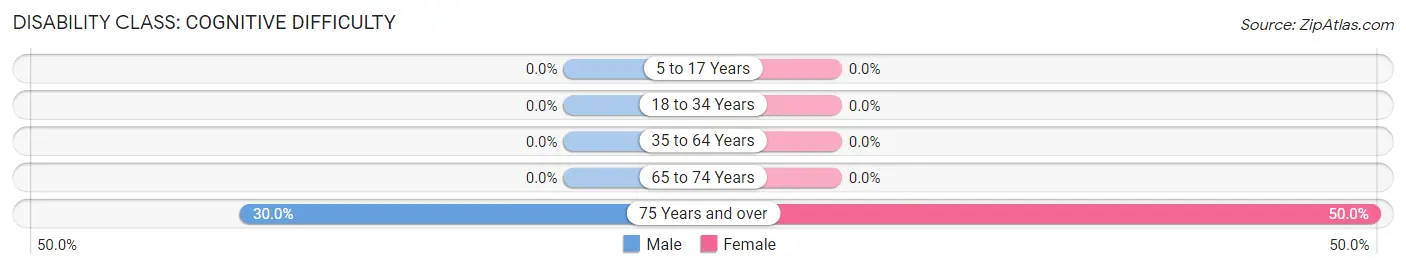
| Age Bracket | Male | Female |
| 5 to 17 Years | 0 (0.0%) | 0 (0.0%) |
| 18 to 34 Years | 0 (0.0%) | 0 (0.0%) |
| 35 to 64 Years | 0 (0.0%) | 0 (0.0%) |
| 65 to 74 Years | 0 (0.0%) | 0 (0.0%) |
| 75 Years and over | 3 (30.0%) | 5 (50.0%) |
Disability Class: Ambulatory Difficulty
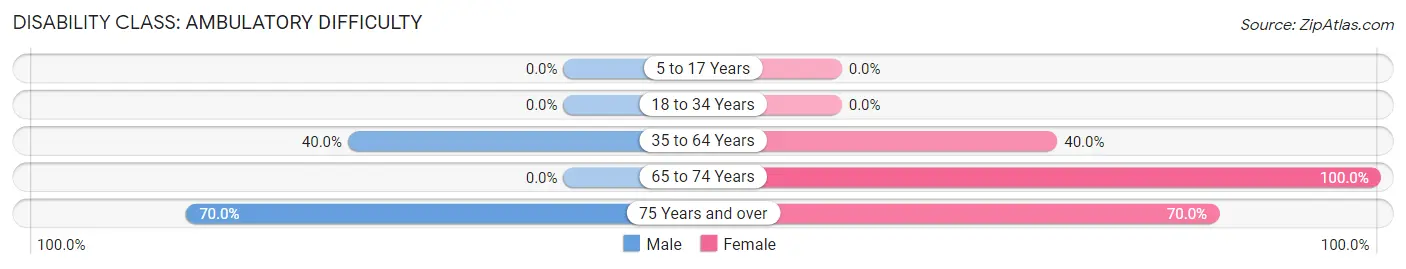
| Age Bracket | Male | Female |
| 5 to 17 Years | 0 (0.0%) | 0 (0.0%) |
| 18 to 34 Years | 0 (0.0%) | 0 (0.0%) |
| 35 to 64 Years | 4 (40.0%) | 4 (40.0%) |
| 65 to 74 Years | 0 (0.0%) | 7 (100.0%) |
| 75 Years and over | 7 (70.0%) | 7 (70.0%) |
Disability Class: Self-Care Difficulty
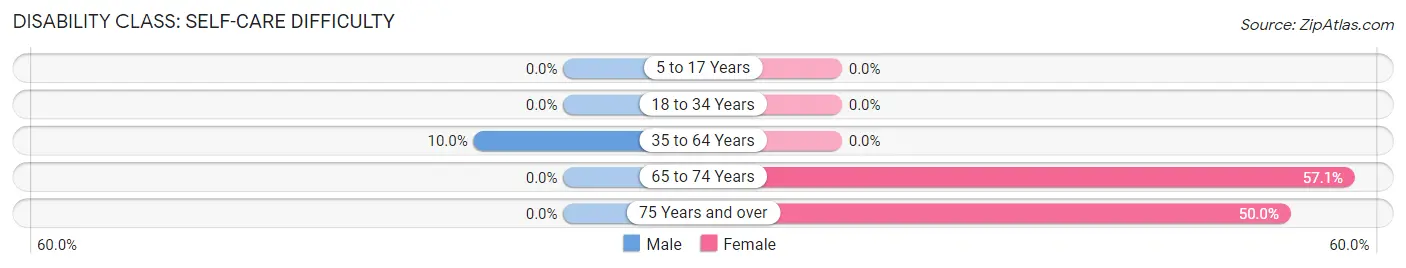
| Age Bracket | Male | Female |
| 5 to 17 Years | 0 (0.0%) | 0 (0.0%) |
| 18 to 34 Years | 0 (0.0%) | 0 (0.0%) |
| 35 to 64 Years | 1 (10.0%) | 0 (0.0%) |
| 65 to 74 Years | 0 (0.0%) | 4 (57.1%) |
| 75 Years and over | 0 (0.0%) | 5 (50.0%) |
Technology Access in Tuskahoma
Computing Device Access in Tuskahoma
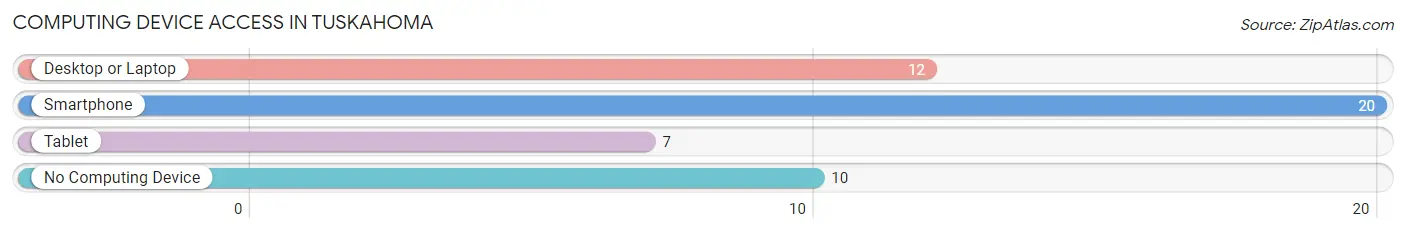
| Device Type | # Households | % Households |
| Desktop or Laptop | 12 | 37.5% |
| Smartphone | 20 | 62.5% |
| Tablet | 7 | 21.9% |
| No Computing Device | 10 | 31.2% |
| Total | 32 | 100.0% |
Internet Access in Tuskahoma
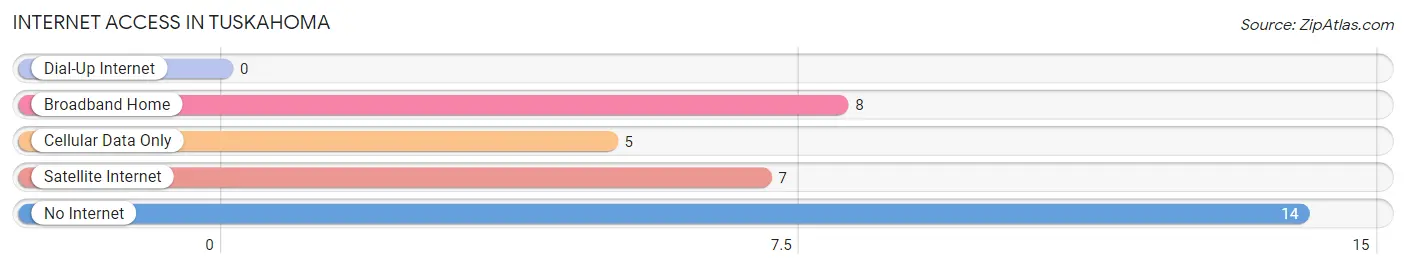
| Internet Type | # Households | % Households |
| Dial-Up Internet | 0 | 0.0% |
| Broadband Home | 8 | 25.0% |
| Cellular Data Only | 5 | 15.6% |
| Satellite Internet | 7 | 21.9% |
| No Internet | 14 | 43.8% |
| Total | 32 | 100.0% |
Tuskahoma Summary
Tuskahoma is a small town located in Pushmataha County, Oklahoma. It is situated in the foothills of the Ouachita Mountains and is home to the Choctaw Nation of Oklahoma. The town was founded in 1884 and is the capital of the Choctaw Nation.
History
Tuskahoma was founded in 1884 by the Choctaw Nation of Oklahoma. The town was named after the Choctaw words for “red warrior” and was chosen as the capital of the Choctaw Nation. The town was originally a trading post and was used as a meeting place for the Choctaw people.
In the early 1900s, the town began to grow and develop. The Choctaw Nation established a school, a post office, and a courthouse in the town. The town also became a center for the Choctaw culture and language.
In the 1920s, the town was home to a number of businesses, including a hotel, a bank, a general store, and a movie theater. The town also had a number of churches, including the First Baptist Church, which was established in 1921.
In the 1930s, the town was home to a number of businesses, including a cotton gin, a sawmill, and a gristmill. The town also had a number of churches, including the First Methodist Church, which was established in 1932.
In the 1940s, the town was home to a number of businesses, including a grocery store, a hardware store, and a drug store. The town also had a number of churches, including the First Presbyterian Church, which was established in 1941.
In the 1950s, the town was home to a number of businesses, including a furniture store, a clothing store, and a restaurant. The town also had a number of churches, including the First Christian Church, which was established in 1952.
In the 1960s, the town was home to a number of businesses, including a gas station, a barber shop, and a beauty salon. The town also had a number of churches, including the First Assembly of God Church, which was established in 1962.
In the 1970s, the town was home to a number of businesses, including a grocery store, a hardware store, and a restaurant. The town also had a number of churches, including the First Church of the Nazarene, which was established in 1972.
In the 1980s, the town was home to a number of businesses, including a gas station, a barber shop, and a beauty salon. The town also had a number of churches, including the First Church of God, which was established in 1982.
In the 1990s, the town was home to a number of businesses, including a grocery store, a hardware store, and a restaurant. The town also had a number of churches, including the First Church of the Nazarene, which was established in 1992.
Geography
Tuskahoma is located in Pushmataha County, Oklahoma. The town is situated in the foothills of the Ouachita Mountains and is home to the Choctaw Nation of Oklahoma. The town is located at an elevation of 890 feet and has a total area of 0.7 square miles.
Economy
The economy of Tuskahoma is largely based on agriculture and tourism. The town is home to a number of farms and ranches, as well as a number of tourist attractions, including the Choctaw Nation Capitol Building, the Choctaw Nation Museum, and the Choctaw Nation Cultural Center.
The town is also home to a number of businesses, including a grocery store, a hardware store, and a restaurant. The town also has a number of churches, including the First Baptist Church, the First Methodist Church, the First Presbyterian Church, the First Christian Church, and the First Church of the Nazarene.
Demographics
As of the 2010 census, the population of Tuskahoma was 1,093. The town has a total area of 0.7 square miles and a population density of 1,541 people per square mile. The median household income in the town is $30,000 and the median age is 37.
The town is home to a number of ethnic groups, including Native Americans, African Americans, and Hispanics. The town is also home to a number of religious groups, including Baptists, Methodists, Presbyterians, and Nazarenes.
Conclusion
Tuskahoma is a small town located in Pushmataha County, Oklahoma. It is situated in the foothills of the Ouachita Mountains and is home to the Choctaw Nation of Oklahoma. The town was founded in 1884 and is the capital of the Choctaw Nation. The town has a rich history and is home to a number of businesses, churches, and tourist attractions. The economy of the town is largely based on agriculture and tourism, and the town has a population of 1,093 people. The town is home to a number of ethnic groups, including Native Americans, African Americans, and Hispanics, and a number of religious groups, including Baptists, Methodists, Presbyterians, and Nazarenes.
Common Questions
What is Per Capita Income in Tuskahoma?
Per Capita income in Tuskahoma is $28,525.
What is the Median Household income in Tuskahoma?
Median Household Income in Tuskahoma is $47,500.
What is Inequality or Gini Index in Tuskahoma?
Inequality or Gini Index in Tuskahoma is 0.45.
What is the Total Population of Tuskahoma?
Total Population of Tuskahoma is 64.
What is the Total Male Population of Tuskahoma?
Total Male Population of Tuskahoma is 33.
What is the Total Female Population of Tuskahoma?
Total Female Population of Tuskahoma is 31.
What is the Ratio of Males per 100 Females in Tuskahoma?
There are 106.45 Males per 100 Females in Tuskahoma.
What is the Ratio of Females per 100 Males in Tuskahoma?
There are 93.94 Females per 100 Males in Tuskahoma.
What is the Median Population Age in Tuskahoma?
Median Population Age in Tuskahoma is 65.5 Years.
What is the Average Family Size in Tuskahoma
Average Family Size in Tuskahoma is 2.3 People.
What is the Average Household Size in Tuskahoma
Average Household Size in Tuskahoma is 2.0 People.
How Large is the Labor Force in Tuskahoma?
There are 14 People in the Labor Forcein in Tuskahoma.
What is the Percentage of People in the Labor Force in Tuskahoma?
22.6% of People are in the Labor Force in Tuskahoma.