Pryor Creek, OK Map & Demographics
Pryor Creek Map
Pryor Creek Overview
$26,092
PER CAPITA INCOME
$52,931
AVG FAMILY INCOME
$46,635
AVG HOUSEHOLD INCOME
38.6%
WAGE / INCOME GAP [ % ]
61.4¢/ $1
WAGE / INCOME GAP [ $ ]
0.43
INEQUALITY / GINI INDEX
9,480
TOTAL POPULATION
4,577
MALE POPULATION
4,903
FEMALE POPULATION
93.35
MALES / 100 FEMALES
107.12
FEMALES / 100 MALES
31.7
MEDIAN AGE
3.0
AVG FAMILY SIZE
2.5
AVG HOUSEHOLD SIZE
4,237
LABOR FORCE [ PEOPLE ]
57.7%
PERCENT IN LABOR FORCE
8.2%
UNEMPLOYMENT RATE
Income in Pryor Creek
Income Overview in Pryor Creek
Per Capita Income in Pryor Creek is $26,092, while median incomes of families and households are $52,931 and $46,635 respectively.
| Characteristic | Number | Measure |
| Per Capita Income | 9,480 | $26,092 |
| Median Family Income | 2,403 | $52,931 |
| Mean Family Income | 2,403 | $70,013 |
| Median Household Income | 3,649 | $46,635 |
| Mean Household Income | 3,649 | $63,858 |
| Income Deficit | 2,403 | $0 |
| Wage / Income Gap (%) | 9,480 | 38.64% |
| Wage / Income Gap ($) | 9,480 | 61.36¢ per $1 |
| Gini / Inequality Index | 9,480 | 0.43 |
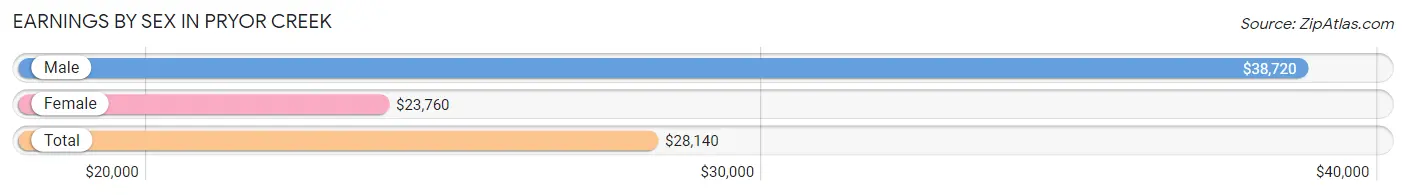
Earnings by Sex in Pryor Creek
Average Earnings in Pryor Creek are $28,140, $38,720 for men and $23,760 for women, a difference of 38.6%.
| Sex | Number | Average Earnings |
| Male | 2,153 (48.1%) | $38,720 |
| Female | 2,321 (51.9%) | $23,760 |
| Total | 4,474 (100.0%) | $28,140 |
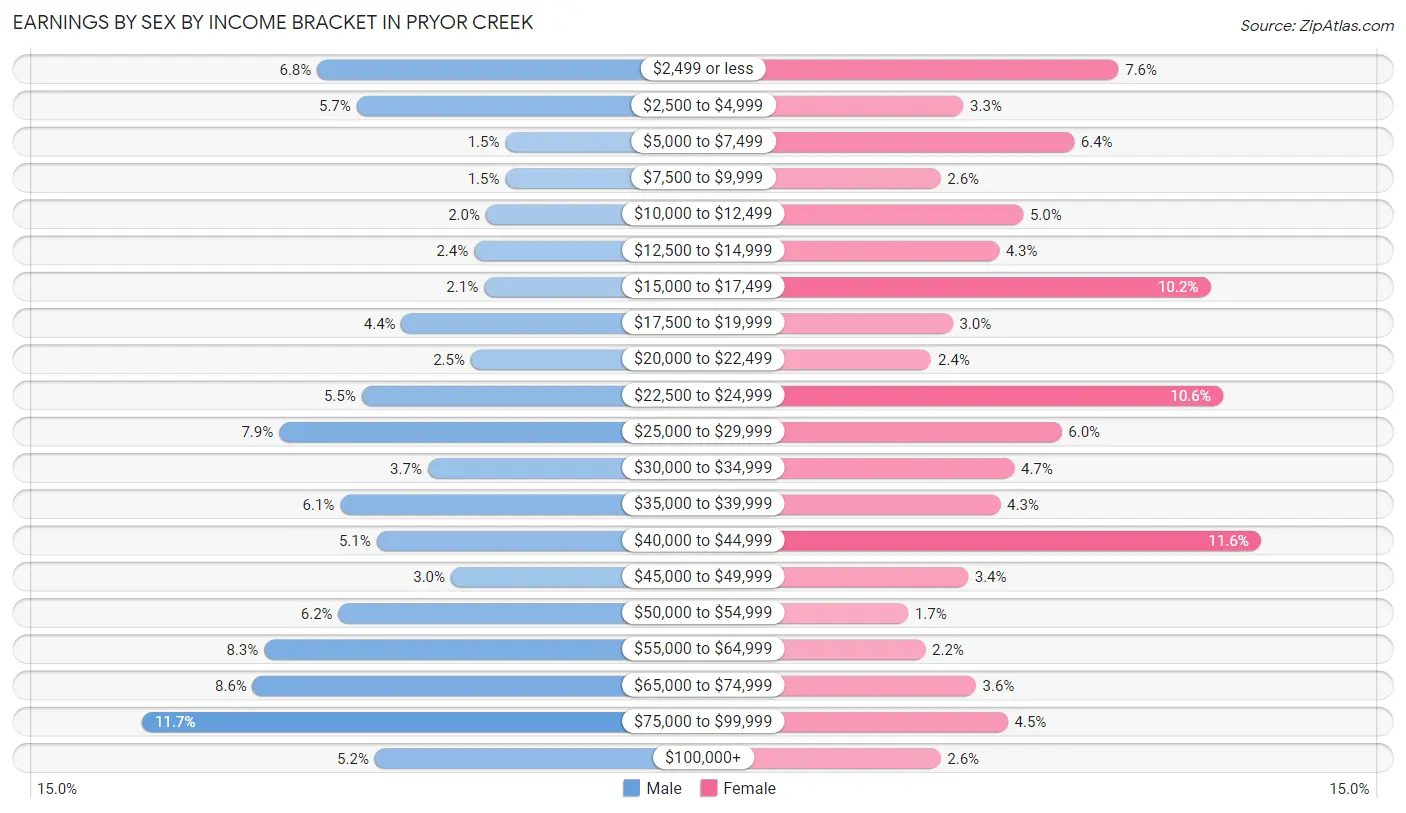
Earnings by Sex by Income Bracket in Pryor Creek
The most common earnings brackets in Pryor Creek are $75,000 to $99,999 for men (252 | 11.7%) and $40,000 to $44,999 for women (270 | 11.6%).
| Income | Male | Female |
| $2,499 or less | 146 (6.8%) | 177 (7.6%) |
| $2,500 to $4,999 | 122 (5.7%) | 76 (3.3%) |
| $5,000 to $7,499 | 32 (1.5%) | 148 (6.4%) |
| $7,500 to $9,999 | 32 (1.5%) | 61 (2.6%) |
| $10,000 to $12,499 | 44 (2.0%) | 115 (5.0%) |
| $12,500 to $14,999 | 51 (2.4%) | 99 (4.3%) |
| $15,000 to $17,499 | 45 (2.1%) | 237 (10.2%) |
| $17,500 to $19,999 | 95 (4.4%) | 69 (3.0%) |
| $20,000 to $22,499 | 53 (2.5%) | 55 (2.4%) |
| $22,500 to $24,999 | 119 (5.5%) | 245 (10.6%) |
| $25,000 to $29,999 | 169 (7.9%) | 140 (6.0%) |
| $30,000 to $34,999 | 79 (3.7%) | 109 (4.7%) |
| $35,000 to $39,999 | 132 (6.1%) | 100 (4.3%) |
| $40,000 to $44,999 | 110 (5.1%) | 270 (11.6%) |
| $45,000 to $49,999 | 65 (3.0%) | 79 (3.4%) |
| $50,000 to $54,999 | 133 (6.2%) | 40 (1.7%) |
| $55,000 to $64,999 | 178 (8.3%) | 51 (2.2%) |
| $65,000 to $74,999 | 185 (8.6%) | 84 (3.6%) |
| $75,000 to $99,999 | 252 (11.7%) | 105 (4.5%) |
| $100,000+ | 111 (5.2%) | 61 (2.6%) |
| Total | 2,153 (100.0%) | 2,321 (100.0%) |
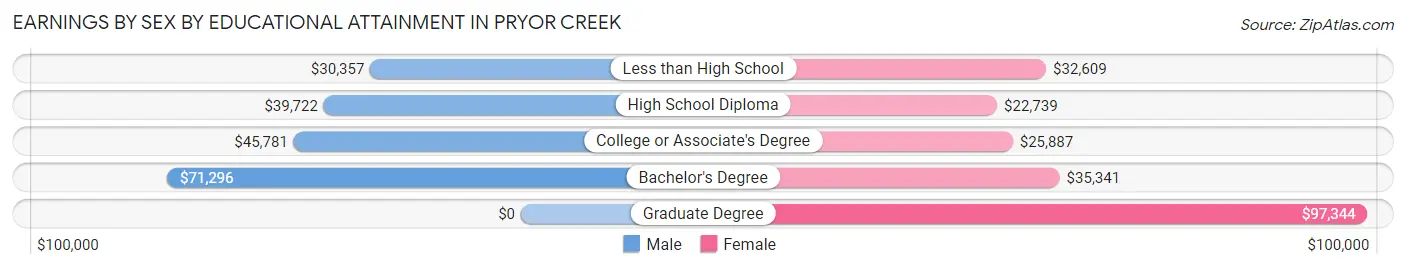
Earnings by Sex by Educational Attainment in Pryor Creek
Average earnings in Pryor Creek are $46,004 for men and $24,863 for women, a difference of 46.0%. Men with an educational attainment of bachelor's degree enjoy the highest average annual earnings of $71,296, while those with less than high school education earn the least with $30,357. Women with an educational attainment of graduate degree earn the most with the average annual earnings of $97,344, while those with high school diploma education have the smallest earnings of $22,739.
| Educational Attainment | Male Income | Female Income |
| Less than High School | $30,357 | $32,609 |
| High School Diploma | $39,722 | $22,739 |
| College or Associate's Degree | $45,781 | $25,887 |
| Bachelor's Degree | $71,296 | $35,341 |
| Graduate Degree | - | - |
| Total | $46,004 | $24,863 |
Family Income in Pryor Creek
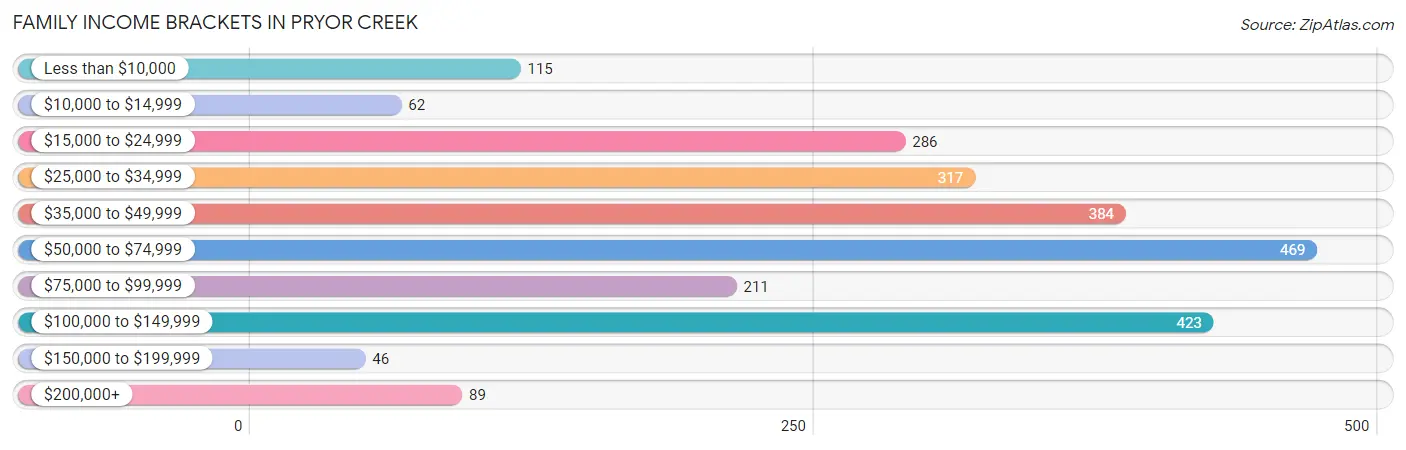
Family Income Brackets in Pryor Creek
According to the Pryor Creek family income data, there are 469 families falling into the $50,000 to $74,999 income range, which is the most common income bracket and makes up 19.5% of all families. Conversely, the $150,000 to $199,999 income bracket is the least frequent group with only 46 families (1.9%) belonging to this category.
| Income Bracket | # Families | % Families |
| Less than $10,000 | 115 | 4.8% |
| $10,000 to $14,999 | 62 | 2.6% |
| $15,000 to $24,999 | 286 | 11.9% |
| $25,000 to $34,999 | 317 | 13.2% |
| $35,000 to $49,999 | 384 | 16.0% |
| $50,000 to $74,999 | 469 | 19.5% |
| $75,000 to $99,999 | 211 | 8.8% |
| $100,000 to $149,999 | 423 | 17.6% |
| $150,000 to $199,999 | 46 | 1.9% |
| $200,000+ | 89 | 3.7% |
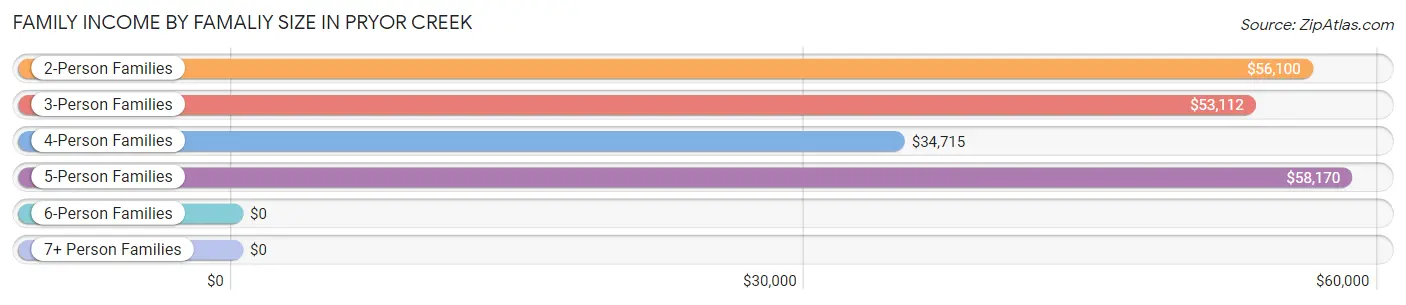
Family Income by Famaliy Size in Pryor Creek
5-person families (231 | 9.6%) account for the highest median family income in Pryor Creek with $58,170 per family, while 2-person families (1,030 | 42.9%) have the highest median income of $28,050 per family member.
| Income Bracket | # Families | Median Income |
| 2-Person Families | 1,030 (42.9%) | $56,100 |
| 3-Person Families | 554 (23.1%) | $53,112 |
| 4-Person Families | 515 (21.4%) | $34,715 |
| 5-Person Families | 231 (9.6%) | $58,170 |
| 6-Person Families | 58 (2.4%) | $0 |
| 7+ Person Families | 15 (0.6%) | $0 |
| Total | 2,403 (100.0%) | $52,931 |
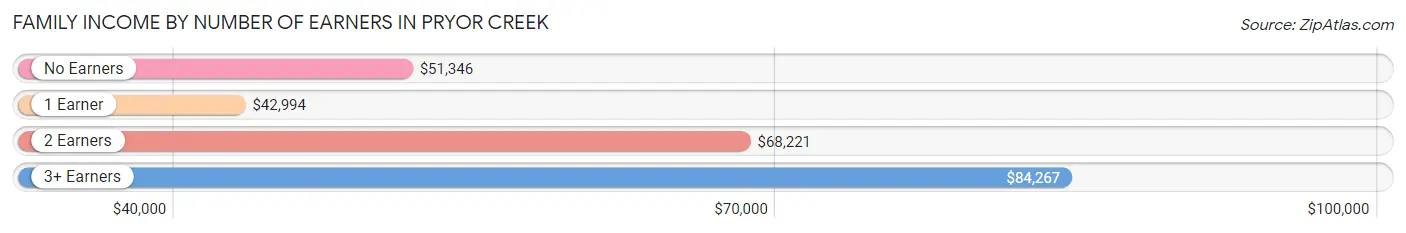
Family Income by Number of Earners in Pryor Creek
The median family income in Pryor Creek is $52,931, with families comprising 3+ earners (131) having the highest median family income of $84,267, while families with 1 earner (1,039) have the lowest median family income of $42,994, accounting for 5.4% and 43.2% of families, respectively.
| Number of Earners | # Families | Median Income |
| No Earners | 400 (16.7%) | $51,346 |
| 1 Earner | 1,039 (43.2%) | $42,994 |
| 2 Earners | 833 (34.7%) | $68,221 |
| 3+ Earners | 131 (5.4%) | $84,267 |
| Total | 2,403 (100.0%) | $52,931 |
Household Income in Pryor Creek
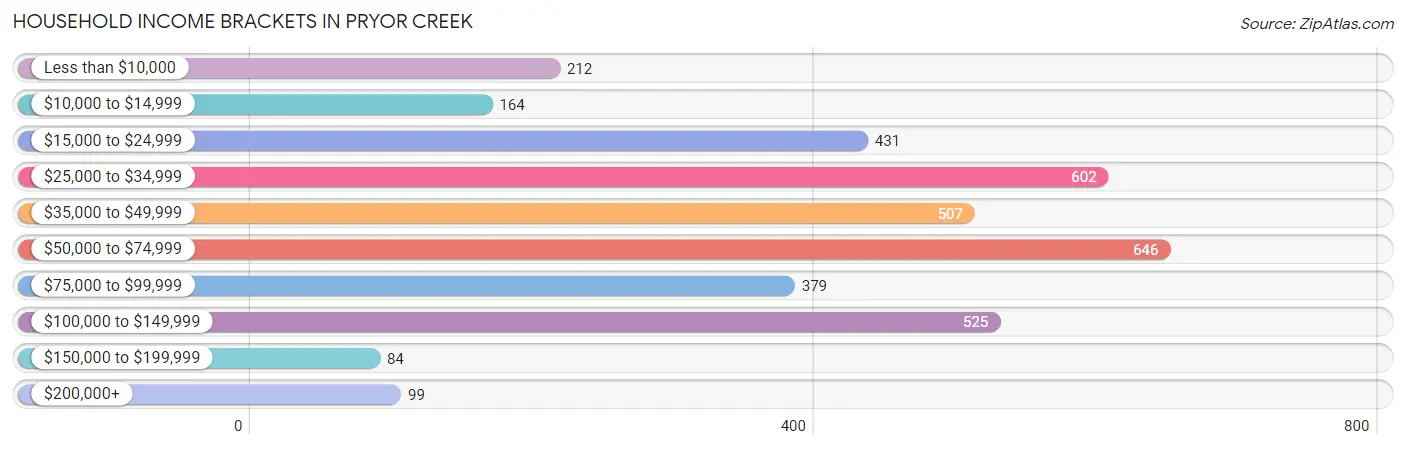
Household Income Brackets in Pryor Creek
With 646 households falling in the category, the $50,000 to $74,999 income range is the most frequent in Pryor Creek, accounting for 17.7% of all households. In contrast, only 84 households (2.3%) fall into the $150,000 to $199,999 income bracket, making it the least populous group.
| Income Bracket | # Households | % Households |
| Less than $10,000 | 212 | 5.8% |
| $10,000 to $14,999 | 164 | 4.5% |
| $15,000 to $24,999 | 431 | 11.8% |
| $25,000 to $34,999 | 602 | 16.5% |
| $35,000 to $49,999 | 507 | 13.9% |
| $50,000 to $74,999 | 646 | 17.7% |
| $75,000 to $99,999 | 379 | 10.4% |
| $100,000 to $149,999 | 525 | 14.4% |
| $150,000 to $199,999 | 84 | 2.3% |
| $200,000+ | 99 | 2.7% |
Household Income by Householder Age in Pryor Creek
The median household income in Pryor Creek is $46,635, with the highest median household income of $56,016 found in the 45 to 64 years age bracket for the primary householder. A total of 1,090 households (29.9%) fall into this category. Meanwhile, the 65+ years age bracket for the primary householder has the lowest median household income of $38,158, with 1,074 households (29.4%) in this group.
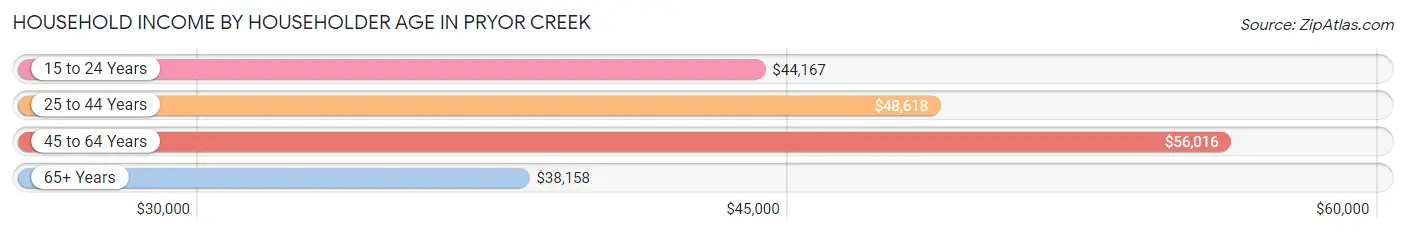
| Income Bracket | # Households | Median Income |
| 15 to 24 Years | 162 (4.4%) | $44,167 |
| 25 to 44 Years | 1,323 (36.3%) | $48,618 |
| 45 to 64 Years | 1,090 (29.9%) | $56,016 |
| 65+ Years | 1,074 (29.4%) | $38,158 |
| Total | 3,649 (100.0%) | $46,635 |
Poverty in Pryor Creek
Income Below Poverty by Sex and Age in Pryor Creek
With 16.9% poverty level for males and 23.8% for females among the residents of Pryor Creek, 15 year old males and 15 year old females are the most vulnerable to poverty, with 12 males (40.0%) and 36 females (61.0%) in their respective age groups living below the poverty level.
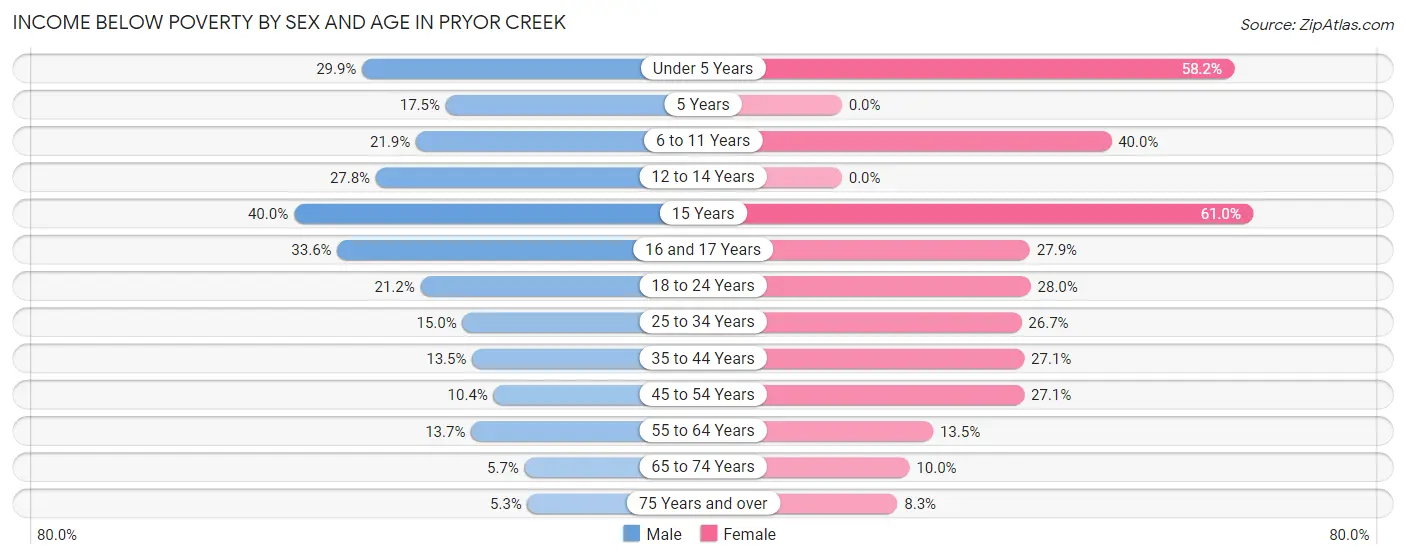
| Age Bracket | Male | Female |
| Under 5 Years | 112 (29.9%) | 110 (58.2%) |
| 5 Years | 22 (17.5%) | 0 (0.0%) |
| 6 to 11 Years | 80 (21.9%) | 166 (40.0%) |
| 12 to 14 Years | 32 (27.8%) | 0 (0.0%) |
| 15 Years | 12 (40.0%) | 36 (61.0%) |
| 16 and 17 Years | 51 (33.6%) | 31 (27.9%) |
| 18 to 24 Years | 119 (21.2%) | 159 (28.0%) |
| 25 to 34 Years | 109 (15.0%) | 215 (26.7%) |
| 35 to 44 Years | 58 (13.5%) | 143 (27.1%) |
| 45 to 54 Years | 44 (10.3%) | 124 (27.1%) |
| 55 to 64 Years | 55 (13.7%) | 73 (13.5%) |
| 65 to 74 Years | 17 (5.7%) | 47 (10.0%) |
| 75 Years and over | 15 (5.3%) | 32 (8.3%) |
| Total | 726 (16.9%) | 1,136 (23.8%) |
Income Above Poverty by Sex and Age in Pryor Creek
According to the poverty statistics in Pryor Creek, males aged 75 years and over and females aged 5 years are the age groups that are most secure financially, with 94.7% of males and 100.0% of females in these age groups living above the poverty line.
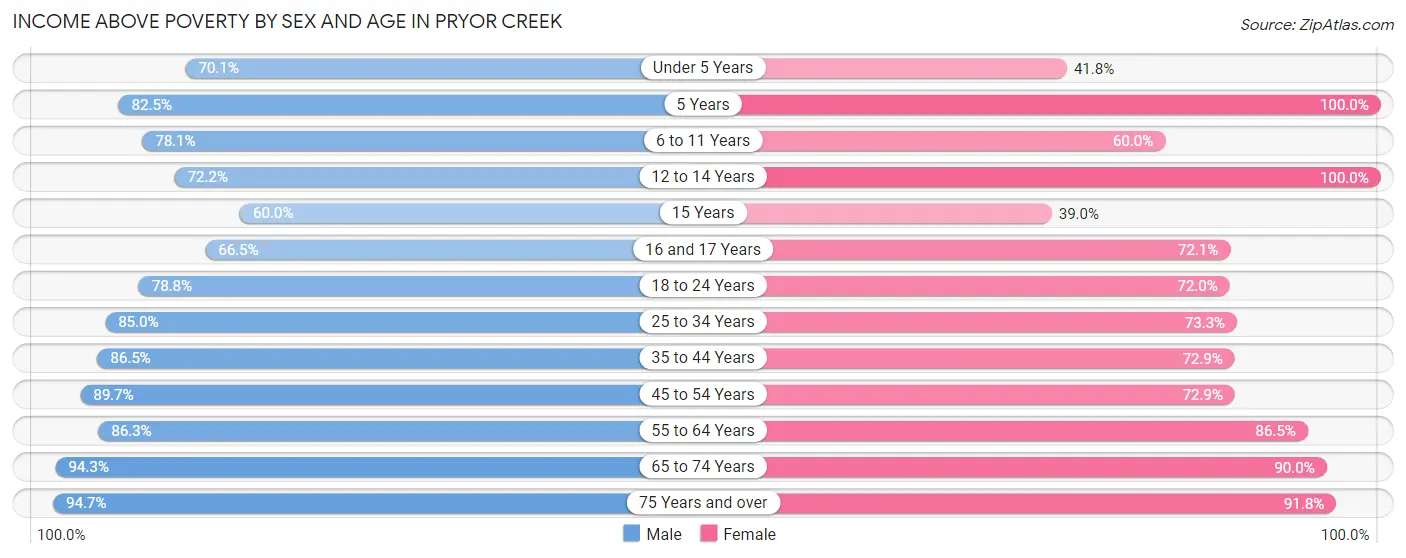
| Age Bracket | Male | Female |
| Under 5 Years | 263 (70.1%) | 79 (41.8%) |
| 5 Years | 104 (82.5%) | 73 (100.0%) |
| 6 to 11 Years | 286 (78.1%) | 249 (60.0%) |
| 12 to 14 Years | 83 (72.2%) | 162 (100.0%) |
| 15 Years | 18 (60.0%) | 23 (39.0%) |
| 16 and 17 Years | 101 (66.4%) | 80 (72.1%) |
| 18 to 24 Years | 442 (78.8%) | 408 (72.0%) |
| 25 to 34 Years | 619 (85.0%) | 591 (73.3%) |
| 35 to 44 Years | 371 (86.5%) | 385 (72.9%) |
| 45 to 54 Years | 381 (89.6%) | 334 (72.9%) |
| 55 to 64 Years | 347 (86.3%) | 466 (86.5%) |
| 65 to 74 Years | 279 (94.3%) | 421 (90.0%) |
| 75 Years and over | 268 (94.7%) | 356 (91.7%) |
| Total | 3,562 (83.1%) | 3,627 (76.1%) |
Income Below Poverty Among Married-Couple Families in Pryor Creek
The poverty statistics for married-couple families in Pryor Creek show that 9.4% or 138 of the total 1,463 families live below the poverty line. Families with 1 or 2 children have the highest poverty rate of 13.1%, comprising of 74 families. On the other hand, families with 5 or more children have the lowest poverty rate of 0.0%, which includes 0 families.
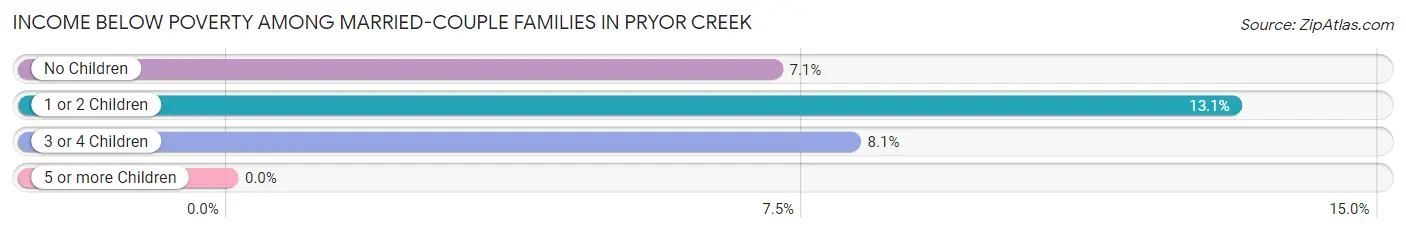
| Children | Above Poverty | Below Poverty |
| No Children | 706 (92.9%) | 54 (7.1%) |
| 1 or 2 Children | 491 (86.9%) | 74 (13.1%) |
| 3 or 4 Children | 113 (91.9%) | 10 (8.1%) |
| 5 or more Children | 15 (100.0%) | 0 (0.0%) |
| Total | 1,325 (90.6%) | 138 (9.4%) |
Income Below Poverty Among Single-Parent Households in Pryor Creek
According to the poverty data in Pryor Creek, 8.1% or 18 single-father households and 37.1% or 266 single-mother households are living below the poverty line. Among single-father households, those with no children have the highest poverty rate, with 18 households (16.5%) experiencing poverty. Likewise, among single-mother households, those with 3 or 4 children have the highest poverty rate, with 148 households (87.1%) falling below the poverty line.
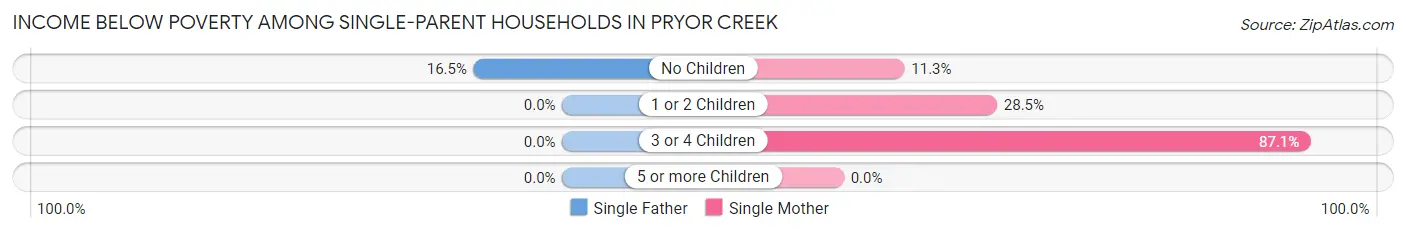
| Children | Single Father | Single Mother |
| No Children | 18 (16.5%) | 25 (11.3%) |
| 1 or 2 Children | 0 (0.0%) | 93 (28.5%) |
| 3 or 4 Children | 0 (0.0%) | 148 (87.1%) |
| 5 or more Children | 0 (0.0%) | 0 (0.0%) |
| Total | 18 (8.1%) | 266 (37.1%) |
Income Below Poverty Among Married-Couple vs Single-Parent Households in Pryor Creek
The poverty data for Pryor Creek shows that 138 of the married-couple family households (9.4%) and 284 of the single-parent households (30.2%) are living below the poverty level. Within the married-couple family households, those with 1 or 2 children have the highest poverty rate, with 74 households (13.1%) falling below the poverty line. Among the single-parent households, those with 3 or 4 children have the highest poverty rate, with 148 household (79.1%) living below poverty.
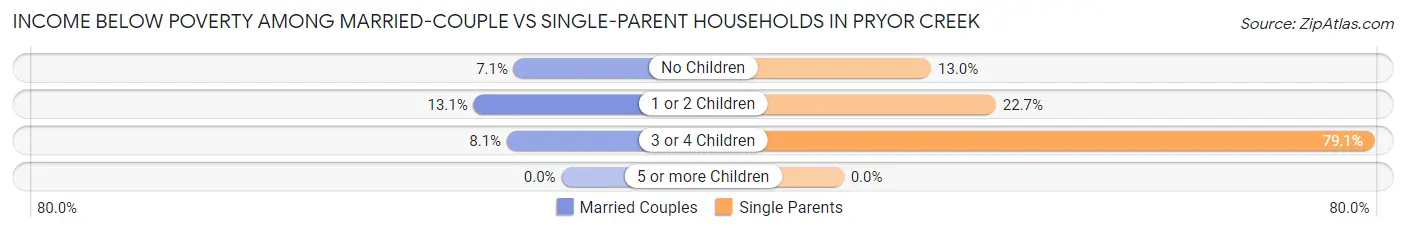
| Children | Married-Couple Families | Single-Parent Households |
| No Children | 54 (7.1%) | 43 (13.0%) |
| 1 or 2 Children | 74 (13.1%) | 93 (22.7%) |
| 3 or 4 Children | 10 (8.1%) | 148 (79.1%) |
| 5 or more Children | 0 (0.0%) | 0 (0.0%) |
| Total | 138 (9.4%) | 284 (30.2%) |
Race in Pryor Creek
The most populous races in Pryor Creek are White / Caucasian (6,313 | 66.6%), Native / Alaskan (1,706 | 18.0%), and Two or more Races (1,115 | 11.8%).
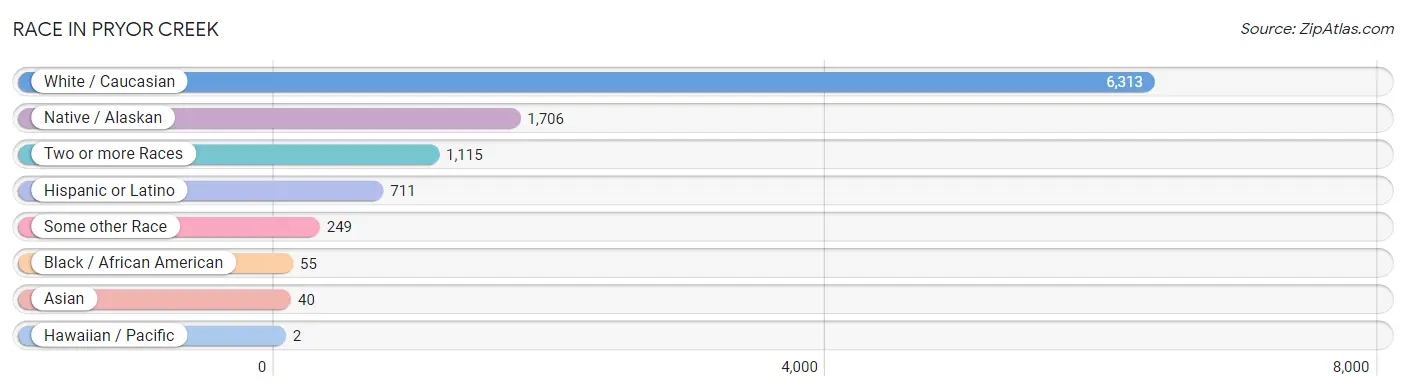
| Race | # Population | % Population |
| Asian | 40 | 0.4% |
| Black / African American | 55 | 0.6% |
| Hawaiian / Pacific | 2 | 0.0% |
| Hispanic or Latino | 711 | 7.5% |
| Native / Alaskan | 1,706 | 18.0% |
| White / Caucasian | 6,313 | 66.6% |
| Two or more Races | 1,115 | 11.8% |
| Some other Race | 249 | 2.6% |
| Total | 9,480 | 100.0% |
Ancestry in Pryor Creek
The most populous ancestries reported in Pryor Creek are Cherokee (1,732 | 18.3%), Irish (1,147 | 12.1%), German (873 | 9.2%), English (860 | 9.1%), and Mexican (661 | 7.0%), together accounting for 55.6% of all Pryor Creek residents.
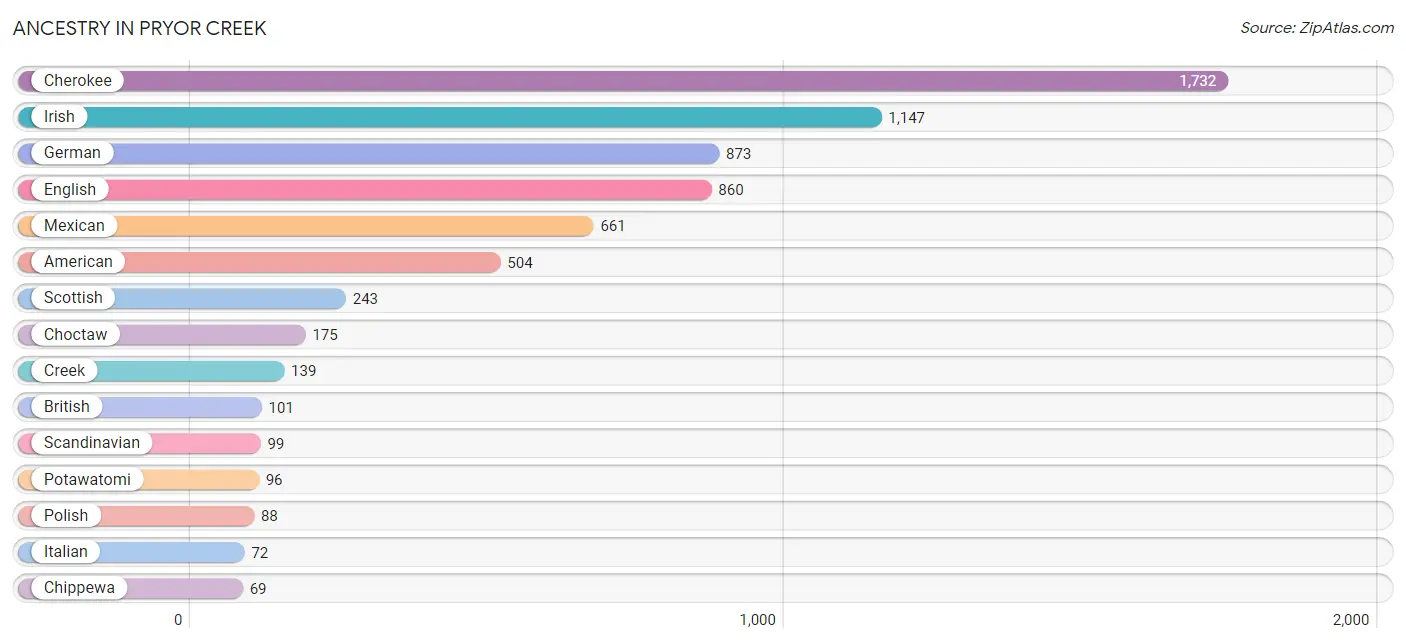
| Ancestry | # Population | % Population |
| American | 504 | 5.3% |
| Arab | 21 | 0.2% |
| Arapaho | 14 | 0.2% |
| Bangladeshi | 8 | 0.1% |
| Bhutanese | 10 | 0.1% |
| Blackfeet | 34 | 0.4% |
| British | 101 | 1.1% |
| Canadian | 19 | 0.2% |
| Central American | 11 | 0.1% |
| Cherokee | 1,732 | 18.3% |
| Chickasaw | 66 | 0.7% |
| Chippewa | 69 | 0.7% |
| Choctaw | 175 | 1.8% |
| Comanche | 15 | 0.2% |
| Creek | 139 | 1.5% |
| Danish | 21 | 0.2% |
| Dutch | 59 | 0.6% |
| Dutch West Indian | 51 | 0.5% |
| Eastern European | 3 | 0.0% |
| English | 860 | 9.1% |
| European | 35 | 0.4% |
| French | 27 | 0.3% |
| German | 873 | 9.2% |
| Guatemalan | 11 | 0.1% |
| Hungarian | 9 | 0.1% |
| Indian (Asian) | 20 | 0.2% |
| Irish | 1,147 | 12.1% |
| Italian | 72 | 0.8% |
| Kiowa | 21 | 0.2% |
| Korean | 16 | 0.2% |
| Mexican | 661 | 7.0% |
| Northern European | 12 | 0.1% |
| Norwegian | 65 | 0.7% |
| Polish | 88 | 0.9% |
| Potawatomi | 96 | 1.0% |
| Puerto Rican | 3 | 0.0% |
| Russian | 11 | 0.1% |
| Samoan | 5 | 0.1% |
| Scandinavian | 99 | 1.0% |
| Scotch-Irish | 39 | 0.4% |
| Scottish | 243 | 2.6% |
| Sioux | 42 | 0.4% |
| Spanish | 16 | 0.2% |
| Sri Lankan | 6 | 0.1% |
| Swedish | 6 | 0.1% |
| Swiss | 13 | 0.1% |
| Syrian | 11 | 0.1% |
| Thai | 5 | 0.1% |
| Welsh | 36 | 0.4% | View All 49 Rows |
Immigrants in Pryor Creek
The most numerous immigrant groups reported in Pryor Creek came from Central America (120 | 1.3%), Latin America (120 | 1.3%), Mexico (120 | 1.3%), Asia (23 | 0.2%), and South Eastern Asia (13 | 0.1%), together accounting for 4.2% of all Pryor Creek residents.
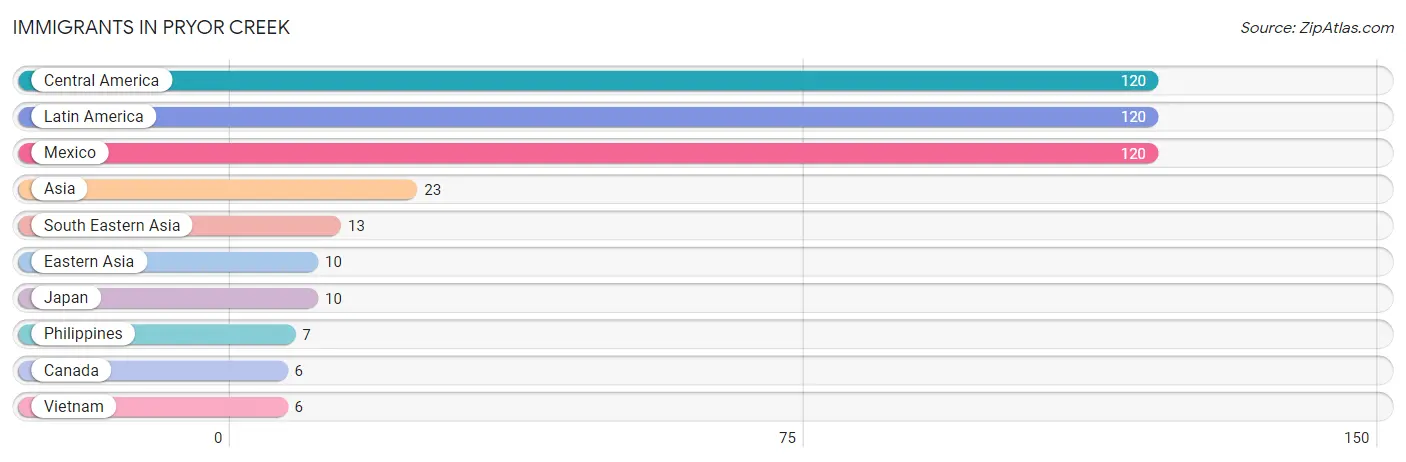
| Immigration Origin | # Population | % Population |
| Asia | 23 | 0.2% |
| Canada | 6 | 0.1% |
| Central America | 120 | 1.3% |
| Eastern Asia | 10 | 0.1% |
| Japan | 10 | 0.1% |
| Latin America | 120 | 1.3% |
| Mexico | 120 | 1.3% |
| Philippines | 7 | 0.1% |
| South Eastern Asia | 13 | 0.1% |
| Vietnam | 6 | 0.1% | View All 10 Rows |
Sex and Age in Pryor Creek
Sex and Age in Pryor Creek
The most populous age groups in Pryor Creek are 20 to 24 Years (436 | 9.5%) for men and 25 to 29 Years (490 | 10.0%) for women.
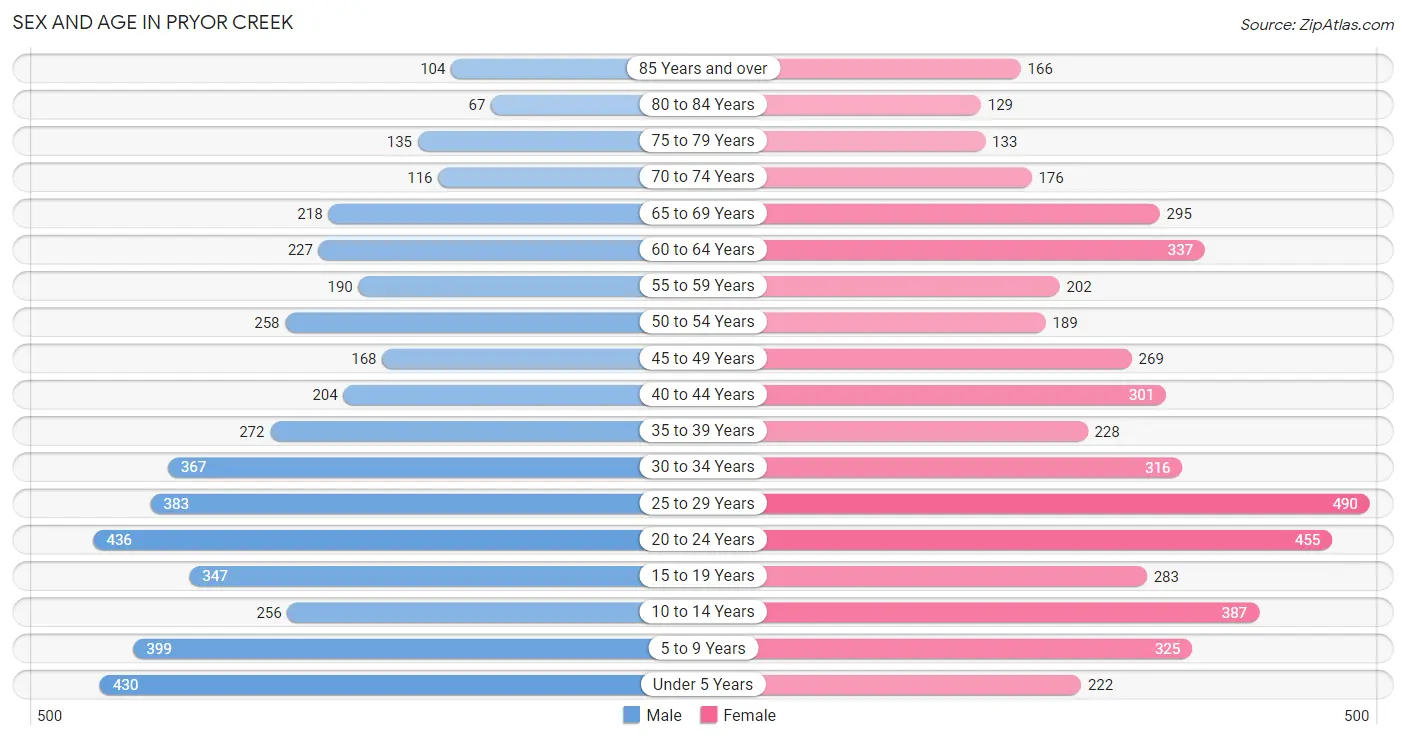
| Age Bracket | Male | Female |
| Under 5 Years | 430 (9.4%) | 222 (4.5%) |
| 5 to 9 Years | 399 (8.7%) | 325 (6.6%) |
| 10 to 14 Years | 256 (5.6%) | 387 (7.9%) |
| 15 to 19 Years | 347 (7.6%) | 283 (5.8%) |
| 20 to 24 Years | 436 (9.5%) | 455 (9.3%) |
| 25 to 29 Years | 383 (8.4%) | 490 (10.0%) |
| 30 to 34 Years | 367 (8.0%) | 316 (6.5%) |
| 35 to 39 Years | 272 (5.9%) | 228 (4.6%) |
| 40 to 44 Years | 204 (4.5%) | 301 (6.1%) |
| 45 to 49 Years | 168 (3.7%) | 269 (5.5%) |
| 50 to 54 Years | 258 (5.6%) | 189 (3.8%) |
| 55 to 59 Years | 190 (4.2%) | 202 (4.1%) |
| 60 to 64 Years | 227 (5.0%) | 337 (6.9%) |
| 65 to 69 Years | 218 (4.8%) | 295 (6.0%) |
| 70 to 74 Years | 116 (2.5%) | 176 (3.6%) |
| 75 to 79 Years | 135 (2.9%) | 133 (2.7%) |
| 80 to 84 Years | 67 (1.5%) | 129 (2.6%) |
| 85 Years and over | 104 (2.3%) | 166 (3.4%) |
| Total | 4,577 (100.0%) | 4,903 (100.0%) |
Families and Households in Pryor Creek
Median Family Size in Pryor Creek
The median family size in Pryor Creek is 2.99 persons per family, with married-couple families (1,463 | 60.9%) accounting for the largest median family size of 3.06 persons per family. On the other hand, single male/father families (223 | 9.3%) represent the smallest median family size with 2.62 persons per family.
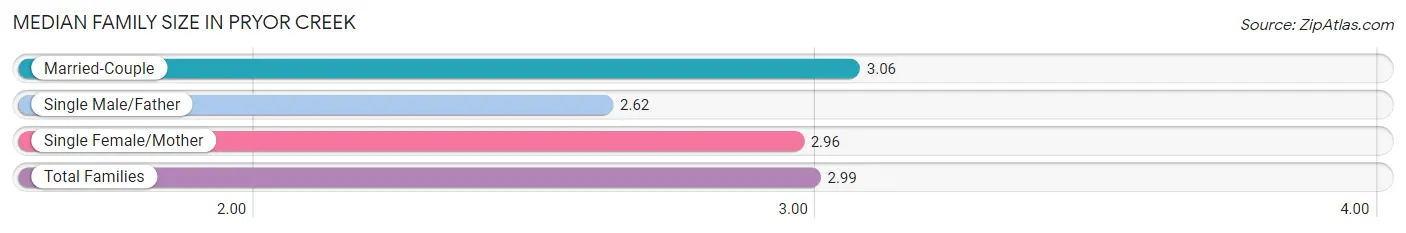
| Family Type | # Families | Family Size |
| Married-Couple | 1,463 (60.9%) | 3.06 |
| Single Male/Father | 223 (9.3%) | 2.62 |
| Single Female/Mother | 717 (29.8%) | 2.96 |
| Total Families | 2,403 (100.0%) | 2.99 |
Median Household Size in Pryor Creek
The median household size in Pryor Creek is 2.52 persons per household, with single male/father households (223 | 6.1%) accounting for the largest median household size of 3.24 persons per household. non-family households (1,246 | 34.2%) represent the smallest median household size with 1.21 persons per household.
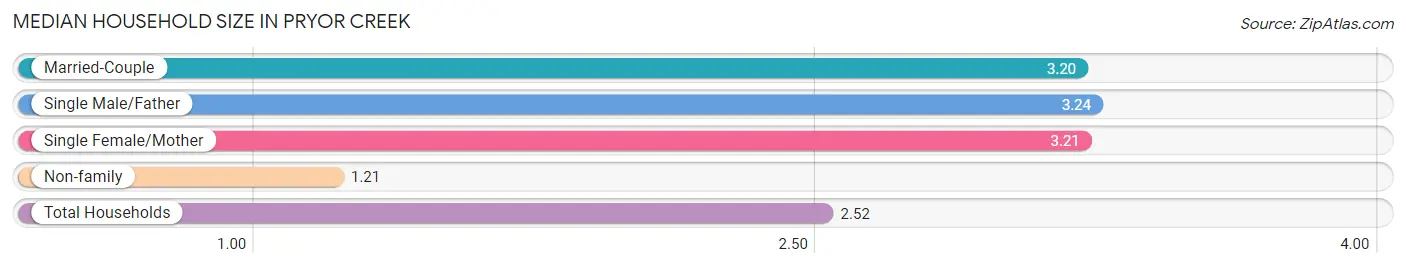
| Household Type | # Households | Household Size |
| Married-Couple | 1,463 (40.1%) | 3.20 |
| Single Male/Father | 223 (6.1%) | 3.24 |
| Single Female/Mother | 717 (19.7%) | 3.21 |
| Non-family | 1,246 (34.2%) | 1.21 |
| Total Households | 3,649 (100.0%) | 2.52 |
Household Size by Marriage Status in Pryor Creek
Out of a total of 3,649 households in Pryor Creek, 2,403 (65.8%) are family households, while 1,246 (34.2%) are nonfamily households. The most numerous type of family households are 2-person households, comprising 896, and the most common type of nonfamily households are 1-person households, comprising 1,089.
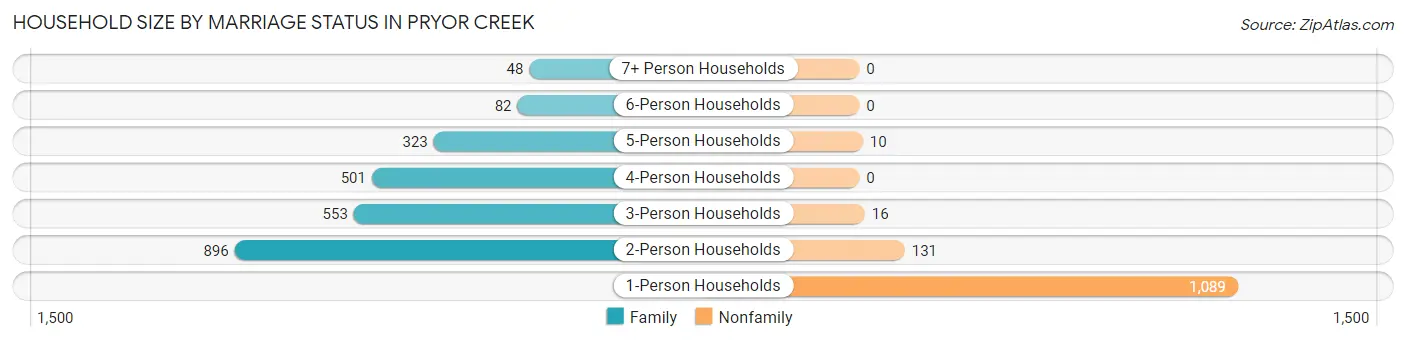
| Household Size | Family Households | Nonfamily Households |
| 1-Person Households | - | 1,089 (29.8%) |
| 2-Person Households | 896 (24.5%) | 131 (3.6%) |
| 3-Person Households | 553 (15.1%) | 16 (0.4%) |
| 4-Person Households | 501 (13.7%) | 0 (0.0%) |
| 5-Person Households | 323 (8.8%) | 10 (0.3%) |
| 6-Person Households | 82 (2.2%) | 0 (0.0%) |
| 7+ Person Households | 48 (1.3%) | 0 (0.0%) |
| Total | 2,403 (65.8%) | 1,246 (34.2%) |
Female Fertility in Pryor Creek
Fertility by Age in Pryor Creek
Average fertility rate in Pryor Creek is 59.0 births per 1,000 women. Women in the age bracket of 20 to 34 years have the highest fertility rate with 95.0 births per 1,000 women. Women in the age bracket of 20 to 34 years acount for 84.5% of all women with births.
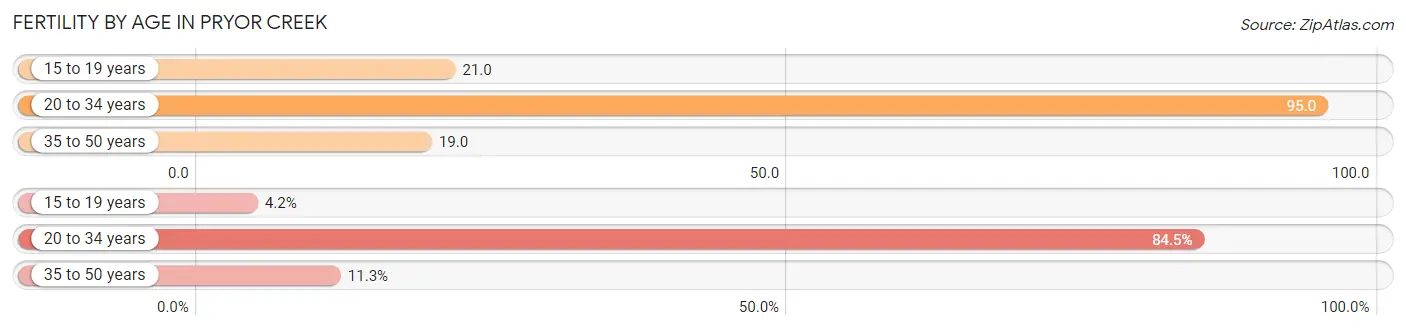
| Age Bracket | Women with Births | Births / 1,000 Women |
| 15 to 19 years | 6 (4.2%) | 21.0 |
| 20 to 34 years | 120 (84.5%) | 95.0 |
| 35 to 50 years | 16 (11.3%) | 19.0 |
| Total | 142 (100.0%) | 59.0 |
Fertility by Age by Marriage Status in Pryor Creek
40.8% of women with births (142) in Pryor Creek are married. The highest percentage of unmarried women with births falls into 35 to 50 years age bracket with 100.0% of them unmarried at the time of birth, while the lowest percentage of unmarried women with births belong to 15 to 19 years age bracket with 0.0% of them unmarried.
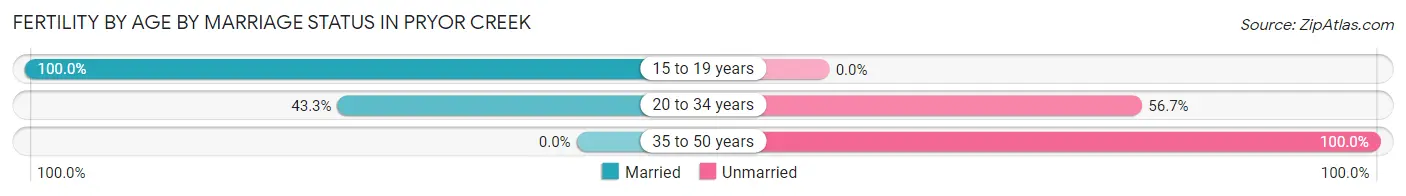
| Age Bracket | Married | Unmarried |
| 15 to 19 years | 6 (100.0%) | 0 (0.0%) |
| 20 to 34 years | 52 (43.3%) | 68 (56.7%) |
| 35 to 50 years | 0 (0.0%) | 16 (100.0%) |
| Total | 58 (40.8%) | 84 (59.2%) |
Fertility by Education in Pryor Creek
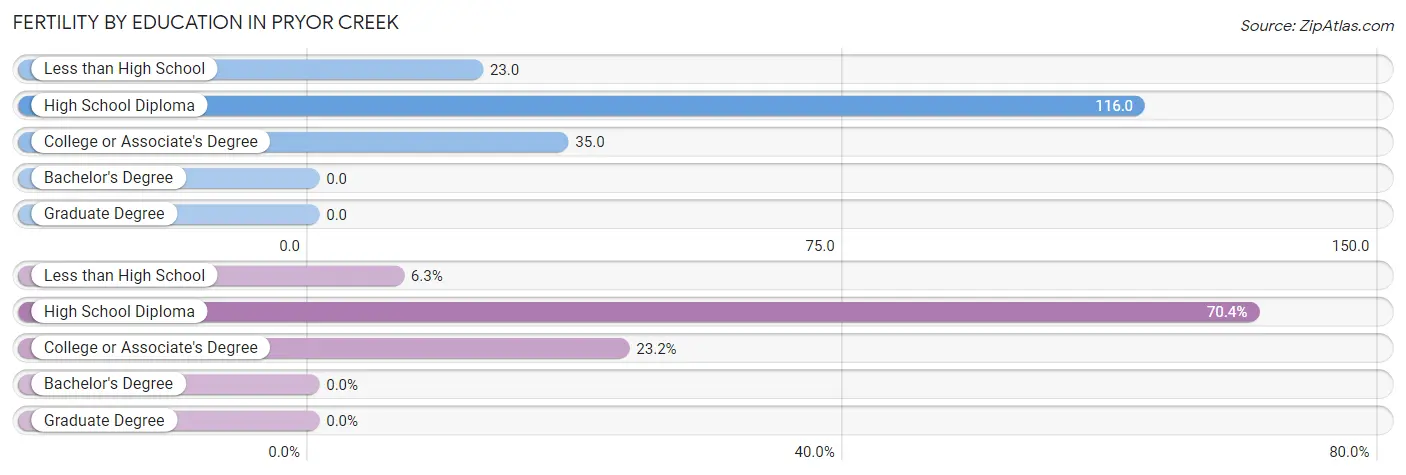
| Educational Attainment | Women with Births | Births / 1,000 Women |
| Less than High School | 9 (6.3%) | 23.0 |
| High School Diploma | 100 (70.4%) | 116.0 |
| College or Associate's Degree | 33 (23.2%) | 35.0 |
| Bachelor's Degree | 0 (0.0%) | 0.0 |
| Graduate Degree | 0 (0.0%) | 0.0 |
| Total | 142 (100.0%) | 59.0 |
Fertility by Education by Marriage Status in Pryor Creek
59.2% of women with births in Pryor Creek are unmarried. Women with the educational attainment of less than high school are most likely to be married with 100.0% of them married at childbirth, while women with the educational attainment of high school diploma are least likely to be married with 66.0% of them unmarried at childbirth.
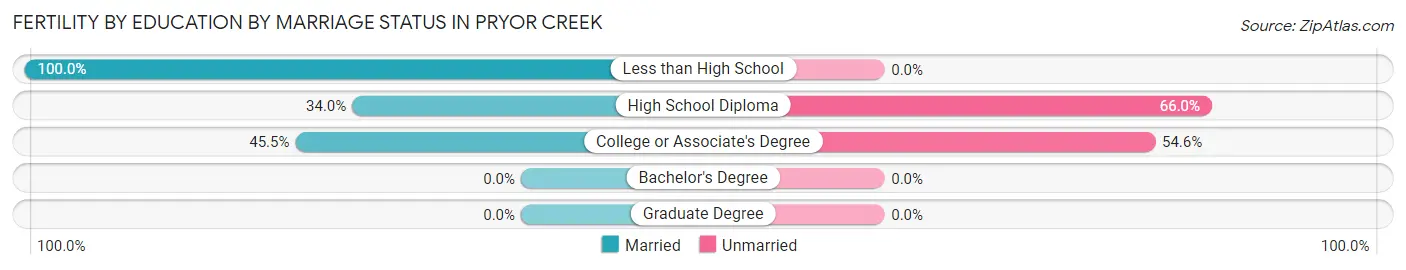
| Educational Attainment | Married | Unmarried |
| Less than High School | 9 (100.0%) | 0 (0.0%) |
| High School Diploma | 34 (34.0%) | 66 (66.0%) |
| College or Associate's Degree | 15 (45.5%) | 18 (54.5%) |
| Bachelor's Degree | 0 (0.0%) | 0 (0.0%) |
| Graduate Degree | 0 (0.0%) | 0 (0.0%) |
| Total | 58 (40.8%) | 84 (59.2%) |
Employment Characteristics in Pryor Creek
Employment by Class of Employer in Pryor Creek
Among the 3,867 employed individuals in Pryor Creek, private company employees (3,033 | 78.4%), self-employed (not incorporated) (225 | 5.8%), and not-for-profit organizations (182 | 4.7%) make up the most common classes of employment.
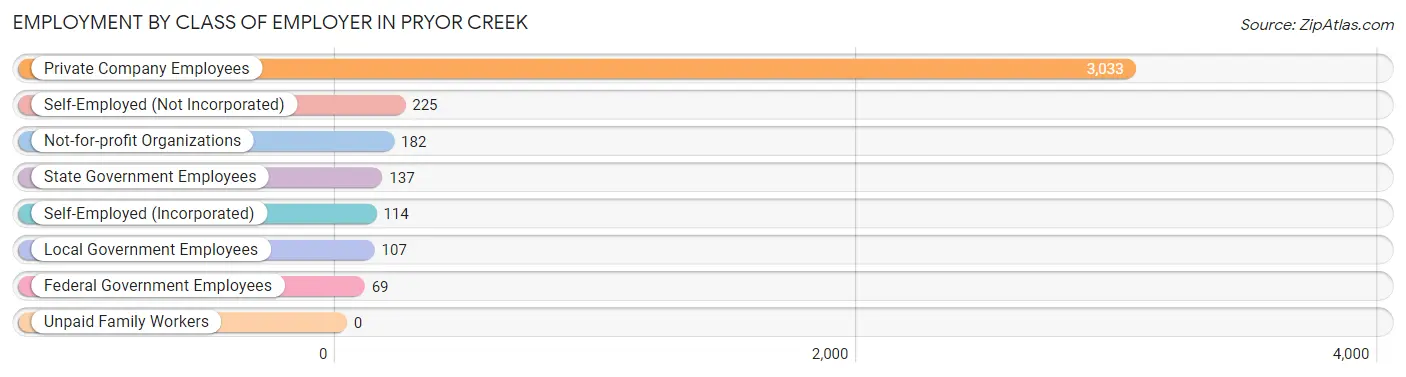
| Employer Class | # Employees | % Employees |
| Private Company Employees | 3,033 | 78.4% |
| Self-Employed (Incorporated) | 114 | 2.9% |
| Self-Employed (Not Incorporated) | 225 | 5.8% |
| Not-for-profit Organizations | 182 | 4.7% |
| Local Government Employees | 107 | 2.8% |
| State Government Employees | 137 | 3.5% |
| Federal Government Employees | 69 | 1.8% |
| Unpaid Family Workers | 0 | 0.0% |
| Total | 3,867 | 100.0% |
Employment Status by Age in Pryor Creek
According to the labor force statistics for Pryor Creek, out of the total population over 16 years of age (7,344), 57.7% or 4,237 individuals are in the labor force, with 8.2% or 347 of them unemployed. The age group with the highest labor force participation rate is 20 to 24 years, with 80.8% or 720 individuals in the labor force. Within the labor force, the 16 to 19 years age range has the highest percentage of unemployed individuals, with 47.5% or 95 of them being unemployed.
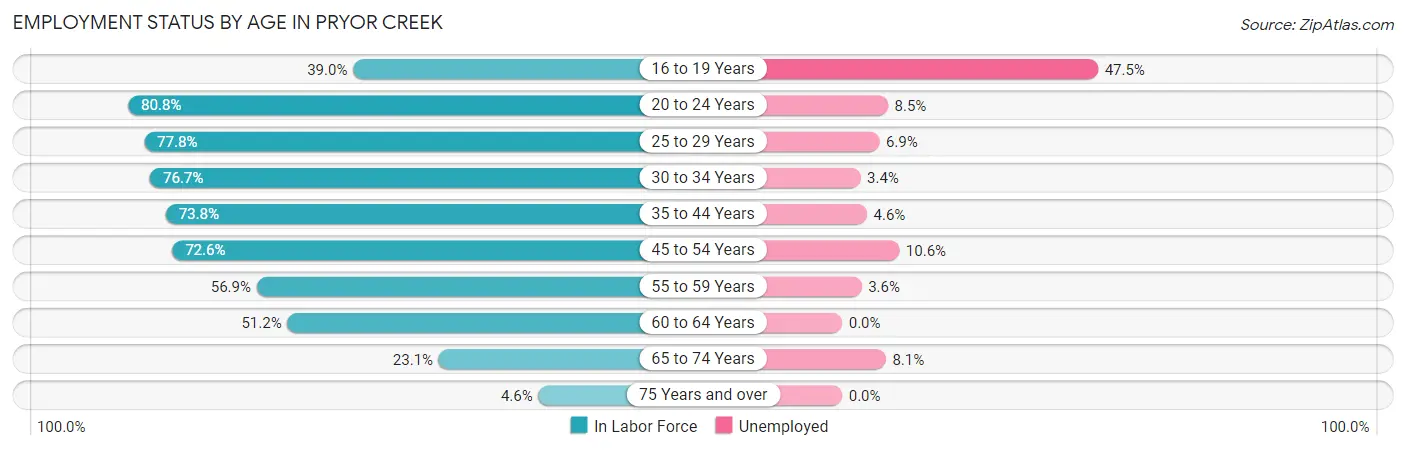
| Age Bracket | In Labor Force | Unemployed |
| 16 to 19 Years | 200 (39.0%) | 95 (47.5%) |
| 20 to 24 Years | 720 (80.8%) | 61 (8.5%) |
| 25 to 29 Years | 679 (77.8%) | 47 (6.9%) |
| 30 to 34 Years | 524 (76.7%) | 18 (3.4%) |
| 35 to 44 Years | 742 (73.8%) | 34 (4.6%) |
| 45 to 54 Years | 642 (72.6%) | 68 (10.6%) |
| 55 to 59 Years | 223 (56.9%) | 8 (3.6%) |
| 60 to 64 Years | 289 (51.2%) | 0 (0.0%) |
| 65 to 74 Years | 186 (23.1%) | 15 (8.1%) |
| 75 Years and over | 34 (4.6%) | 0 (0.0%) |
| Total | 4,237 (57.7%) | 347 (8.2%) |
Employment Status by Educational Attainment in Pryor Creek
According to labor force statistics for Pryor Creek, 70.4% of individuals (3,098) out of the total population between 25 and 64 years of age (4,401) are in the labor force, with 5.6% or 173 of them being unemployed. The group with the highest labor force participation rate are those with the educational attainment of bachelor's degree or higher, with 77.5% or 531 individuals in the labor force. Within the labor force, individuals with less than high school education have the highest percentage of unemployment, with 8.7% or 20 of them being unemployed.
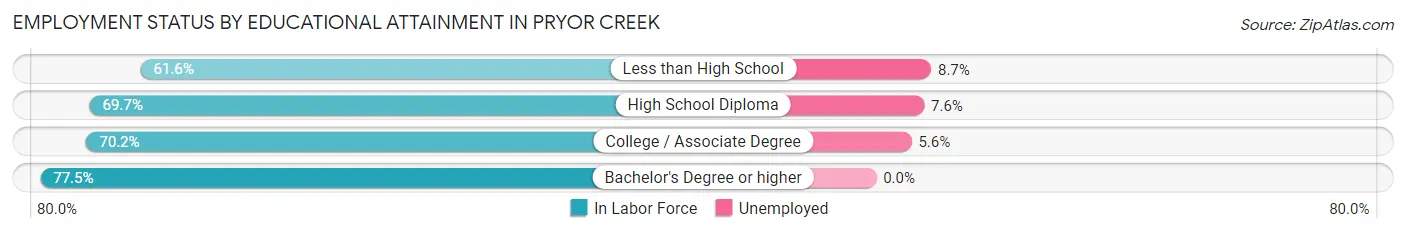
| Educational Attainment | In Labor Force | Unemployed |
| Less than High School | 231 (61.6%) | 33 (8.7%) |
| High School Diploma | 1,230 (69.7%) | 134 (7.6%) |
| College / Associate Degree | 1,106 (70.2%) | 88 (5.6%) |
| Bachelor's Degree or higher | 531 (77.5%) | 0 (0.0%) |
| Total | 3,098 (70.4%) | 246 (5.6%) |
Employment Occupations by Sex in Pryor Creek
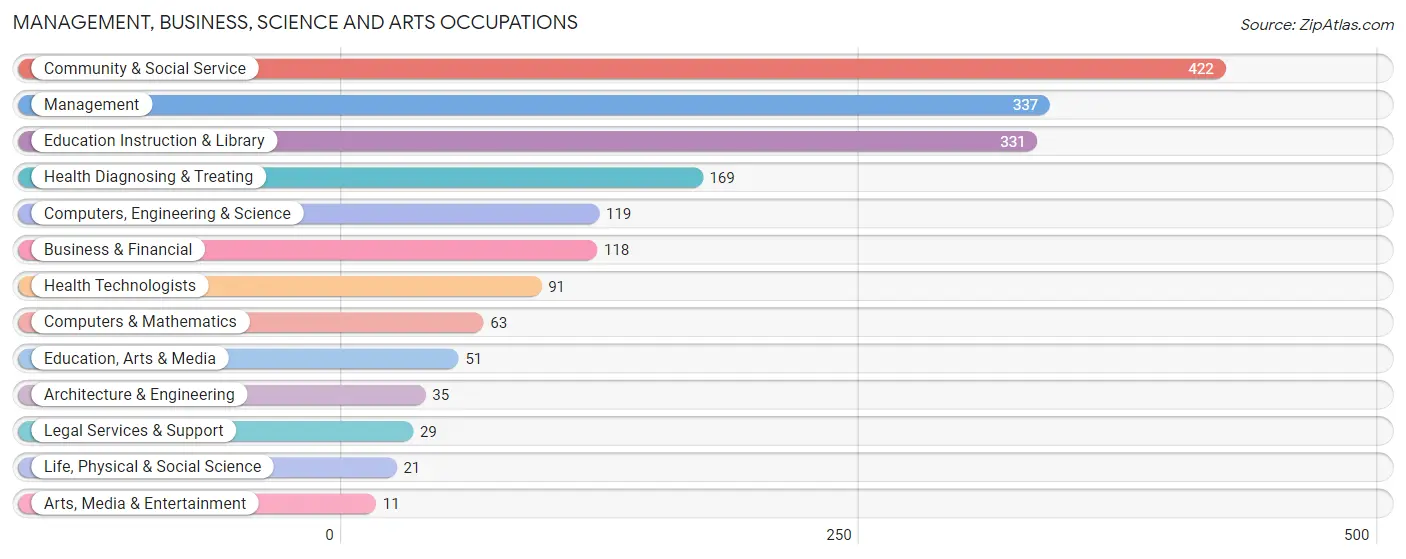
Management, Business, Science and Arts Occupations
The most common Management, Business, Science and Arts occupations in Pryor Creek are Community & Social Service (422 | 10.8%), Management (337 | 8.7%), Education Instruction & Library (331 | 8.5%), Health Diagnosing & Treating (169 | 4.3%), and Computers, Engineering & Science (119 | 3.1%).
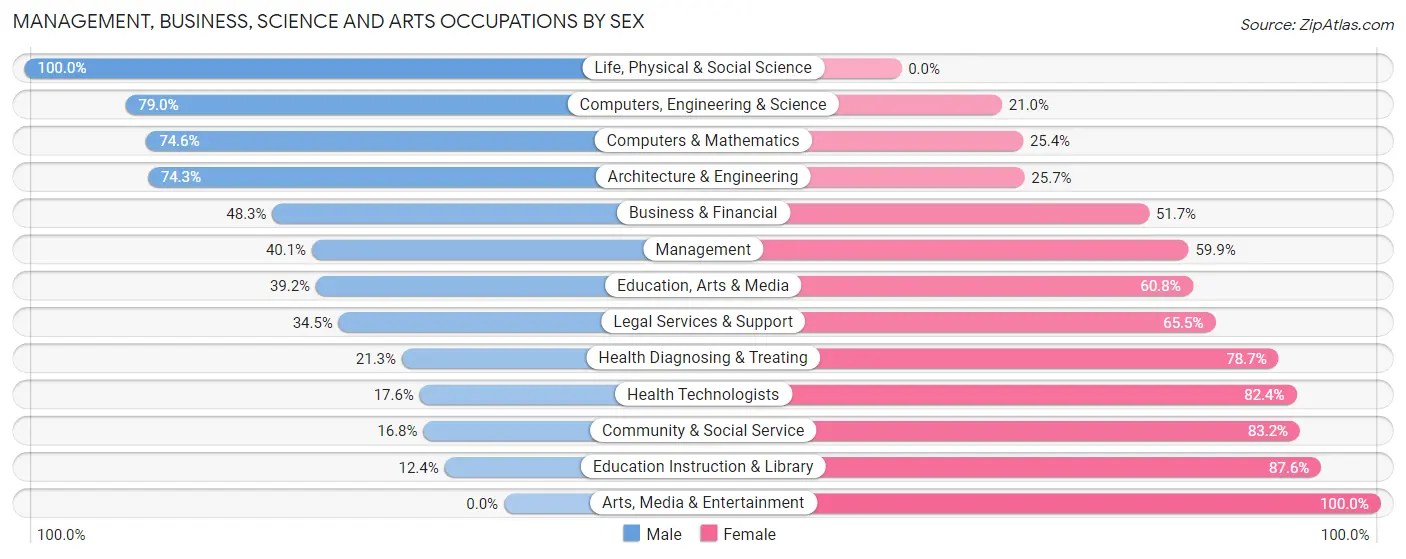
Management, Business, Science and Arts Occupations by Sex
Within the Management, Business, Science and Arts occupations in Pryor Creek, the most male-oriented occupations are Life, Physical & Social Science (100.0%), Computers, Engineering & Science (79.0%), and Computers & Mathematics (74.6%), while the most female-oriented occupations are Arts, Media & Entertainment (100.0%), Education Instruction & Library (87.6%), and Community & Social Service (83.2%).
| Occupation | Male | Female |
| Management | 135 (40.1%) | 202 (59.9%) |
| Business & Financial | 57 (48.3%) | 61 (51.7%) |
| Computers, Engineering & Science | 94 (79.0%) | 25 (21.0%) |
| Computers & Mathematics | 47 (74.6%) | 16 (25.4%) |
| Architecture & Engineering | 26 (74.3%) | 9 (25.7%) |
| Life, Physical & Social Science | 21 (100.0%) | 0 (0.0%) |
| Community & Social Service | 71 (16.8%) | 351 (83.2%) |
| Education, Arts & Media | 20 (39.2%) | 31 (60.8%) |
| Legal Services & Support | 10 (34.5%) | 19 (65.5%) |
| Education Instruction & Library | 41 (12.4%) | 290 (87.6%) |
| Arts, Media & Entertainment | 0 (0.0%) | 11 (100.0%) |
| Health Diagnosing & Treating | 36 (21.3%) | 133 (78.7%) |
| Health Technologists | 16 (17.6%) | 75 (82.4%) |
| Total (Category) | 393 (33.7%) | 772 (66.3%) |
| Total (Overall) | 1,888 (48.5%) | 2,005 (51.5%) |
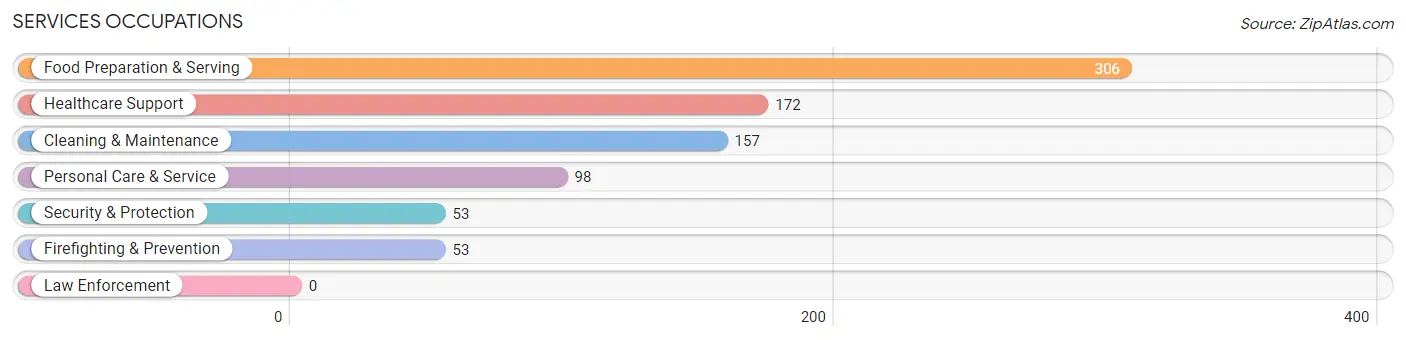
Services Occupations
The most common Services occupations in Pryor Creek are Food Preparation & Serving (306 | 7.9%), Healthcare Support (172 | 4.4%), Cleaning & Maintenance (157 | 4.0%), Personal Care & Service (98 | 2.5%), and Security & Protection (53 | 1.4%).
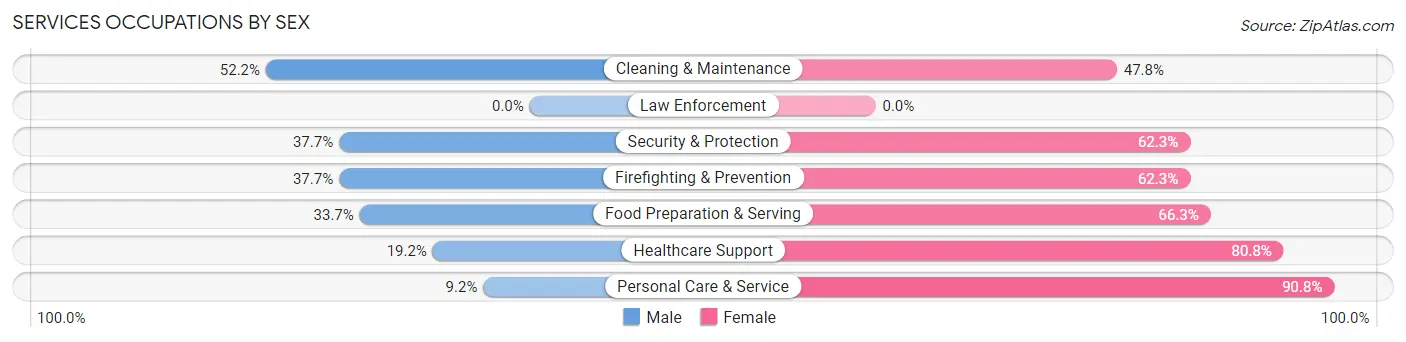
Services Occupations by Sex
Within the Services occupations in Pryor Creek, the most male-oriented occupations are Cleaning & Maintenance (52.2%), Security & Protection (37.7%), and Firefighting & Prevention (37.7%), while the most female-oriented occupations are Personal Care & Service (90.8%), Healthcare Support (80.8%), and Food Preparation & Serving (66.3%).
| Occupation | Male | Female |
| Healthcare Support | 33 (19.2%) | 139 (80.8%) |
| Security & Protection | 20 (37.7%) | 33 (62.3%) |
| Firefighting & Prevention | 20 (37.7%) | 33 (62.3%) |
| Law Enforcement | 0 (0.0%) | 0 (0.0%) |
| Food Preparation & Serving | 103 (33.7%) | 203 (66.3%) |
| Cleaning & Maintenance | 82 (52.2%) | 75 (47.8%) |
| Personal Care & Service | 9 (9.2%) | 89 (90.8%) |
| Total (Category) | 247 (31.4%) | 539 (68.6%) |
| Total (Overall) | 1,888 (48.5%) | 2,005 (51.5%) |
Sales and Office Occupations
The most common Sales and Office occupations in Pryor Creek are Office & Administration (359 | 9.2%), and Sales & Related (304 | 7.8%).

Sales and Office Occupations by Sex

| Occupation | Male | Female |
| Sales & Related | 49 (16.1%) | 255 (83.9%) |
| Office & Administration | 60 (16.7%) | 299 (83.3%) |
| Total (Category) | 109 (16.4%) | 554 (83.6%) |
| Total (Overall) | 1,888 (48.5%) | 2,005 (51.5%) |
Natural Resources, Construction and Maintenance Occupations
The most common Natural Resources, Construction and Maintenance occupations in Pryor Creek are Construction & Extraction (207 | 5.3%), and Installation, Maintenance & Repair (189 | 4.9%).
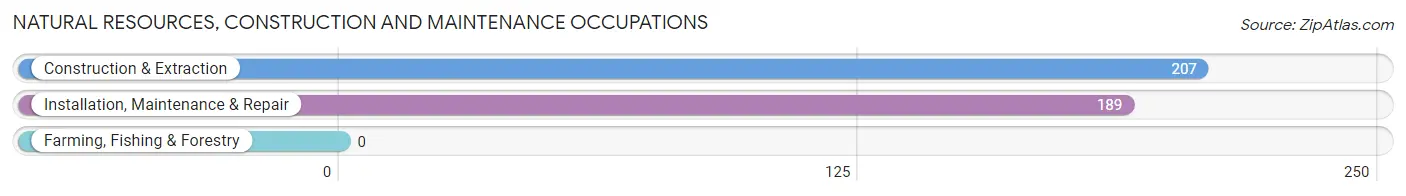
Natural Resources, Construction and Maintenance Occupations by Sex
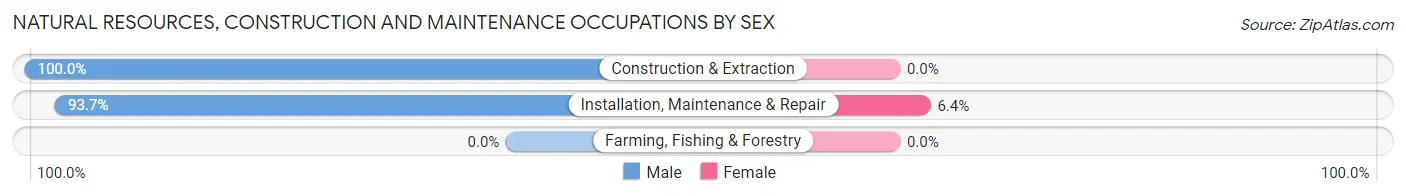
| Occupation | Male | Female |
| Farming, Fishing & Forestry | 0 (0.0%) | 0 (0.0%) |
| Construction & Extraction | 207 (100.0%) | 0 (0.0%) |
| Installation, Maintenance & Repair | 177 (93.6%) | 12 (6.4%) |
| Total (Category) | 384 (97.0%) | 12 (3.0%) |
| Total (Overall) | 1,888 (48.5%) | 2,005 (51.5%) |
Production, Transportation and Moving Occupations
The most common Production, Transportation and Moving occupations in Pryor Creek are Production (471 | 12.1%), Material Moving (303 | 7.8%), and Transportation (109 | 2.8%).
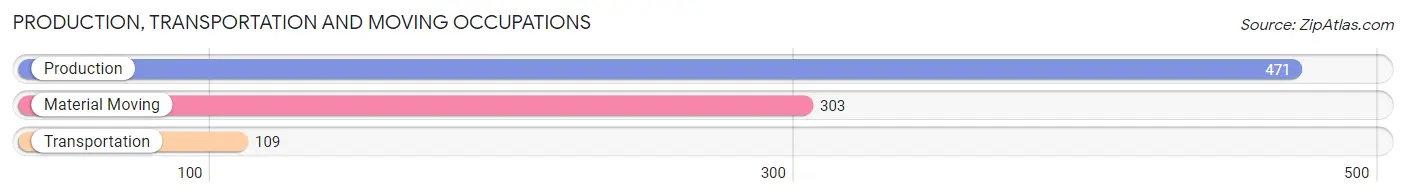
Production, Transportation and Moving Occupations by Sex
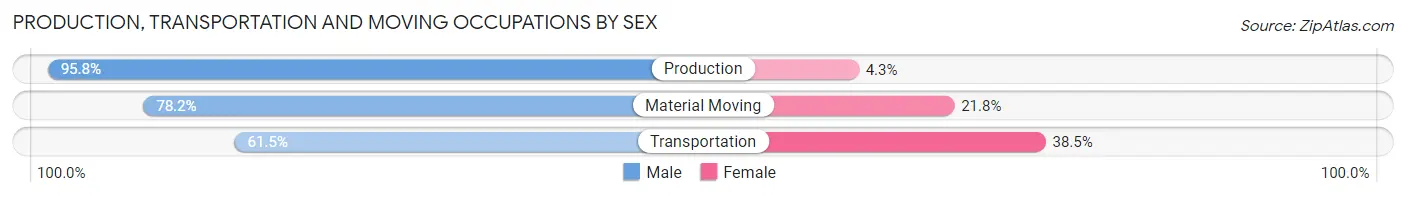
| Occupation | Male | Female |
| Production | 451 (95.8%) | 20 (4.3%) |
| Transportation | 67 (61.5%) | 42 (38.5%) |
| Material Moving | 237 (78.2%) | 66 (21.8%) |
| Total (Category) | 755 (85.5%) | 128 (14.5%) |
| Total (Overall) | 1,888 (48.5%) | 2,005 (51.5%) |
Employment Industries by Sex in Pryor Creek
Employment Industries in Pryor Creek
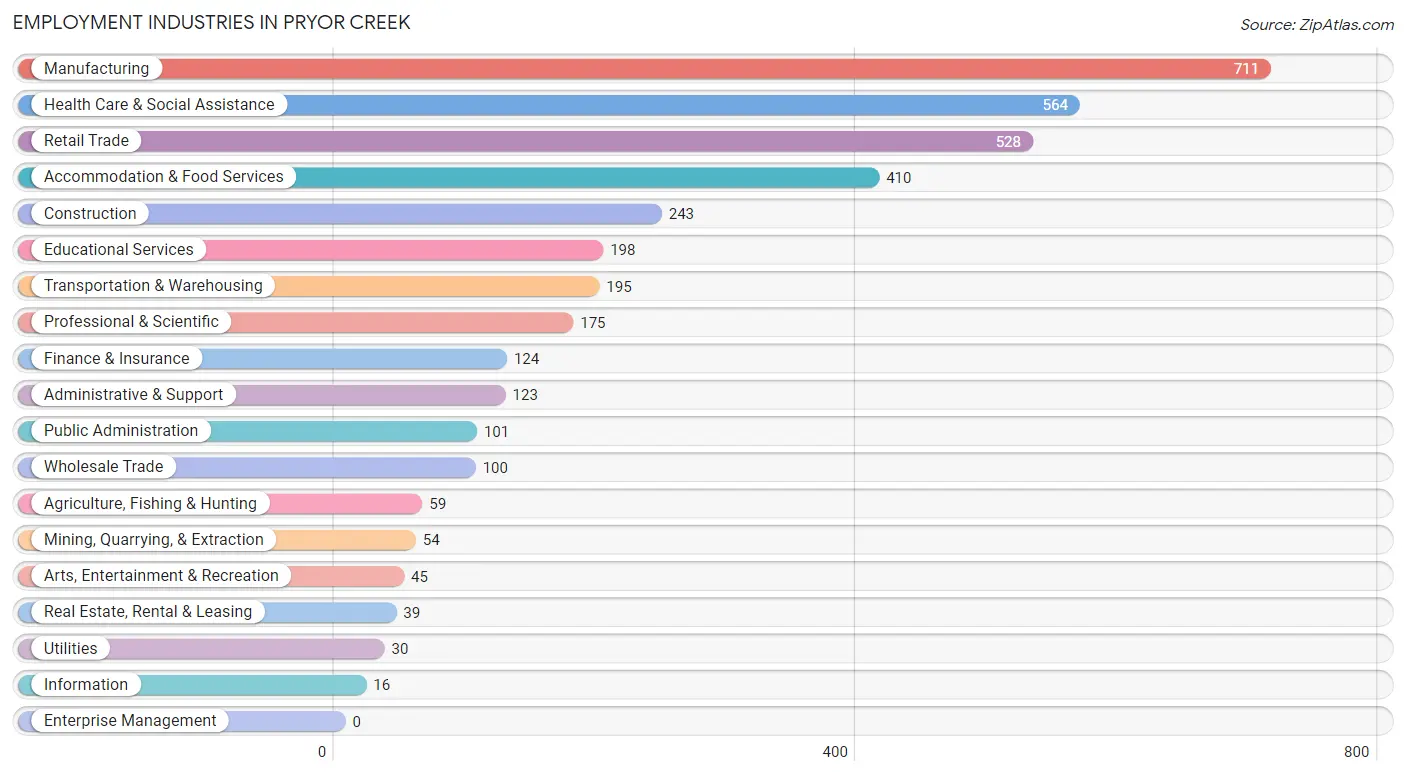
The major employment industries in Pryor Creek include Manufacturing (711 | 18.3%), Health Care & Social Assistance (564 | 14.5%), Retail Trade (528 | 13.6%), Accommodation & Food Services (410 | 10.5%), and Construction (243 | 6.2%).
Employment Industries by Sex in Pryor Creek
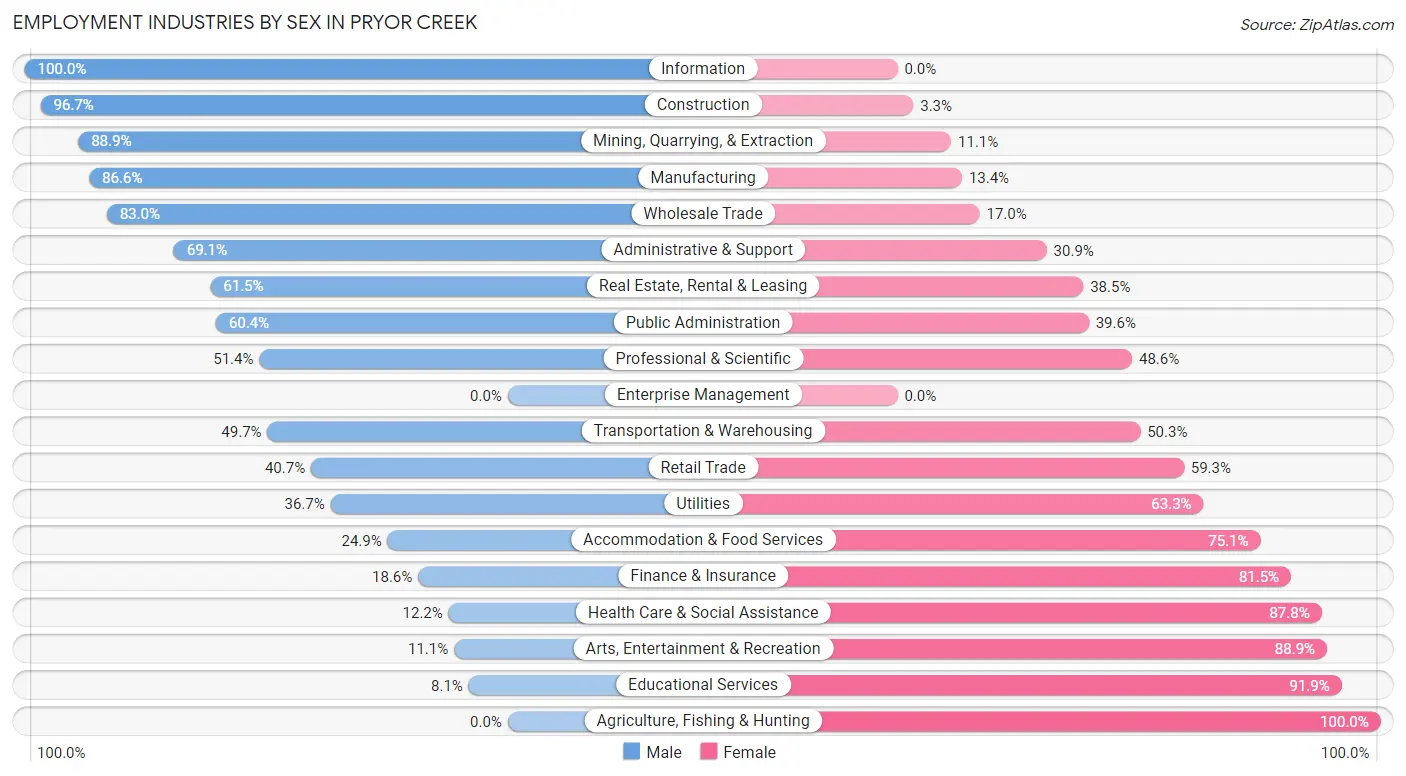
The Pryor Creek industries that see more men than women are Information (100.0%), Construction (96.7%), and Mining, Quarrying, & Extraction (88.9%), whereas the industries that tend to have a higher number of women are Agriculture, Fishing & Hunting (100.0%), Educational Services (91.9%), and Arts, Entertainment & Recreation (88.9%).
| Industry | Male | Female |
| Agriculture, Fishing & Hunting | 0 (0.0%) | 59 (100.0%) |
| Mining, Quarrying, & Extraction | 48 (88.9%) | 6 (11.1%) |
| Construction | 235 (96.7%) | 8 (3.3%) |
| Manufacturing | 616 (86.6%) | 95 (13.4%) |
| Wholesale Trade | 83 (83.0%) | 17 (17.0%) |
| Retail Trade | 215 (40.7%) | 313 (59.3%) |
| Transportation & Warehousing | 97 (49.7%) | 98 (50.3%) |
| Utilities | 11 (36.7%) | 19 (63.3%) |
| Information | 16 (100.0%) | 0 (0.0%) |
| Finance & Insurance | 23 (18.5%) | 101 (81.5%) |
| Real Estate, Rental & Leasing | 24 (61.5%) | 15 (38.5%) |
| Professional & Scientific | 90 (51.4%) | 85 (48.6%) |
| Enterprise Management | 0 (0.0%) | 0 (0.0%) |
| Administrative & Support | 85 (69.1%) | 38 (30.9%) |
| Educational Services | 16 (8.1%) | 182 (91.9%) |
| Health Care & Social Assistance | 69 (12.2%) | 495 (87.8%) |
| Arts, Entertainment & Recreation | 5 (11.1%) | 40 (88.9%) |
| Accommodation & Food Services | 102 (24.9%) | 308 (75.1%) |
| Public Administration | 61 (60.4%) | 40 (39.6%) |
| Total | 1,888 (48.5%) | 2,005 (51.5%) |
Education in Pryor Creek
School Enrollment in Pryor Creek
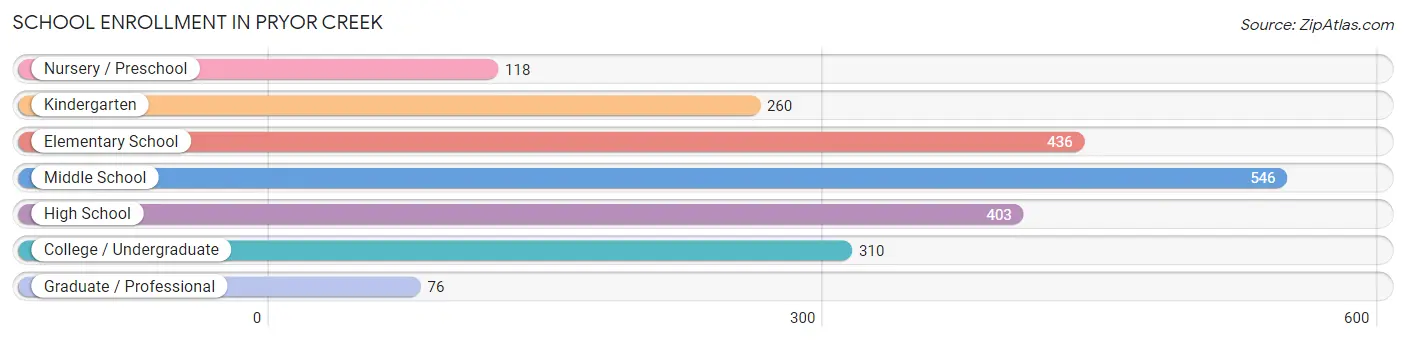
The most common levels of schooling among the 2,149 students in Pryor Creek are middle school (546 | 25.4%), elementary school (436 | 20.3%), and high school (403 | 18.8%).
| School Level | # Students | % Students |
| Nursery / Preschool | 118 | 5.5% |
| Kindergarten | 260 | 12.1% |
| Elementary School | 436 | 20.3% |
| Middle School | 546 | 25.4% |
| High School | 403 | 18.8% |
| College / Undergraduate | 310 | 14.4% |
| Graduate / Professional | 76 | 3.5% |
| Total | 2,149 | 100.0% |
School Enrollment by Age by Funding Source in Pryor Creek
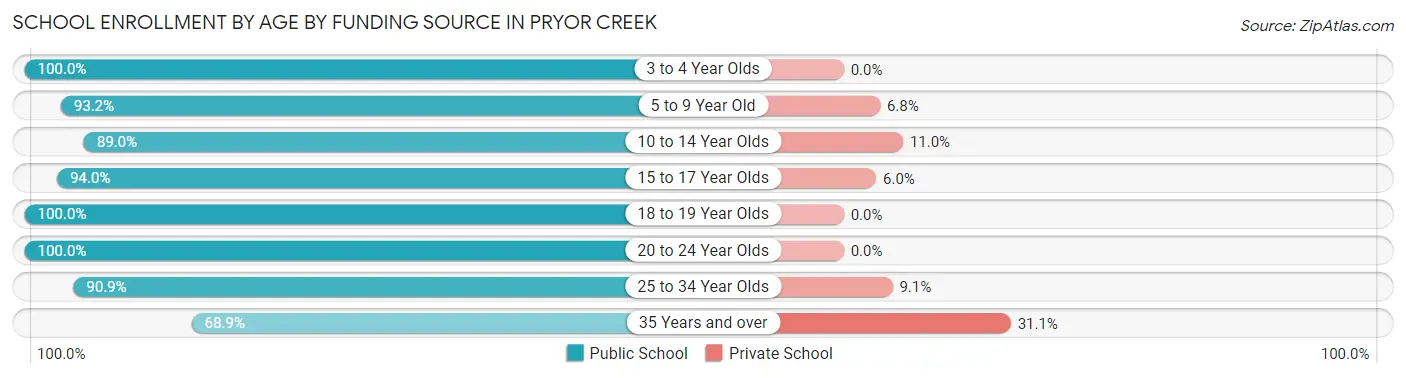
Out of a total of 2,149 students who are enrolled in schools in Pryor Creek, 159 (7.4%) attend a private institution, while the remaining 1,990 (92.6%) are enrolled in public schools. The age group of 35 years and over has the highest likelihood of being enrolled in private schools, with 14 (31.1% in the age bracket) enrolled. Conversely, the age group of 3 to 4 year olds has the lowest likelihood of being enrolled in a private school, with 56 (100.0% in the age bracket) attending a public institution.
| Age Bracket | Public School | Private School |
| 3 to 4 Year Olds | 56 (100.0%) | 0 (0.0%) |
| 5 to 9 Year Old | 607 (93.2%) | 44 (6.8%) |
| 10 to 14 Year Olds | 572 (89.0%) | 71 (11.0%) |
| 15 to 17 Year Olds | 311 (94.0%) | 20 (6.0%) |
| 18 to 19 Year Olds | 146 (100.0%) | 0 (0.0%) |
| 20 to 24 Year Olds | 167 (100.0%) | 0 (0.0%) |
| 25 to 34 Year Olds | 100 (90.9%) | 10 (9.1%) |
| 35 Years and over | 31 (68.9%) | 14 (31.1%) |
| Total | 1,990 (92.6%) | 159 (7.4%) |
Educational Attainment by Field of Study in Pryor Creek
Business (217 | 22.3%), arts & humanities (154 | 15.8%), education (125 | 12.8%), engineering (116 | 11.9%), and science & technology (64 | 6.6%) are the most common fields of study among 975 individuals in Pryor Creek who have obtained a bachelor's degree or higher.
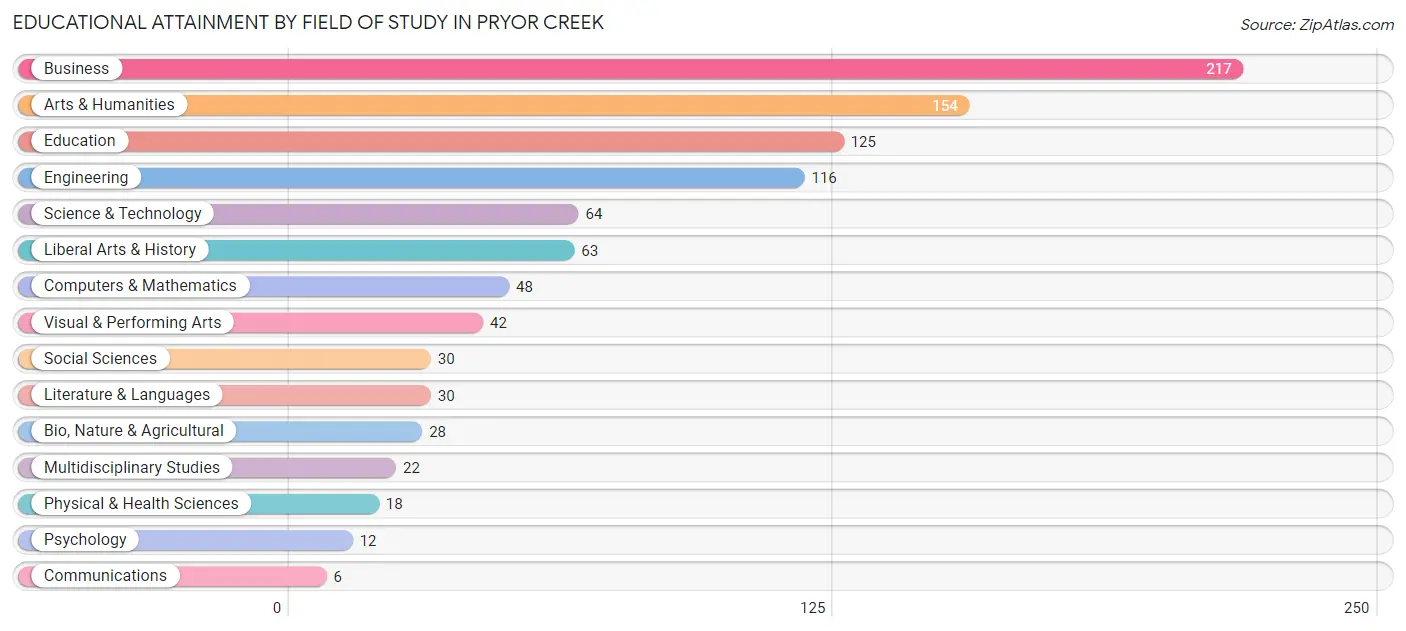
| Field of Study | # Graduates | % Graduates |
| Computers & Mathematics | 48 | 4.9% |
| Bio, Nature & Agricultural | 28 | 2.9% |
| Physical & Health Sciences | 18 | 1.8% |
| Psychology | 12 | 1.2% |
| Social Sciences | 30 | 3.1% |
| Engineering | 116 | 11.9% |
| Multidisciplinary Studies | 22 | 2.3% |
| Science & Technology | 64 | 6.6% |
| Business | 217 | 22.3% |
| Education | 125 | 12.8% |
| Literature & Languages | 30 | 3.1% |
| Liberal Arts & History | 63 | 6.5% |
| Visual & Performing Arts | 42 | 4.3% |
| Communications | 6 | 0.6% |
| Arts & Humanities | 154 | 15.8% |
| Total | 975 | 100.0% |
Transportation & Commute in Pryor Creek
Vehicle Availability by Sex in Pryor Creek
The most prevalent vehicle ownership categories in Pryor Creek are males with 2 vehicles (744, accounting for 39.8%) and females with 2 vehicles (689, making up 37.3%).
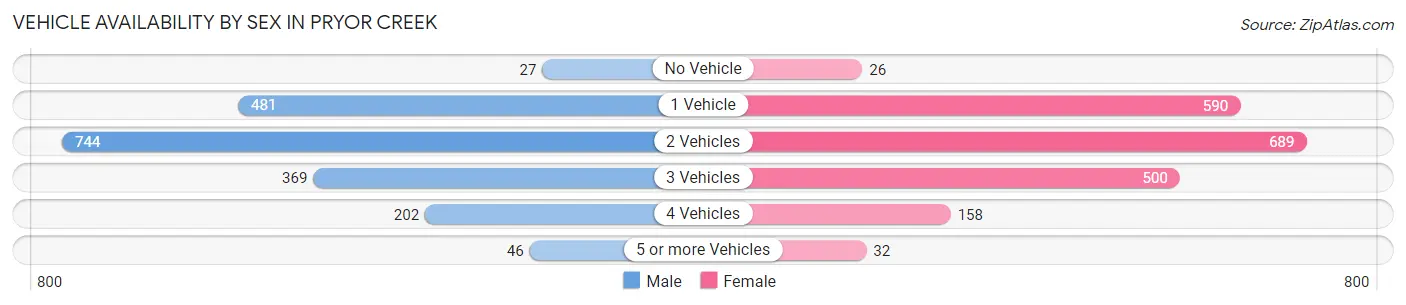
| Vehicles Available | Male | Female |
| No Vehicle | 27 (1.4%) | 26 (1.3%) |
| 1 Vehicle | 481 (25.7%) | 590 (29.6%) |
| 2 Vehicles | 744 (39.8%) | 689 (34.5%) |
| 3 Vehicles | 369 (19.7%) | 500 (25.1%) |
| 4 Vehicles | 202 (10.8%) | 158 (7.9%) |
| 5 or more Vehicles | 46 (2.5%) | 32 (1.6%) |
| Total | 1,869 (100.0%) | 1,995 (100.0%) |
Commute Time in Pryor Creek
The most frequently occuring commute durations in Pryor Creek are 10 to 14 minutes (901 commuters, 25.4%), 5 to 9 minutes (599 commuters, 16.9%), and 15 to 19 minutes (566 commuters, 15.9%).
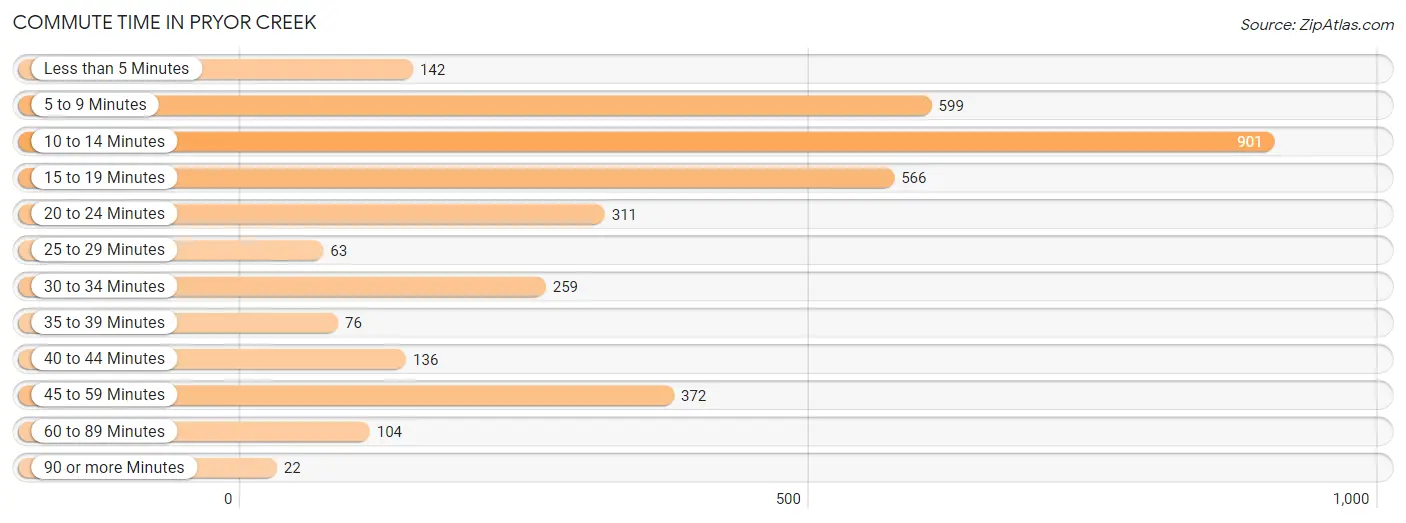
| Commute Time | # Commuters | % Commuters |
| Less than 5 Minutes | 142 | 4.0% |
| 5 to 9 Minutes | 599 | 16.9% |
| 10 to 14 Minutes | 901 | 25.4% |
| 15 to 19 Minutes | 566 | 15.9% |
| 20 to 24 Minutes | 311 | 8.8% |
| 25 to 29 Minutes | 63 | 1.8% |
| 30 to 34 Minutes | 259 | 7.3% |
| 35 to 39 Minutes | 76 | 2.1% |
| 40 to 44 Minutes | 136 | 3.8% |
| 45 to 59 Minutes | 372 | 10.5% |
| 60 to 89 Minutes | 104 | 2.9% |
| 90 or more Minutes | 22 | 0.6% |
Commute Time by Sex in Pryor Creek
The most common commute times in Pryor Creek are 10 to 14 minutes (427 commuters, 23.5%) for males and 10 to 14 minutes (474 commuters, 27.4%) for females.
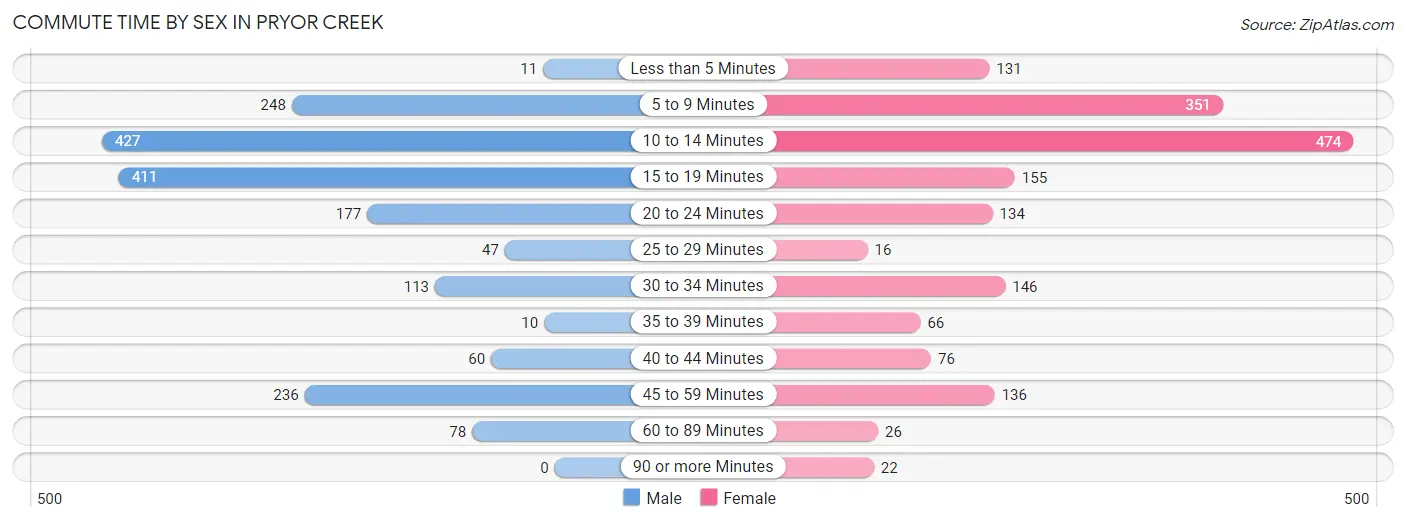
| Commute Time | Male | Female |
| Less than 5 Minutes | 11 (0.6%) | 131 (7.6%) |
| 5 to 9 Minutes | 248 (13.6%) | 351 (20.3%) |
| 10 to 14 Minutes | 427 (23.5%) | 474 (27.4%) |
| 15 to 19 Minutes | 411 (22.6%) | 155 (8.9%) |
| 20 to 24 Minutes | 177 (9.7%) | 134 (7.7%) |
| 25 to 29 Minutes | 47 (2.6%) | 16 (0.9%) |
| 30 to 34 Minutes | 113 (6.2%) | 146 (8.4%) |
| 35 to 39 Minutes | 10 (0.5%) | 66 (3.8%) |
| 40 to 44 Minutes | 60 (3.3%) | 76 (4.4%) |
| 45 to 59 Minutes | 236 (13.0%) | 136 (7.9%) |
| 60 to 89 Minutes | 78 (4.3%) | 26 (1.5%) |
| 90 or more Minutes | 0 (0.0%) | 22 (1.3%) |
Time of Departure to Work by Sex in Pryor Creek
The most frequent times of departure to work in Pryor Creek are 5:30 AM to 5:59 AM (300, 16.5%) for males and 7:30 AM to 7:59 AM (275, 15.9%) for females.
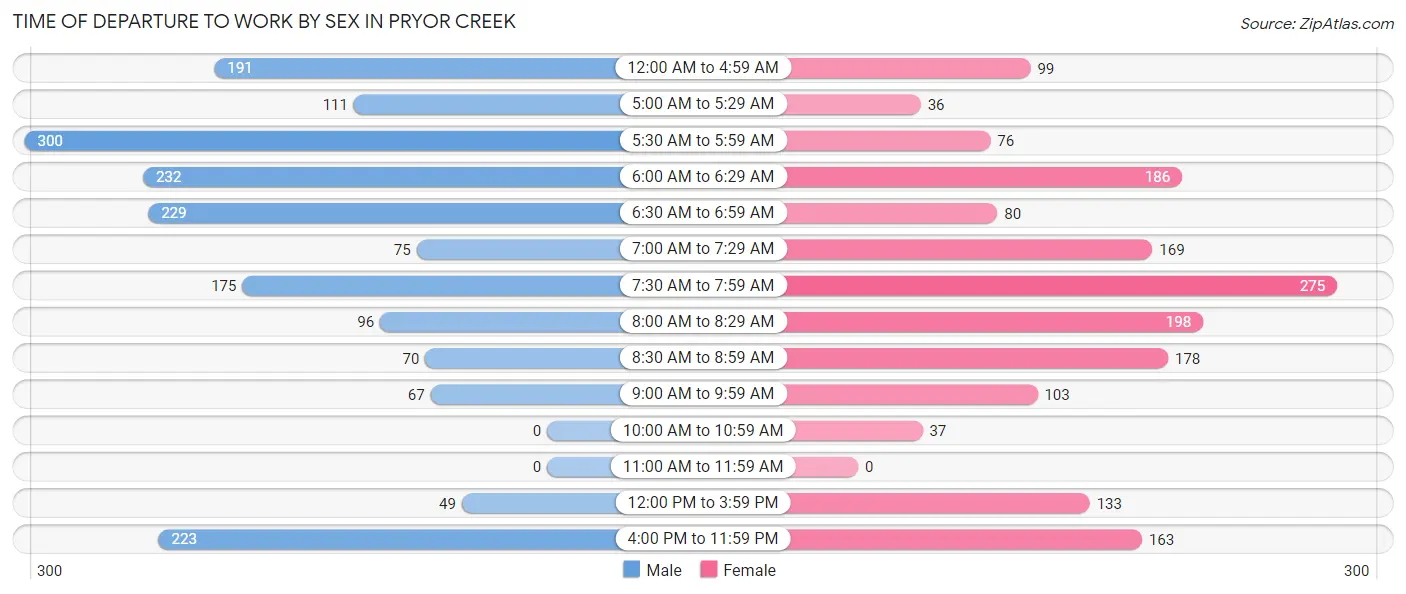
| Time of Departure | Male | Female |
| 12:00 AM to 4:59 AM | 191 (10.5%) | 99 (5.7%) |
| 5:00 AM to 5:29 AM | 111 (6.1%) | 36 (2.1%) |
| 5:30 AM to 5:59 AM | 300 (16.5%) | 76 (4.4%) |
| 6:00 AM to 6:29 AM | 232 (12.8%) | 186 (10.7%) |
| 6:30 AM to 6:59 AM | 229 (12.6%) | 80 (4.6%) |
| 7:00 AM to 7:29 AM | 75 (4.1%) | 169 (9.8%) |
| 7:30 AM to 7:59 AM | 175 (9.6%) | 275 (15.9%) |
| 8:00 AM to 8:29 AM | 96 (5.3%) | 198 (11.4%) |
| 8:30 AM to 8:59 AM | 70 (3.8%) | 178 (10.3%) |
| 9:00 AM to 9:59 AM | 67 (3.7%) | 103 (5.9%) |
| 10:00 AM to 10:59 AM | 0 (0.0%) | 37 (2.1%) |
| 11:00 AM to 11:59 AM | 0 (0.0%) | 0 (0.0%) |
| 12:00 PM to 3:59 PM | 49 (2.7%) | 133 (7.7%) |
| 4:00 PM to 11:59 PM | 223 (12.3%) | 163 (9.4%) |
| Total | 1,818 (100.0%) | 1,733 (100.0%) |
Housing Occupancy in Pryor Creek
Occupancy by Ownership in Pryor Creek
Of the total 3,649 dwellings in Pryor Creek, owner-occupied units account for 2,011 (55.1%), while renter-occupied units make up 1,638 (44.9%).
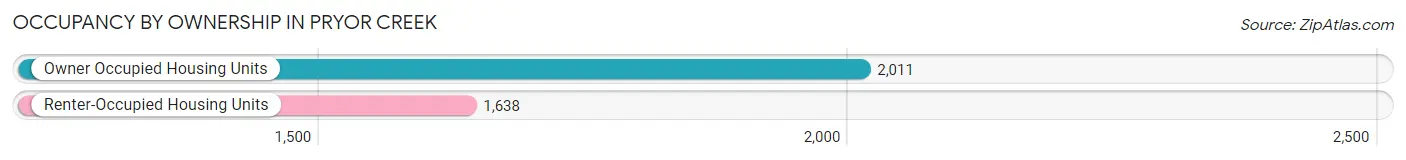
| Occupancy | # Housing Units | % Housing Units |
| Owner Occupied Housing Units | 2,011 | 55.1% |
| Renter-Occupied Housing Units | 1,638 | 44.9% |
| Total Occupied Housing Units | 3,649 | 100.0% |
Occupancy by Household Size in Pryor Creek
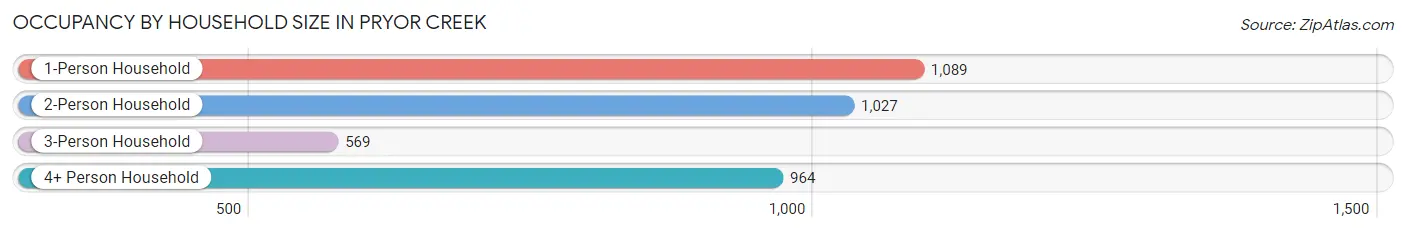
| Household Size | # Housing Units | % Housing Units |
| 1-Person Household | 1,089 | 29.8% |
| 2-Person Household | 1,027 | 28.1% |
| 3-Person Household | 569 | 15.6% |
| 4+ Person Household | 964 | 26.4% |
| Total Housing Units | 3,649 | 100.0% |
Occupancy by Ownership by Household Size in Pryor Creek
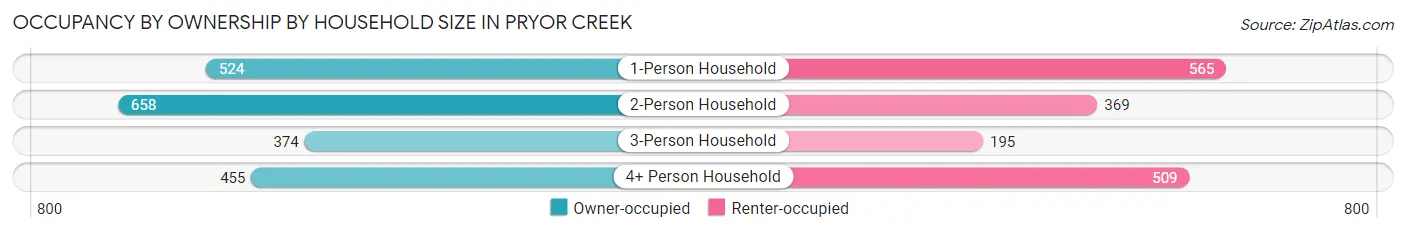
| Household Size | Owner-occupied | Renter-occupied |
| 1-Person Household | 524 (48.1%) | 565 (51.9%) |
| 2-Person Household | 658 (64.1%) | 369 (35.9%) |
| 3-Person Household | 374 (65.7%) | 195 (34.3%) |
| 4+ Person Household | 455 (47.2%) | 509 (52.8%) |
| Total Housing Units | 2,011 (55.1%) | 1,638 (44.9%) |
Occupancy by Educational Attainment in Pryor Creek
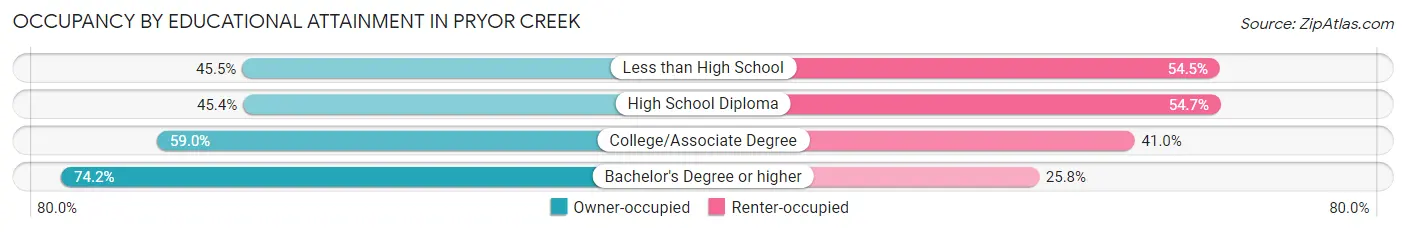
| Household Size | Owner-occupied | Renter-occupied |
| Less than High School | 106 (45.5%) | 127 (54.5%) |
| High School Diploma | 653 (45.4%) | 787 (54.6%) |
| College/Associate Degree | 832 (59.0%) | 578 (41.0%) |
| Bachelor's Degree or higher | 420 (74.2%) | 146 (25.8%) |
Occupancy by Age of Householder in Pryor Creek
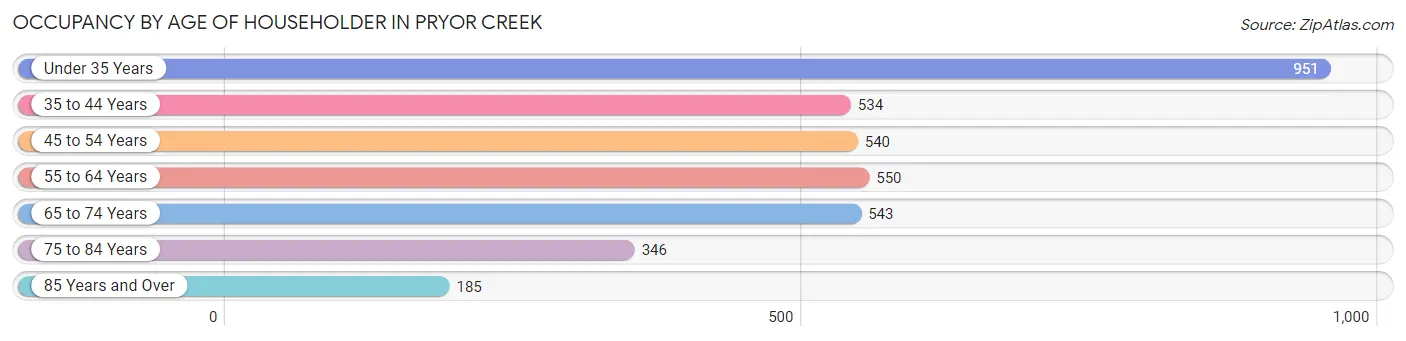
| Age Bracket | # Households | % Households |
| Under 35 Years | 951 | 26.1% |
| 35 to 44 Years | 534 | 14.6% |
| 45 to 54 Years | 540 | 14.8% |
| 55 to 64 Years | 550 | 15.1% |
| 65 to 74 Years | 543 | 14.9% |
| 75 to 84 Years | 346 | 9.5% |
| 85 Years and Over | 185 | 5.1% |
| Total | 3,649 | 100.0% |
Housing Finances in Pryor Creek
Median Income by Occupancy in Pryor Creek
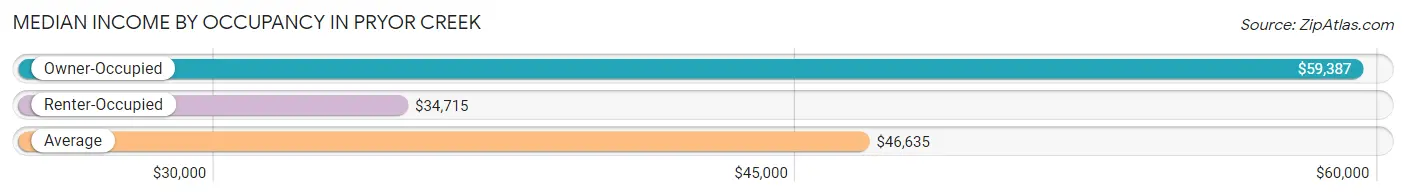
| Occupancy Type | # Households | Median Income |
| Owner-Occupied | 2,011 (55.1%) | $59,387 |
| Renter-Occupied | 1,638 (44.9%) | $34,715 |
| Average | 3,649 (100.0%) | $46,635 |
Occupancy by Householder Income Bracket in Pryor Creek
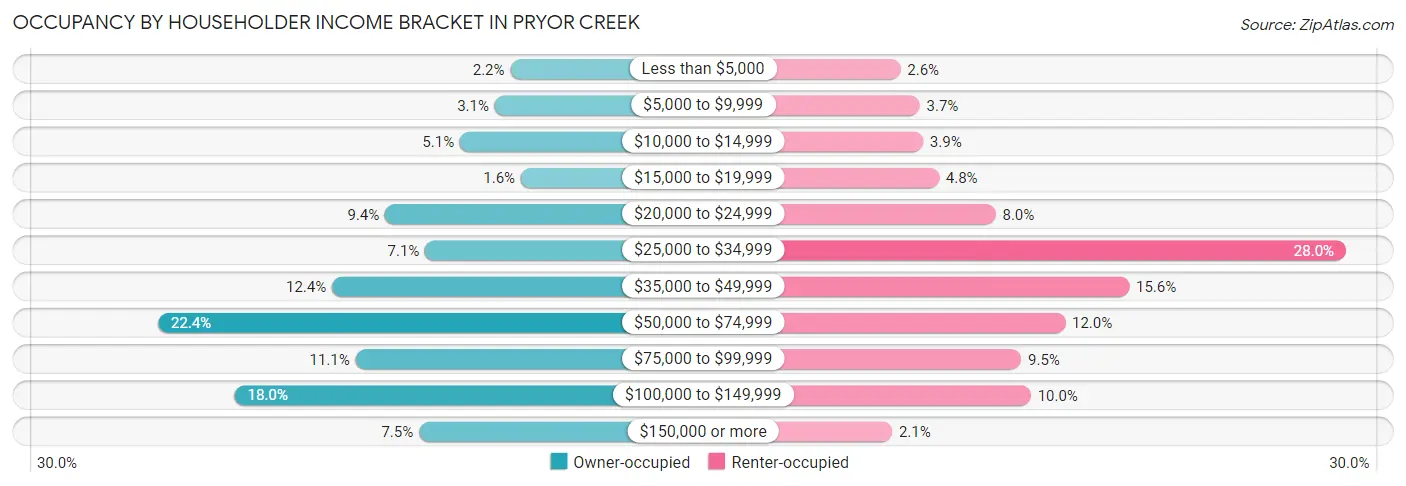
| Income Bracket | Owner-occupied | Renter-occupied |
| Less than $5,000 | 45 (2.2%) | 42 (2.6%) |
| $5,000 to $9,999 | 63 (3.1%) | 60 (3.7%) |
| $10,000 to $14,999 | 103 (5.1%) | 63 (3.8%) |
| $15,000 to $19,999 | 33 (1.6%) | 78 (4.8%) |
| $20,000 to $24,999 | 189 (9.4%) | 131 (8.0%) |
| $25,000 to $34,999 | 143 (7.1%) | 459 (28.0%) |
| $35,000 to $49,999 | 250 (12.4%) | 256 (15.6%) |
| $50,000 to $74,999 | 450 (22.4%) | 196 (12.0%) |
| $75,000 to $99,999 | 223 (11.1%) | 155 (9.5%) |
| $100,000 to $149,999 | 362 (18.0%) | 164 (10.0%) |
| $150,000 or more | 150 (7.5%) | 34 (2.1%) |
| Total | 2,011 (100.0%) | 1,638 (100.0%) |
Monthly Housing Cost Tiers in Pryor Creek
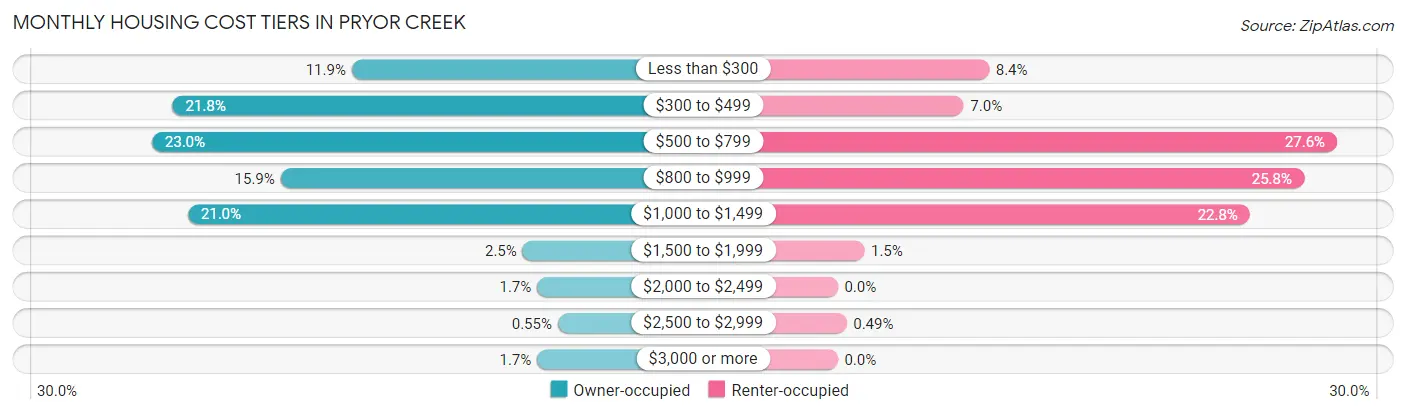
| Monthly Cost | Owner-occupied | Renter-occupied |
| Less than $300 | 240 (11.9%) | 137 (8.4%) |
| $300 to $499 | 439 (21.8%) | 114 (7.0%) |
| $500 to $799 | 462 (23.0%) | 452 (27.6%) |
| $800 to $999 | 319 (15.9%) | 422 (25.8%) |
| $1,000 to $1,499 | 422 (21.0%) | 373 (22.8%) |
| $1,500 to $1,999 | 50 (2.5%) | 24 (1.5%) |
| $2,000 to $2,499 | 34 (1.7%) | 0 (0.0%) |
| $2,500 to $2,999 | 11 (0.5%) | 8 (0.5%) |
| $3,000 or more | 34 (1.7%) | 0 (0.0%) |
| Total | 2,011 (100.0%) | 1,638 (100.0%) |
Physical Housing Characteristics in Pryor Creek
Housing Structures in Pryor Creek
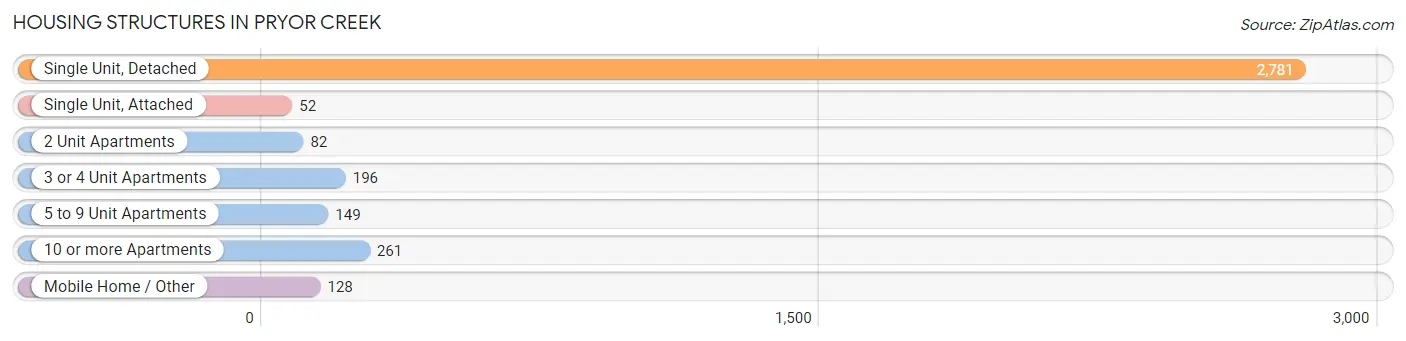
| Structure Type | # Housing Units | % Housing Units |
| Single Unit, Detached | 2,781 | 76.2% |
| Single Unit, Attached | 52 | 1.4% |
| 2 Unit Apartments | 82 | 2.2% |
| 3 or 4 Unit Apartments | 196 | 5.4% |
| 5 to 9 Unit Apartments | 149 | 4.1% |
| 10 or more Apartments | 261 | 7.1% |
| Mobile Home / Other | 128 | 3.5% |
| Total | 3,649 | 100.0% |
Housing Structures by Occupancy in Pryor Creek
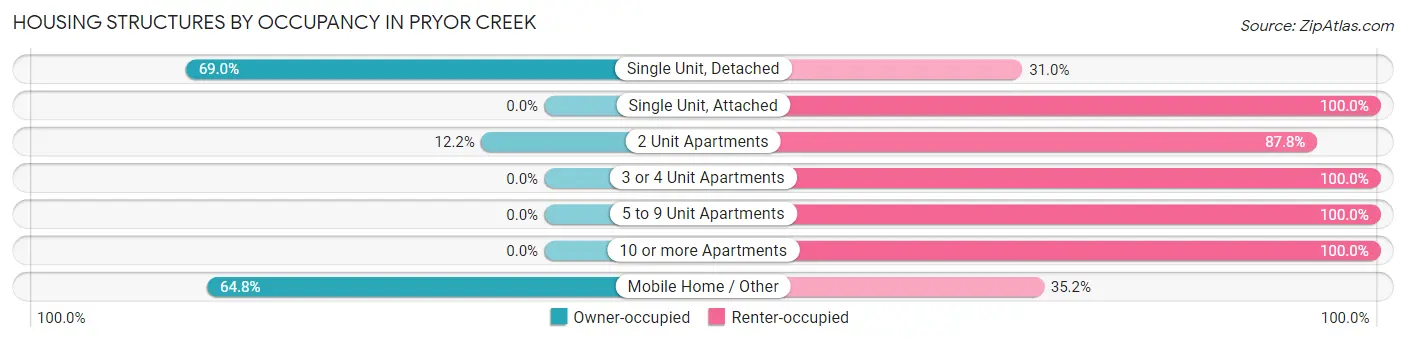
| Structure Type | Owner-occupied | Renter-occupied |
| Single Unit, Detached | 1,918 (69.0%) | 863 (31.0%) |
| Single Unit, Attached | 0 (0.0%) | 52 (100.0%) |
| 2 Unit Apartments | 10 (12.2%) | 72 (87.8%) |
| 3 or 4 Unit Apartments | 0 (0.0%) | 196 (100.0%) |
| 5 to 9 Unit Apartments | 0 (0.0%) | 149 (100.0%) |
| 10 or more Apartments | 0 (0.0%) | 261 (100.0%) |
| Mobile Home / Other | 83 (64.8%) | 45 (35.2%) |
| Total | 2,011 (55.1%) | 1,638 (44.9%) |
Housing Structures by Number of Rooms in Pryor Creek
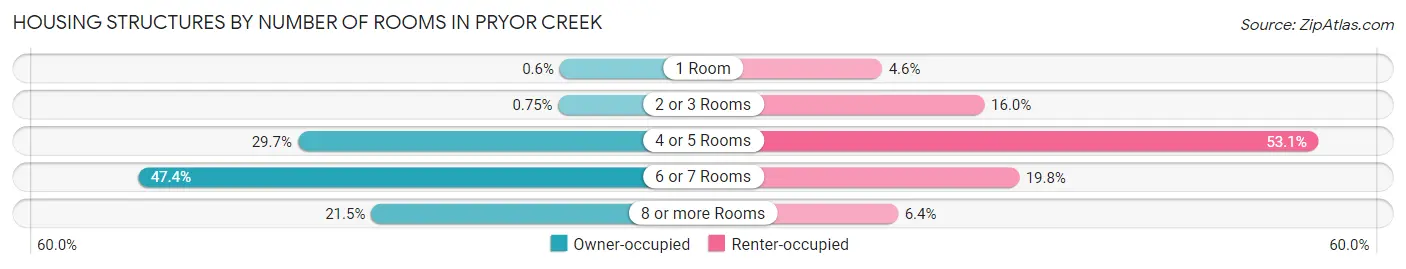
| Number of Rooms | Owner-occupied | Renter-occupied |
| 1 Room | 12 (0.6%) | 76 (4.6%) |
| 2 or 3 Rooms | 15 (0.7%) | 262 (16.0%) |
| 4 or 5 Rooms | 597 (29.7%) | 870 (53.1%) |
| 6 or 7 Rooms | 954 (47.4%) | 325 (19.8%) |
| 8 or more Rooms | 433 (21.5%) | 105 (6.4%) |
| Total | 2,011 (100.0%) | 1,638 (100.0%) |
Housing Structure by Heating Type in Pryor Creek
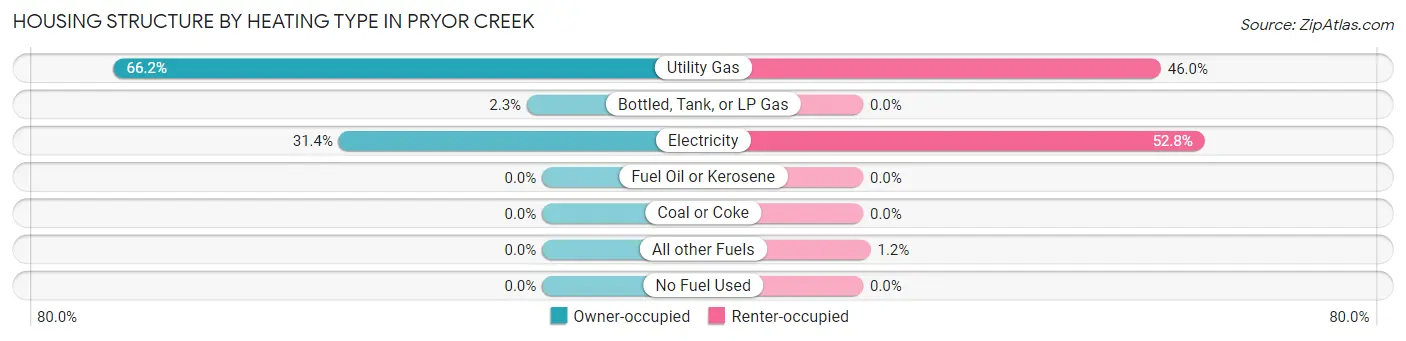
| Heating Type | Owner-occupied | Renter-occupied |
| Utility Gas | 1,332 (66.2%) | 754 (46.0%) |
| Bottled, Tank, or LP Gas | 47 (2.3%) | 0 (0.0%) |
| Electricity | 632 (31.4%) | 865 (52.8%) |
| Fuel Oil or Kerosene | 0 (0.0%) | 0 (0.0%) |
| Coal or Coke | 0 (0.0%) | 0 (0.0%) |
| All other Fuels | 0 (0.0%) | 19 (1.2%) |
| No Fuel Used | 0 (0.0%) | 0 (0.0%) |
| Total | 2,011 (100.0%) | 1,638 (100.0%) |
Household Vehicle Usage in Pryor Creek
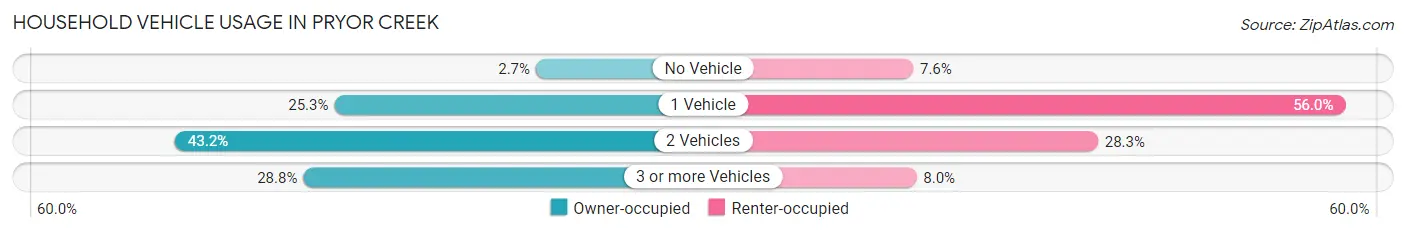
| Vehicles per Household | Owner-occupied | Renter-occupied |
| No Vehicle | 55 (2.7%) | 125 (7.6%) |
| 1 Vehicle | 509 (25.3%) | 918 (56.0%) |
| 2 Vehicles | 868 (43.2%) | 464 (28.3%) |
| 3 or more Vehicles | 579 (28.8%) | 131 (8.0%) |
| Total | 2,011 (100.0%) | 1,638 (100.0%) |
Real Estate & Mortgages in Pryor Creek
Real Estate and Mortgage Overview in Pryor Creek
| Characteristic | Without Mortgage | With Mortgage |
| Housing Units | 940 | 1,071 |
| Median Property Value | $136,900 | $133,100 |
| Median Household Income | $56,923 | $80 |
| Monthly Housing Costs | $417 | $34 |
| Real Estate Taxes | $973 | $69 |
Property Value by Mortgage Status in Pryor Creek
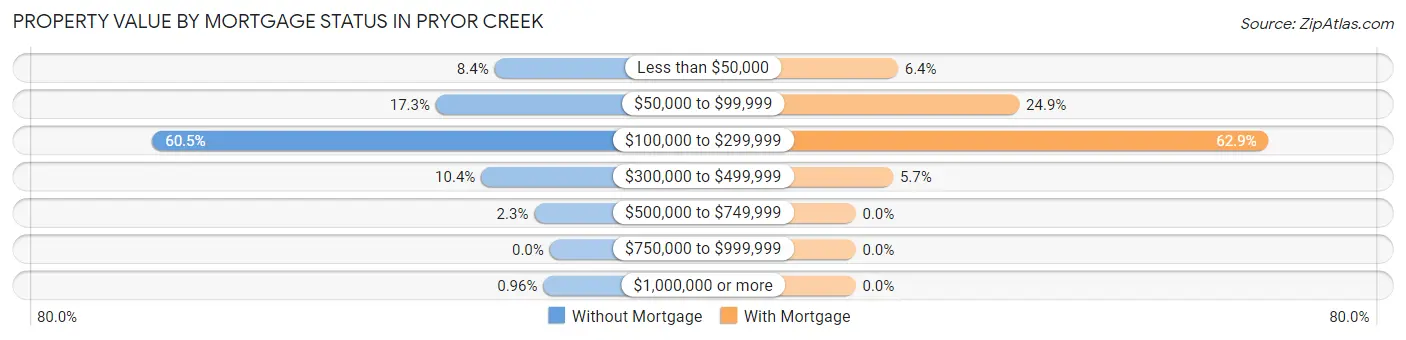
| Property Value | Without Mortgage | With Mortgage |
| Less than $50,000 | 79 (8.4%) | 69 (6.4%) |
| $50,000 to $99,999 | 163 (17.3%) | 267 (24.9%) |
| $100,000 to $299,999 | 569 (60.5%) | 674 (62.9%) |
| $300,000 to $499,999 | 98 (10.4%) | 61 (5.7%) |
| $500,000 to $749,999 | 22 (2.3%) | 0 (0.0%) |
| $750,000 to $999,999 | 0 (0.0%) | 0 (0.0%) |
| $1,000,000 or more | 9 (1.0%) | 0 (0.0%) |
| Total | 940 (100.0%) | 1,071 (100.0%) |
Household Income by Mortgage Status in Pryor Creek
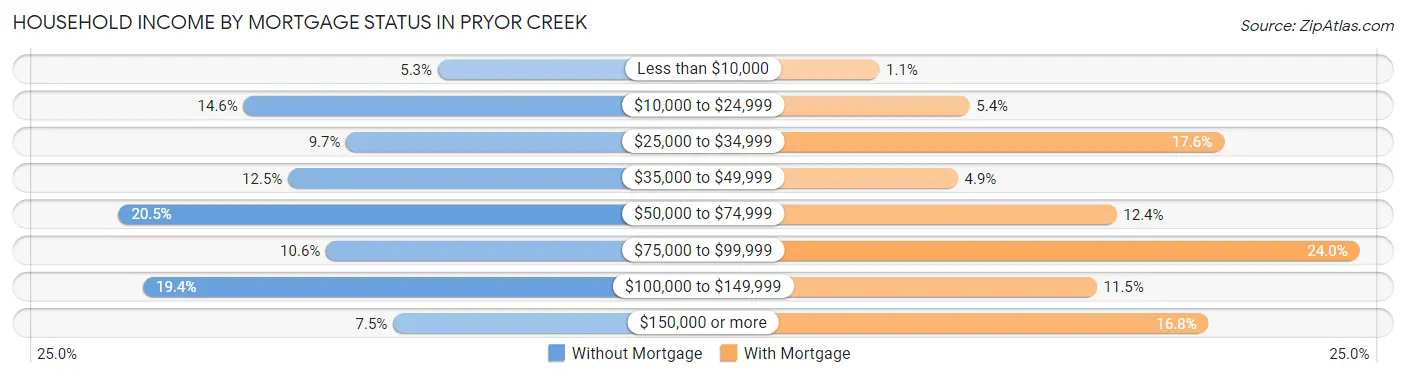
| Household Income | Without Mortgage | With Mortgage |
| Less than $10,000 | 50 (5.3%) | 12 (1.1%) |
| $10,000 to $24,999 | 137 (14.6%) | 58 (5.4%) |
| $25,000 to $34,999 | 91 (9.7%) | 188 (17.5%) |
| $35,000 to $49,999 | 117 (12.4%) | 52 (4.9%) |
| $50,000 to $74,999 | 193 (20.5%) | 133 (12.4%) |
| $75,000 to $99,999 | 100 (10.6%) | 257 (24.0%) |
| $100,000 to $149,999 | 182 (19.4%) | 123 (11.5%) |
| $150,000 or more | 70 (7.4%) | 180 (16.8%) |
| Total | 940 (100.0%) | 1,071 (100.0%) |
Property Value to Household Income Ratio in Pryor Creek
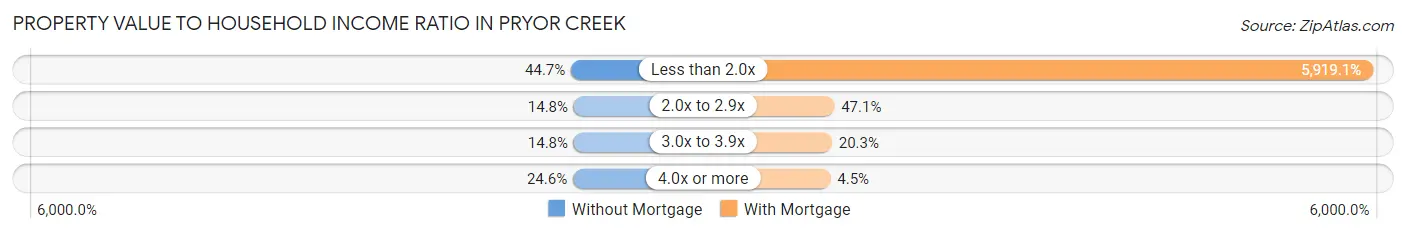
| Value-to-Income Ratio | Without Mortgage | With Mortgage |
| Less than 2.0x | 420 (44.7%) | 63,393 (5,919.1%) |
| 2.0x to 2.9x | 139 (14.8%) | 504 (47.1%) |
| 3.0x to 3.9x | 139 (14.8%) | 217 (20.3%) |
| 4.0x or more | 231 (24.6%) | 48 (4.5%) |
| Total | 940 (100.0%) | 1,071 (100.0%) |
Real Estate Taxes by Mortgage Status in Pryor Creek
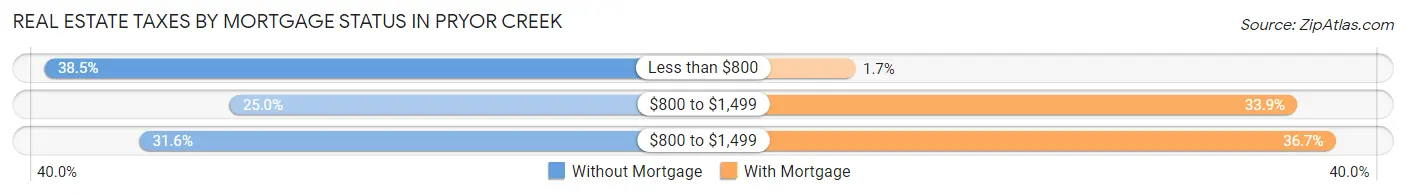
| Property Taxes | Without Mortgage | With Mortgage |
| Less than $800 | 362 (38.5%) | 18 (1.7%) |
| $800 to $1,499 | 235 (25.0%) | 363 (33.9%) |
| $800 to $1,499 | 297 (31.6%) | 393 (36.7%) |
| Total | 940 (100.0%) | 1,071 (100.0%) |
Health & Disability in Pryor Creek
Health Insurance Coverage by Age in Pryor Creek
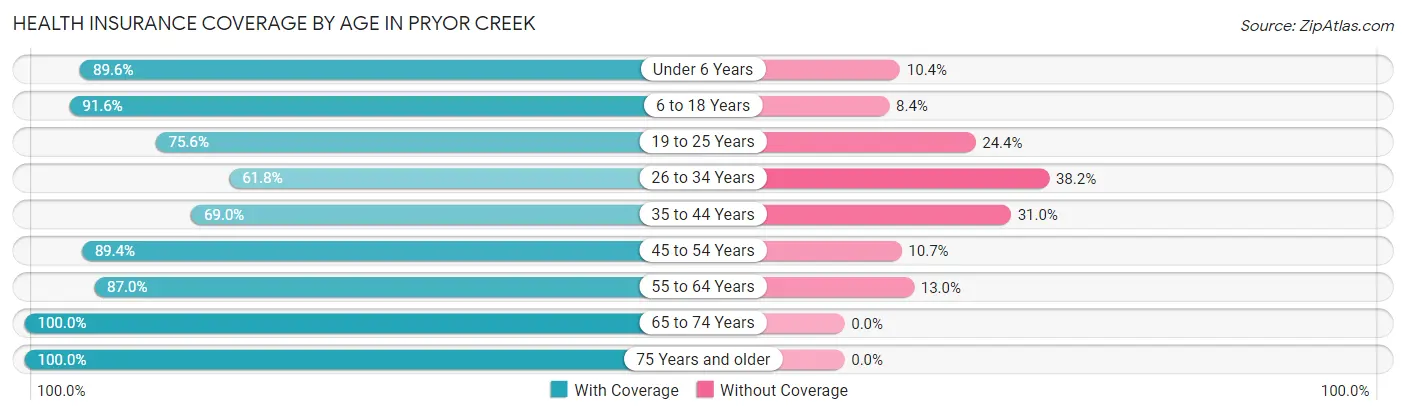
| Age Bracket | With Coverage | Without Coverage |
| Under 6 Years | 787 (89.6%) | 91 (10.4%) |
| 6 to 18 Years | 1,469 (91.6%) | 134 (8.4%) |
| 19 to 25 Years | 900 (75.6%) | 291 (24.4%) |
| 26 to 34 Years | 823 (61.8%) | 508 (38.2%) |
| 35 to 44 Years | 660 (69.0%) | 297 (31.0%) |
| 45 to 54 Years | 789 (89.3%) | 94 (10.6%) |
| 55 to 64 Years | 819 (87.0%) | 122 (13.0%) |
| 65 to 74 Years | 764 (100.0%) | 0 (0.0%) |
| 75 Years and older | 671 (100.0%) | 0 (0.0%) |
| Total | 7,682 (83.3%) | 1,537 (16.7%) |
Health Insurance Coverage by Citizenship Status in Pryor Creek
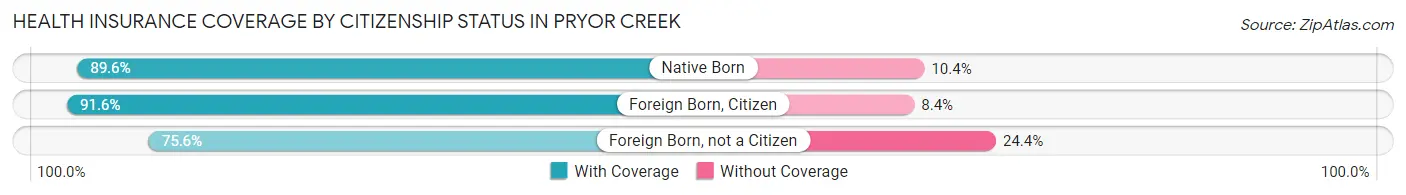
| Citizenship Status | With Coverage | Without Coverage |
| Native Born | 787 (89.6%) | 91 (10.4%) |
| Foreign Born, Citizen | 1,469 (91.6%) | 134 (8.4%) |
| Foreign Born, not a Citizen | 900 (75.6%) | 291 (24.4%) |
Health Insurance Coverage by Household Income in Pryor Creek
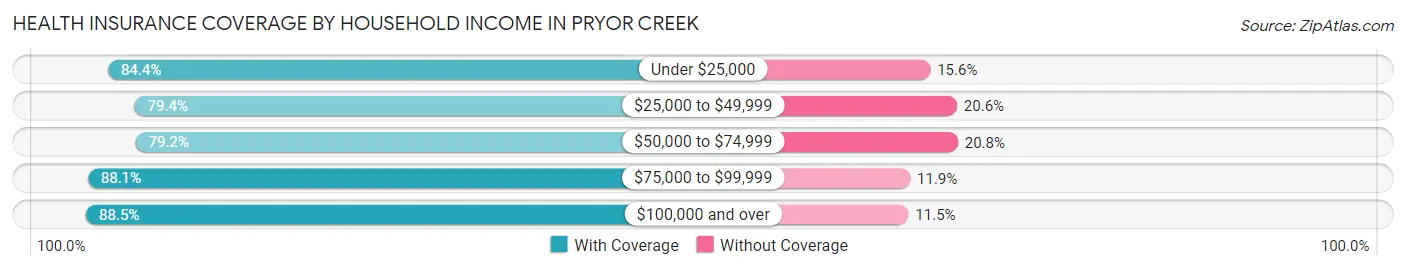
| Household Income | With Coverage | Without Coverage |
| Under $25,000 | 1,436 (84.4%) | 266 (15.6%) |
| $25,000 to $49,999 | 2,001 (79.4%) | 520 (20.6%) |
| $50,000 to $74,999 | 1,443 (79.2%) | 379 (20.8%) |
| $75,000 to $99,999 | 825 (88.1%) | 111 (11.9%) |
| $100,000 and over | 1,970 (88.5%) | 257 (11.5%) |
Public vs Private Health Insurance Coverage by Age in Pryor Creek
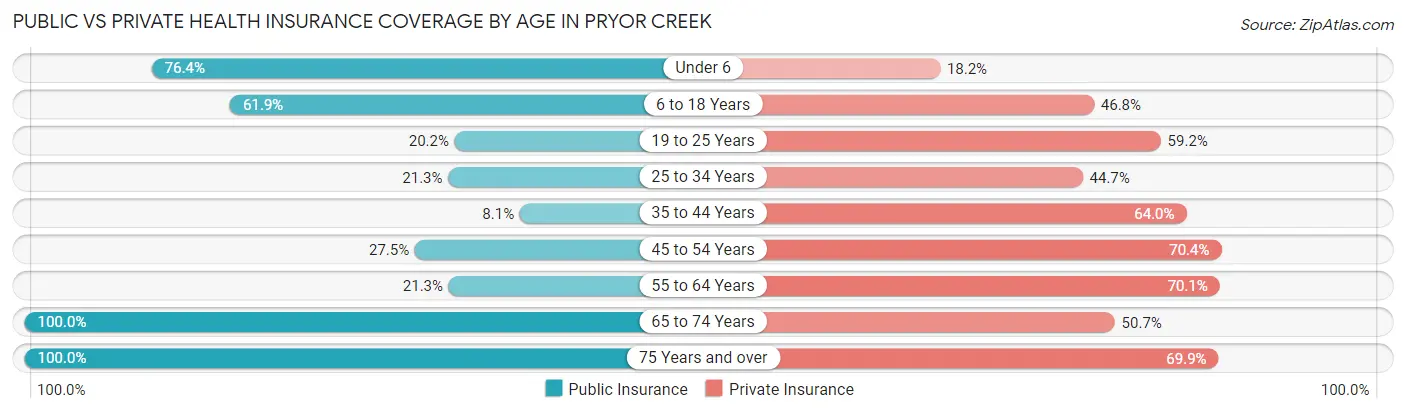
| Age Bracket | Public Insurance | Private Insurance |
| Under 6 | 671 (76.4%) | 160 (18.2%) |
| 6 to 18 Years | 992 (61.9%) | 750 (46.8%) |
| 19 to 25 Years | 240 (20.2%) | 705 (59.2%) |
| 25 to 34 Years | 284 (21.3%) | 595 (44.7%) |
| 35 to 44 Years | 77 (8.1%) | 612 (63.9%) |
| 45 to 54 Years | 243 (27.5%) | 622 (70.4%) |
| 55 to 64 Years | 200 (21.2%) | 660 (70.1%) |
| 65 to 74 Years | 764 (100.0%) | 387 (50.6%) |
| 75 Years and over | 671 (100.0%) | 469 (69.9%) |
| Total | 4,142 (44.9%) | 4,960 (53.8%) |
Disability Status by Sex by Age in Pryor Creek
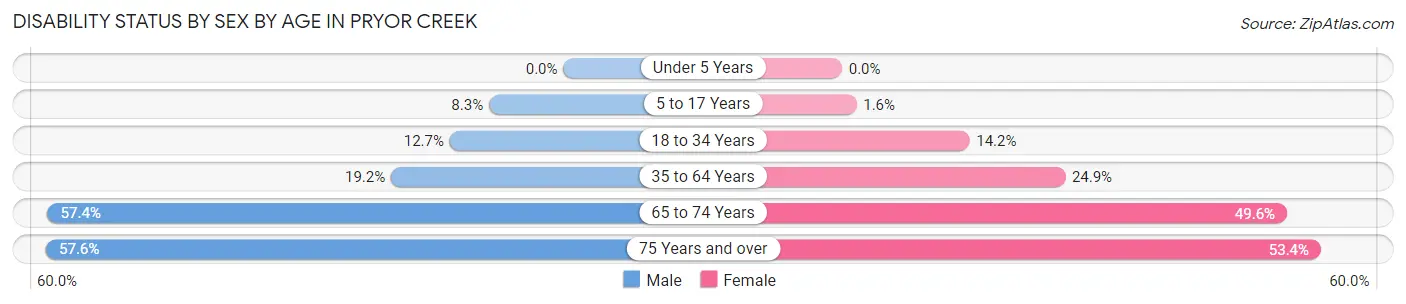
| Age Bracket | Male | Female |
| Under 5 Years | 0 (0.0%) | 0 (0.0%) |
| 5 to 17 Years | 68 (8.3%) | 14 (1.6%) |
| 18 to 34 Years | 163 (12.7%) | 195 (14.2%) |
| 35 to 64 Years | 241 (19.2%) | 379 (24.8%) |
| 65 to 74 Years | 170 (57.4%) | 232 (49.6%) |
| 75 Years and over | 163 (57.6%) | 207 (53.3%) |
Disability Class by Sex by Age in Pryor Creek
Disability Class: Hearing Difficulty
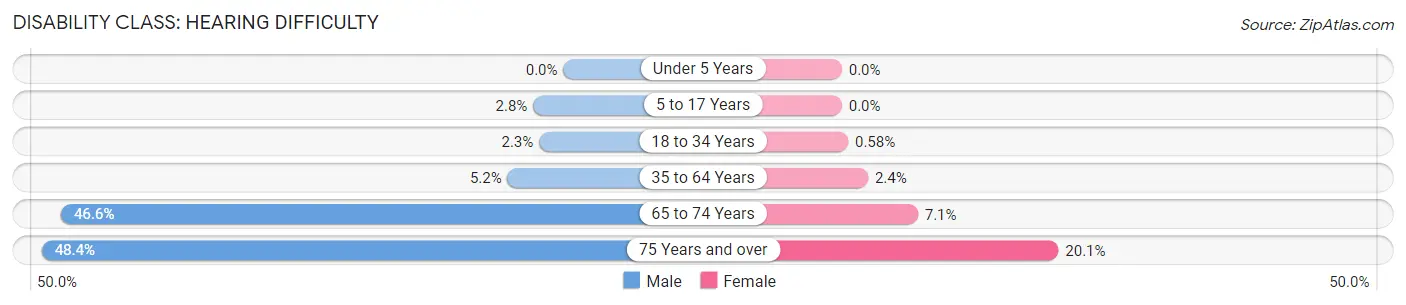
| Age Bracket | Male | Female |
| Under 5 Years | 0 (0.0%) | 0 (0.0%) |
| 5 to 17 Years | 23 (2.8%) | 0 (0.0%) |
| 18 to 34 Years | 29 (2.2%) | 8 (0.6%) |
| 35 to 64 Years | 65 (5.2%) | 37 (2.4%) |
| 65 to 74 Years | 138 (46.6%) | 33 (7.0%) |
| 75 Years and over | 137 (48.4%) | 78 (20.1%) |
Disability Class: Vision Difficulty
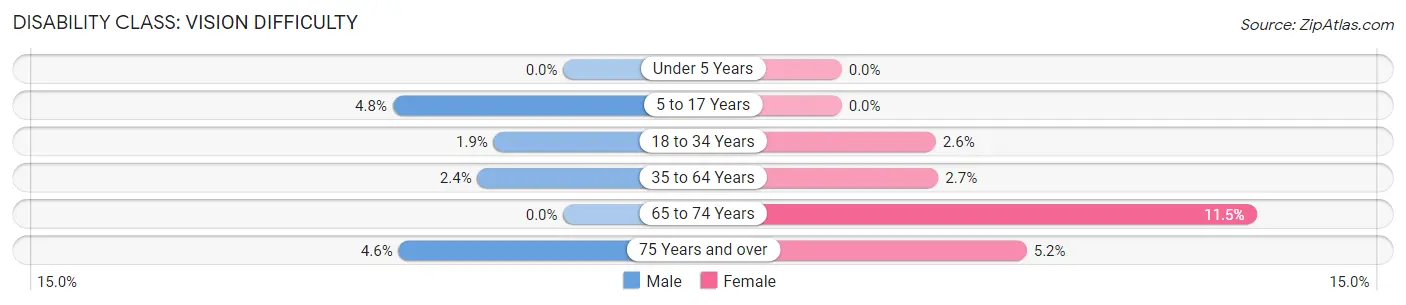
| Age Bracket | Male | Female |
| Under 5 Years | 0 (0.0%) | 0 (0.0%) |
| 5 to 17 Years | 39 (4.8%) | 0 (0.0%) |
| 18 to 34 Years | 25 (1.9%) | 36 (2.6%) |
| 35 to 64 Years | 30 (2.4%) | 41 (2.7%) |
| 65 to 74 Years | 0 (0.0%) | 54 (11.5%) |
| 75 Years and over | 13 (4.6%) | 20 (5.1%) |
Disability Class: Cognitive Difficulty
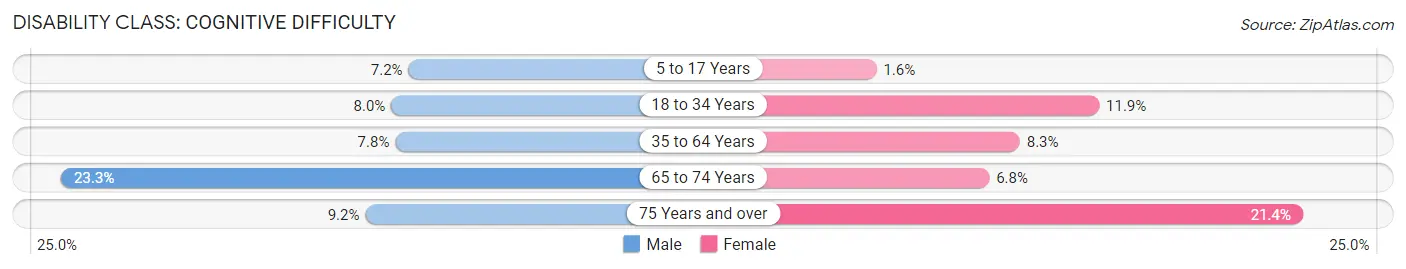
| Age Bracket | Male | Female |
| 5 to 17 Years | 59 (7.2%) | 14 (1.6%) |
| 18 to 34 Years | 103 (8.0%) | 164 (11.9%) |
| 35 to 64 Years | 98 (7.8%) | 126 (8.3%) |
| 65 to 74 Years | 69 (23.3%) | 32 (6.8%) |
| 75 Years and over | 26 (9.2%) | 83 (21.4%) |
Disability Class: Ambulatory Difficulty
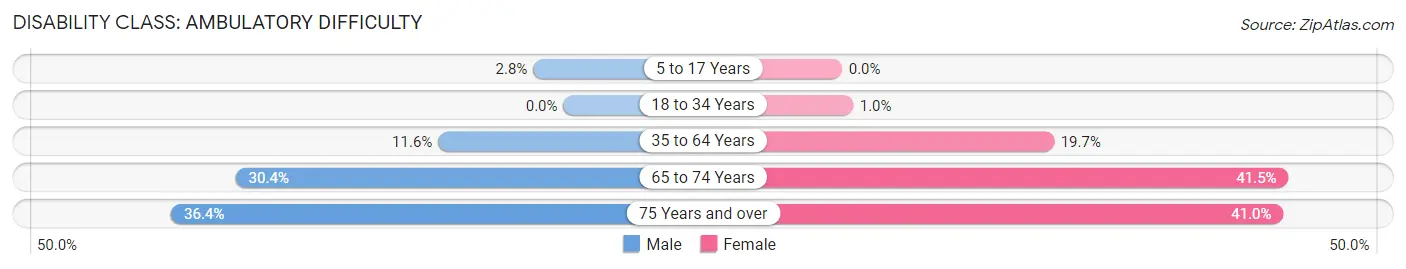
| Age Bracket | Male | Female |
| 5 to 17 Years | 23 (2.8%) | 0 (0.0%) |
| 18 to 34 Years | 0 (0.0%) | 14 (1.0%) |
| 35 to 64 Years | 146 (11.6%) | 300 (19.7%) |
| 65 to 74 Years | 90 (30.4%) | 194 (41.4%) |
| 75 Years and over | 103 (36.4%) | 159 (41.0%) |
Disability Class: Self-Care Difficulty
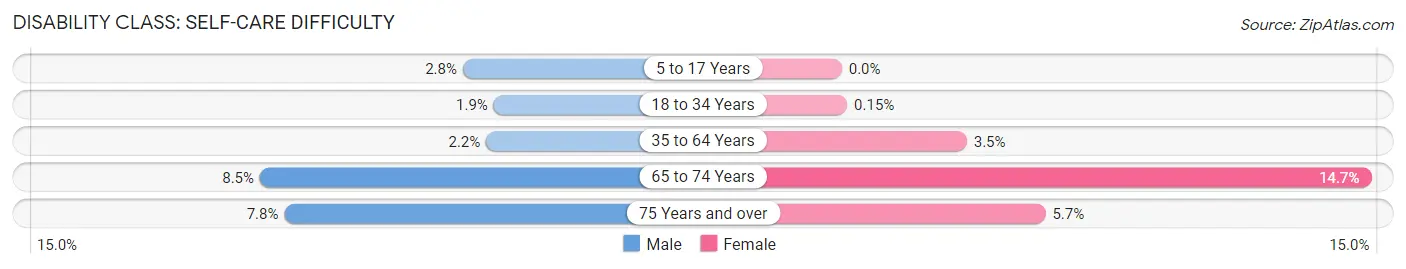
| Age Bracket | Male | Female |
| 5 to 17 Years | 23 (2.8%) | 0 (0.0%) |
| 18 to 34 Years | 25 (1.9%) | 2 (0.2%) |
| 35 to 64 Years | 27 (2.1%) | 53 (3.5%) |
| 65 to 74 Years | 25 (8.5%) | 69 (14.7%) |
| 75 Years and over | 22 (7.8%) | 22 (5.7%) |
Technology Access in Pryor Creek
Computing Device Access in Pryor Creek
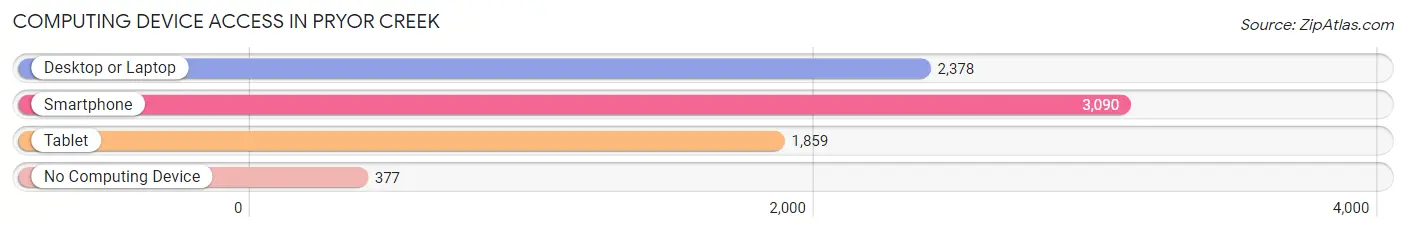
| Device Type | # Households | % Households |
| Desktop or Laptop | 2,378 | 65.2% |
| Smartphone | 3,090 | 84.7% |
| Tablet | 1,859 | 50.9% |
| No Computing Device | 377 | 10.3% |
| Total | 3,649 | 100.0% |
Internet Access in Pryor Creek
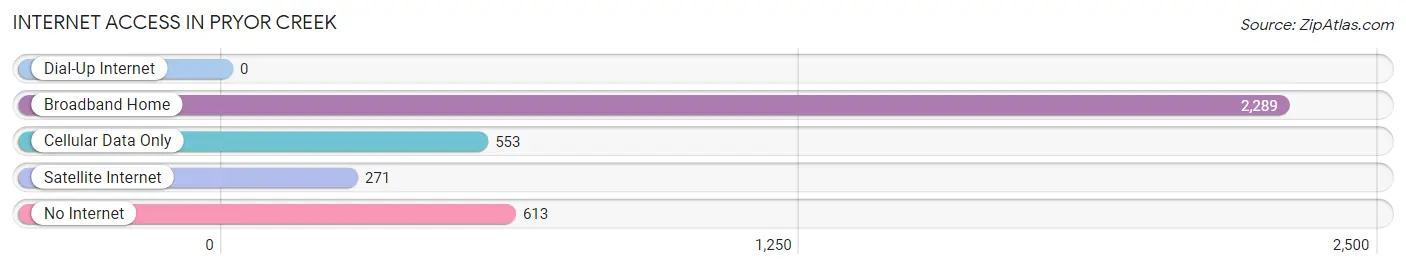
| Internet Type | # Households | % Households |
| Dial-Up Internet | 0 | 0.0% |
| Broadband Home | 2,289 | 62.7% |
| Cellular Data Only | 553 | 15.1% |
| Satellite Internet | 271 | 7.4% |
| No Internet | 613 | 16.8% |
| Total | 3,649 | 100.0% |
Pryor Creek Summary
Pryor Creek, Oklahoma is a small city located in Mayes County, Oklahoma. It is situated on the banks of the Arkansas River, approximately 25 miles east of Tulsa. The city was founded in 1887 and was named after the nearby creek, which was named after Nathaniel Pryor, a member of the Lewis and Clark Expedition. As of the 2010 census, the population of Pryor Creek was 8,659.
History
The area that is now Pryor Creek was originally inhabited by the Osage and Cherokee Native American tribes. In 1817, the area was ceded to the United States by the Osage Nation. The area was then opened to white settlement in 1828. The first settlers in the area were the Pryor family, who arrived in 1837. The town of Pryor Creek was founded in 1887 and was named after the nearby creek, which was named after Nathaniel Pryor, a member of the Lewis and Clark Expedition.
In the early 1900s, Pryor Creek was a thriving agricultural community. The town was home to several cotton gins, a flour mill, and a cottonseed oil mill. The town also had a number of stores, a hotel, and a bank. In the 1920s, the town began to experience a decline in population as many of the residents moved away to larger cities in search of better economic opportunities.
Geography
Pryor Creek is located in Mayes County, Oklahoma. It is situated on the banks of the Arkansas River, approximately 25 miles east of Tulsa. The city has a total area of 4.3 square miles, all of which is land. The city is located in the Ozark Mountains and is surrounded by rolling hills and wooded areas.
Economy
Pryor Creek is a small city with a limited economy. The city’s main industries are agriculture and manufacturing. The city is home to several manufacturing plants, including a paper mill, a plastics plant, and a metal fabrication plant. The city also has a number of retail stores, restaurants, and other businesses.
Demographics
As of the 2010 census, the population of Pryor Creek was 8,659. The racial makeup of the city was 79.2% White, 15.2% African American, 0.7% Native American, 0.5% Asian, 0.1% Pacific Islander, and 4.3% from other races. The median household income was $35,945 and the median family income was $41,945. The per capita income was $17,845.
Conclusion
Pryor Creek, Oklahoma is a small city located in Mayes County, Oklahoma. It is situated on the banks of the Arkansas River, approximately 25 miles east of Tulsa. The city was founded in 1887 and was named after the nearby creek, which was named after Nathaniel Pryor, a member of the Lewis and Clark Expedition. As of the 2010 census, the population of Pryor Creek was 8,659. The city’s main industries are agriculture and manufacturing. The racial makeup of the city was 79.2% White, 15.2% African American, 0.7% Native American, 0.5% Asian, 0.1% Pacific Islander, and 4.3% from other races. The median household income was $35,945 and the median family income was $41,945. The per capita income was $17,845.
Common Questions
What is Per Capita Income in Pryor Creek?
Per Capita income in Pryor Creek is $26,092.
What is the Median Family Income in Pryor Creek?
Median Family Income in Pryor Creek is $52,931.
What is the Median Household income in Pryor Creek?
Median Household Income in Pryor Creek is $46,635.
What is Income or Wage Gap in Pryor Creek?
Income or Wage Gap in Pryor Creek is 38.6%.
Women in Pryor Creek earn 61.4 cents for every dollar earned by a man.
What is Inequality or Gini Index in Pryor Creek?
Inequality or Gini Index in Pryor Creek is 0.43.
What is the Total Population of Pryor Creek?
Total Population of Pryor Creek is 9,480.
What is the Total Male Population of Pryor Creek?
Total Male Population of Pryor Creek is 4,577.
What is the Total Female Population of Pryor Creek?
Total Female Population of Pryor Creek is 4,903.
What is the Ratio of Males per 100 Females in Pryor Creek?
There are 93.35 Males per 100 Females in Pryor Creek.
What is the Ratio of Females per 100 Males in Pryor Creek?
There are 107.12 Females per 100 Males in Pryor Creek.
What is the Median Population Age in Pryor Creek?
Median Population Age in Pryor Creek is 31.7 Years.
What is the Average Family Size in Pryor Creek
Average Family Size in Pryor Creek is 3.0 People.
What is the Average Household Size in Pryor Creek
Average Household Size in Pryor Creek is 2.5 People.
How Large is the Labor Force in Pryor Creek?
There are 4,237 People in the Labor Forcein in Pryor Creek.
What is the Percentage of People in the Labor Force in Pryor Creek?
57.7% of People are in the Labor Force in Pryor Creek.
What is the Unemployment Rate in Pryor Creek?
Unemployment Rate in Pryor Creek is 8.2%.