Fairfield, OK Map & Demographics
Fairfield Map
Fairfield Overview
$22,693
PER CAPITA INCOME
$83,667
AVG FAMILY INCOME
$70,000
AVG HOUSEHOLD INCOME
37.5%
WAGE / INCOME GAP [ % ]
62.5¢/ $1
WAGE / INCOME GAP [ $ ]
0.40
INEQUALITY / GINI INDEX
535
TOTAL POPULATION
260
MALE POPULATION
275
FEMALE POPULATION
94.55
MALES / 100 FEMALES
105.77
FEMALES / 100 MALES
41.4
MEDIAN AGE
3.9
AVG FAMILY SIZE
3.1
AVG HOUSEHOLD SIZE
204
LABOR FORCE [ PEOPLE ]
49.2%
PERCENT IN LABOR FORCE
Income in Fairfield
Income Overview in Fairfield
Per Capita Income in Fairfield is $22,693, while median incomes of families and households are $83,667 and $70,000 respectively.
| Characteristic | Number | Measure |
| Per Capita Income | 535 | $22,693 |
| Median Family Income | 122 | $83,667 |
| Mean Family Income | 122 | $69,153 |
| Median Household Income | 172 | $70,000 |
| Mean Household Income | 172 | $62,313 |
| Income Deficit | 122 | $0 |
| Wage / Income Gap (%) | 535 | 37.50% |
| Wage / Income Gap ($) | 535 | 62.50¢ per $1 |
| Gini / Inequality Index | 535 | 0.40 |
Earnings by Sex in Fairfield
Average Earnings in Fairfield are $39,688, $51,250 for men and $32,031 for women, a difference of 37.5%.
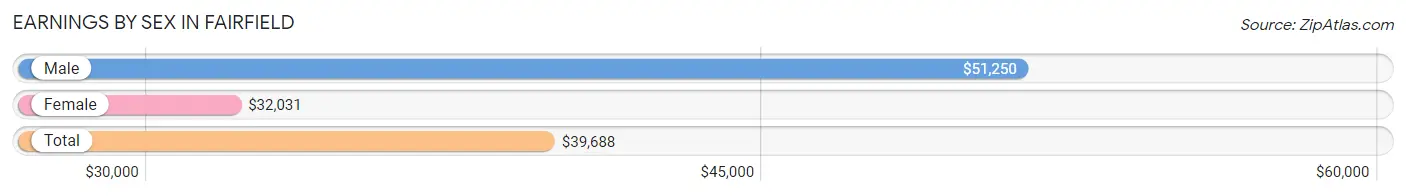
| Sex | Number | Average Earnings |
| Male | 112 (51.1%) | $51,250 |
| Female | 107 (48.9%) | $32,031 |
| Total | 219 (100.0%) | $39,688 |
Earnings by Sex by Income Bracket in Fairfield
The most common earnings brackets in Fairfield are $75,000 to $99,999 for men (28 | 25.0%) and $55,000 to $64,999 for women (22 | 20.6%).
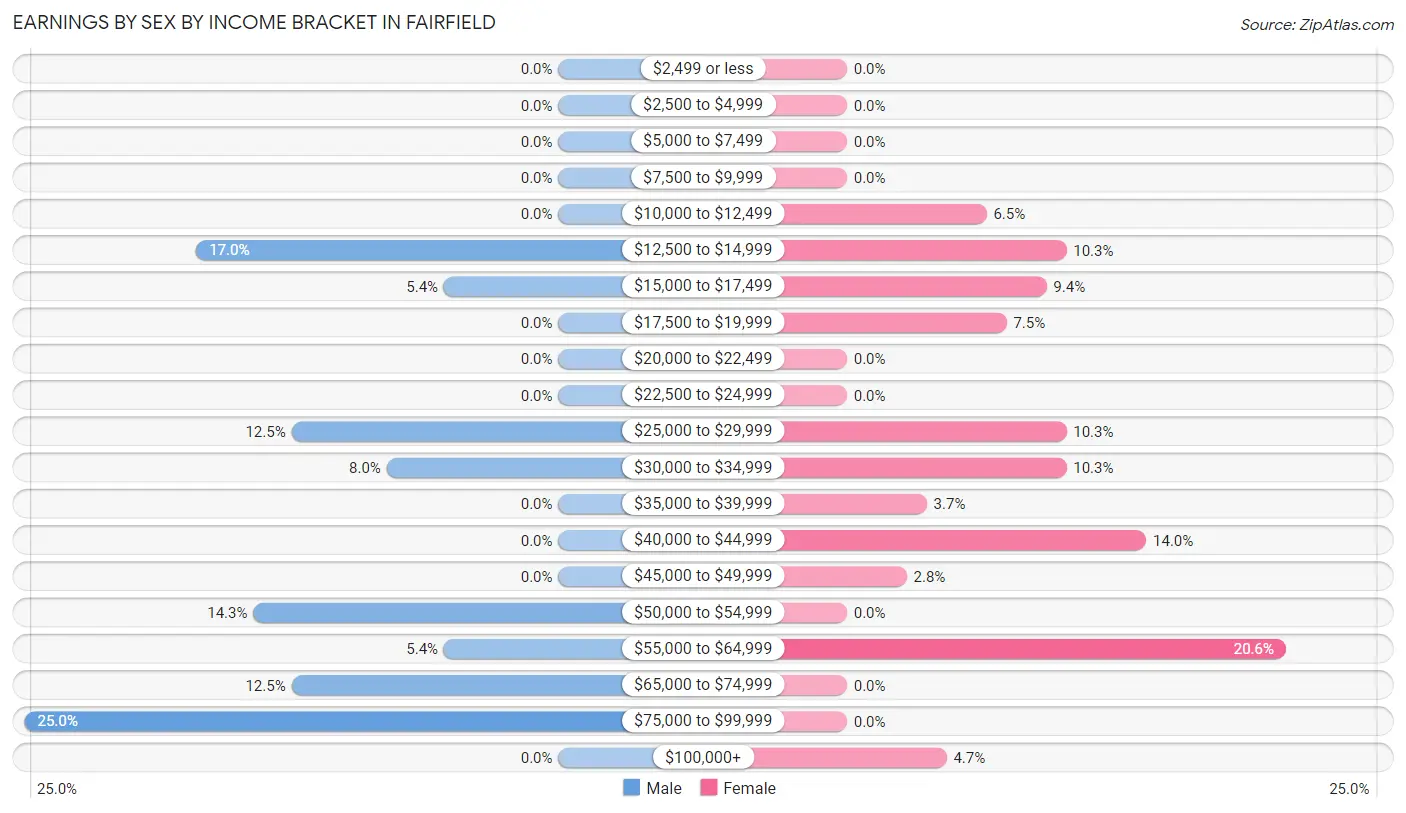
| Income | Male | Female |
| $2,499 or less | 0 (0.0%) | 0 (0.0%) |
| $2,500 to $4,999 | 0 (0.0%) | 0 (0.0%) |
| $5,000 to $7,499 | 0 (0.0%) | 0 (0.0%) |
| $7,500 to $9,999 | 0 (0.0%) | 0 (0.0%) |
| $10,000 to $12,499 | 0 (0.0%) | 7 (6.5%) |
| $12,500 to $14,999 | 19 (17.0%) | 11 (10.3%) |
| $15,000 to $17,499 | 6 (5.4%) | 10 (9.3%) |
| $17,500 to $19,999 | 0 (0.0%) | 8 (7.5%) |
| $20,000 to $22,499 | 0 (0.0%) | 0 (0.0%) |
| $22,500 to $24,999 | 0 (0.0%) | 0 (0.0%) |
| $25,000 to $29,999 | 14 (12.5%) | 11 (10.3%) |
| $30,000 to $34,999 | 9 (8.0%) | 11 (10.3%) |
| $35,000 to $39,999 | 0 (0.0%) | 4 (3.7%) |
| $40,000 to $44,999 | 0 (0.0%) | 15 (14.0%) |
| $45,000 to $49,999 | 0 (0.0%) | 3 (2.8%) |
| $50,000 to $54,999 | 16 (14.3%) | 0 (0.0%) |
| $55,000 to $64,999 | 6 (5.4%) | 22 (20.6%) |
| $65,000 to $74,999 | 14 (12.5%) | 0 (0.0%) |
| $75,000 to $99,999 | 28 (25.0%) | 0 (0.0%) |
| $100,000+ | 0 (0.0%) | 5 (4.7%) |
| Total | 112 (100.0%) | 107 (100.0%) |
Earnings by Sex by Educational Attainment in Fairfield
Average earnings in Fairfield are $68,125 for men and $32,188 for women, a difference of 52.7%. Men with an educational attainment of high school diploma enjoy the highest average annual earnings of $69,000, while those with high school diploma education earn the least with $69,000. Women with an educational attainment of college or associate's degree earn the most with the average annual earnings of $60,938, while those with high school diploma education have the smallest earnings of $26,705.
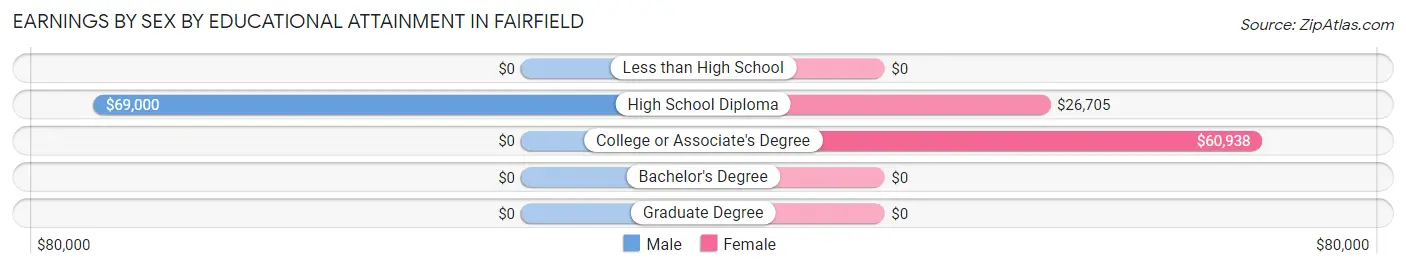
| Educational Attainment | Male Income | Female Income |
| Less than High School | - | - |
| High School Diploma | $69,000 | $26,705 |
| College or Associate's Degree | - | - |
| Bachelor's Degree | - | - |
| Graduate Degree | - | - |
| Total | $68,125 | $32,188 |
Family Income in Fairfield
Family Income Brackets in Fairfield
According to the Fairfield family income data, there are 34 families falling into the $100,000 to $149,999 income range, which is the most common income bracket and makes up 27.9% of all families.
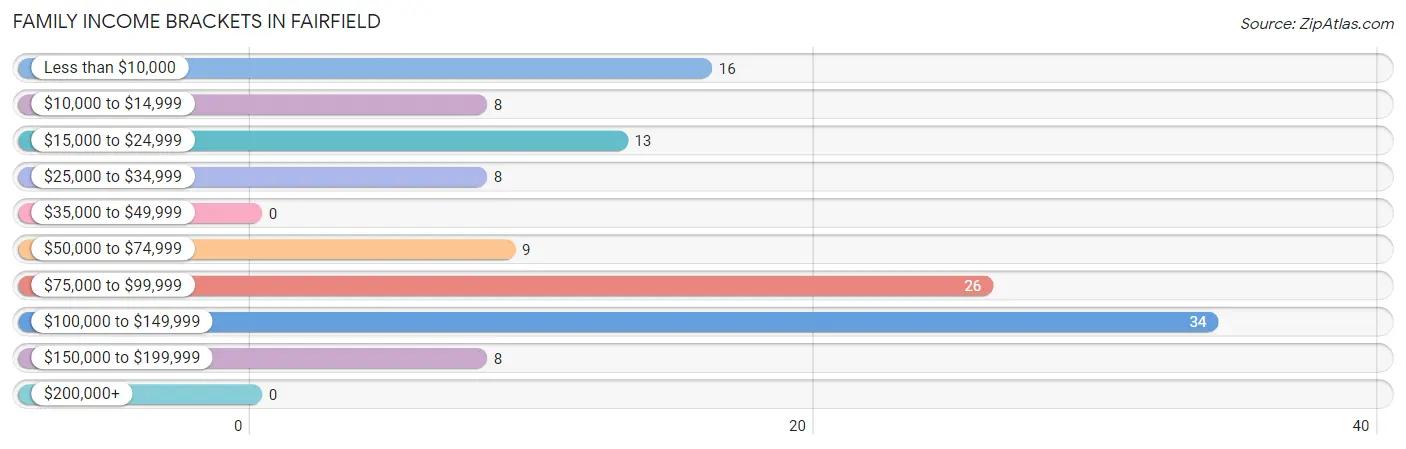
| Income Bracket | # Families | % Families |
| Less than $10,000 | 16 | 13.1% |
| $10,000 to $14,999 | 8 | 6.6% |
| $15,000 to $24,999 | 13 | 10.7% |
| $25,000 to $34,999 | 8 | 6.6% |
| $35,000 to $49,999 | 0 | 0.0% |
| $50,000 to $74,999 | 9 | 7.4% |
| $75,000 to $99,999 | 26 | 21.3% |
| $100,000 to $149,999 | 34 | 27.9% |
| $150,000 to $199,999 | 8 | 6.6% |
| $200,000+ | 0 | 0.0% |
Family Income by Famaliy Size in Fairfield
3-person families (18 | 14.7%) account for the highest median family income in Fairfield with $101,250 per family, while 3-person families (18 | 14.7%) have the highest median income of $33,750 per family member.
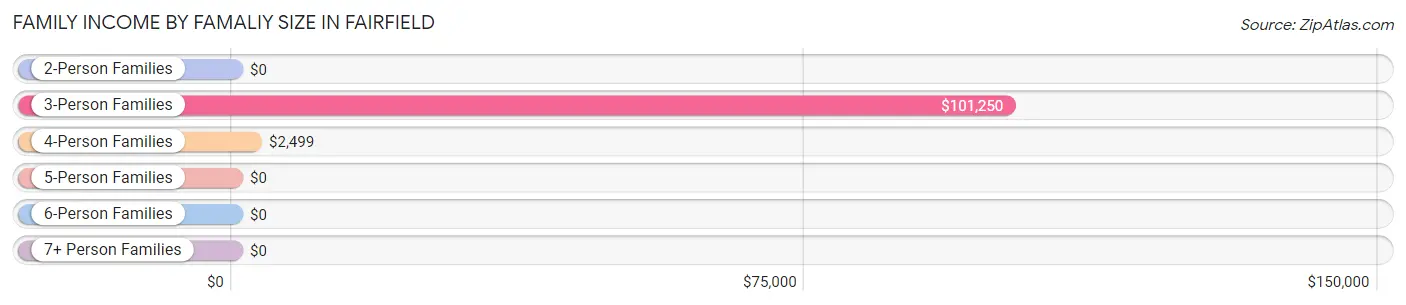
| Income Bracket | # Families | Median Income |
| 2-Person Families | 55 (45.1%) | $0 |
| 3-Person Families | 18 (14.7%) | $101,250 |
| 4-Person Families | 19 (15.6%) | $2,499 |
| 5-Person Families | 12 (9.8%) | $0 |
| 6-Person Families | 14 (11.5%) | $0 |
| 7+ Person Families | 4 (3.3%) | $0 |
| Total | 122 (100.0%) | $83,667 |
Family Income by Number of Earners in Fairfield
The median family income in Fairfield is $83,667, with families comprising 3+ earners (15) having the highest median family income of $150,156, while families with no earners (51) have the lowest median family income of $20,375, accounting for 12.3% and 41.8% of families, respectively.
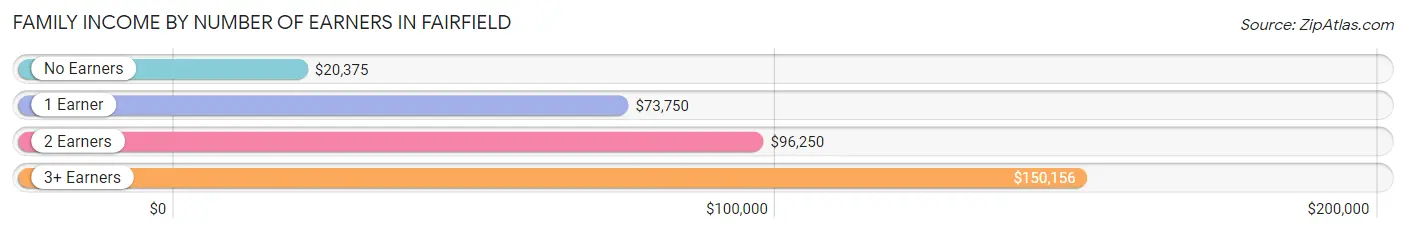
| Number of Earners | # Families | Median Income |
| No Earners | 51 (41.8%) | $20,375 |
| 1 Earner | 20 (16.4%) | $73,750 |
| 2 Earners | 36 (29.5%) | $96,250 |
| 3+ Earners | 15 (12.3%) | $150,156 |
| Total | 122 (100.0%) | $83,667 |
Household Income in Fairfield
Household Income Brackets in Fairfield
With 44 households falling in the category, the $75,000 to $99,999 income range is the most frequent in Fairfield, accounting for 25.6% of all households.
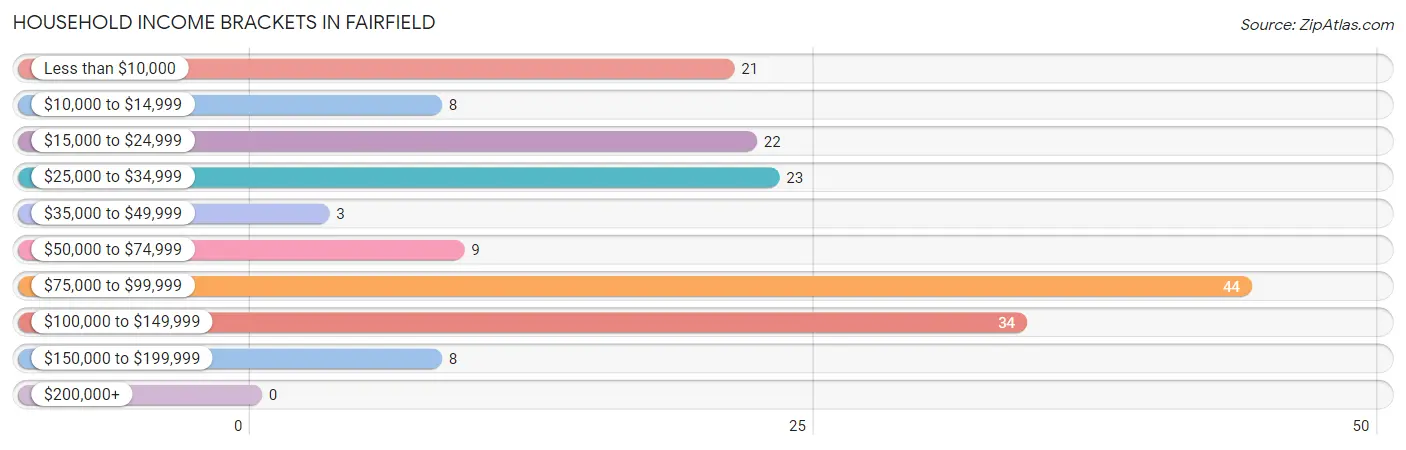
| Income Bracket | # Households | % Households |
| Less than $10,000 | 21 | 12.2% |
| $10,000 to $14,999 | 8 | 4.7% |
| $15,000 to $24,999 | 22 | 12.8% |
| $25,000 to $34,999 | 23 | 13.4% |
| $35,000 to $49,999 | 3 | 1.7% |
| $50,000 to $74,999 | 9 | 5.2% |
| $75,000 to $99,999 | 44 | 25.6% |
| $100,000 to $149,999 | 34 | 19.8% |
| $150,000 to $199,999 | 8 | 4.7% |
| $200,000+ | 0 | 0.0% |
Household Income by Householder Age in Fairfield
The median household income in Fairfield is $70,000, with the highest median household income of $85,000 found in the 25 to 44 years age bracket for the primary householder. A total of 36 households (20.9%) fall into this category.
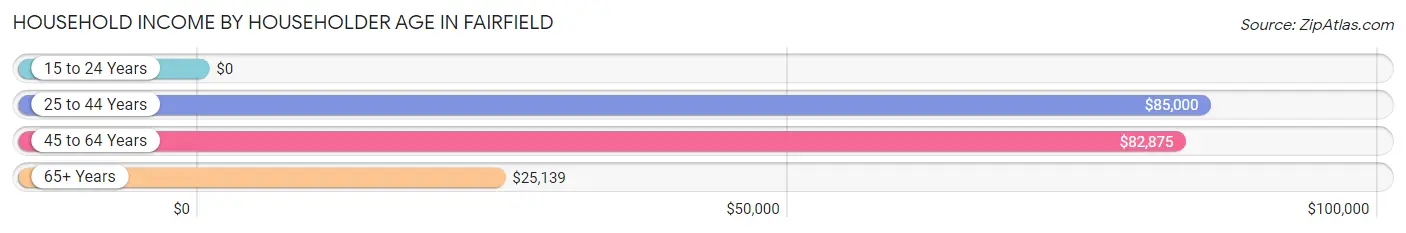
| Income Bracket | # Households | Median Income |
| 15 to 24 Years | 0 (0.0%) | $0 |
| 25 to 44 Years | 36 (20.9%) | $85,000 |
| 45 to 64 Years | 71 (41.3%) | $82,875 |
| 65+ Years | 65 (37.8%) | $25,139 |
| Total | 172 (100.0%) | $70,000 |
Poverty in Fairfield
Income Below Poverty by Sex and Age in Fairfield
With 19.2% poverty level for males and 13.1% for females among the residents of Fairfield, 12 to 14 year old males and under 5 year old females are the most vulnerable to poverty, with 12 males (100.0%) and 11 females (100.0%) in their respective age groups living below the poverty level.
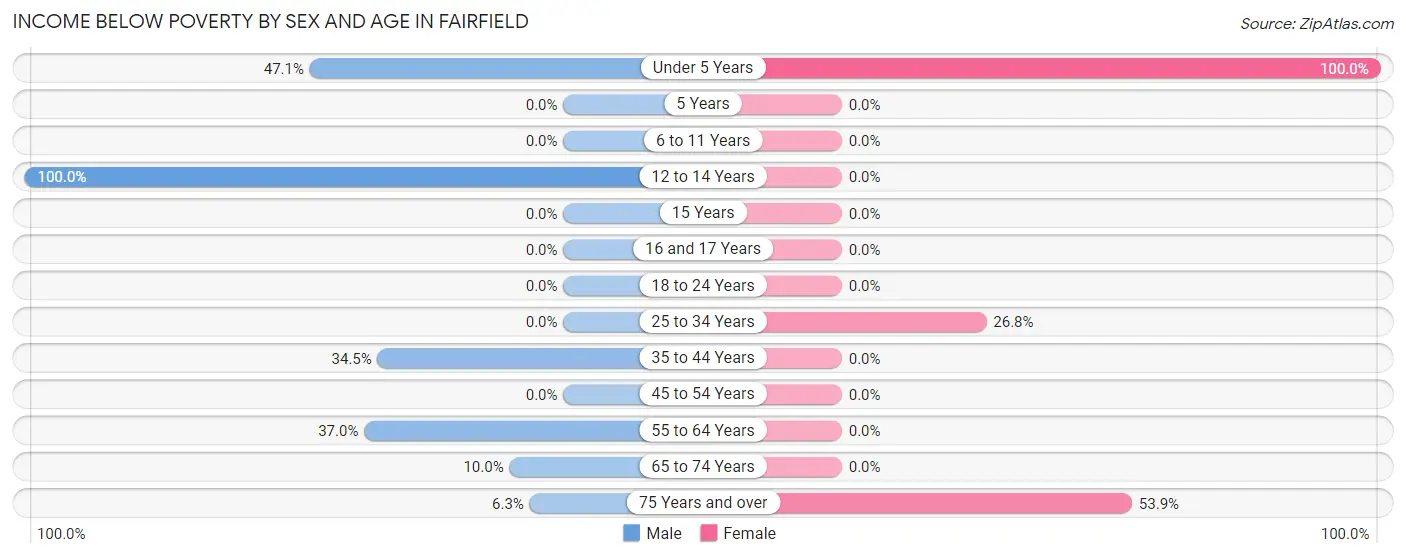
| Age Bracket | Male | Female |
| Under 5 Years | 8 (47.1%) | 11 (100.0%) |
| 5 Years | 0 (0.0%) | 0 (0.0%) |
| 6 to 11 Years | 0 (0.0%) | 0 (0.0%) |
| 12 to 14 Years | 12 (100.0%) | 0 (0.0%) |
| 15 Years | 0 (0.0%) | 0 (0.0%) |
| 16 and 17 Years | 0 (0.0%) | 0 (0.0%) |
| 18 to 24 Years | 0 (0.0%) | 0 (0.0%) |
| 25 to 34 Years | 0 (0.0%) | 11 (26.8%) |
| 35 to 44 Years | 10 (34.5%) | 0 (0.0%) |
| 45 to 54 Years | 0 (0.0%) | 0 (0.0%) |
| 55 to 64 Years | 17 (37.0%) | 0 (0.0%) |
| 65 to 74 Years | 2 (10.0%) | 0 (0.0%) |
| 75 Years and over | 1 (6.2%) | 14 (53.8%) |
| Total | 50 (19.2%) | 36 (13.1%) |
Income Above Poverty by Sex and Age in Fairfield
According to the poverty statistics in Fairfield, males aged 6 to 11 years and females aged 6 to 11 years are the age groups that are most secure financially, with 100.0% of males and 100.0% of females in these age groups living above the poverty line.
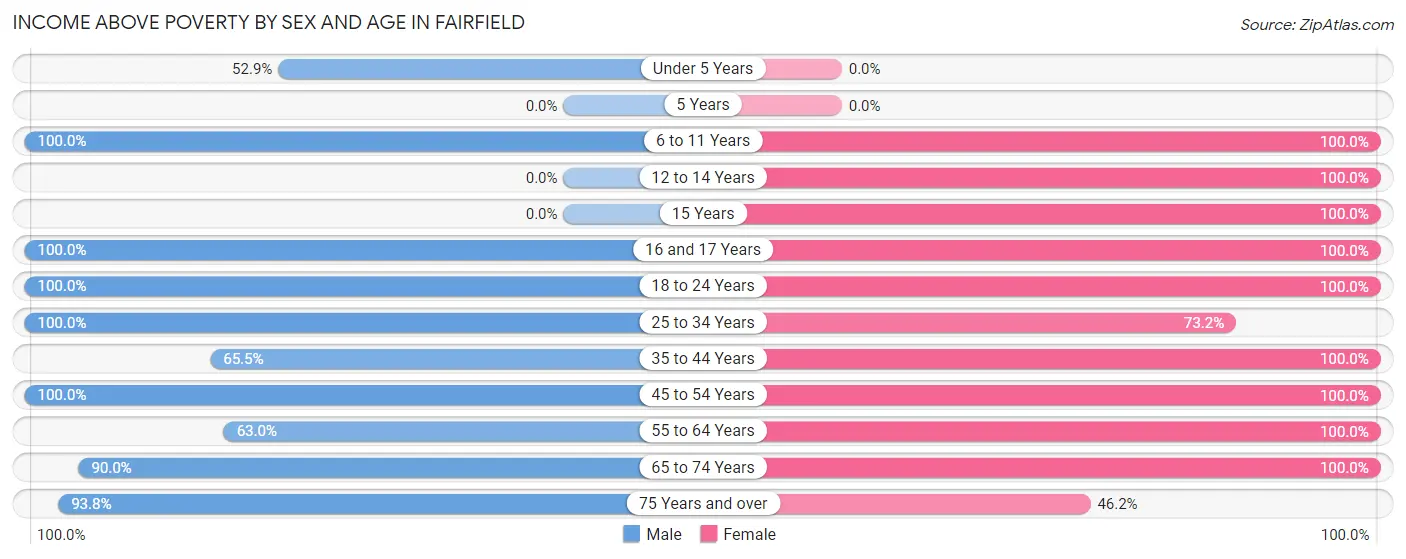
| Age Bracket | Male | Female |
| Under 5 Years | 9 (52.9%) | 0 (0.0%) |
| 5 Years | 0 (0.0%) | 0 (0.0%) |
| 6 to 11 Years | 31 (100.0%) | 23 (100.0%) |
| 12 to 14 Years | 0 (0.0%) | 22 (100.0%) |
| 15 Years | 0 (0.0%) | 4 (100.0%) |
| 16 and 17 Years | 6 (100.0%) | 14 (100.0%) |
| 18 to 24 Years | 35 (100.0%) | 11 (100.0%) |
| 25 to 34 Years | 5 (100.0%) | 30 (73.2%) |
| 35 to 44 Years | 19 (65.5%) | 35 (100.0%) |
| 45 to 54 Years | 43 (100.0%) | 34 (100.0%) |
| 55 to 64 Years | 29 (63.0%) | 21 (100.0%) |
| 65 to 74 Years | 18 (90.0%) | 33 (100.0%) |
| 75 Years and over | 15 (93.8%) | 12 (46.2%) |
| Total | 210 (80.8%) | 239 (86.9%) |
Income Below Poverty Among Married-Couple Families in Fairfield
The poverty statistics for married-couple families in Fairfield show that 17.5% or 18 of the total 103 families live below the poverty line. Families with 1 or 2 children have the highest poverty rate of 40.0%, comprising of 10 families. On the other hand, families with 3 or 4 children have the lowest poverty rate of 0.0%, which includes 0 families.
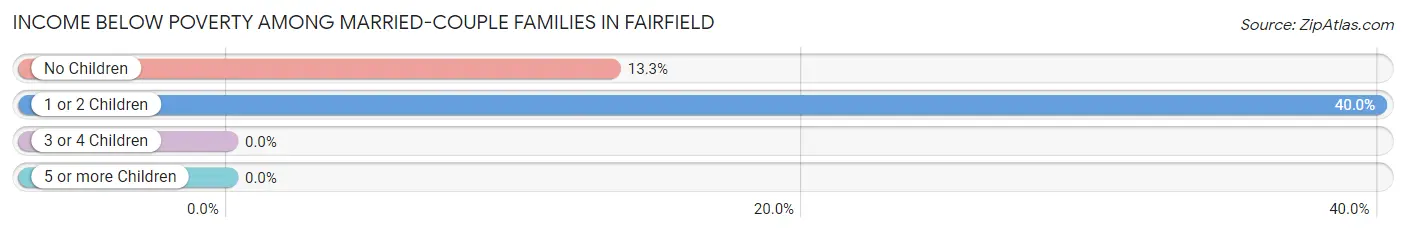
| Children | Above Poverty | Below Poverty |
| No Children | 52 (86.7%) | 8 (13.3%) |
| 1 or 2 Children | 15 (60.0%) | 10 (40.0%) |
| 3 or 4 Children | 14 (100.0%) | 0 (0.0%) |
| 5 or more Children | 4 (100.0%) | 0 (0.0%) |
| Total | 85 (82.5%) | 18 (17.5%) |
Income Below Poverty Among Single-Parent Households in Fairfield
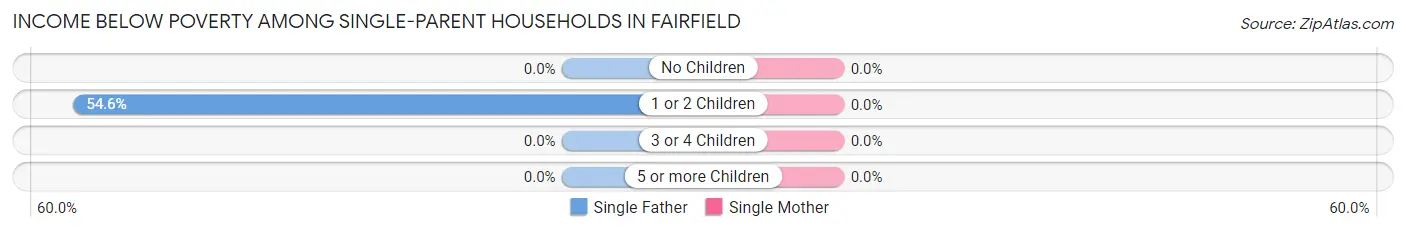
| Children | Single Father | Single Mother |
| No Children | 0 (0.0%) | 0 (0.0%) |
| 1 or 2 Children | 6 (54.5%) | 0 (0.0%) |
| 3 or 4 Children | 0 (0.0%) | 0 (0.0%) |
| 5 or more Children | 0 (0.0%) | 0 (0.0%) |
| Total | 6 (54.5%) | 0 (0.0%) |
Income Below Poverty Among Married-Couple vs Single-Parent Households in Fairfield
The poverty data for Fairfield shows that 18 of the married-couple family households (17.5%) and 6 of the single-parent households (31.6%) are living below the poverty level. Within the married-couple family households, those with 1 or 2 children have the highest poverty rate, with 10 households (40.0%) falling below the poverty line. Among the single-parent households, those with 1 or 2 children have the highest poverty rate, with 6 household (42.9%) living below poverty.
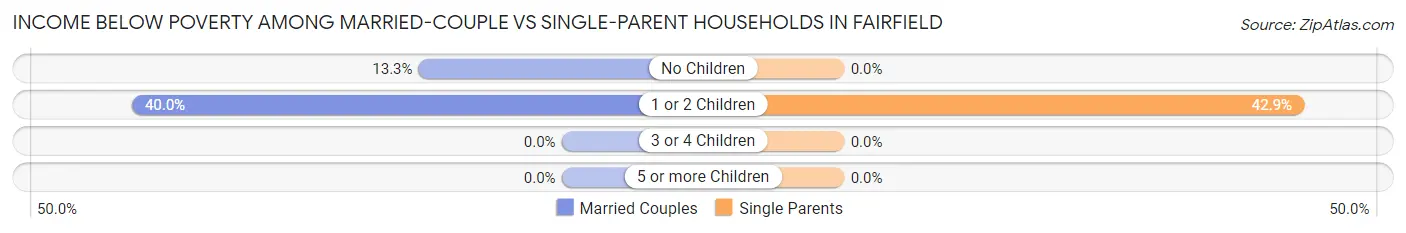
| Children | Married-Couple Families | Single-Parent Households |
| No Children | 8 (13.3%) | 0 (0.0%) |
| 1 or 2 Children | 10 (40.0%) | 6 (42.9%) |
| 3 or 4 Children | 0 (0.0%) | 0 (0.0%) |
| 5 or more Children | 0 (0.0%) | 0 (0.0%) |
| Total | 18 (17.5%) | 6 (31.6%) |
Race in Fairfield
The most populous races in Fairfield are Native / Alaskan (273 | 51.0%), White / Caucasian (137 | 25.6%), and Two or more Races (117 | 21.9%).
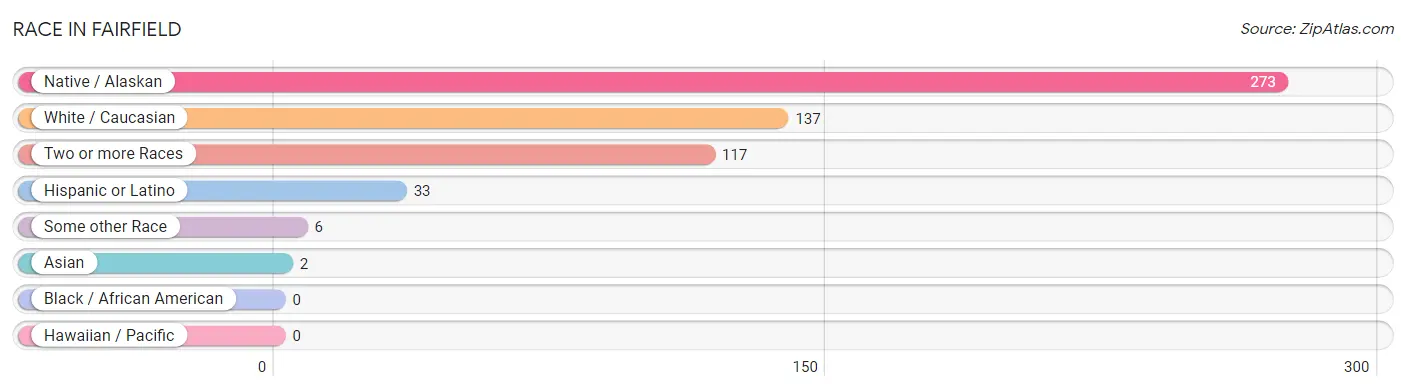
| Race | # Population | % Population |
| Asian | 2 | 0.4% |
| Black / African American | 0 | 0.0% |
| Hawaiian / Pacific | 0 | 0.0% |
| Hispanic or Latino | 33 | 6.2% |
| Native / Alaskan | 273 | 51.0% |
| White / Caucasian | 137 | 25.6% |
| Two or more Races | 117 | 21.9% |
| Some other Race | 6 | 1.1% |
| Total | 535 | 100.0% |
Ancestry in Fairfield
The most populous ancestries reported in Fairfield are Cherokee (373 | 69.7%), Irish (28 | 5.2%), Mexican (23 | 4.3%), Spaniard (10 | 1.9%), and Dutch (8 | 1.5%), together accounting for 82.6% of all Fairfield residents.
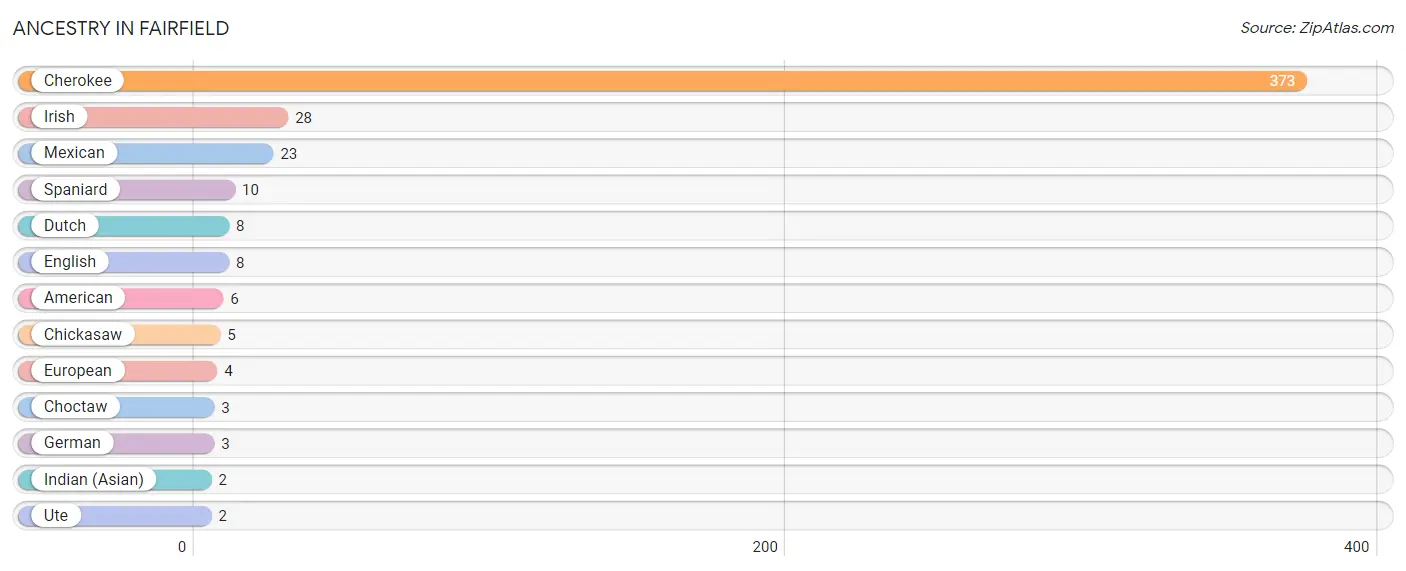
| Ancestry | # Population | % Population |
| American | 6 | 1.1% |
| Cherokee | 373 | 69.7% |
| Chickasaw | 5 | 0.9% |
| Choctaw | 3 | 0.6% |
| Dutch | 8 | 1.5% |
| English | 8 | 1.5% |
| European | 4 | 0.7% |
| German | 3 | 0.6% |
| Indian (Asian) | 2 | 0.4% |
| Irish | 28 | 5.2% |
| Mexican | 23 | 4.3% |
| Spaniard | 10 | 1.9% |
| Ute | 2 | 0.4% | View All 13 Rows |
Immigrants in Fairfield
The most numerous immigrant groups reported in Fairfield came from Central America (6 | 1.1%), Latin America (6 | 1.1%), Mexico (6 | 1.1%), Asia (2 | 0.4%), and China (2 | 0.4%), together accounting for 4.1% of all Fairfield residents.
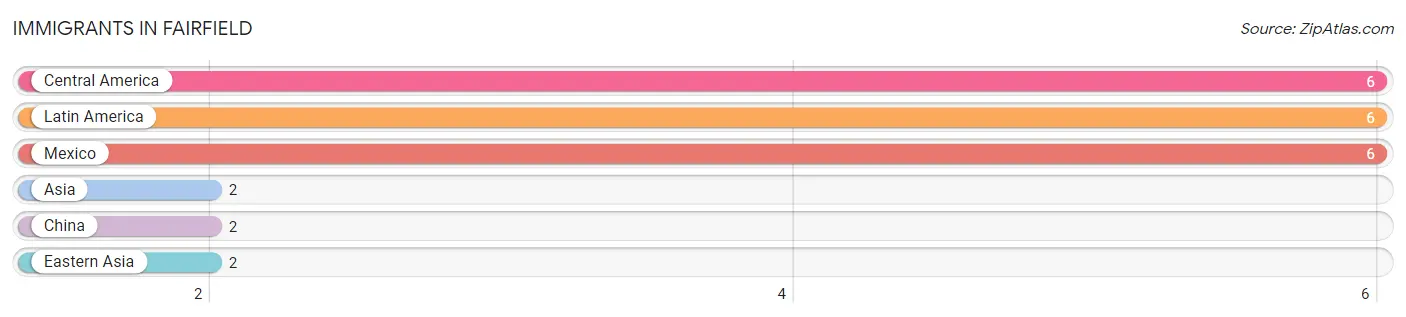
| Immigration Origin | # Population | % Population |
| Asia | 2 | 0.4% |
| Central America | 6 | 1.1% |
| China | 2 | 0.4% |
| Eastern Asia | 2 | 0.4% |
| Latin America | 6 | 1.1% |
| Mexico | 6 | 1.1% | View All 6 Rows |
Sex and Age in Fairfield
Sex and Age in Fairfield
The most populous age groups in Fairfield are 10 to 14 Years (43 | 16.5%) for men and 25 to 29 Years (41 | 14.9%) for women.
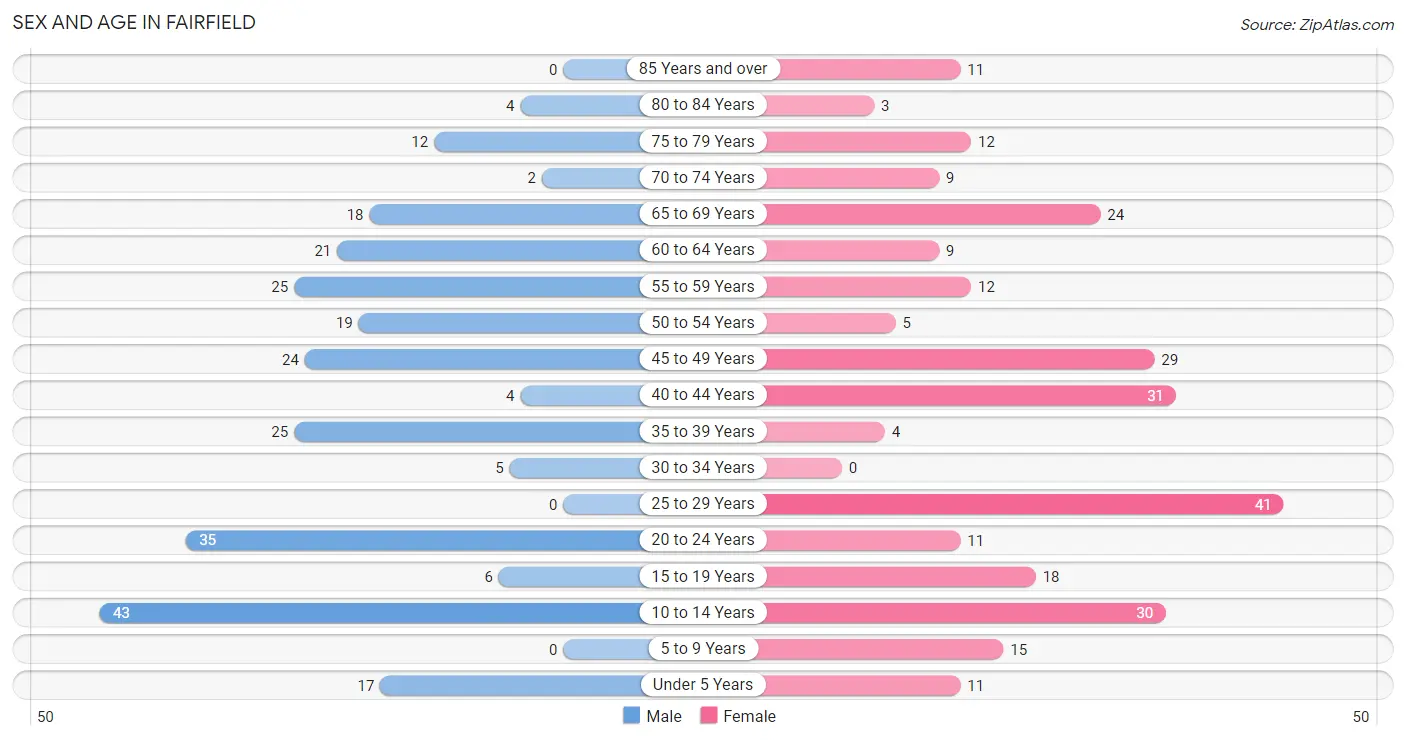
| Age Bracket | Male | Female |
| Under 5 Years | 17 (6.5%) | 11 (4.0%) |
| 5 to 9 Years | 0 (0.0%) | 15 (5.4%) |
| 10 to 14 Years | 43 (16.5%) | 30 (10.9%) |
| 15 to 19 Years | 6 (2.3%) | 18 (6.6%) |
| 20 to 24 Years | 35 (13.5%) | 11 (4.0%) |
| 25 to 29 Years | 0 (0.0%) | 41 (14.9%) |
| 30 to 34 Years | 5 (1.9%) | 0 (0.0%) |
| 35 to 39 Years | 25 (9.6%) | 4 (1.5%) |
| 40 to 44 Years | 4 (1.5%) | 31 (11.3%) |
| 45 to 49 Years | 24 (9.2%) | 29 (10.5%) |
| 50 to 54 Years | 19 (7.3%) | 5 (1.8%) |
| 55 to 59 Years | 25 (9.6%) | 12 (4.4%) |
| 60 to 64 Years | 21 (8.1%) | 9 (3.3%) |
| 65 to 69 Years | 18 (6.9%) | 24 (8.7%) |
| 70 to 74 Years | 2 (0.8%) | 9 (3.3%) |
| 75 to 79 Years | 12 (4.6%) | 12 (4.4%) |
| 80 to 84 Years | 4 (1.5%) | 3 (1.1%) |
| 85 Years and over | 0 (0.0%) | 11 (4.0%) |
| Total | 260 (100.0%) | 275 (100.0%) |
Families and Households in Fairfield
Median Family Size in Fairfield
The median family size in Fairfield is 3.93 persons per family, with single female/mother families (8 | 6.6%) accounting for the largest median family size of 4.5 persons per family. On the other hand, single male/father families (11 | 9.0%) represent the smallest median family size with 3.55 persons per family.
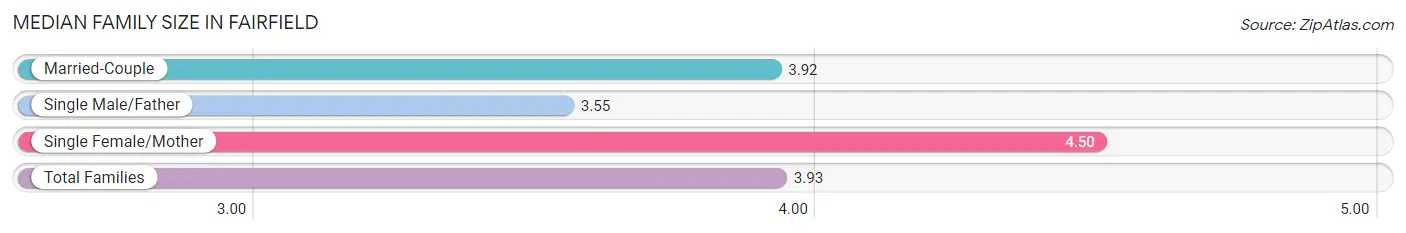
| Family Type | # Families | Family Size |
| Married-Couple | 103 (84.4%) | 3.92 |
| Single Male/Father | 11 (9.0%) | 3.55 |
| Single Female/Mother | 8 (6.6%) | 4.50 |
| Total Families | 122 (100.0%) | 3.93 |
Median Household Size in Fairfield
The median household size in Fairfield is 3.11 persons per household, with single female/mother households (8 | 4.6%) accounting for the largest median household size of 4.5 persons per household. non-family households (50 | 29.1%) represent the smallest median household size with 1.12 persons per household.
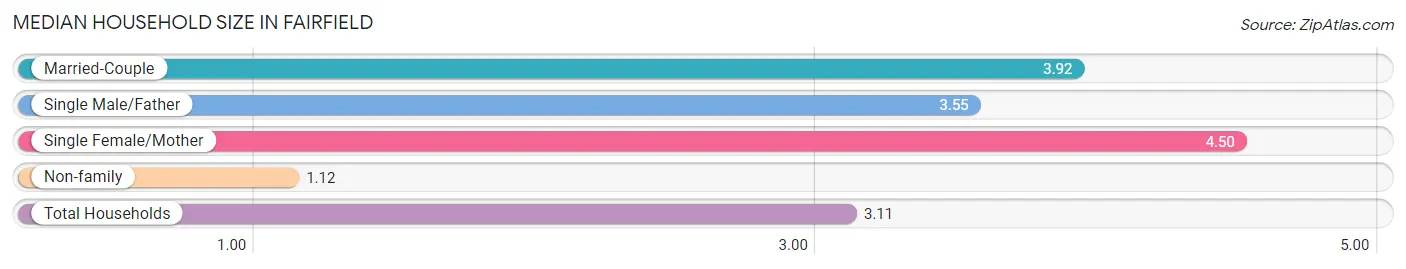
| Household Type | # Households | Household Size |
| Married-Couple | 103 (59.9%) | 3.92 |
| Single Male/Father | 11 (6.4%) | 3.55 |
| Single Female/Mother | 8 (4.6%) | 4.50 |
| Non-family | 50 (29.1%) | 1.12 |
| Total Households | 172 (100.0%) | 3.11 |
Household Size by Marriage Status in Fairfield
Out of a total of 172 households in Fairfield, 122 (70.9%) are family households, while 50 (29.1%) are nonfamily households. The most numerous type of family households are 2-person households, comprising 55, and the most common type of nonfamily households are 1-person households, comprising 44.
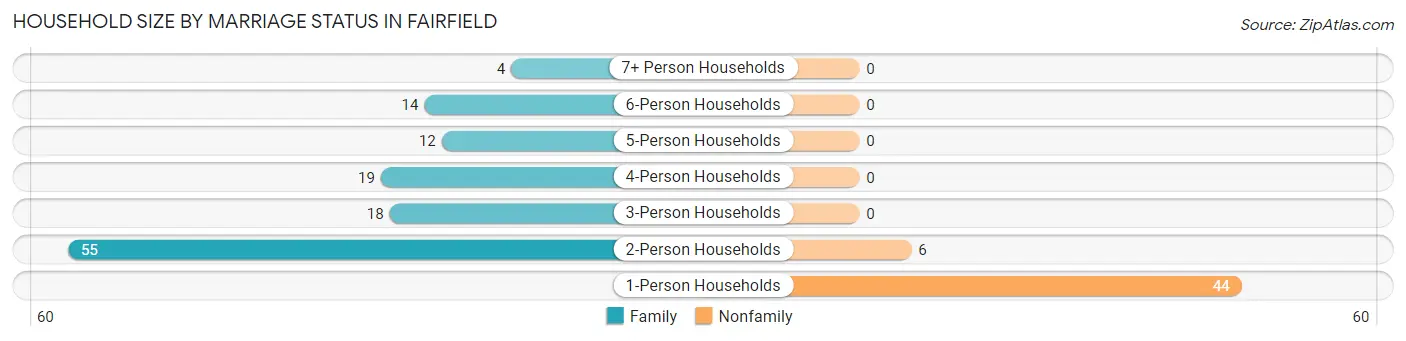
| Household Size | Family Households | Nonfamily Households |
| 1-Person Households | - | 44 (25.6%) |
| 2-Person Households | 55 (32.0%) | 6 (3.5%) |
| 3-Person Households | 18 (10.5%) | 0 (0.0%) |
| 4-Person Households | 19 (11.1%) | 0 (0.0%) |
| 5-Person Households | 12 (7.0%) | 0 (0.0%) |
| 6-Person Households | 14 (8.1%) | 0 (0.0%) |
| 7+ Person Households | 4 (2.3%) | 0 (0.0%) |
| Total | 122 (70.9%) | 50 (29.1%) |
Female Fertility in Fairfield
Fertility by Age in Fairfield
| Age Bracket | Women with Births | Births / 1,000 Women |
| 15 to 19 years | 0 (0.0%) | 0.0 |
| 20 to 34 years | 0 (0.0%) | 0.0 |
| 35 to 50 years | 0 (0.0%) | 0.0 |
| Total | 0 (0.0%) | 0.0 |
Fertility by Age by Marriage Status in Fairfield
| Age Bracket | Married | Unmarried |
| 15 to 19 years | 0 (0.0%) | 0 (0.0%) |
| 20 to 34 years | 0 (0.0%) | 0 (0.0%) |
| 35 to 50 years | 0 (0.0%) | 0 (0.0%) |
| Total | 0 (0.0%) | 0 (0.0%) |
Fertility by Education in Fairfield
| Educational Attainment | Women with Births | Births / 1,000 Women |
| Less than High School | 0 (0.0%) | 0.0 |
| High School Diploma | 0 (0.0%) | 0.0 |
| College or Associate's Degree | 0 (0.0%) | 0.0 |
| Bachelor's Degree | 0 (0.0%) | 0.0 |
| Graduate Degree | 0 (0.0%) | 0.0 |
| Total | 0 (0.0%) | 0.0 |
Fertility by Education by Marriage Status in Fairfield
| Educational Attainment | Married | Unmarried |
| Less than High School | 0 (0.0%) | 0 (0.0%) |
| High School Diploma | 0 (0.0%) | 0 (0.0%) |
| College or Associate's Degree | 0 (0.0%) | 0 (0.0%) |
| Bachelor's Degree | 0 (0.0%) | 0 (0.0%) |
| Graduate Degree | 0 (0.0%) | 0 (0.0%) |
| Total | 0 (0.0%) | 0 (0.0%) |
Employment Characteristics in Fairfield
Employment by Class of Employer in Fairfield
Among the 204 employed individuals in Fairfield, private company employees (100 | 49.0%), local government employees (43 | 21.1%), and state government employees (32 | 15.7%) make up the most common classes of employment.
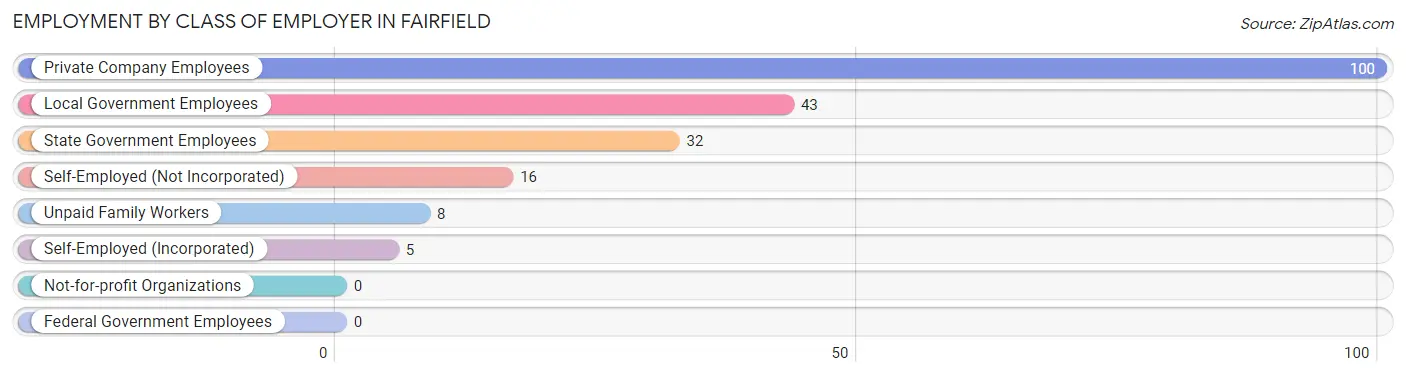
| Employer Class | # Employees | % Employees |
| Private Company Employees | 100 | 49.0% |
| Self-Employed (Incorporated) | 5 | 2.5% |
| Self-Employed (Not Incorporated) | 16 | 7.8% |
| Not-for-profit Organizations | 0 | 0.0% |
| Local Government Employees | 43 | 21.1% |
| State Government Employees | 32 | 15.7% |
| Federal Government Employees | 0 | 0.0% |
| Unpaid Family Workers | 8 | 3.9% |
| Total | 204 | 100.0% |
Employment Status by Age in Fairfield
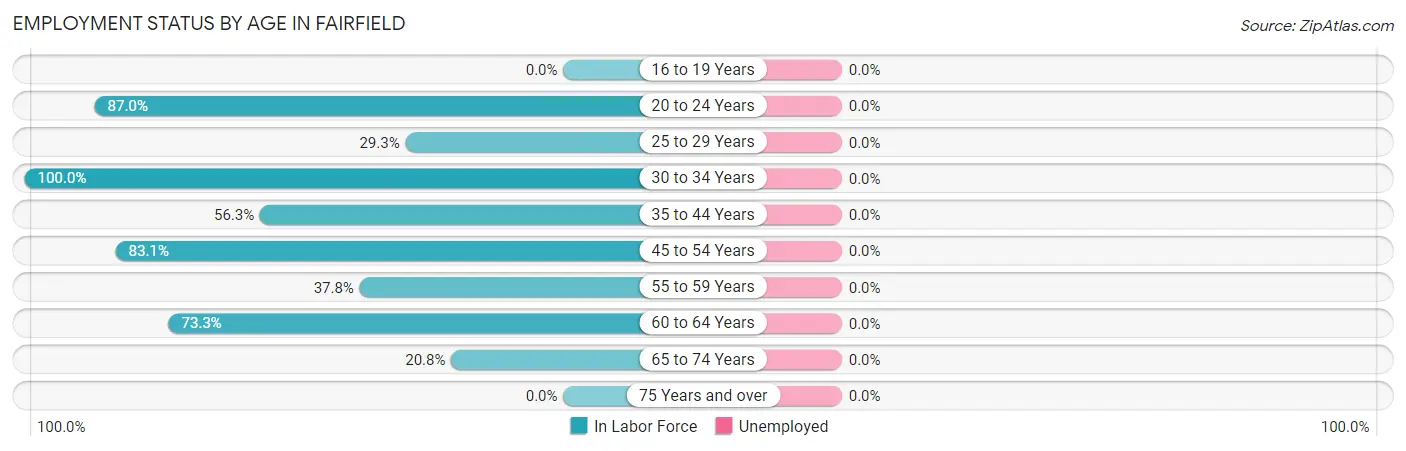
| Age Bracket | In Labor Force | Unemployed |
| 16 to 19 Years | 0 (0.0%) | 0 (0.0%) |
| 20 to 24 Years | 40 (87.0%) | 0 (0.0%) |
| 25 to 29 Years | 12 (29.3%) | 0 (0.0%) |
| 30 to 34 Years | 5 (100.0%) | 0 (0.0%) |
| 35 to 44 Years | 36 (56.3%) | 0 (0.0%) |
| 45 to 54 Years | 64 (83.1%) | 0 (0.0%) |
| 55 to 59 Years | 14 (37.8%) | 0 (0.0%) |
| 60 to 64 Years | 22 (73.3%) | 0 (0.0%) |
| 65 to 74 Years | 11 (20.8%) | 0 (0.0%) |
| 75 Years and over | 0 (0.0%) | 0 (0.0%) |
| Total | 204 (49.2%) | 0 (0.0%) |
Employment Status by Educational Attainment in Fairfield
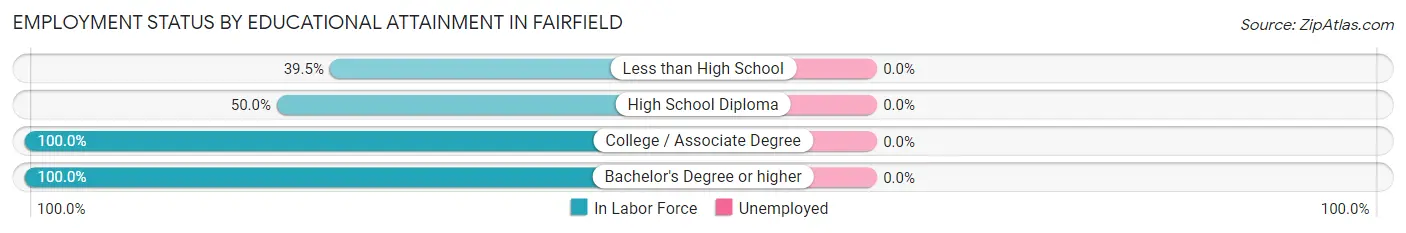
| Educational Attainment | In Labor Force | Unemployed |
| Less than High School | 17 (39.5%) | 0 (0.0%) |
| High School Diploma | 75 (50.0%) | 0 (0.0%) |
| College / Associate Degree | 44 (100.0%) | 0 (0.0%) |
| Bachelor's Degree or higher | 17 (100.0%) | 0 (0.0%) |
| Total | 153 (60.2%) | 0 (0.0%) |
Employment Occupations by Sex in Fairfield
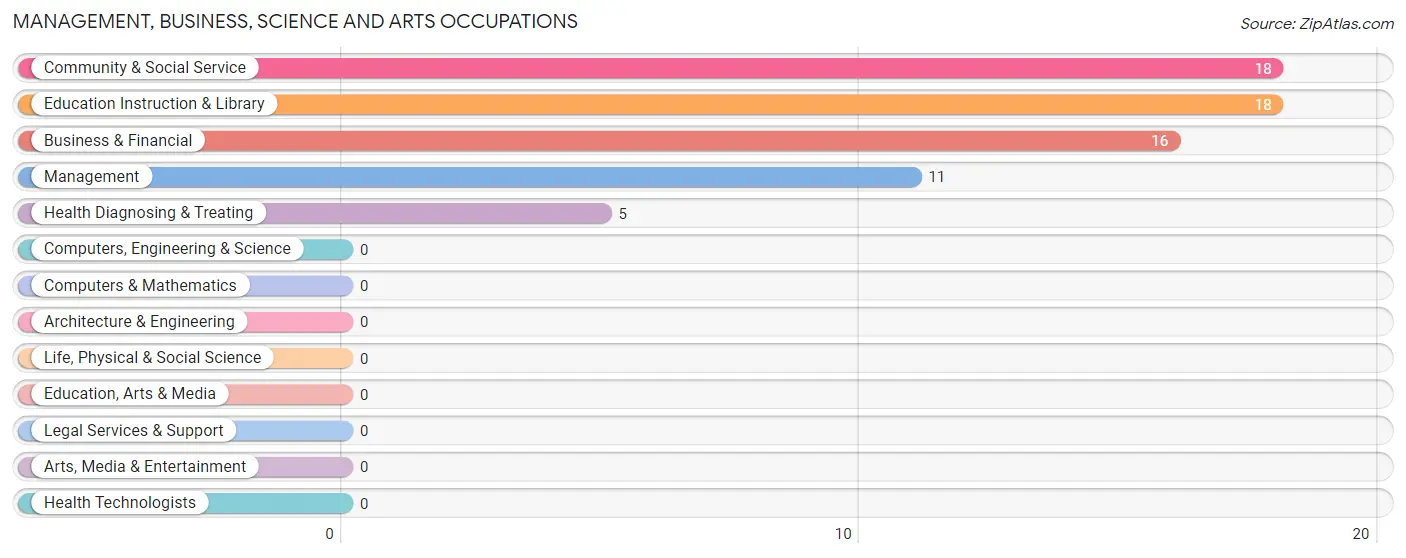
Management, Business, Science and Arts Occupations
The most common Management, Business, Science and Arts occupations in Fairfield are Community & Social Service (18 | 8.8%), Education Instruction & Library (18 | 8.8%), Business & Financial (16 | 7.8%), Management (11 | 5.4%), and Health Diagnosing & Treating (5 | 2.5%).
Management, Business, Science and Arts Occupations by Sex
Within the Management, Business, Science and Arts occupations in Fairfield, the most male-oriented occupations are Business & Financial (100.0%), Health Diagnosing & Treating (100.0%), and Management (54.5%), while the most female-oriented occupations are Community & Social Service (72.2%), Education Instruction & Library (72.2%), and Management (45.5%).
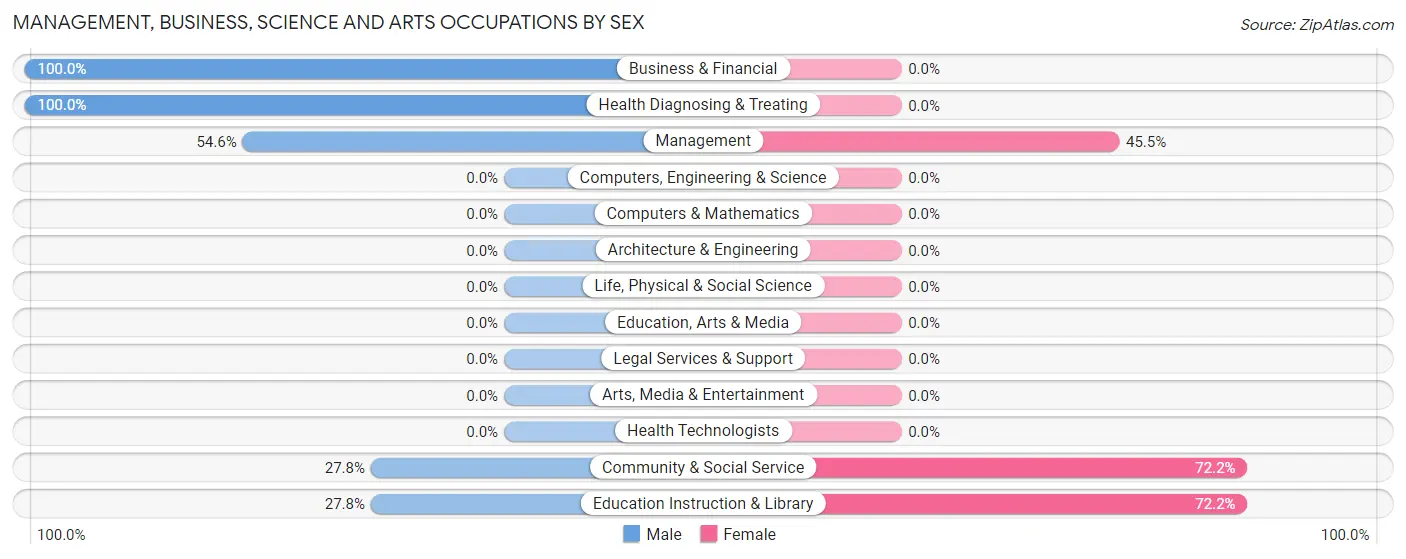
| Occupation | Male | Female |
| Management | 6 (54.5%) | 5 (45.5%) |
| Business & Financial | 16 (100.0%) | 0 (0.0%) |
| Computers, Engineering & Science | 0 (0.0%) | 0 (0.0%) |
| Computers & Mathematics | 0 (0.0%) | 0 (0.0%) |
| Architecture & Engineering | 0 (0.0%) | 0 (0.0%) |
| Life, Physical & Social Science | 0 (0.0%) | 0 (0.0%) |
| Community & Social Service | 5 (27.8%) | 13 (72.2%) |
| Education, Arts & Media | 0 (0.0%) | 0 (0.0%) |
| Legal Services & Support | 0 (0.0%) | 0 (0.0%) |
| Education Instruction & Library | 5 (27.8%) | 13 (72.2%) |
| Arts, Media & Entertainment | 0 (0.0%) | 0 (0.0%) |
| Health Diagnosing & Treating | 5 (100.0%) | 0 (0.0%) |
| Health Technologists | 0 (0.0%) | 0 (0.0%) |
| Total (Category) | 32 (64.0%) | 18 (36.0%) |
| Total (Overall) | 106 (52.0%) | 98 (48.0%) |
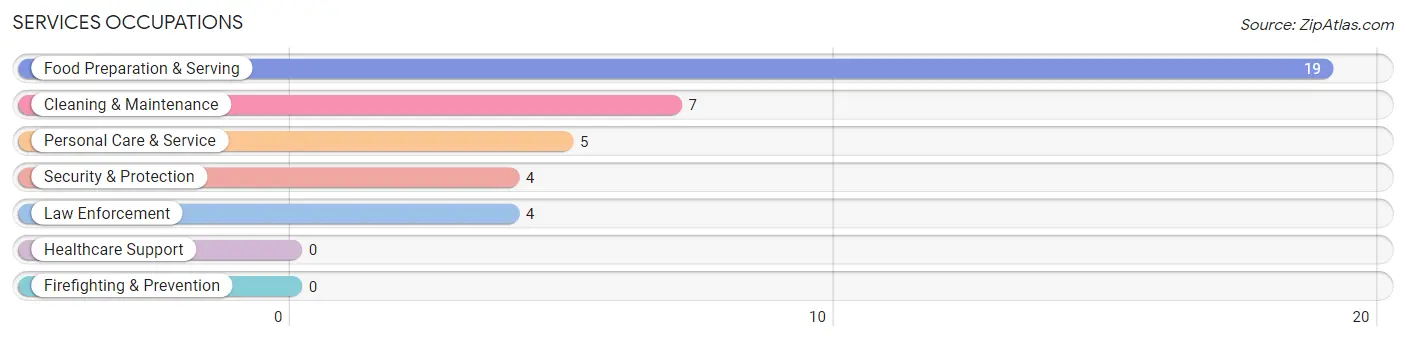
Services Occupations
The most common Services occupations in Fairfield are Food Preparation & Serving (19 | 9.3%), Cleaning & Maintenance (7 | 3.4%), Personal Care & Service (5 | 2.5%), Security & Protection (4 | 2.0%), and Law Enforcement (4 | 2.0%).
Services Occupations by Sex
Within the Services occupations in Fairfield, the most male-oriented occupations are Security & Protection (100.0%), Law Enforcement (100.0%), and Food Preparation & Serving (100.0%), while the most female-oriented occupations are Personal Care & Service (100.0%), and Cleaning & Maintenance (42.9%).
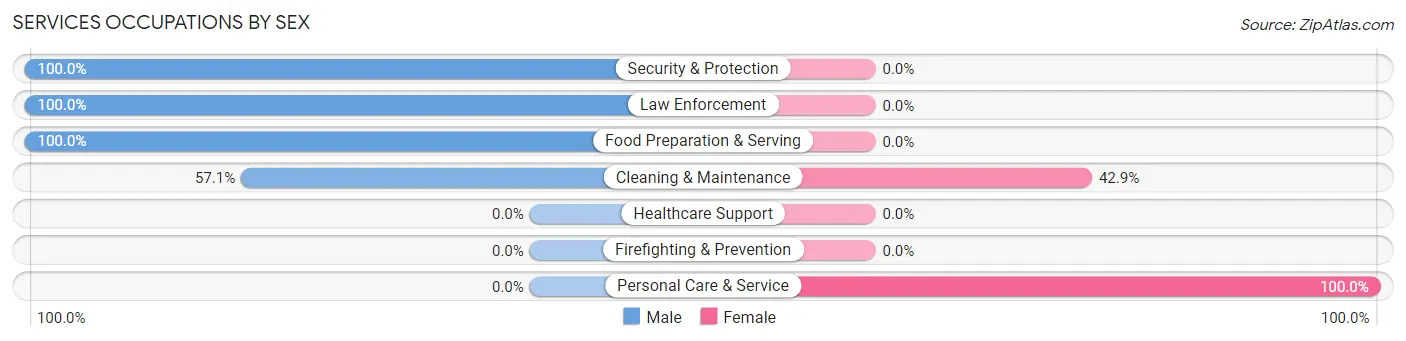
| Occupation | Male | Female |
| Healthcare Support | 0 (0.0%) | 0 (0.0%) |
| Security & Protection | 4 (100.0%) | 0 (0.0%) |
| Firefighting & Prevention | 0 (0.0%) | 0 (0.0%) |
| Law Enforcement | 4 (100.0%) | 0 (0.0%) |
| Food Preparation & Serving | 19 (100.0%) | 0 (0.0%) |
| Cleaning & Maintenance | 4 (57.1%) | 3 (42.9%) |
| Personal Care & Service | 0 (0.0%) | 5 (100.0%) |
| Total (Category) | 27 (77.1%) | 8 (22.9%) |
| Total (Overall) | 106 (52.0%) | 98 (48.0%) |
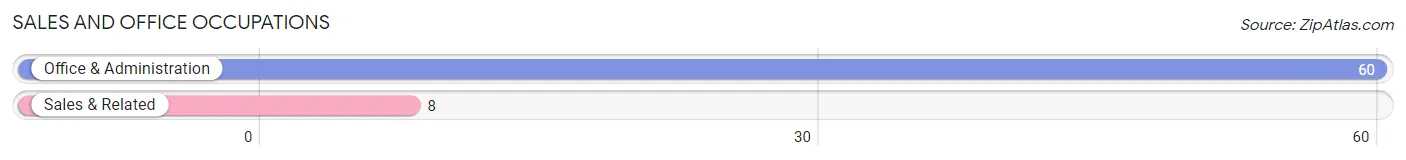
Sales and Office Occupations
The most common Sales and Office occupations in Fairfield are Office & Administration (60 | 29.4%), and Sales & Related (8 | 3.9%).
Sales and Office Occupations by Sex
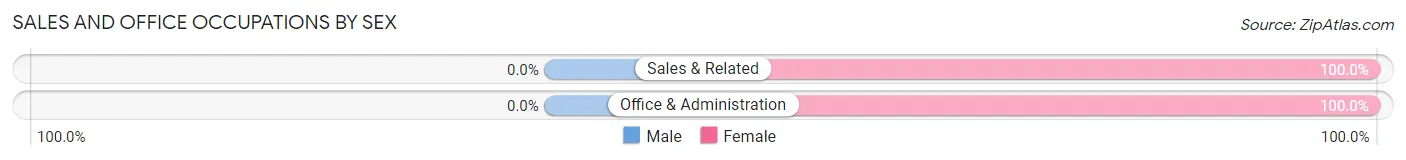
| Occupation | Male | Female |
| Sales & Related | 0 (0.0%) | 8 (100.0%) |
| Office & Administration | 0 (0.0%) | 60 (100.0%) |
| Total (Category) | 0 (0.0%) | 68 (100.0%) |
| Total (Overall) | 106 (52.0%) | 98 (48.0%) |
Natural Resources, Construction and Maintenance Occupations
The most common Natural Resources, Construction and Maintenance occupations in Fairfield are Construction & Extraction (26 | 12.8%), and Installation, Maintenance & Repair (4 | 2.0%).
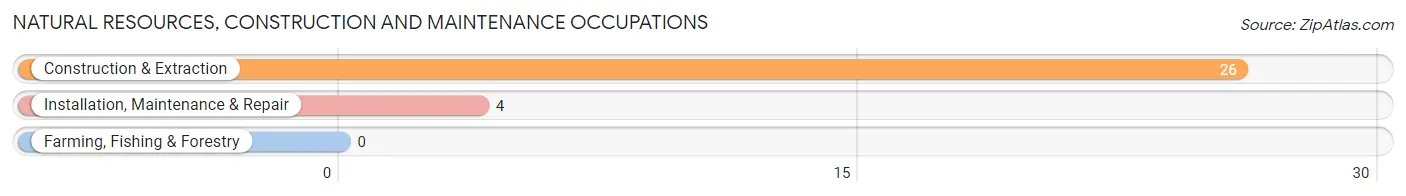
Natural Resources, Construction and Maintenance Occupations by Sex
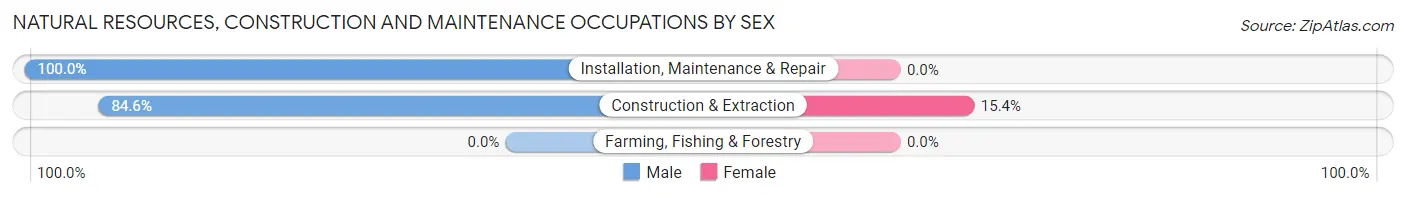
| Occupation | Male | Female |
| Farming, Fishing & Forestry | 0 (0.0%) | 0 (0.0%) |
| Construction & Extraction | 22 (84.6%) | 4 (15.4%) |
| Installation, Maintenance & Repair | 4 (100.0%) | 0 (0.0%) |
| Total (Category) | 26 (86.7%) | 4 (13.3%) |
| Total (Overall) | 106 (52.0%) | 98 (48.0%) |
Production, Transportation and Moving Occupations
The most common Production, Transportation and Moving occupations in Fairfield are Production (13 | 6.4%), Transportation (4 | 2.0%), and Material Moving (4 | 2.0%).
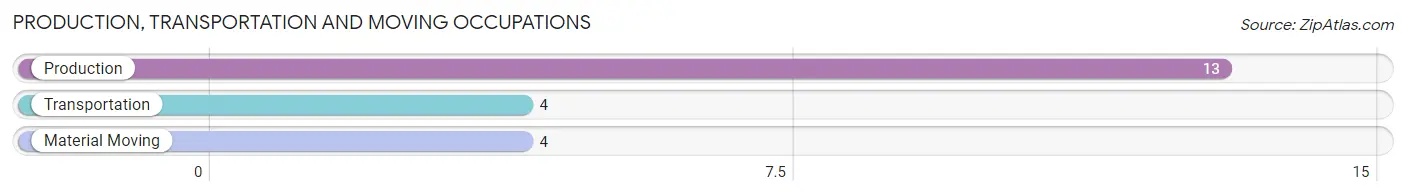
Production, Transportation and Moving Occupations by Sex
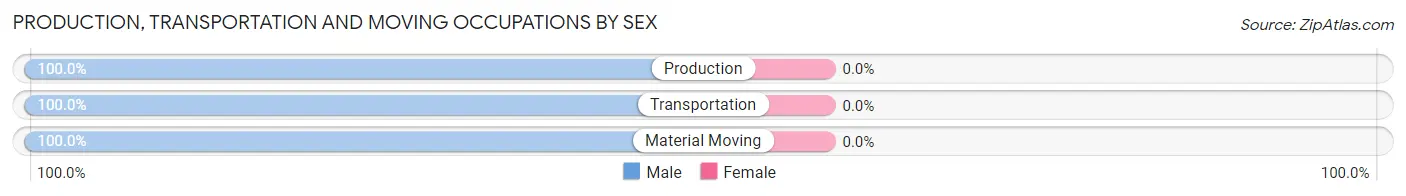
| Occupation | Male | Female |
| Production | 13 (100.0%) | 0 (0.0%) |
| Transportation | 4 (100.0%) | 0 (0.0%) |
| Material Moving | 4 (100.0%) | 0 (0.0%) |
| Total (Category) | 21 (100.0%) | 0 (0.0%) |
| Total (Overall) | 106 (52.0%) | 98 (48.0%) |
Employment Industries by Sex in Fairfield
Employment Industries in Fairfield
The major employment industries in Fairfield include Construction (30 | 14.7%), Public Administration (27 | 13.2%), Educational Services (26 | 12.8%), Accommodation & Food Services (24 | 11.8%), and Health Care & Social Assistance (22 | 10.8%).
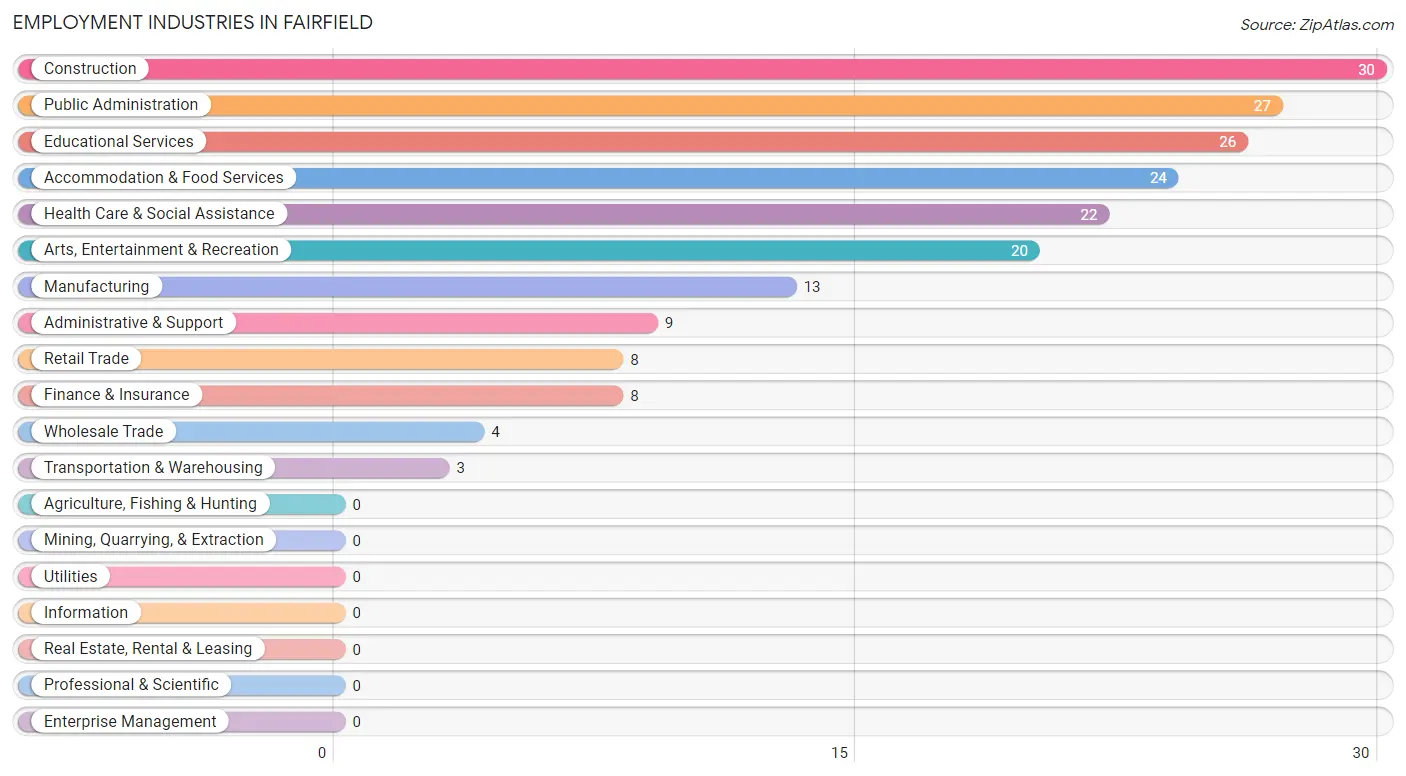
Employment Industries by Sex in Fairfield
The Fairfield industries that see more men than women are Wholesale Trade (100.0%), Transportation & Warehousing (100.0%), and Administrative & Support (100.0%), whereas the industries that tend to have a higher number of women are Retail Trade (100.0%), Finance & Insurance (100.0%), and Health Care & Social Assistance (100.0%).
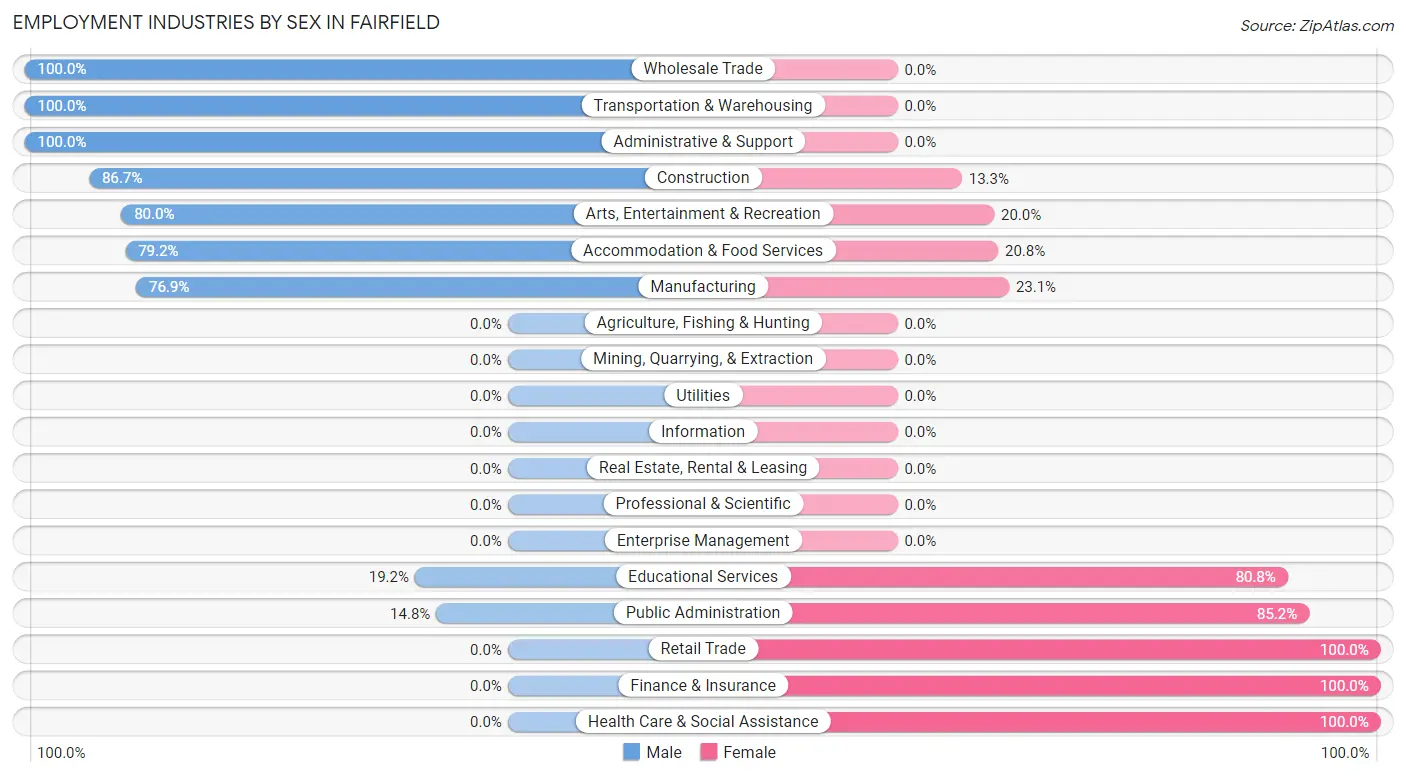
| Industry | Male | Female |
| Agriculture, Fishing & Hunting | 0 (0.0%) | 0 (0.0%) |
| Mining, Quarrying, & Extraction | 0 (0.0%) | 0 (0.0%) |
| Construction | 26 (86.7%) | 4 (13.3%) |
| Manufacturing | 10 (76.9%) | 3 (23.1%) |
| Wholesale Trade | 4 (100.0%) | 0 (0.0%) |
| Retail Trade | 0 (0.0%) | 8 (100.0%) |
| Transportation & Warehousing | 3 (100.0%) | 0 (0.0%) |
| Utilities | 0 (0.0%) | 0 (0.0%) |
| Information | 0 (0.0%) | 0 (0.0%) |
| Finance & Insurance | 0 (0.0%) | 8 (100.0%) |
| Real Estate, Rental & Leasing | 0 (0.0%) | 0 (0.0%) |
| Professional & Scientific | 0 (0.0%) | 0 (0.0%) |
| Enterprise Management | 0 (0.0%) | 0 (0.0%) |
| Administrative & Support | 9 (100.0%) | 0 (0.0%) |
| Educational Services | 5 (19.2%) | 21 (80.8%) |
| Health Care & Social Assistance | 0 (0.0%) | 22 (100.0%) |
| Arts, Entertainment & Recreation | 16 (80.0%) | 4 (20.0%) |
| Accommodation & Food Services | 19 (79.2%) | 5 (20.8%) |
| Public Administration | 4 (14.8%) | 23 (85.2%) |
| Total | 106 (52.0%) | 98 (48.0%) |
Education in Fairfield
School Enrollment in Fairfield
The most common levels of schooling among the 129 students in Fairfield are middle school (61 | 47.3%), high school (28 | 21.7%), and elementary school (20 | 15.5%).
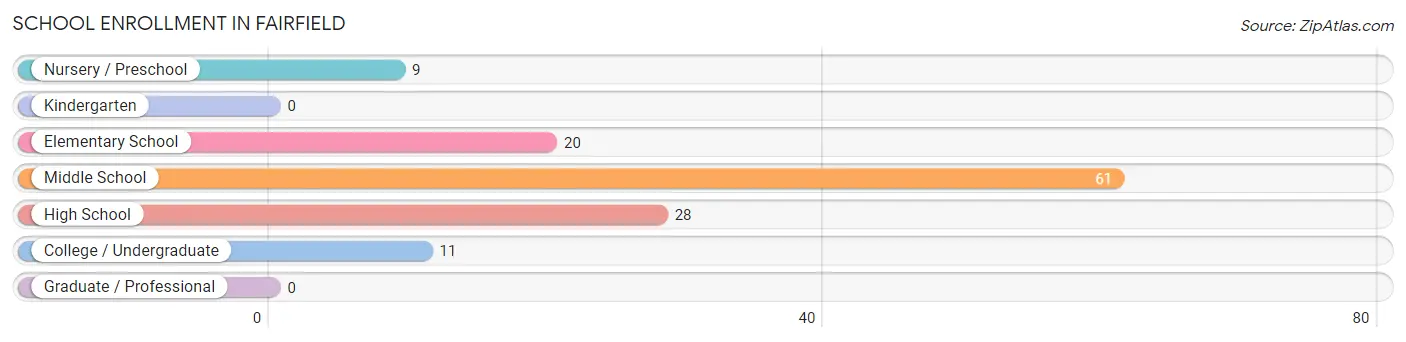
| School Level | # Students | % Students |
| Nursery / Preschool | 9 | 7.0% |
| Kindergarten | 0 | 0.0% |
| Elementary School | 20 | 15.5% |
| Middle School | 61 | 47.3% |
| High School | 28 | 21.7% |
| College / Undergraduate | 11 | 8.5% |
| Graduate / Professional | 0 | 0.0% |
| Total | 129 | 100.0% |
School Enrollment by Age by Funding Source in Fairfield
Out of a total of 129 students who are enrolled in schools in Fairfield, 50 (38.8%) attend a private institution, while the remaining 79 (61.2%) are enrolled in public schools. The age group of 15 to 17 year olds has the highest likelihood of being enrolled in private schools, with 14 (58.3% in the age bracket) enrolled. Conversely, the age group of 3 to 4 year olds has the lowest likelihood of being enrolled in a private school, with 9 (100.0% in the age bracket) attending a public institution.
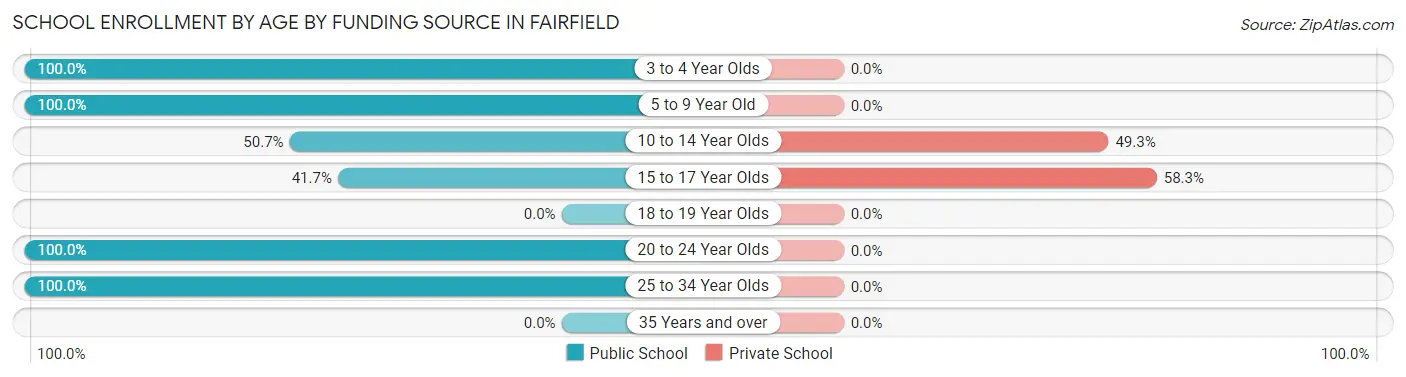
| Age Bracket | Public School | Private School |
| 3 to 4 Year Olds | 9 (100.0%) | 0 (0.0%) |
| 5 to 9 Year Old | 12 (100.0%) | 0 (0.0%) |
| 10 to 14 Year Olds | 37 (50.7%) | 36 (49.3%) |
| 15 to 17 Year Olds | 10 (41.7%) | 14 (58.3%) |
| 18 to 19 Year Olds | 0 (0.0%) | 0 (0.0%) |
| 20 to 24 Year Olds | 6 (100.0%) | 0 (0.0%) |
| 25 to 34 Year Olds | 5 (100.0%) | 0 (0.0%) |
| 35 Years and over | 0 (0.0%) | 0 (0.0%) |
| Total | 79 (61.2%) | 50 (38.8%) |
Educational Attainment by Field of Study in Fairfield
Education (16 | 47.1%), engineering (5 | 14.7%), science & technology (5 | 14.7%), arts & humanities (5 | 14.7%), and psychology (3 | 8.8%) are the most common fields of study among 34 individuals in Fairfield who have obtained a bachelor's degree or higher.
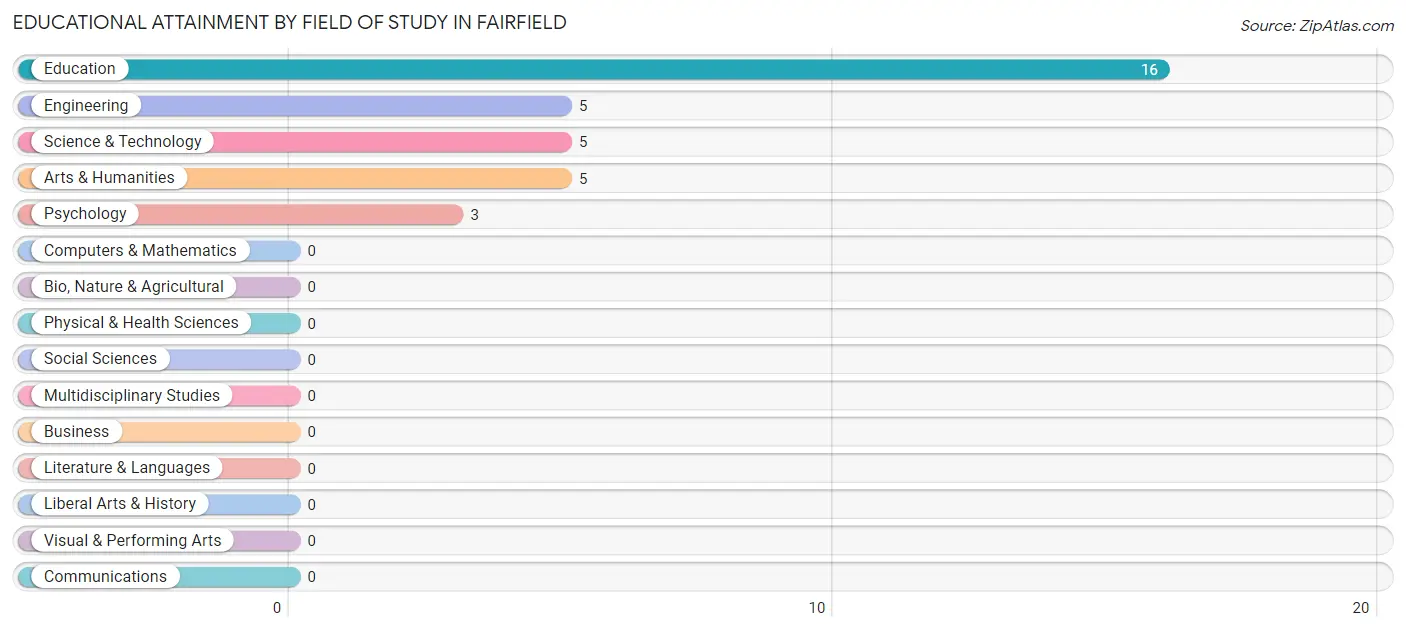
| Field of Study | # Graduates | % Graduates |
| Computers & Mathematics | 0 | 0.0% |
| Bio, Nature & Agricultural | 0 | 0.0% |
| Physical & Health Sciences | 0 | 0.0% |
| Psychology | 3 | 8.8% |
| Social Sciences | 0 | 0.0% |
| Engineering | 5 | 14.7% |
| Multidisciplinary Studies | 0 | 0.0% |
| Science & Technology | 5 | 14.7% |
| Business | 0 | 0.0% |
| Education | 16 | 47.1% |
| Literature & Languages | 0 | 0.0% |
| Liberal Arts & History | 0 | 0.0% |
| Visual & Performing Arts | 0 | 0.0% |
| Communications | 0 | 0.0% |
| Arts & Humanities | 5 | 14.7% |
| Total | 34 | 100.0% |
Transportation & Commute in Fairfield
Vehicle Availability by Sex in Fairfield
The most prevalent vehicle ownership categories in Fairfield are males with 3 vehicles (69, accounting for 65.1%) and females with 3 vehicles (50, making up 70.4%).
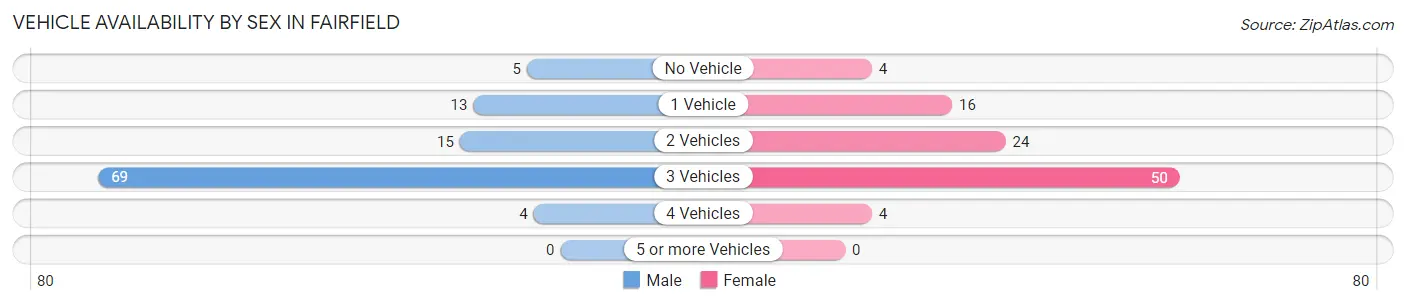
| Vehicles Available | Male | Female |
| No Vehicle | 5 (4.7%) | 4 (4.1%) |
| 1 Vehicle | 13 (12.3%) | 16 (16.3%) |
| 2 Vehicles | 15 (14.1%) | 24 (24.5%) |
| 3 Vehicles | 69 (65.1%) | 50 (51.0%) |
| 4 Vehicles | 4 (3.8%) | 4 (4.1%) |
| 5 or more Vehicles | 0 (0.0%) | 0 (0.0%) |
| Total | 106 (100.0%) | 98 (100.0%) |
Commute Time in Fairfield
The most frequently occuring commute durations in Fairfield are 5 to 9 minutes (42 commuters, 20.6%), 10 to 14 minutes (42 commuters, 20.6%), and 60 to 89 minutes (38 commuters, 18.6%).
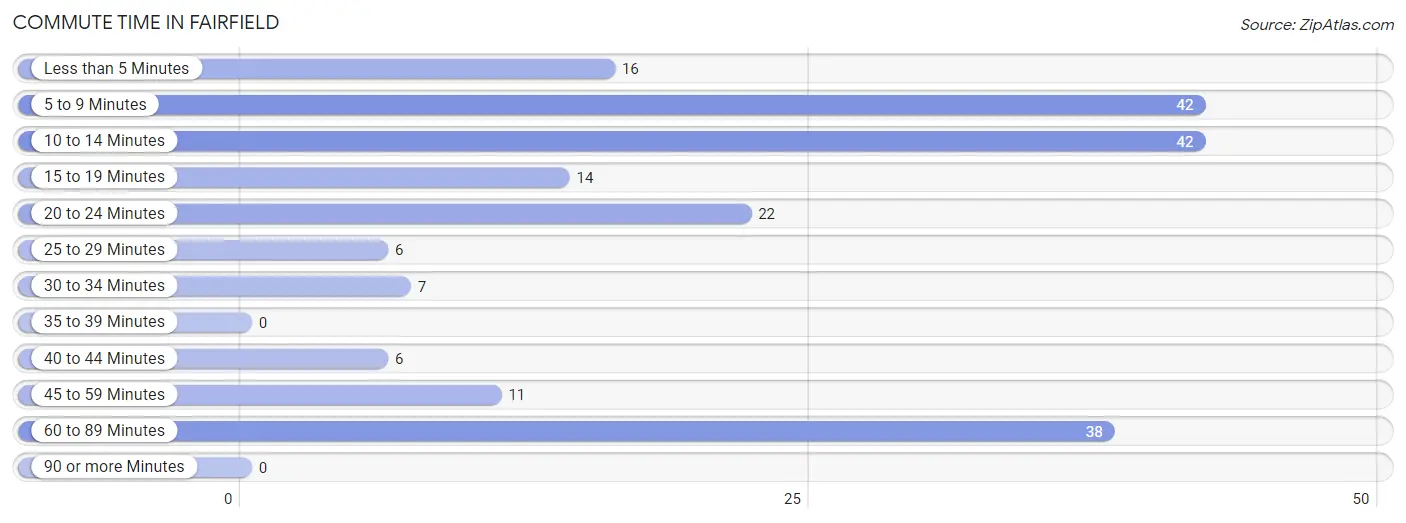
| Commute Time | # Commuters | % Commuters |
| Less than 5 Minutes | 16 | 7.8% |
| 5 to 9 Minutes | 42 | 20.6% |
| 10 to 14 Minutes | 42 | 20.6% |
| 15 to 19 Minutes | 14 | 6.9% |
| 20 to 24 Minutes | 22 | 10.8% |
| 25 to 29 Minutes | 6 | 2.9% |
| 30 to 34 Minutes | 7 | 3.4% |
| 35 to 39 Minutes | 0 | 0.0% |
| 40 to 44 Minutes | 6 | 2.9% |
| 45 to 59 Minutes | 11 | 5.4% |
| 60 to 89 Minutes | 38 | 18.6% |
| 90 or more Minutes | 0 | 0.0% |
Commute Time by Sex in Fairfield
The most common commute times in Fairfield are 5 to 9 minutes (34 commuters, 32.1%) for males and 10 to 14 minutes (30 commuters, 30.6%) for females.
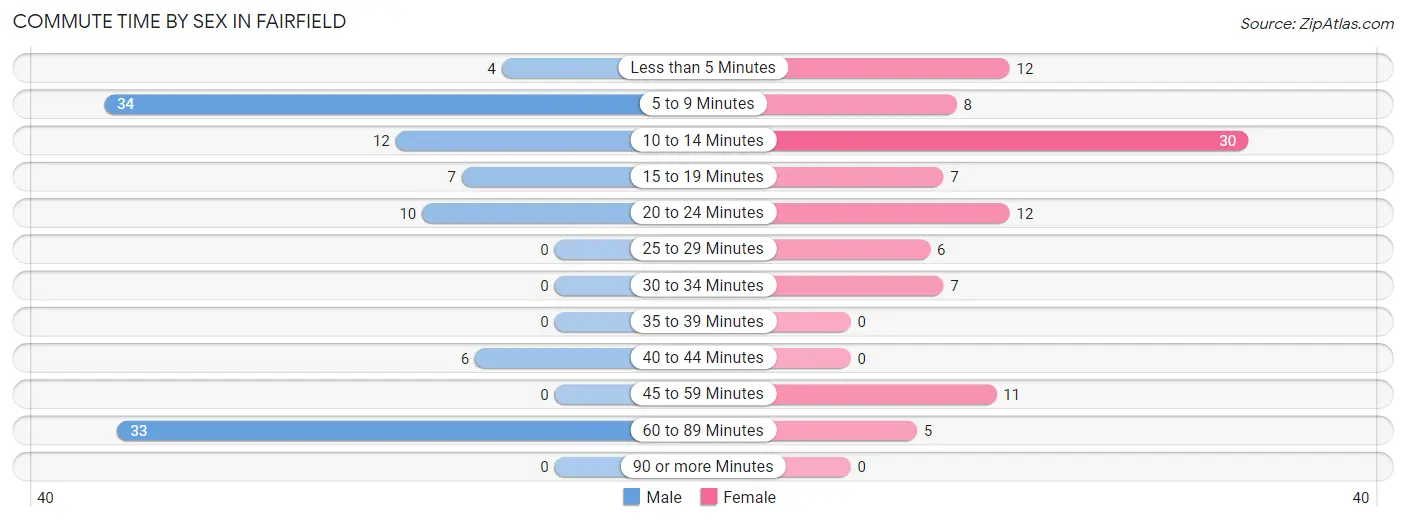
| Commute Time | Male | Female |
| Less than 5 Minutes | 4 (3.8%) | 12 (12.2%) |
| 5 to 9 Minutes | 34 (32.1%) | 8 (8.2%) |
| 10 to 14 Minutes | 12 (11.3%) | 30 (30.6%) |
| 15 to 19 Minutes | 7 (6.6%) | 7 (7.1%) |
| 20 to 24 Minutes | 10 (9.4%) | 12 (12.2%) |
| 25 to 29 Minutes | 0 (0.0%) | 6 (6.1%) |
| 30 to 34 Minutes | 0 (0.0%) | 7 (7.1%) |
| 35 to 39 Minutes | 0 (0.0%) | 0 (0.0%) |
| 40 to 44 Minutes | 6 (5.7%) | 0 (0.0%) |
| 45 to 59 Minutes | 0 (0.0%) | 11 (11.2%) |
| 60 to 89 Minutes | 33 (31.1%) | 5 (5.1%) |
| 90 or more Minutes | 0 (0.0%) | 0 (0.0%) |
Time of Departure to Work by Sex in Fairfield
The most frequent times of departure to work in Fairfield are 5:30 AM to 5:59 AM (26, 24.5%) for males and 7:30 AM to 7:59 AM (39, 39.8%) for females.
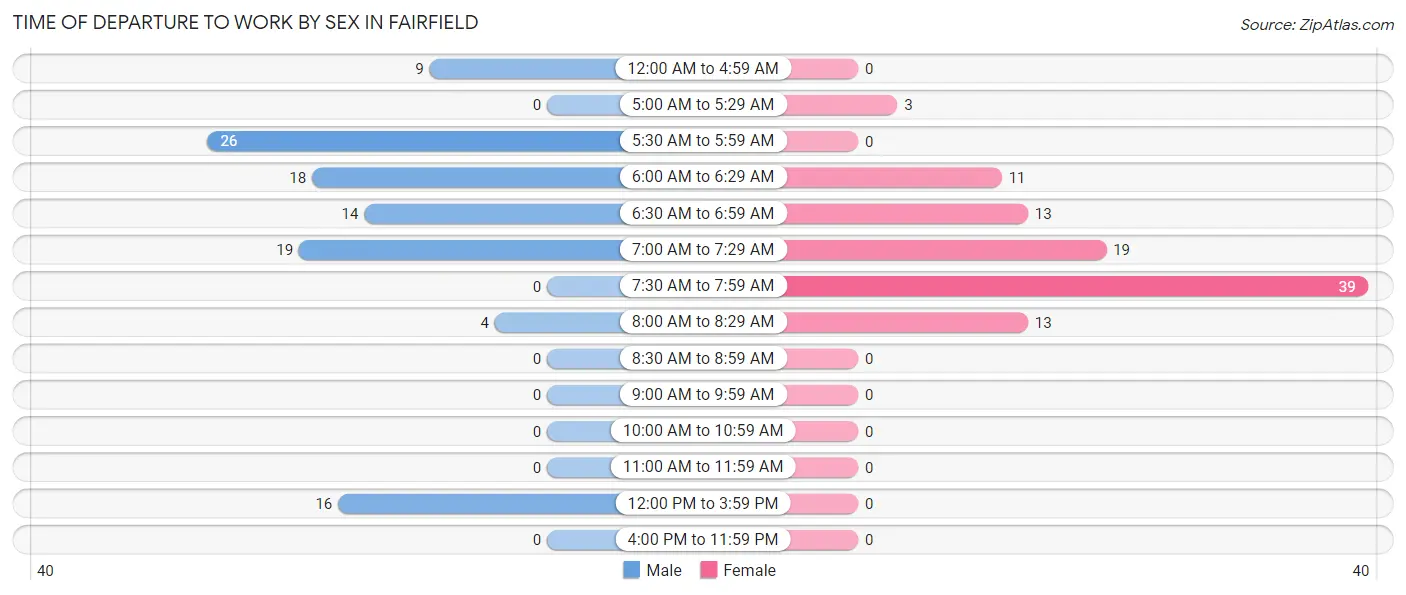
| Time of Departure | Male | Female |
| 12:00 AM to 4:59 AM | 9 (8.5%) | 0 (0.0%) |
| 5:00 AM to 5:29 AM | 0 (0.0%) | 3 (3.1%) |
| 5:30 AM to 5:59 AM | 26 (24.5%) | 0 (0.0%) |
| 6:00 AM to 6:29 AM | 18 (17.0%) | 11 (11.2%) |
| 6:30 AM to 6:59 AM | 14 (13.2%) | 13 (13.3%) |
| 7:00 AM to 7:29 AM | 19 (17.9%) | 19 (19.4%) |
| 7:30 AM to 7:59 AM | 0 (0.0%) | 39 (39.8%) |
| 8:00 AM to 8:29 AM | 4 (3.8%) | 13 (13.3%) |
| 8:30 AM to 8:59 AM | 0 (0.0%) | 0 (0.0%) |
| 9:00 AM to 9:59 AM | 0 (0.0%) | 0 (0.0%) |
| 10:00 AM to 10:59 AM | 0 (0.0%) | 0 (0.0%) |
| 11:00 AM to 11:59 AM | 0 (0.0%) | 0 (0.0%) |
| 12:00 PM to 3:59 PM | 16 (15.1%) | 0 (0.0%) |
| 4:00 PM to 11:59 PM | 0 (0.0%) | 0 (0.0%) |
| Total | 106 (100.0%) | 98 (100.0%) |
Housing Occupancy in Fairfield
Occupancy by Ownership in Fairfield
Of the total 172 dwellings in Fairfield, owner-occupied units account for 135 (78.5%), while renter-occupied units make up 37 (21.5%).
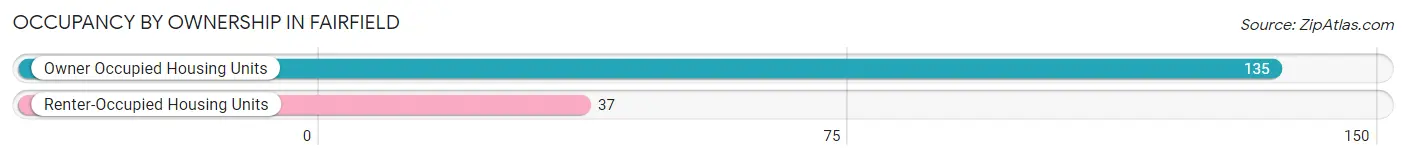
| Occupancy | # Housing Units | % Housing Units |
| Owner Occupied Housing Units | 135 | 78.5% |
| Renter-Occupied Housing Units | 37 | 21.5% |
| Total Occupied Housing Units | 172 | 100.0% |
Occupancy by Household Size in Fairfield
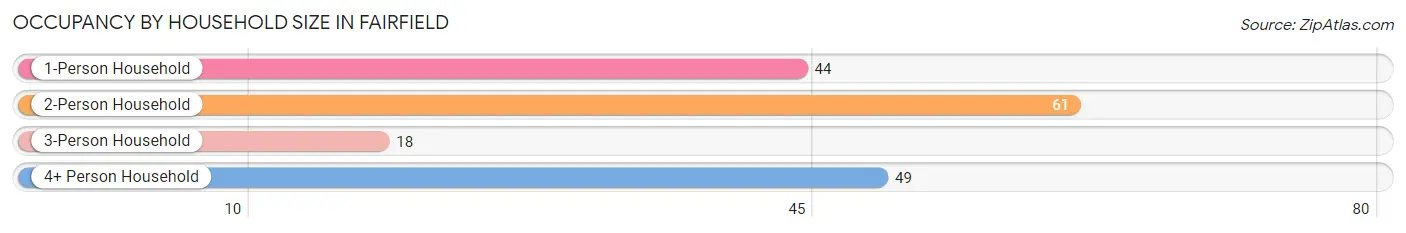
| Household Size | # Housing Units | % Housing Units |
| 1-Person Household | 44 | 25.6% |
| 2-Person Household | 61 | 35.5% |
| 3-Person Household | 18 | 10.5% |
| 4+ Person Household | 49 | 28.5% |
| Total Housing Units | 172 | 100.0% |
Occupancy by Ownership by Household Size in Fairfield
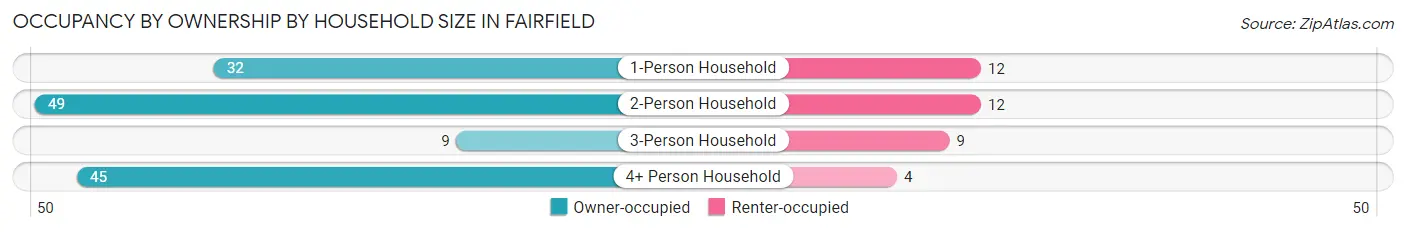
| Household Size | Owner-occupied | Renter-occupied |
| 1-Person Household | 32 (72.7%) | 12 (27.3%) |
| 2-Person Household | 49 (80.3%) | 12 (19.7%) |
| 3-Person Household | 9 (50.0%) | 9 (50.0%) |
| 4+ Person Household | 45 (91.8%) | 4 (8.2%) |
| Total Housing Units | 135 (78.5%) | 37 (21.5%) |
Occupancy by Educational Attainment in Fairfield
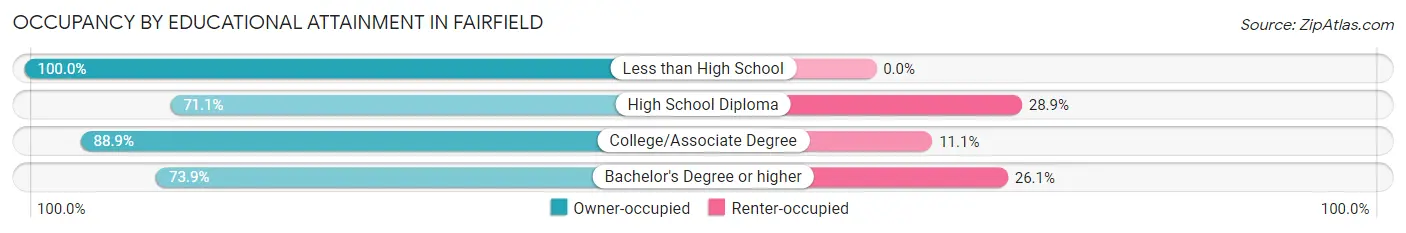
| Household Size | Owner-occupied | Renter-occupied |
| Less than High School | 25 (100.0%) | 0 (0.0%) |
| High School Diploma | 69 (71.1%) | 28 (28.9%) |
| College/Associate Degree | 24 (88.9%) | 3 (11.1%) |
| Bachelor's Degree or higher | 17 (73.9%) | 6 (26.1%) |
Occupancy by Age of Householder in Fairfield
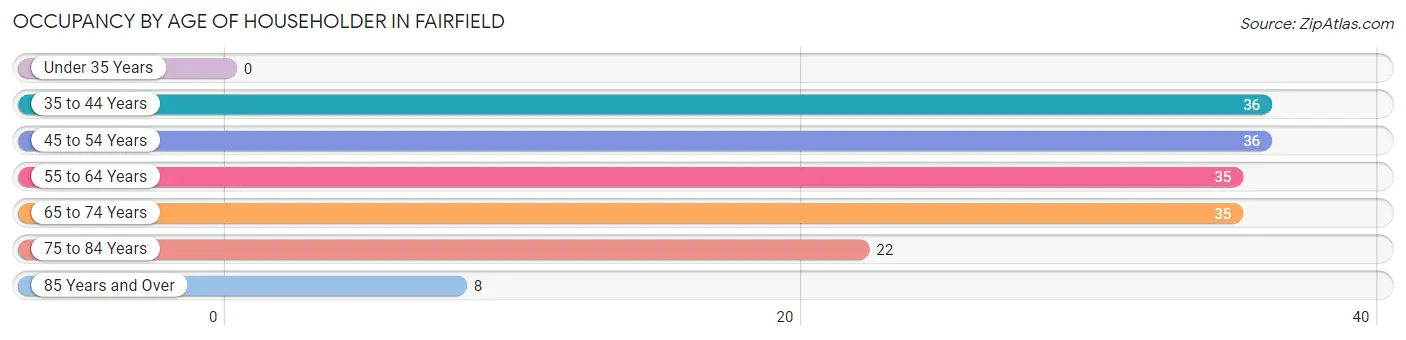
| Age Bracket | # Households | % Households |
| Under 35 Years | 0 | 0.0% |
| 35 to 44 Years | 36 | 20.9% |
| 45 to 54 Years | 36 | 20.9% |
| 55 to 64 Years | 35 | 20.3% |
| 65 to 74 Years | 35 | 20.3% |
| 75 to 84 Years | 22 | 12.8% |
| 85 Years and Over | 8 | 4.6% |
| Total | 172 | 100.0% |
Housing Finances in Fairfield
Median Income by Occupancy in Fairfield
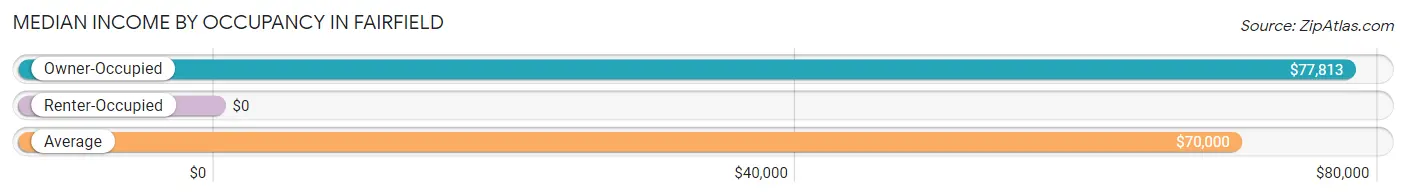
| Occupancy Type | # Households | Median Income |
| Owner-Occupied | 135 (78.5%) | $77,813 |
| Renter-Occupied | 37 (21.5%) | $0 |
| Average | 172 (100.0%) | $70,000 |
Occupancy by Householder Income Bracket in Fairfield
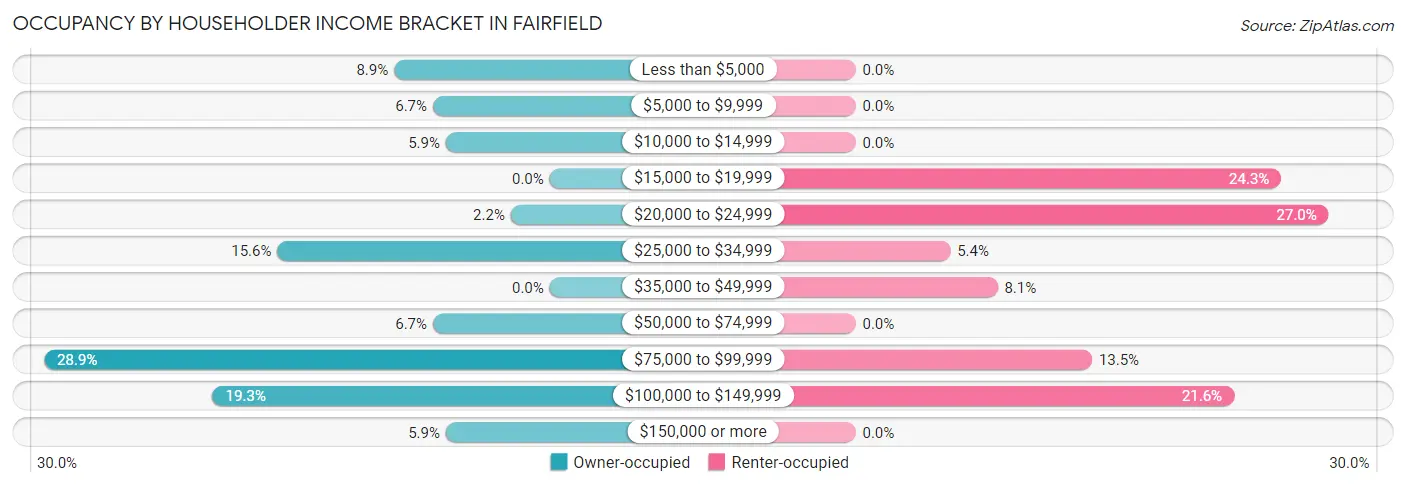
| Income Bracket | Owner-occupied | Renter-occupied |
| Less than $5,000 | 12 (8.9%) | 0 (0.0%) |
| $5,000 to $9,999 | 9 (6.7%) | 0 (0.0%) |
| $10,000 to $14,999 | 8 (5.9%) | 0 (0.0%) |
| $15,000 to $19,999 | 0 (0.0%) | 9 (24.3%) |
| $20,000 to $24,999 | 3 (2.2%) | 10 (27.0%) |
| $25,000 to $34,999 | 21 (15.6%) | 2 (5.4%) |
| $35,000 to $49,999 | 0 (0.0%) | 3 (8.1%) |
| $50,000 to $74,999 | 9 (6.7%) | 0 (0.0%) |
| $75,000 to $99,999 | 39 (28.9%) | 5 (13.5%) |
| $100,000 to $149,999 | 26 (19.3%) | 8 (21.6%) |
| $150,000 or more | 8 (5.9%) | 0 (0.0%) |
| Total | 135 (100.0%) | 37 (100.0%) |
Monthly Housing Cost Tiers in Fairfield
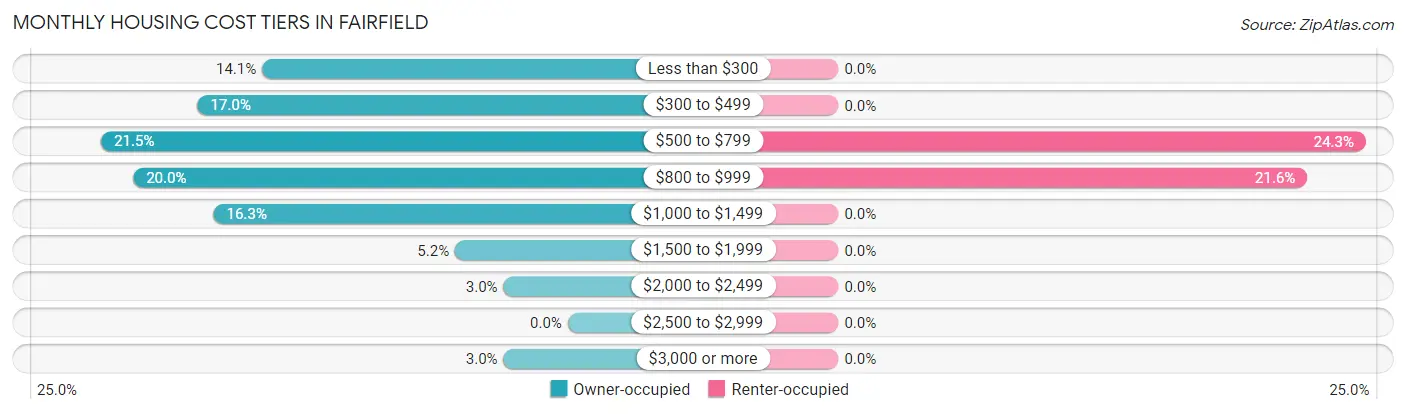
| Monthly Cost | Owner-occupied | Renter-occupied |
| Less than $300 | 19 (14.1%) | 0 (0.0%) |
| $300 to $499 | 23 (17.0%) | 0 (0.0%) |
| $500 to $799 | 29 (21.5%) | 9 (24.3%) |
| $800 to $999 | 27 (20.0%) | 8 (21.6%) |
| $1,000 to $1,499 | 22 (16.3%) | 0 (0.0%) |
| $1,500 to $1,999 | 7 (5.2%) | 0 (0.0%) |
| $2,000 to $2,499 | 4 (3.0%) | 0 (0.0%) |
| $2,500 to $2,999 | 0 (0.0%) | 0 (0.0%) |
| $3,000 or more | 4 (3.0%) | 0 (0.0%) |
| Total | 135 (100.0%) | 37 (100.0%) |
Physical Housing Characteristics in Fairfield
Housing Structures in Fairfield
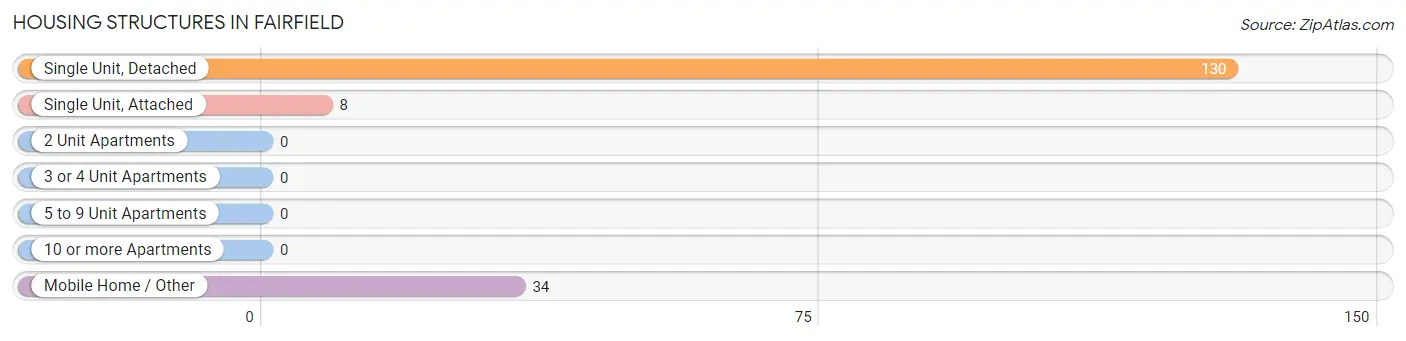
| Structure Type | # Housing Units | % Housing Units |
| Single Unit, Detached | 130 | 75.6% |
| Single Unit, Attached | 8 | 4.6% |
| 2 Unit Apartments | 0 | 0.0% |
| 3 or 4 Unit Apartments | 0 | 0.0% |
| 5 to 9 Unit Apartments | 0 | 0.0% |
| 10 or more Apartments | 0 | 0.0% |
| Mobile Home / Other | 34 | 19.8% |
| Total | 172 | 100.0% |
Housing Structures by Occupancy in Fairfield
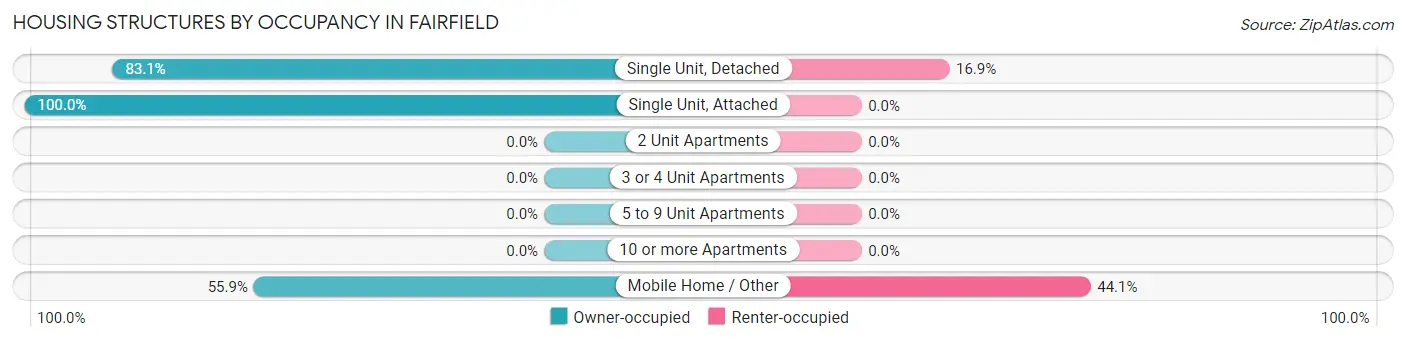
| Structure Type | Owner-occupied | Renter-occupied |
| Single Unit, Detached | 108 (83.1%) | 22 (16.9%) |
| Single Unit, Attached | 8 (100.0%) | 0 (0.0%) |
| 2 Unit Apartments | 0 (0.0%) | 0 (0.0%) |
| 3 or 4 Unit Apartments | 0 (0.0%) | 0 (0.0%) |
| 5 to 9 Unit Apartments | 0 (0.0%) | 0 (0.0%) |
| 10 or more Apartments | 0 (0.0%) | 0 (0.0%) |
| Mobile Home / Other | 19 (55.9%) | 15 (44.1%) |
| Total | 135 (78.5%) | 37 (21.5%) |
Housing Structures by Number of Rooms in Fairfield
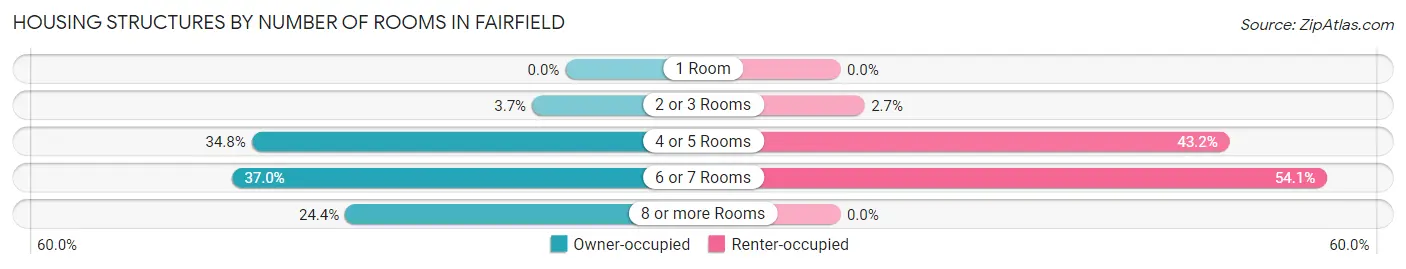
| Number of Rooms | Owner-occupied | Renter-occupied |
| 1 Room | 0 (0.0%) | 0 (0.0%) |
| 2 or 3 Rooms | 5 (3.7%) | 1 (2.7%) |
| 4 or 5 Rooms | 47 (34.8%) | 16 (43.2%) |
| 6 or 7 Rooms | 50 (37.0%) | 20 (54.0%) |
| 8 or more Rooms | 33 (24.4%) | 0 (0.0%) |
| Total | 135 (100.0%) | 37 (100.0%) |
Housing Structure by Heating Type in Fairfield
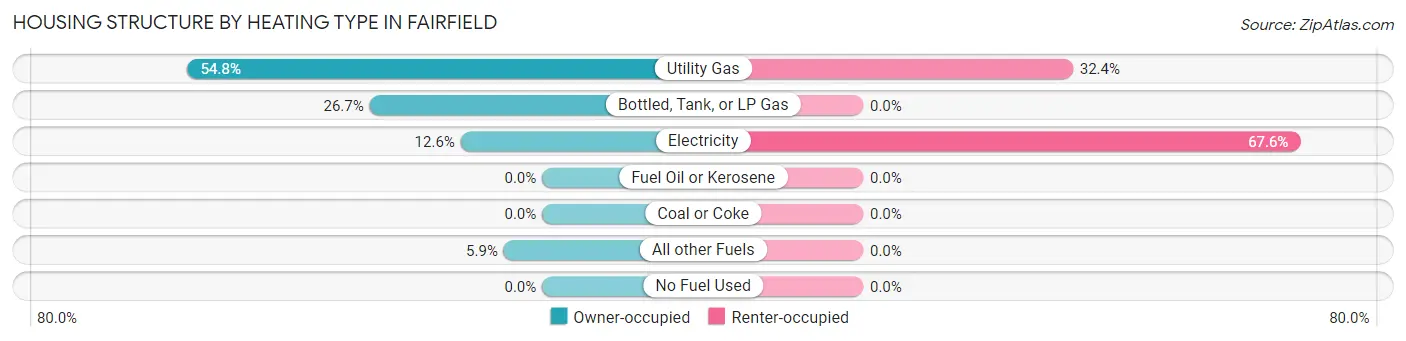
| Heating Type | Owner-occupied | Renter-occupied |
| Utility Gas | 74 (54.8%) | 12 (32.4%) |
| Bottled, Tank, or LP Gas | 36 (26.7%) | 0 (0.0%) |
| Electricity | 17 (12.6%) | 25 (67.6%) |
| Fuel Oil or Kerosene | 0 (0.0%) | 0 (0.0%) |
| Coal or Coke | 0 (0.0%) | 0 (0.0%) |
| All other Fuels | 8 (5.9%) | 0 (0.0%) |
| No Fuel Used | 0 (0.0%) | 0 (0.0%) |
| Total | 135 (100.0%) | 37 (100.0%) |
Household Vehicle Usage in Fairfield
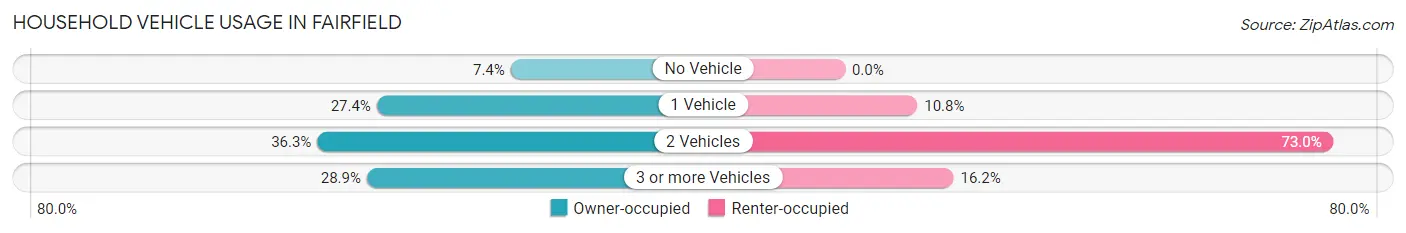
| Vehicles per Household | Owner-occupied | Renter-occupied |
| No Vehicle | 10 (7.4%) | 0 (0.0%) |
| 1 Vehicle | 37 (27.4%) | 4 (10.8%) |
| 2 Vehicles | 49 (36.3%) | 27 (73.0%) |
| 3 or more Vehicles | 39 (28.9%) | 6 (16.2%) |
| Total | 135 (100.0%) | 37 (100.0%) |
Real Estate & Mortgages in Fairfield
Real Estate and Mortgage Overview in Fairfield
| Characteristic | Without Mortgage | With Mortgage |
| Housing Units | 55 | 80 |
| Median Property Value | $80,500 | $175,000 |
| Median Household Income | - | - |
| Monthly Housing Costs | $409 | $4 |
| Real Estate Taxes | $507 | $20 |
Property Value by Mortgage Status in Fairfield
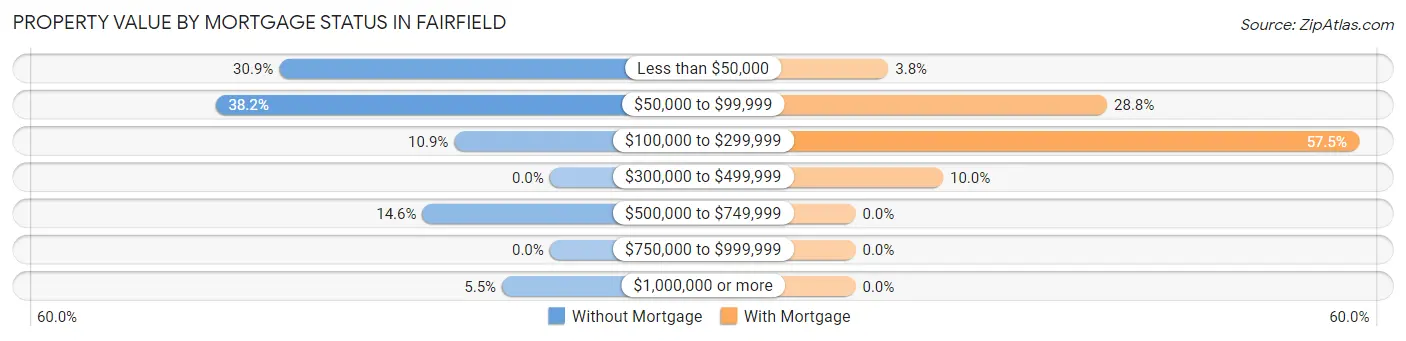
| Property Value | Without Mortgage | With Mortgage |
| Less than $50,000 | 17 (30.9%) | 3 (3.7%) |
| $50,000 to $99,999 | 21 (38.2%) | 23 (28.7%) |
| $100,000 to $299,999 | 6 (10.9%) | 46 (57.5%) |
| $300,000 to $499,999 | 0 (0.0%) | 8 (10.0%) |
| $500,000 to $749,999 | 8 (14.5%) | 0 (0.0%) |
| $750,000 to $999,999 | 0 (0.0%) | 0 (0.0%) |
| $1,000,000 or more | 3 (5.4%) | 0 (0.0%) |
| Total | 55 (100.0%) | 80 (100.0%) |
Household Income by Mortgage Status in Fairfield
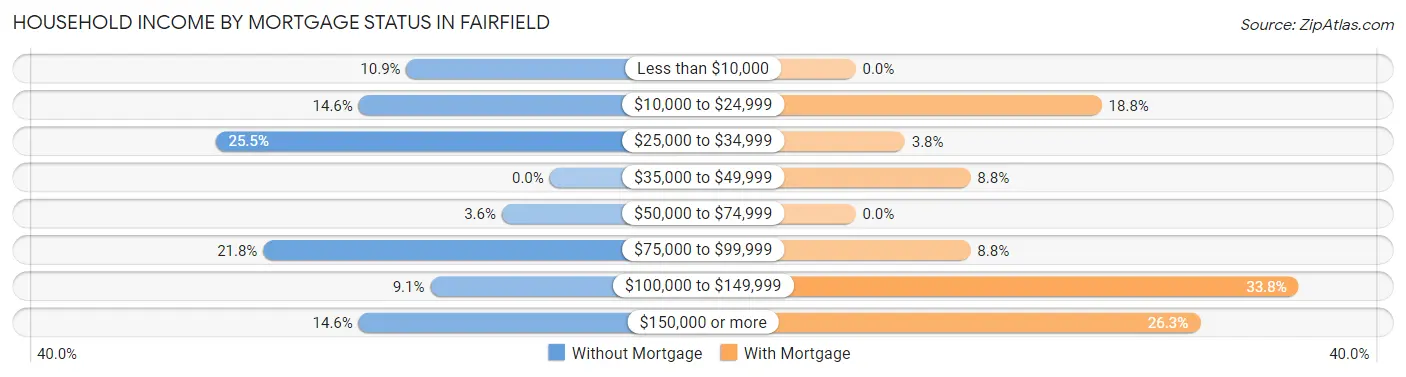
| Household Income | Without Mortgage | With Mortgage |
| Less than $10,000 | 6 (10.9%) | 0 (0.0%) |
| $10,000 to $24,999 | 8 (14.5%) | 15 (18.8%) |
| $25,000 to $34,999 | 14 (25.5%) | 3 (3.7%) |
| $35,000 to $49,999 | 0 (0.0%) | 7 (8.7%) |
| $50,000 to $74,999 | 2 (3.6%) | 0 (0.0%) |
| $75,000 to $99,999 | 12 (21.8%) | 7 (8.7%) |
| $100,000 to $149,999 | 5 (9.1%) | 27 (33.8%) |
| $150,000 or more | 8 (14.5%) | 21 (26.3%) |
| Total | 55 (100.0%) | 80 (100.0%) |
Property Value to Household Income Ratio in Fairfield
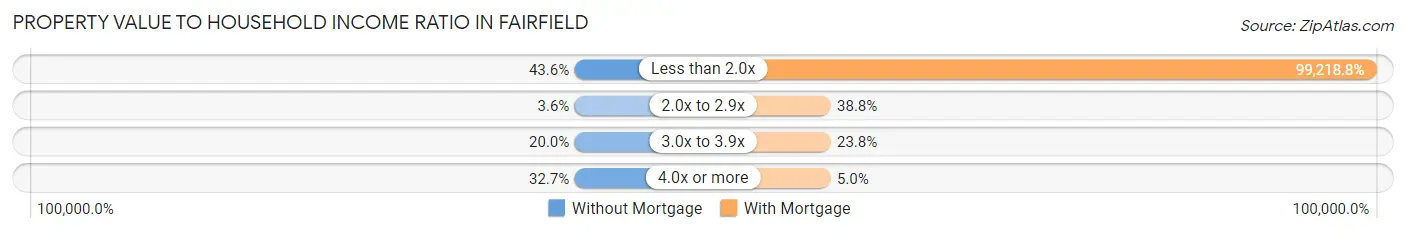
| Value-to-Income Ratio | Without Mortgage | With Mortgage |
| Less than 2.0x | 24 (43.6%) | 79,375 (99,218.8%) |
| 2.0x to 2.9x | 2 (3.6%) | 31 (38.8%) |
| 3.0x to 3.9x | 11 (20.0%) | 19 (23.7%) |
| 4.0x or more | 18 (32.7%) | 4 (5.0%) |
| Total | 55 (100.0%) | 80 (100.0%) |
Real Estate Taxes by Mortgage Status in Fairfield
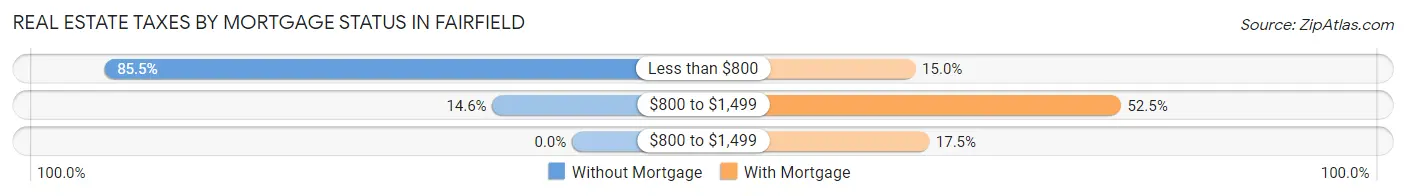
| Property Taxes | Without Mortgage | With Mortgage |
| Less than $800 | 47 (85.5%) | 12 (15.0%) |
| $800 to $1,499 | 8 (14.5%) | 42 (52.5%) |
| $800 to $1,499 | 0 (0.0%) | 14 (17.5%) |
| Total | 55 (100.0%) | 80 (100.0%) |
Health & Disability in Fairfield
Health Insurance Coverage by Age in Fairfield
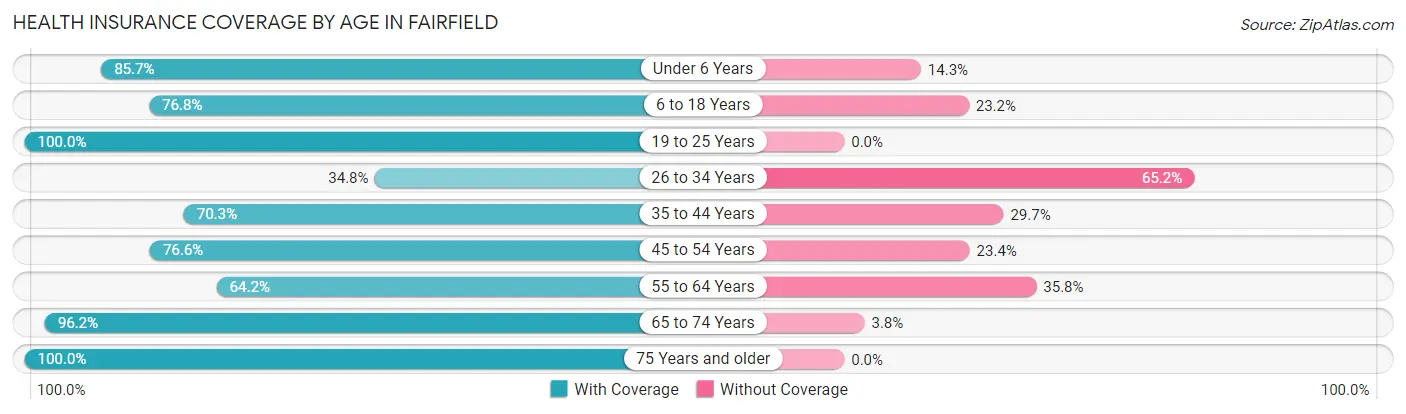
| Age Bracket | With Coverage | Without Coverage |
| Under 6 Years | 24 (85.7%) | 4 (14.3%) |
| 6 to 18 Years | 86 (76.8%) | 26 (23.2%) |
| 19 to 25 Years | 46 (100.0%) | 0 (0.0%) |
| 26 to 34 Years | 16 (34.8%) | 30 (65.2%) |
| 35 to 44 Years | 45 (70.3%) | 19 (29.7%) |
| 45 to 54 Years | 59 (76.6%) | 18 (23.4%) |
| 55 to 64 Years | 43 (64.2%) | 24 (35.8%) |
| 65 to 74 Years | 51 (96.2%) | 2 (3.8%) |
| 75 Years and older | 42 (100.0%) | 0 (0.0%) |
| Total | 412 (77.0%) | 123 (23.0%) |
Health Insurance Coverage by Citizenship Status in Fairfield
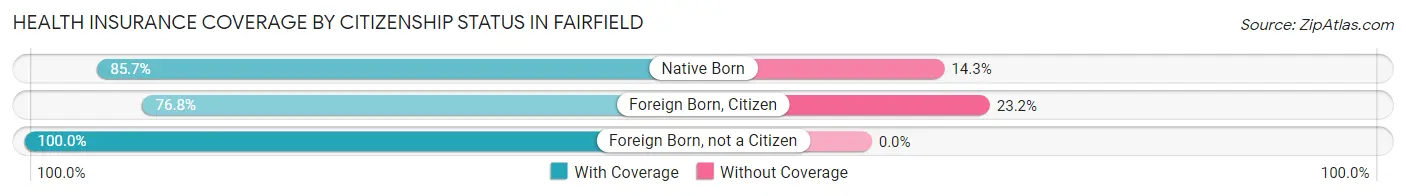
| Citizenship Status | With Coverage | Without Coverage |
| Native Born | 24 (85.7%) | 4 (14.3%) |
| Foreign Born, Citizen | 86 (76.8%) | 26 (23.2%) |
| Foreign Born, not a Citizen | 46 (100.0%) | 0 (0.0%) |
Health Insurance Coverage by Household Income in Fairfield
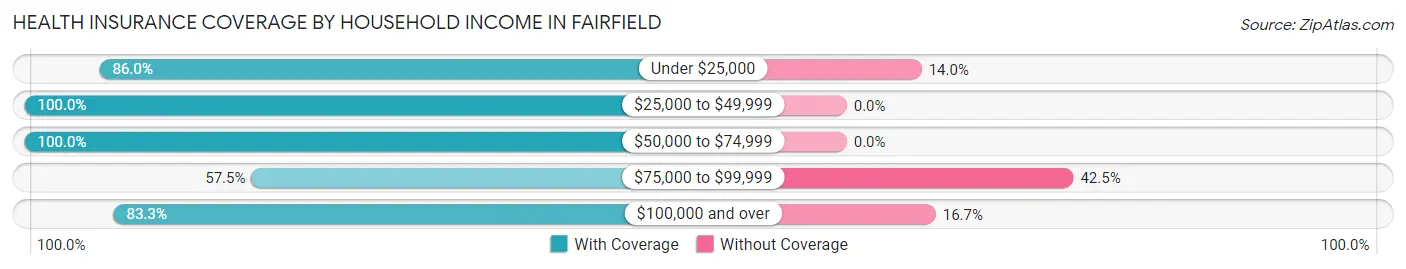
| Household Income | With Coverage | Without Coverage |
| Under $25,000 | 98 (86.0%) | 16 (14.0%) |
| $25,000 to $49,999 | 45 (100.0%) | 0 (0.0%) |
| $50,000 to $74,999 | 22 (100.0%) | 0 (0.0%) |
| $75,000 to $99,999 | 107 (57.5%) | 79 (42.5%) |
| $100,000 and over | 140 (83.3%) | 28 (16.7%) |
Public vs Private Health Insurance Coverage by Age in Fairfield
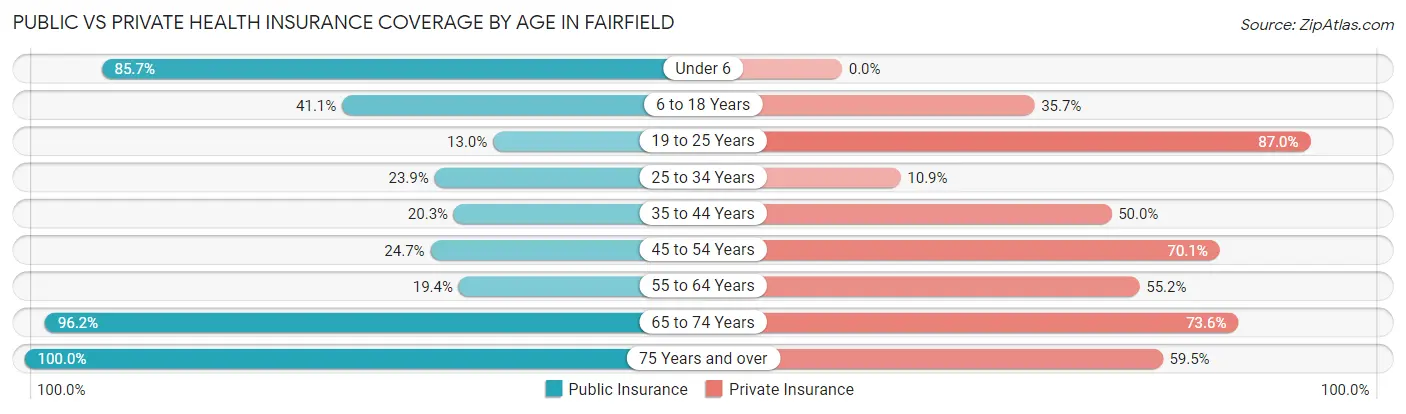
| Age Bracket | Public Insurance | Private Insurance |
| Under 6 | 24 (85.7%) | 0 (0.0%) |
| 6 to 18 Years | 46 (41.1%) | 40 (35.7%) |
| 19 to 25 Years | 6 (13.0%) | 40 (87.0%) |
| 25 to 34 Years | 11 (23.9%) | 5 (10.9%) |
| 35 to 44 Years | 13 (20.3%) | 32 (50.0%) |
| 45 to 54 Years | 19 (24.7%) | 54 (70.1%) |
| 55 to 64 Years | 13 (19.4%) | 37 (55.2%) |
| 65 to 74 Years | 51 (96.2%) | 39 (73.6%) |
| 75 Years and over | 42 (100.0%) | 25 (59.5%) |
| Total | 225 (42.1%) | 272 (50.8%) |
Disability Status by Sex by Age in Fairfield
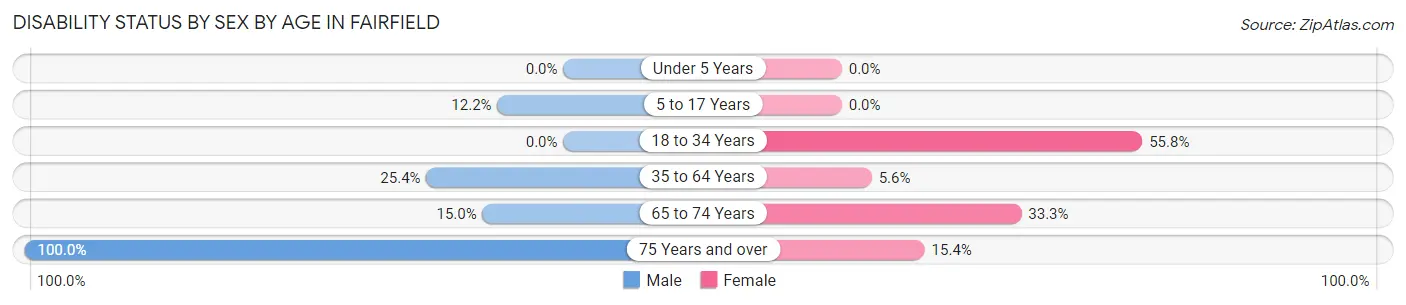
| Age Bracket | Male | Female |
| Under 5 Years | 0 (0.0%) | 0 (0.0%) |
| 5 to 17 Years | 6 (12.2%) | 0 (0.0%) |
| 18 to 34 Years | 0 (0.0%) | 29 (55.8%) |
| 35 to 64 Years | 30 (25.4%) | 5 (5.6%) |
| 65 to 74 Years | 3 (15.0%) | 11 (33.3%) |
| 75 Years and over | 16 (100.0%) | 4 (15.4%) |
Disability Class by Sex by Age in Fairfield
Disability Class: Hearing Difficulty
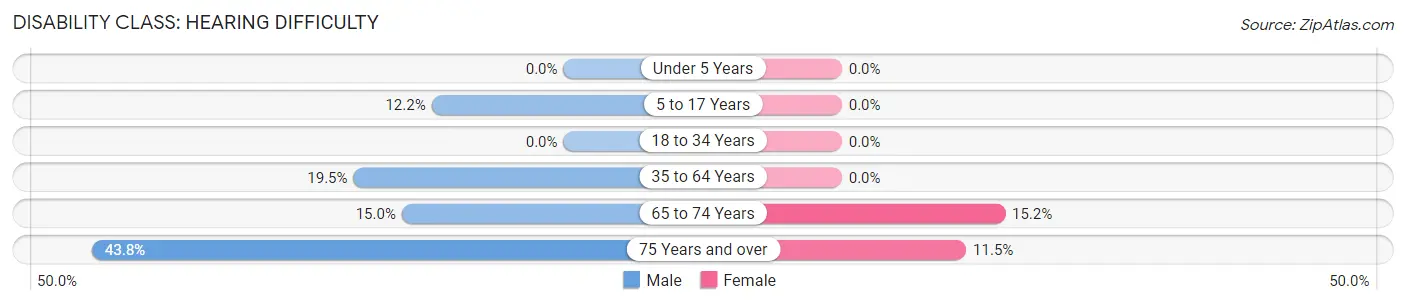
| Age Bracket | Male | Female |
| Under 5 Years | 0 (0.0%) | 0 (0.0%) |
| 5 to 17 Years | 6 (12.2%) | 0 (0.0%) |
| 18 to 34 Years | 0 (0.0%) | 0 (0.0%) |
| 35 to 64 Years | 23 (19.5%) | 0 (0.0%) |
| 65 to 74 Years | 3 (15.0%) | 5 (15.1%) |
| 75 Years and over | 7 (43.8%) | 3 (11.5%) |
Disability Class: Vision Difficulty
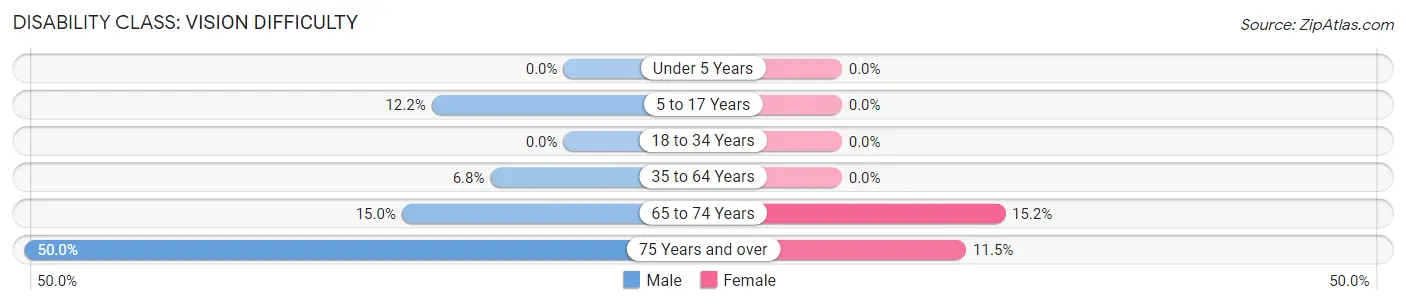
| Age Bracket | Male | Female |
| Under 5 Years | 0 (0.0%) | 0 (0.0%) |
| 5 to 17 Years | 6 (12.2%) | 0 (0.0%) |
| 18 to 34 Years | 0 (0.0%) | 0 (0.0%) |
| 35 to 64 Years | 8 (6.8%) | 0 (0.0%) |
| 65 to 74 Years | 3 (15.0%) | 5 (15.1%) |
| 75 Years and over | 8 (50.0%) | 3 (11.5%) |
Disability Class: Cognitive Difficulty
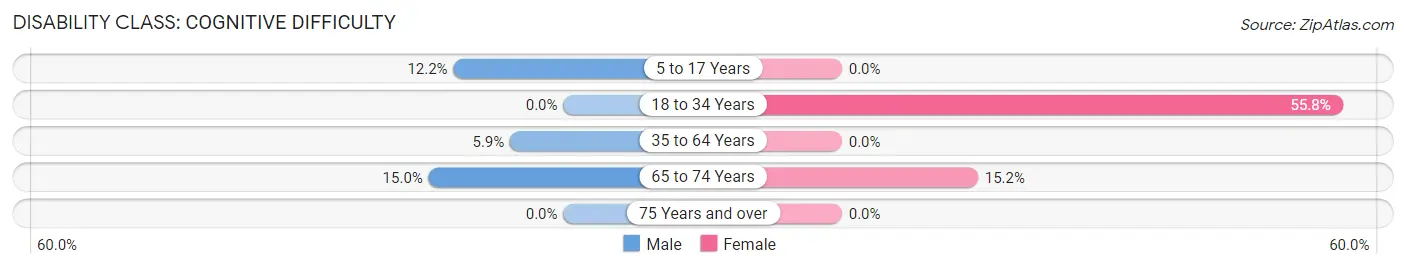
| Age Bracket | Male | Female |
| 5 to 17 Years | 6 (12.2%) | 0 (0.0%) |
| 18 to 34 Years | 0 (0.0%) | 29 (55.8%) |
| 35 to 64 Years | 7 (5.9%) | 0 (0.0%) |
| 65 to 74 Years | 3 (15.0%) | 5 (15.1%) |
| 75 Years and over | 0 (0.0%) | 0 (0.0%) |
Disability Class: Ambulatory Difficulty
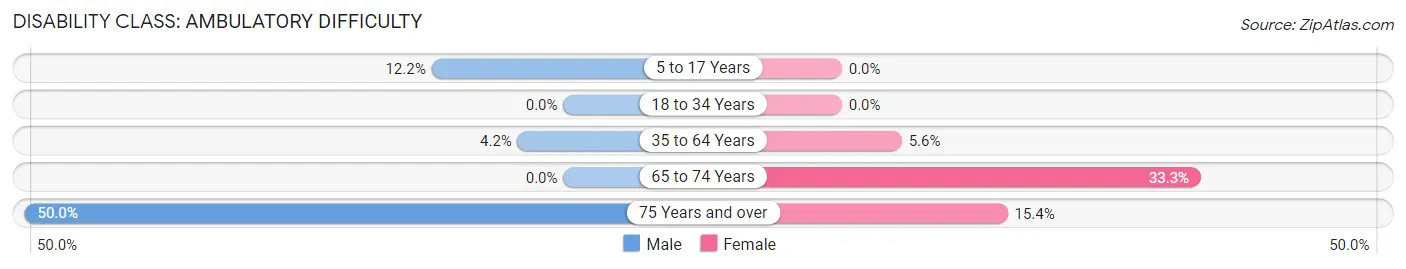
| Age Bracket | Male | Female |
| 5 to 17 Years | 6 (12.2%) | 0 (0.0%) |
| 18 to 34 Years | 0 (0.0%) | 0 (0.0%) |
| 35 to 64 Years | 5 (4.2%) | 5 (5.6%) |
| 65 to 74 Years | 0 (0.0%) | 11 (33.3%) |
| 75 Years and over | 8 (50.0%) | 4 (15.4%) |
Disability Class: Self-Care Difficulty
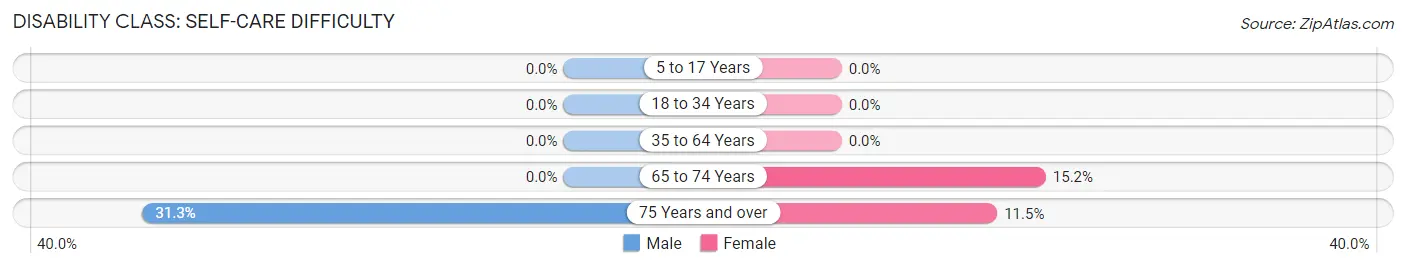
| Age Bracket | Male | Female |
| 5 to 17 Years | 0 (0.0%) | 0 (0.0%) |
| 18 to 34 Years | 0 (0.0%) | 0 (0.0%) |
| 35 to 64 Years | 0 (0.0%) | 0 (0.0%) |
| 65 to 74 Years | 0 (0.0%) | 5 (15.1%) |
| 75 Years and over | 5 (31.2%) | 3 (11.5%) |
Technology Access in Fairfield
Computing Device Access in Fairfield
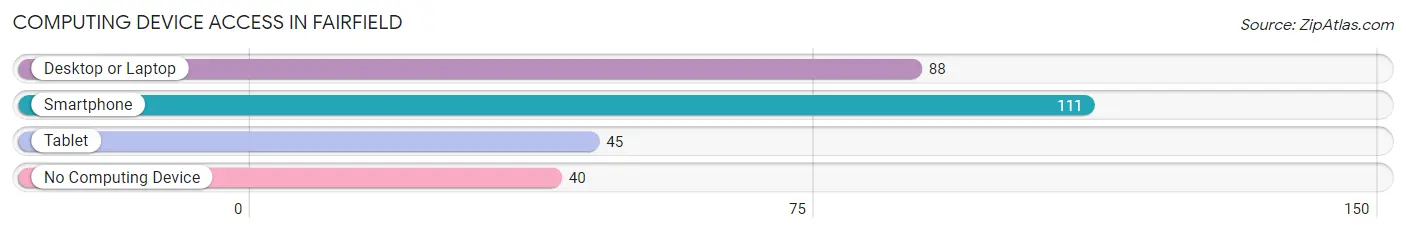
| Device Type | # Households | % Households |
| Desktop or Laptop | 88 | 51.2% |
| Smartphone | 111 | 64.5% |
| Tablet | 45 | 26.2% |
| No Computing Device | 40 | 23.3% |
| Total | 172 | 100.0% |
Internet Access in Fairfield

| Internet Type | # Households | % Households |
| Dial-Up Internet | 0 | 0.0% |
| Broadband Home | 57 | 33.1% |
| Cellular Data Only | 13 | 7.6% |
| Satellite Internet | 20 | 11.6% |
| No Internet | 95 | 55.2% |
| Total | 172 | 100.0% |
Fairfield Summary
Fairfield is a small town located in the southeastern corner of Oklahoma, in Pushmataha County. It is situated on the banks of the Kiamichi River, and is surrounded by the Ouachita National Forest. The town was founded in 1891, and was named after the nearby Fairfield Plantation. The population of Fairfield was estimated to be 545 in 2019.
History
Fairfield was founded in 1891 by the Choctaw Nation, and was named after the nearby Fairfield Plantation. The town was originally a trading post, and was the site of a post office in 1892. The town was incorporated in 1901, and the first mayor was J.W. McBride.
In the early 1900s, Fairfield was a thriving agricultural community, with cotton, corn, and other crops being grown in the area. The town also had a sawmill, a gristmill, and a cotton gin.
In the 1920s, the town began to decline, as the Great Depression hit the area. The population decreased, and many businesses closed. The town was revitalized in the 1940s, when the nearby Kiamichi River was dammed to create Lake Eufaula. The lake brought new visitors to the area, and the town began to grow again.
Geography
Fairfield is located in the southeastern corner of Oklahoma, in Pushmataha County. It is situated on the banks of the Kiamichi River, and is surrounded by the Ouachita National Forest. The town is located approximately 30 miles from the Arkansas border, and is about 90 miles from the Texas border.
The climate in Fairfield is humid subtropical, with hot summers and mild winters. The average annual temperature is around 65°F, and the average annual precipitation is around 45 inches.
Economy
The economy of Fairfield is largely based on tourism, as the town is located near Lake Eufaula. The lake attracts visitors from all over the region, and the town has several restaurants, hotels, and other businesses that cater to tourists.
The town also has a few manufacturing businesses, including a furniture factory and a woodworking shop. There are also several small businesses in the area, including a grocery store, a hardware store, and a gas station.
Demographics
As of the 2019 census, the population of Fairfield was estimated to be 545. The racial makeup of the town was 95.3% White, 0.7% African American, 0.4% Native American, 0.2% Asian, and 3.4% from other races.
The median household income in Fairfield was $31,250, and the median family income was $37,500. The per capita income was $17,500. The poverty rate was 22.2%.
Conclusion
Fairfield is a small town located in the southeastern corner of Oklahoma, in Pushmataha County. It was founded in 1891, and was named after the nearby Fairfield Plantation. The town is situated on the banks of the Kiamichi River, and is surrounded by the Ouachita National Forest. The economy of Fairfield is largely based on tourism, as the town is located near Lake Eufaula. The population of Fairfield was estimated to be 545 in 2019.
Common Questions
What is Per Capita Income in Fairfield?
Per Capita income in Fairfield is $22,693.
What is the Median Family Income in Fairfield?
Median Family Income in Fairfield is $83,667.
What is the Median Household income in Fairfield?
Median Household Income in Fairfield is $70,000.
What is Income or Wage Gap in Fairfield?
Income or Wage Gap in Fairfield is 37.5%.
Women in Fairfield earn 62.5 cents for every dollar earned by a man.
What is Inequality or Gini Index in Fairfield?
Inequality or Gini Index in Fairfield is 0.40.
What is the Total Population of Fairfield?
Total Population of Fairfield is 535.
What is the Total Male Population of Fairfield?
Total Male Population of Fairfield is 260.
What is the Total Female Population of Fairfield?
Total Female Population of Fairfield is 275.
What is the Ratio of Males per 100 Females in Fairfield?
There are 94.55 Males per 100 Females in Fairfield.
What is the Ratio of Females per 100 Males in Fairfield?
There are 105.77 Females per 100 Males in Fairfield.
What is the Median Population Age in Fairfield?
Median Population Age in Fairfield is 41.4 Years.
What is the Average Family Size in Fairfield
Average Family Size in Fairfield is 3.9 People.
What is the Average Household Size in Fairfield
Average Household Size in Fairfield is 3.1 People.
How Large is the Labor Force in Fairfield?
There are 204 People in the Labor Forcein in Fairfield.
What is the Percentage of People in the Labor Force in Fairfield?
49.2% of People are in the Labor Force in Fairfield.