West Siloam Springs, OK Map & Demographics
West Siloam Springs Map
West Siloam Springs Overview
$22,798
PER CAPITA INCOME
$64,219
AVG FAMILY INCOME
$55,400
AVG HOUSEHOLD INCOME
31.6%
WAGE / INCOME GAP [ % ]
68.4¢/ $1
WAGE / INCOME GAP [ $ ]
0.40
INEQUALITY / GINI INDEX
1,368
TOTAL POPULATION
631
MALE POPULATION
737
FEMALE POPULATION
85.62
MALES / 100 FEMALES
116.80
FEMALES / 100 MALES
41.7
MEDIAN AGE
3.2
AVG FAMILY SIZE
2.8
AVG HOUSEHOLD SIZE
506
LABOR FORCE [ PEOPLE ]
45.3%
PERCENT IN LABOR FORCE
6.7%
UNEMPLOYMENT RATE
West Siloam Springs Area Codes
Income in West Siloam Springs
Income Overview in West Siloam Springs
Per Capita Income in West Siloam Springs is $22,798, while median incomes of families and households are $64,219 and $55,400 respectively.
| Characteristic | Number | Measure |
| Per Capita Income | 1,368 | $22,798 |
| Median Family Income | 322 | $64,219 |
| Mean Family Income | 322 | $73,877 |
| Median Household Income | 444 | $55,400 |
| Mean Household Income | 444 | $63,800 |
| Income Deficit | 322 | $0 |
| Wage / Income Gap (%) | 1,368 | 31.64% |
| Wage / Income Gap ($) | 1,368 | 68.36¢ per $1 |
| Gini / Inequality Index | 1,368 | 0.40 |
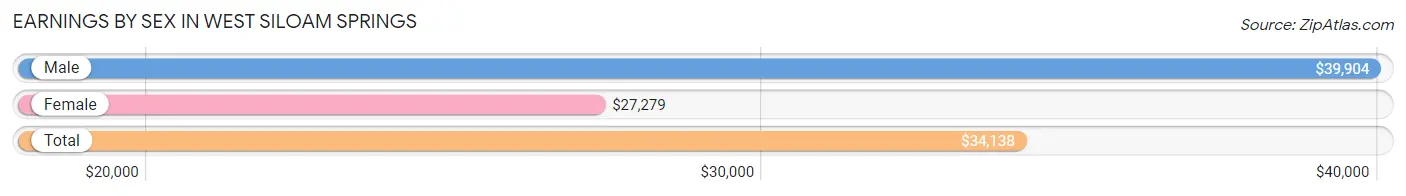
Earnings by Sex in West Siloam Springs
Average Earnings in West Siloam Springs are $34,138, $39,904 for men and $27,279 for women, a difference of 31.6%.
| Sex | Number | Average Earnings |
| Male | 259 (47.8%) | $39,904 |
| Female | 283 (52.2%) | $27,279 |
| Total | 542 (100.0%) | $34,138 |
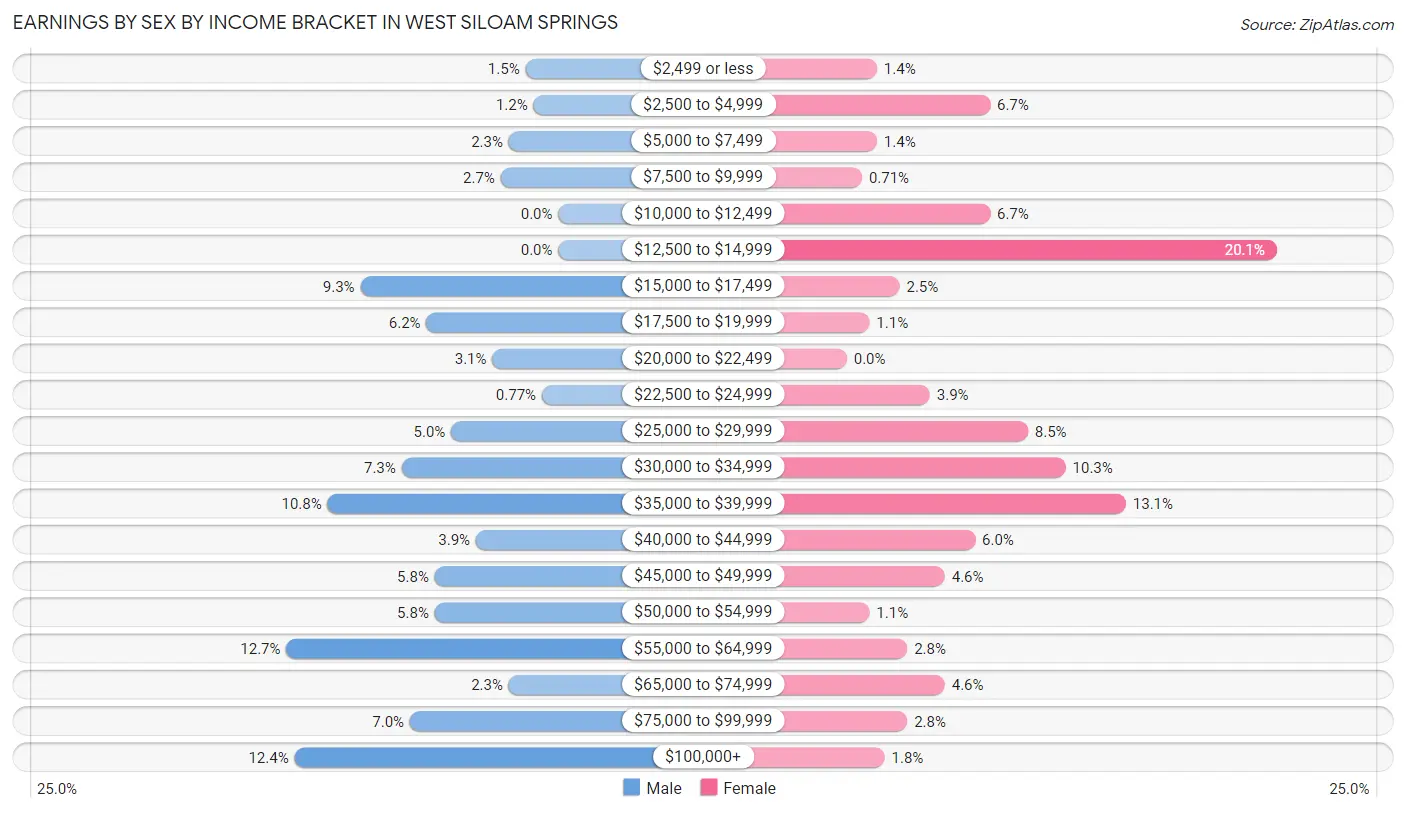
Earnings by Sex by Income Bracket in West Siloam Springs
The most common earnings brackets in West Siloam Springs are $55,000 to $64,999 for men (33 | 12.7%) and $12,500 to $14,999 for women (57 | 20.1%).
| Income | Male | Female |
| $2,499 or less | 4 (1.5%) | 4 (1.4%) |
| $2,500 to $4,999 | 3 (1.2%) | 19 (6.7%) |
| $5,000 to $7,499 | 6 (2.3%) | 4 (1.4%) |
| $7,500 to $9,999 | 7 (2.7%) | 2 (0.7%) |
| $10,000 to $12,499 | 0 (0.0%) | 19 (6.7%) |
| $12,500 to $14,999 | 0 (0.0%) | 57 (20.1%) |
| $15,000 to $17,499 | 24 (9.3%) | 7 (2.5%) |
| $17,500 to $19,999 | 16 (6.2%) | 3 (1.1%) |
| $20,000 to $22,499 | 8 (3.1%) | 0 (0.0%) |
| $22,500 to $24,999 | 2 (0.8%) | 11 (3.9%) |
| $25,000 to $29,999 | 13 (5.0%) | 24 (8.5%) |
| $30,000 to $34,999 | 19 (7.3%) | 29 (10.2%) |
| $35,000 to $39,999 | 28 (10.8%) | 37 (13.1%) |
| $40,000 to $44,999 | 10 (3.9%) | 17 (6.0%) |
| $45,000 to $49,999 | 15 (5.8%) | 13 (4.6%) |
| $50,000 to $54,999 | 15 (5.8%) | 3 (1.1%) |
| $55,000 to $64,999 | 33 (12.7%) | 8 (2.8%) |
| $65,000 to $74,999 | 6 (2.3%) | 13 (4.6%) |
| $75,000 to $99,999 | 18 (7.0%) | 8 (2.8%) |
| $100,000+ | 32 (12.4%) | 5 (1.8%) |
| Total | 259 (100.0%) | 283 (100.0%) |
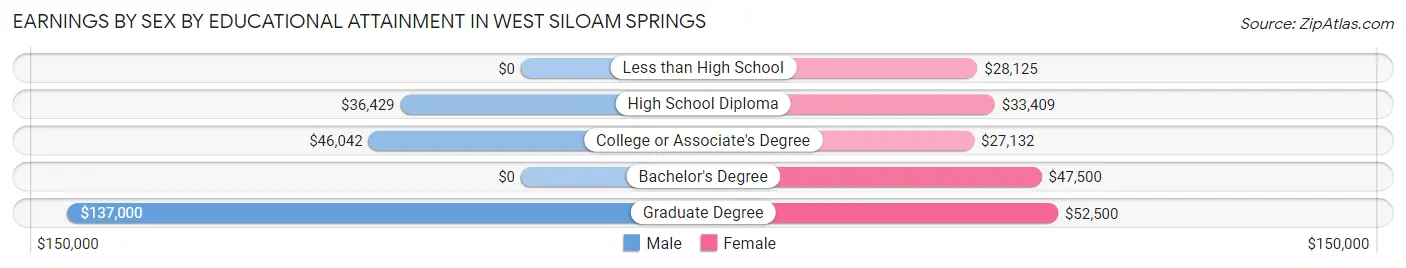
Earnings by Sex by Educational Attainment in West Siloam Springs
Average earnings in West Siloam Springs are $43,438 for men and $34,318 for women, a difference of 21.0%. Men with an educational attainment of graduate degree enjoy the highest average annual earnings of $137,000, while those with high school diploma education earn the least with $36,429. Women with an educational attainment of graduate degree earn the most with the average annual earnings of $52,500, while those with college or associate's degree education have the smallest earnings of $27,132.
| Educational Attainment | Male Income | Female Income |
| Less than High School | - | - |
| High School Diploma | $36,429 | $33,409 |
| College or Associate's Degree | $46,042 | $27,132 |
| Bachelor's Degree | - | - |
| Graduate Degree | $137,000 | $52,500 |
| Total | $43,438 | $34,318 |
Family Income in West Siloam Springs
Family Income Brackets in West Siloam Springs
According to the West Siloam Springs family income data, there are 112 families falling into the $50,000 to $74,999 income range, which is the most common income bracket and makes up 34.8% of all families.
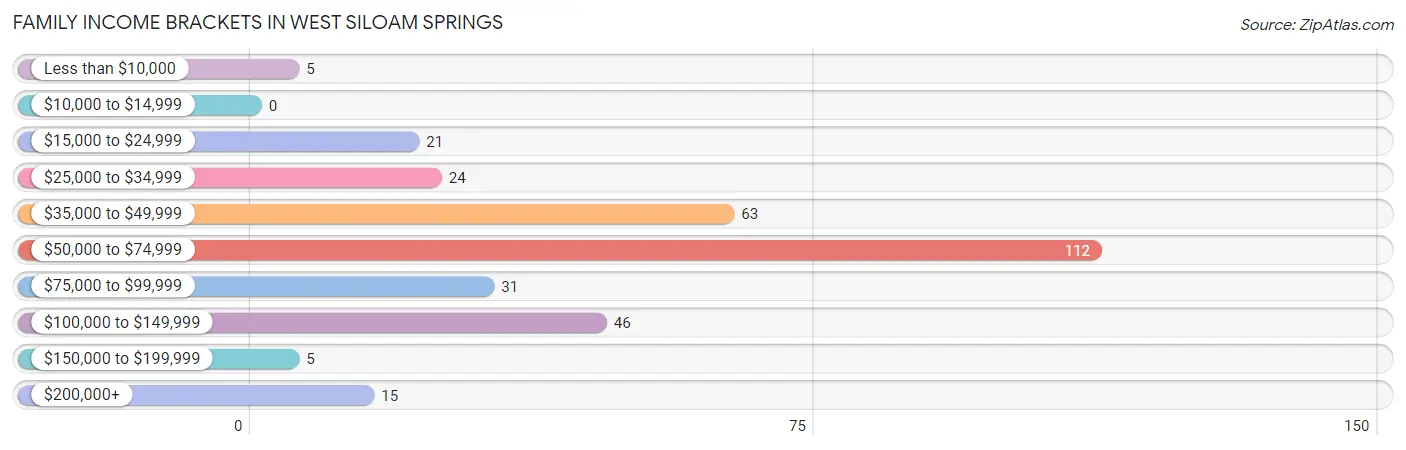
| Income Bracket | # Families | % Families |
| Less than $10,000 | 5 | 1.6% |
| $10,000 to $14,999 | 0 | 0.0% |
| $15,000 to $24,999 | 21 | 6.5% |
| $25,000 to $34,999 | 24 | 7.5% |
| $35,000 to $49,999 | 63 | 19.6% |
| $50,000 to $74,999 | 112 | 34.8% |
| $75,000 to $99,999 | 31 | 9.6% |
| $100,000 to $149,999 | 46 | 14.3% |
| $150,000 to $199,999 | 5 | 1.6% |
| $200,000+ | 15 | 4.7% |
Family Income by Famaliy Size in West Siloam Springs
4-person families (40 | 12.4%) account for the highest median family income in West Siloam Springs with $98,750 per family, while 2-person families (156 | 48.4%) have the highest median income of $28,572 per family member.
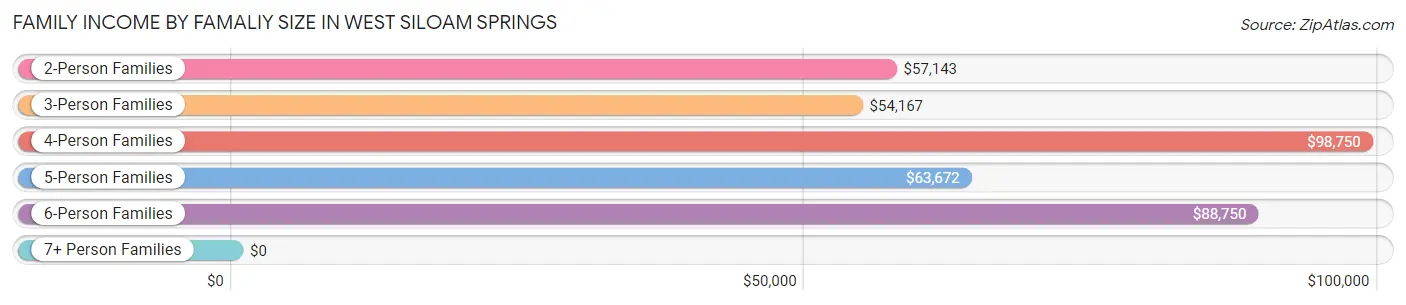
| Income Bracket | # Families | Median Income |
| 2-Person Families | 156 (48.4%) | $57,143 |
| 3-Person Families | 72 (22.4%) | $54,167 |
| 4-Person Families | 40 (12.4%) | $98,750 |
| 5-Person Families | 27 (8.4%) | $63,672 |
| 6-Person Families | 20 (6.2%) | $88,750 |
| 7+ Person Families | 7 (2.2%) | $0 |
| Total | 322 (100.0%) | $64,219 |
Family Income by Number of Earners in West Siloam Springs
The median family income in West Siloam Springs is $64,219, with families comprising 3+ earners (31) having the highest median family income of $163,125, while families with 1 earner (110) have the lowest median family income of $53,182, accounting for 9.6% and 34.2% of families, respectively.
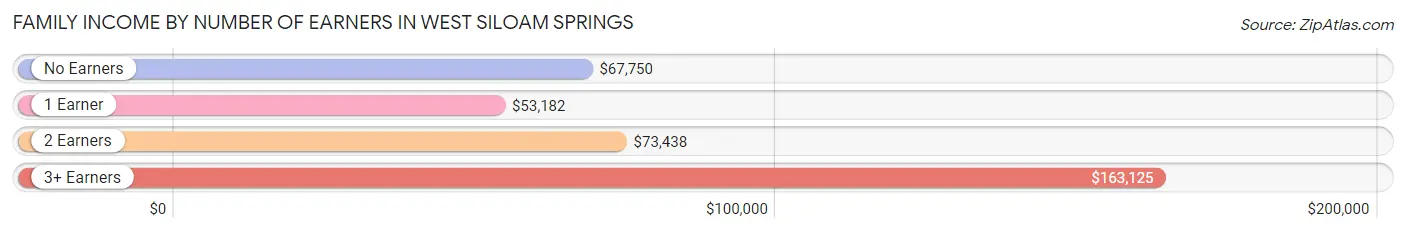
| Number of Earners | # Families | Median Income |
| No Earners | 78 (24.2%) | $67,750 |
| 1 Earner | 110 (34.2%) | $53,182 |
| 2 Earners | 103 (32.0%) | $73,438 |
| 3+ Earners | 31 (9.6%) | $163,125 |
| Total | 322 (100.0%) | $64,219 |
Household Income in West Siloam Springs
Household Income Brackets in West Siloam Springs
With 138 households falling in the category, the $50,000 to $74,999 income range is the most frequent in West Siloam Springs, accounting for 31.1% of all households. In contrast, only 5 households (1.1%) fall into the $150,000 to $199,999 income bracket, making it the least populous group.
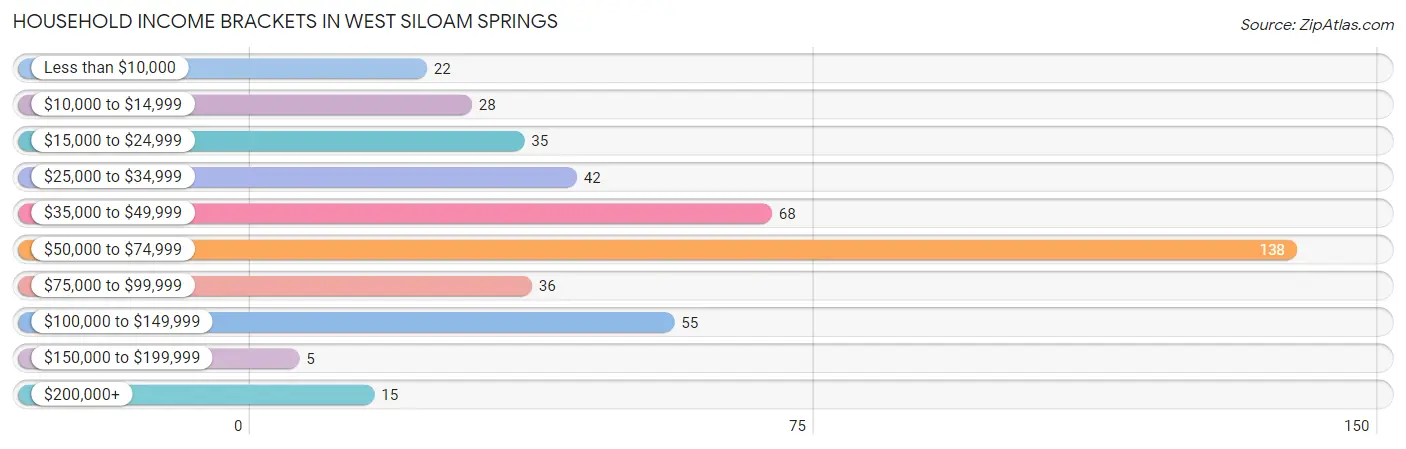
| Income Bracket | # Households | % Households |
| Less than $10,000 | 22 | 5.0% |
| $10,000 to $14,999 | 28 | 6.3% |
| $15,000 to $24,999 | 35 | 7.9% |
| $25,000 to $34,999 | 42 | 9.5% |
| $35,000 to $49,999 | 68 | 15.3% |
| $50,000 to $74,999 | 138 | 31.1% |
| $75,000 to $99,999 | 36 | 8.1% |
| $100,000 to $149,999 | 55 | 12.4% |
| $150,000 to $199,999 | 5 | 1.1% |
| $200,000+ | 15 | 3.4% |
Household Income by Householder Age in West Siloam Springs
The median household income in West Siloam Springs is $55,400, with the highest median household income of $64,297 found in the 25 to 44 years age bracket for the primary householder. A total of 133 households (29.9%) fall into this category. Meanwhile, the 15 to 24 years age bracket for the primary householder has the lowest median household income of $0, with 10 households (2.2%) in this group.
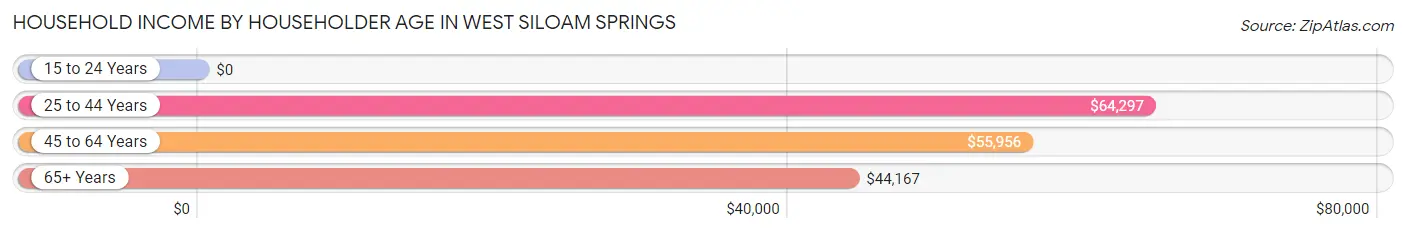
| Income Bracket | # Households | Median Income |
| 15 to 24 Years | 10 (2.2%) | $0 |
| 25 to 44 Years | 133 (29.9%) | $64,297 |
| 45 to 64 Years | 147 (33.1%) | $55,956 |
| 65+ Years | 154 (34.7%) | $44,167 |
| Total | 444 (100.0%) | $55,400 |
Poverty in West Siloam Springs
Income Below Poverty by Sex and Age in West Siloam Springs
With 13.5% poverty level for males and 19.2% for females among the residents of West Siloam Springs, 5 year old males and under 5 year old females are the most vulnerable to poverty, with 3 males (100.0%) and 13 females (46.4%) in their respective age groups living below the poverty level.
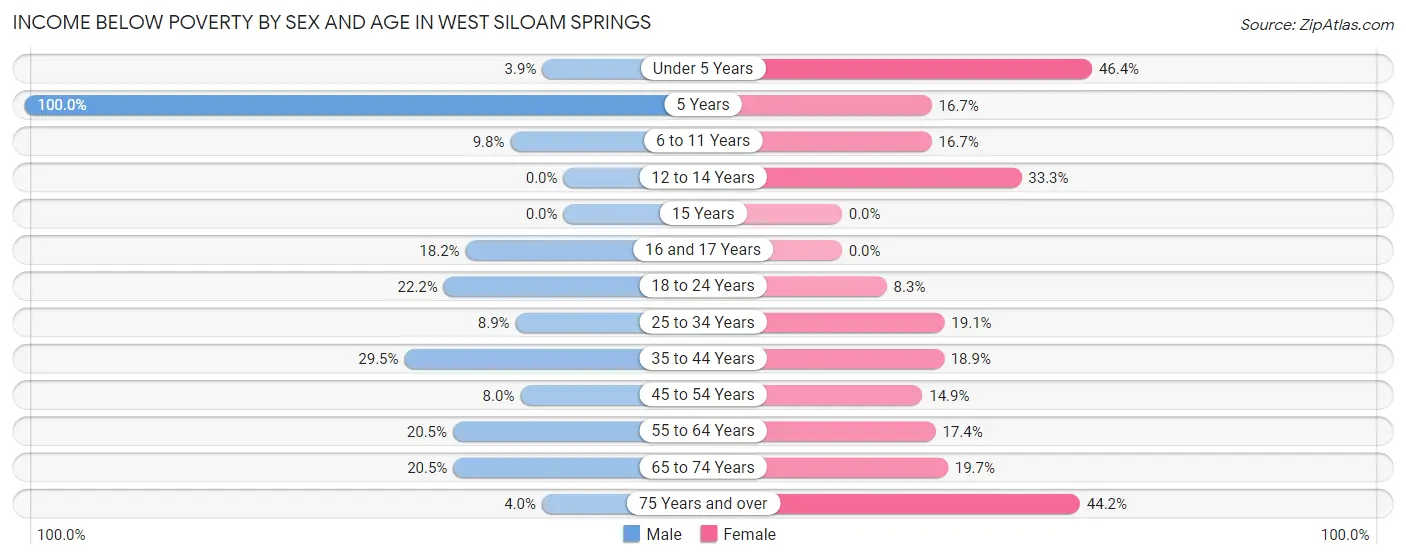
| Age Bracket | Male | Female |
| Under 5 Years | 2 (3.9%) | 13 (46.4%) |
| 5 Years | 3 (100.0%) | 2 (16.7%) |
| 6 to 11 Years | 6 (9.8%) | 10 (16.7%) |
| 12 to 14 Years | 0 (0.0%) | 2 (33.3%) |
| 15 Years | 0 (0.0%) | 0 (0.0%) |
| 16 and 17 Years | 2 (18.2%) | 0 (0.0%) |
| 18 to 24 Years | 8 (22.2%) | 6 (8.3%) |
| 25 to 34 Years | 8 (8.9%) | 20 (19.1%) |
| 35 to 44 Years | 18 (29.5%) | 14 (18.9%) |
| 45 to 54 Years | 6 (8.0%) | 13 (14.9%) |
| 55 to 64 Years | 16 (20.5%) | 16 (17.4%) |
| 65 to 74 Years | 9 (20.4%) | 12 (19.7%) |
| 75 Years and over | 3 (4.0%) | 19 (44.2%) |
| Total | 81 (13.5%) | 127 (19.2%) |
Income Above Poverty by Sex and Age in West Siloam Springs
According to the poverty statistics in West Siloam Springs, males aged 12 to 14 years and females aged 15 years are the age groups that are most secure financially, with 100.0% of males and 100.0% of females in these age groups living above the poverty line.
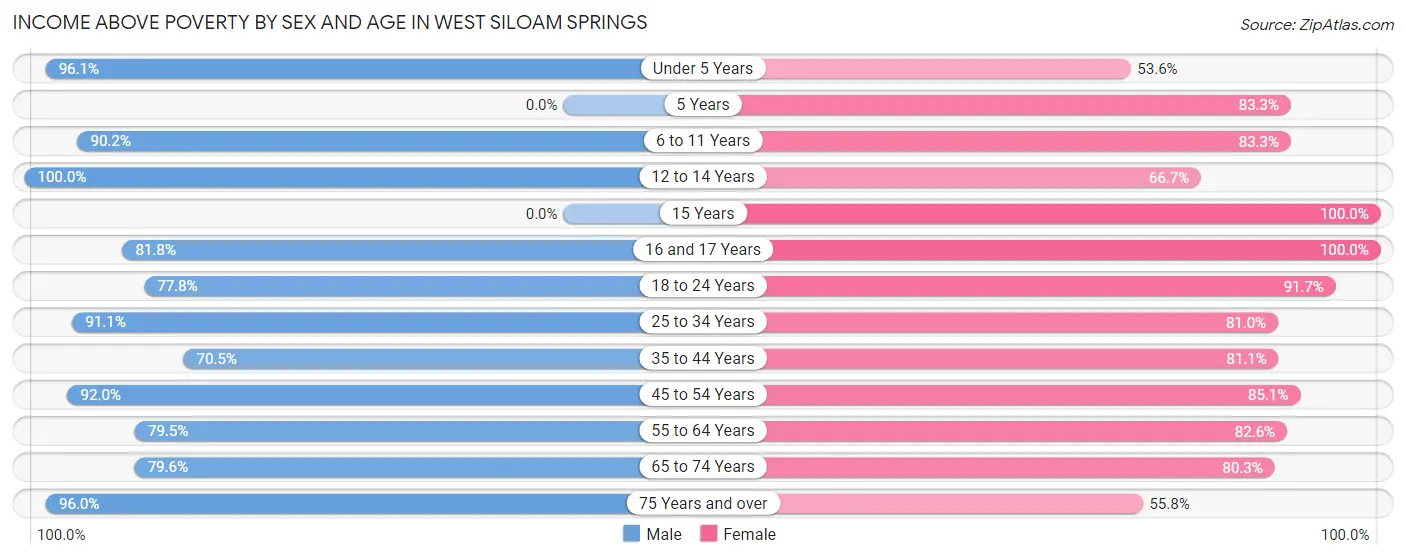
| Age Bracket | Male | Female |
| Under 5 Years | 49 (96.1%) | 15 (53.6%) |
| 5 Years | 0 (0.0%) | 10 (83.3%) |
| 6 to 11 Years | 55 (90.2%) | 50 (83.3%) |
| 12 to 14 Years | 14 (100.0%) | 4 (66.7%) |
| 15 Years | 0 (0.0%) | 4 (100.0%) |
| 16 and 17 Years | 9 (81.8%) | 16 (100.0%) |
| 18 to 24 Years | 28 (77.8%) | 66 (91.7%) |
| 25 to 34 Years | 82 (91.1%) | 85 (80.9%) |
| 35 to 44 Years | 43 (70.5%) | 60 (81.1%) |
| 45 to 54 Years | 69 (92.0%) | 74 (85.1%) |
| 55 to 64 Years | 62 (79.5%) | 76 (82.6%) |
| 65 to 74 Years | 35 (79.5%) | 49 (80.3%) |
| 75 Years and over | 72 (96.0%) | 24 (55.8%) |
| Total | 518 (86.5%) | 533 (80.8%) |
Income Below Poverty Among Married-Couple Families in West Siloam Springs
The poverty statistics for married-couple families in West Siloam Springs show that 8.6% or 21 of the total 243 families live below the poverty line. Families with 5 or more children have the highest poverty rate of 50.0%, comprising of 2 families. On the other hand, families with no children have the lowest poverty rate of 0.0%, which includes 0 families.
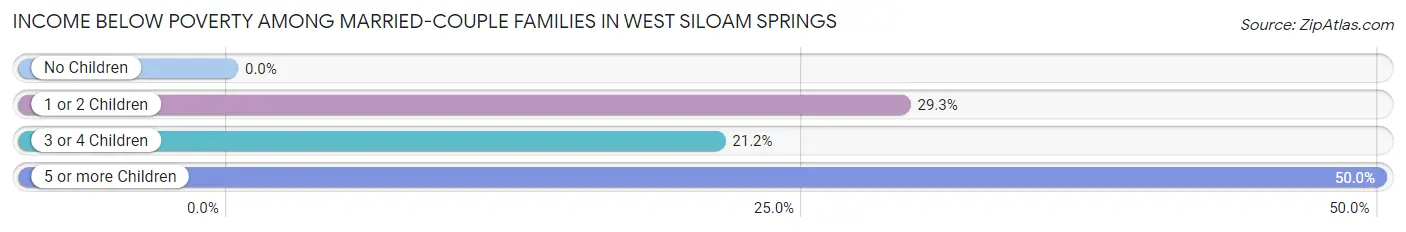
| Children | Above Poverty | Below Poverty |
| No Children | 165 (100.0%) | 0 (0.0%) |
| 1 or 2 Children | 29 (70.7%) | 12 (29.3%) |
| 3 or 4 Children | 26 (78.8%) | 7 (21.2%) |
| 5 or more Children | 2 (50.0%) | 2 (50.0%) |
| Total | 222 (91.4%) | 21 (8.6%) |
Income Below Poverty Among Single-Parent Households in West Siloam Springs
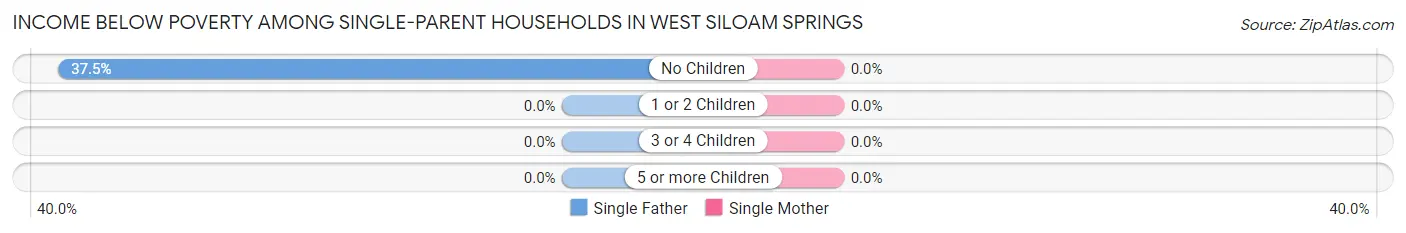
| Children | Single Father | Single Mother |
| No Children | 3 (37.5%) | 0 (0.0%) |
| 1 or 2 Children | 0 (0.0%) | 0 (0.0%) |
| 3 or 4 Children | 0 (0.0%) | 0 (0.0%) |
| 5 or more Children | 0 (0.0%) | 0 (0.0%) |
| Total | 3 (11.5%) | 0 (0.0%) |
Income Below Poverty Among Married-Couple vs Single-Parent Households in West Siloam Springs
The poverty data for West Siloam Springs shows that 21 of the married-couple family households (8.6%) and 3 of the single-parent households (3.8%) are living below the poverty level. Within the married-couple family households, those with 5 or more children have the highest poverty rate, with 2 households (50.0%) falling below the poverty line. Among the single-parent households, those with no children have the highest poverty rate, with 3 household (15.0%) living below poverty.
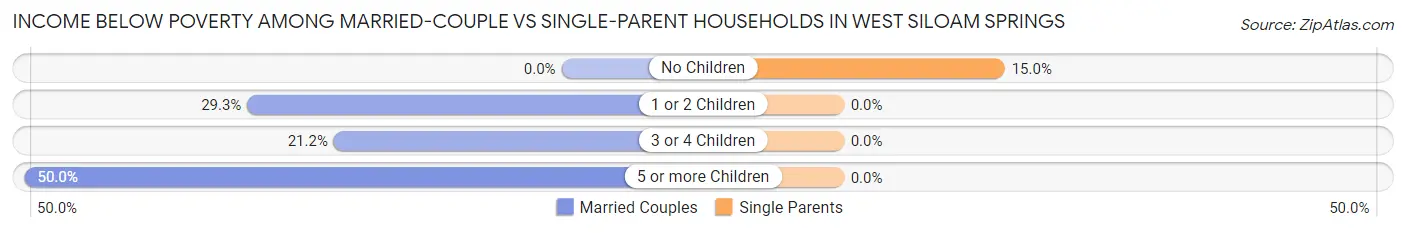
| Children | Married-Couple Families | Single-Parent Households |
| No Children | 0 (0.0%) | 3 (15.0%) |
| 1 or 2 Children | 12 (29.3%) | 0 (0.0%) |
| 3 or 4 Children | 7 (21.2%) | 0 (0.0%) |
| 5 or more Children | 2 (50.0%) | 0 (0.0%) |
| Total | 21 (8.6%) | 3 (3.8%) |
Race in West Siloam Springs
The most populous races in West Siloam Springs are White / Caucasian (777 | 56.8%), Native / Alaskan (369 | 27.0%), and Two or more Races (155 | 11.3%).
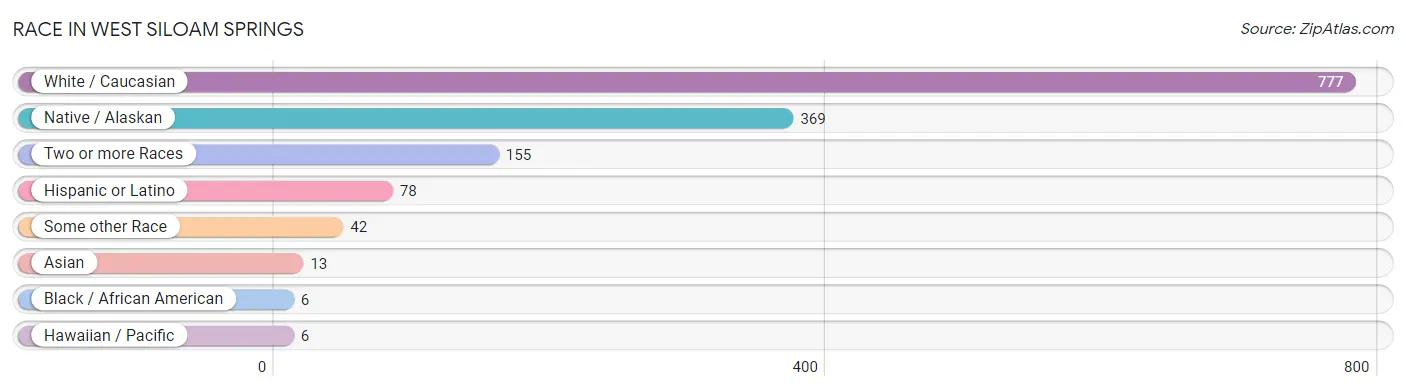
| Race | # Population | % Population |
| Asian | 13 | 0.9% |
| Black / African American | 6 | 0.4% |
| Hawaiian / Pacific | 6 | 0.4% |
| Hispanic or Latino | 78 | 5.7% |
| Native / Alaskan | 369 | 27.0% |
| White / Caucasian | 777 | 56.8% |
| Two or more Races | 155 | 11.3% |
| Some other Race | 42 | 3.1% |
| Total | 1,368 | 100.0% |
Ancestry in West Siloam Springs
The most populous ancestries reported in West Siloam Springs are Cherokee (459 | 33.6%), German (92 | 6.7%), English (91 | 6.7%), Irish (91 | 6.7%), and Mexican (50 | 3.6%), together accounting for 57.2% of all West Siloam Springs residents.
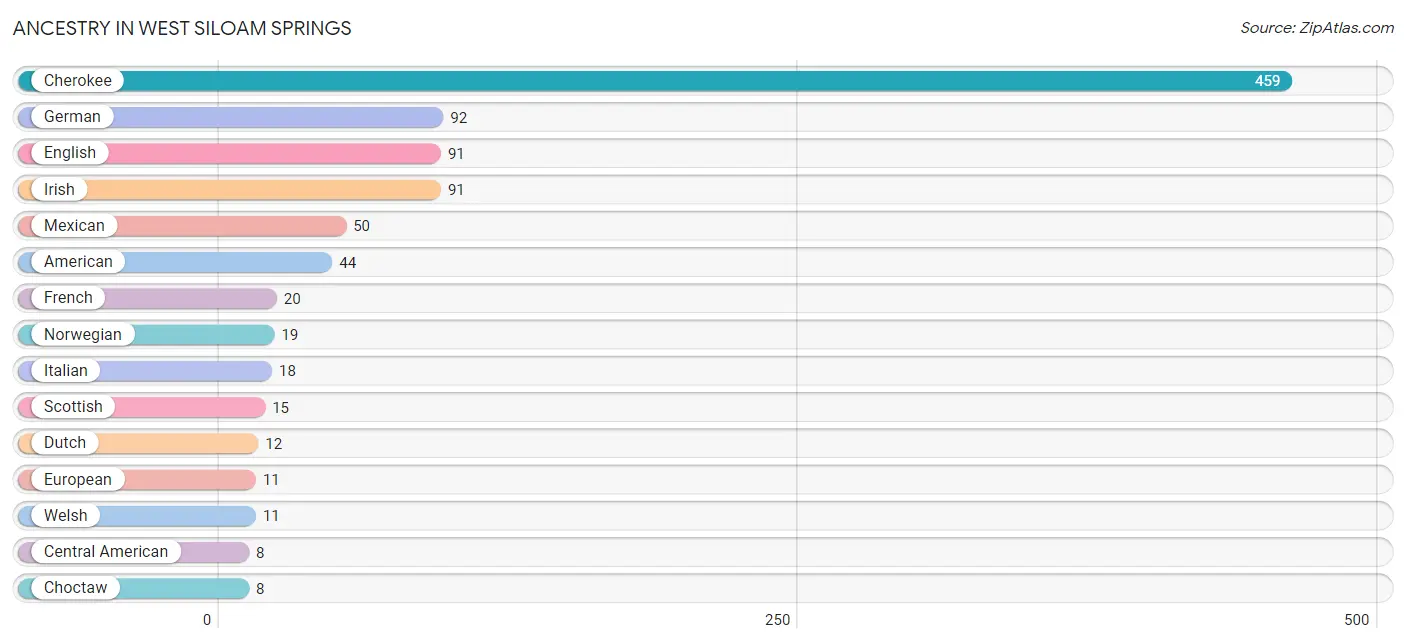
| Ancestry | # Population | % Population |
| American | 44 | 3.2% |
| British | 3 | 0.2% |
| Central American | 8 | 0.6% |
| Cherokee | 459 | 33.6% |
| Choctaw | 8 | 0.6% |
| Comanche | 7 | 0.5% |
| Creek | 3 | 0.2% |
| Czechoslovakian | 3 | 0.2% |
| Danish | 8 | 0.6% |
| Delaware | 6 | 0.4% |
| Dutch | 12 | 0.9% |
| Dutch West Indian | 8 | 0.6% |
| English | 91 | 6.7% |
| European | 11 | 0.8% |
| French | 20 | 1.5% |
| German | 92 | 6.7% |
| Guatemalan | 7 | 0.5% |
| Indian (Asian) | 6 | 0.4% |
| Irish | 91 | 6.7% |
| Italian | 18 | 1.3% |
| Mexican | 50 | 3.6% |
| Navajo | 5 | 0.4% |
| Norwegian | 19 | 1.4% |
| Salvadoran | 1 | 0.1% |
| Scotch-Irish | 3 | 0.2% |
| Scottish | 15 | 1.1% |
| Spanish | 7 | 0.5% |
| Sri Lankan | 7 | 0.5% |
| Swedish | 1 | 0.1% |
| Welsh | 11 | 0.8% | View All 30 Rows |
Immigrants in West Siloam Springs
The most numerous immigrant groups reported in West Siloam Springs came from Asia (13 | 0.9%), Canada (11 | 0.8%), Europe (8 | 0.6%), Germany (8 | 0.6%), and Western Europe (8 | 0.6%), together accounting for 3.5% of all West Siloam Springs residents.
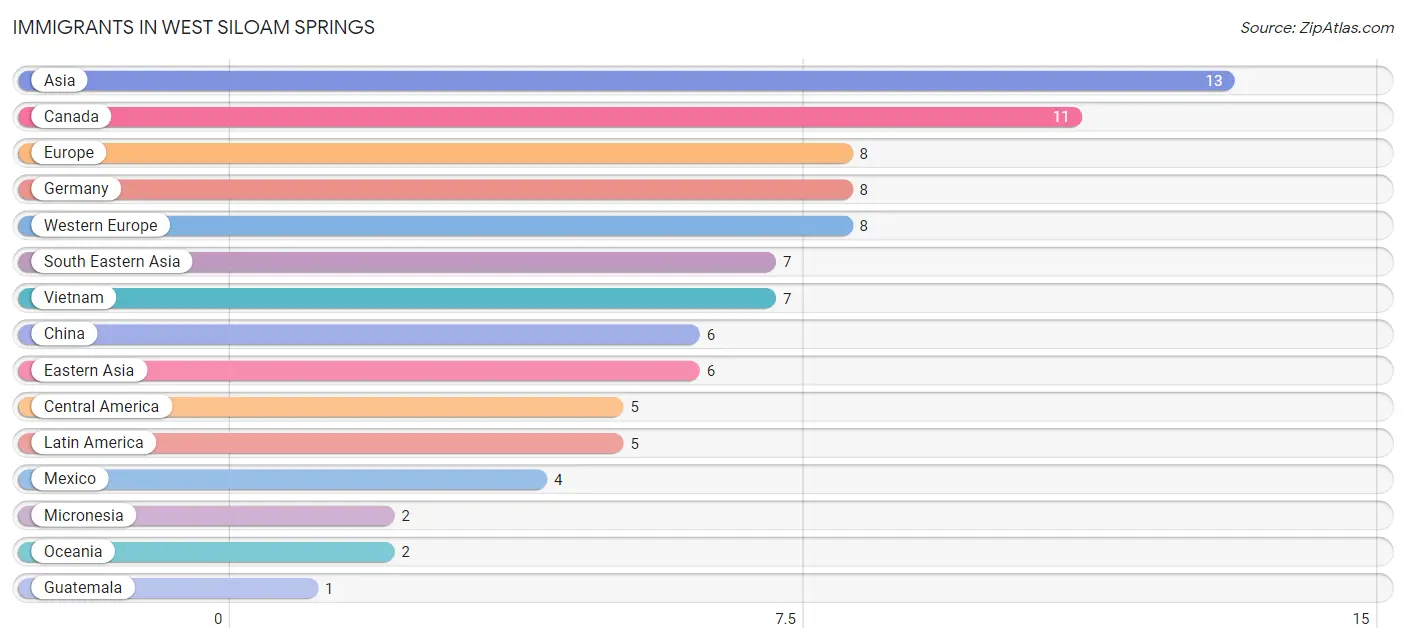
| Immigration Origin | # Population | % Population |
| Asia | 13 | 0.9% |
| Canada | 11 | 0.8% |
| Central America | 5 | 0.4% |
| China | 6 | 0.4% |
| Eastern Asia | 6 | 0.4% |
| Europe | 8 | 0.6% |
| Germany | 8 | 0.6% |
| Guatemala | 1 | 0.1% |
| Latin America | 5 | 0.4% |
| Mexico | 4 | 0.3% |
| Micronesia | 2 | 0.2% |
| Oceania | 2 | 0.2% |
| South Eastern Asia | 7 | 0.5% |
| Vietnam | 7 | 0.5% |
| Western Europe | 8 | 0.6% | View All 15 Rows |
Sex and Age in West Siloam Springs
Sex and Age in West Siloam Springs
The most populous age groups in West Siloam Springs are 25 to 29 Years (56 | 8.9%) for men and 60 to 64 Years (77 | 10.4%) for women.
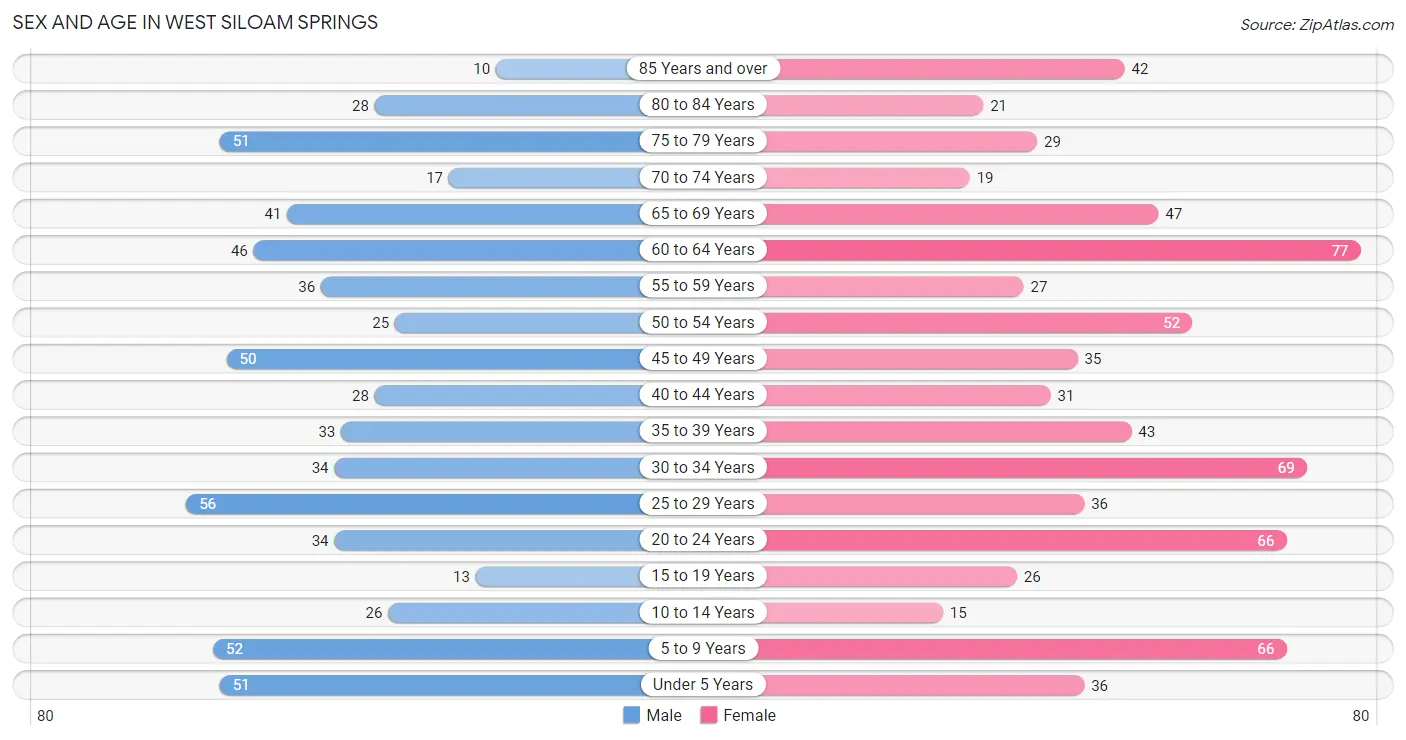
| Age Bracket | Male | Female |
| Under 5 Years | 51 (8.1%) | 36 (4.9%) |
| 5 to 9 Years | 52 (8.2%) | 66 (9.0%) |
| 10 to 14 Years | 26 (4.1%) | 15 (2.0%) |
| 15 to 19 Years | 13 (2.1%) | 26 (3.5%) |
| 20 to 24 Years | 34 (5.4%) | 66 (9.0%) |
| 25 to 29 Years | 56 (8.9%) | 36 (4.9%) |
| 30 to 34 Years | 34 (5.4%) | 69 (9.4%) |
| 35 to 39 Years | 33 (5.2%) | 43 (5.8%) |
| 40 to 44 Years | 28 (4.4%) | 31 (4.2%) |
| 45 to 49 Years | 50 (7.9%) | 35 (4.8%) |
| 50 to 54 Years | 25 (4.0%) | 52 (7.1%) |
| 55 to 59 Years | 36 (5.7%) | 27 (3.7%) |
| 60 to 64 Years | 46 (7.3%) | 77 (10.4%) |
| 65 to 69 Years | 41 (6.5%) | 47 (6.4%) |
| 70 to 74 Years | 17 (2.7%) | 19 (2.6%) |
| 75 to 79 Years | 51 (8.1%) | 29 (3.9%) |
| 80 to 84 Years | 28 (4.4%) | 21 (2.9%) |
| 85 Years and over | 10 (1.6%) | 42 (5.7%) |
| Total | 631 (100.0%) | 737 (100.0%) |
Families and Households in West Siloam Springs
Median Family Size in West Siloam Springs
The median family size in West Siloam Springs is 3.22 persons per family, with single female/mother families (53 | 16.5%) accounting for the largest median family size of 4.23 persons per family. On the other hand, single male/father families (26 | 8.1%) represent the smallest median family size with 2.50 persons per family.
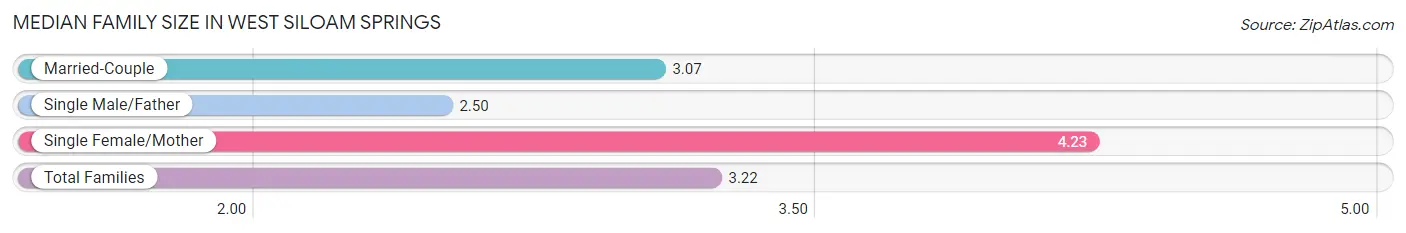
| Family Type | # Families | Family Size |
| Married-Couple | 243 (75.5%) | 3.07 |
| Single Male/Father | 26 (8.1%) | 2.50 |
| Single Female/Mother | 53 (16.5%) | 4.23 |
| Total Families | 322 (100.0%) | 3.22 |
Median Household Size in West Siloam Springs
The median household size in West Siloam Springs is 2.79 persons per household, with single female/mother households (53 | 11.9%) accounting for the largest median household size of 4.55 persons per household. non-family households (122 | 27.5%) represent the smallest median household size with 1.30 persons per household.
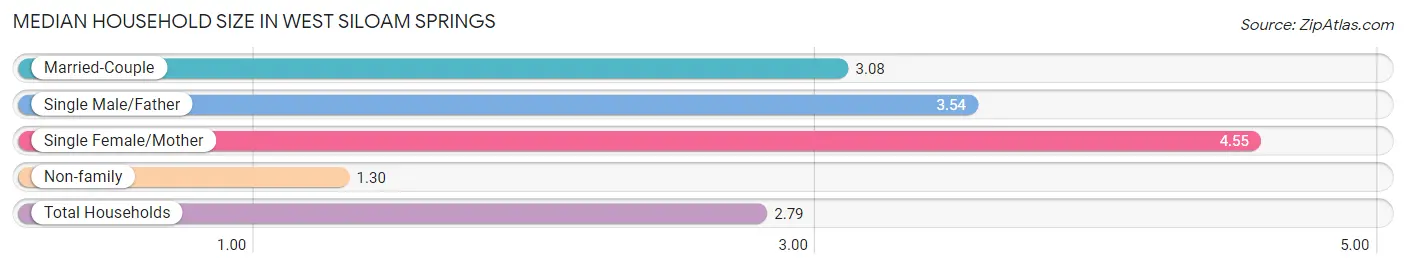
| Household Type | # Households | Household Size |
| Married-Couple | 243 (54.7%) | 3.08 |
| Single Male/Father | 26 (5.9%) | 3.54 |
| Single Female/Mother | 53 (11.9%) | 4.55 |
| Non-family | 122 (27.5%) | 1.30 |
| Total Households | 444 (100.0%) | 2.79 |
Household Size by Marriage Status in West Siloam Springs
Out of a total of 444 households in West Siloam Springs, 322 (72.5%) are family households, while 122 (27.5%) are nonfamily households. The most numerous type of family households are 2-person households, comprising 141, and the most common type of nonfamily households are 1-person households, comprising 109.
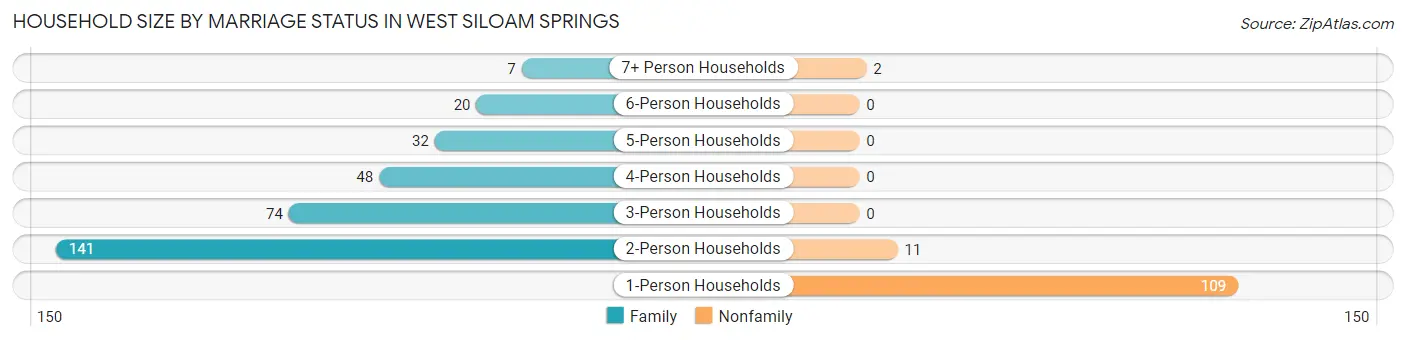
| Household Size | Family Households | Nonfamily Households |
| 1-Person Households | - | 109 (24.5%) |
| 2-Person Households | 141 (31.8%) | 11 (2.5%) |
| 3-Person Households | 74 (16.7%) | 0 (0.0%) |
| 4-Person Households | 48 (10.8%) | 0 (0.0%) |
| 5-Person Households | 32 (7.2%) | 0 (0.0%) |
| 6-Person Households | 20 (4.5%) | 0 (0.0%) |
| 7+ Person Households | 7 (1.6%) | 2 (0.4%) |
| Total | 322 (72.5%) | 122 (27.5%) |
Female Fertility in West Siloam Springs
Fertility by Age in West Siloam Springs
Average fertility rate in West Siloam Springs is 97.0 births per 1,000 women. Women in the age bracket of 20 to 34 years have the highest fertility rate with 140.0 births per 1,000 women. Women in the age bracket of 20 to 34 years acount for 75.0% of all women with births.
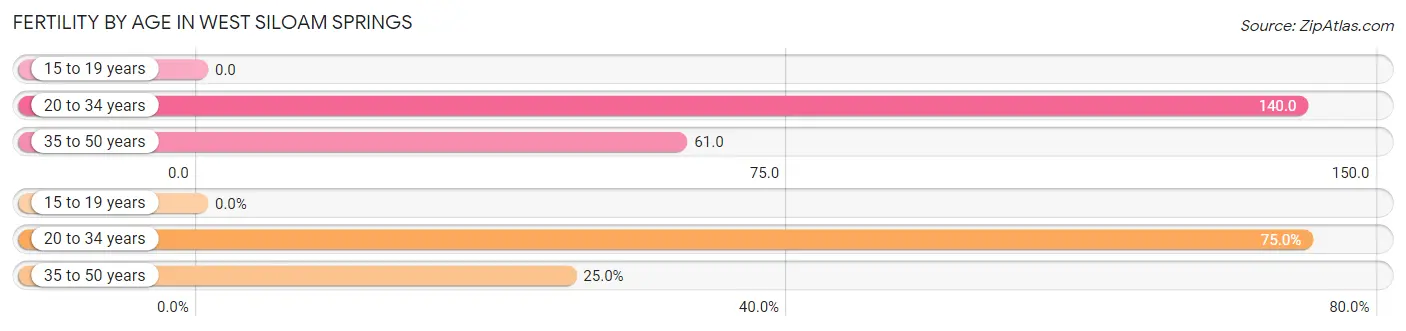
| Age Bracket | Women with Births | Births / 1,000 Women |
| 15 to 19 years | 0 (0.0%) | 0.0 |
| 20 to 34 years | 24 (75.0%) | 140.0 |
| 35 to 50 years | 8 (25.0%) | 61.0 |
| Total | 32 (100.0%) | 97.0 |
Fertility by Age by Marriage Status in West Siloam Springs
40.6% of women with births (32) in West Siloam Springs are married. The highest percentage of unmarried women with births falls into 35 to 50 years age bracket with 100.0% of them unmarried at the time of birth, while the lowest percentage of unmarried women with births belong to 20 to 34 years age bracket with 45.8% of them unmarried.
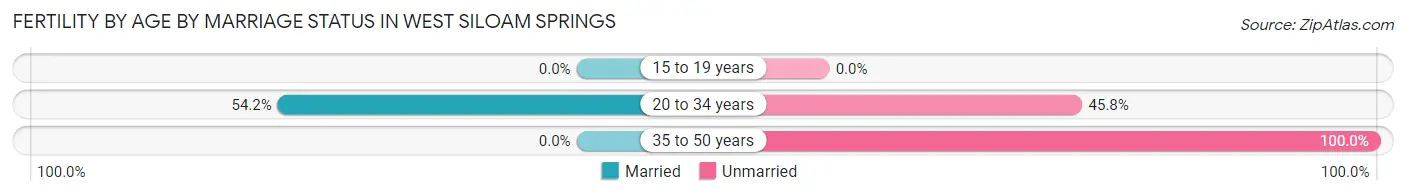
| Age Bracket | Married | Unmarried |
| 15 to 19 years | 0 (0.0%) | 0 (0.0%) |
| 20 to 34 years | 13 (54.2%) | 11 (45.8%) |
| 35 to 50 years | 0 (0.0%) | 8 (100.0%) |
| Total | 13 (40.6%) | 19 (59.4%) |
Fertility by Education in West Siloam Springs
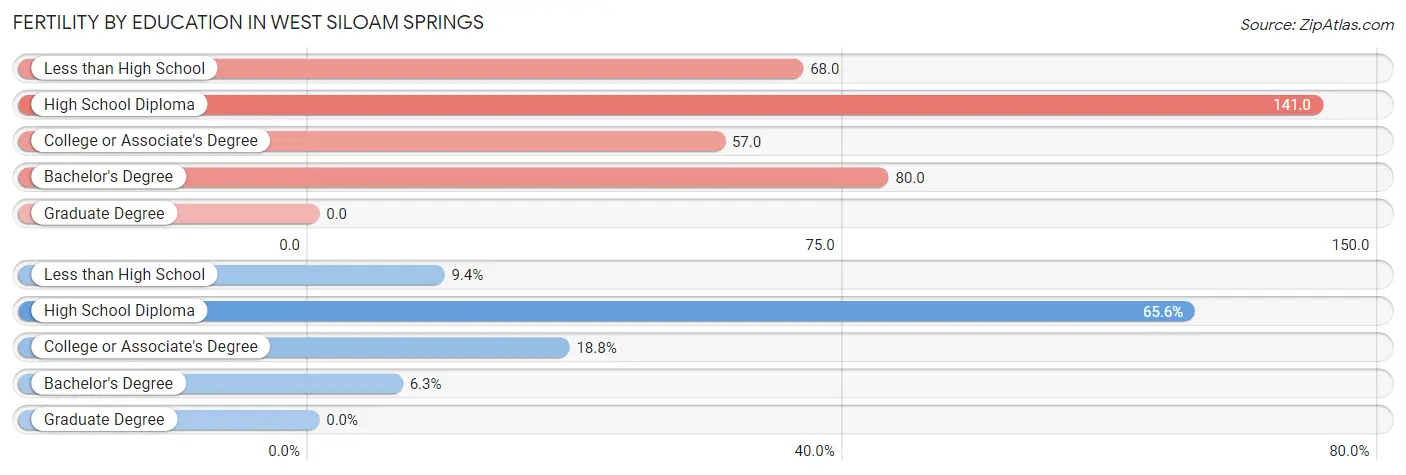
| Educational Attainment | Women with Births | Births / 1,000 Women |
| Less than High School | 3 (9.4%) | 68.0 |
| High School Diploma | 21 (65.6%) | 141.0 |
| College or Associate's Degree | 6 (18.8%) | 57.0 |
| Bachelor's Degree | 2 (6.2%) | 80.0 |
| Graduate Degree | 0 (0.0%) | 0.0 |
| Total | 32 (100.0%) | 97.0 |
Fertility by Education by Marriage Status in West Siloam Springs
59.4% of women with births in West Siloam Springs are unmarried. Women with the educational attainment of bachelor's degree are most likely to be married with 100.0% of them married at childbirth, while women with the educational attainment of college or associate's degree are least likely to be married with 100.0% of them unmarried at childbirth.
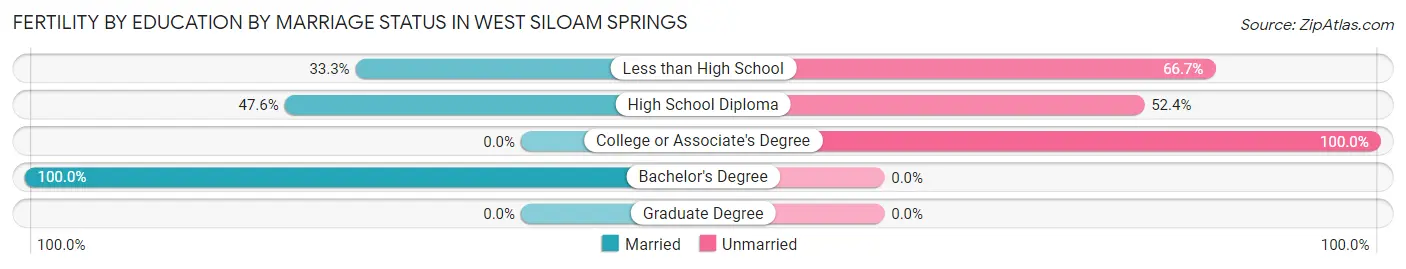
| Educational Attainment | Married | Unmarried |
| Less than High School | 1 (33.3%) | 2 (66.7%) |
| High School Diploma | 10 (47.6%) | 11 (52.4%) |
| College or Associate's Degree | 0 (0.0%) | 6 (100.0%) |
| Bachelor's Degree | 2 (100.0%) | 0 (0.0%) |
| Graduate Degree | 0 (0.0%) | 0 (0.0%) |
| Total | 13 (40.6%) | 19 (59.4%) |
Employment Characteristics in West Siloam Springs
Employment by Class of Employer in West Siloam Springs
Among the 466 employed individuals in West Siloam Springs, private company employees (326 | 70.0%), not-for-profit organizations (58 | 12.4%), and local government employees (35 | 7.5%) make up the most common classes of employment.
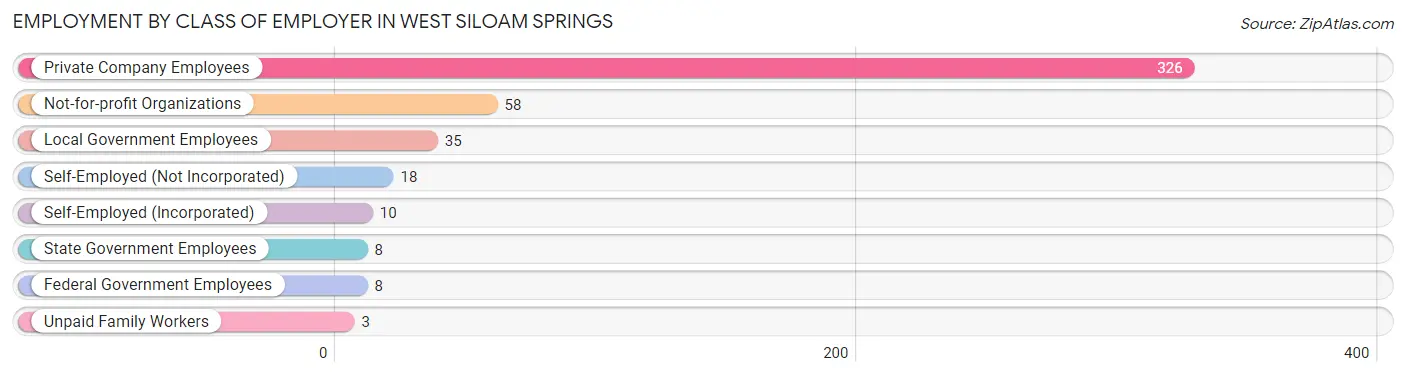
| Employer Class | # Employees | % Employees |
| Private Company Employees | 326 | 70.0% |
| Self-Employed (Incorporated) | 10 | 2.1% |
| Self-Employed (Not Incorporated) | 18 | 3.9% |
| Not-for-profit Organizations | 58 | 12.4% |
| Local Government Employees | 35 | 7.5% |
| State Government Employees | 8 | 1.7% |
| Federal Government Employees | 8 | 1.7% |
| Unpaid Family Workers | 3 | 0.6% |
| Total | 466 | 100.0% |
Employment Status by Age in West Siloam Springs
According to the labor force statistics for West Siloam Springs, out of the total population over 16 years of age (1,118), 45.3% or 506 individuals are in the labor force, with 6.7% or 34 of them unemployed. The age group with the highest labor force participation rate is 20 to 24 years, with 82.0% or 82 individuals in the labor force. Within the labor force, the 55 to 59 years age range has the highest percentage of unemployed individuals, with 21.3% or 10 of them being unemployed.
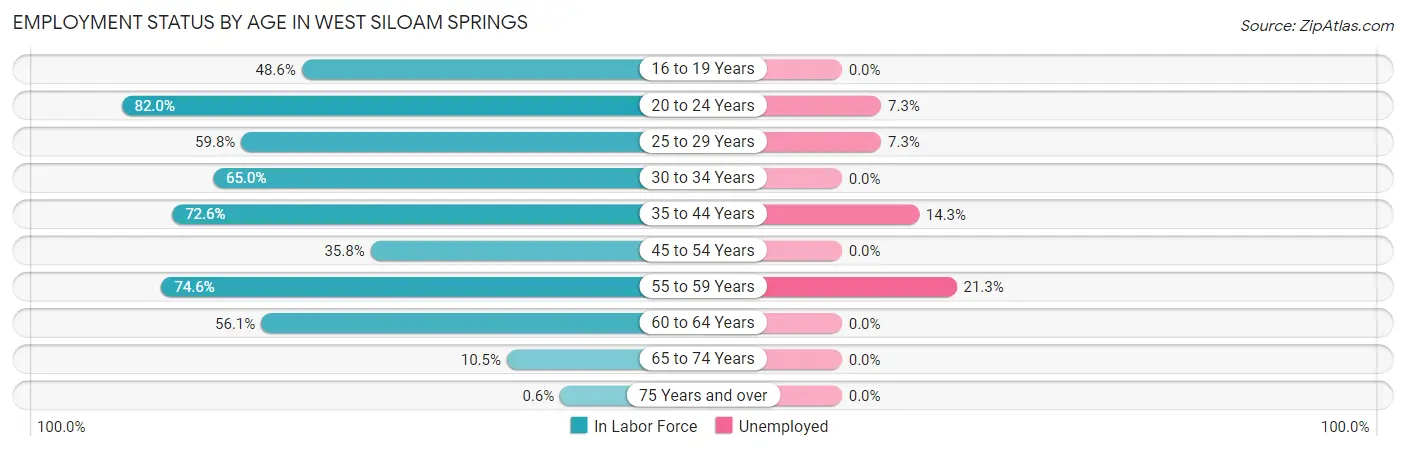
| Age Bracket | In Labor Force | Unemployed |
| 16 to 19 Years | 17 (48.6%) | 0 (0.0%) |
| 20 to 24 Years | 82 (82.0%) | 6 (7.3%) |
| 25 to 29 Years | 55 (59.8%) | 4 (7.3%) |
| 30 to 34 Years | 67 (65.0%) | 0 (0.0%) |
| 35 to 44 Years | 98 (72.6%) | 14 (14.3%) |
| 45 to 54 Years | 58 (35.8%) | 0 (0.0%) |
| 55 to 59 Years | 47 (74.6%) | 10 (21.3%) |
| 60 to 64 Years | 69 (56.1%) | 0 (0.0%) |
| 65 to 74 Years | 13 (10.5%) | 0 (0.0%) |
| 75 Years and over | 1 (0.6%) | 0 (0.0%) |
| Total | 506 (45.3%) | 34 (6.7%) |
Employment Status by Educational Attainment in West Siloam Springs
According to labor force statistics for West Siloam Springs, 58.1% of individuals (394) out of the total population between 25 and 64 years of age (678) are in the labor force, with 7.1% or 28 of them being unemployed. The group with the highest labor force participation rate are those with the educational attainment of bachelor's degree or higher, with 91.8% or 67 individuals in the labor force. Within the labor force, individuals with high school diploma education have the highest percentage of unemployment, with 14.9% or 24 of them being unemployed.
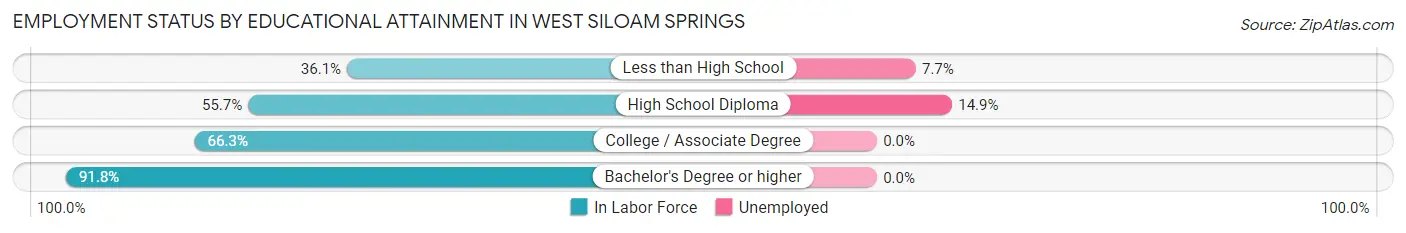
| Educational Attainment | In Labor Force | Unemployed |
| Less than High School | 52 (36.1%) | 11 (7.7%) |
| High School Diploma | 161 (55.7%) | 43 (14.9%) |
| College / Associate Degree | 114 (66.3%) | 0 (0.0%) |
| Bachelor's Degree or higher | 67 (91.8%) | 0 (0.0%) |
| Total | 394 (58.1%) | 48 (7.1%) |
Employment Occupations by Sex in West Siloam Springs
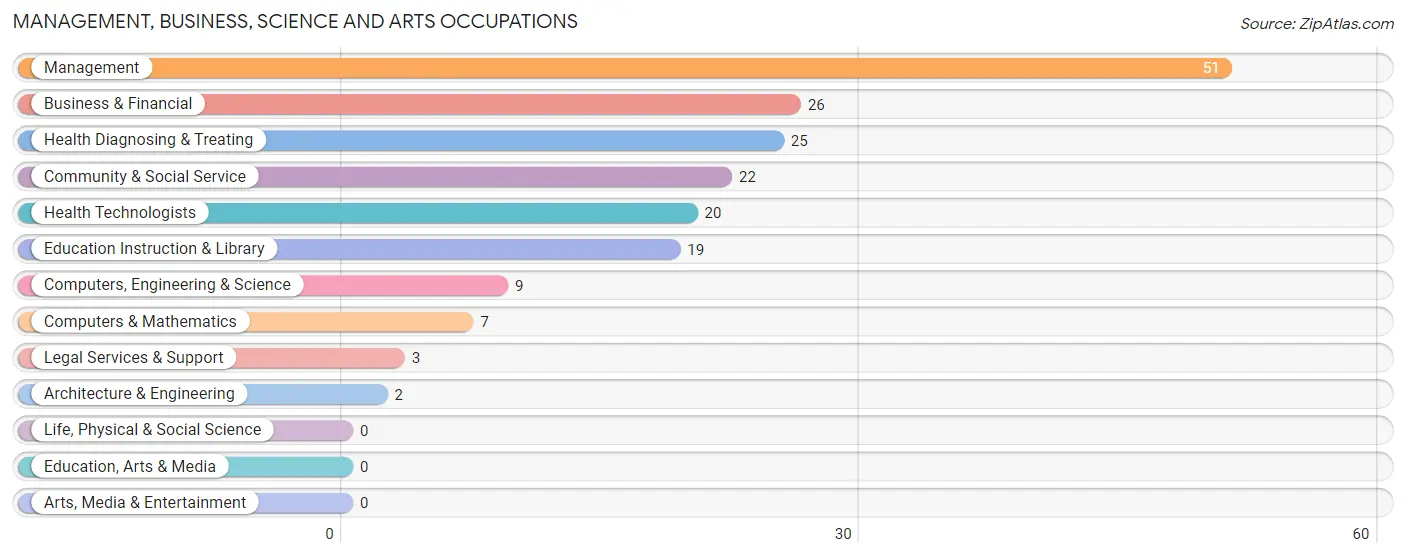
Management, Business, Science and Arts Occupations
The most common Management, Business, Science and Arts occupations in West Siloam Springs are Management (51 | 10.8%), Business & Financial (26 | 5.5%), Health Diagnosing & Treating (25 | 5.3%), Community & Social Service (22 | 4.6%), and Health Technologists (20 | 4.2%).
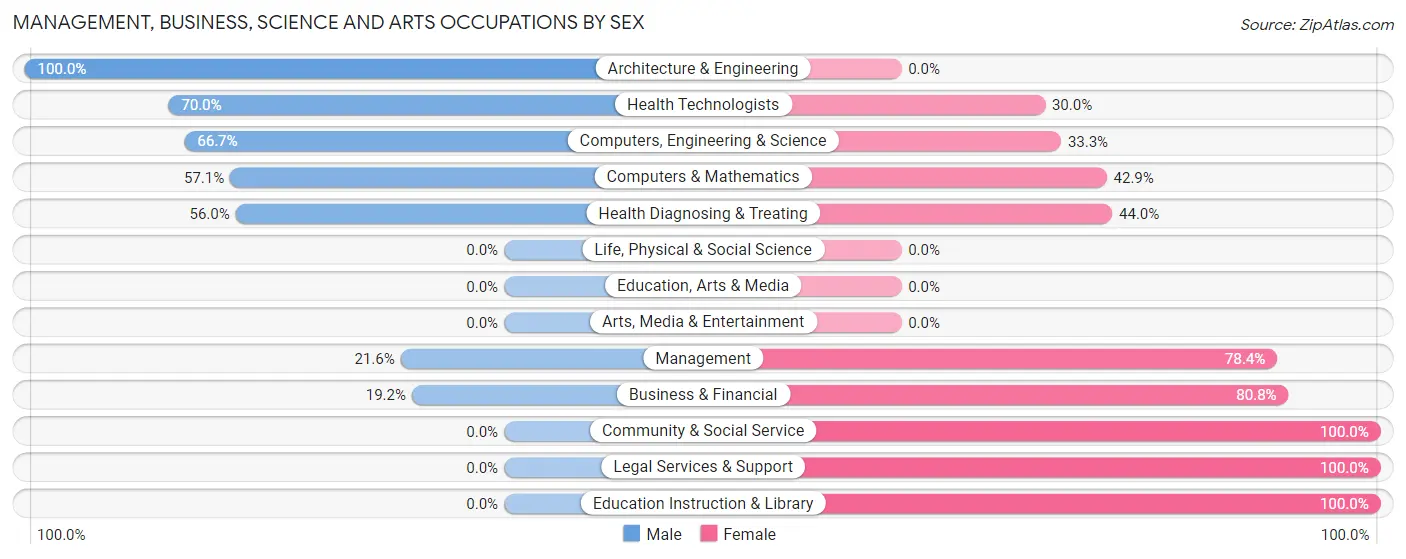
Management, Business, Science and Arts Occupations by Sex
Within the Management, Business, Science and Arts occupations in West Siloam Springs, the most male-oriented occupations are Architecture & Engineering (100.0%), Health Technologists (70.0%), and Computers, Engineering & Science (66.7%), while the most female-oriented occupations are Community & Social Service (100.0%), Legal Services & Support (100.0%), and Education Instruction & Library (100.0%).
| Occupation | Male | Female |
| Management | 11 (21.6%) | 40 (78.4%) |
| Business & Financial | 5 (19.2%) | 21 (80.8%) |
| Computers, Engineering & Science | 6 (66.7%) | 3 (33.3%) |
| Computers & Mathematics | 4 (57.1%) | 3 (42.9%) |
| Architecture & Engineering | 2 (100.0%) | 0 (0.0%) |
| Life, Physical & Social Science | 0 (0.0%) | 0 (0.0%) |
| Community & Social Service | 0 (0.0%) | 22 (100.0%) |
| Education, Arts & Media | 0 (0.0%) | 0 (0.0%) |
| Legal Services & Support | 0 (0.0%) | 3 (100.0%) |
| Education Instruction & Library | 0 (0.0%) | 19 (100.0%) |
| Arts, Media & Entertainment | 0 (0.0%) | 0 (0.0%) |
| Health Diagnosing & Treating | 14 (56.0%) | 11 (44.0%) |
| Health Technologists | 14 (70.0%) | 6 (30.0%) |
| Total (Category) | 36 (27.1%) | 97 (72.9%) |
| Total (Overall) | 209 (44.2%) | 264 (55.8%) |
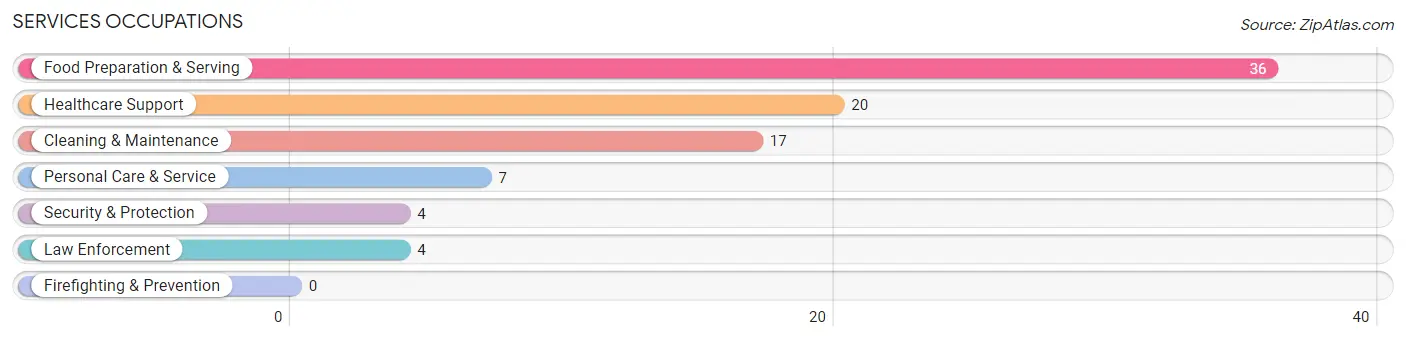
Services Occupations
The most common Services occupations in West Siloam Springs are Food Preparation & Serving (36 | 7.6%), Healthcare Support (20 | 4.2%), Cleaning & Maintenance (17 | 3.6%), Personal Care & Service (7 | 1.5%), and Security & Protection (4 | 0.9%).
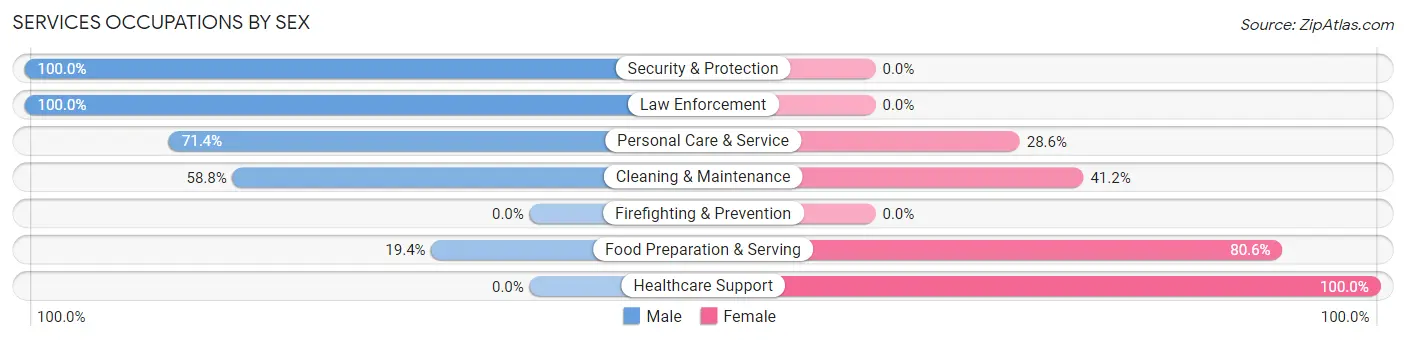
Services Occupations by Sex
Within the Services occupations in West Siloam Springs, the most male-oriented occupations are Security & Protection (100.0%), Law Enforcement (100.0%), and Personal Care & Service (71.4%), while the most female-oriented occupations are Healthcare Support (100.0%), Food Preparation & Serving (80.6%), and Cleaning & Maintenance (41.2%).
| Occupation | Male | Female |
| Healthcare Support | 0 (0.0%) | 20 (100.0%) |
| Security & Protection | 4 (100.0%) | 0 (0.0%) |
| Firefighting & Prevention | 0 (0.0%) | 0 (0.0%) |
| Law Enforcement | 4 (100.0%) | 0 (0.0%) |
| Food Preparation & Serving | 7 (19.4%) | 29 (80.6%) |
| Cleaning & Maintenance | 10 (58.8%) | 7 (41.2%) |
| Personal Care & Service | 5 (71.4%) | 2 (28.6%) |
| Total (Category) | 26 (30.9%) | 58 (69.1%) |
| Total (Overall) | 209 (44.2%) | 264 (55.8%) |
Sales and Office Occupations
The most common Sales and Office occupations in West Siloam Springs are Sales & Related (55 | 11.6%), and Office & Administration (50 | 10.6%).
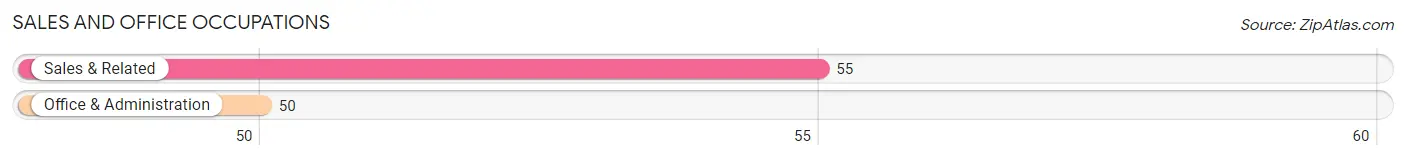
Sales and Office Occupations by Sex
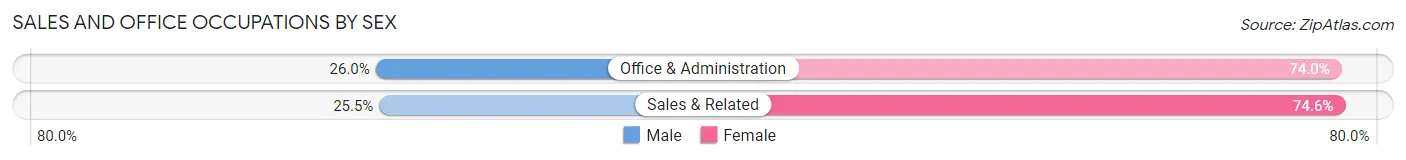
| Occupation | Male | Female |
| Sales & Related | 14 (25.5%) | 41 (74.6%) |
| Office & Administration | 13 (26.0%) | 37 (74.0%) |
| Total (Category) | 27 (25.7%) | 78 (74.3%) |
| Total (Overall) | 209 (44.2%) | 264 (55.8%) |
Natural Resources, Construction and Maintenance Occupations
The most common Natural Resources, Construction and Maintenance occupations in West Siloam Springs are Construction & Extraction (32 | 6.8%), Installation, Maintenance & Repair (16 | 3.4%), and Farming, Fishing & Forestry (3 | 0.6%).
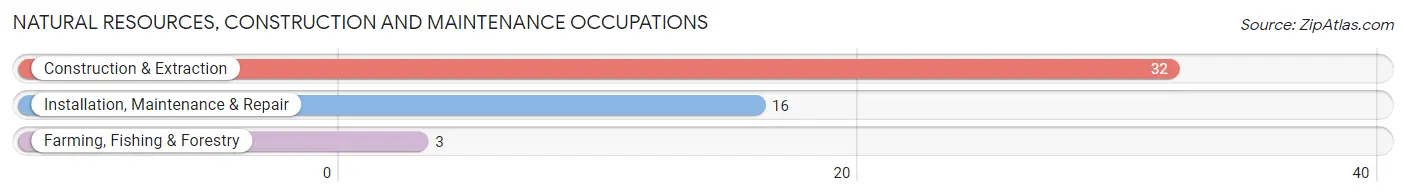
Natural Resources, Construction and Maintenance Occupations by Sex
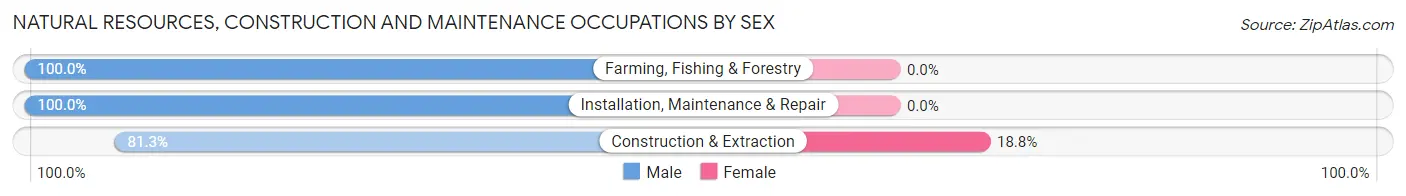
| Occupation | Male | Female |
| Farming, Fishing & Forestry | 3 (100.0%) | 0 (0.0%) |
| Construction & Extraction | 26 (81.2%) | 6 (18.8%) |
| Installation, Maintenance & Repair | 16 (100.0%) | 0 (0.0%) |
| Total (Category) | 45 (88.2%) | 6 (11.8%) |
| Total (Overall) | 209 (44.2%) | 264 (55.8%) |
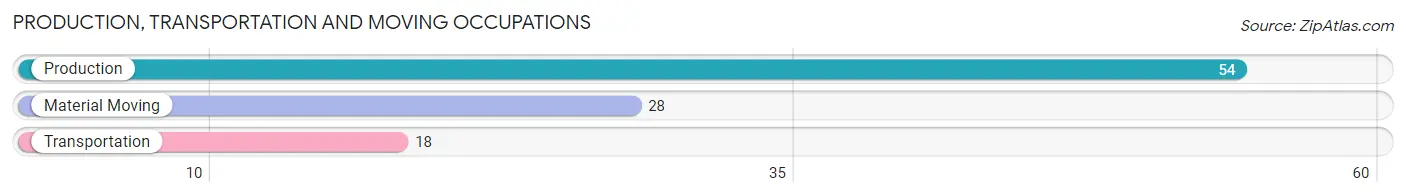
Production, Transportation and Moving Occupations
The most common Production, Transportation and Moving occupations in West Siloam Springs are Production (54 | 11.4%), Material Moving (28 | 5.9%), and Transportation (18 | 3.8%).
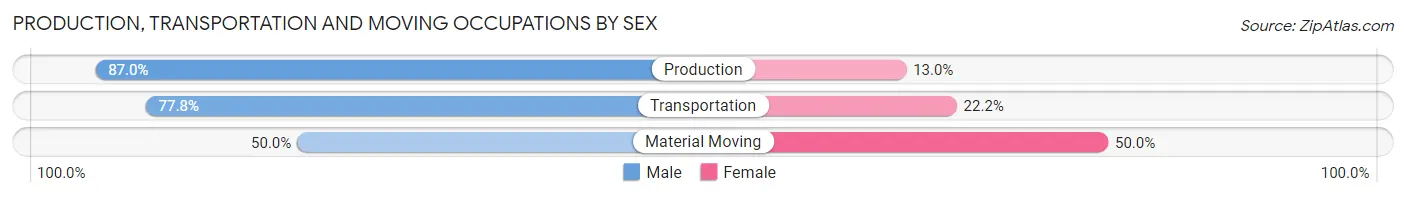
Production, Transportation and Moving Occupations by Sex
| Occupation | Male | Female |
| Production | 47 (87.0%) | 7 (13.0%) |
| Transportation | 14 (77.8%) | 4 (22.2%) |
| Material Moving | 14 (50.0%) | 14 (50.0%) |
| Total (Category) | 75 (75.0%) | 25 (25.0%) |
| Total (Overall) | 209 (44.2%) | 264 (55.8%) |
Employment Industries by Sex in West Siloam Springs
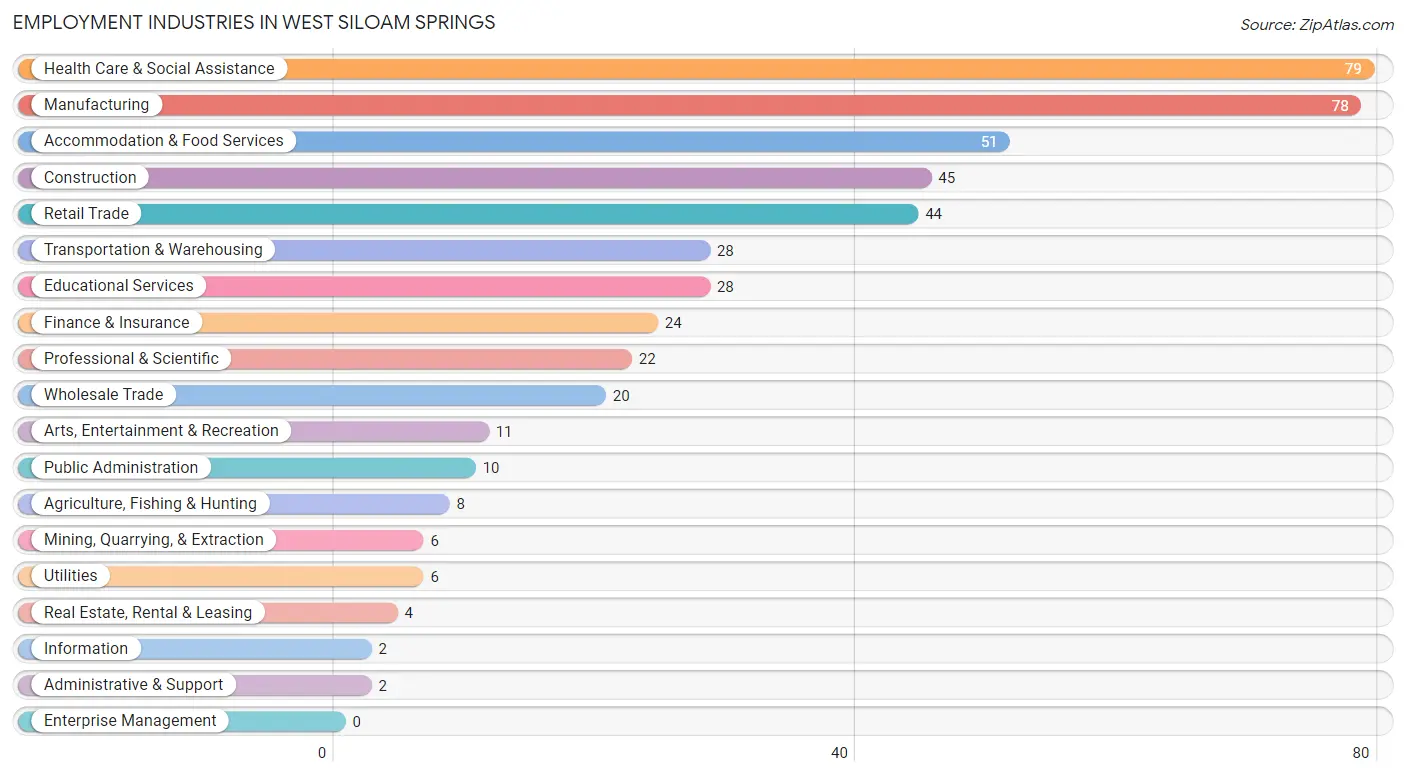
Employment Industries in West Siloam Springs
The major employment industries in West Siloam Springs include Health Care & Social Assistance (79 | 16.7%), Manufacturing (78 | 16.5%), Accommodation & Food Services (51 | 10.8%), Construction (45 | 9.5%), and Retail Trade (44 | 9.3%).
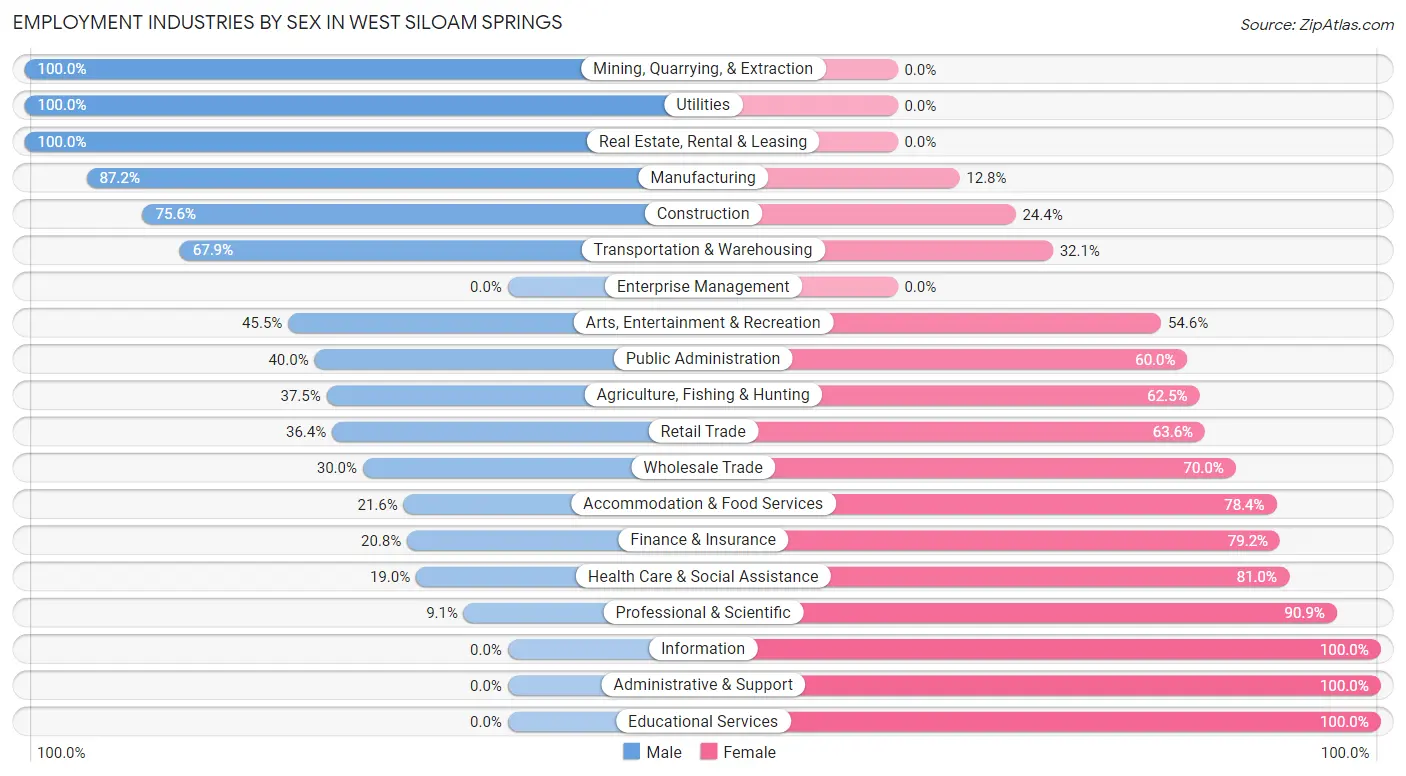
Employment Industries by Sex in West Siloam Springs
The West Siloam Springs industries that see more men than women are Mining, Quarrying, & Extraction (100.0%), Utilities (100.0%), and Real Estate, Rental & Leasing (100.0%), whereas the industries that tend to have a higher number of women are Information (100.0%), Administrative & Support (100.0%), and Educational Services (100.0%).
| Industry | Male | Female |
| Agriculture, Fishing & Hunting | 3 (37.5%) | 5 (62.5%) |
| Mining, Quarrying, & Extraction | 6 (100.0%) | 0 (0.0%) |
| Construction | 34 (75.6%) | 11 (24.4%) |
| Manufacturing | 68 (87.2%) | 10 (12.8%) |
| Wholesale Trade | 6 (30.0%) | 14 (70.0%) |
| Retail Trade | 16 (36.4%) | 28 (63.6%) |
| Transportation & Warehousing | 19 (67.9%) | 9 (32.1%) |
| Utilities | 6 (100.0%) | 0 (0.0%) |
| Information | 0 (0.0%) | 2 (100.0%) |
| Finance & Insurance | 5 (20.8%) | 19 (79.2%) |
| Real Estate, Rental & Leasing | 4 (100.0%) | 0 (0.0%) |
| Professional & Scientific | 2 (9.1%) | 20 (90.9%) |
| Enterprise Management | 0 (0.0%) | 0 (0.0%) |
| Administrative & Support | 0 (0.0%) | 2 (100.0%) |
| Educational Services | 0 (0.0%) | 28 (100.0%) |
| Health Care & Social Assistance | 15 (19.0%) | 64 (81.0%) |
| Arts, Entertainment & Recreation | 5 (45.5%) | 6 (54.5%) |
| Accommodation & Food Services | 11 (21.6%) | 40 (78.4%) |
| Public Administration | 4 (40.0%) | 6 (60.0%) |
| Total | 209 (44.2%) | 264 (55.8%) |
Education in West Siloam Springs
School Enrollment in West Siloam Springs
The most common levels of schooling among the 213 students in West Siloam Springs are elementary school (69 | 32.4%), kindergarten (45 | 21.1%), and high school (44 | 20.7%).
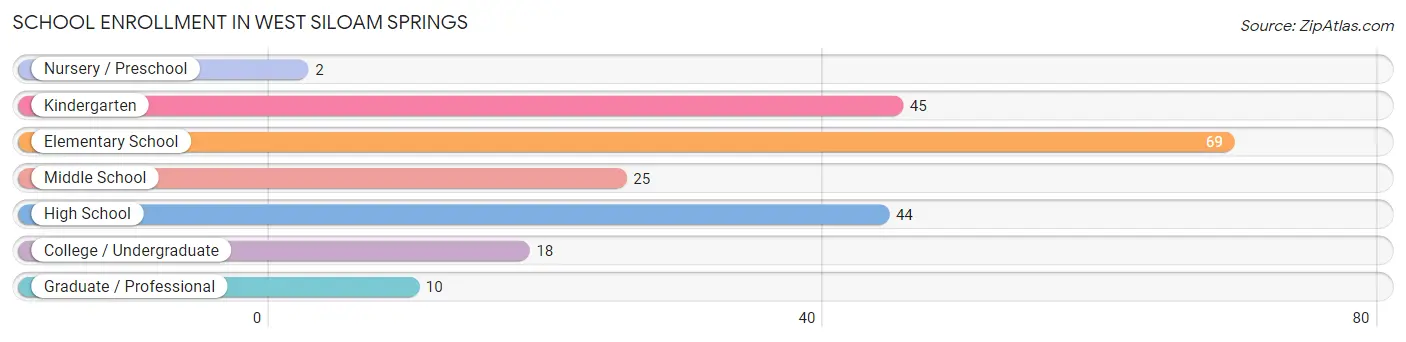
| School Level | # Students | % Students |
| Nursery / Preschool | 2 | 0.9% |
| Kindergarten | 45 | 21.1% |
| Elementary School | 69 | 32.4% |
| Middle School | 25 | 11.7% |
| High School | 44 | 20.7% |
| College / Undergraduate | 18 | 8.5% |
| Graduate / Professional | 10 | 4.7% |
| Total | 213 | 100.0% |
School Enrollment by Age by Funding Source in West Siloam Springs
Out of a total of 213 students who are enrolled in schools in West Siloam Springs, 24 (11.3%) attend a private institution, while the remaining 189 (88.7%) are enrolled in public schools. The age group of 35 years and over has the highest likelihood of being enrolled in private schools, with 5 (100.0% in the age bracket) enrolled. Conversely, the age group of 3 to 4 year olds has the lowest likelihood of being enrolled in a private school, with 2 (100.0% in the age bracket) attending a public institution.
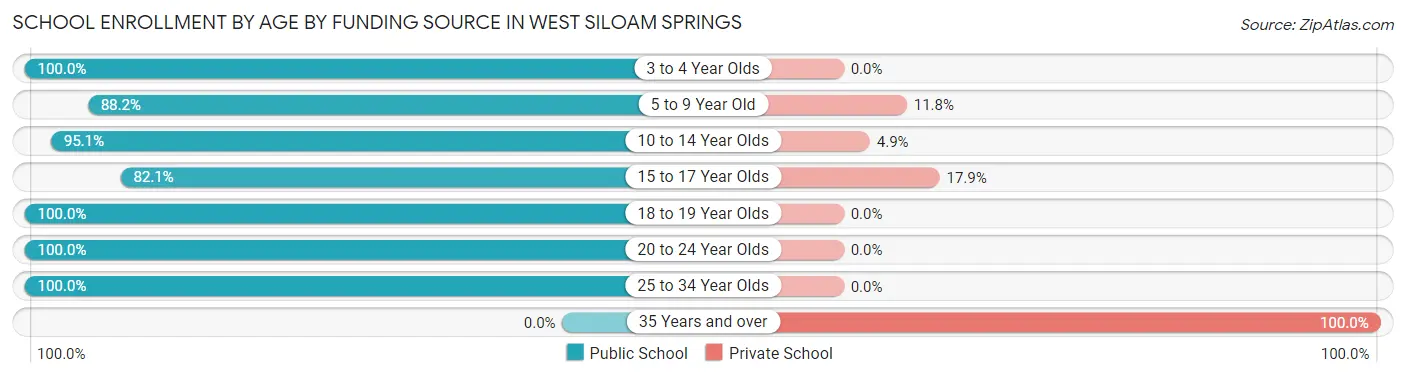
| Age Bracket | Public School | Private School |
| 3 to 4 Year Olds | 2 (100.0%) | 0 (0.0%) |
| 5 to 9 Year Old | 90 (88.2%) | 12 (11.8%) |
| 10 to 14 Year Olds | 39 (95.1%) | 2 (4.9%) |
| 15 to 17 Year Olds | 23 (82.1%) | 5 (17.9%) |
| 18 to 19 Year Olds | 4 (100.0%) | 0 (0.0%) |
| 20 to 24 Year Olds | 26 (100.0%) | 0 (0.0%) |
| 25 to 34 Year Olds | 5 (100.0%) | 0 (0.0%) |
| 35 Years and over | 0 (0.0%) | 5 (100.0%) |
| Total | 189 (88.7%) | 24 (11.3%) |
Educational Attainment by Field of Study in West Siloam Springs
Business (28 | 24.8%), education (20 | 17.7%), arts & humanities (14 | 12.4%), bio, nature & agricultural (13 | 11.5%), and engineering (9 | 8.0%) are the most common fields of study among 113 individuals in West Siloam Springs who have obtained a bachelor's degree or higher.
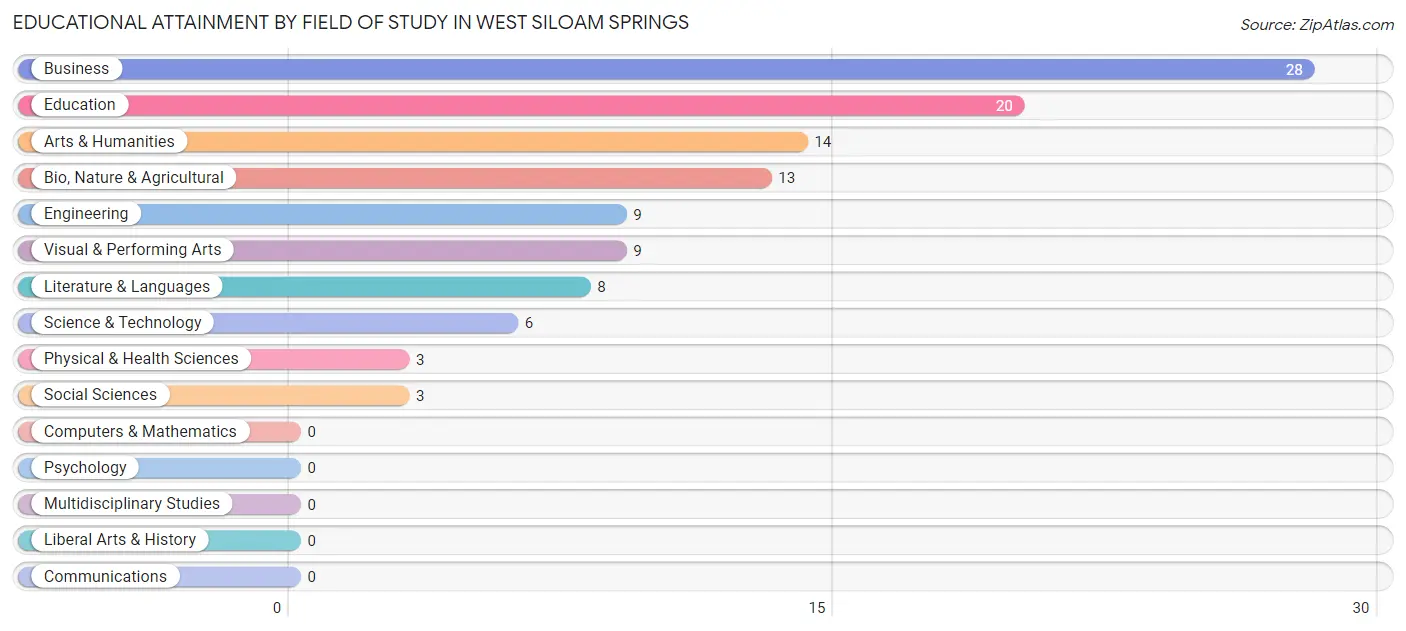
| Field of Study | # Graduates | % Graduates |
| Computers & Mathematics | 0 | 0.0% |
| Bio, Nature & Agricultural | 13 | 11.5% |
| Physical & Health Sciences | 3 | 2.6% |
| Psychology | 0 | 0.0% |
| Social Sciences | 3 | 2.6% |
| Engineering | 9 | 8.0% |
| Multidisciplinary Studies | 0 | 0.0% |
| Science & Technology | 6 | 5.3% |
| Business | 28 | 24.8% |
| Education | 20 | 17.7% |
| Literature & Languages | 8 | 7.1% |
| Liberal Arts & History | 0 | 0.0% |
| Visual & Performing Arts | 9 | 8.0% |
| Communications | 0 | 0.0% |
| Arts & Humanities | 14 | 12.4% |
| Total | 113 | 100.0% |
Transportation & Commute in West Siloam Springs
Vehicle Availability by Sex in West Siloam Springs
The most prevalent vehicle ownership categories in West Siloam Springs are males with 2 vehicles (61, accounting for 30.2%) and females with 2 vehicles (81, making up 23.1%).
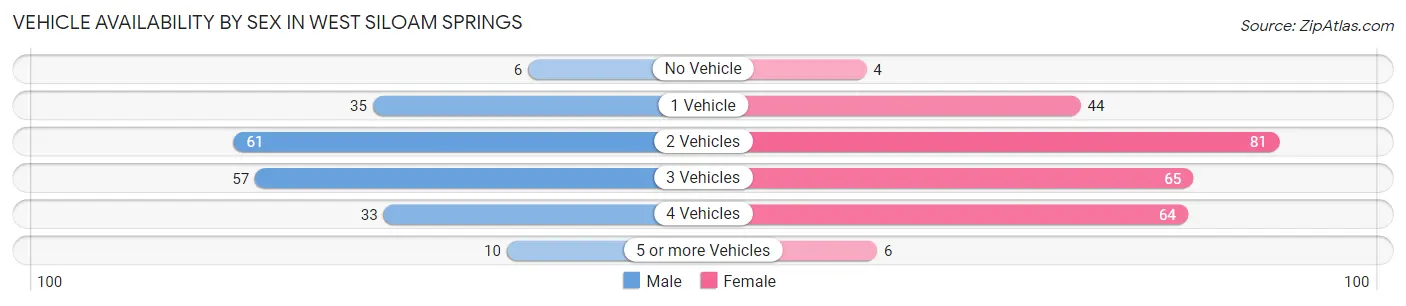
| Vehicles Available | Male | Female |
| No Vehicle | 6 (3.0%) | 4 (1.5%) |
| 1 Vehicle | 35 (17.3%) | 44 (16.7%) |
| 2 Vehicles | 61 (30.2%) | 81 (30.7%) |
| 3 Vehicles | 57 (28.2%) | 65 (24.6%) |
| 4 Vehicles | 33 (16.3%) | 64 (24.2%) |
| 5 or more Vehicles | 10 (5.0%) | 6 (2.3%) |
| Total | 202 (100.0%) | 264 (100.0%) |
Commute Time in West Siloam Springs
The most frequently occuring commute durations in West Siloam Springs are 45 to 59 minutes (77 commuters, 17.7%), 15 to 19 minutes (71 commuters, 16.3%), and 10 to 14 minutes (63 commuters, 14.5%).
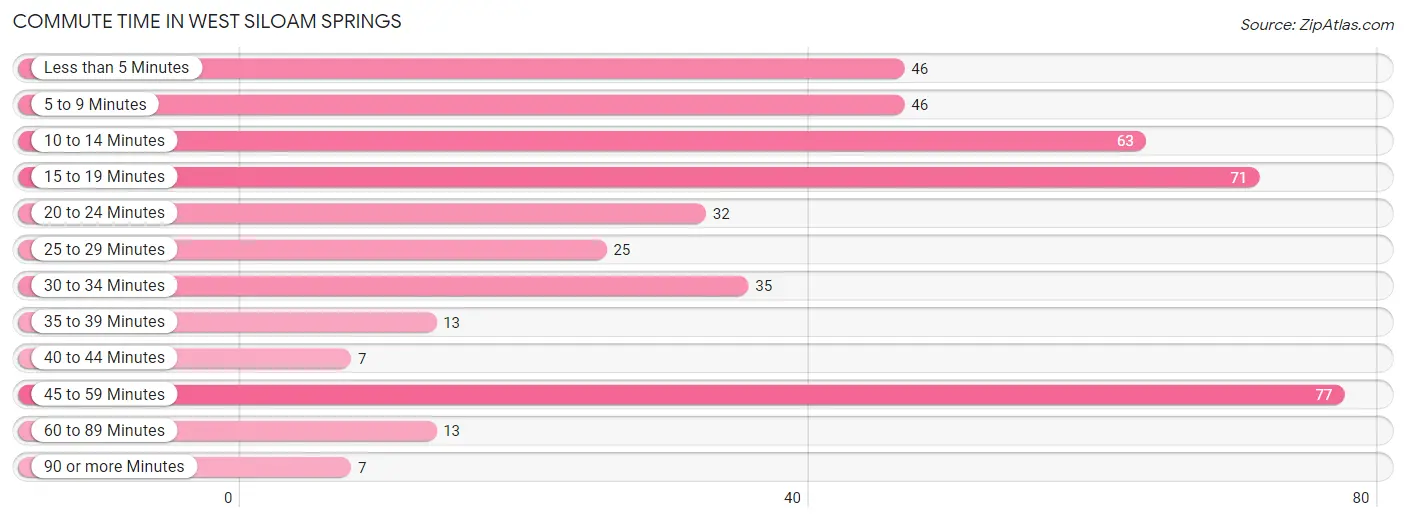
| Commute Time | # Commuters | % Commuters |
| Less than 5 Minutes | 46 | 10.6% |
| 5 to 9 Minutes | 46 | 10.6% |
| 10 to 14 Minutes | 63 | 14.5% |
| 15 to 19 Minutes | 71 | 16.3% |
| 20 to 24 Minutes | 32 | 7.4% |
| 25 to 29 Minutes | 25 | 5.8% |
| 30 to 34 Minutes | 35 | 8.1% |
| 35 to 39 Minutes | 13 | 3.0% |
| 40 to 44 Minutes | 7 | 1.6% |
| 45 to 59 Minutes | 77 | 17.7% |
| 60 to 89 Minutes | 13 | 3.0% |
| 90 or more Minutes | 7 | 1.6% |
Commute Time by Sex in West Siloam Springs
The most common commute times in West Siloam Springs are 10 to 14 minutes (30 commuters, 16.1%) for males and 45 to 59 minutes (56 commuters, 22.5%) for females.
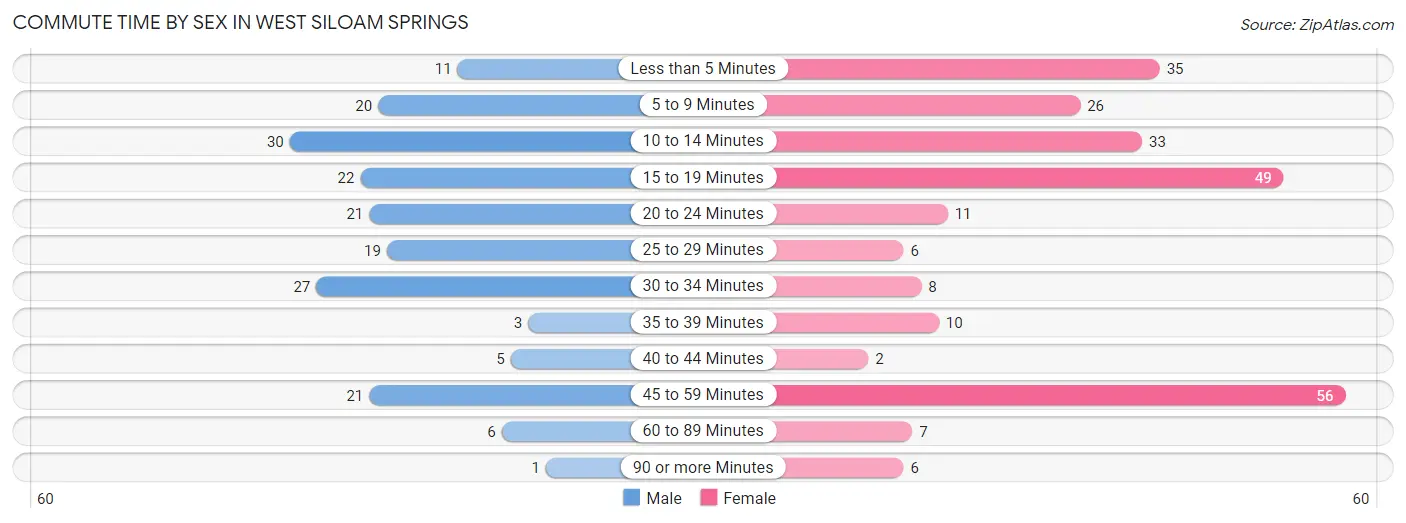
| Commute Time | Male | Female |
| Less than 5 Minutes | 11 (5.9%) | 35 (14.1%) |
| 5 to 9 Minutes | 20 (10.7%) | 26 (10.4%) |
| 10 to 14 Minutes | 30 (16.1%) | 33 (13.3%) |
| 15 to 19 Minutes | 22 (11.8%) | 49 (19.7%) |
| 20 to 24 Minutes | 21 (11.3%) | 11 (4.4%) |
| 25 to 29 Minutes | 19 (10.2%) | 6 (2.4%) |
| 30 to 34 Minutes | 27 (14.5%) | 8 (3.2%) |
| 35 to 39 Minutes | 3 (1.6%) | 10 (4.0%) |
| 40 to 44 Minutes | 5 (2.7%) | 2 (0.8%) |
| 45 to 59 Minutes | 21 (11.3%) | 56 (22.5%) |
| 60 to 89 Minutes | 6 (3.2%) | 7 (2.8%) |
| 90 or more Minutes | 1 (0.5%) | 6 (2.4%) |
Time of Departure to Work by Sex in West Siloam Springs
The most frequent times of departure to work in West Siloam Springs are 5:30 AM to 5:59 AM (47, 25.3%) for males and 8:00 AM to 8:29 AM (53, 21.3%) for females.
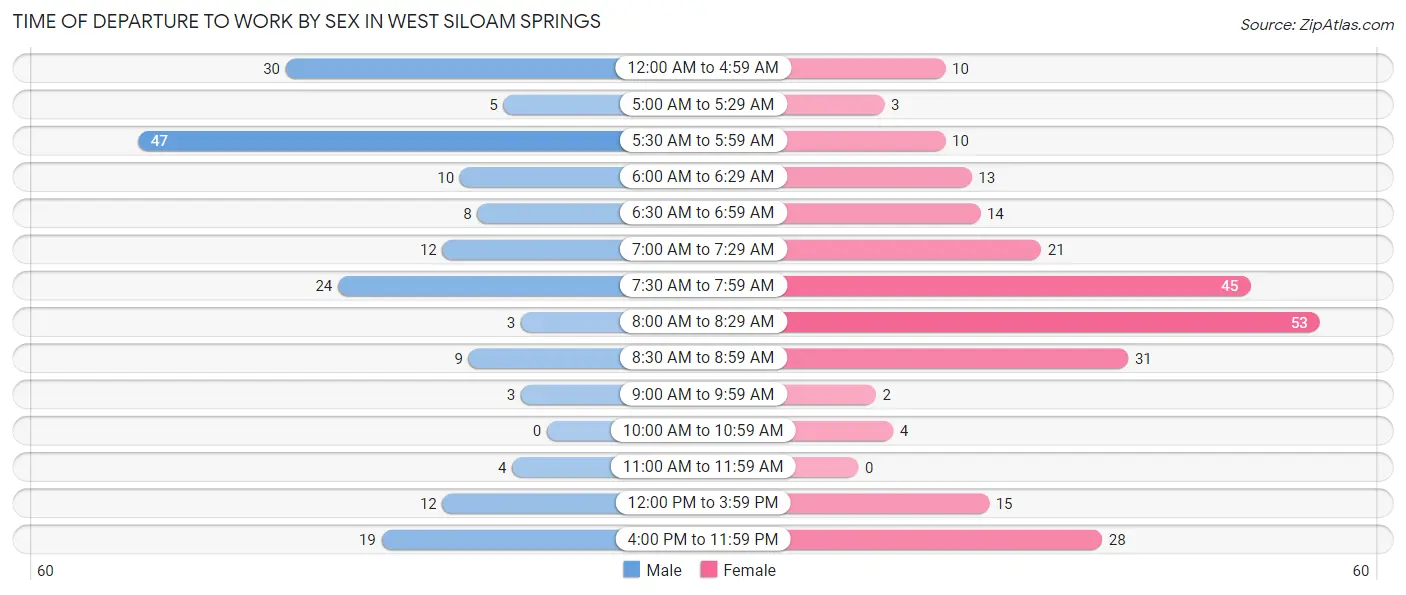
| Time of Departure | Male | Female |
| 12:00 AM to 4:59 AM | 30 (16.1%) | 10 (4.0%) |
| 5:00 AM to 5:29 AM | 5 (2.7%) | 3 (1.2%) |
| 5:30 AM to 5:59 AM | 47 (25.3%) | 10 (4.0%) |
| 6:00 AM to 6:29 AM | 10 (5.4%) | 13 (5.2%) |
| 6:30 AM to 6:59 AM | 8 (4.3%) | 14 (5.6%) |
| 7:00 AM to 7:29 AM | 12 (6.5%) | 21 (8.4%) |
| 7:30 AM to 7:59 AM | 24 (12.9%) | 45 (18.1%) |
| 8:00 AM to 8:29 AM | 3 (1.6%) | 53 (21.3%) |
| 8:30 AM to 8:59 AM | 9 (4.8%) | 31 (12.4%) |
| 9:00 AM to 9:59 AM | 3 (1.6%) | 2 (0.8%) |
| 10:00 AM to 10:59 AM | 0 (0.0%) | 4 (1.6%) |
| 11:00 AM to 11:59 AM | 4 (2.1%) | 0 (0.0%) |
| 12:00 PM to 3:59 PM | 12 (6.5%) | 15 (6.0%) |
| 4:00 PM to 11:59 PM | 19 (10.2%) | 28 (11.2%) |
| Total | 186 (100.0%) | 249 (100.0%) |
Housing Occupancy in West Siloam Springs
Occupancy by Ownership in West Siloam Springs
Of the total 444 dwellings in West Siloam Springs, owner-occupied units account for 331 (74.6%), while renter-occupied units make up 113 (25.5%).
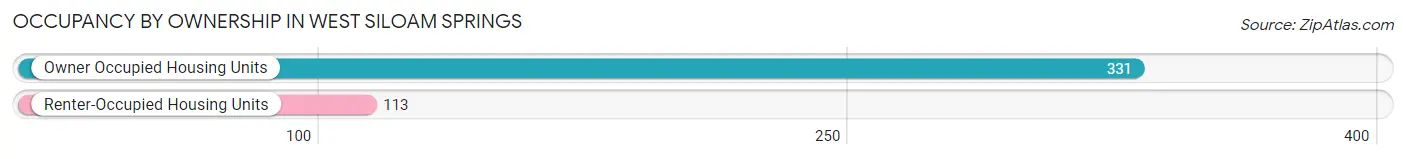
| Occupancy | # Housing Units | % Housing Units |
| Owner Occupied Housing Units | 331 | 74.6% |
| Renter-Occupied Housing Units | 113 | 25.5% |
| Total Occupied Housing Units | 444 | 100.0% |
Occupancy by Household Size in West Siloam Springs
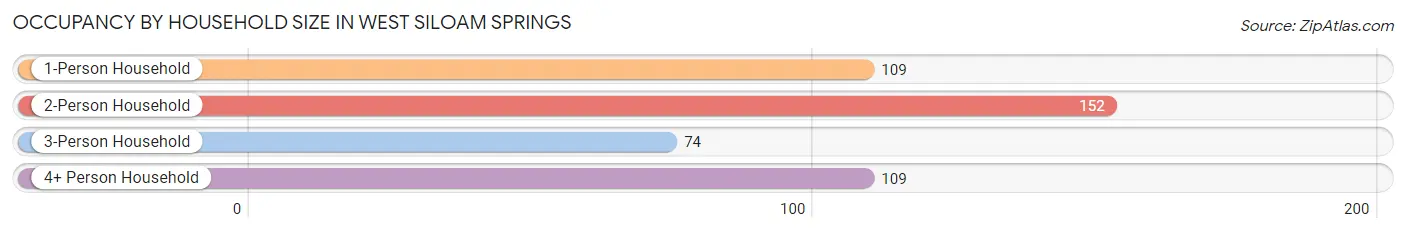
| Household Size | # Housing Units | % Housing Units |
| 1-Person Household | 109 | 24.5% |
| 2-Person Household | 152 | 34.2% |
| 3-Person Household | 74 | 16.7% |
| 4+ Person Household | 109 | 24.5% |
| Total Housing Units | 444 | 100.0% |
Occupancy by Ownership by Household Size in West Siloam Springs
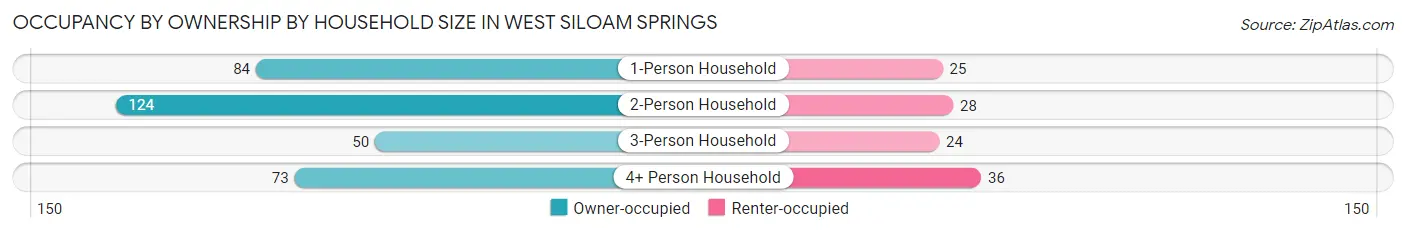
| Household Size | Owner-occupied | Renter-occupied |
| 1-Person Household | 84 (77.1%) | 25 (22.9%) |
| 2-Person Household | 124 (81.6%) | 28 (18.4%) |
| 3-Person Household | 50 (67.6%) | 24 (32.4%) |
| 4+ Person Household | 73 (67.0%) | 36 (33.0%) |
| Total Housing Units | 331 (74.6%) | 113 (25.5%) |
Occupancy by Educational Attainment in West Siloam Springs
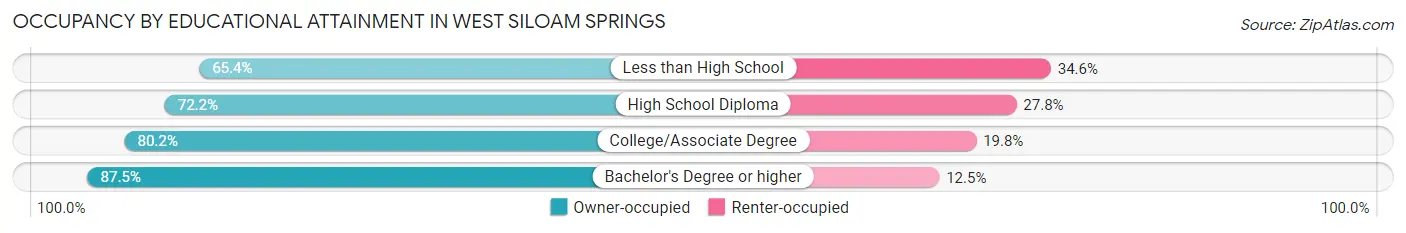
| Household Size | Owner-occupied | Renter-occupied |
| Less than High School | 51 (65.4%) | 27 (34.6%) |
| High School Diploma | 148 (72.2%) | 57 (27.8%) |
| College/Associate Degree | 97 (80.2%) | 24 (19.8%) |
| Bachelor's Degree or higher | 35 (87.5%) | 5 (12.5%) |
Occupancy by Age of Householder in West Siloam Springs
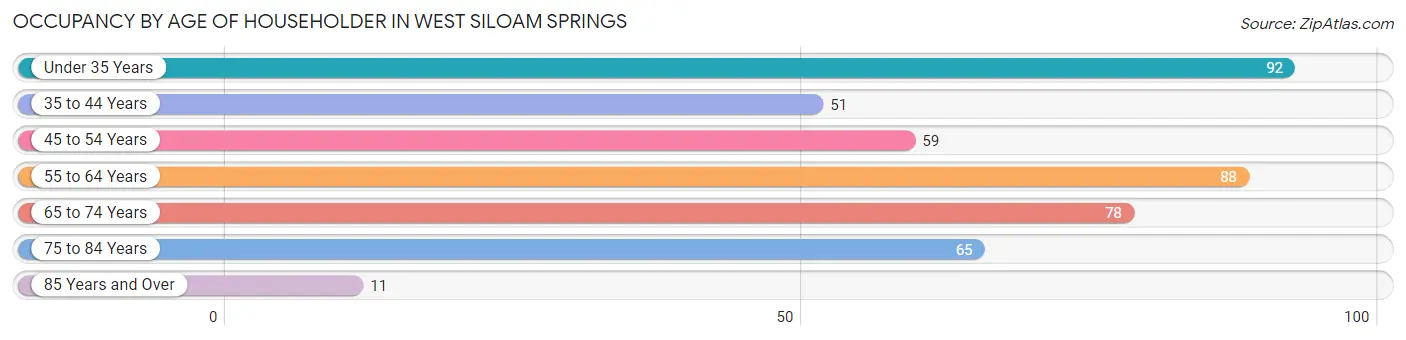
| Age Bracket | # Households | % Households |
| Under 35 Years | 92 | 20.7% |
| 35 to 44 Years | 51 | 11.5% |
| 45 to 54 Years | 59 | 13.3% |
| 55 to 64 Years | 88 | 19.8% |
| 65 to 74 Years | 78 | 17.6% |
| 75 to 84 Years | 65 | 14.6% |
| 85 Years and Over | 11 | 2.5% |
| Total | 444 | 100.0% |
Housing Finances in West Siloam Springs
Median Income by Occupancy in West Siloam Springs
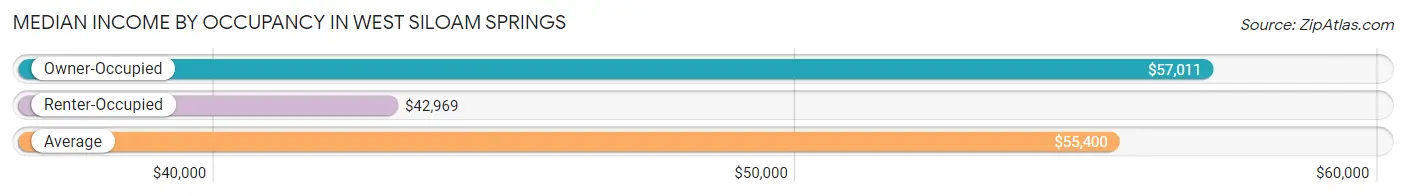
| Occupancy Type | # Households | Median Income |
| Owner-Occupied | 331 (74.6%) | $57,011 |
| Renter-Occupied | 113 (25.5%) | $42,969 |
| Average | 444 (100.0%) | $55,400 |
Occupancy by Householder Income Bracket in West Siloam Springs
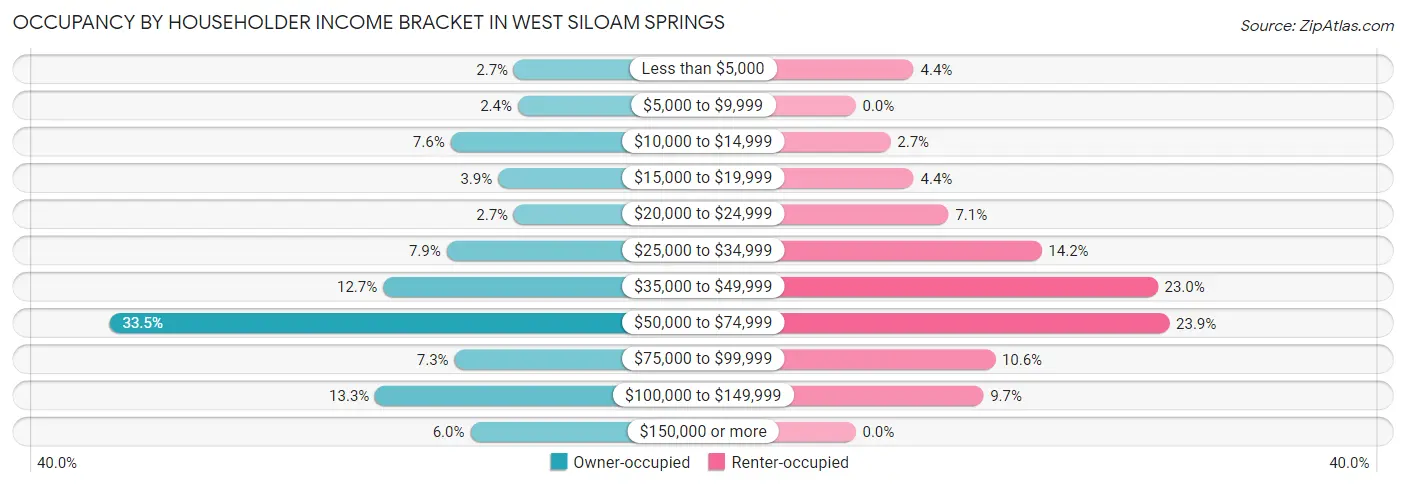
| Income Bracket | Owner-occupied | Renter-occupied |
| Less than $5,000 | 9 (2.7%) | 5 (4.4%) |
| $5,000 to $9,999 | 8 (2.4%) | 0 (0.0%) |
| $10,000 to $14,999 | 25 (7.5%) | 3 (2.6%) |
| $15,000 to $19,999 | 13 (3.9%) | 5 (4.4%) |
| $20,000 to $24,999 | 9 (2.7%) | 8 (7.1%) |
| $25,000 to $34,999 | 26 (7.9%) | 16 (14.2%) |
| $35,000 to $49,999 | 42 (12.7%) | 26 (23.0%) |
| $50,000 to $74,999 | 111 (33.5%) | 27 (23.9%) |
| $75,000 to $99,999 | 24 (7.2%) | 12 (10.6%) |
| $100,000 to $149,999 | 44 (13.3%) | 11 (9.7%) |
| $150,000 or more | 20 (6.0%) | 0 (0.0%) |
| Total | 331 (100.0%) | 113 (100.0%) |
Monthly Housing Cost Tiers in West Siloam Springs
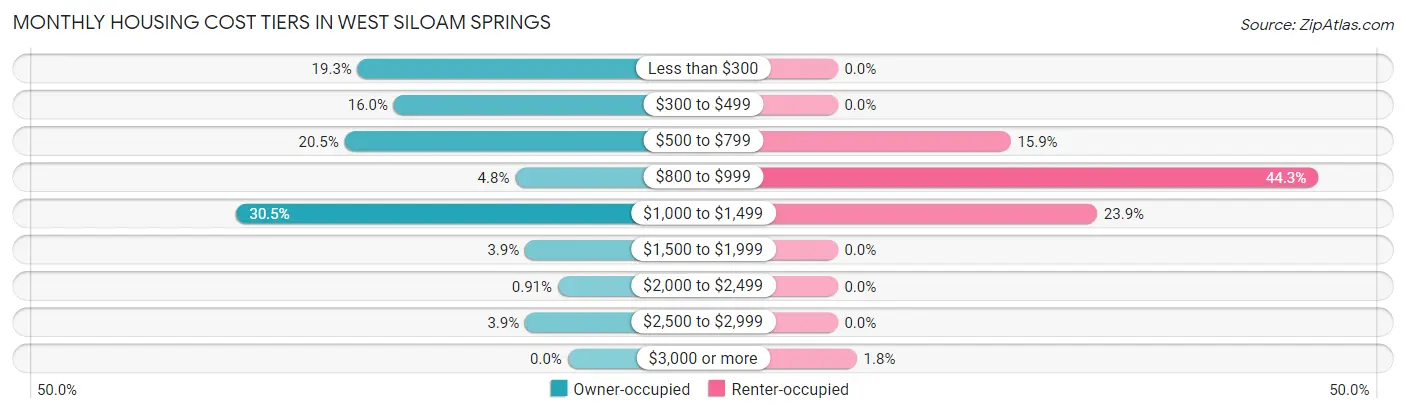
| Monthly Cost | Owner-occupied | Renter-occupied |
| Less than $300 | 64 (19.3%) | 0 (0.0%) |
| $300 to $499 | 53 (16.0%) | 0 (0.0%) |
| $500 to $799 | 68 (20.5%) | 18 (15.9%) |
| $800 to $999 | 16 (4.8%) | 50 (44.3%) |
| $1,000 to $1,499 | 101 (30.5%) | 27 (23.9%) |
| $1,500 to $1,999 | 13 (3.9%) | 0 (0.0%) |
| $2,000 to $2,499 | 3 (0.9%) | 0 (0.0%) |
| $2,500 to $2,999 | 13 (3.9%) | 0 (0.0%) |
| $3,000 or more | 0 (0.0%) | 2 (1.8%) |
| Total | 331 (100.0%) | 113 (100.0%) |
Physical Housing Characteristics in West Siloam Springs
Housing Structures in West Siloam Springs
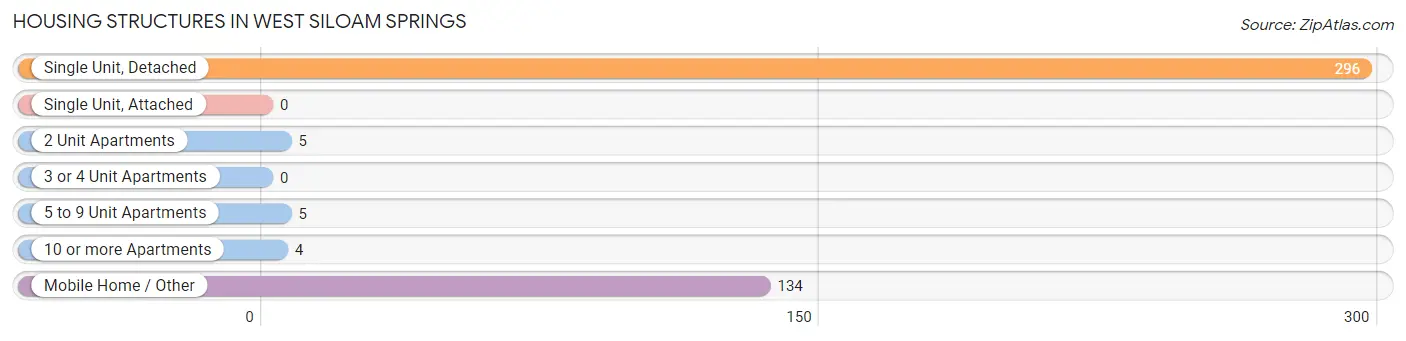
| Structure Type | # Housing Units | % Housing Units |
| Single Unit, Detached | 296 | 66.7% |
| Single Unit, Attached | 0 | 0.0% |
| 2 Unit Apartments | 5 | 1.1% |
| 3 or 4 Unit Apartments | 0 | 0.0% |
| 5 to 9 Unit Apartments | 5 | 1.1% |
| 10 or more Apartments | 4 | 0.9% |
| Mobile Home / Other | 134 | 30.2% |
| Total | 444 | 100.0% |
Housing Structures by Occupancy in West Siloam Springs
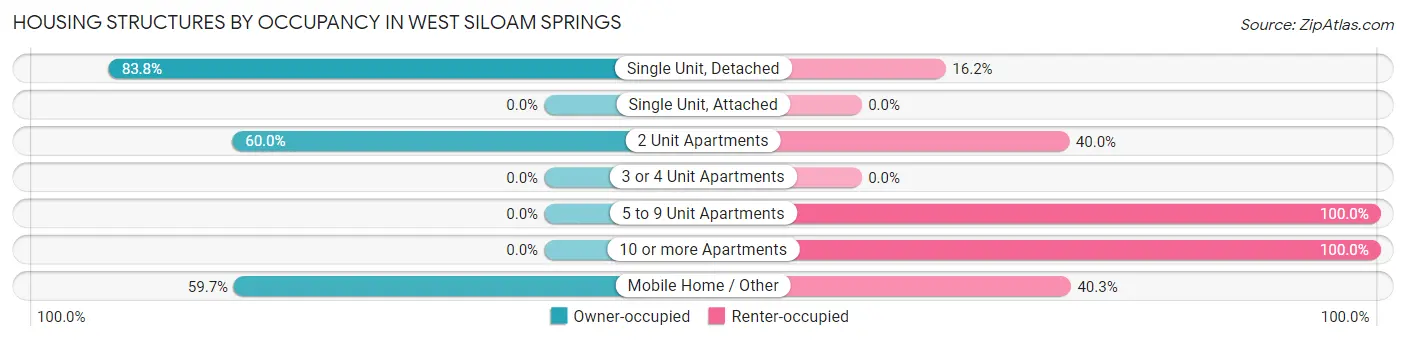
| Structure Type | Owner-occupied | Renter-occupied |
| Single Unit, Detached | 248 (83.8%) | 48 (16.2%) |
| Single Unit, Attached | 0 (0.0%) | 0 (0.0%) |
| 2 Unit Apartments | 3 (60.0%) | 2 (40.0%) |
| 3 or 4 Unit Apartments | 0 (0.0%) | 0 (0.0%) |
| 5 to 9 Unit Apartments | 0 (0.0%) | 5 (100.0%) |
| 10 or more Apartments | 0 (0.0%) | 4 (100.0%) |
| Mobile Home / Other | 80 (59.7%) | 54 (40.3%) |
| Total | 331 (74.6%) | 113 (25.5%) |
Housing Structures by Number of Rooms in West Siloam Springs
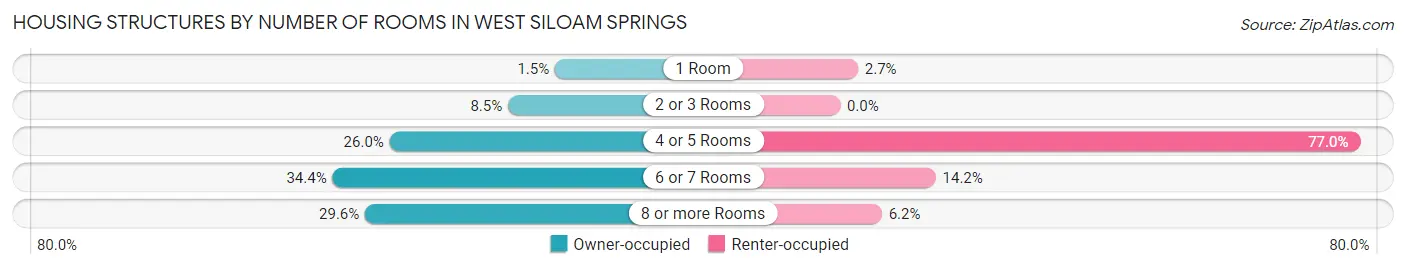
| Number of Rooms | Owner-occupied | Renter-occupied |
| 1 Room | 5 (1.5%) | 3 (2.6%) |
| 2 or 3 Rooms | 28 (8.5%) | 0 (0.0%) |
| 4 or 5 Rooms | 86 (26.0%) | 87 (77.0%) |
| 6 or 7 Rooms | 114 (34.4%) | 16 (14.2%) |
| 8 or more Rooms | 98 (29.6%) | 7 (6.2%) |
| Total | 331 (100.0%) | 113 (100.0%) |
Housing Structure by Heating Type in West Siloam Springs
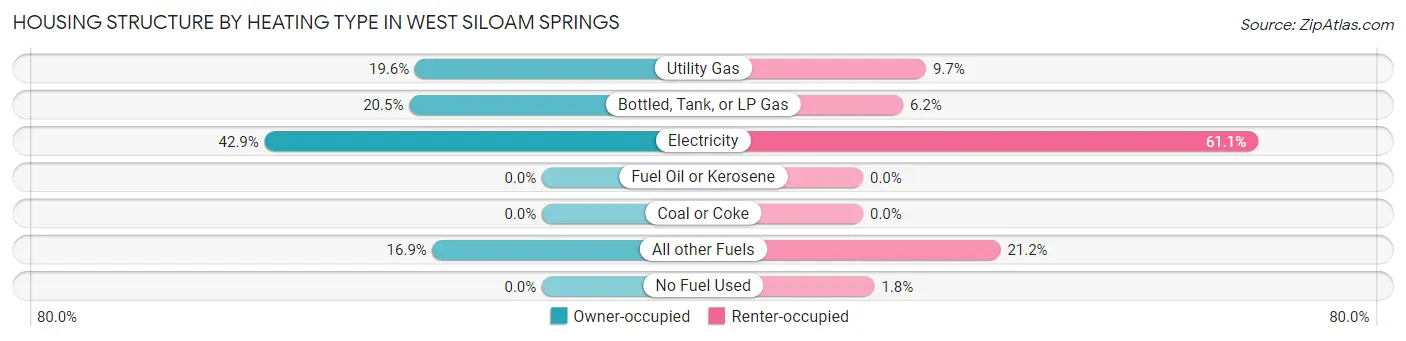
| Heating Type | Owner-occupied | Renter-occupied |
| Utility Gas | 65 (19.6%) | 11 (9.7%) |
| Bottled, Tank, or LP Gas | 68 (20.5%) | 7 (6.2%) |
| Electricity | 142 (42.9%) | 69 (61.1%) |
| Fuel Oil or Kerosene | 0 (0.0%) | 0 (0.0%) |
| Coal or Coke | 0 (0.0%) | 0 (0.0%) |
| All other Fuels | 56 (16.9%) | 24 (21.2%) |
| No Fuel Used | 0 (0.0%) | 2 (1.8%) |
| Total | 331 (100.0%) | 113 (100.0%) |
Household Vehicle Usage in West Siloam Springs
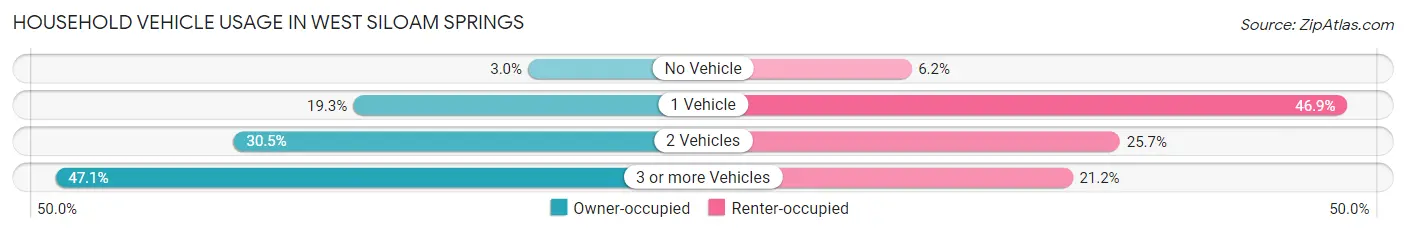
| Vehicles per Household | Owner-occupied | Renter-occupied |
| No Vehicle | 10 (3.0%) | 7 (6.2%) |
| 1 Vehicle | 64 (19.3%) | 53 (46.9%) |
| 2 Vehicles | 101 (30.5%) | 29 (25.7%) |
| 3 or more Vehicles | 156 (47.1%) | 24 (21.2%) |
| Total | 331 (100.0%) | 113 (100.0%) |
Real Estate & Mortgages in West Siloam Springs
Real Estate and Mortgage Overview in West Siloam Springs
| Characteristic | Without Mortgage | With Mortgage |
| Housing Units | 161 | 170 |
| Median Property Value | $96,500 | $184,500 |
| Median Household Income | $37,946 | $17 |
| Monthly Housing Costs | $341 | $0 |
| Real Estate Taxes | $485 | $31 |
Property Value by Mortgage Status in West Siloam Springs
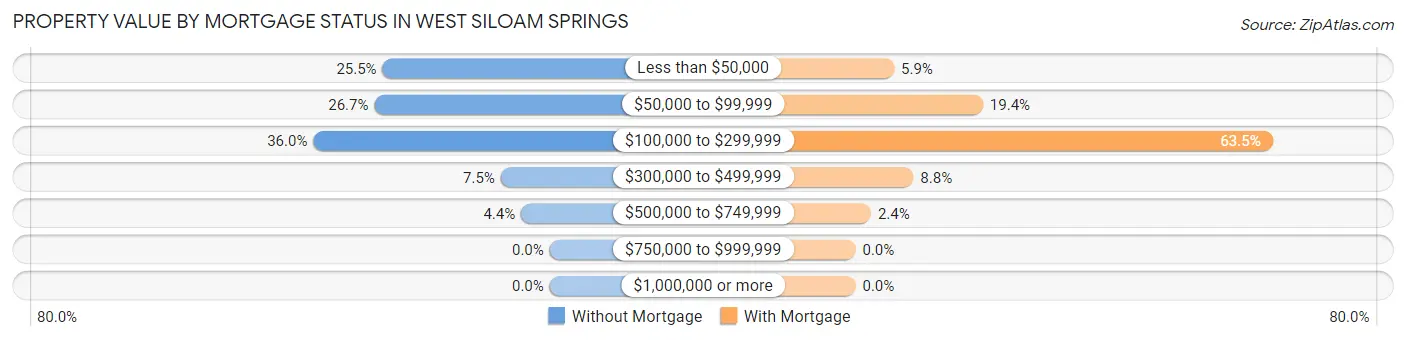
| Property Value | Without Mortgage | With Mortgage |
| Less than $50,000 | 41 (25.5%) | 10 (5.9%) |
| $50,000 to $99,999 | 43 (26.7%) | 33 (19.4%) |
| $100,000 to $299,999 | 58 (36.0%) | 108 (63.5%) |
| $300,000 to $499,999 | 12 (7.4%) | 15 (8.8%) |
| $500,000 to $749,999 | 7 (4.3%) | 4 (2.4%) |
| $750,000 to $999,999 | 0 (0.0%) | 0 (0.0%) |
| $1,000,000 or more | 0 (0.0%) | 0 (0.0%) |
| Total | 161 (100.0%) | 170 (100.0%) |
Household Income by Mortgage Status in West Siloam Springs
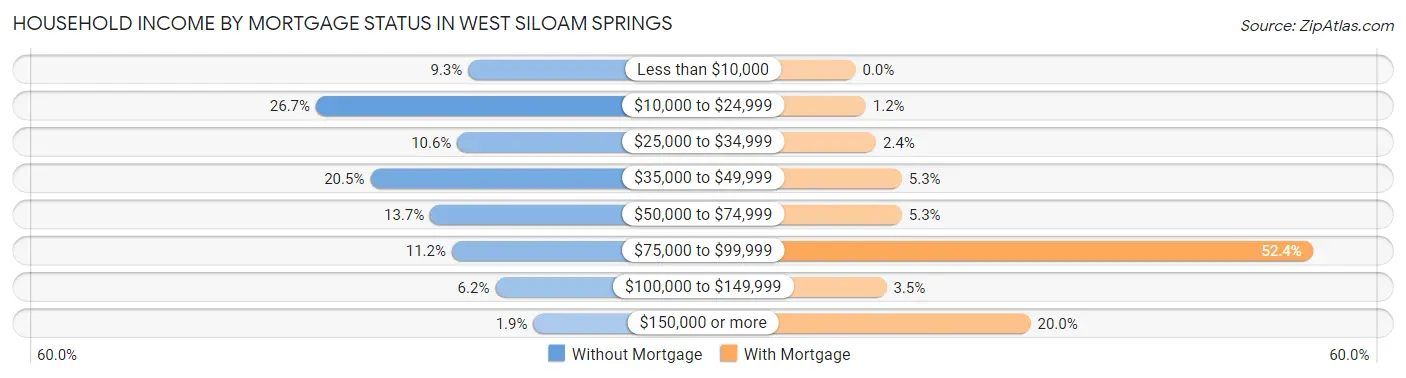
| Household Income | Without Mortgage | With Mortgage |
| Less than $10,000 | 15 (9.3%) | 0 (0.0%) |
| $10,000 to $24,999 | 43 (26.7%) | 2 (1.2%) |
| $25,000 to $34,999 | 17 (10.6%) | 4 (2.4%) |
| $35,000 to $49,999 | 33 (20.5%) | 9 (5.3%) |
| $50,000 to $74,999 | 22 (13.7%) | 9 (5.3%) |
| $75,000 to $99,999 | 18 (11.2%) | 89 (52.3%) |
| $100,000 to $149,999 | 10 (6.2%) | 6 (3.5%) |
| $150,000 or more | 3 (1.9%) | 34 (20.0%) |
| Total | 161 (100.0%) | 170 (100.0%) |
Property Value to Household Income Ratio in West Siloam Springs
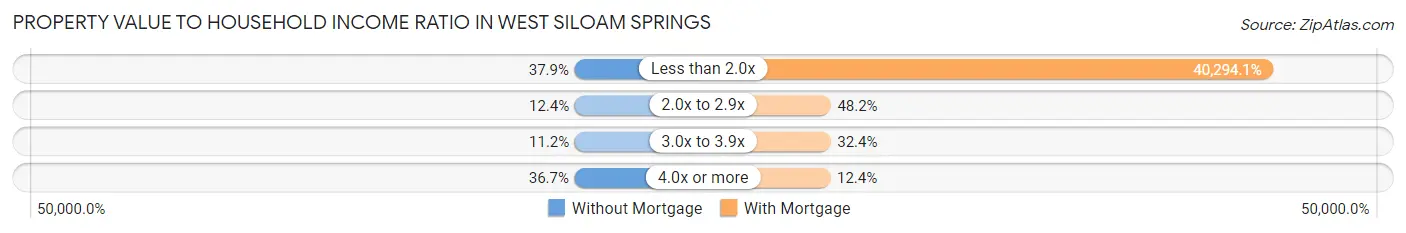
| Value-to-Income Ratio | Without Mortgage | With Mortgage |
| Less than 2.0x | 61 (37.9%) | 68,500 (40,294.1%) |
| 2.0x to 2.9x | 20 (12.4%) | 82 (48.2%) |
| 3.0x to 3.9x | 18 (11.2%) | 55 (32.4%) |
| 4.0x or more | 59 (36.6%) | 21 (12.3%) |
| Total | 161 (100.0%) | 170 (100.0%) |
Real Estate Taxes by Mortgage Status in West Siloam Springs
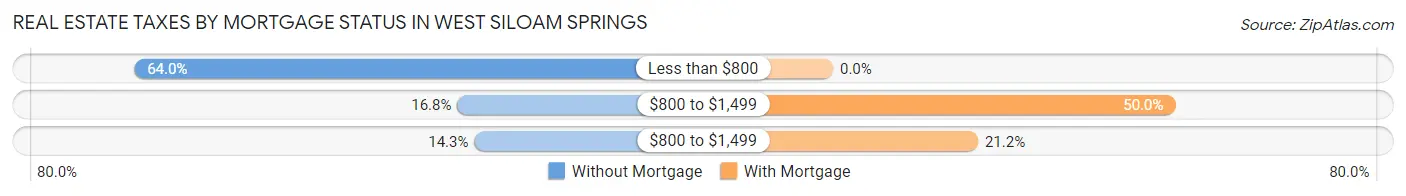
| Property Taxes | Without Mortgage | With Mortgage |
| Less than $800 | 103 (64.0%) | 0 (0.0%) |
| $800 to $1,499 | 27 (16.8%) | 85 (50.0%) |
| $800 to $1,499 | 23 (14.3%) | 36 (21.2%) |
| Total | 161 (100.0%) | 170 (100.0%) |
Health & Disability in West Siloam Springs
Health Insurance Coverage by Age in West Siloam Springs
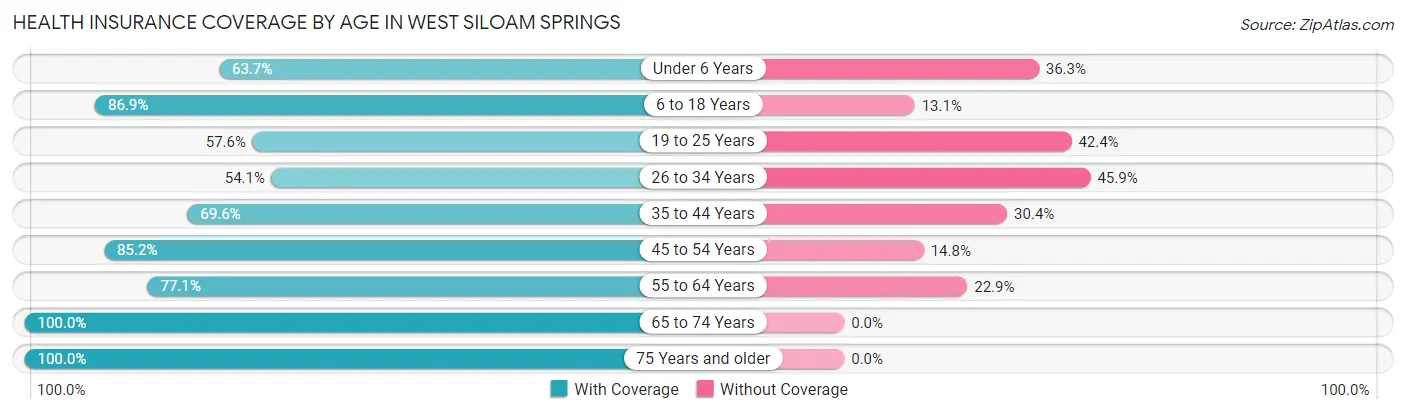
| Age Bracket | With Coverage | Without Coverage |
| Under 6 Years | 65 (63.7%) | 37 (36.3%) |
| 6 to 18 Years | 152 (86.9%) | 23 (13.1%) |
| 19 to 25 Years | 83 (57.6%) | 61 (42.4%) |
| 26 to 34 Years | 86 (54.1%) | 73 (45.9%) |
| 35 to 44 Years | 94 (69.6%) | 41 (30.4%) |
| 45 to 54 Years | 138 (85.2%) | 24 (14.8%) |
| 55 to 64 Years | 131 (77.1%) | 39 (22.9%) |
| 65 to 74 Years | 105 (100.0%) | 0 (0.0%) |
| 75 Years and older | 118 (100.0%) | 0 (0.0%) |
| Total | 972 (76.5%) | 298 (23.5%) |
Health Insurance Coverage by Citizenship Status in West Siloam Springs
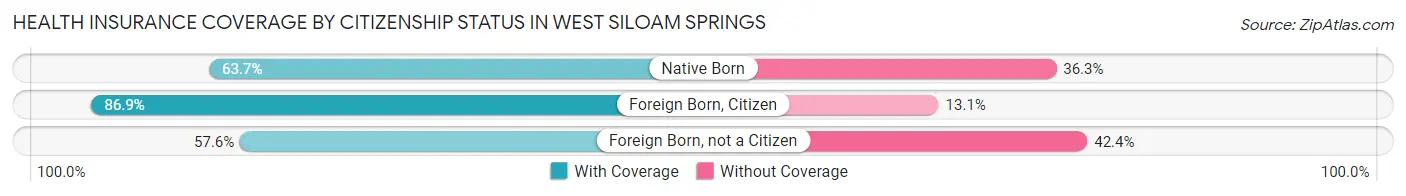
| Citizenship Status | With Coverage | Without Coverage |
| Native Born | 65 (63.7%) | 37 (36.3%) |
| Foreign Born, Citizen | 152 (86.9%) | 23 (13.1%) |
| Foreign Born, not a Citizen | 83 (57.6%) | 61 (42.4%) |
Health Insurance Coverage by Household Income in West Siloam Springs
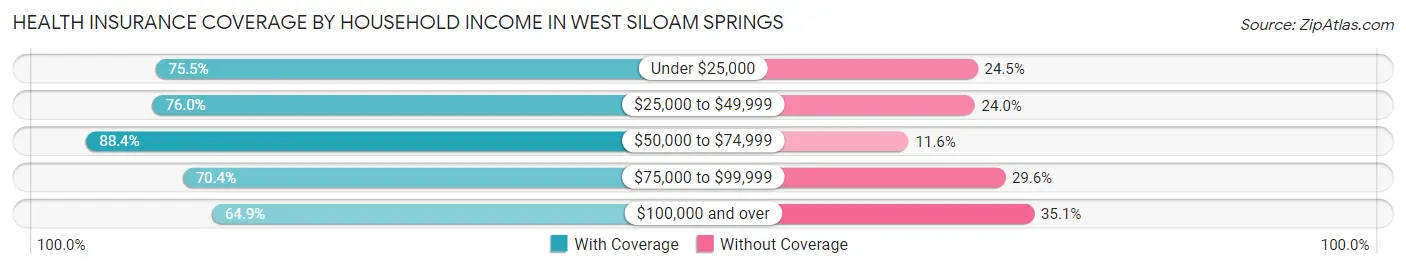
| Household Income | With Coverage | Without Coverage |
| Under $25,000 | 114 (75.5%) | 37 (24.5%) |
| $25,000 to $49,999 | 219 (76.0%) | 69 (24.0%) |
| $50,000 to $74,999 | 313 (88.4%) | 41 (11.6%) |
| $75,000 to $99,999 | 76 (70.4%) | 32 (29.6%) |
| $100,000 and over | 220 (64.9%) | 119 (35.1%) |
Public vs Private Health Insurance Coverage by Age in West Siloam Springs
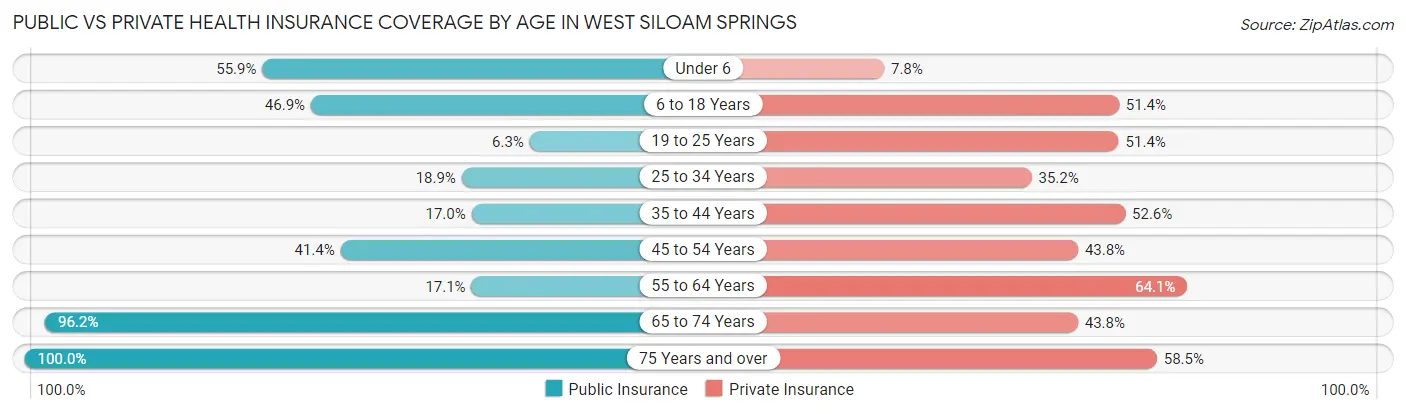
| Age Bracket | Public Insurance | Private Insurance |
| Under 6 | 57 (55.9%) | 8 (7.8%) |
| 6 to 18 Years | 82 (46.9%) | 90 (51.4%) |
| 19 to 25 Years | 9 (6.2%) | 74 (51.4%) |
| 25 to 34 Years | 30 (18.9%) | 56 (35.2%) |
| 35 to 44 Years | 23 (17.0%) | 71 (52.6%) |
| 45 to 54 Years | 67 (41.4%) | 71 (43.8%) |
| 55 to 64 Years | 29 (17.1%) | 109 (64.1%) |
| 65 to 74 Years | 101 (96.2%) | 46 (43.8%) |
| 75 Years and over | 118 (100.0%) | 69 (58.5%) |
| Total | 516 (40.6%) | 594 (46.8%) |
Disability Status by Sex by Age in West Siloam Springs
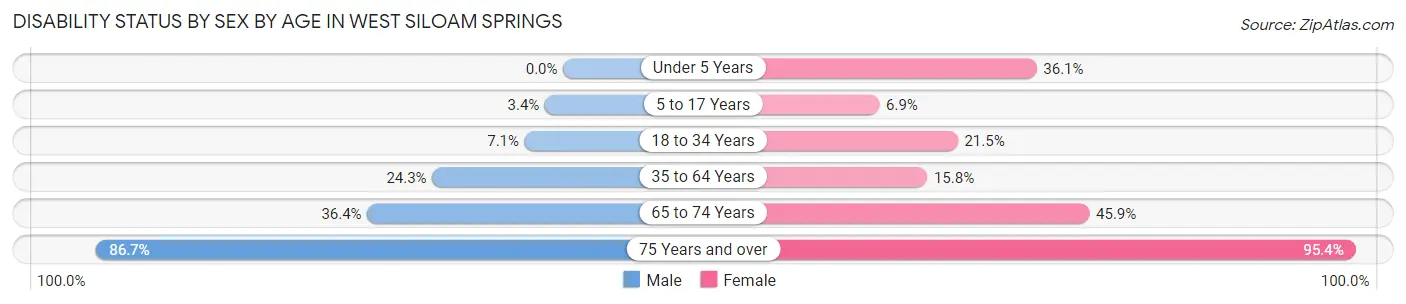
| Age Bracket | Male | Female |
| Under 5 Years | 0 (0.0%) | 13 (36.1%) |
| 5 to 17 Years | 3 (3.4%) | 7 (6.9%) |
| 18 to 34 Years | 9 (7.1%) | 38 (21.5%) |
| 35 to 64 Years | 52 (24.3%) | 40 (15.8%) |
| 65 to 74 Years | 16 (36.4%) | 28 (45.9%) |
| 75 Years and over | 65 (86.7%) | 41 (95.4%) |
Disability Class by Sex by Age in West Siloam Springs
Disability Class: Hearing Difficulty
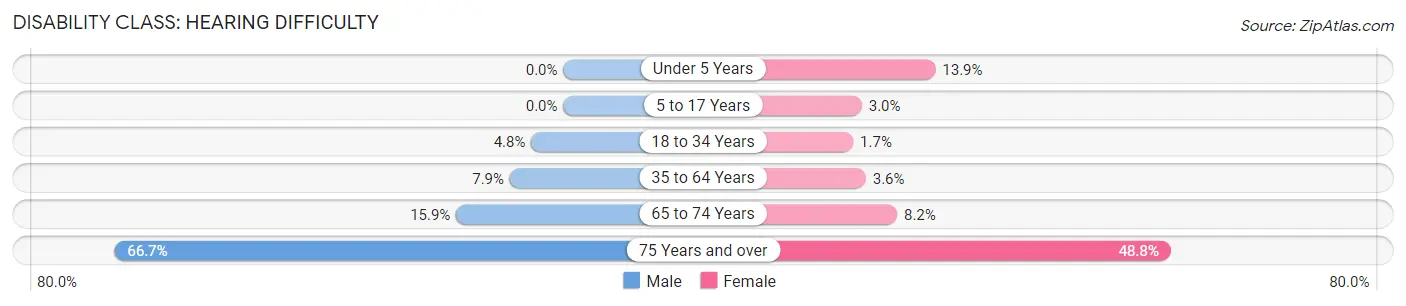
| Age Bracket | Male | Female |
| Under 5 Years | 0 (0.0%) | 5 (13.9%) |
| 5 to 17 Years | 0 (0.0%) | 3 (3.0%) |
| 18 to 34 Years | 6 (4.8%) | 3 (1.7%) |
| 35 to 64 Years | 17 (7.9%) | 9 (3.6%) |
| 65 to 74 Years | 7 (15.9%) | 5 (8.2%) |
| 75 Years and over | 50 (66.7%) | 21 (48.8%) |
Disability Class: Vision Difficulty
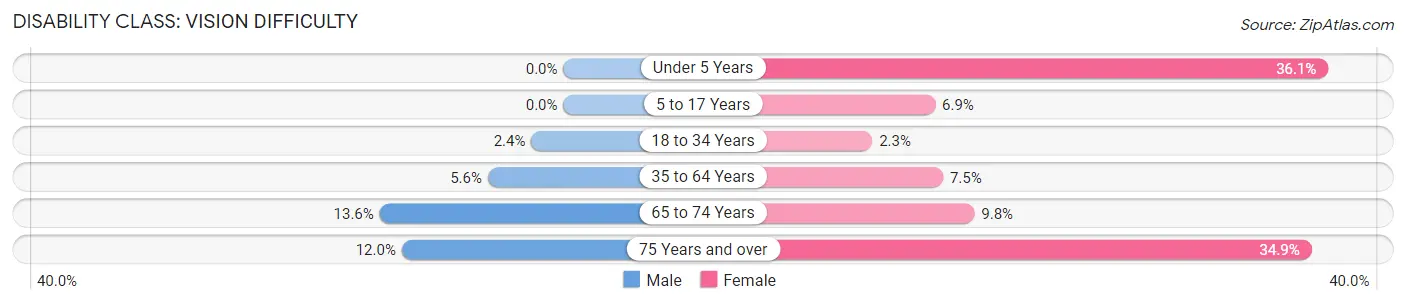
| Age Bracket | Male | Female |
| Under 5 Years | 0 (0.0%) | 13 (36.1%) |
| 5 to 17 Years | 0 (0.0%) | 7 (6.9%) |
| 18 to 34 Years | 3 (2.4%) | 4 (2.3%) |
| 35 to 64 Years | 12 (5.6%) | 19 (7.5%) |
| 65 to 74 Years | 6 (13.6%) | 6 (9.8%) |
| 75 Years and over | 9 (12.0%) | 15 (34.9%) |
Disability Class: Cognitive Difficulty
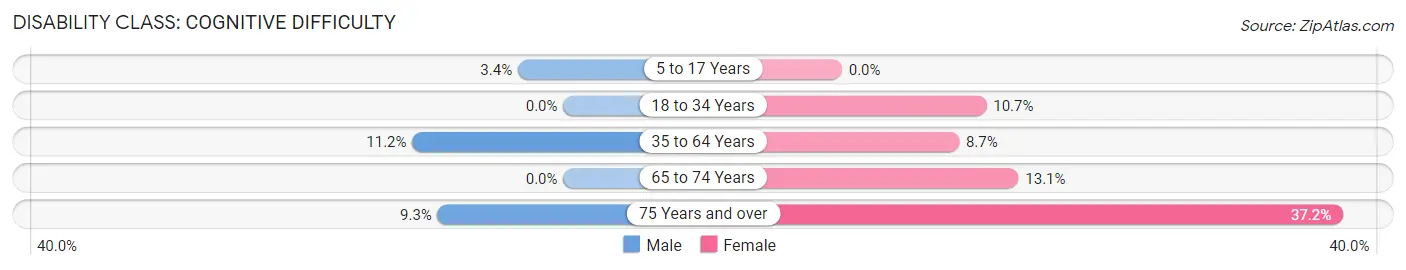
| Age Bracket | Male | Female |
| 5 to 17 Years | 3 (3.4%) | 0 (0.0%) |
| 18 to 34 Years | 0 (0.0%) | 19 (10.7%) |
| 35 to 64 Years | 24 (11.2%) | 22 (8.7%) |
| 65 to 74 Years | 0 (0.0%) | 8 (13.1%) |
| 75 Years and over | 7 (9.3%) | 16 (37.2%) |
Disability Class: Ambulatory Difficulty
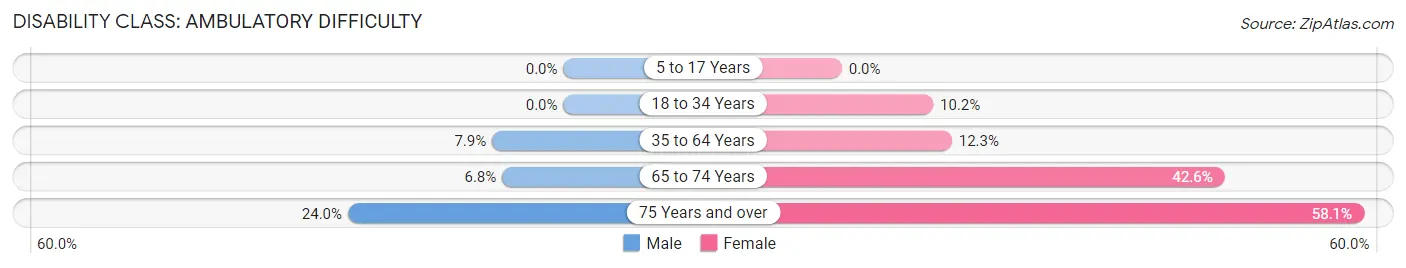
| Age Bracket | Male | Female |
| 5 to 17 Years | 0 (0.0%) | 0 (0.0%) |
| 18 to 34 Years | 0 (0.0%) | 18 (10.2%) |
| 35 to 64 Years | 17 (7.9%) | 31 (12.2%) |
| 65 to 74 Years | 3 (6.8%) | 26 (42.6%) |
| 75 Years and over | 18 (24.0%) | 25 (58.1%) |
Disability Class: Self-Care Difficulty
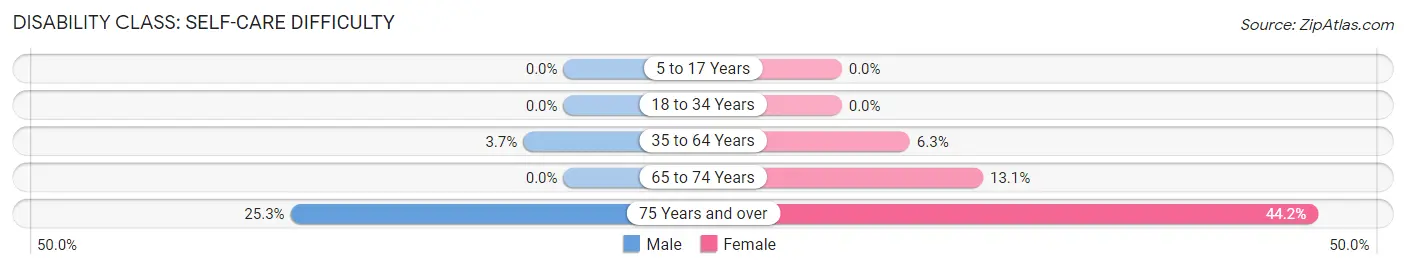
| Age Bracket | Male | Female |
| 5 to 17 Years | 0 (0.0%) | 0 (0.0%) |
| 18 to 34 Years | 0 (0.0%) | 0 (0.0%) |
| 35 to 64 Years | 8 (3.7%) | 16 (6.3%) |
| 65 to 74 Years | 0 (0.0%) | 8 (13.1%) |
| 75 Years and over | 19 (25.3%) | 19 (44.2%) |
Technology Access in West Siloam Springs
Computing Device Access in West Siloam Springs
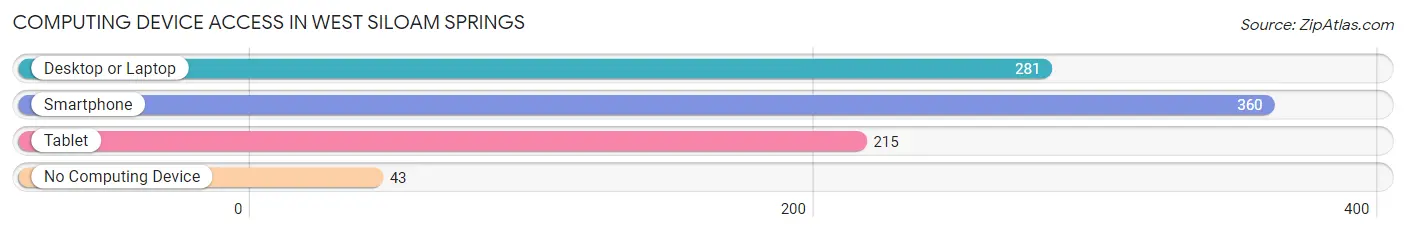
| Device Type | # Households | % Households |
| Desktop or Laptop | 281 | 63.3% |
| Smartphone | 360 | 81.1% |
| Tablet | 215 | 48.4% |
| No Computing Device | 43 | 9.7% |
| Total | 444 | 100.0% |
Internet Access in West Siloam Springs
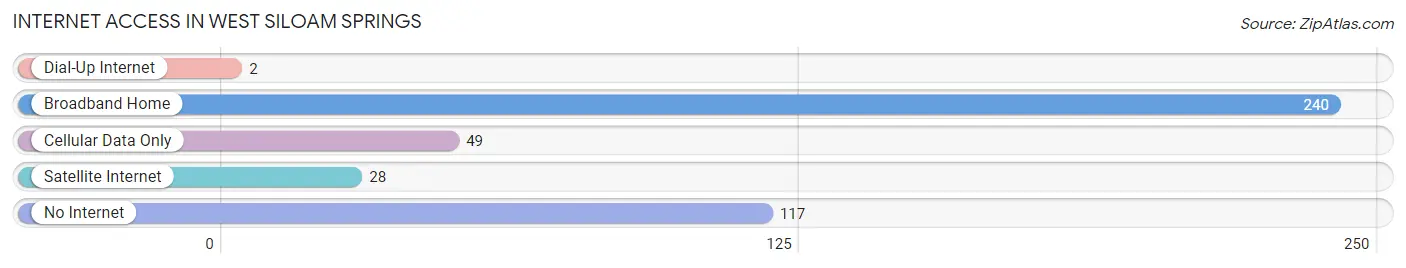
| Internet Type | # Households | % Households |
| Dial-Up Internet | 2 | 0.4% |
| Broadband Home | 240 | 54.0% |
| Cellular Data Only | 49 | 11.0% |
| Satellite Internet | 28 | 6.3% |
| No Internet | 117 | 26.4% |
| Total | 444 | 100.0% |
West Siloam Springs Summary
West Siloam Springs is a small town located in the northeastern corner of Oklahoma, in the Ozark Mountains. It is situated in the Cherokee Nation, and is part of the Cherokee County. The town is located on the Arkansas-Oklahoma border, and is approximately 20 miles east of the city of Fayetteville, Arkansas. The town is home to a population of approximately 1,500 people, and is known for its rich history and culture.
History
West Siloam Springs was founded in 1883 by the Cherokee Nation. The town was originally known as “Siloam Springs”, and was named after the nearby Siloam Springs in Arkansas. The town was originally a trading post, and was used as a stopover for travelers and traders. The town was also a popular destination for Native Americans, who would come to trade and socialize.
In the early 1900s, the town began to grow and develop. The town was incorporated in 1906, and the first mayor was elected in 1907. The town was also home to a number of businesses, including a hotel, a general store, a blacksmith shop, and a livery stable.
In the 1920s, the town began to experience a period of growth and prosperity. The town was home to a number of businesses, including a bank, a movie theater, a drug store, and a number of other stores. The town also had a number of churches, including the First Baptist Church, the First Methodist Church, and the First Presbyterian Church.
In the 1950s, the town began to experience a period of decline. The town’s population began to decline, and many of the businesses began to close. The town was also affected by the construction of the nearby Grand River Dam, which caused flooding in the area.
In the late 1970s, the town began to experience a period of revitalization. The town was home to a number of new businesses, including a grocery store, a hardware store, and a number of restaurants. The town also began to attract tourists, and the town’s population began to increase.
Geography
West Siloam Springs is located in the Ozark Mountains, in the northeastern corner of Oklahoma. The town is situated in the Cherokee Nation, and is part of the Cherokee County. The town is located on the Arkansas-Oklahoma border, and is approximately 20 miles east of the city of Fayetteville, Arkansas.
The town is situated in a valley, and is surrounded by rolling hills and forests. The town is located near the Illinois River, and is home to a number of creeks and streams. The town is also home to a number of parks, including the West Siloam Springs State Park.
Economy
West Siloam Springs is a small town, and the economy is largely based on tourism and agriculture. The town is home to a number of businesses, including restaurants, hotels, and retail stores. The town is also home to a number of farms, and the town’s economy is largely based on the production of livestock and crops.
The town is also home to a number of manufacturing businesses, including a furniture factory and a woodworking shop. The town is also home to a number of service businesses, including a number of auto repair shops and a number of medical offices.
Demographics
West Siloam Springs is home to a population of approximately 1,500 people. The town is predominantly white, with approximately 90% of the population being white. The town is also home to a small Hispanic population, with approximately 5% of the population being Hispanic. The town is also home to a small Native American population, with approximately 5% of the population being Native American.
The town is also home to a number of religious denominations, including Baptist, Methodist, and Presbyterian. The town is also home to a number of churches, including the First Baptist Church, the First Methodist Church, and the First Presbyterian Church.
Conclusion
West Siloam Springs is a small town located in the northeastern corner of Oklahoma, in the Ozark Mountains. The town is situated in the Cherokee Nation, and is part of the Cherokee County. The town is home to a population of approximately 1,500 people, and is known for its rich history and culture. The town’s economy is largely based on tourism and agriculture, and the town is home to a number of businesses, including restaurants, hotels, and retail stores. The town is predominantly white, with approximately 90% of the population being white. The town is also home to a small Hispanic population, with approximately 5% of the population being Hispanic, and a small Native American population, with approximately 5% of the population being Native American.
Common Questions
What is Per Capita Income in West Siloam Springs?
Per Capita income in West Siloam Springs is $22,798.
What is the Median Family Income in West Siloam Springs?
Median Family Income in West Siloam Springs is $64,219.
What is the Median Household income in West Siloam Springs?
Median Household Income in West Siloam Springs is $55,400.
What is Income or Wage Gap in West Siloam Springs?
Income or Wage Gap in West Siloam Springs is 31.6%.
Women in West Siloam Springs earn 68.4 cents for every dollar earned by a man.
What is Inequality or Gini Index in West Siloam Springs?
Inequality or Gini Index in West Siloam Springs is 0.40.
What is the Total Population of West Siloam Springs?
Total Population of West Siloam Springs is 1,368.
What is the Total Male Population of West Siloam Springs?
Total Male Population of West Siloam Springs is 631.
What is the Total Female Population of West Siloam Springs?
Total Female Population of West Siloam Springs is 737.
What is the Ratio of Males per 100 Females in West Siloam Springs?
There are 85.62 Males per 100 Females in West Siloam Springs.
What is the Ratio of Females per 100 Males in West Siloam Springs?
There are 116.80 Females per 100 Males in West Siloam Springs.
What is the Median Population Age in West Siloam Springs?
Median Population Age in West Siloam Springs is 41.7 Years.
What is the Average Family Size in West Siloam Springs
Average Family Size in West Siloam Springs is 3.2 People.
What is the Average Household Size in West Siloam Springs
Average Household Size in West Siloam Springs is 2.8 People.
How Large is the Labor Force in West Siloam Springs?
There are 506 People in the Labor Forcein in West Siloam Springs.
What is the Percentage of People in the Labor Force in West Siloam Springs?
45.3% of People are in the Labor Force in West Siloam Springs.
What is the Unemployment Rate in West Siloam Springs?
Unemployment Rate in West Siloam Springs is 6.7%.