Lewisville, MN Map & Demographics
Lewisville Map
Lewisville Overview
$24,584
PER CAPITA INCOME
$51,875
AVG FAMILY INCOME
$55,000
AVG HOUSEHOLD INCOME
0.37
INEQUALITY / GINI INDEX
273
TOTAL POPULATION
131
MALE POPULATION
142
FEMALE POPULATION
92.25
MALES / 100 FEMALES
108.40
FEMALES / 100 MALES
46.1
MEDIAN AGE
3.3
AVG FAMILY SIZE
2.4
AVG HOUSEHOLD SIZE
108
LABOR FORCE [ PEOPLE ]
47.8%
PERCENT IN LABOR FORCE
1.9%
UNEMPLOYMENT RATE
Lewisville Zip Codes
Lewisville Area Codes
Income in Lewisville
Income Overview in Lewisville
Per Capita Income in Lewisville is $24,584, while median incomes of families and households are $51,875 and $55,000 respectively.
| Characteristic | Number | Measure |
| Per Capita Income | 273 | $24,584 |
| Median Family Income | 61 | $51,875 |
| Mean Family Income | 61 | $59,154 |
| Median Household Income | 112 | $55,000 |
| Mean Household Income | 112 | $54,321 |
| Income Deficit | 61 | $0 |
| Wage / Income Gap (%) | 273 | 0.00% |
| Wage / Income Gap ($) | 273 | 100.00¢ per $1 |
| Gini / Inequality Index | 273 | 0.37 |
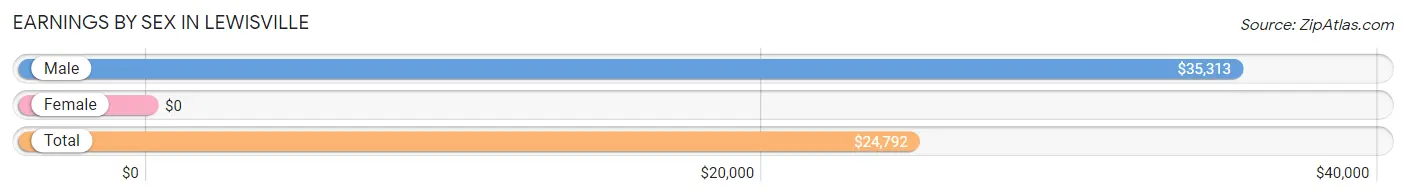
Earnings by Sex in Lewisville
| Sex | Number | Average Earnings |
| Male | 103 (69.6%) | $35,313 |
| Female | 45 (30.4%) | $0 |
| Total | 148 (100.0%) | $24,792 |
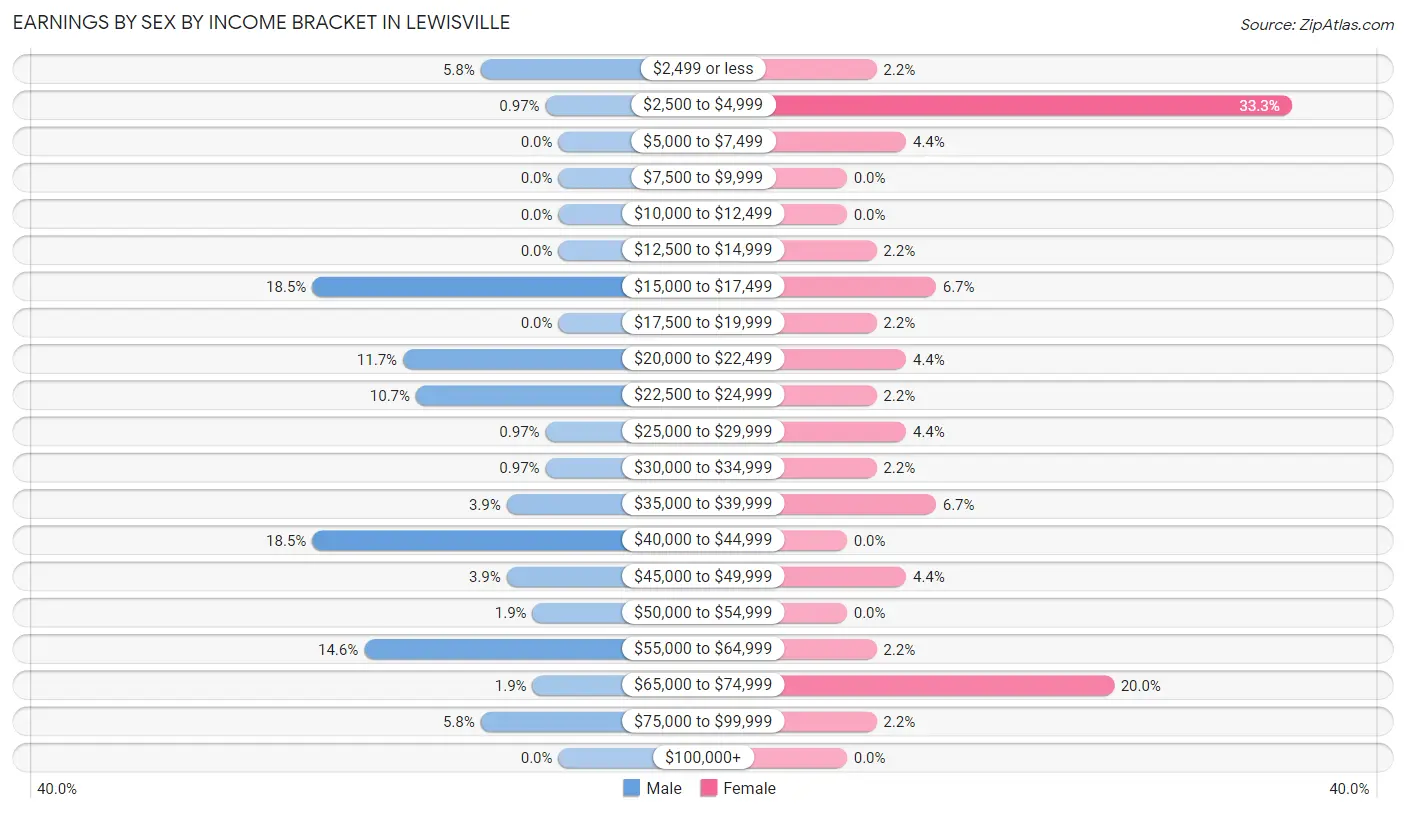
Earnings by Sex by Income Bracket in Lewisville
The most common earnings brackets in Lewisville are $15,000 to $17,499 for men (19 | 18.4%) and $2,500 to $4,999 for women (15 | 33.3%).
| Income | Male | Female |
| $2,499 or less | 6 (5.8%) | 1 (2.2%) |
| $2,500 to $4,999 | 1 (1.0%) | 15 (33.3%) |
| $5,000 to $7,499 | 0 (0.0%) | 2 (4.4%) |
| $7,500 to $9,999 | 0 (0.0%) | 0 (0.0%) |
| $10,000 to $12,499 | 0 (0.0%) | 0 (0.0%) |
| $12,500 to $14,999 | 0 (0.0%) | 1 (2.2%) |
| $15,000 to $17,499 | 19 (18.4%) | 3 (6.7%) |
| $17,500 to $19,999 | 0 (0.0%) | 1 (2.2%) |
| $20,000 to $22,499 | 12 (11.7%) | 2 (4.4%) |
| $22,500 to $24,999 | 11 (10.7%) | 1 (2.2%) |
| $25,000 to $29,999 | 1 (1.0%) | 2 (4.4%) |
| $30,000 to $34,999 | 1 (1.0%) | 1 (2.2%) |
| $35,000 to $39,999 | 4 (3.9%) | 3 (6.7%) |
| $40,000 to $44,999 | 19 (18.4%) | 0 (0.0%) |
| $45,000 to $49,999 | 4 (3.9%) | 2 (4.4%) |
| $50,000 to $54,999 | 2 (1.9%) | 0 (0.0%) |
| $55,000 to $64,999 | 15 (14.6%) | 1 (2.2%) |
| $65,000 to $74,999 | 2 (1.9%) | 9 (20.0%) |
| $75,000 to $99,999 | 6 (5.8%) | 1 (2.2%) |
| $100,000+ | 0 (0.0%) | 0 (0.0%) |
| Total | 103 (100.0%) | 45 (100.0%) |
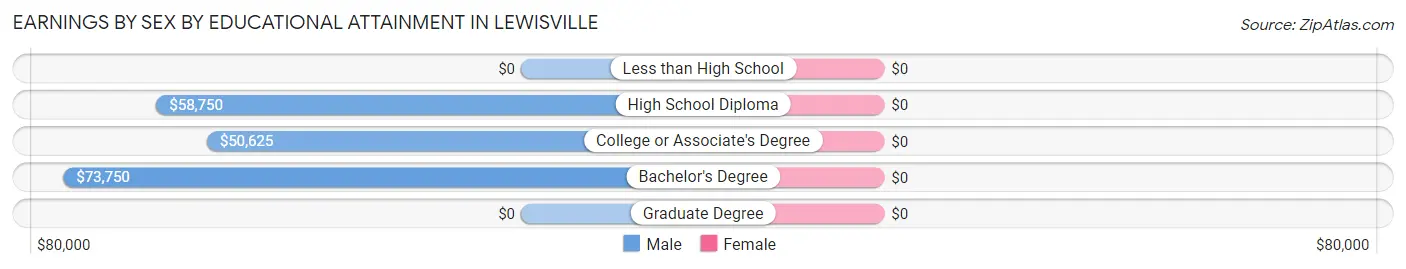
Earnings by Sex by Educational Attainment in Lewisville
| Educational Attainment | Male Income | Female Income |
| Less than High School | - | - |
| High School Diploma | $58,750 | $0 |
| College or Associate's Degree | $50,625 | $0 |
| Bachelor's Degree | $73,750 | $0 |
| Graduate Degree | - | - |
| Total | $40,921 | $0 |
Family Income in Lewisville
Family Income Brackets in Lewisville
According to the Lewisville family income data, there are 15 families falling into the $35,000 to $49,999 income range, which is the most common income bracket and makes up 24.6% of all families.
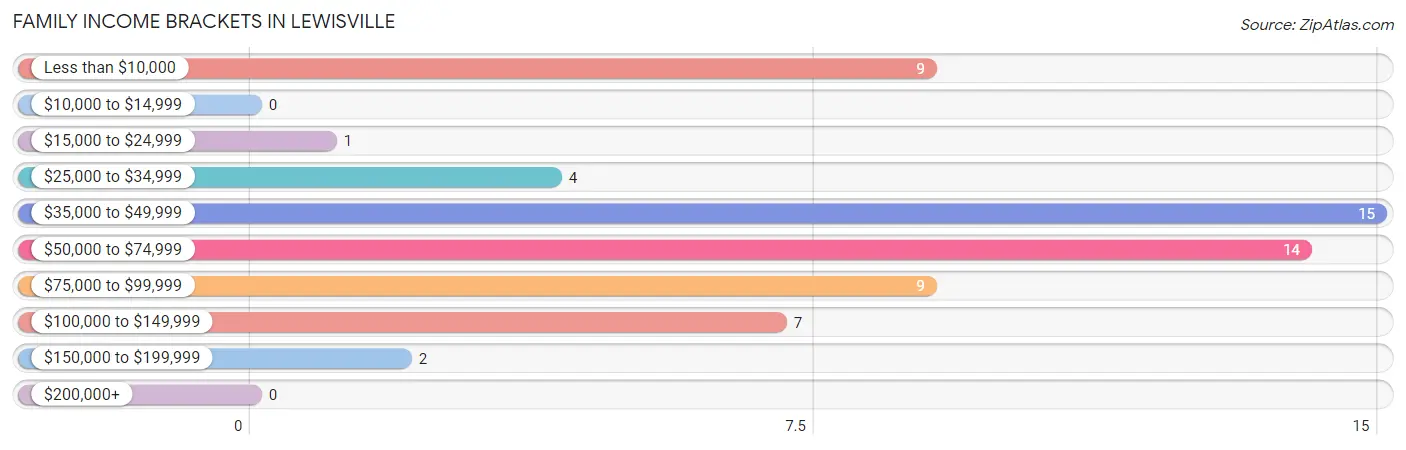
| Income Bracket | # Families | % Families |
| Less than $10,000 | 9 | 14.8% |
| $10,000 to $14,999 | 0 | 0.0% |
| $15,000 to $24,999 | 1 | 1.6% |
| $25,000 to $34,999 | 4 | 6.6% |
| $35,000 to $49,999 | 15 | 24.6% |
| $50,000 to $74,999 | 14 | 23.0% |
| $75,000 to $99,999 | 9 | 14.8% |
| $100,000 to $149,999 | 7 | 11.5% |
| $150,000 to $199,999 | 2 | 3.3% |
| $200,000+ | 0 | 0.0% |
Family Income by Famaliy Size in Lewisville
2-person families (29 | 47.5%) account for the highest median family income in Lewisville with $55,625 per family, while 2-person families (29 | 47.5%) have the highest median income of $27,812 per family member.
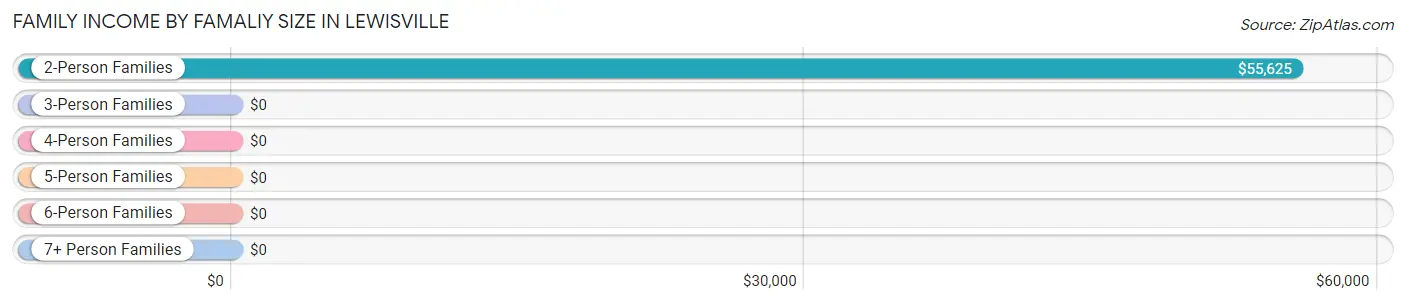
| Income Bracket | # Families | Median Income |
| 2-Person Families | 29 (47.5%) | $55,625 |
| 3-Person Families | 16 (26.2%) | $0 |
| 4-Person Families | 15 (24.6%) | $0 |
| 5-Person Families | 1 (1.6%) | $0 |
| 6-Person Families | 0 (0.0%) | $0 |
| 7+ Person Families | 0 (0.0%) | $0 |
| Total | 61 (100.0%) | $51,875 |
Family Income by Number of Earners in Lewisville
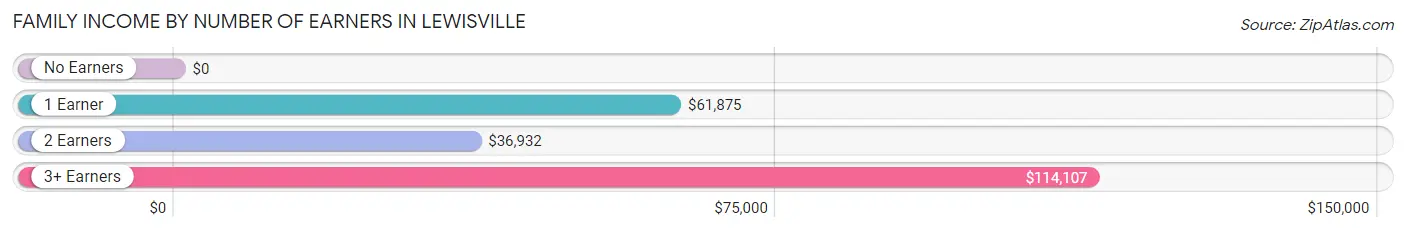
| Number of Earners | # Families | Median Income |
| No Earners | 14 (23.0%) | $0 |
| 1 Earner | 17 (27.9%) | $61,875 |
| 2 Earners | 21 (34.4%) | $36,932 |
| 3+ Earners | 9 (14.7%) | $114,107 |
| Total | 61 (100.0%) | $51,875 |
Household Income in Lewisville
Household Income Brackets in Lewisville
With 26 households falling in the category, the $50,000 to $74,999 income range is the most frequent in Lewisville, accounting for 23.2% of all households.
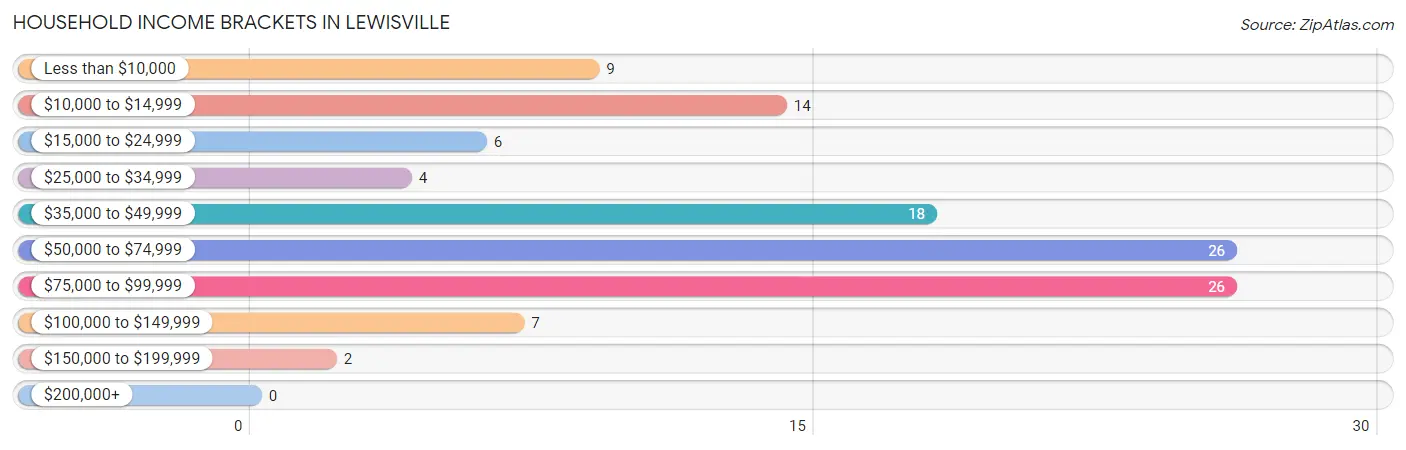
| Income Bracket | # Households | % Households |
| Less than $10,000 | 9 | 8.0% |
| $10,000 to $14,999 | 14 | 12.5% |
| $15,000 to $24,999 | 6 | 5.4% |
| $25,000 to $34,999 | 4 | 3.6% |
| $35,000 to $49,999 | 18 | 16.1% |
| $50,000 to $74,999 | 26 | 23.2% |
| $75,000 to $99,999 | 26 | 23.2% |
| $100,000 to $149,999 | 7 | 6.3% |
| $150,000 to $199,999 | 2 | 1.8% |
| $200,000+ | 0 | 0.0% |
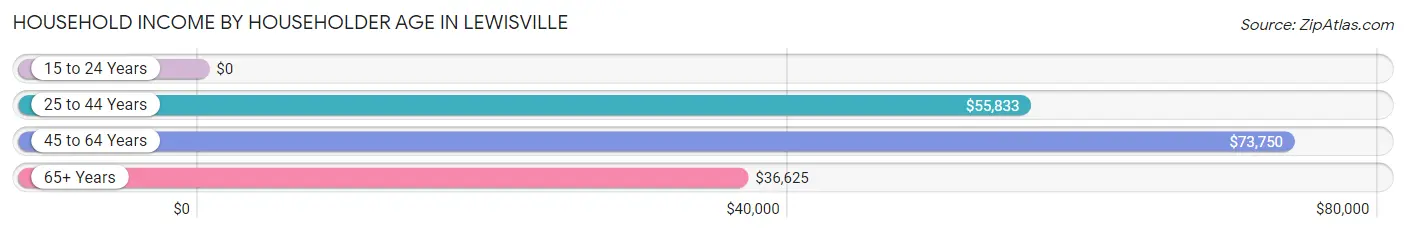
Household Income by Householder Age in Lewisville
The median household income in Lewisville is $55,000, with the highest median household income of $73,750 found in the 45 to 64 years age bracket for the primary householder. A total of 61 households (54.5%) fall into this category.
| Income Bracket | # Households | Median Income |
| 15 to 24 Years | 0 (0.0%) | $0 |
| 25 to 44 Years | 14 (12.5%) | $55,833 |
| 45 to 64 Years | 61 (54.5%) | $73,750 |
| 65+ Years | 37 (33.0%) | $36,625 |
| Total | 112 (100.0%) | $55,000 |
Poverty in Lewisville
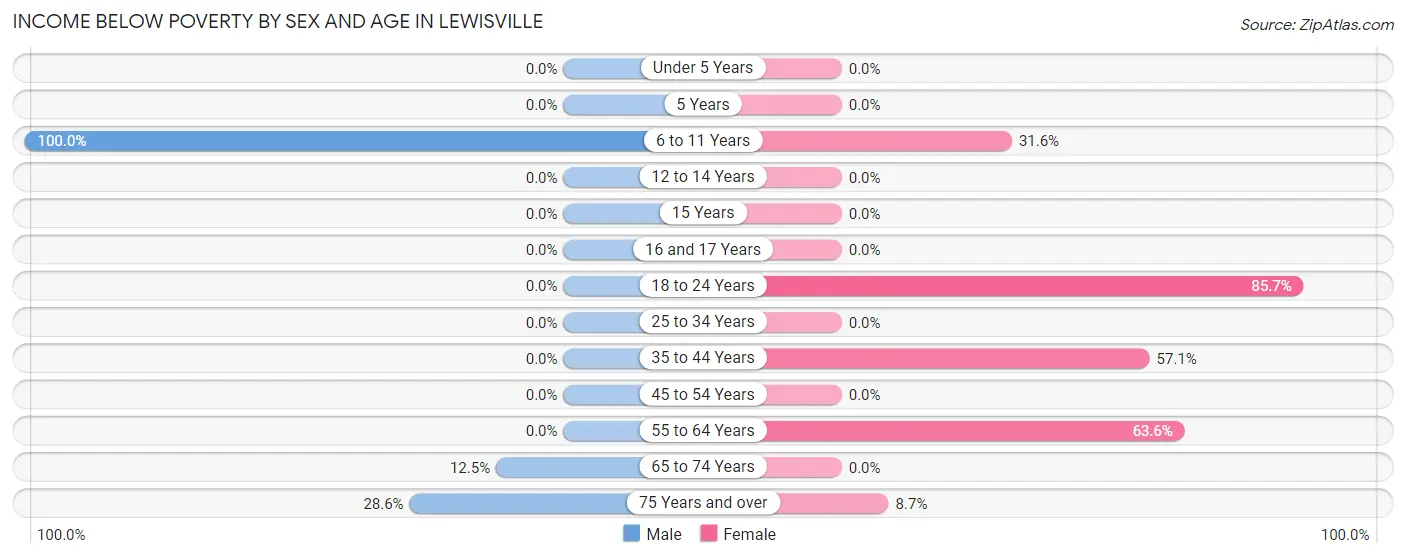
Income Below Poverty by Sex and Age in Lewisville
With 6.9% poverty level for males and 22.5% for females among the residents of Lewisville, 6 to 11 year old males and 18 to 24 year old females are the most vulnerable to poverty, with 5 males (100.0%) and 6 females (85.7%) in their respective age groups living below the poverty level.
| Age Bracket | Male | Female |
| Under 5 Years | 0 (0.0%) | 0 (0.0%) |
| 5 Years | 0 (0.0%) | 0 (0.0%) |
| 6 to 11 Years | 5 (100.0%) | 6 (31.6%) |
| 12 to 14 Years | 0 (0.0%) | 0 (0.0%) |
| 15 Years | 0 (0.0%) | 0 (0.0%) |
| 16 and 17 Years | 0 (0.0%) | 0 (0.0%) |
| 18 to 24 Years | 0 (0.0%) | 6 (85.7%) |
| 25 to 34 Years | 0 (0.0%) | 0 (0.0%) |
| 35 to 44 Years | 0 (0.0%) | 4 (57.1%) |
| 45 to 54 Years | 0 (0.0%) | 0 (0.0%) |
| 55 to 64 Years | 0 (0.0%) | 14 (63.6%) |
| 65 to 74 Years | 2 (12.5%) | 0 (0.0%) |
| 75 Years and over | 2 (28.6%) | 2 (8.7%) |
| Total | 9 (6.9%) | 32 (22.5%) |
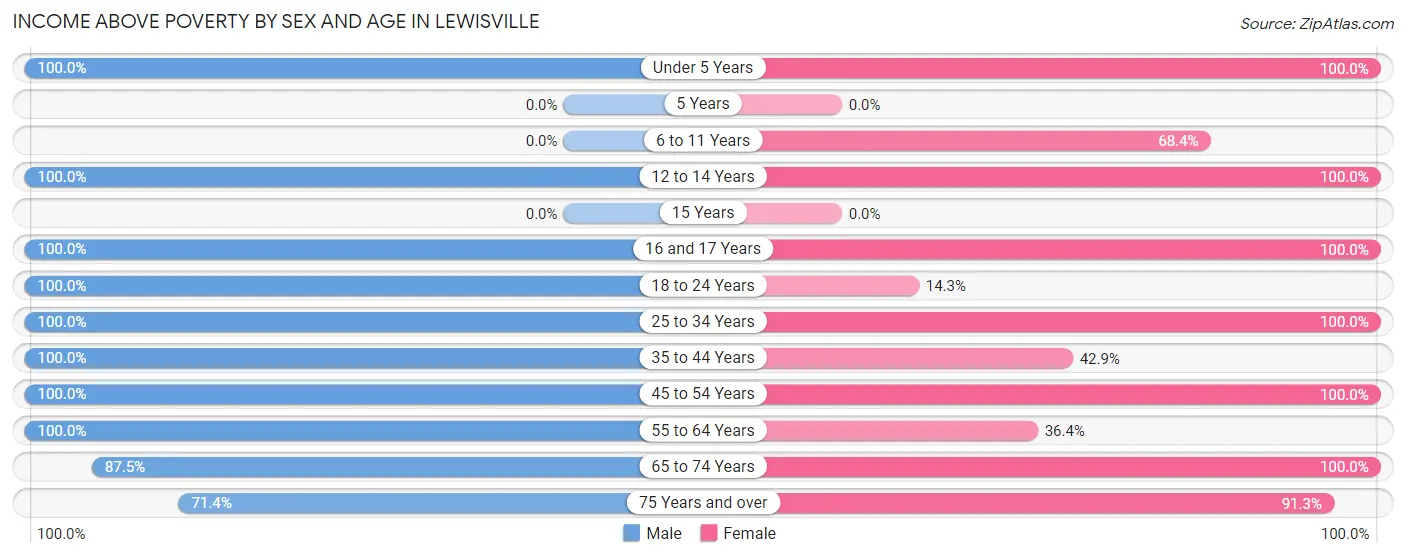
Income Above Poverty by Sex and Age in Lewisville
According to the poverty statistics in Lewisville, males aged under 5 years and females aged under 5 years are the age groups that are most secure financially, with 100.0% of males and 100.0% of females in these age groups living above the poverty line.
| Age Bracket | Male | Female |
| Under 5 Years | 2 (100.0%) | 18 (100.0%) |
| 5 Years | 0 (0.0%) | 0 (0.0%) |
| 6 to 11 Years | 0 (0.0%) | 13 (68.4%) |
| 12 to 14 Years | 1 (100.0%) | 2 (100.0%) |
| 15 Years | 0 (0.0%) | 0 (0.0%) |
| 16 and 17 Years | 4 (100.0%) | 2 (100.0%) |
| 18 to 24 Years | 17 (100.0%) | 1 (14.3%) |
| 25 to 34 Years | 19 (100.0%) | 7 (100.0%) |
| 35 to 44 Years | 25 (100.0%) | 3 (42.9%) |
| 45 to 54 Years | 5 (100.0%) | 23 (100.0%) |
| 55 to 64 Years | 30 (100.0%) | 8 (36.4%) |
| 65 to 74 Years | 14 (87.5%) | 12 (100.0%) |
| 75 Years and over | 5 (71.4%) | 21 (91.3%) |
| Total | 122 (93.1%) | 110 (77.5%) |
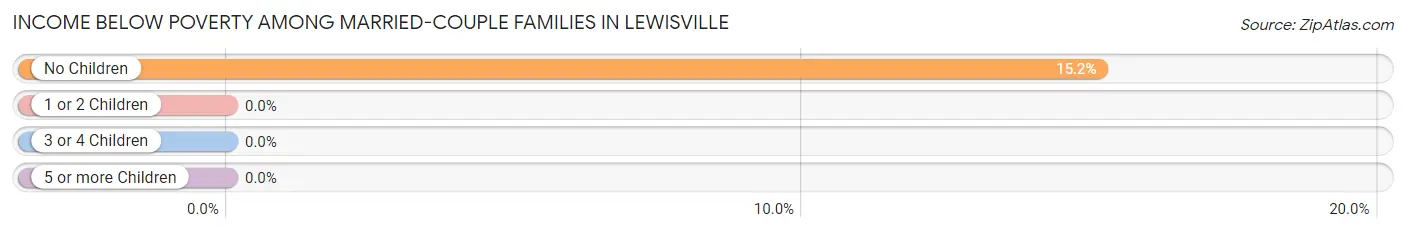
Income Below Poverty Among Married-Couple Families in Lewisville
The poverty statistics for married-couple families in Lewisville show that 13.5% or 5 of the total 37 families live below the poverty line. Families with no children have the highest poverty rate of 15.1%, comprising of 5 families. On the other hand, families with 1 or 2 children have the lowest poverty rate of 0.0%, which includes 0 families.
| Children | Above Poverty | Below Poverty |
| No Children | 28 (84.9%) | 5 (15.1%) |
| 1 or 2 Children | 3 (100.0%) | 0 (0.0%) |
| 3 or 4 Children | 1 (100.0%) | 0 (0.0%) |
| 5 or more Children | 0 (0.0%) | 0 (0.0%) |
| Total | 32 (86.5%) | 5 (13.5%) |
Income Below Poverty Among Single-Parent Households in Lewisville
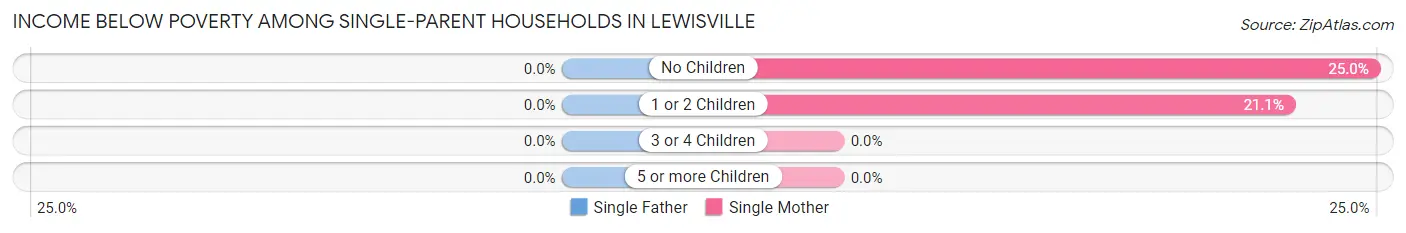
| Children | Single Father | Single Mother |
| No Children | 0 (0.0%) | 1 (25.0%) |
| 1 or 2 Children | 0 (0.0%) | 4 (21.0%) |
| 3 or 4 Children | 0 (0.0%) | 0 (0.0%) |
| 5 or more Children | 0 (0.0%) | 0 (0.0%) |
| Total | 0 (0.0%) | 5 (21.7%) |
Income Below Poverty Among Married-Couple vs Single-Parent Households in Lewisville
The poverty data for Lewisville shows that 5 of the married-couple family households (13.5%) and 5 of the single-parent households (20.8%) are living below the poverty level. Within the married-couple family households, those with no children have the highest poverty rate, with 5 households (15.1%) falling below the poverty line. Among the single-parent households, those with 1 or 2 children have the highest poverty rate, with 4 household (21.0%) living below poverty.
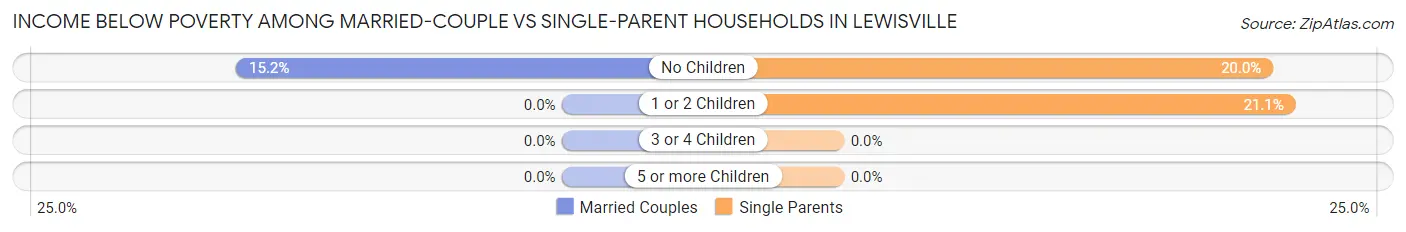
| Children | Married-Couple Families | Single-Parent Households |
| No Children | 5 (15.1%) | 1 (20.0%) |
| 1 or 2 Children | 0 (0.0%) | 4 (21.0%) |
| 3 or 4 Children | 0 (0.0%) | 0 (0.0%) |
| 5 or more Children | 0 (0.0%) | 0 (0.0%) |
| Total | 5 (13.5%) | 5 (20.8%) |
Race in Lewisville
The most populous races in Lewisville are White / Caucasian (161 | 59.0%), Hispanic or Latino (87 | 31.9%), and Two or more Races (73 | 26.7%).
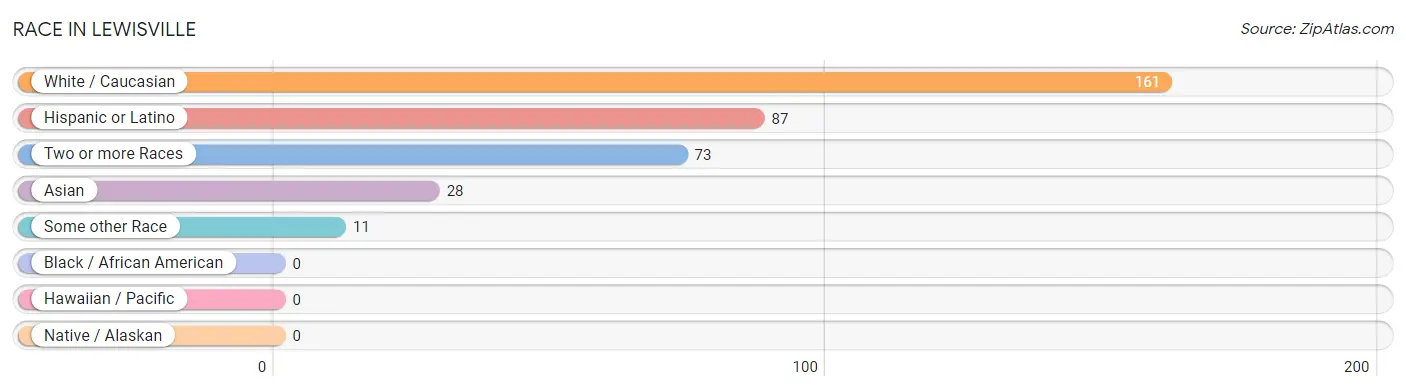
| Race | # Population | % Population |
| Asian | 28 | 10.3% |
| Black / African American | 0 | 0.0% |
| Hawaiian / Pacific | 0 | 0.0% |
| Hispanic or Latino | 87 | 31.9% |
| Native / Alaskan | 0 | 0.0% |
| White / Caucasian | 161 | 59.0% |
| Two or more Races | 73 | 26.7% |
| Some other Race | 11 | 4.0% |
| Total | 273 | 100.0% |
Ancestry in Lewisville
The most populous ancestries reported in Lewisville are German (124 | 45.4%), Mexican (84 | 30.8%), Norwegian (29 | 10.6%), Korean (28 | 10.3%), and English (17 | 6.2%), together accounting for 103.3% of all Lewisville residents.
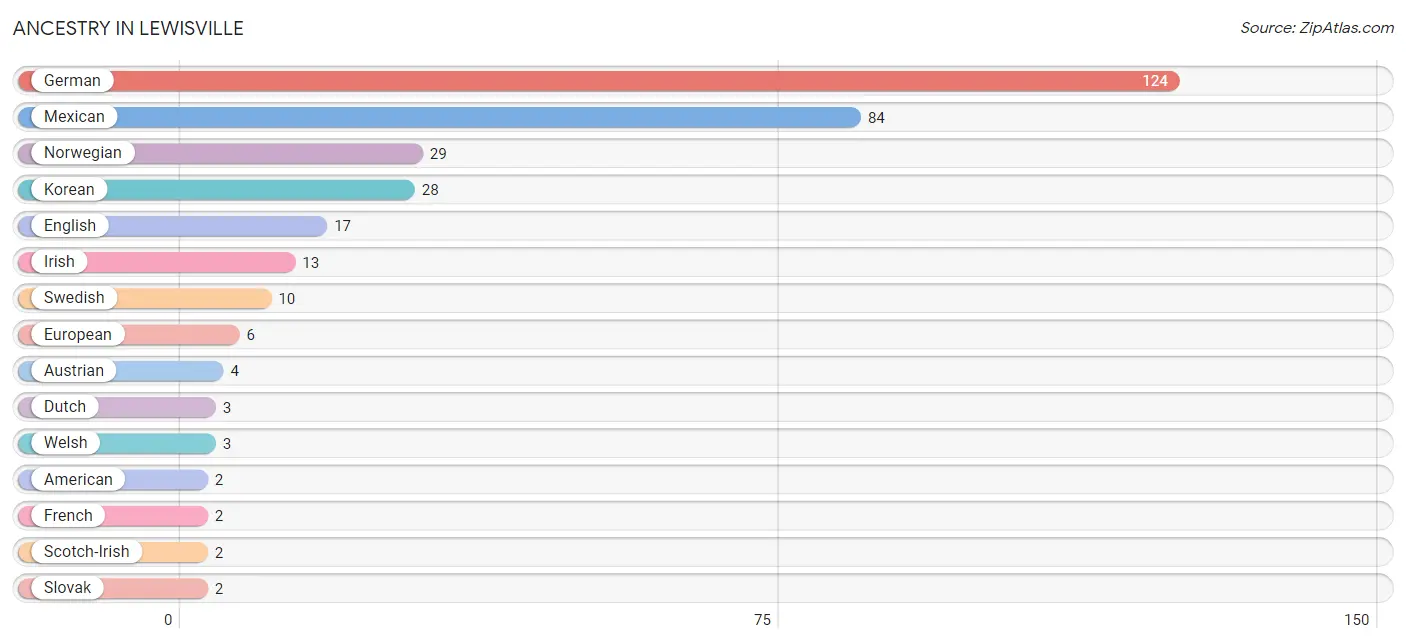
| Ancestry | # Population | % Population |
| American | 2 | 0.7% |
| Austrian | 4 | 1.5% |
| Dutch | 3 | 1.1% |
| English | 17 | 6.2% |
| European | 6 | 2.2% |
| French | 2 | 0.7% |
| German | 124 | 45.4% |
| Irish | 13 | 4.8% |
| Korean | 28 | 10.3% |
| Mexican | 84 | 30.8% |
| Northern European | 1 | 0.4% |
| Norwegian | 29 | 10.6% |
| Scotch-Irish | 2 | 0.7% |
| Slovak | 2 | 0.7% |
| Swedish | 10 | 3.7% |
| Welsh | 3 | 1.1% | View All 16 Rows |
Immigrants in Lewisville
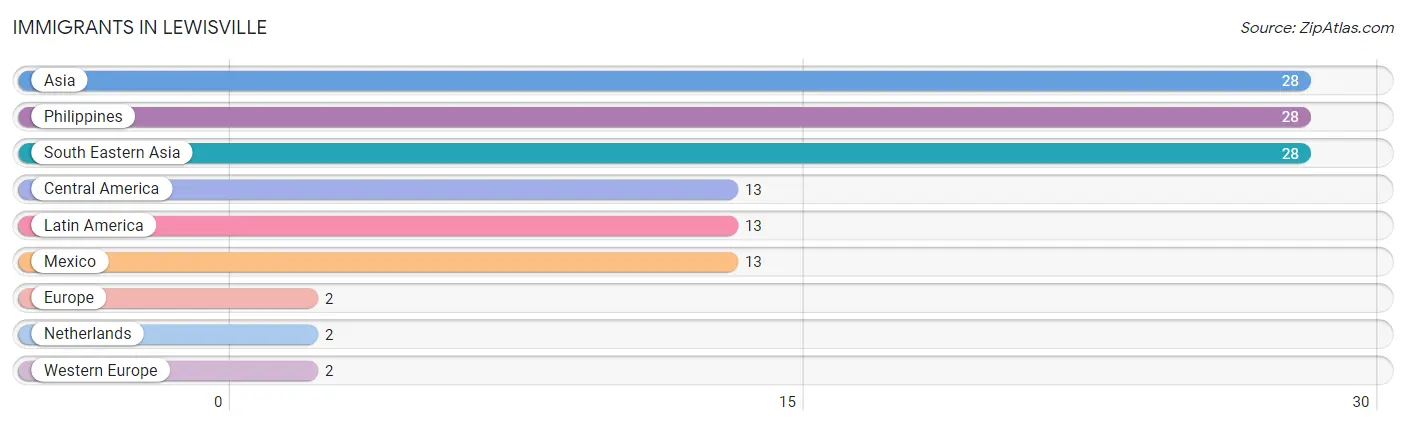
The most numerous immigrant groups reported in Lewisville came from Asia (28 | 10.3%), Philippines (28 | 10.3%), South Eastern Asia (28 | 10.3%), Central America (13 | 4.8%), and Latin America (13 | 4.8%), together accounting for 40.3% of all Lewisville residents.
| Immigration Origin | # Population | % Population |
| Asia | 28 | 10.3% |
| Central America | 13 | 4.8% |
| Europe | 2 | 0.7% |
| Latin America | 13 | 4.8% |
| Mexico | 13 | 4.8% |
| Netherlands | 2 | 0.7% |
| Philippines | 28 | 10.3% |
| South Eastern Asia | 28 | 10.3% |
| Western Europe | 2 | 0.7% | View All 9 Rows |
Sex and Age in Lewisville
Sex and Age in Lewisville
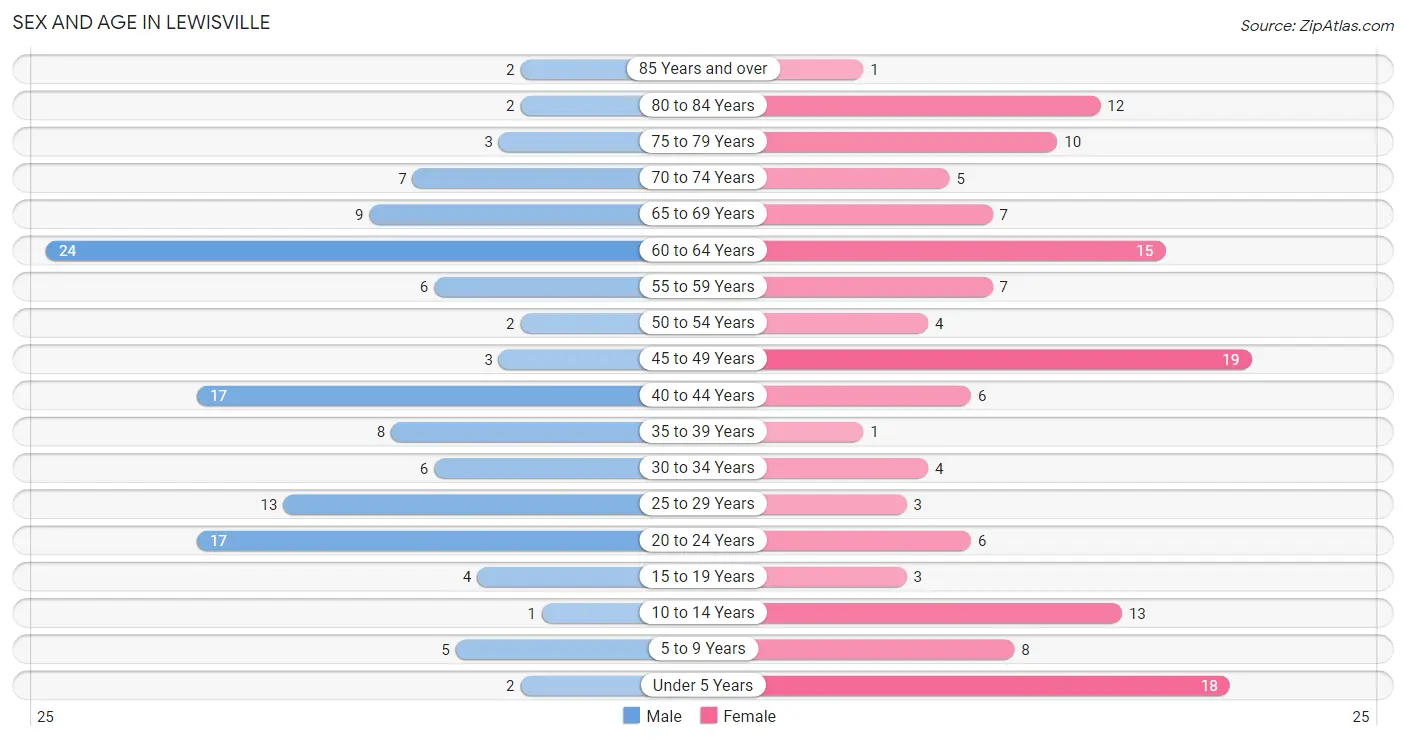
The most populous age groups in Lewisville are 60 to 64 Years (24 | 18.3%) for men and 45 to 49 Years (19 | 13.4%) for women.
| Age Bracket | Male | Female |
| Under 5 Years | 2 (1.5%) | 18 (12.7%) |
| 5 to 9 Years | 5 (3.8%) | 8 (5.6%) |
| 10 to 14 Years | 1 (0.8%) | 13 (9.1%) |
| 15 to 19 Years | 4 (3.0%) | 3 (2.1%) |
| 20 to 24 Years | 17 (13.0%) | 6 (4.2%) |
| 25 to 29 Years | 13 (9.9%) | 3 (2.1%) |
| 30 to 34 Years | 6 (4.6%) | 4 (2.8%) |
| 35 to 39 Years | 8 (6.1%) | 1 (0.7%) |
| 40 to 44 Years | 17 (13.0%) | 6 (4.2%) |
| 45 to 49 Years | 3 (2.3%) | 19 (13.4%) |
| 50 to 54 Years | 2 (1.5%) | 4 (2.8%) |
| 55 to 59 Years | 6 (4.6%) | 7 (4.9%) |
| 60 to 64 Years | 24 (18.3%) | 15 (10.6%) |
| 65 to 69 Years | 9 (6.9%) | 7 (4.9%) |
| 70 to 74 Years | 7 (5.3%) | 5 (3.5%) |
| 75 to 79 Years | 3 (2.3%) | 10 (7.0%) |
| 80 to 84 Years | 2 (1.5%) | 12 (8.5%) |
| 85 Years and over | 2 (1.5%) | 1 (0.7%) |
| Total | 131 (100.0%) | 142 (100.0%) |
Families and Households in Lewisville
Median Family Size in Lewisville
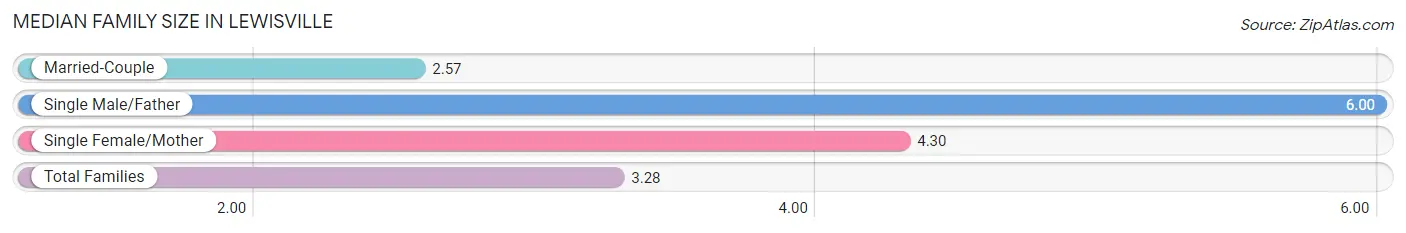
The median family size in Lewisville is 3.28 persons per family, with single male/father families (1 | 1.6%) accounting for the largest median family size of 6 persons per family. On the other hand, married-couple families (37 | 60.7%) represent the smallest median family size with 2.57 persons per family.
| Family Type | # Families | Family Size |
| Married-Couple | 37 (60.7%) | 2.57 |
| Single Male/Father | 1 (1.6%) | 6.00 |
| Single Female/Mother | 23 (37.7%) | 4.30 |
| Total Families | 61 (100.0%) | 3.28 |
Median Household Size in Lewisville
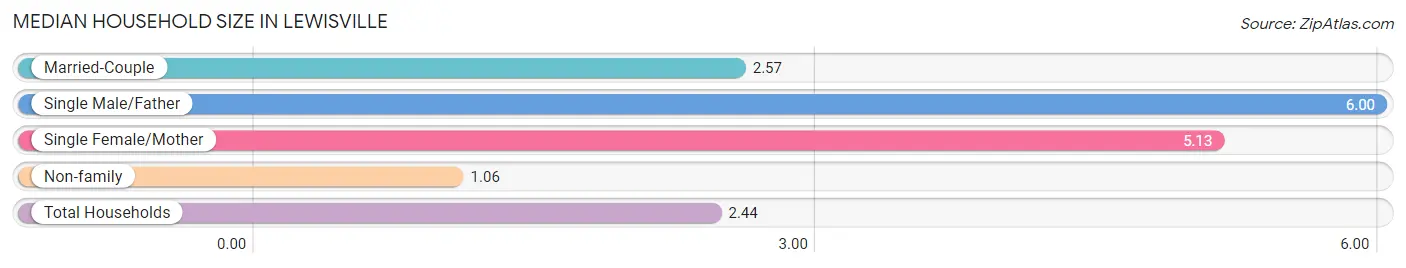
The median household size in Lewisville is 2.44 persons per household, with single male/father households (1 | 0.9%) accounting for the largest median household size of 6 persons per household. non-family households (51 | 45.5%) represent the smallest median household size with 1.06 persons per household.
| Household Type | # Households | Household Size |
| Married-Couple | 37 (33.0%) | 2.57 |
| Single Male/Father | 1 (0.9%) | 6.00 |
| Single Female/Mother | 23 (20.5%) | 5.13 |
| Non-family | 51 (45.5%) | 1.06 |
| Total Households | 112 (100.0%) | 2.44 |
Household Size by Marriage Status in Lewisville
Out of a total of 112 households in Lewisville, 61 (54.5%) are family households, while 51 (45.5%) are nonfamily households. The most numerous type of family households are 2-person households, comprising 29, and the most common type of nonfamily households are 1-person households, comprising 49.
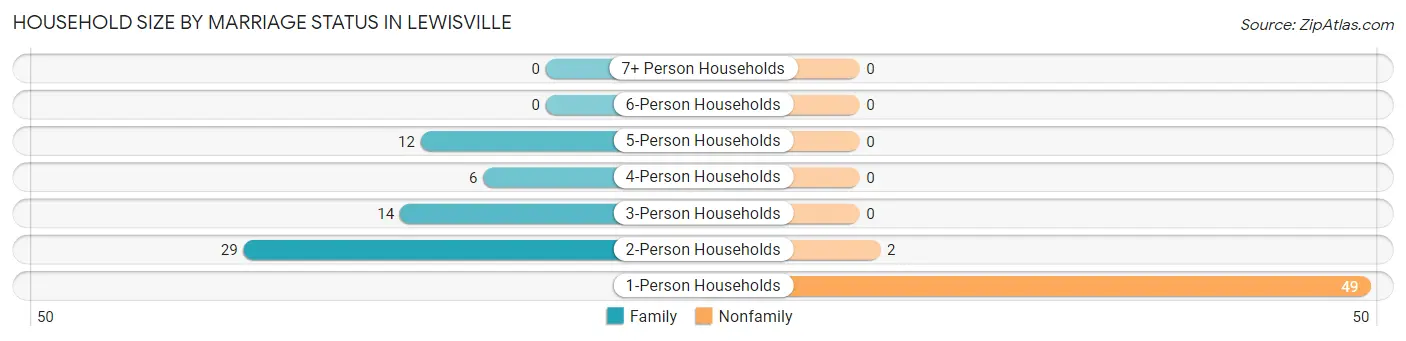
| Household Size | Family Households | Nonfamily Households |
| 1-Person Households | - | 49 (43.8%) |
| 2-Person Households | 29 (25.9%) | 2 (1.8%) |
| 3-Person Households | 14 (12.5%) | 0 (0.0%) |
| 4-Person Households | 6 (5.4%) | 0 (0.0%) |
| 5-Person Households | 12 (10.7%) | 0 (0.0%) |
| 6-Person Households | 0 (0.0%) | 0 (0.0%) |
| 7+ Person Households | 0 (0.0%) | 0 (0.0%) |
| Total | 61 (54.5%) | 51 (45.5%) |
Female Fertility in Lewisville
Fertility by Age in Lewisville
Average fertility rate in Lewisville is 48.0 births per 1,000 women. Women in the age bracket of 20 to 34 years have the highest fertility rate with 154.0 births per 1,000 women. Women in the age bracket of 20 to 34 years acount for 100.0% of all women with births.
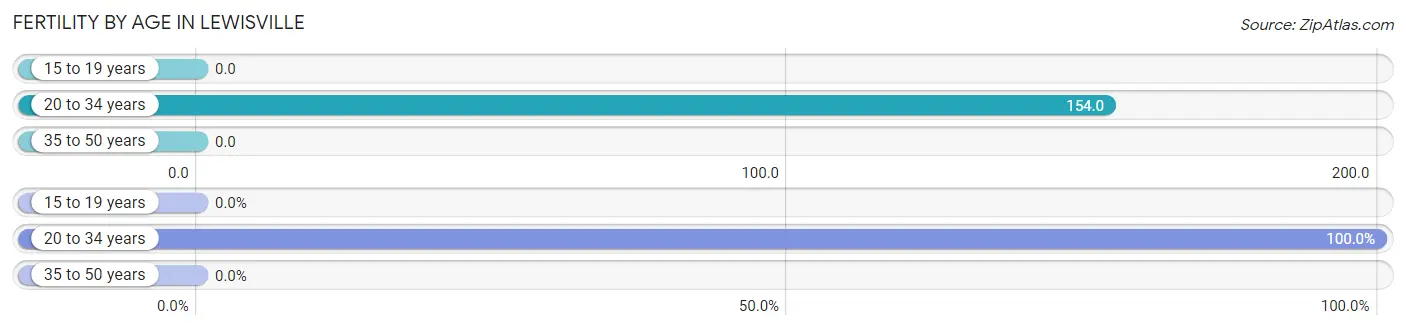
| Age Bracket | Women with Births | Births / 1,000 Women |
| 15 to 19 years | 0 (0.0%) | 0.0 |
| 20 to 34 years | 2 (100.0%) | 154.0 |
| 35 to 50 years | 0 (0.0%) | 0.0 |
| Total | 2 (100.0%) | 48.0 |
Fertility by Age by Marriage Status in Lewisville
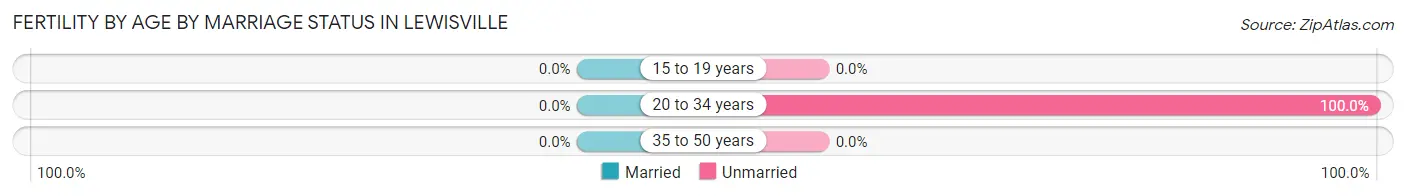
| Age Bracket | Married | Unmarried |
| 15 to 19 years | 0 (0.0%) | 0 (0.0%) |
| 20 to 34 years | 0 (0.0%) | 2 (100.0%) |
| 35 to 50 years | 0 (0.0%) | 0 (0.0%) |
| Total | 0 (0.0%) | 2 (100.0%) |
Fertility by Education in Lewisville
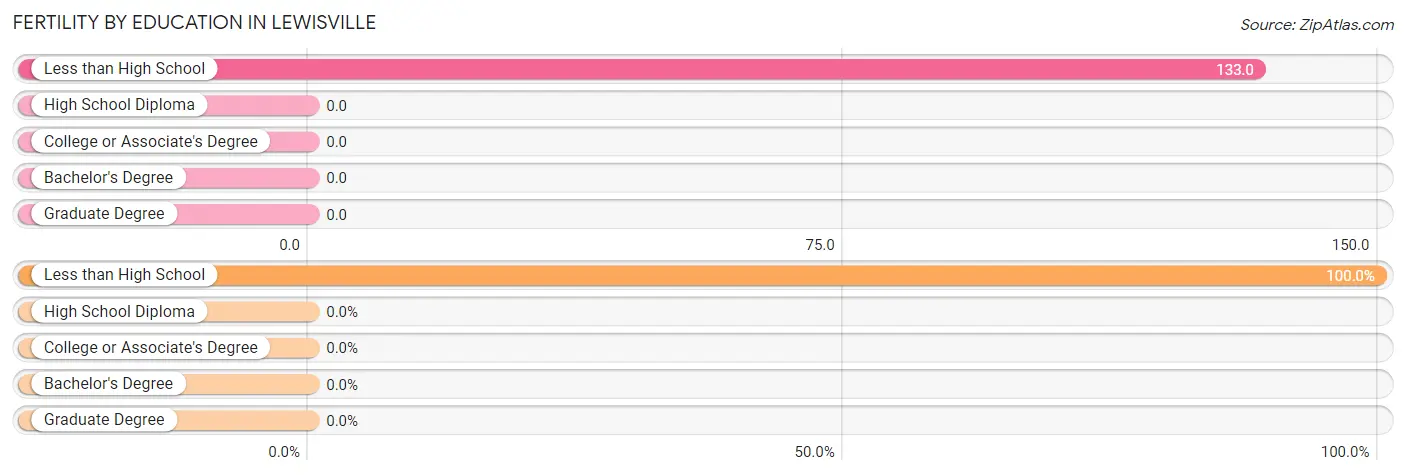
| Educational Attainment | Women with Births | Births / 1,000 Women |
| Less than High School | 2 (100.0%) | 133.0 |
| High School Diploma | 0 (0.0%) | 0.0 |
| College or Associate's Degree | 0 (0.0%) | 0.0 |
| Bachelor's Degree | 0 (0.0%) | 0.0 |
| Graduate Degree | 0 (0.0%) | 0.0 |
| Total | 2 (100.0%) | 48.0 |
Fertility by Education by Marriage Status in Lewisville
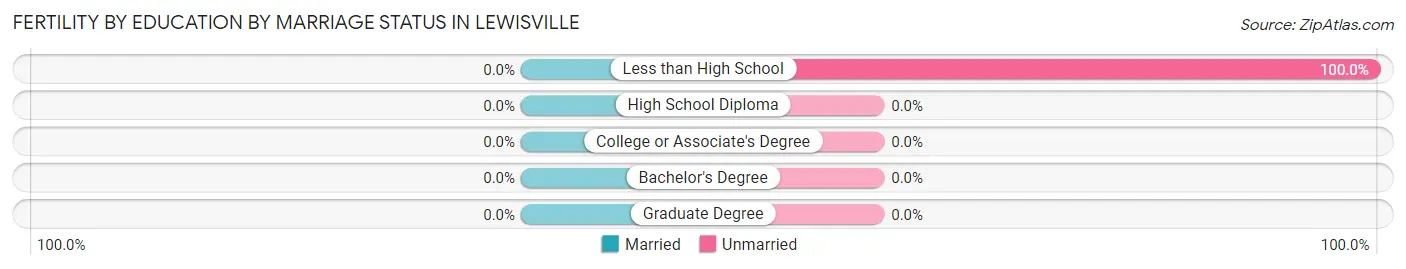
| Educational Attainment | Married | Unmarried |
| Less than High School | 0 (0.0%) | 2 (100.0%) |
| High School Diploma | 0 (0.0%) | 0 (0.0%) |
| College or Associate's Degree | 0 (0.0%) | 0 (0.0%) |
| Bachelor's Degree | 0 (0.0%) | 0 (0.0%) |
| Graduate Degree | 0 (0.0%) | 0 (0.0%) |
| Total | 0 (0.0%) | 2 (100.0%) |
Employment Characteristics in Lewisville
Employment by Class of Employer in Lewisville
Among the 105 employed individuals in Lewisville, private company employees (89 | 84.8%), not-for-profit organizations (10 | 9.5%), and self-employed (incorporated) (2 | 1.9%) make up the most common classes of employment.
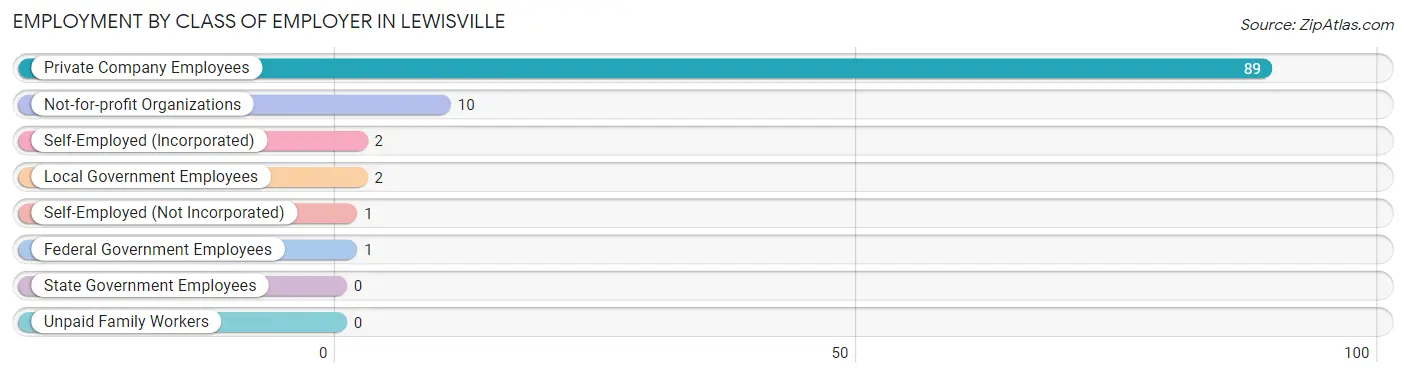
| Employer Class | # Employees | % Employees |
| Private Company Employees | 89 | 84.8% |
| Self-Employed (Incorporated) | 2 | 1.9% |
| Self-Employed (Not Incorporated) | 1 | 0.9% |
| Not-for-profit Organizations | 10 | 9.5% |
| Local Government Employees | 2 | 1.9% |
| State Government Employees | 0 | 0.0% |
| Federal Government Employees | 1 | 0.9% |
| Unpaid Family Workers | 0 | 0.0% |
| Total | 105 | 100.0% |
Employment Status by Age in Lewisville
According to the labor force statistics for Lewisville, out of the total population over 16 years of age (226), 47.8% or 108 individuals are in the labor force, with 1.9% or 2 of them unemployed. The age group with the highest labor force participation rate is 55 to 59 years, with 92.3% or 12 individuals in the labor force. Within the labor force, the 45 to 54 years age range has the highest percentage of unemployed individuals, with 11.8% or 2 of them being unemployed.
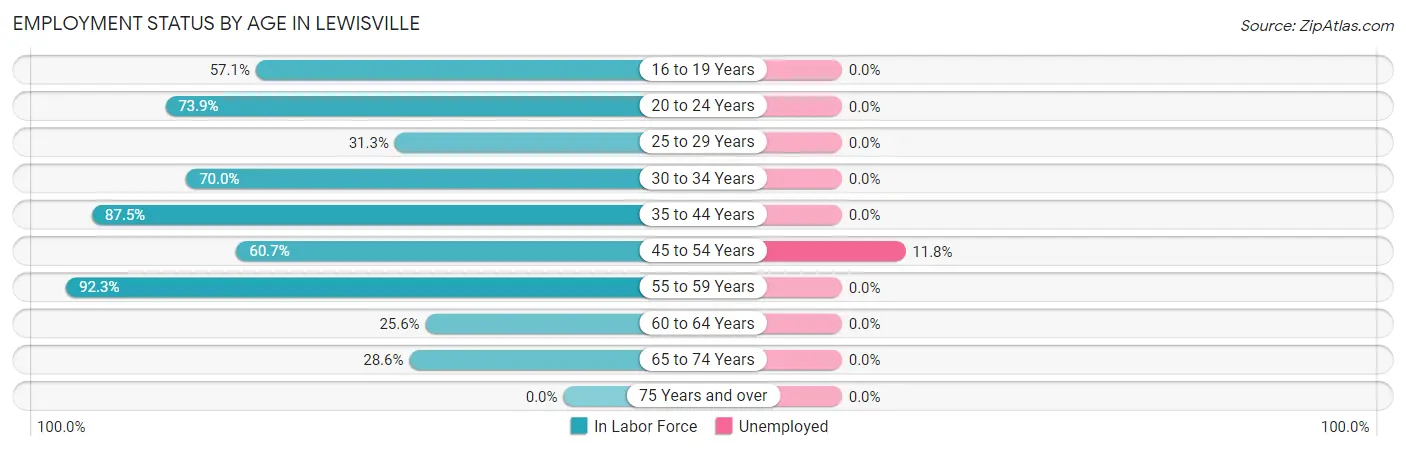
| Age Bracket | In Labor Force | Unemployed |
| 16 to 19 Years | 4 (57.1%) | 0 (0.0%) |
| 20 to 24 Years | 17 (73.9%) | 0 (0.0%) |
| 25 to 29 Years | 5 (31.3%) | 0 (0.0%) |
| 30 to 34 Years | 7 (70.0%) | 0 (0.0%) |
| 35 to 44 Years | 28 (87.5%) | 0 (0.0%) |
| 45 to 54 Years | 17 (60.7%) | 2 (11.8%) |
| 55 to 59 Years | 12 (92.3%) | 0 (0.0%) |
| 60 to 64 Years | 10 (25.6%) | 0 (0.0%) |
| 65 to 74 Years | 8 (28.6%) | 0 (0.0%) |
| 75 Years and over | 0 (0.0%) | 0 (0.0%) |
| Total | 108 (47.8%) | 2 (1.9%) |
Employment Status by Educational Attainment in Lewisville
According to labor force statistics for Lewisville, 57.2% of individuals (79) out of the total population between 25 and 64 years of age (138) are in the labor force, with 2.5% or 2 of them being unemployed. The group with the highest labor force participation rate are those with the educational attainment of college / associate degree, with 87.2% or 34 individuals in the labor force. Within the labor force, individuals with college / associate degree education have the highest percentage of unemployment, with 5.9% or 2 of them being unemployed.
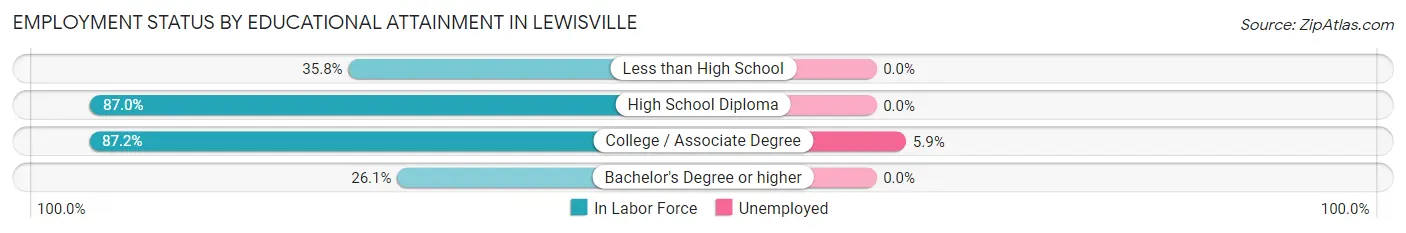
| Educational Attainment | In Labor Force | Unemployed |
| Less than High School | 19 (35.8%) | 0 (0.0%) |
| High School Diploma | 20 (87.0%) | 0 (0.0%) |
| College / Associate Degree | 34 (87.2%) | 2 (5.9%) |
| Bachelor's Degree or higher | 6 (26.1%) | 0 (0.0%) |
| Total | 79 (57.2%) | 3 (2.5%) |
Employment Occupations by Sex in Lewisville
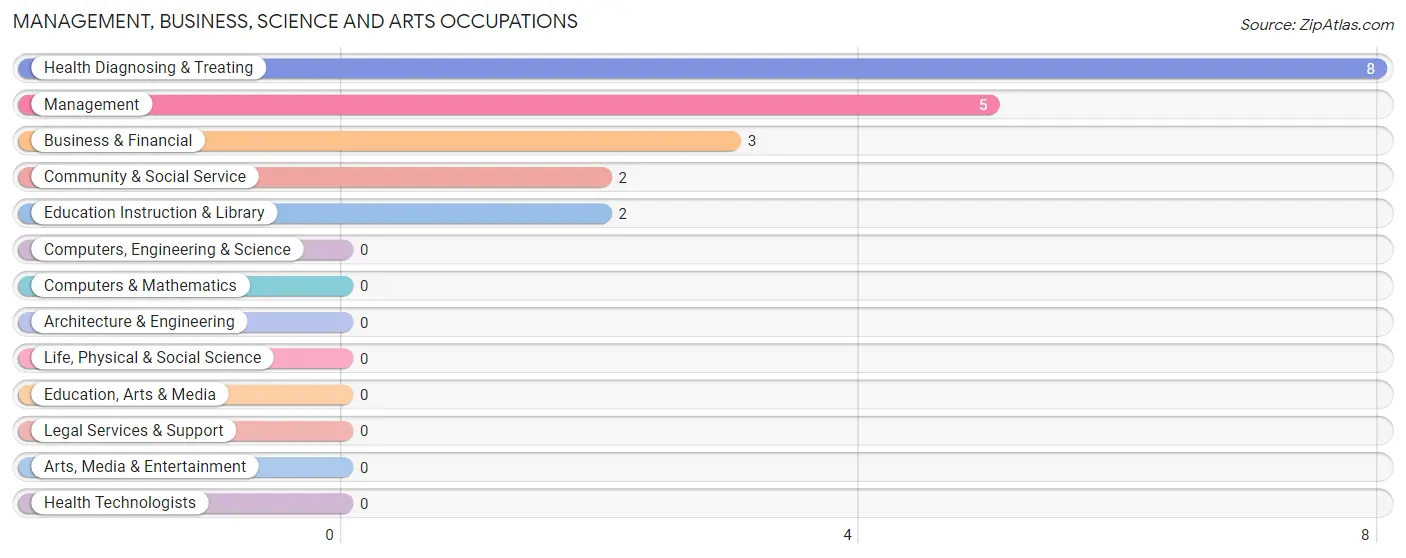
Management, Business, Science and Arts Occupations
The most common Management, Business, Science and Arts occupations in Lewisville are Health Diagnosing & Treating (8 | 7.5%), Management (5 | 4.7%), Business & Financial (3 | 2.8%), Community & Social Service (2 | 1.9%), and Education Instruction & Library (2 | 1.9%).
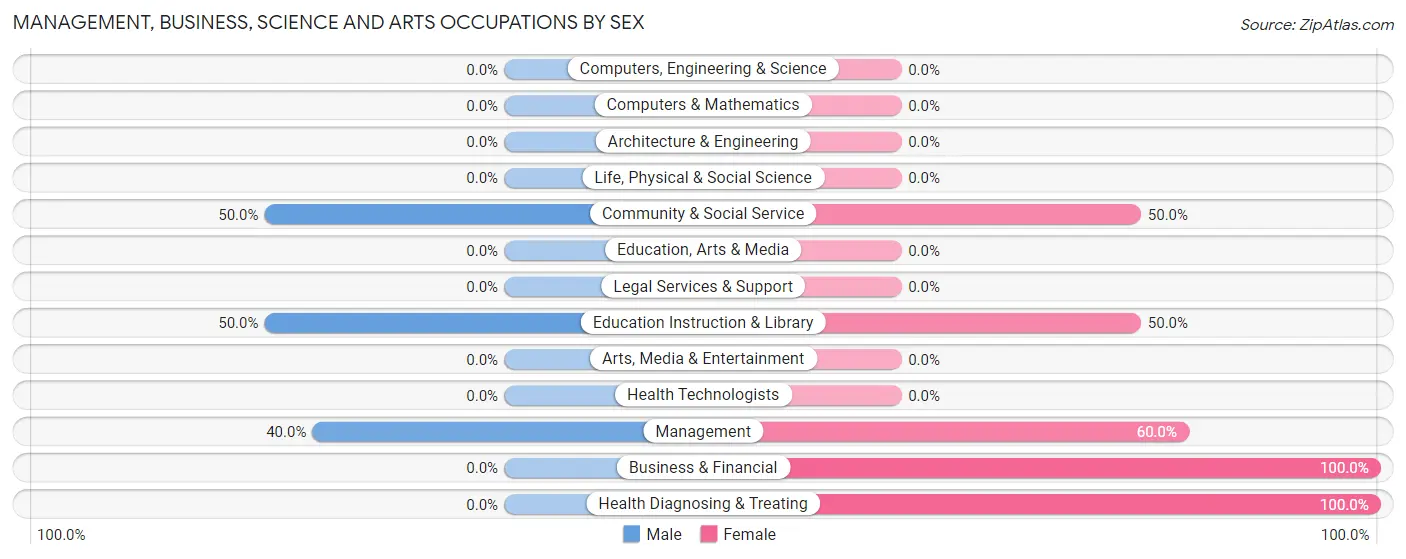
Management, Business, Science and Arts Occupations by Sex
Within the Management, Business, Science and Arts occupations in Lewisville, the most male-oriented occupations are Community & Social Service (50.0%), Education Instruction & Library (50.0%), and Management (40.0%), while the most female-oriented occupations are Business & Financial (100.0%), Health Diagnosing & Treating (100.0%), and Management (60.0%).
| Occupation | Male | Female |
| Management | 2 (40.0%) | 3 (60.0%) |
| Business & Financial | 0 (0.0%) | 3 (100.0%) |
| Computers, Engineering & Science | 0 (0.0%) | 0 (0.0%) |
| Computers & Mathematics | 0 (0.0%) | 0 (0.0%) |
| Architecture & Engineering | 0 (0.0%) | 0 (0.0%) |
| Life, Physical & Social Science | 0 (0.0%) | 0 (0.0%) |
| Community & Social Service | 1 (50.0%) | 1 (50.0%) |
| Education, Arts & Media | 0 (0.0%) | 0 (0.0%) |
| Legal Services & Support | 0 (0.0%) | 0 (0.0%) |
| Education Instruction & Library | 1 (50.0%) | 1 (50.0%) |
| Arts, Media & Entertainment | 0 (0.0%) | 0 (0.0%) |
| Health Diagnosing & Treating | 0 (0.0%) | 8 (100.0%) |
| Health Technologists | 0 (0.0%) | 0 (0.0%) |
| Total (Category) | 3 (16.7%) | 15 (83.3%) |
| Total (Overall) | 79 (74.5%) | 27 (25.5%) |
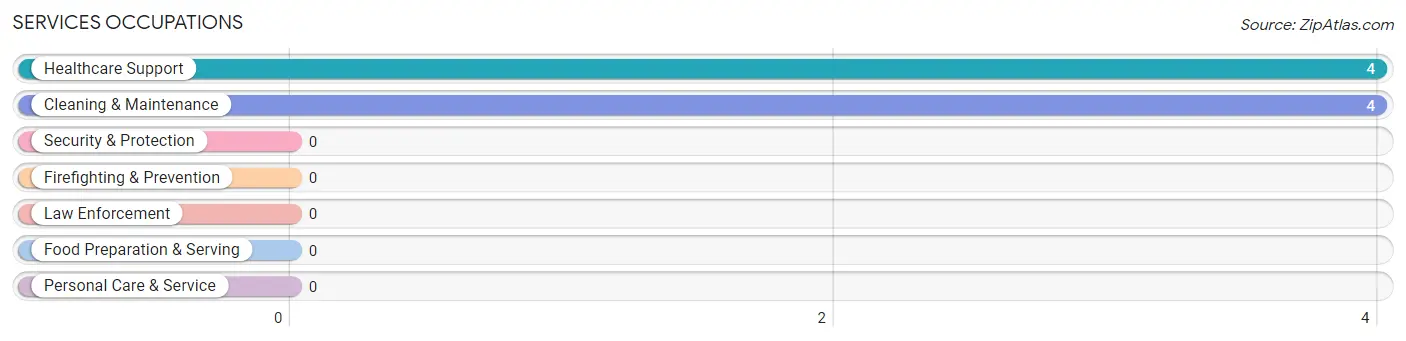
Services Occupations
The most common Services occupations in Lewisville are Healthcare Support (4 | 3.8%), and Cleaning & Maintenance (4 | 3.8%).
Services Occupations by Sex
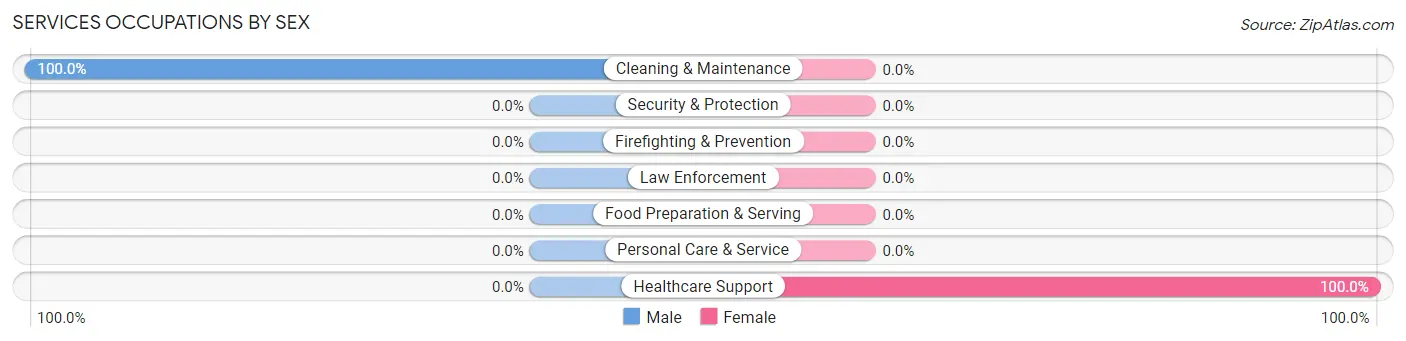
| Occupation | Male | Female |
| Healthcare Support | 0 (0.0%) | 4 (100.0%) |
| Security & Protection | 0 (0.0%) | 0 (0.0%) |
| Firefighting & Prevention | 0 (0.0%) | 0 (0.0%) |
| Law Enforcement | 0 (0.0%) | 0 (0.0%) |
| Food Preparation & Serving | 0 (0.0%) | 0 (0.0%) |
| Cleaning & Maintenance | 4 (100.0%) | 0 (0.0%) |
| Personal Care & Service | 0 (0.0%) | 0 (0.0%) |
| Total (Category) | 4 (50.0%) | 4 (50.0%) |
| Total (Overall) | 79 (74.5%) | 27 (25.5%) |
Sales and Office Occupations
The most common Sales and Office occupations in Lewisville are Sales & Related (20 | 18.9%), and Office & Administration (2 | 1.9%).

Sales and Office Occupations by Sex

| Occupation | Male | Female |
| Sales & Related | 20 (100.0%) | 0 (0.0%) |
| Office & Administration | 0 (0.0%) | 2 (100.0%) |
| Total (Category) | 20 (90.9%) | 2 (9.1%) |
| Total (Overall) | 79 (74.5%) | 27 (25.5%) |
Natural Resources, Construction and Maintenance Occupations
The most common Natural Resources, Construction and Maintenance occupations in Lewisville are Construction & Extraction (9 | 8.5%), Farming, Fishing & Forestry (6 | 5.7%), and Installation, Maintenance & Repair (3 | 2.8%).

Natural Resources, Construction and Maintenance Occupations by Sex

| Occupation | Male | Female |
| Farming, Fishing & Forestry | 4 (66.7%) | 2 (33.3%) |
| Construction & Extraction | 9 (100.0%) | 0 (0.0%) |
| Installation, Maintenance & Repair | 3 (100.0%) | 0 (0.0%) |
| Total (Category) | 16 (88.9%) | 2 (11.1%) |
| Total (Overall) | 79 (74.5%) | 27 (25.5%) |
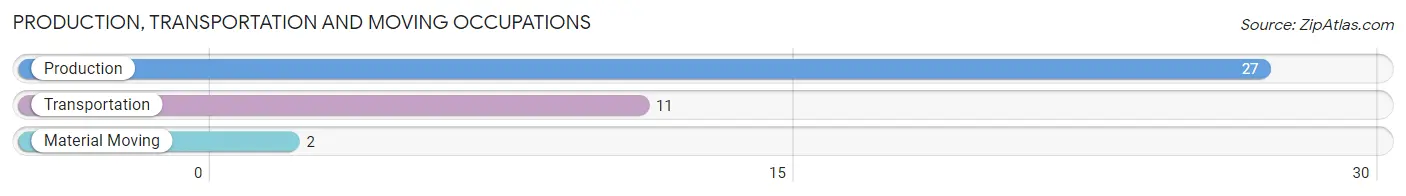
Production, Transportation and Moving Occupations
The most common Production, Transportation and Moving occupations in Lewisville are Production (27 | 25.5%), Transportation (11 | 10.4%), and Material Moving (2 | 1.9%).
Production, Transportation and Moving Occupations by Sex
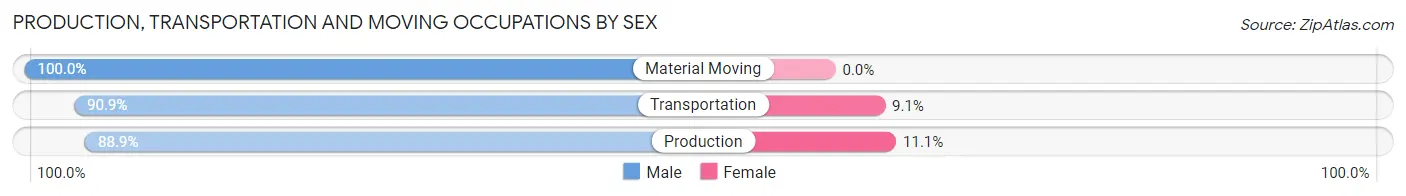
| Occupation | Male | Female |
| Production | 24 (88.9%) | 3 (11.1%) |
| Transportation | 10 (90.9%) | 1 (9.1%) |
| Material Moving | 2 (100.0%) | 0 (0.0%) |
| Total (Category) | 36 (90.0%) | 4 (10.0%) |
| Total (Overall) | 79 (74.5%) | 27 (25.5%) |
Employment Industries by Sex in Lewisville
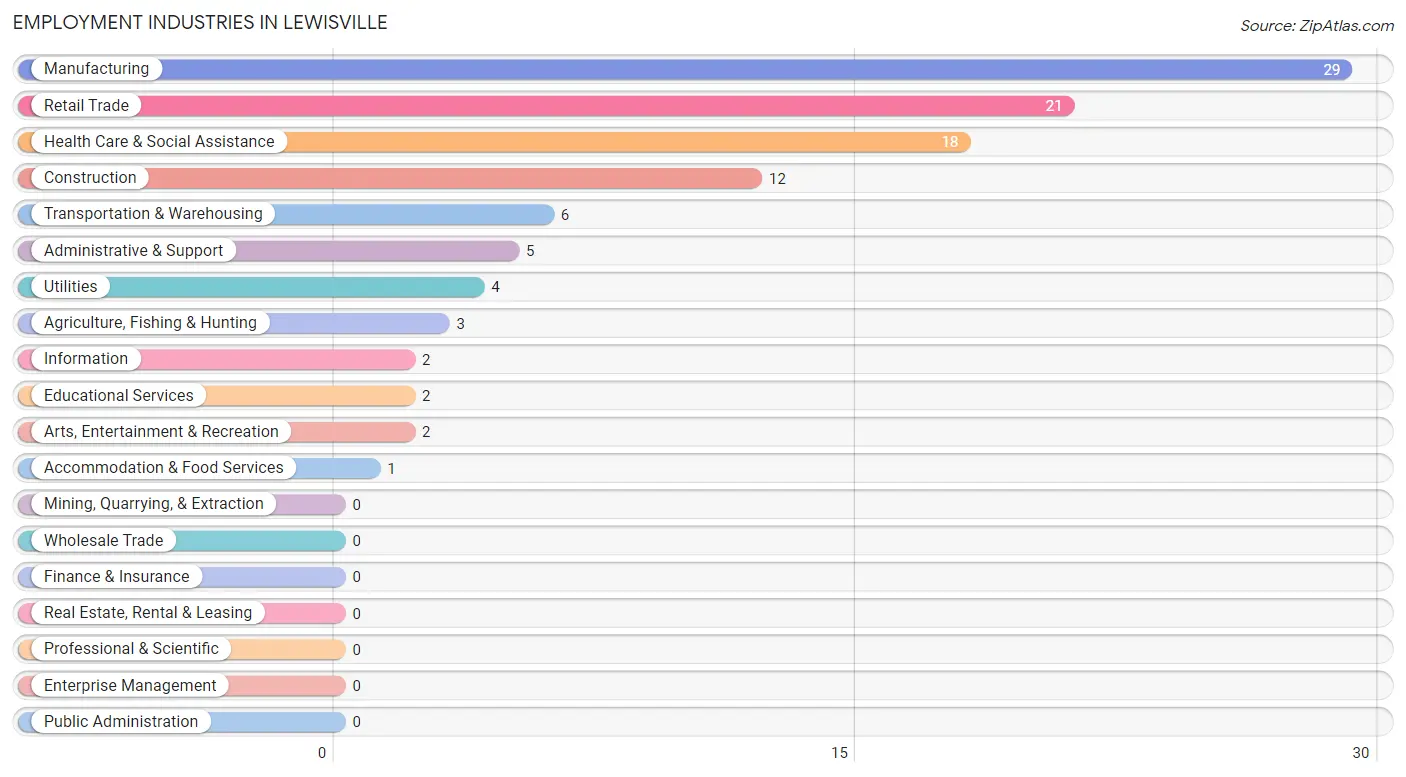
Employment Industries in Lewisville
The major employment industries in Lewisville include Manufacturing (29 | 27.4%), Retail Trade (21 | 19.8%), Health Care & Social Assistance (18 | 17.0%), Construction (12 | 11.3%), and Transportation & Warehousing (6 | 5.7%).
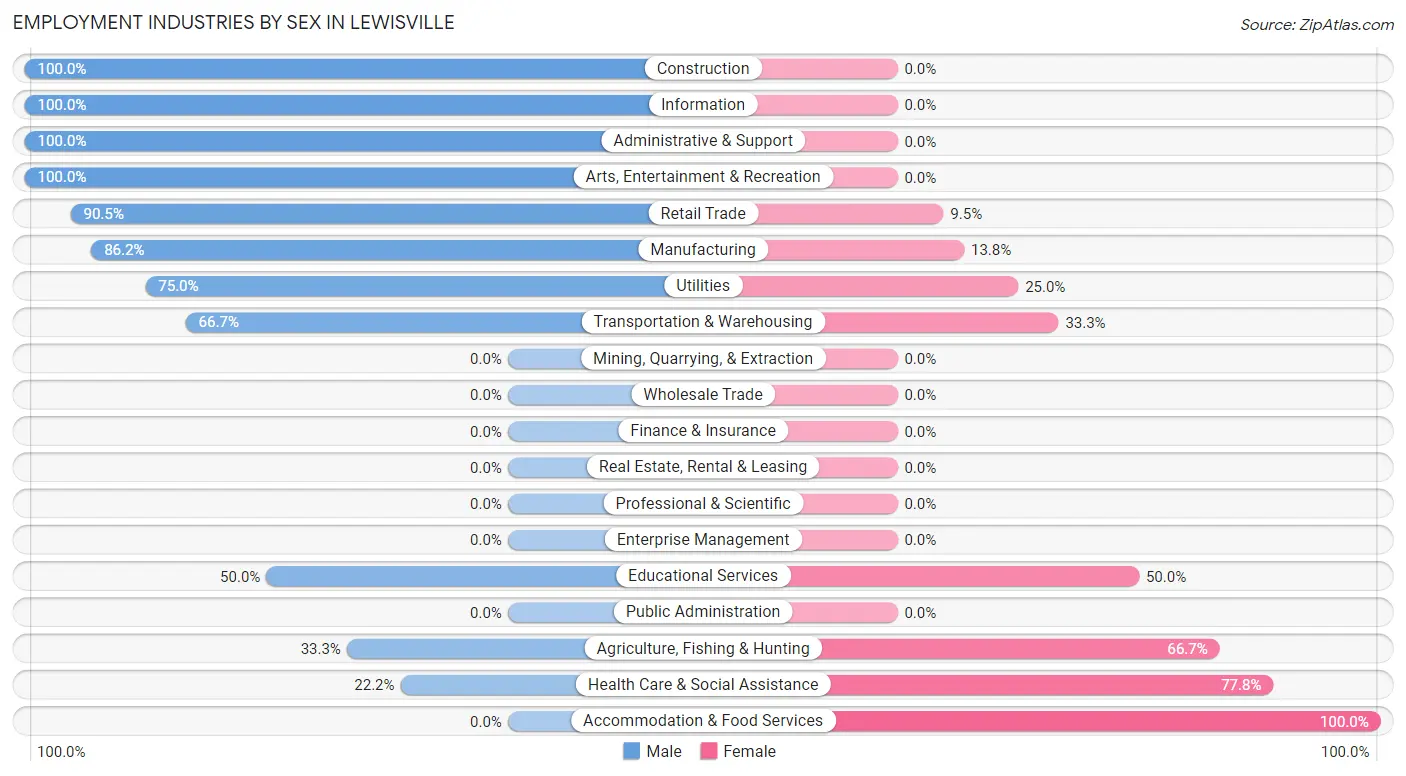
Employment Industries by Sex in Lewisville
The Lewisville industries that see more men than women are Construction (100.0%), Information (100.0%), and Administrative & Support (100.0%), whereas the industries that tend to have a higher number of women are Accommodation & Food Services (100.0%), Health Care & Social Assistance (77.8%), and Agriculture, Fishing & Hunting (66.7%).
| Industry | Male | Female |
| Agriculture, Fishing & Hunting | 1 (33.3%) | 2 (66.7%) |
| Mining, Quarrying, & Extraction | 0 (0.0%) | 0 (0.0%) |
| Construction | 12 (100.0%) | 0 (0.0%) |
| Manufacturing | 25 (86.2%) | 4 (13.8%) |
| Wholesale Trade | 0 (0.0%) | 0 (0.0%) |
| Retail Trade | 19 (90.5%) | 2 (9.5%) |
| Transportation & Warehousing | 4 (66.7%) | 2 (33.3%) |
| Utilities | 3 (75.0%) | 1 (25.0%) |
| Information | 2 (100.0%) | 0 (0.0%) |
| Finance & Insurance | 0 (0.0%) | 0 (0.0%) |
| Real Estate, Rental & Leasing | 0 (0.0%) | 0 (0.0%) |
| Professional & Scientific | 0 (0.0%) | 0 (0.0%) |
| Enterprise Management | 0 (0.0%) | 0 (0.0%) |
| Administrative & Support | 5 (100.0%) | 0 (0.0%) |
| Educational Services | 1 (50.0%) | 1 (50.0%) |
| Health Care & Social Assistance | 4 (22.2%) | 14 (77.8%) |
| Arts, Entertainment & Recreation | 2 (100.0%) | 0 (0.0%) |
| Accommodation & Food Services | 0 (0.0%) | 1 (100.0%) |
| Public Administration | 0 (0.0%) | 0 (0.0%) |
| Total | 79 (74.5%) | 27 (25.5%) |
Education in Lewisville
School Enrollment in Lewisville
The most common levels of schooling among the 35 students in Lewisville are elementary school (24 | 68.6%), high school (6 | 17.1%), and middle school (3 | 8.6%).
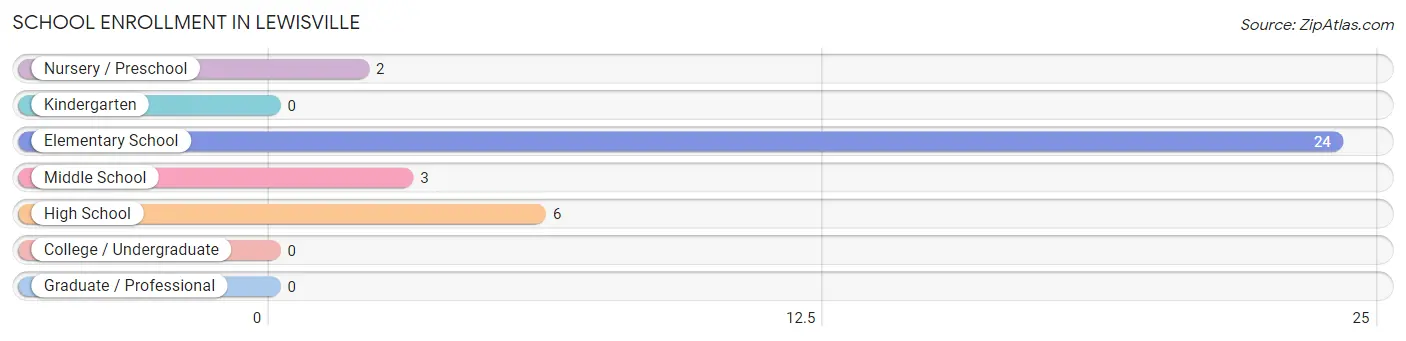
| School Level | # Students | % Students |
| Nursery / Preschool | 2 | 5.7% |
| Kindergarten | 0 | 0.0% |
| Elementary School | 24 | 68.6% |
| Middle School | 3 | 8.6% |
| High School | 6 | 17.1% |
| College / Undergraduate | 0 | 0.0% |
| Graduate / Professional | 0 | 0.0% |
| Total | 35 | 100.0% |
School Enrollment by Age by Funding Source in Lewisville
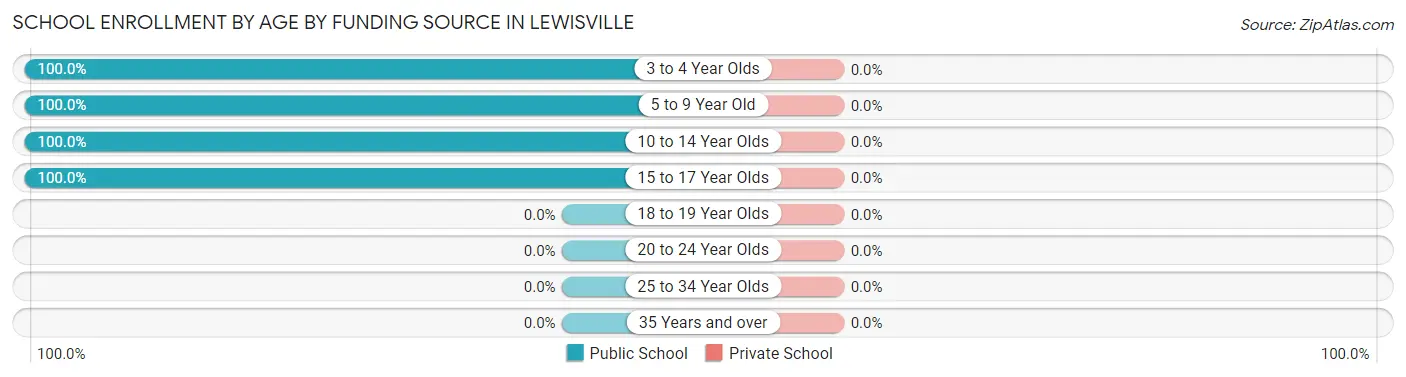
| Age Bracket | Public School | Private School |
| 3 to 4 Year Olds | 2 (100.0%) | 0 (0.0%) |
| 5 to 9 Year Old | 13 (100.0%) | 0 (0.0%) |
| 10 to 14 Year Olds | 14 (100.0%) | 0 (0.0%) |
| 15 to 17 Year Olds | 6 (100.0%) | 0 (0.0%) |
| 18 to 19 Year Olds | 0 (0.0%) | 0 (0.0%) |
| 20 to 24 Year Olds | 0 (0.0%) | 0 (0.0%) |
| 25 to 34 Year Olds | 0 (0.0%) | 0 (0.0%) |
| 35 Years and over | 0 (0.0%) | 0 (0.0%) |
| Total | 35 (100.0%) | 0 (0.0%) |
Educational Attainment by Field of Study in Lewisville
Science & technology (13 | 50.0%), business (8 | 30.8%), liberal arts & history (2 | 7.7%), bio, nature & agricultural (1 | 3.8%), and education (1 | 3.8%) are the most common fields of study among 26 individuals in Lewisville who have obtained a bachelor's degree or higher.
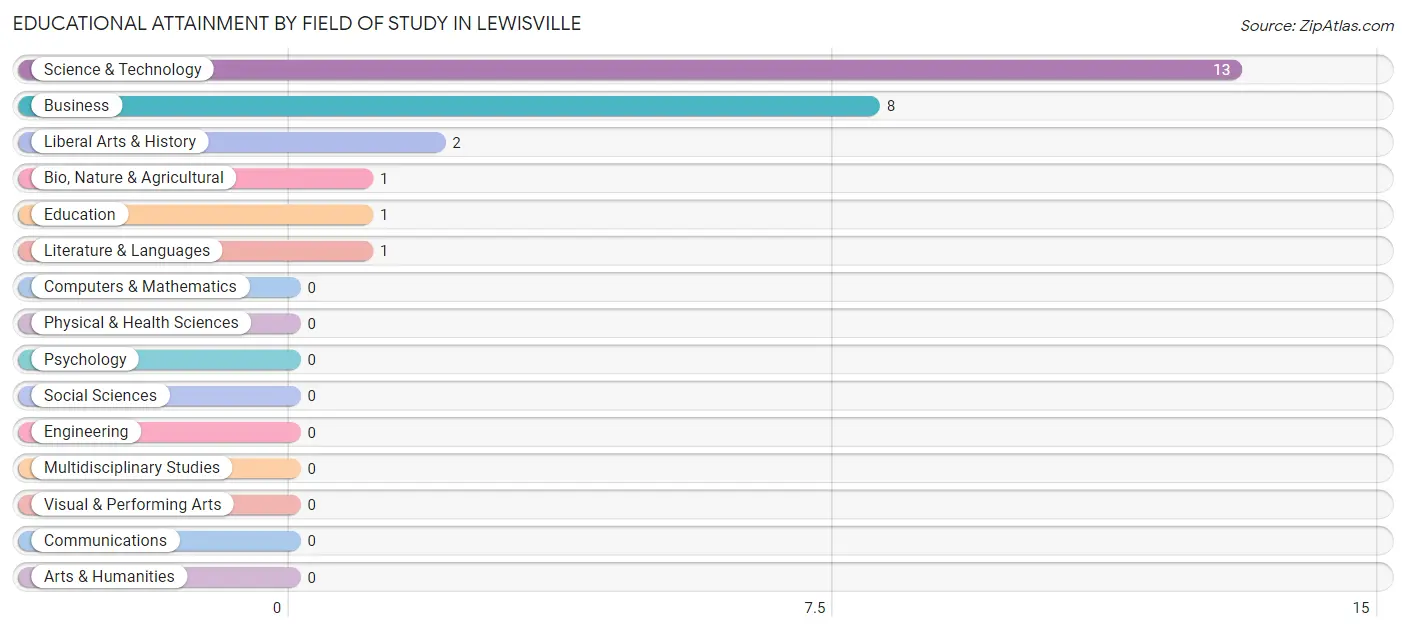
| Field of Study | # Graduates | % Graduates |
| Computers & Mathematics | 0 | 0.0% |
| Bio, Nature & Agricultural | 1 | 3.8% |
| Physical & Health Sciences | 0 | 0.0% |
| Psychology | 0 | 0.0% |
| Social Sciences | 0 | 0.0% |
| Engineering | 0 | 0.0% |
| Multidisciplinary Studies | 0 | 0.0% |
| Science & Technology | 13 | 50.0% |
| Business | 8 | 30.8% |
| Education | 1 | 3.8% |
| Literature & Languages | 1 | 3.8% |
| Liberal Arts & History | 2 | 7.7% |
| Visual & Performing Arts | 0 | 0.0% |
| Communications | 0 | 0.0% |
| Arts & Humanities | 0 | 0.0% |
| Total | 26 | 100.0% |
Transportation & Commute in Lewisville
Vehicle Availability by Sex in Lewisville
The most prevalent vehicle ownership categories in Lewisville are males with 2 vehicles (50, accounting for 64.1%) and females with 2 vehicles (6, making up 185.2%).
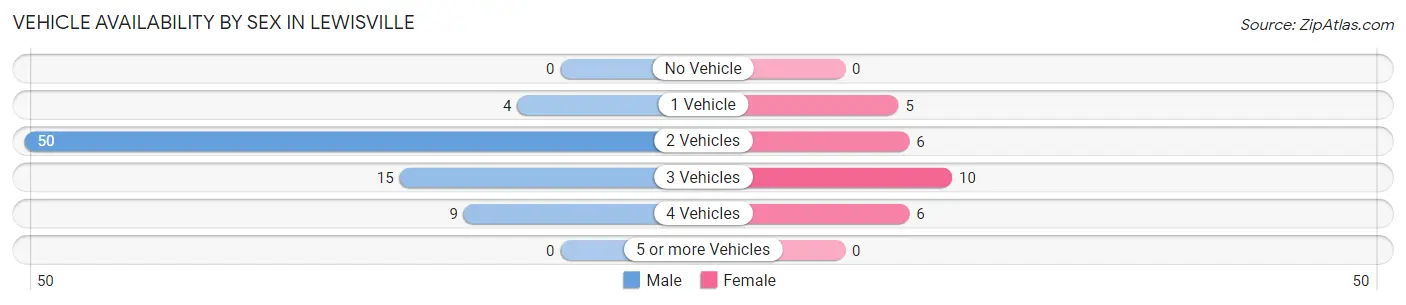
| Vehicles Available | Male | Female |
| No Vehicle | 0 (0.0%) | 0 (0.0%) |
| 1 Vehicle | 4 (5.1%) | 5 (18.5%) |
| 2 Vehicles | 50 (64.1%) | 6 (22.2%) |
| 3 Vehicles | 15 (19.2%) | 10 (37.0%) |
| 4 Vehicles | 9 (11.5%) | 6 (22.2%) |
| 5 or more Vehicles | 0 (0.0%) | 0 (0.0%) |
| Total | 78 (100.0%) | 27 (100.0%) |
Commute Time in Lewisville
The most frequently occuring commute durations in Lewisville are 25 to 29 minutes (22 commuters, 20.9%), 15 to 19 minutes (19 commuters, 18.1%), and 10 to 14 minutes (18 commuters, 17.1%).
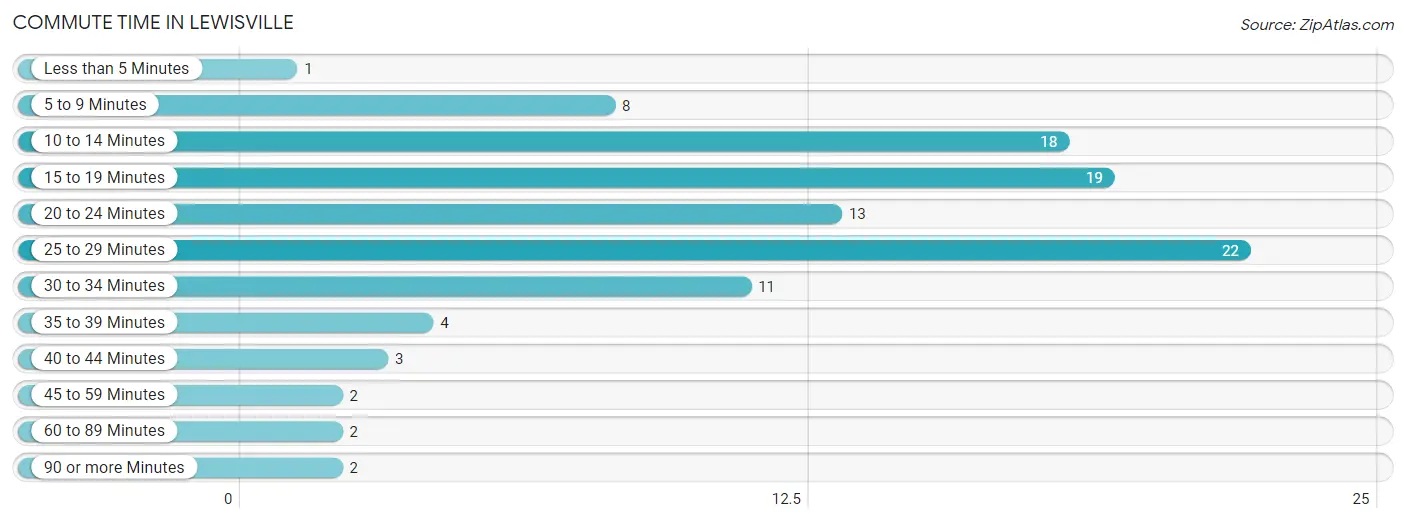
| Commute Time | # Commuters | % Commuters |
| Less than 5 Minutes | 1 | 0.9% |
| 5 to 9 Minutes | 8 | 7.6% |
| 10 to 14 Minutes | 18 | 17.1% |
| 15 to 19 Minutes | 19 | 18.1% |
| 20 to 24 Minutes | 13 | 12.4% |
| 25 to 29 Minutes | 22 | 20.9% |
| 30 to 34 Minutes | 11 | 10.5% |
| 35 to 39 Minutes | 4 | 3.8% |
| 40 to 44 Minutes | 3 | 2.9% |
| 45 to 59 Minutes | 2 | 1.9% |
| 60 to 89 Minutes | 2 | 1.9% |
| 90 or more Minutes | 2 | 1.9% |
Commute Time by Sex in Lewisville
The most common commute times in Lewisville are 25 to 29 minutes (22 commuters, 28.2%) for males and 15 to 19 minutes (14 commuters, 51.8%) for females.
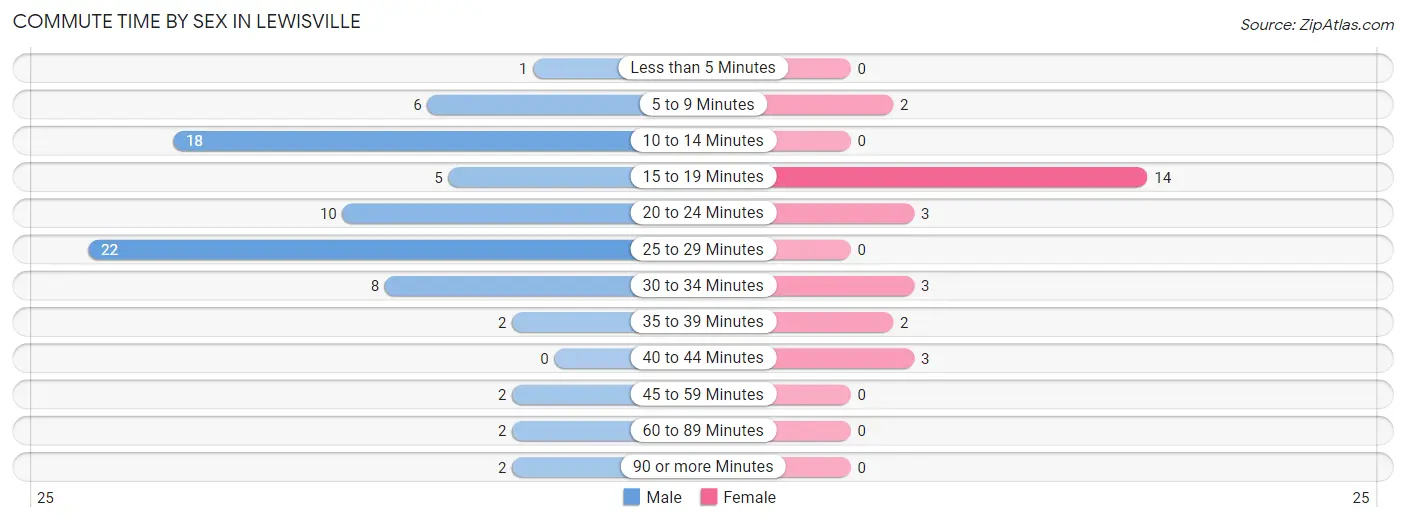
| Commute Time | Male | Female |
| Less than 5 Minutes | 1 (1.3%) | 0 (0.0%) |
| 5 to 9 Minutes | 6 (7.7%) | 2 (7.4%) |
| 10 to 14 Minutes | 18 (23.1%) | 0 (0.0%) |
| 15 to 19 Minutes | 5 (6.4%) | 14 (51.8%) |
| 20 to 24 Minutes | 10 (12.8%) | 3 (11.1%) |
| 25 to 29 Minutes | 22 (28.2%) | 0 (0.0%) |
| 30 to 34 Minutes | 8 (10.3%) | 3 (11.1%) |
| 35 to 39 Minutes | 2 (2.6%) | 2 (7.4%) |
| 40 to 44 Minutes | 0 (0.0%) | 3 (11.1%) |
| 45 to 59 Minutes | 2 (2.6%) | 0 (0.0%) |
| 60 to 89 Minutes | 2 (2.6%) | 0 (0.0%) |
| 90 or more Minutes | 2 (2.6%) | 0 (0.0%) |
Time of Departure to Work by Sex in Lewisville
The most frequent times of departure to work in Lewisville are 6:00 AM to 6:29 AM (22, 28.2%) for males and 5:00 AM to 5:29 AM (7, 25.9%) for females.
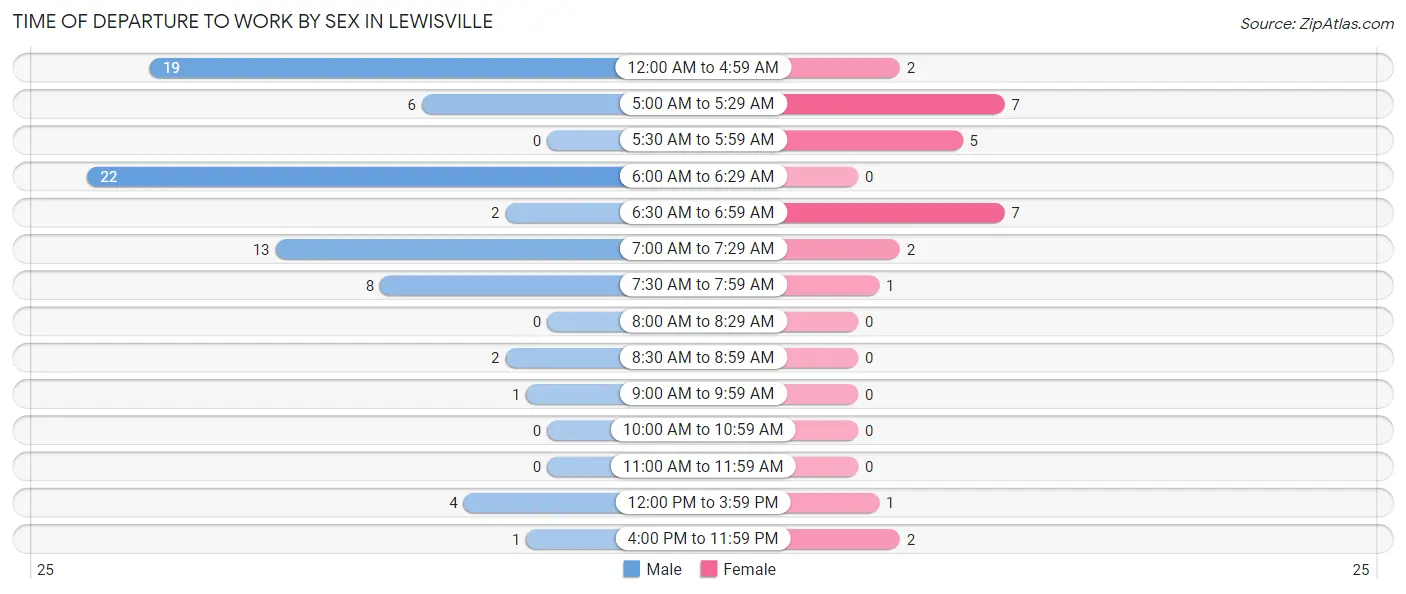
| Time of Departure | Male | Female |
| 12:00 AM to 4:59 AM | 19 (24.4%) | 2 (7.4%) |
| 5:00 AM to 5:29 AM | 6 (7.7%) | 7 (25.9%) |
| 5:30 AM to 5:59 AM | 0 (0.0%) | 5 (18.5%) |
| 6:00 AM to 6:29 AM | 22 (28.2%) | 0 (0.0%) |
| 6:30 AM to 6:59 AM | 2 (2.6%) | 7 (25.9%) |
| 7:00 AM to 7:29 AM | 13 (16.7%) | 2 (7.4%) |
| 7:30 AM to 7:59 AM | 8 (10.3%) | 1 (3.7%) |
| 8:00 AM to 8:29 AM | 0 (0.0%) | 0 (0.0%) |
| 8:30 AM to 8:59 AM | 2 (2.6%) | 0 (0.0%) |
| 9:00 AM to 9:59 AM | 1 (1.3%) | 0 (0.0%) |
| 10:00 AM to 10:59 AM | 0 (0.0%) | 0 (0.0%) |
| 11:00 AM to 11:59 AM | 0 (0.0%) | 0 (0.0%) |
| 12:00 PM to 3:59 PM | 4 (5.1%) | 1 (3.7%) |
| 4:00 PM to 11:59 PM | 1 (1.3%) | 2 (7.4%) |
| Total | 78 (100.0%) | 27 (100.0%) |
Housing Occupancy in Lewisville
Occupancy by Ownership in Lewisville
Of the total 112 dwellings in Lewisville, owner-occupied units account for 96 (85.7%), while renter-occupied units make up 16 (14.3%).
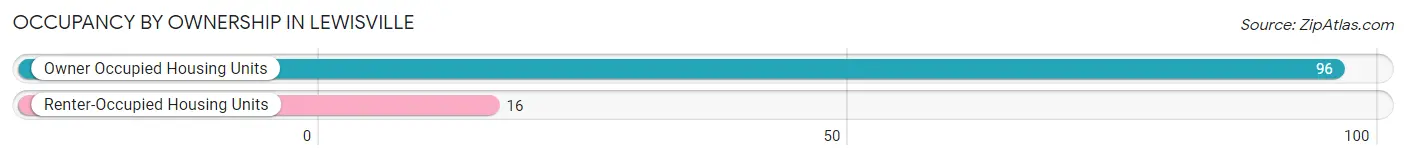
| Occupancy | # Housing Units | % Housing Units |
| Owner Occupied Housing Units | 96 | 85.7% |
| Renter-Occupied Housing Units | 16 | 14.3% |
| Total Occupied Housing Units | 112 | 100.0% |
Occupancy by Household Size in Lewisville
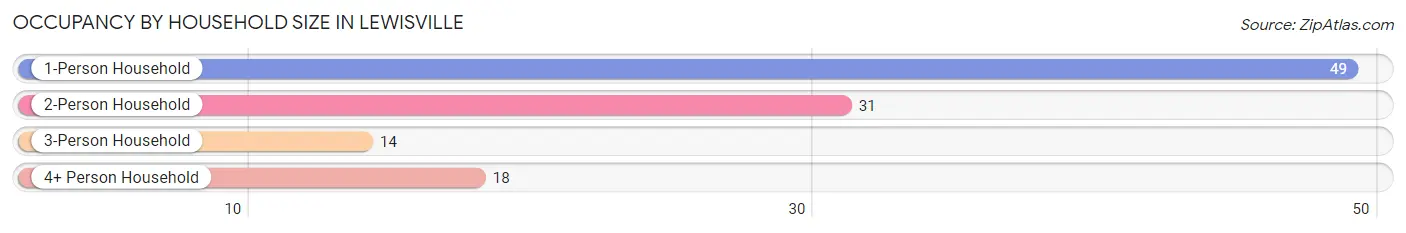
| Household Size | # Housing Units | % Housing Units |
| 1-Person Household | 49 | 43.8% |
| 2-Person Household | 31 | 27.7% |
| 3-Person Household | 14 | 12.5% |
| 4+ Person Household | 18 | 16.1% |
| Total Housing Units | 112 | 100.0% |
Occupancy by Ownership by Household Size in Lewisville
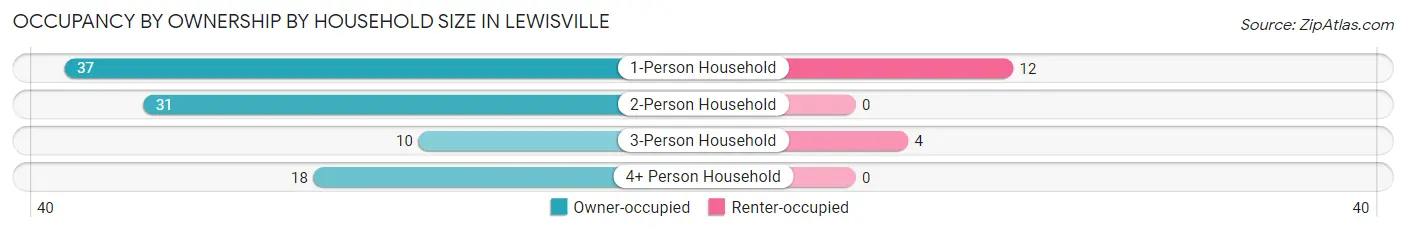
| Household Size | Owner-occupied | Renter-occupied |
| 1-Person Household | 37 (75.5%) | 12 (24.5%) |
| 2-Person Household | 31 (100.0%) | 0 (0.0%) |
| 3-Person Household | 10 (71.4%) | 4 (28.6%) |
| 4+ Person Household | 18 (100.0%) | 0 (0.0%) |
| Total Housing Units | 96 (85.7%) | 16 (14.3%) |
Occupancy by Educational Attainment in Lewisville
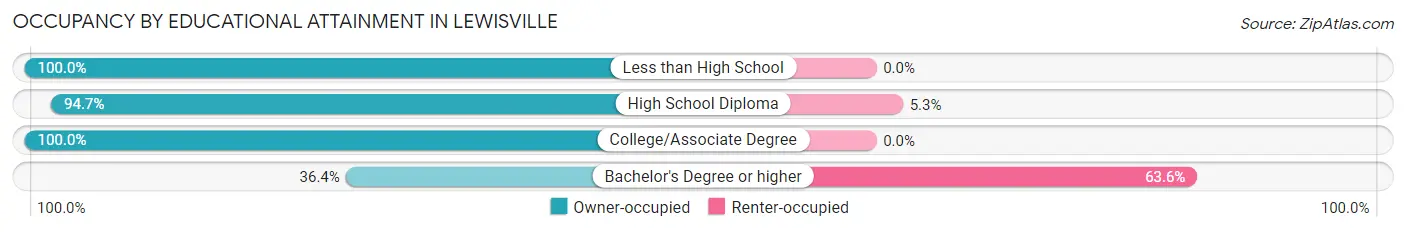
| Household Size | Owner-occupied | Renter-occupied |
| Less than High School | 19 (100.0%) | 0 (0.0%) |
| High School Diploma | 36 (94.7%) | 2 (5.3%) |
| College/Associate Degree | 33 (100.0%) | 0 (0.0%) |
| Bachelor's Degree or higher | 8 (36.4%) | 14 (63.6%) |
Occupancy by Age of Householder in Lewisville
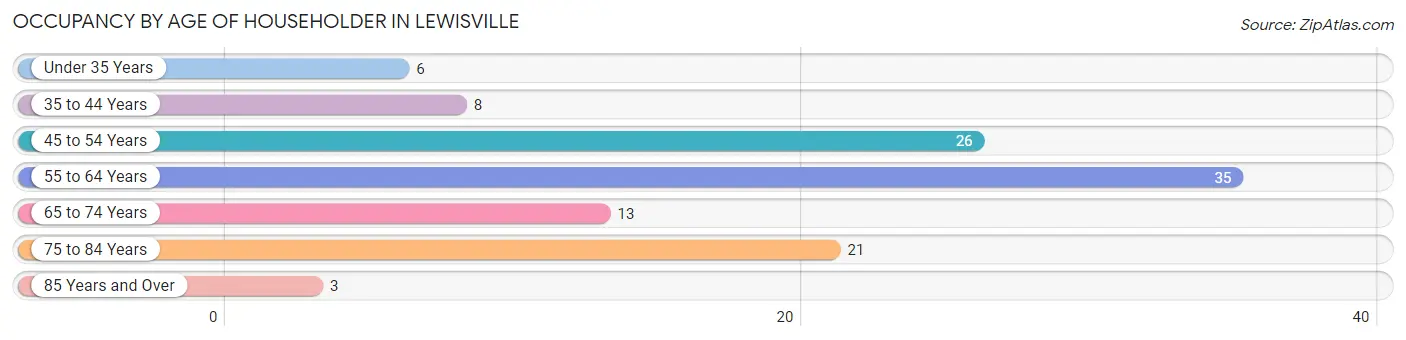
| Age Bracket | # Households | % Households |
| Under 35 Years | 6 | 5.4% |
| 35 to 44 Years | 8 | 7.1% |
| 45 to 54 Years | 26 | 23.2% |
| 55 to 64 Years | 35 | 31.2% |
| 65 to 74 Years | 13 | 11.6% |
| 75 to 84 Years | 21 | 18.8% |
| 85 Years and Over | 3 | 2.7% |
| Total | 112 | 100.0% |
Housing Finances in Lewisville
Median Income by Occupancy in Lewisville
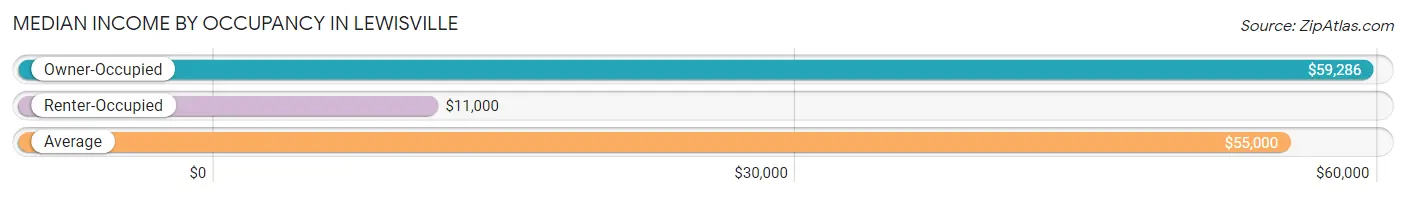
| Occupancy Type | # Households | Median Income |
| Owner-Occupied | 96 (85.7%) | $59,286 |
| Renter-Occupied | 16 (14.3%) | $11,000 |
| Average | 112 (100.0%) | $55,000 |
Occupancy by Householder Income Bracket in Lewisville
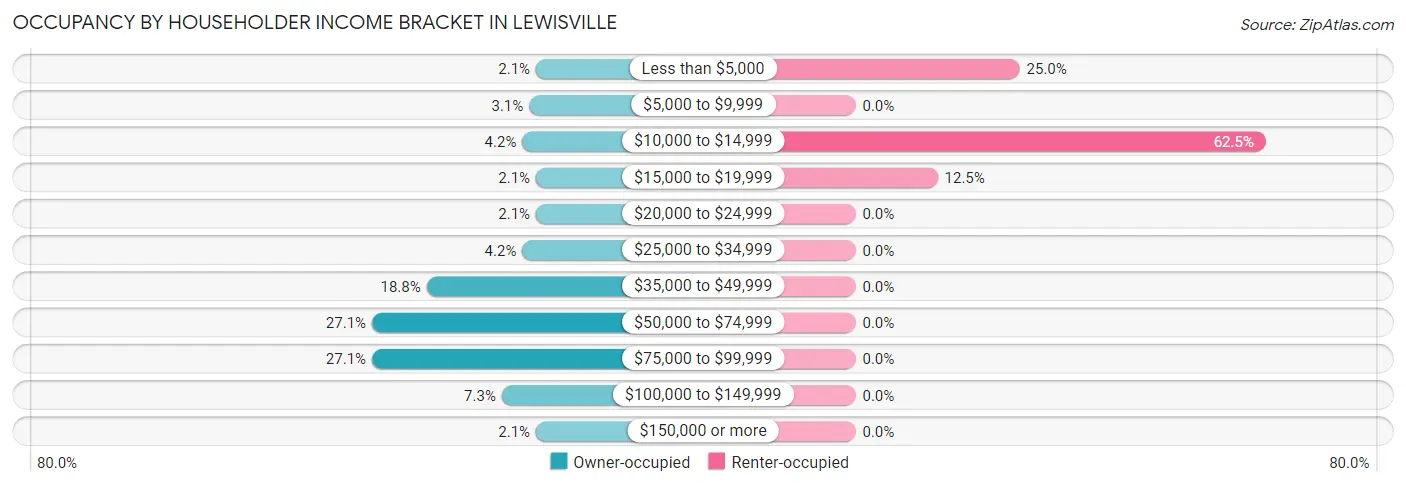
| Income Bracket | Owner-occupied | Renter-occupied |
| Less than $5,000 | 2 (2.1%) | 4 (25.0%) |
| $5,000 to $9,999 | 3 (3.1%) | 0 (0.0%) |
| $10,000 to $14,999 | 4 (4.2%) | 10 (62.5%) |
| $15,000 to $19,999 | 2 (2.1%) | 2 (12.5%) |
| $20,000 to $24,999 | 2 (2.1%) | 0 (0.0%) |
| $25,000 to $34,999 | 4 (4.2%) | 0 (0.0%) |
| $35,000 to $49,999 | 18 (18.8%) | 0 (0.0%) |
| $50,000 to $74,999 | 26 (27.1%) | 0 (0.0%) |
| $75,000 to $99,999 | 26 (27.1%) | 0 (0.0%) |
| $100,000 to $149,999 | 7 (7.3%) | 0 (0.0%) |
| $150,000 or more | 2 (2.1%) | 0 (0.0%) |
| Total | 96 (100.0%) | 16 (100.0%) |
Monthly Housing Cost Tiers in Lewisville
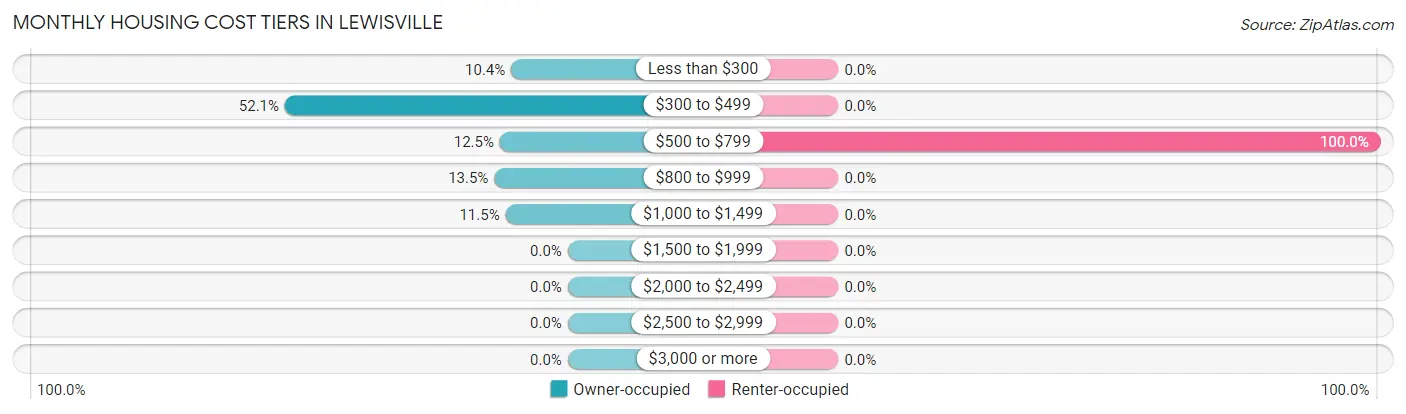
| Monthly Cost | Owner-occupied | Renter-occupied |
| Less than $300 | 10 (10.4%) | 0 (0.0%) |
| $300 to $499 | 50 (52.1%) | 0 (0.0%) |
| $500 to $799 | 12 (12.5%) | 16 (100.0%) |
| $800 to $999 | 13 (13.5%) | 0 (0.0%) |
| $1,000 to $1,499 | 11 (11.5%) | 0 (0.0%) |
| $1,500 to $1,999 | 0 (0.0%) | 0 (0.0%) |
| $2,000 to $2,499 | 0 (0.0%) | 0 (0.0%) |
| $2,500 to $2,999 | 0 (0.0%) | 0 (0.0%) |
| $3,000 or more | 0 (0.0%) | 0 (0.0%) |
| Total | 96 (100.0%) | 16 (100.0%) |
Physical Housing Characteristics in Lewisville
Housing Structures in Lewisville
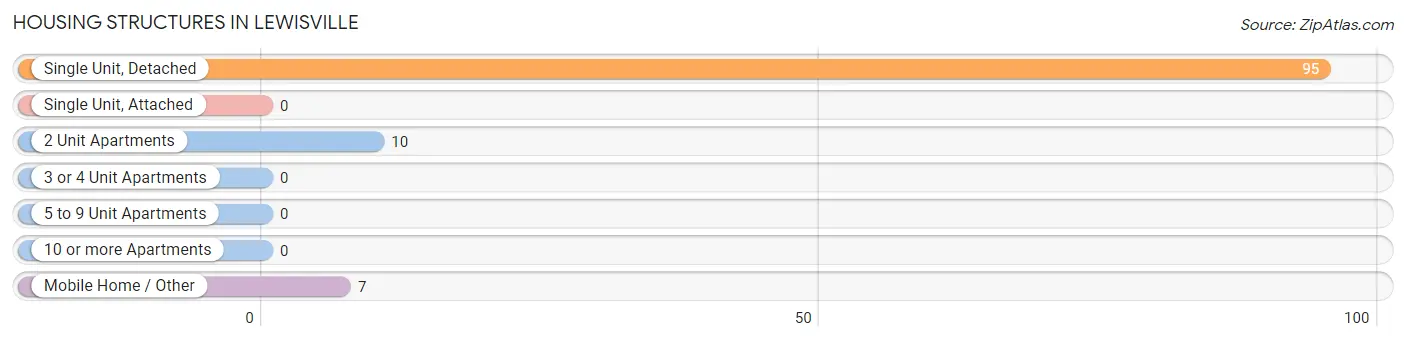
| Structure Type | # Housing Units | % Housing Units |
| Single Unit, Detached | 95 | 84.8% |
| Single Unit, Attached | 0 | 0.0% |
| 2 Unit Apartments | 10 | 8.9% |
| 3 or 4 Unit Apartments | 0 | 0.0% |
| 5 to 9 Unit Apartments | 0 | 0.0% |
| 10 or more Apartments | 0 | 0.0% |
| Mobile Home / Other | 7 | 6.2% |
| Total | 112 | 100.0% |
Housing Structures by Occupancy in Lewisville
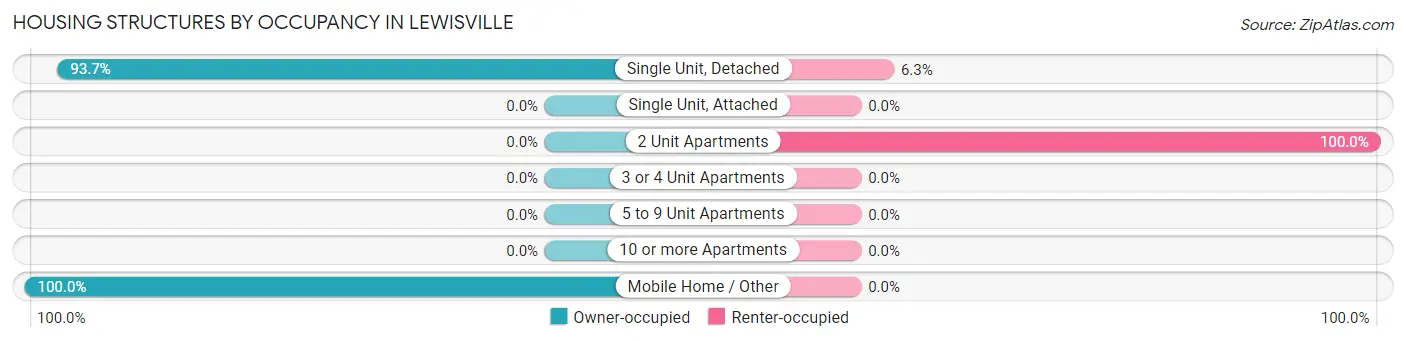
| Structure Type | Owner-occupied | Renter-occupied |
| Single Unit, Detached | 89 (93.7%) | 6 (6.3%) |
| Single Unit, Attached | 0 (0.0%) | 0 (0.0%) |
| 2 Unit Apartments | 0 (0.0%) | 10 (100.0%) |
| 3 or 4 Unit Apartments | 0 (0.0%) | 0 (0.0%) |
| 5 to 9 Unit Apartments | 0 (0.0%) | 0 (0.0%) |
| 10 or more Apartments | 0 (0.0%) | 0 (0.0%) |
| Mobile Home / Other | 7 (100.0%) | 0 (0.0%) |
| Total | 96 (85.7%) | 16 (14.3%) |
Housing Structures by Number of Rooms in Lewisville
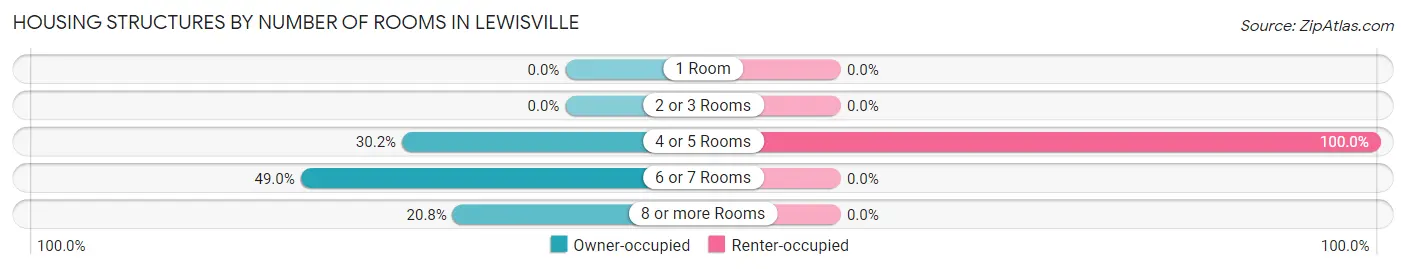
| Number of Rooms | Owner-occupied | Renter-occupied |
| 1 Room | 0 (0.0%) | 0 (0.0%) |
| 2 or 3 Rooms | 0 (0.0%) | 0 (0.0%) |
| 4 or 5 Rooms | 29 (30.2%) | 16 (100.0%) |
| 6 or 7 Rooms | 47 (49.0%) | 0 (0.0%) |
| 8 or more Rooms | 20 (20.8%) | 0 (0.0%) |
| Total | 96 (100.0%) | 16 (100.0%) |
Housing Structure by Heating Type in Lewisville
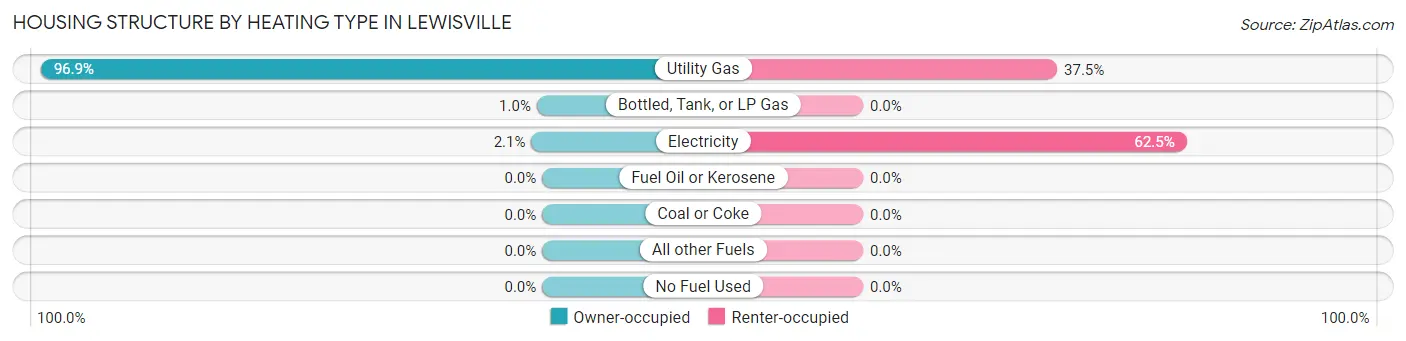
| Heating Type | Owner-occupied | Renter-occupied |
| Utility Gas | 93 (96.9%) | 6 (37.5%) |
| Bottled, Tank, or LP Gas | 1 (1.0%) | 0 (0.0%) |
| Electricity | 2 (2.1%) | 10 (62.5%) |
| Fuel Oil or Kerosene | 0 (0.0%) | 0 (0.0%) |
| Coal or Coke | 0 (0.0%) | 0 (0.0%) |
| All other Fuels | 0 (0.0%) | 0 (0.0%) |
| No Fuel Used | 0 (0.0%) | 0 (0.0%) |
| Total | 96 (100.0%) | 16 (100.0%) |
Household Vehicle Usage in Lewisville
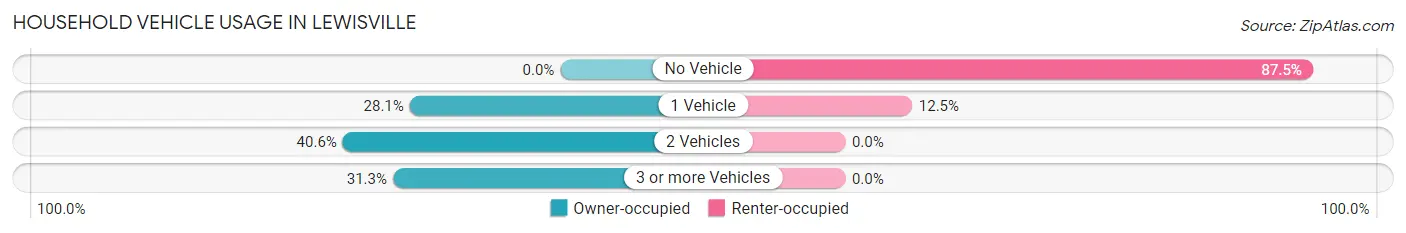
| Vehicles per Household | Owner-occupied | Renter-occupied |
| No Vehicle | 0 (0.0%) | 14 (87.5%) |
| 1 Vehicle | 27 (28.1%) | 2 (12.5%) |
| 2 Vehicles | 39 (40.6%) | 0 (0.0%) |
| 3 or more Vehicles | 30 (31.2%) | 0 (0.0%) |
| Total | 96 (100.0%) | 16 (100.0%) |
Real Estate & Mortgages in Lewisville
Real Estate and Mortgage Overview in Lewisville
| Characteristic | Without Mortgage | With Mortgage |
| Housing Units | 60 | 36 |
| Median Property Value | $41,900 | $71,400 |
| Median Household Income | $53,750 | $2 |
| Monthly Housing Costs | $393 | $0 |
| Real Estate Taxes | $871 | $0 |
Property Value by Mortgage Status in Lewisville
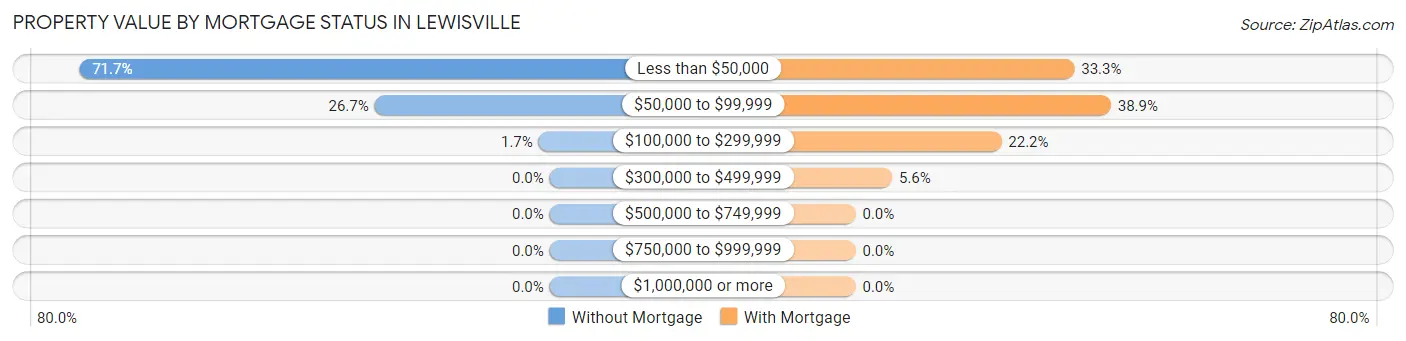
| Property Value | Without Mortgage | With Mortgage |
| Less than $50,000 | 43 (71.7%) | 12 (33.3%) |
| $50,000 to $99,999 | 16 (26.7%) | 14 (38.9%) |
| $100,000 to $299,999 | 1 (1.7%) | 8 (22.2%) |
| $300,000 to $499,999 | 0 (0.0%) | 2 (5.6%) |
| $500,000 to $749,999 | 0 (0.0%) | 0 (0.0%) |
| $750,000 to $999,999 | 0 (0.0%) | 0 (0.0%) |
| $1,000,000 or more | 0 (0.0%) | 0 (0.0%) |
| Total | 60 (100.0%) | 36 (100.0%) |
Household Income by Mortgage Status in Lewisville
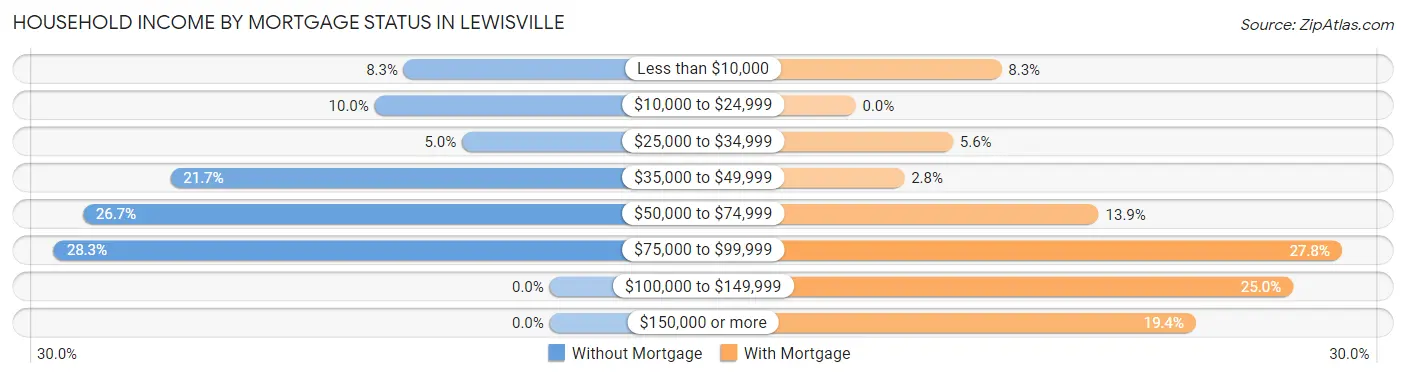
| Household Income | Without Mortgage | With Mortgage |
| Less than $10,000 | 5 (8.3%) | 3 (8.3%) |
| $10,000 to $24,999 | 6 (10.0%) | 0 (0.0%) |
| $25,000 to $34,999 | 3 (5.0%) | 2 (5.6%) |
| $35,000 to $49,999 | 13 (21.7%) | 1 (2.8%) |
| $50,000 to $74,999 | 16 (26.7%) | 5 (13.9%) |
| $75,000 to $99,999 | 17 (28.3%) | 10 (27.8%) |
| $100,000 to $149,999 | 0 (0.0%) | 9 (25.0%) |
| $150,000 or more | 0 (0.0%) | 7 (19.4%) |
| Total | 60 (100.0%) | 36 (100.0%) |
Property Value to Household Income Ratio in Lewisville
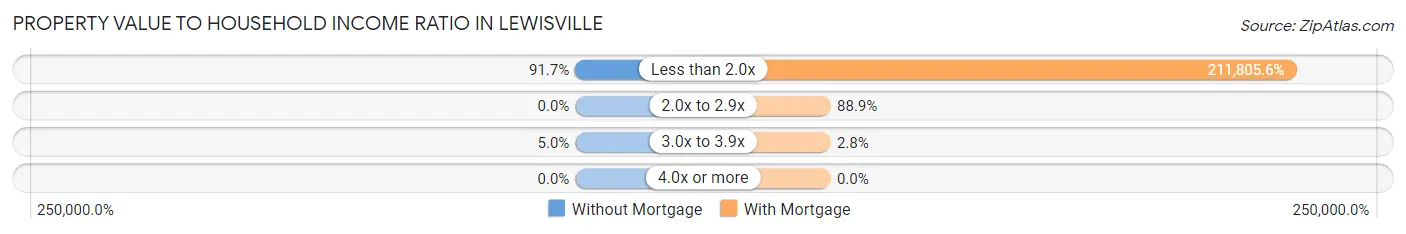
| Value-to-Income Ratio | Without Mortgage | With Mortgage |
| Less than 2.0x | 55 (91.7%) | 76,250 (211,805.6%) |
| 2.0x to 2.9x | 0 (0.0%) | 32 (88.9%) |
| 3.0x to 3.9x | 3 (5.0%) | 1 (2.8%) |
| 4.0x or more | 0 (0.0%) | 0 (0.0%) |
| Total | 60 (100.0%) | 36 (100.0%) |
Real Estate Taxes by Mortgage Status in Lewisville
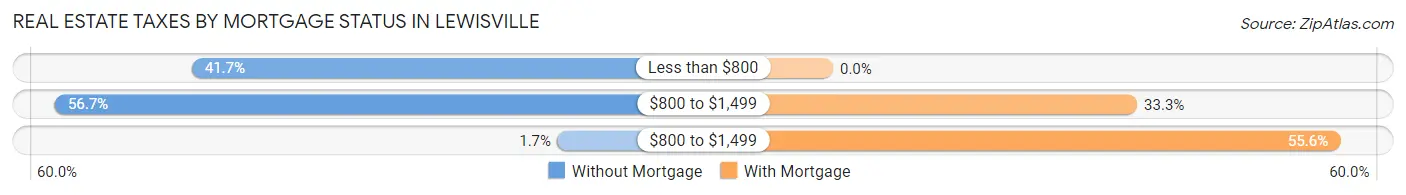
| Property Taxes | Without Mortgage | With Mortgage |
| Less than $800 | 25 (41.7%) | 0 (0.0%) |
| $800 to $1,499 | 34 (56.7%) | 12 (33.3%) |
| $800 to $1,499 | 1 (1.7%) | 20 (55.6%) |
| Total | 60 (100.0%) | 36 (100.0%) |
Health & Disability in Lewisville
Health Insurance Coverage by Age in Lewisville
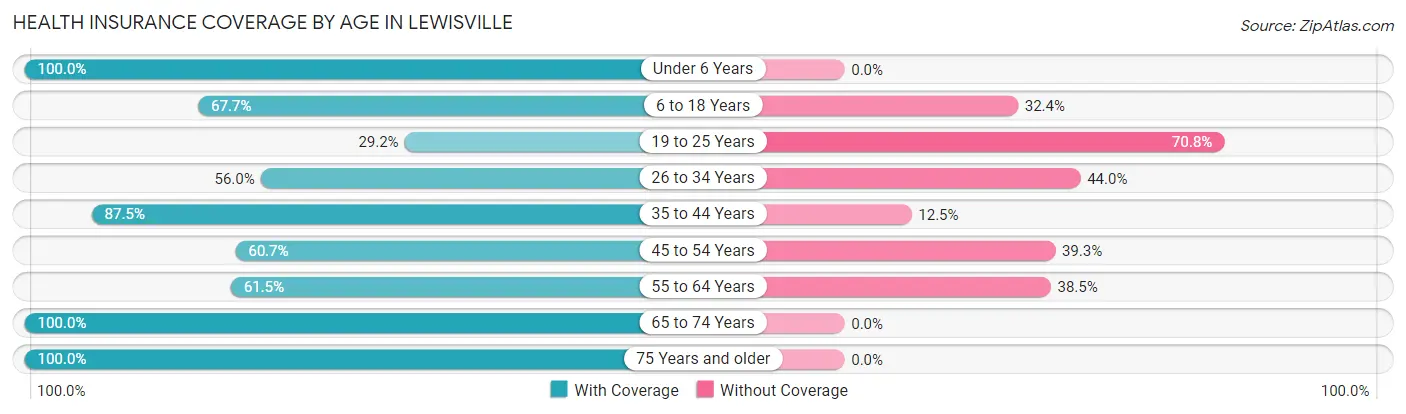
| Age Bracket | With Coverage | Without Coverage |
| Under 6 Years | 20 (100.0%) | 0 (0.0%) |
| 6 to 18 Years | 23 (67.6%) | 11 (32.4%) |
| 19 to 25 Years | 7 (29.2%) | 17 (70.8%) |
| 26 to 34 Years | 14 (56.0%) | 11 (44.0%) |
| 35 to 44 Years | 28 (87.5%) | 4 (12.5%) |
| 45 to 54 Years | 17 (60.7%) | 11 (39.3%) |
| 55 to 64 Years | 32 (61.5%) | 20 (38.5%) |
| 65 to 74 Years | 28 (100.0%) | 0 (0.0%) |
| 75 Years and older | 30 (100.0%) | 0 (0.0%) |
| Total | 199 (72.9%) | 74 (27.1%) |
Health Insurance Coverage by Citizenship Status in Lewisville
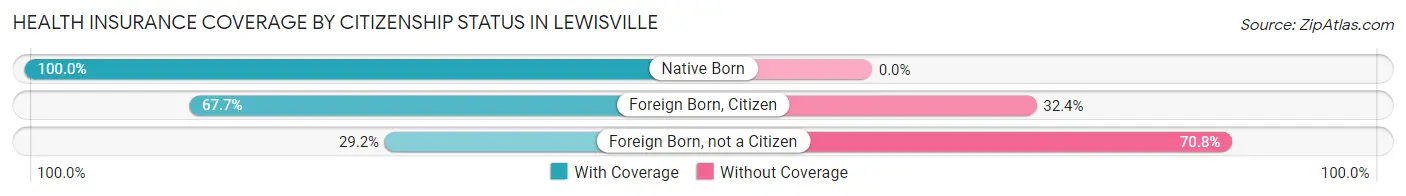
| Citizenship Status | With Coverage | Without Coverage |
| Native Born | 20 (100.0%) | 0 (0.0%) |
| Foreign Born, Citizen | 23 (67.6%) | 11 (32.4%) |
| Foreign Born, not a Citizen | 7 (29.2%) | 17 (70.8%) |
Health Insurance Coverage by Household Income in Lewisville
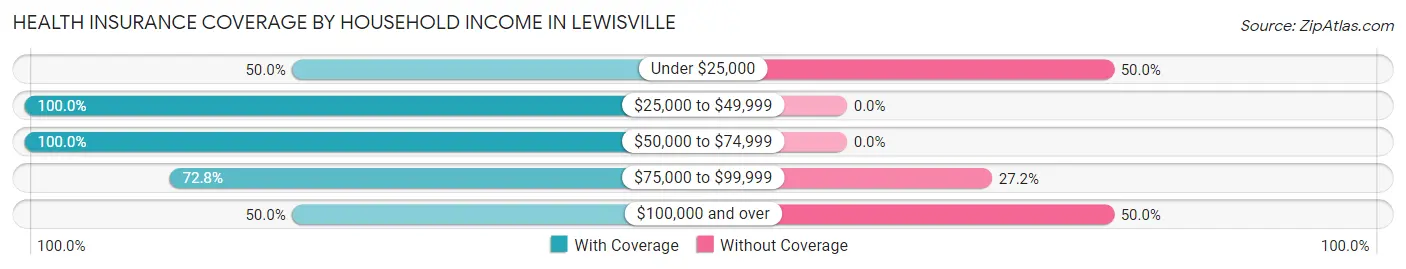
| Household Income | With Coverage | Without Coverage |
| Under $25,000 | 25 (50.0%) | 25 (50.0%) |
| $25,000 to $49,999 | 26 (100.0%) | 0 (0.0%) |
| $50,000 to $74,999 | 52 (100.0%) | 0 (0.0%) |
| $75,000 to $99,999 | 75 (72.8%) | 28 (27.2%) |
| $100,000 and over | 21 (50.0%) | 21 (50.0%) |
Public vs Private Health Insurance Coverage by Age in Lewisville
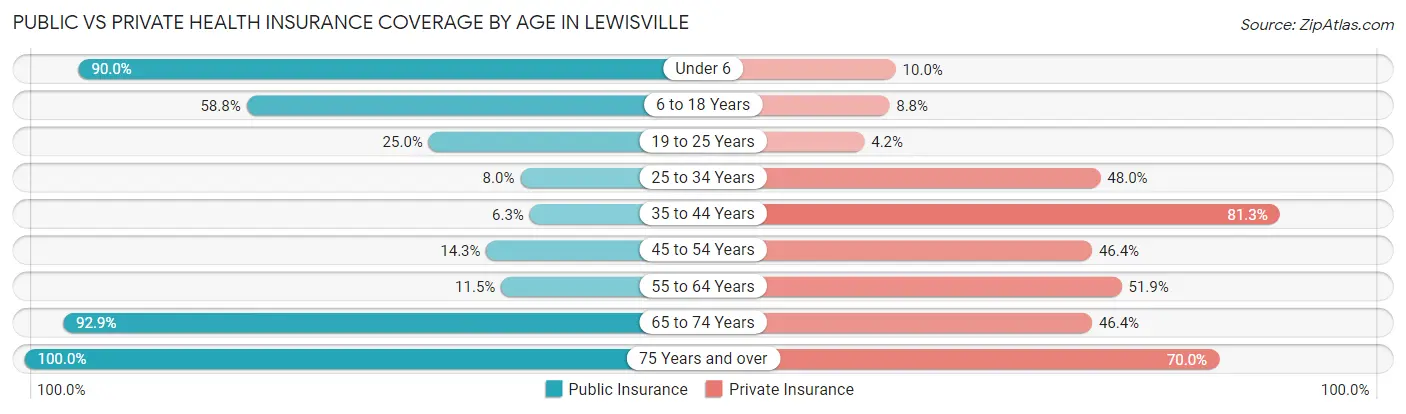
| Age Bracket | Public Insurance | Private Insurance |
| Under 6 | 18 (90.0%) | 2 (10.0%) |
| 6 to 18 Years | 20 (58.8%) | 3 (8.8%) |
| 19 to 25 Years | 6 (25.0%) | 1 (4.2%) |
| 25 to 34 Years | 2 (8.0%) | 12 (48.0%) |
| 35 to 44 Years | 2 (6.2%) | 26 (81.2%) |
| 45 to 54 Years | 4 (14.3%) | 13 (46.4%) |
| 55 to 64 Years | 6 (11.5%) | 27 (51.9%) |
| 65 to 74 Years | 26 (92.9%) | 13 (46.4%) |
| 75 Years and over | 30 (100.0%) | 21 (70.0%) |
| Total | 114 (41.8%) | 118 (43.2%) |
Disability Status by Sex by Age in Lewisville
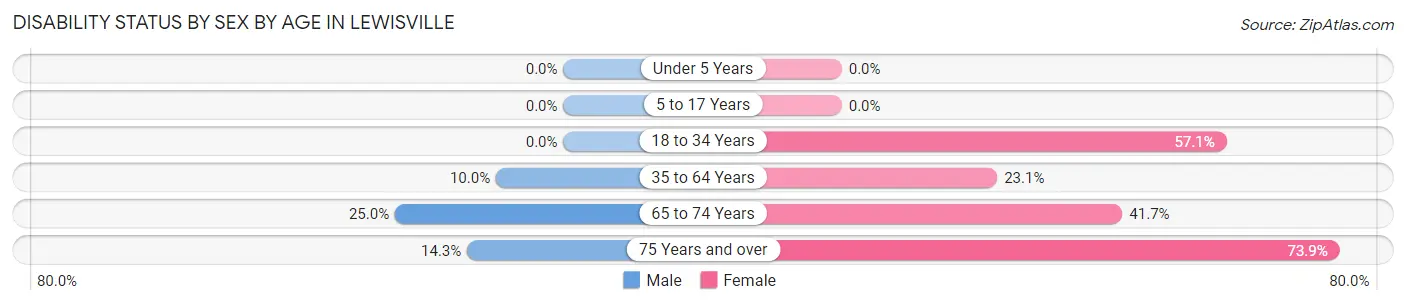
| Age Bracket | Male | Female |
| Under 5 Years | 0 (0.0%) | 0 (0.0%) |
| 5 to 17 Years | 0 (0.0%) | 0 (0.0%) |
| 18 to 34 Years | 0 (0.0%) | 8 (57.1%) |
| 35 to 64 Years | 6 (10.0%) | 12 (23.1%) |
| 65 to 74 Years | 4 (25.0%) | 5 (41.7%) |
| 75 Years and over | 1 (14.3%) | 17 (73.9%) |
Disability Class by Sex by Age in Lewisville
Disability Class: Hearing Difficulty
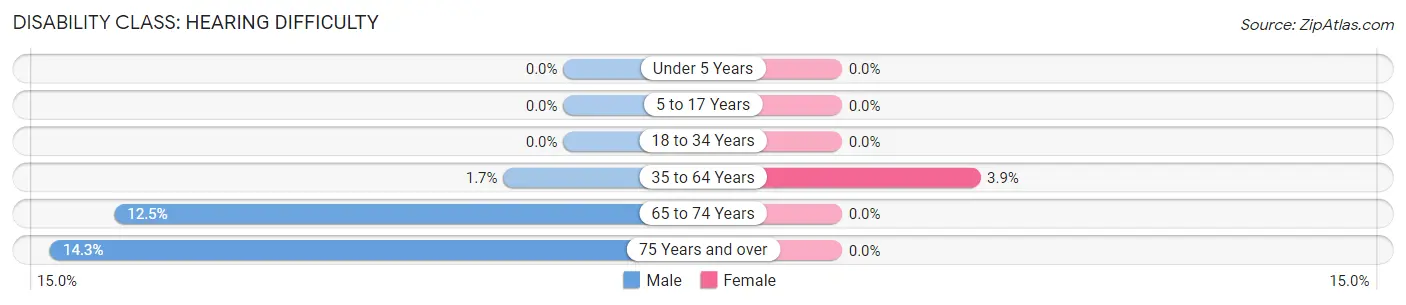
| Age Bracket | Male | Female |
| Under 5 Years | 0 (0.0%) | 0 (0.0%) |
| 5 to 17 Years | 0 (0.0%) | 0 (0.0%) |
| 18 to 34 Years | 0 (0.0%) | 0 (0.0%) |
| 35 to 64 Years | 1 (1.7%) | 2 (3.8%) |
| 65 to 74 Years | 2 (12.5%) | 0 (0.0%) |
| 75 Years and over | 1 (14.3%) | 0 (0.0%) |
Disability Class: Vision Difficulty
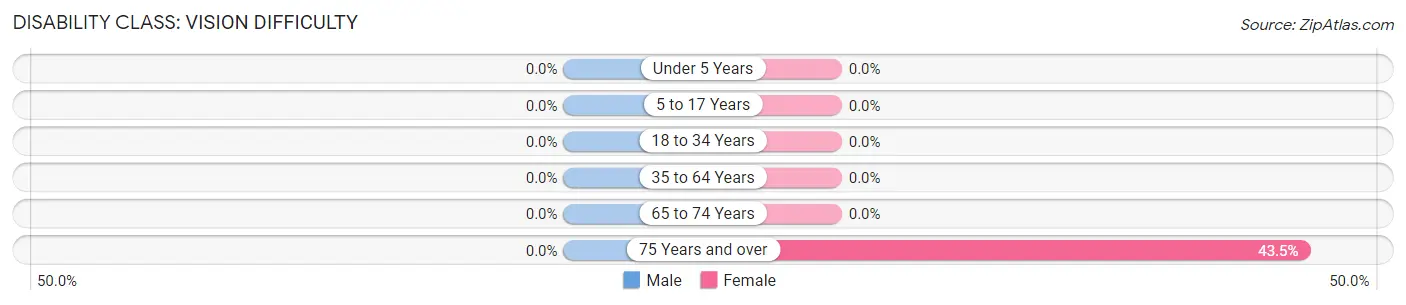
| Age Bracket | Male | Female |
| Under 5 Years | 0 (0.0%) | 0 (0.0%) |
| 5 to 17 Years | 0 (0.0%) | 0 (0.0%) |
| 18 to 34 Years | 0 (0.0%) | 0 (0.0%) |
| 35 to 64 Years | 0 (0.0%) | 0 (0.0%) |
| 65 to 74 Years | 0 (0.0%) | 0 (0.0%) |
| 75 Years and over | 0 (0.0%) | 10 (43.5%) |
Disability Class: Cognitive Difficulty
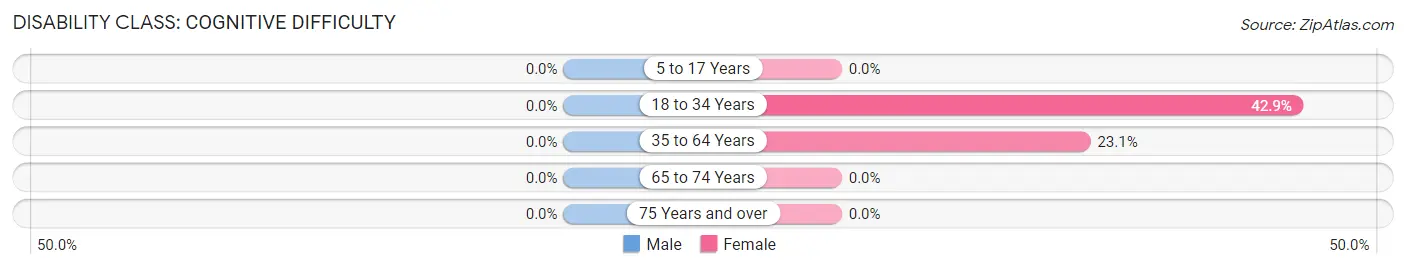
| Age Bracket | Male | Female |
| 5 to 17 Years | 0 (0.0%) | 0 (0.0%) |
| 18 to 34 Years | 0 (0.0%) | 6 (42.9%) |
| 35 to 64 Years | 0 (0.0%) | 12 (23.1%) |
| 65 to 74 Years | 0 (0.0%) | 0 (0.0%) |
| 75 Years and over | 0 (0.0%) | 0 (0.0%) |
Disability Class: Ambulatory Difficulty
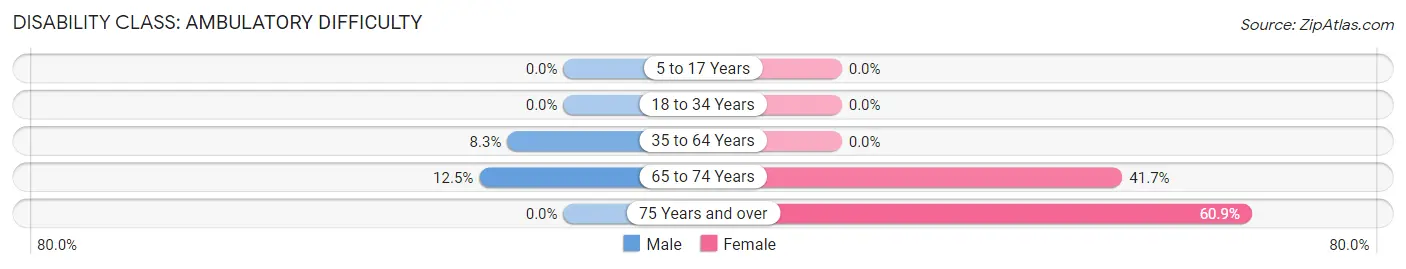
| Age Bracket | Male | Female |
| 5 to 17 Years | 0 (0.0%) | 0 (0.0%) |
| 18 to 34 Years | 0 (0.0%) | 0 (0.0%) |
| 35 to 64 Years | 5 (8.3%) | 0 (0.0%) |
| 65 to 74 Years | 2 (12.5%) | 5 (41.7%) |
| 75 Years and over | 0 (0.0%) | 14 (60.9%) |
Disability Class: Self-Care Difficulty
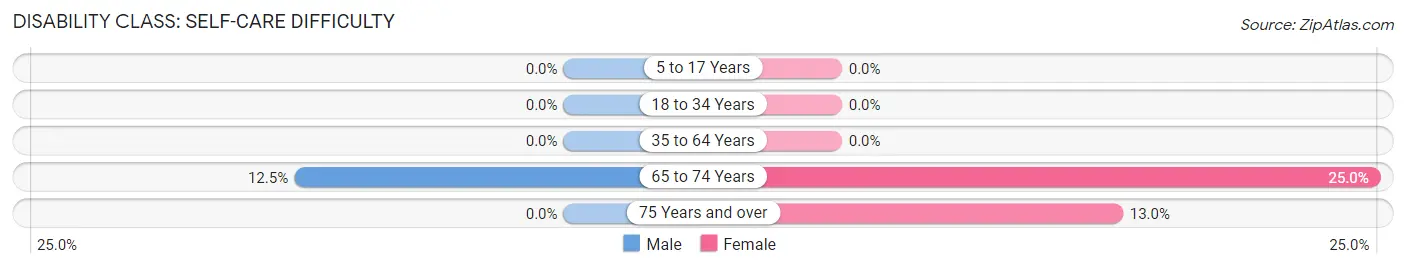
| Age Bracket | Male | Female |
| 5 to 17 Years | 0 (0.0%) | 0 (0.0%) |
| 18 to 34 Years | 0 (0.0%) | 0 (0.0%) |
| 35 to 64 Years | 0 (0.0%) | 0 (0.0%) |
| 65 to 74 Years | 2 (12.5%) | 3 (25.0%) |
| 75 Years and over | 0 (0.0%) | 3 (13.0%) |
Technology Access in Lewisville
Computing Device Access in Lewisville
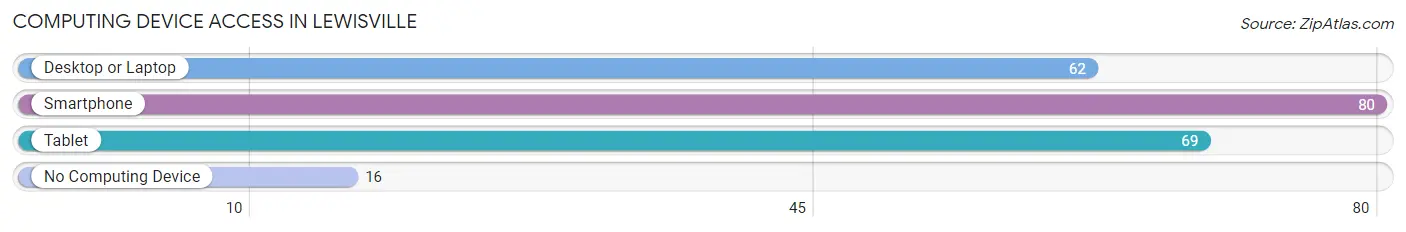
| Device Type | # Households | % Households |
| Desktop or Laptop | 62 | 55.4% |
| Smartphone | 80 | 71.4% |
| Tablet | 69 | 61.6% |
| No Computing Device | 16 | 14.3% |
| Total | 112 | 100.0% |
Internet Access in Lewisville
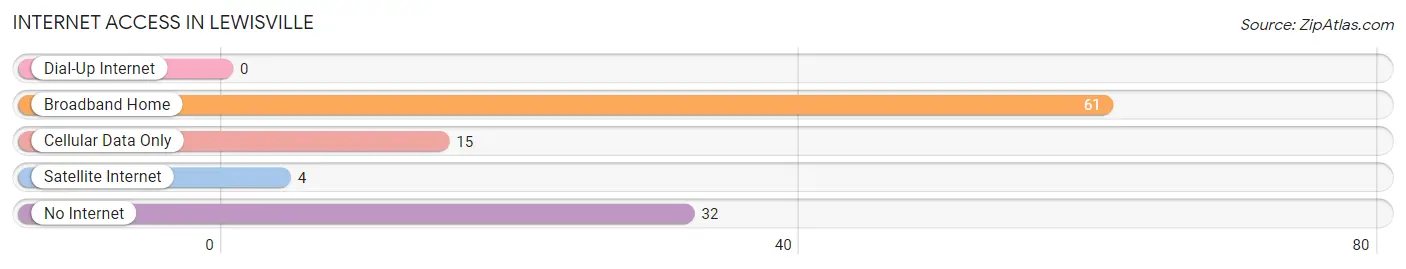
| Internet Type | # Households | % Households |
| Dial-Up Internet | 0 | 0.0% |
| Broadband Home | 61 | 54.5% |
| Cellular Data Only | 15 | 13.4% |
| Satellite Internet | 4 | 3.6% |
| No Internet | 32 | 28.6% |
| Total | 112 | 100.0% |
Lewisville Summary
Lewisville, Minnesota is a small city located in the southeastern corner of the state, in the county of Wabasha. It is situated on the banks of the Mississippi River, and is part of the Rochester, Minnesota Metropolitan Statistical Area. The city has a population of approximately 1,400 people, and is known for its small-town charm and rural atmosphere.
History
Lewisville was founded in 1854 by William Lewis, a settler from Ohio. He purchased the land from the government and began to build a small settlement. The town was originally called Lewisville, but was later changed to Lewisville in honor of William Lewis. The town grew slowly, but steadily, and by the late 1800s, it had become a thriving community.
In the early 1900s, Lewisville was a major hub for the lumber industry. The town was home to several sawmills, and the lumber industry provided many jobs for the residents. The town also had a thriving agricultural industry, and was home to several dairy farms.
In the 1950s, Lewisville began to experience a decline in population. The lumber industry had moved away, and the agricultural industry was in decline. The town was struggling to survive, and many of the residents moved away in search of better opportunities.
Geography
Lewisville is located in the southeastern corner of Minnesota, in Wabasha County. It is situated on the banks of the Mississippi River, and is part of the Rochester, Minnesota Metropolitan Statistical Area. The city has a total area of 0.9 square miles, all of which is land.
The city is located in a rural area, and is surrounded by rolling hills and farmland. The climate is humid continental, with hot summers and cold winters. The average annual temperature is around 45 degrees Fahrenheit.
Economy
The economy of Lewisville is largely based on agriculture and tourism. The town is home to several dairy farms, and the agricultural industry provides many jobs for the residents. The town is also a popular tourist destination, and is home to several attractions, including the Lewisville Historical Museum and the Lewisville State Park.
The town also has a small retail sector, with several small businesses located in the downtown area. The town is home to several restaurants, bars, and other small businesses.
Demographics
As of the 2010 census, the population of Lewisville was 1,400. The racial makeup of the city was 97.3% White, 0.3% African American, 0.3% Native American, 0.3% Asian, 0.3% from other races, and 1.7% from two or more races. Hispanic or Latino of any race were 1.3% of the population.
The median income for a household in the city was $41,250, and the median income for a family was $50,000. The per capita income for the city was $20,945. About 8.3% of families and 10.3% of the population were below the poverty line, including 14.3% of those under age 18 and 6.3% of those age 65 or over.
Lewisville is a small city with a rural atmosphere and a strong sense of community. The town is home to many small businesses, and the agricultural industry provides many jobs for the residents. The town is also a popular tourist destination, and is home to several attractions. The town has a population of approximately 1,400 people, and is known for its small-town charm and rural atmosphere.
Common Questions
What is Per Capita Income in Lewisville?
Per Capita income in Lewisville is $24,584.
What is the Median Family Income in Lewisville?
Median Family Income in Lewisville is $51,875.
What is the Median Household income in Lewisville?
Median Household Income in Lewisville is $55,000.
What is Inequality or Gini Index in Lewisville?
Inequality or Gini Index in Lewisville is 0.37.
What is the Total Population of Lewisville?
Total Population of Lewisville is 273.
What is the Total Male Population of Lewisville?
Total Male Population of Lewisville is 131.
What is the Total Female Population of Lewisville?
Total Female Population of Lewisville is 142.
What is the Ratio of Males per 100 Females in Lewisville?
There are 92.25 Males per 100 Females in Lewisville.
What is the Ratio of Females per 100 Males in Lewisville?
There are 108.40 Females per 100 Males in Lewisville.
What is the Median Population Age in Lewisville?
Median Population Age in Lewisville is 46.1 Years.
What is the Average Family Size in Lewisville
Average Family Size in Lewisville is 3.3 People.
What is the Average Household Size in Lewisville
Average Household Size in Lewisville is 2.4 People.
How Large is the Labor Force in Lewisville?
There are 108 People in the Labor Forcein in Lewisville.
What is the Percentage of People in the Labor Force in Lewisville?
47.8% of People are in the Labor Force in Lewisville.
What is the Unemployment Rate in Lewisville?
Unemployment Rate in Lewisville is 1.9%.