Wolf Lake, MN Map & Demographics
Wolf Lake Map
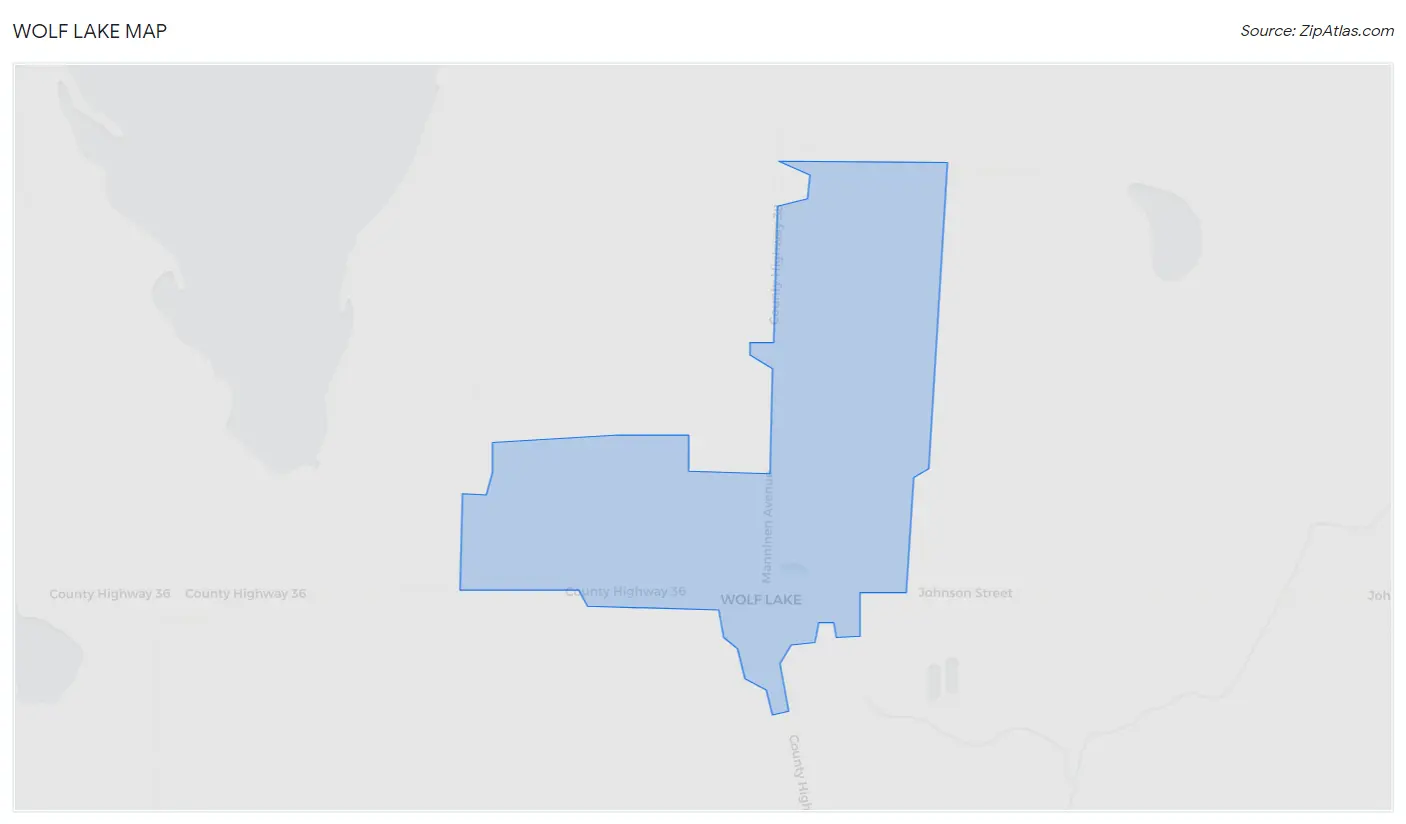
Wolf Lake Overview
$29,619
PER CAPITA INCOME
$72,500
AVG FAMILY INCOME
$68,750
AVG HOUSEHOLD INCOME
43.3%
WAGE / INCOME GAP [ % ]
56.7¢/ $1
WAGE / INCOME GAP [ $ ]
0.21
INEQUALITY / GINI INDEX
73
TOTAL POPULATION
31
MALE POPULATION
42
FEMALE POPULATION
73.81
MALES / 100 FEMALES
135.48
FEMALES / 100 MALES
24.1
MEDIAN AGE
2.4
AVG FAMILY SIZE
2.3
AVG HOUSEHOLD SIZE
47
LABOR FORCE [ PEOPLE ]
73.4%
PERCENT IN LABOR FORCE
Wolf Lake Area Codes
Income in Wolf Lake
Income Overview in Wolf Lake
Per Capita Income in Wolf Lake is $29,619, while median incomes of families and households are $72,500 and $68,750 respectively.
| Characteristic | Number | Measure |
| Per Capita Income | 73 | $29,619 |
| Median Family Income | 30 | $72,500 |
| Mean Family Income | 30 | $69,457 |
| Median Household Income | 32 | $68,750 |
| Mean Household Income | 32 | $68,341 |
| Income Deficit | 30 | $0 |
| Wage / Income Gap (%) | 73 | 43.35% |
| Wage / Income Gap ($) | 73 | 56.65¢ per $1 |
| Gini / Inequality Index | 73 | 0.21 |
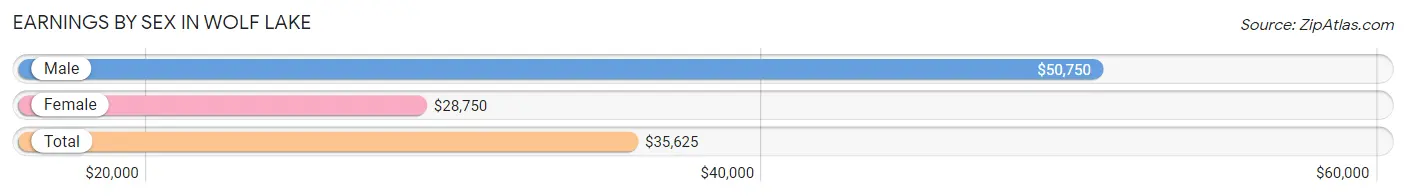
Earnings by Sex in Wolf Lake
Average Earnings in Wolf Lake are $35,625, $50,750 for men and $28,750 for women, a difference of 43.3%.
| Sex | Number | Average Earnings |
| Male | 27 (50.9%) | $50,750 |
| Female | 26 (49.1%) | $28,750 |
| Total | 53 (100.0%) | $35,625 |
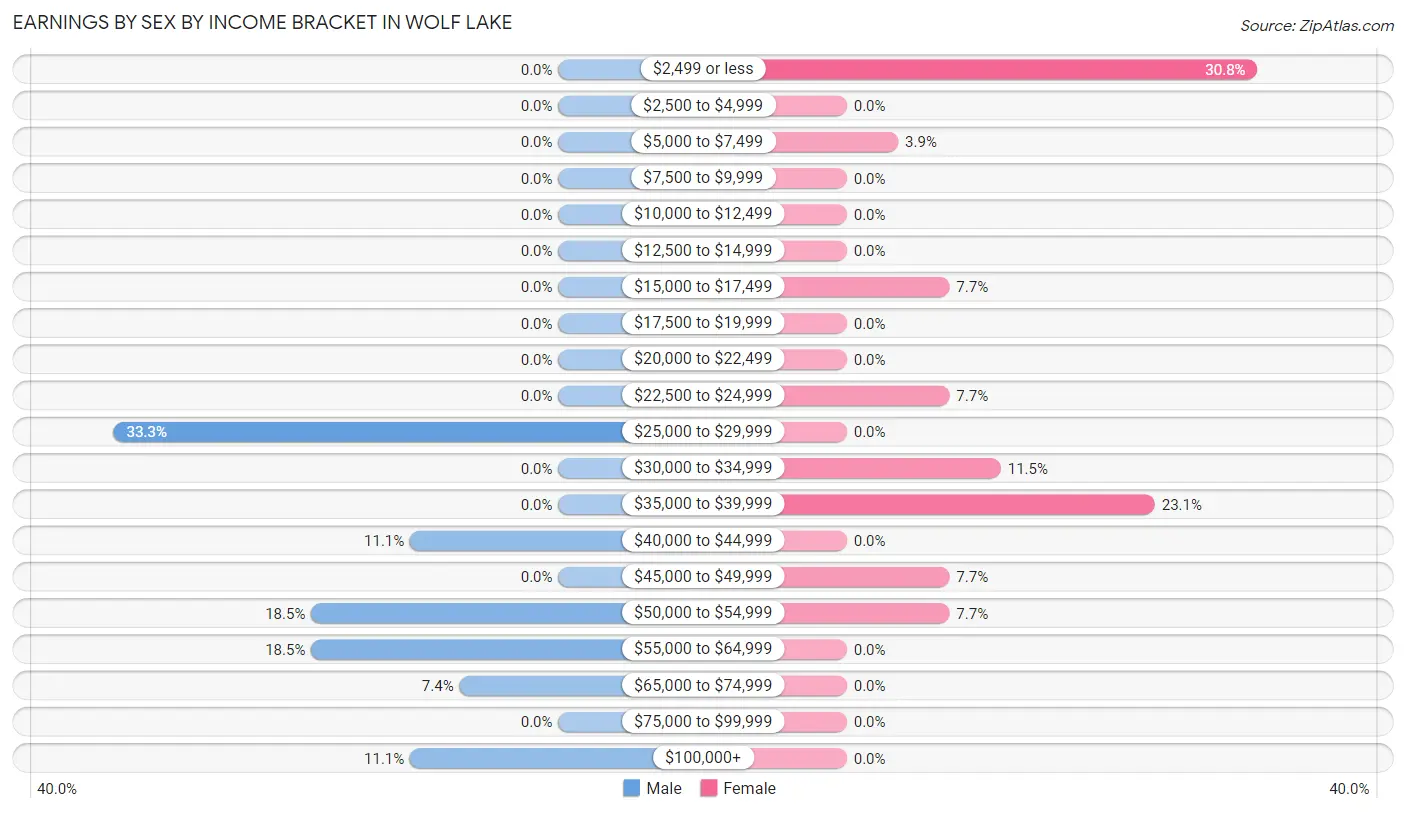
Earnings by Sex by Income Bracket in Wolf Lake
The most common earnings brackets in Wolf Lake are $25,000 to $29,999 for men (9 | 33.3%) and $2,499 or less for women (8 | 30.8%).
| Income | Male | Female |
| $2,499 or less | 0 (0.0%) | 8 (30.8%) |
| $2,500 to $4,999 | 0 (0.0%) | 0 (0.0%) |
| $5,000 to $7,499 | 0 (0.0%) | 1 (3.8%) |
| $7,500 to $9,999 | 0 (0.0%) | 0 (0.0%) |
| $10,000 to $12,499 | 0 (0.0%) | 0 (0.0%) |
| $12,500 to $14,999 | 0 (0.0%) | 0 (0.0%) |
| $15,000 to $17,499 | 0 (0.0%) | 2 (7.7%) |
| $17,500 to $19,999 | 0 (0.0%) | 0 (0.0%) |
| $20,000 to $22,499 | 0 (0.0%) | 0 (0.0%) |
| $22,500 to $24,999 | 0 (0.0%) | 2 (7.7%) |
| $25,000 to $29,999 | 9 (33.3%) | 0 (0.0%) |
| $30,000 to $34,999 | 0 (0.0%) | 3 (11.5%) |
| $35,000 to $39,999 | 0 (0.0%) | 6 (23.1%) |
| $40,000 to $44,999 | 3 (11.1%) | 0 (0.0%) |
| $45,000 to $49,999 | 0 (0.0%) | 2 (7.7%) |
| $50,000 to $54,999 | 5 (18.5%) | 2 (7.7%) |
| $55,000 to $64,999 | 5 (18.5%) | 0 (0.0%) |
| $65,000 to $74,999 | 2 (7.4%) | 0 (0.0%) |
| $75,000 to $99,999 | 0 (0.0%) | 0 (0.0%) |
| $100,000+ | 3 (11.1%) | 0 (0.0%) |
| Total | 27 (100.0%) | 26 (100.0%) |
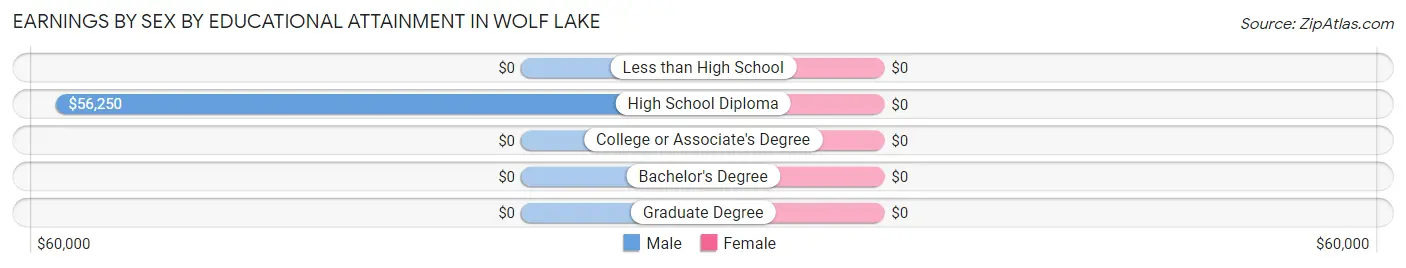
Earnings by Sex by Educational Attainment in Wolf Lake
| Educational Attainment | Male Income | Female Income |
| Less than High School | - | - |
| High School Diploma | $56,250 | $0 |
| College or Associate's Degree | - | - |
| Bachelor's Degree | - | - |
| Graduate Degree | - | - |
| Total | $43,750 | $36,458 |
Family Income in Wolf Lake
Family Income Brackets in Wolf Lake
According to the Wolf Lake family income data, there are 12 families falling into the $75,000 to $99,999 income range, which is the most common income bracket and makes up 40.0% of all families.
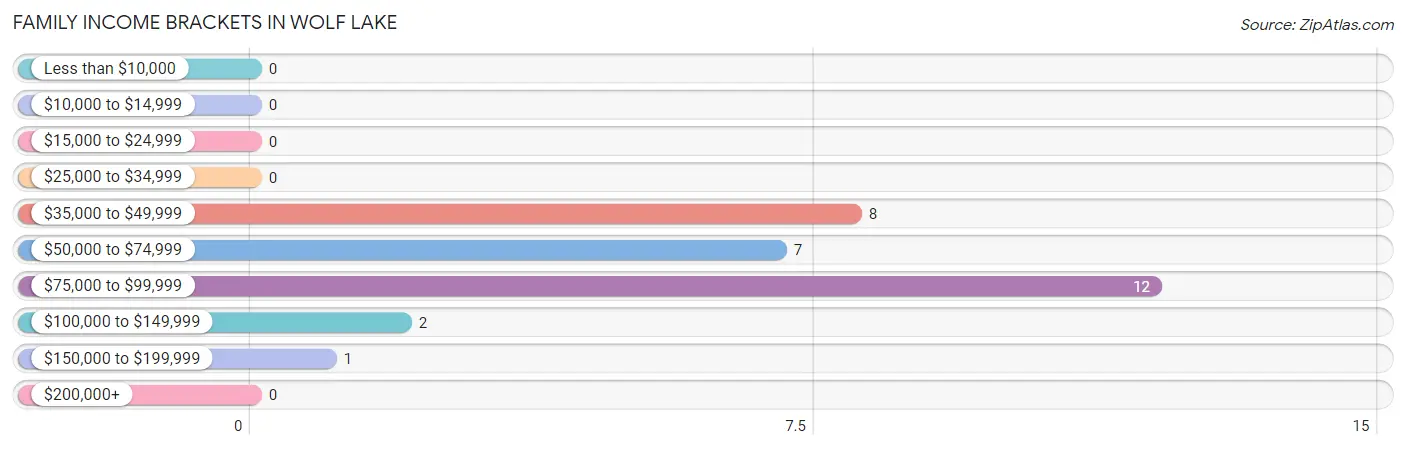
| Income Bracket | # Families | % Families |
| Less than $10,000 | 0 | 0.0% |
| $10,000 to $14,999 | 0 | 0.0% |
| $15,000 to $24,999 | 0 | 0.0% |
| $25,000 to $34,999 | 0 | 0.0% |
| $35,000 to $49,999 | 8 | 26.7% |
| $50,000 to $74,999 | 7 | 23.3% |
| $75,000 to $99,999 | 12 | 40.0% |
| $100,000 to $149,999 | 2 | 6.7% |
| $150,000 to $199,999 | 1 | 3.3% |
| $200,000+ | 0 | 0.0% |
Family Income by Famaliy Size in Wolf Lake
3-person families (9 | 30.0%) account for the highest median family income in Wolf Lake with $76,250 per family, while 2-person families (19 | 63.3%) have the highest median income of $32,188 per family member.
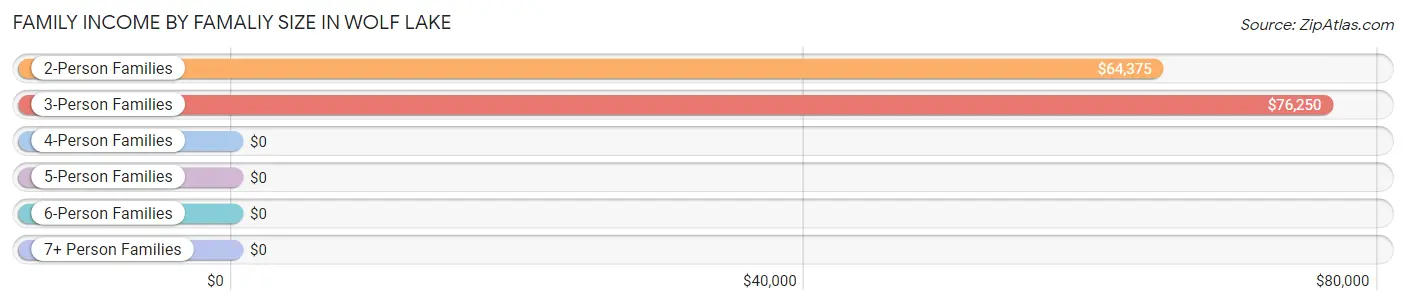
| Income Bracket | # Families | Median Income |
| 2-Person Families | 19 (63.3%) | $64,375 |
| 3-Person Families | 9 (30.0%) | $76,250 |
| 4-Person Families | 0 (0.0%) | $0 |
| 5-Person Families | 0 (0.0%) | $0 |
| 6-Person Families | 2 (6.7%) | $0 |
| 7+ Person Families | 0 (0.0%) | $0 |
| Total | 30 (100.0%) | $72,500 |
Family Income by Number of Earners in Wolf Lake
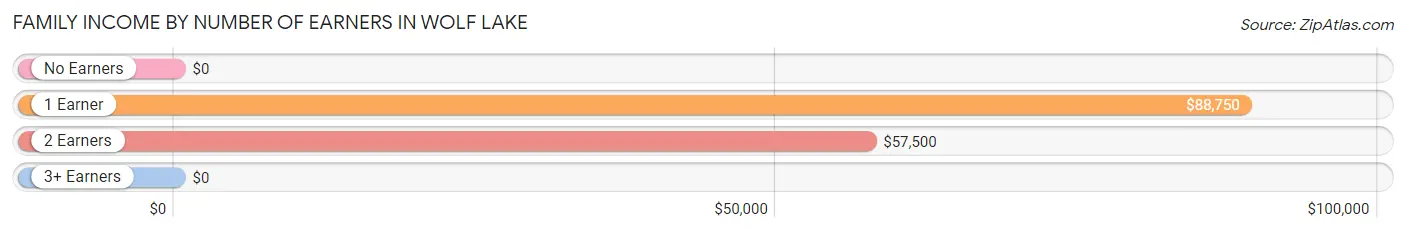
| Number of Earners | # Families | Median Income |
| No Earners | 0 (0.0%) | $0 |
| 1 Earner | 8 (26.7%) | $88,750 |
| 2 Earners | 22 (73.3%) | $57,500 |
| 3+ Earners | 0 (0.0%) | $0 |
| Total | 30 (100.0%) | $72,500 |
Household Income in Wolf Lake
Household Income Brackets in Wolf Lake
With 12 households falling in the category, the $75,000 to $99,999 income range is the most frequent in Wolf Lake, accounting for 37.5% of all households.
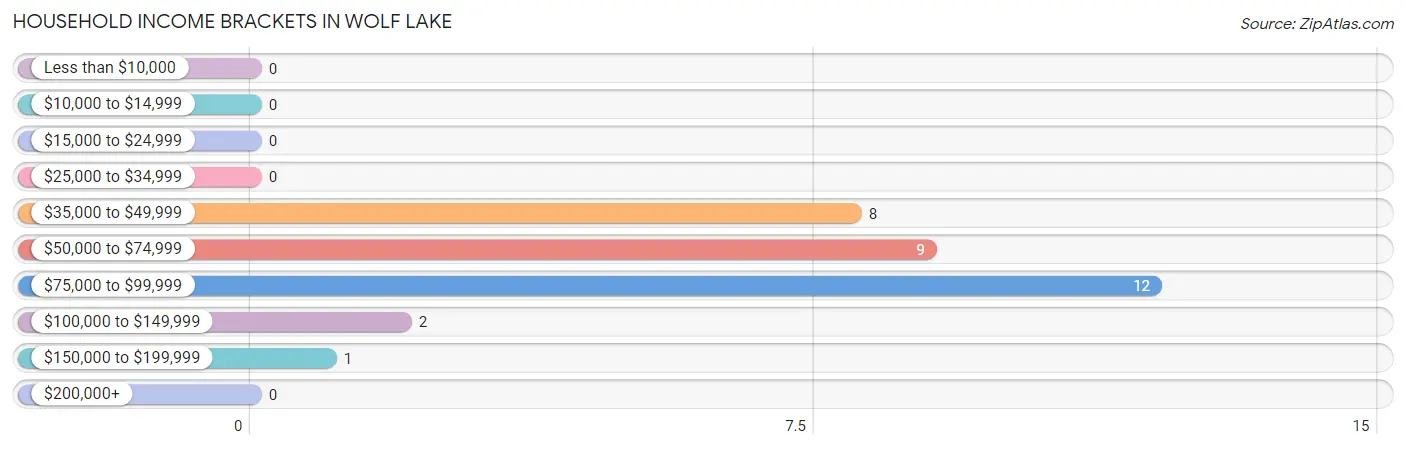
| Income Bracket | # Households | % Households |
| Less than $10,000 | 0 | 0.0% |
| $10,000 to $14,999 | 0 | 0.0% |
| $15,000 to $24,999 | 0 | 0.0% |
| $25,000 to $34,999 | 0 | 0.0% |
| $35,000 to $49,999 | 8 | 25.0% |
| $50,000 to $74,999 | 9 | 28.1% |
| $75,000 to $99,999 | 12 | 37.5% |
| $100,000 to $149,999 | 2 | 6.3% |
| $150,000 to $199,999 | 1 | 3.1% |
| $200,000+ | 0 | 0.0% |
Household Income by Householder Age in Wolf Lake
The median household income in Wolf Lake is $68,750, with the highest median household income of $76,250 found in the 15 to 24 years age bracket for the primary householder. A total of 17 households (53.1%) fall into this category. Meanwhile, the 45 to 64 years age bracket for the primary householder has the lowest median household income of $0, with 1 households (3.1%) in this group.
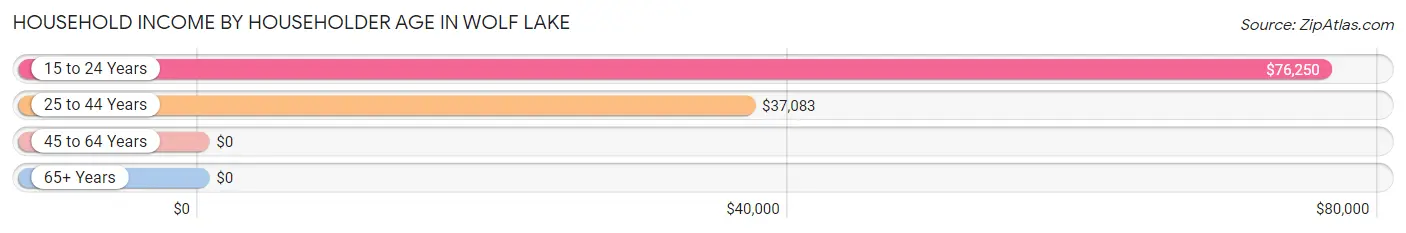
| Income Bracket | # Households | Median Income |
| 15 to 24 Years | 17 (53.1%) | $76,250 |
| 25 to 44 Years | 10 (31.2%) | $37,083 |
| 45 to 64 Years | 1 (3.1%) | $0 |
| 65+ Years | 4 (12.5%) | $0 |
| Total | 32 (100.0%) | $68,750 |
Poverty in Wolf Lake
Income Below Poverty by Sex and Age in Wolf Lake
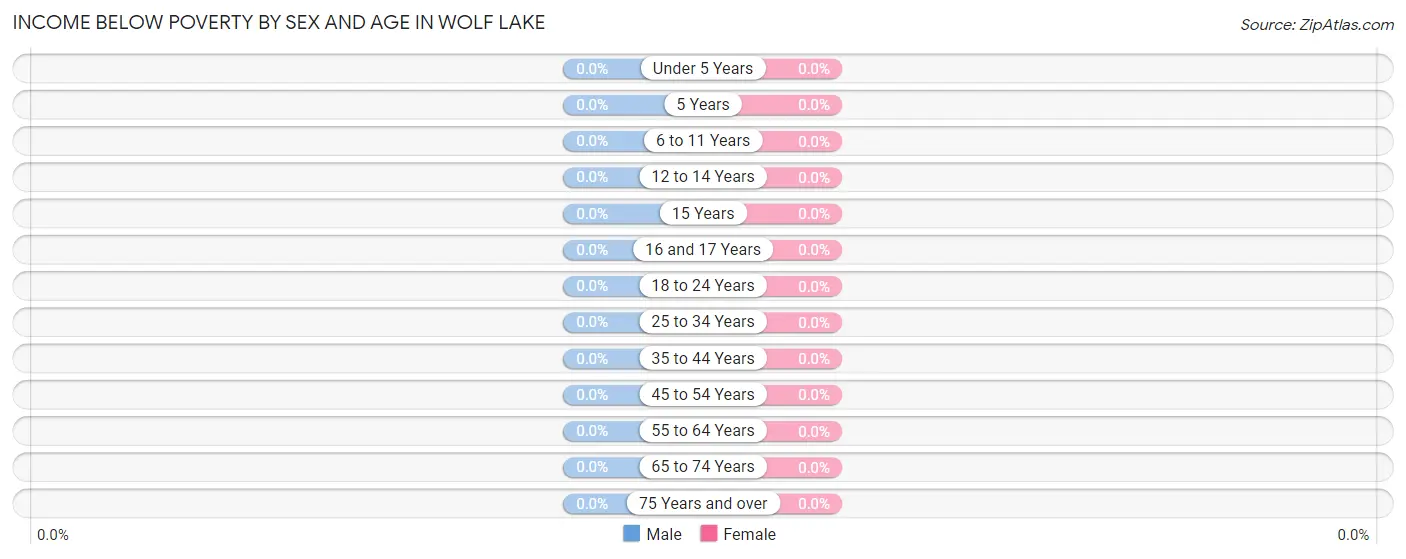
| Age Bracket | Male | Female |
| Under 5 Years | 0 (0.0%) | 0 (0.0%) |
| 5 Years | 0 (0.0%) | 0 (0.0%) |
| 6 to 11 Years | 0 (0.0%) | 0 (0.0%) |
| 12 to 14 Years | 0 (0.0%) | 0 (0.0%) |
| 15 Years | 0 (0.0%) | 0 (0.0%) |
| 16 and 17 Years | 0 (0.0%) | 0 (0.0%) |
| 18 to 24 Years | 0 (0.0%) | 0 (0.0%) |
| 25 to 34 Years | 0 (0.0%) | 0 (0.0%) |
| 35 to 44 Years | 0 (0.0%) | 0 (0.0%) |
| 45 to 54 Years | 0 (0.0%) | 0 (0.0%) |
| 55 to 64 Years | 0 (0.0%) | 0 (0.0%) |
| 65 to 74 Years | 0 (0.0%) | 0 (0.0%) |
| 75 Years and over | 0 (0.0%) | 0 (0.0%) |
| Total | 0 (0.0%) | 0 (0.0%) |
Income Above Poverty by Sex and Age in Wolf Lake
According to the poverty statistics in Wolf Lake, males aged under 5 years and females aged under 5 years are the age groups that are most secure financially, with 100.0% of males and 100.0% of females in these age groups living above the poverty line.
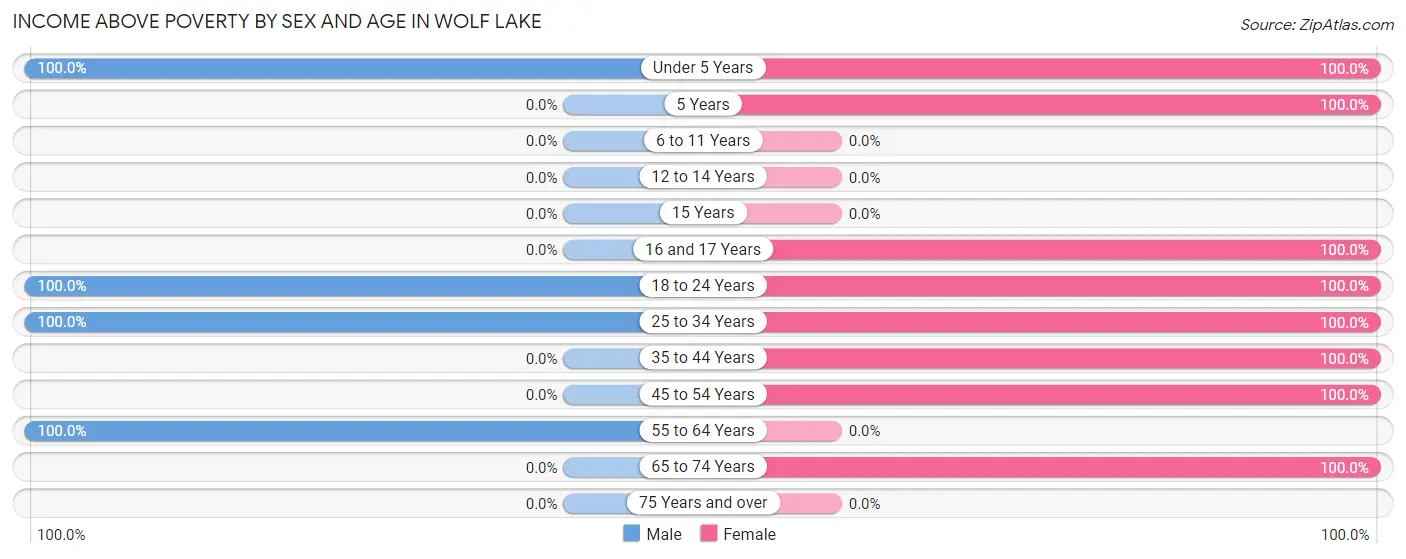
| Age Bracket | Male | Female |
| Under 5 Years | 4 (100.0%) | 4 (100.0%) |
| 5 Years | 0 (0.0%) | 1 (100.0%) |
| 6 to 11 Years | 0 (0.0%) | 0 (0.0%) |
| 12 to 14 Years | 0 (0.0%) | 0 (0.0%) |
| 15 Years | 0 (0.0%) | 0 (0.0%) |
| 16 and 17 Years | 0 (0.0%) | 6 (100.0%) |
| 18 to 24 Years | 10 (100.0%) | 17 (100.0%) |
| 25 to 34 Years | 11 (100.0%) | 1 (100.0%) |
| 35 to 44 Years | 0 (0.0%) | 8 (100.0%) |
| 45 to 54 Years | 0 (0.0%) | 1 (100.0%) |
| 55 to 64 Years | 6 (100.0%) | 0 (0.0%) |
| 65 to 74 Years | 0 (0.0%) | 4 (100.0%) |
| 75 Years and over | 0 (0.0%) | 0 (0.0%) |
| Total | 31 (100.0%) | 42 (100.0%) |
Income Below Poverty Among Married-Couple Families in Wolf Lake
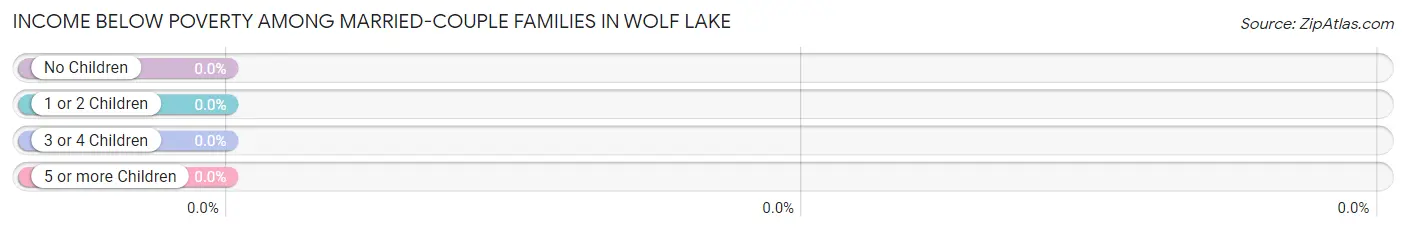
| Children | Above Poverty | Below Poverty |
| No Children | 3 (100.0%) | 0 (0.0%) |
| 1 or 2 Children | 8 (100.0%) | 0 (0.0%) |
| 3 or 4 Children | 2 (100.0%) | 0 (0.0%) |
| 5 or more Children | 0 (0.0%) | 0 (0.0%) |
| Total | 13 (100.0%) | 0 (0.0%) |
Income Below Poverty Among Single-Parent Households in Wolf Lake
| Children | Single Father | Single Mother |
| No Children | 0 (0.0%) | 0 (0.0%) |
| 1 or 2 Children | 0 (0.0%) | 0 (0.0%) |
| 3 or 4 Children | 0 (0.0%) | 0 (0.0%) |
| 5 or more Children | 0 (0.0%) | 0 (0.0%) |
| Total | 0 (0.0%) | 0 (0.0%) |
Income Below Poverty Among Married-Couple vs Single-Parent Households in Wolf Lake
| Children | Married-Couple Families | Single-Parent Households |
| No Children | 0 (0.0%) | 0 (0.0%) |
| 1 or 2 Children | 0 (0.0%) | 0 (0.0%) |
| 3 or 4 Children | 0 (0.0%) | 0 (0.0%) |
| 5 or more Children | 0 (0.0%) | 0 (0.0%) |
| Total | 0 (0.0%) | 0 (0.0%) |
Race in Wolf Lake
The most populous races in Wolf Lake are White / Caucasian (70 | 95.9%), and Asian (3 | 4.1%).
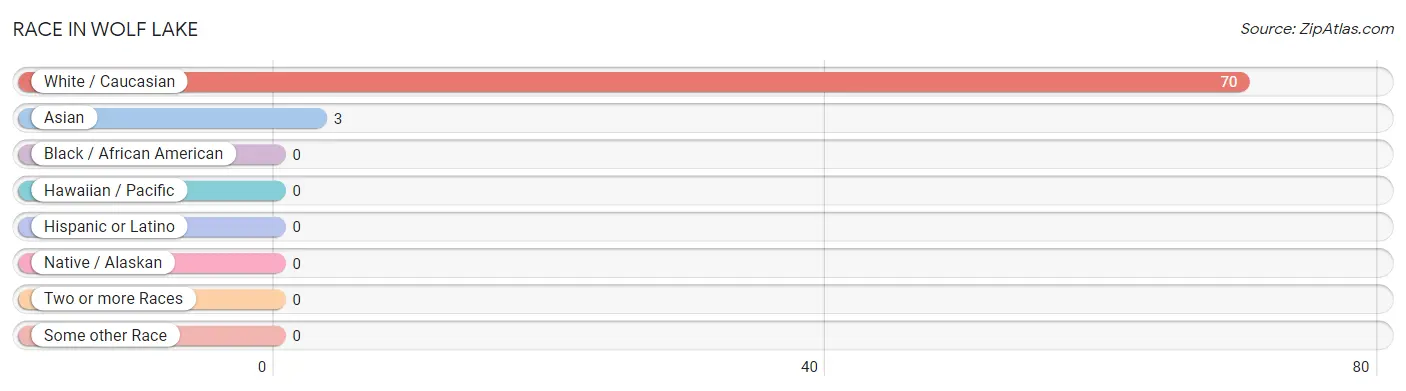
| Race | # Population | % Population |
| Asian | 3 | 4.1% |
| Black / African American | 0 | 0.0% |
| Hawaiian / Pacific | 0 | 0.0% |
| Hispanic or Latino | 0 | 0.0% |
| Native / Alaskan | 0 | 0.0% |
| White / Caucasian | 70 | 95.9% |
| Two or more Races | 0 | 0.0% |
| Some other Race | 0 | 0.0% |
| Total | 73 | 100.0% |
Ancestry in Wolf Lake
The most populous ancestries reported in Wolf Lake are Finnish (49 | 67.1%), Burmese (3 | 4.1%), and German (3 | 4.1%), together accounting for 75.3% of all Wolf Lake residents.
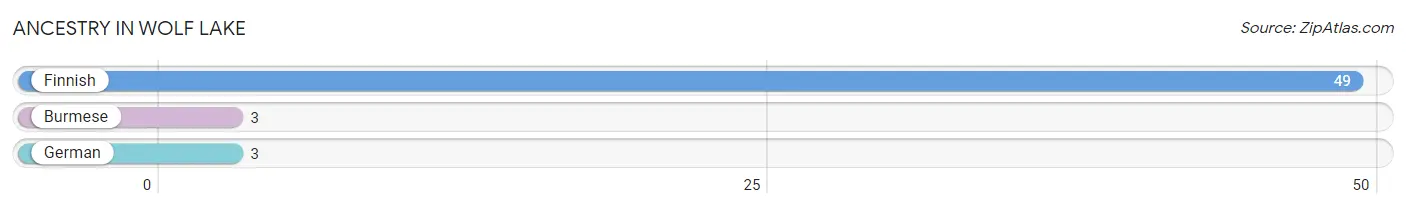
| Ancestry | # Population | % Population |
| Burmese | 3 | 4.1% |
| Finnish | 49 | 67.1% |
| German | 3 | 4.1% | View All 3 Rows |
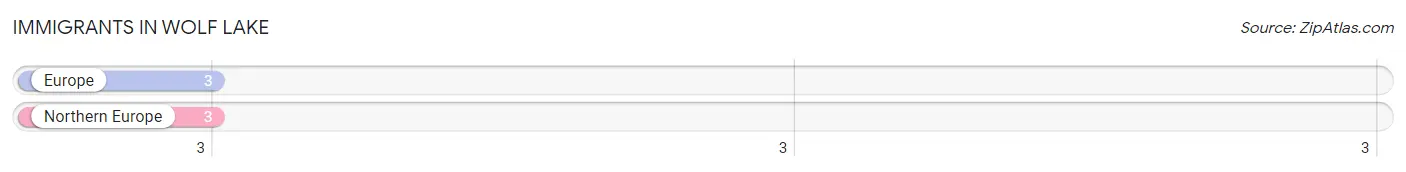
Immigrants in Wolf Lake
The most numerous immigrant groups reported in Wolf Lake came from Europe (3 | 4.1%), and Northern Europe (3 | 4.1%), together accounting for 8.2% of all Wolf Lake residents.
| Immigration Origin | # Population | % Population |
| Europe | 3 | 4.1% |
| Northern Europe | 3 | 4.1% | View All 2 Rows |
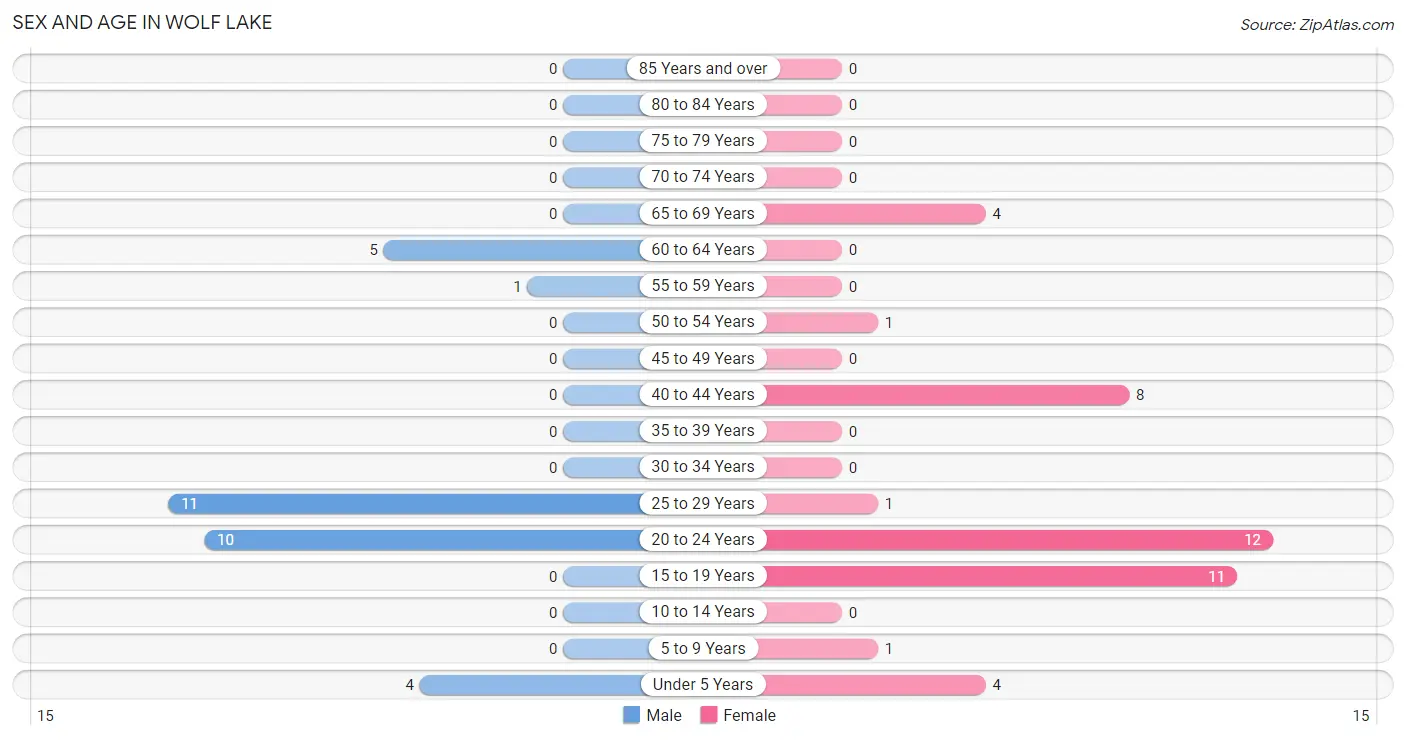
Sex and Age in Wolf Lake
Sex and Age in Wolf Lake
The most populous age groups in Wolf Lake are 25 to 29 Years (11 | 35.5%) for men and 20 to 24 Years (12 | 28.6%) for women.
| Age Bracket | Male | Female |
| Under 5 Years | 4 (12.9%) | 4 (9.5%) |
| 5 to 9 Years | 0 (0.0%) | 1 (2.4%) |
| 10 to 14 Years | 0 (0.0%) | 0 (0.0%) |
| 15 to 19 Years | 0 (0.0%) | 11 (26.2%) |
| 20 to 24 Years | 10 (32.3%) | 12 (28.6%) |
| 25 to 29 Years | 11 (35.5%) | 1 (2.4%) |
| 30 to 34 Years | 0 (0.0%) | 0 (0.0%) |
| 35 to 39 Years | 0 (0.0%) | 0 (0.0%) |
| 40 to 44 Years | 0 (0.0%) | 8 (19.1%) |
| 45 to 49 Years | 0 (0.0%) | 0 (0.0%) |
| 50 to 54 Years | 0 (0.0%) | 1 (2.4%) |
| 55 to 59 Years | 1 (3.2%) | 0 (0.0%) |
| 60 to 64 Years | 5 (16.1%) | 0 (0.0%) |
| 65 to 69 Years | 0 (0.0%) | 4 (9.5%) |
| 70 to 74 Years | 0 (0.0%) | 0 (0.0%) |
| 75 to 79 Years | 0 (0.0%) | 0 (0.0%) |
| 80 to 84 Years | 0 (0.0%) | 0 (0.0%) |
| 85 Years and over | 0 (0.0%) | 0 (0.0%) |
| Total | 31 (100.0%) | 42 (100.0%) |
Families and Households in Wolf Lake
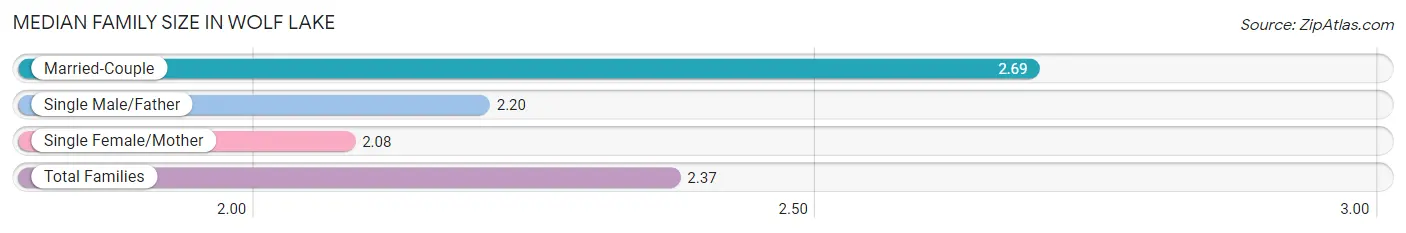
Median Family Size in Wolf Lake
The median family size in Wolf Lake is 2.37 persons per family, with married-couple families (13 | 43.3%) accounting for the largest median family size of 2.69 persons per family. On the other hand, single female/mother families (12 | 40.0%) represent the smallest median family size with 2.08 persons per family.
| Family Type | # Families | Family Size |
| Married-Couple | 13 (43.3%) | 2.69 |
| Single Male/Father | 5 (16.7%) | 2.20 |
| Single Female/Mother | 12 (40.0%) | 2.08 |
| Total Families | 30 (100.0%) | 2.37 |
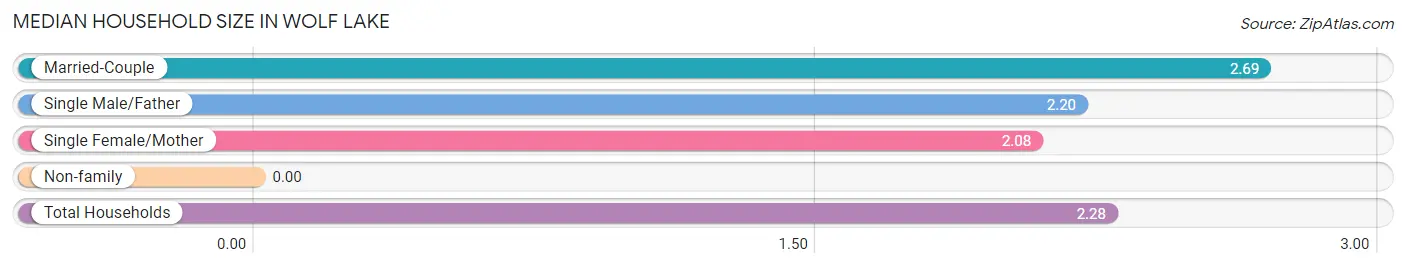
Median Household Size in Wolf Lake
| Household Type | # Households | Household Size |
| Married-Couple | 13 (40.6%) | 2.69 |
| Single Male/Father | 5 (15.6%) | 2.20 |
| Single Female/Mother | 12 (37.5%) | 2.08 |
| Non-family | 2 (6.2%) | - |
| Total Households | 32 (100.0%) | 2.28 |
Household Size by Marriage Status in Wolf Lake
Out of a total of 32 households in Wolf Lake, 30 (93.8%) are family households, while 2 (6.2%) are nonfamily households. The most numerous type of family households are 2-person households, comprising 19, and the most common type of nonfamily households are 1-person households, comprising 2.
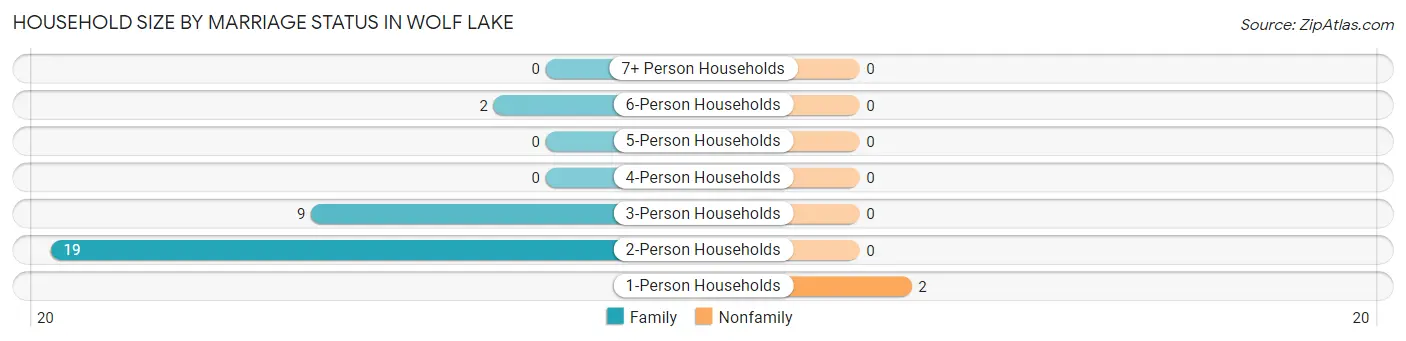
| Household Size | Family Households | Nonfamily Households |
| 1-Person Households | - | 2 (6.2%) |
| 2-Person Households | 19 (59.4%) | 0 (0.0%) |
| 3-Person Households | 9 (28.1%) | 0 (0.0%) |
| 4-Person Households | 0 (0.0%) | 0 (0.0%) |
| 5-Person Households | 0 (0.0%) | 0 (0.0%) |
| 6-Person Households | 2 (6.2%) | 0 (0.0%) |
| 7+ Person Households | 0 (0.0%) | 0 (0.0%) |
| Total | 30 (93.8%) | 2 (6.2%) |
Female Fertility in Wolf Lake
Fertility by Age in Wolf Lake
Average fertility rate in Wolf Lake is 94.0 births per 1,000 women. Women in the age bracket of 20 to 34 years have the highest fertility rate with 231.0 births per 1,000 women. Women in the age bracket of 20 to 34 years acount for 100.0% of all women with births.
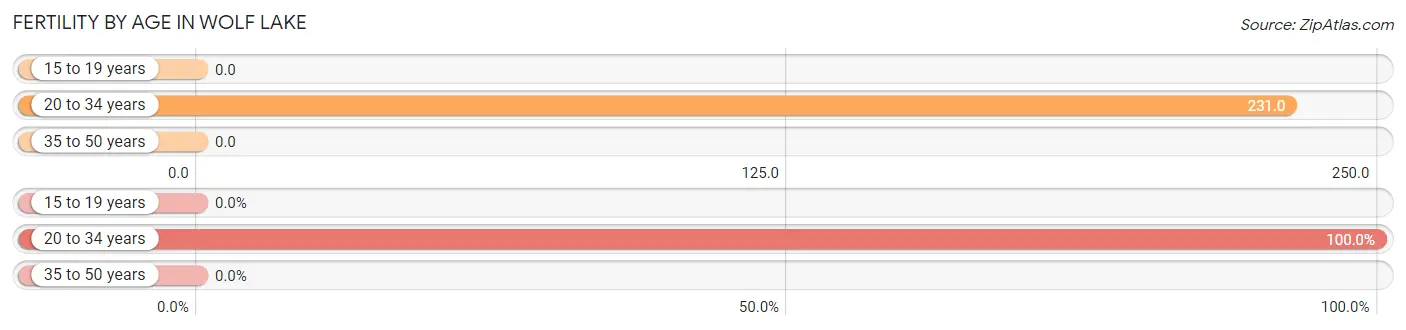
| Age Bracket | Women with Births | Births / 1,000 Women |
| 15 to 19 years | 0 (0.0%) | 0.0 |
| 20 to 34 years | 3 (100.0%) | 231.0 |
| 35 to 50 years | 0 (0.0%) | 0.0 |
| Total | 3 (100.0%) | 94.0 |
Fertility by Age by Marriage Status in Wolf Lake
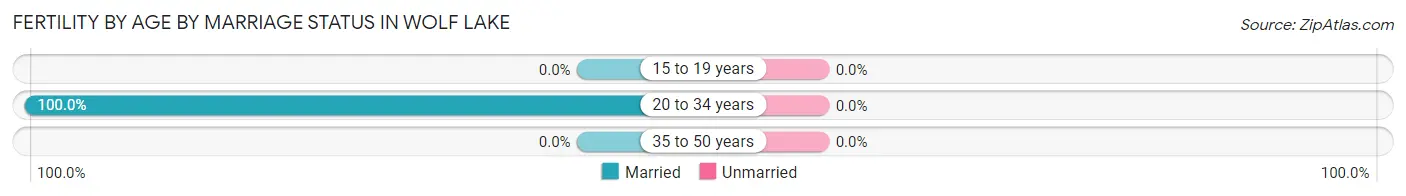
| Age Bracket | Married | Unmarried |
| 15 to 19 years | 0 (0.0%) | 0 (0.0%) |
| 20 to 34 years | 3 (100.0%) | 0 (0.0%) |
| 35 to 50 years | 0 (0.0%) | 0 (0.0%) |
| Total | 3 (100.0%) | 0 (0.0%) |
Fertility by Education in Wolf Lake
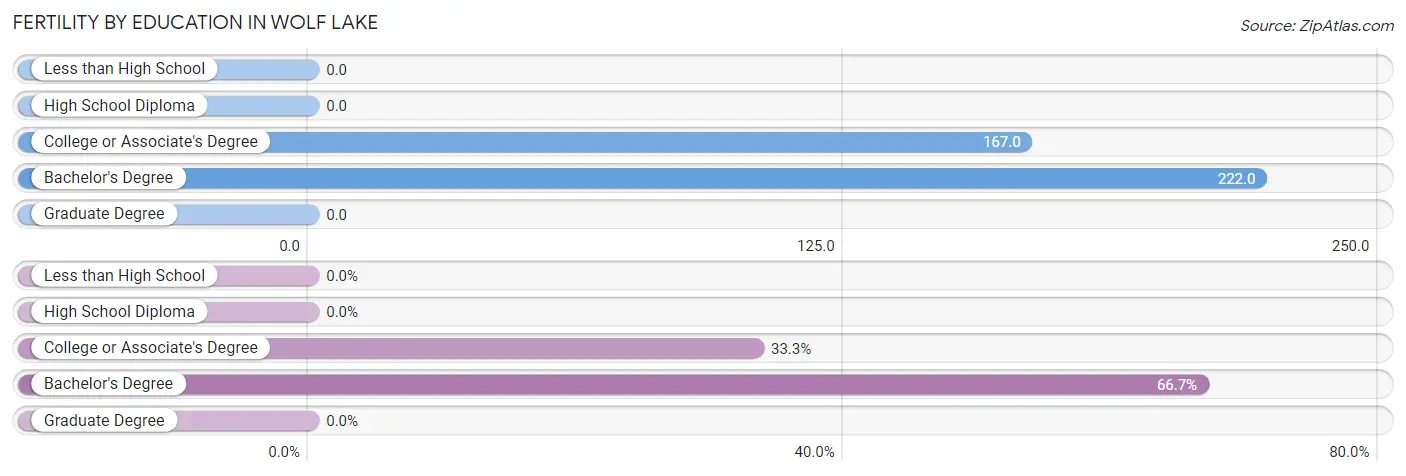
| Educational Attainment | Women with Births | Births / 1,000 Women |
| Less than High School | 0 (0.0%) | 0.0 |
| High School Diploma | 0 (0.0%) | 0.0 |
| College or Associate's Degree | 1 (33.3%) | 167.0 |
| Bachelor's Degree | 2 (66.7%) | 222.0 |
| Graduate Degree | 0 (0.0%) | 0.0 |
| Total | 3 (100.0%) | 94.0 |
Fertility by Education by Marriage Status in Wolf Lake
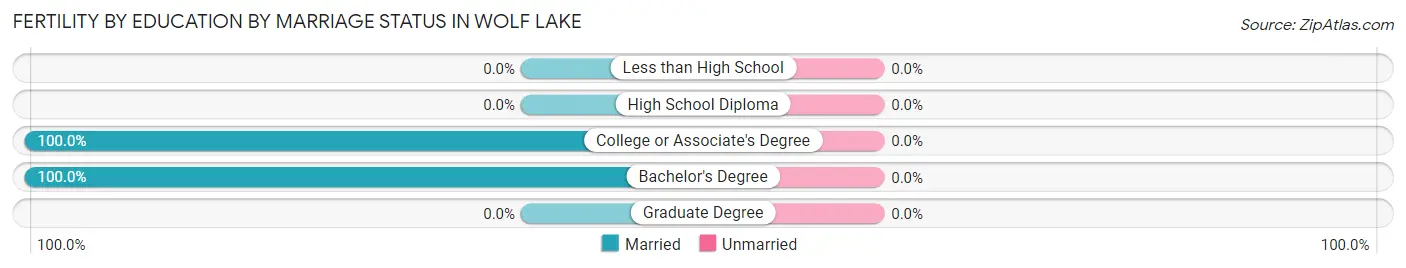
| Educational Attainment | Married | Unmarried |
| Less than High School | 0 (0.0%) | 0 (0.0%) |
| High School Diploma | 0 (0.0%) | 0 (0.0%) |
| College or Associate's Degree | 1 (100.0%) | 0 (0.0%) |
| Bachelor's Degree | 2 (100.0%) | 0 (0.0%) |
| Graduate Degree | 0 (0.0%) | 0 (0.0%) |
| Total | 3 (100.0%) | 0 (0.0%) |
Employment Characteristics in Wolf Lake
Employment by Class of Employer in Wolf Lake
Among the 47 employed individuals in Wolf Lake, private company employees (39 | 83.0%), self-employed (not incorporated) (4 | 8.5%), and state government employees (3 | 6.4%) make up the most common classes of employment.
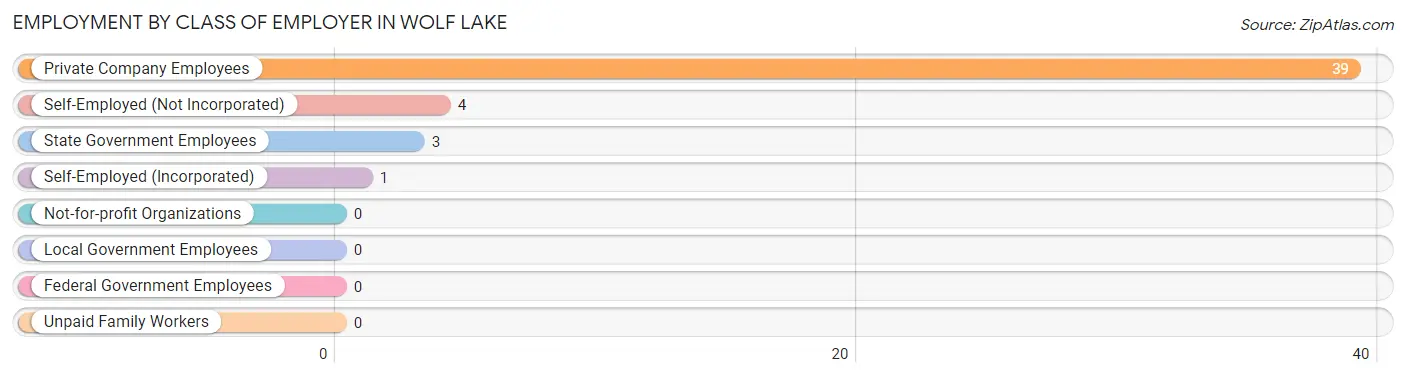
| Employer Class | # Employees | % Employees |
| Private Company Employees | 39 | 83.0% |
| Self-Employed (Incorporated) | 1 | 2.1% |
| Self-Employed (Not Incorporated) | 4 | 8.5% |
| Not-for-profit Organizations | 0 | 0.0% |
| Local Government Employees | 0 | 0.0% |
| State Government Employees | 3 | 6.4% |
| Federal Government Employees | 0 | 0.0% |
| Unpaid Family Workers | 0 | 0.0% |
| Total | 47 | 100.0% |
Employment Status by Age in Wolf Lake
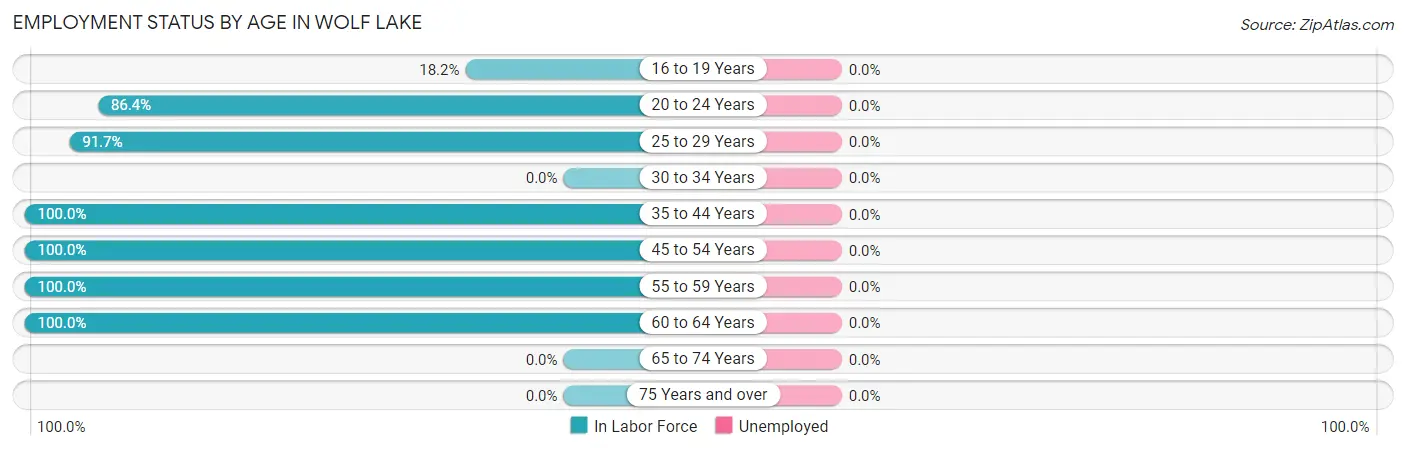
| Age Bracket | In Labor Force | Unemployed |
| 16 to 19 Years | 2 (18.2%) | 0 (0.0%) |
| 20 to 24 Years | 19 (86.4%) | 0 (0.0%) |
| 25 to 29 Years | 11 (91.7%) | 0 (0.0%) |
| 30 to 34 Years | 0 (0.0%) | 0 (0.0%) |
| 35 to 44 Years | 8 (100.0%) | 0 (0.0%) |
| 45 to 54 Years | 1 (100.0%) | 0 (0.0%) |
| 55 to 59 Years | 1 (100.0%) | 0 (0.0%) |
| 60 to 64 Years | 5 (100.0%) | 0 (0.0%) |
| 65 to 74 Years | 0 (0.0%) | 0 (0.0%) |
| 75 Years and over | 0 (0.0%) | 0 (0.0%) |
| Total | 47 (73.4%) | 0 (0.0%) |
Employment Status by Educational Attainment in Wolf Lake
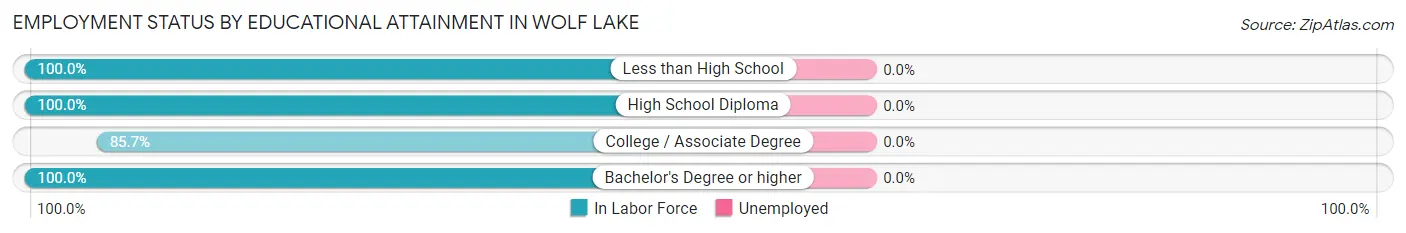
| Educational Attainment | In Labor Force | Unemployed |
| Less than High School | 6 (100.0%) | 0 (0.0%) |
| High School Diploma | 12 (100.0%) | 0 (0.0%) |
| College / Associate Degree | 6 (85.7%) | 0 (0.0%) |
| Bachelor's Degree or higher | 2 (100.0%) | 0 (0.0%) |
| Total | 26 (96.3%) | 0 (0.0%) |
Employment Occupations by Sex in Wolf Lake
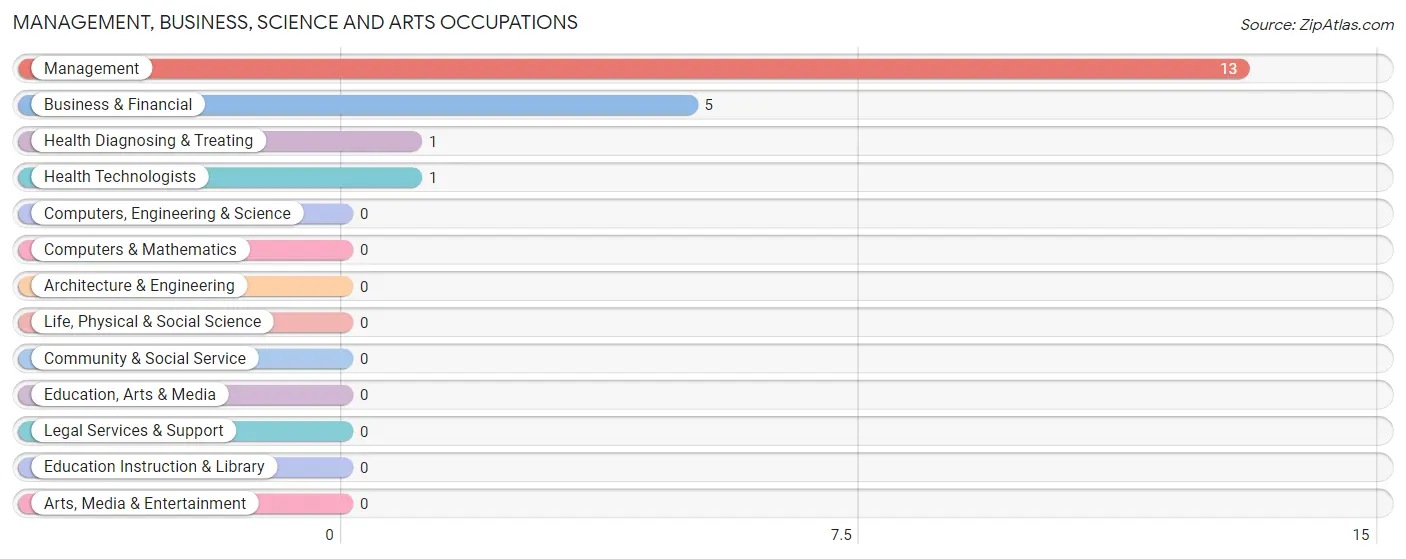
Management, Business, Science and Arts Occupations
The most common Management, Business, Science and Arts occupations in Wolf Lake are Management (13 | 27.7%), Business & Financial (5 | 10.6%), Health Diagnosing & Treating (1 | 2.1%), and Health Technologists (1 | 2.1%).
Management, Business, Science and Arts Occupations by Sex
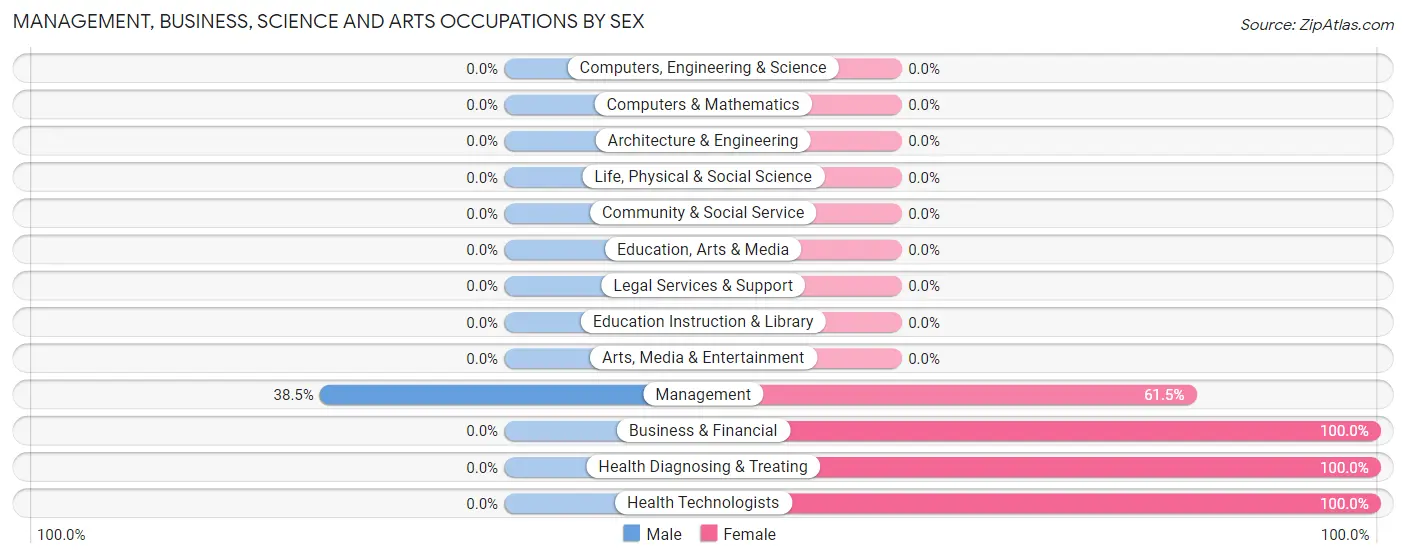
| Occupation | Male | Female |
| Management | 5 (38.5%) | 8 (61.5%) |
| Business & Financial | 0 (0.0%) | 5 (100.0%) |
| Computers, Engineering & Science | 0 (0.0%) | 0 (0.0%) |
| Computers & Mathematics | 0 (0.0%) | 0 (0.0%) |
| Architecture & Engineering | 0 (0.0%) | 0 (0.0%) |
| Life, Physical & Social Science | 0 (0.0%) | 0 (0.0%) |
| Community & Social Service | 0 (0.0%) | 0 (0.0%) |
| Education, Arts & Media | 0 (0.0%) | 0 (0.0%) |
| Legal Services & Support | 0 (0.0%) | 0 (0.0%) |
| Education Instruction & Library | 0 (0.0%) | 0 (0.0%) |
| Arts, Media & Entertainment | 0 (0.0%) | 0 (0.0%) |
| Health Diagnosing & Treating | 0 (0.0%) | 1 (100.0%) |
| Health Technologists | 0 (0.0%) | 1 (100.0%) |
| Total (Category) | 5 (26.3%) | 14 (73.7%) |
| Total (Overall) | 27 (57.5%) | 20 (42.5%) |
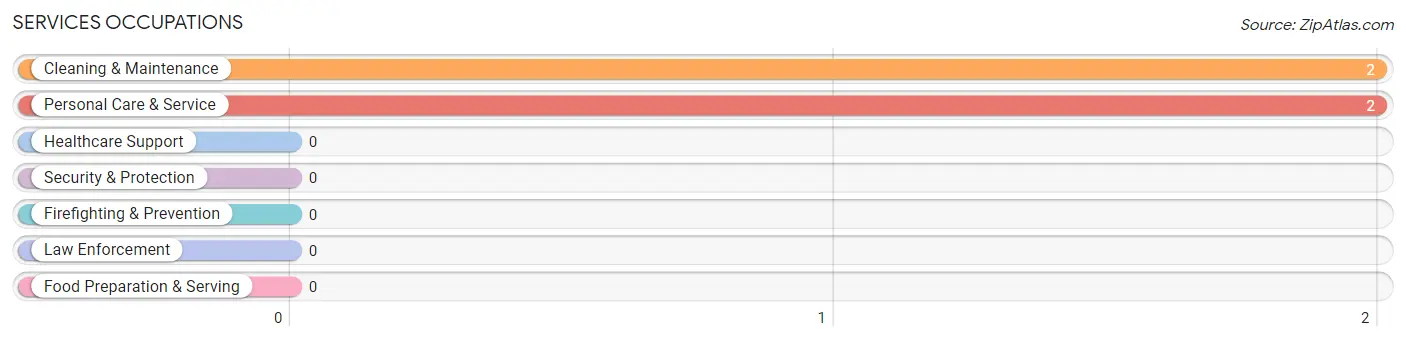
Services Occupations
The most common Services occupations in Wolf Lake are Cleaning & Maintenance (2 | 4.3%), and Personal Care & Service (2 | 4.3%).
Services Occupations by Sex
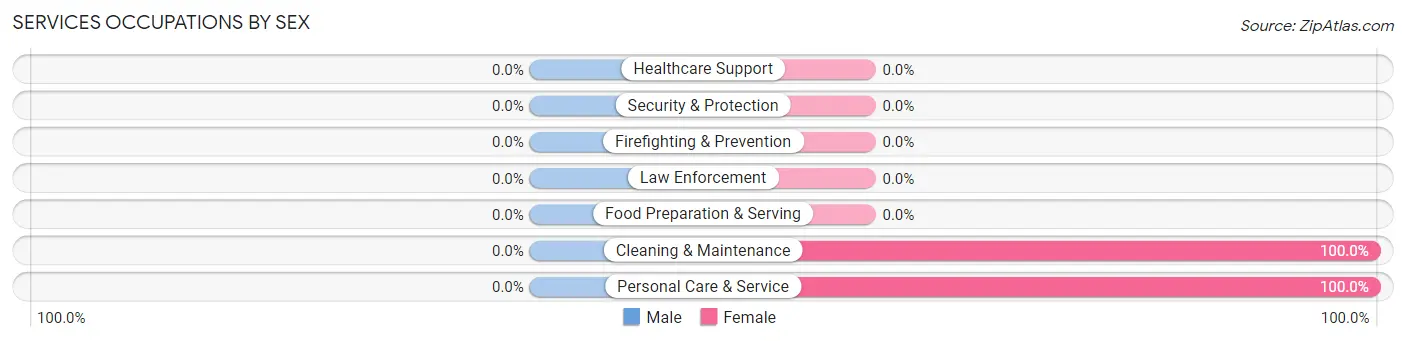
| Occupation | Male | Female |
| Healthcare Support | 0 (0.0%) | 0 (0.0%) |
| Security & Protection | 0 (0.0%) | 0 (0.0%) |
| Firefighting & Prevention | 0 (0.0%) | 0 (0.0%) |
| Law Enforcement | 0 (0.0%) | 0 (0.0%) |
| Food Preparation & Serving | 0 (0.0%) | 0 (0.0%) |
| Cleaning & Maintenance | 0 (0.0%) | 2 (100.0%) |
| Personal Care & Service | 0 (0.0%) | 2 (100.0%) |
| Total (Category) | 0 (0.0%) | 4 (100.0%) |
| Total (Overall) | 27 (57.5%) | 20 (42.5%) |
Sales and Office Occupations
Sales and Office Occupations by Sex
| Occupation | Male | Female |
| Sales & Related | 0 (0.0%) | 0 (0.0%) |
| Office & Administration | 0 (0.0%) | 0 (0.0%) |
| Total (Category) | 0 (0.0%) | 0 (0.0%) |
| Total (Overall) | 27 (57.5%) | 20 (42.5%) |
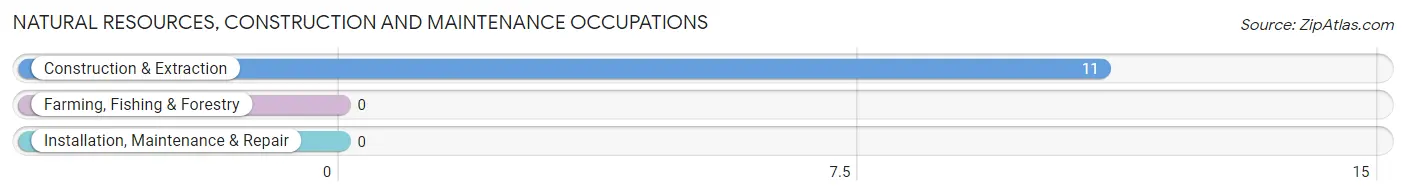
Natural Resources, Construction and Maintenance Occupations
The most common Natural Resources, Construction and Maintenance occupations in Wolf Lake are , and Construction & Extraction (11 | 23.4%).
Natural Resources, Construction and Maintenance Occupations by Sex
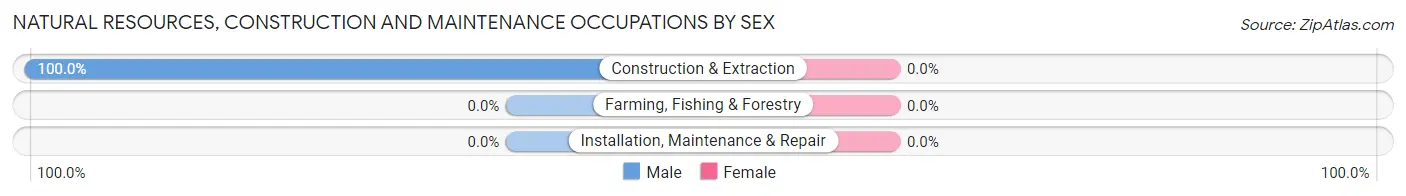
| Occupation | Male | Female |
| Farming, Fishing & Forestry | 0 (0.0%) | 0 (0.0%) |
| Construction & Extraction | 11 (100.0%) | 0 (0.0%) |
| Installation, Maintenance & Repair | 0 (0.0%) | 0 (0.0%) |
| Total (Category) | 11 (100.0%) | 0 (0.0%) |
| Total (Overall) | 27 (57.5%) | 20 (42.5%) |
Production, Transportation and Moving Occupations
The most common Production, Transportation and Moving occupations in Wolf Lake are Transportation (7 | 14.9%), and Production (6 | 12.8%).
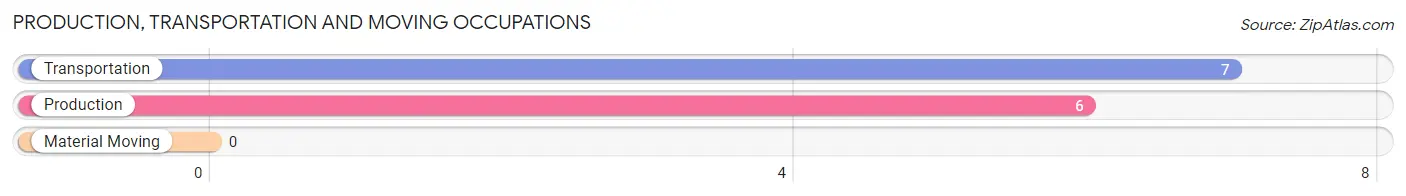
Production, Transportation and Moving Occupations by Sex
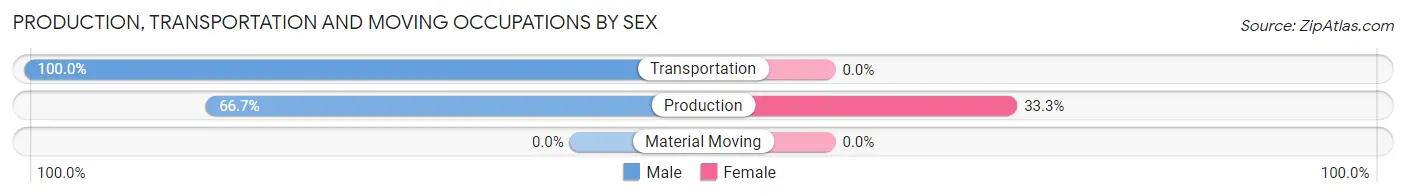
| Occupation | Male | Female |
| Production | 4 (66.7%) | 2 (33.3%) |
| Transportation | 7 (100.0%) | 0 (0.0%) |
| Material Moving | 0 (0.0%) | 0 (0.0%) |
| Total (Category) | 11 (84.6%) | 2 (15.4%) |
| Total (Overall) | 27 (57.5%) | 20 (42.5%) |
Employment Industries by Sex in Wolf Lake
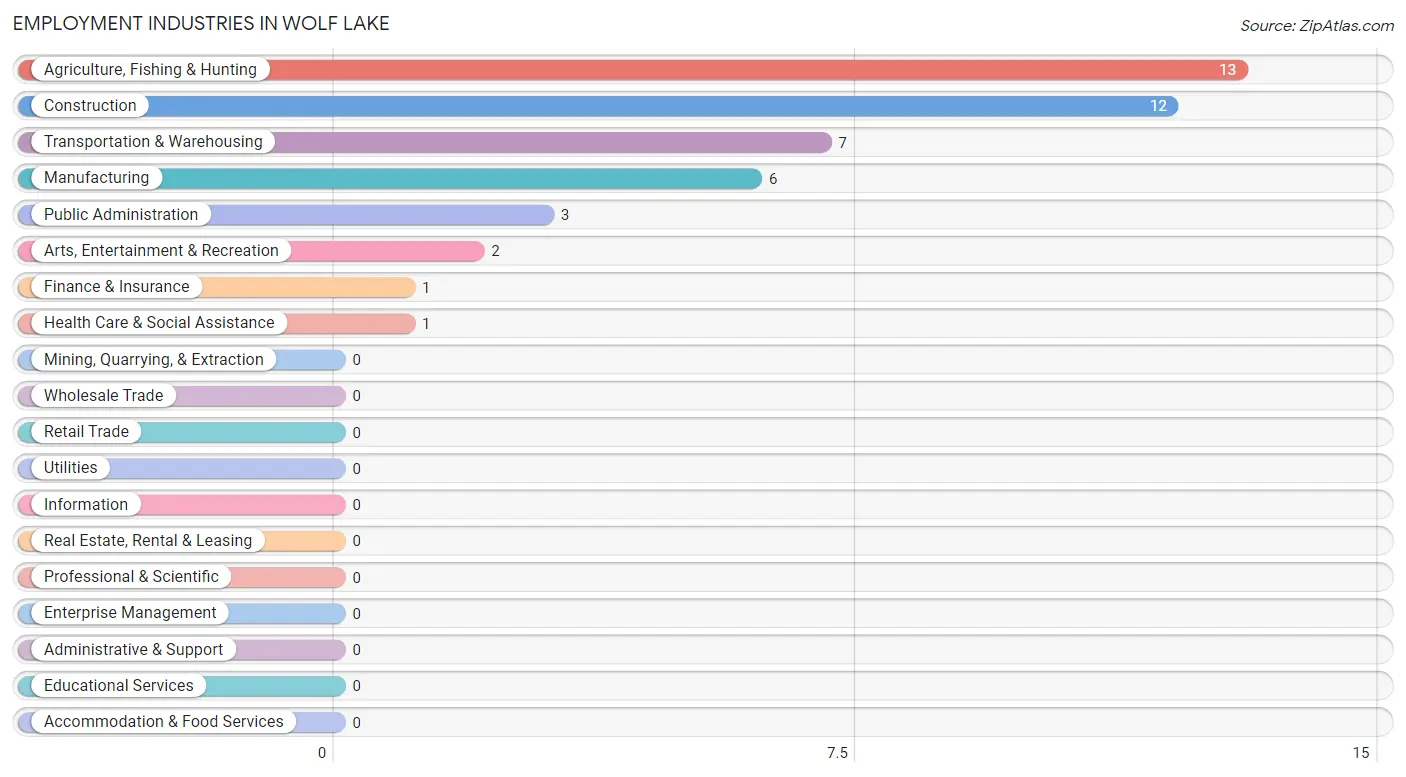
Employment Industries in Wolf Lake
The major employment industries in Wolf Lake include Agriculture, Fishing & Hunting (13 | 27.7%), Construction (12 | 25.5%), Transportation & Warehousing (7 | 14.9%), Manufacturing (6 | 12.8%), and Public Administration (3 | 6.4%).
Employment Industries by Sex in Wolf Lake
The Wolf Lake industries that see more men than women are Construction (100.0%), Transportation & Warehousing (100.0%), and Finance & Insurance (100.0%), whereas the industries that tend to have a higher number of women are Health Care & Social Assistance (100.0%), Arts, Entertainment & Recreation (100.0%), and Public Administration (100.0%).
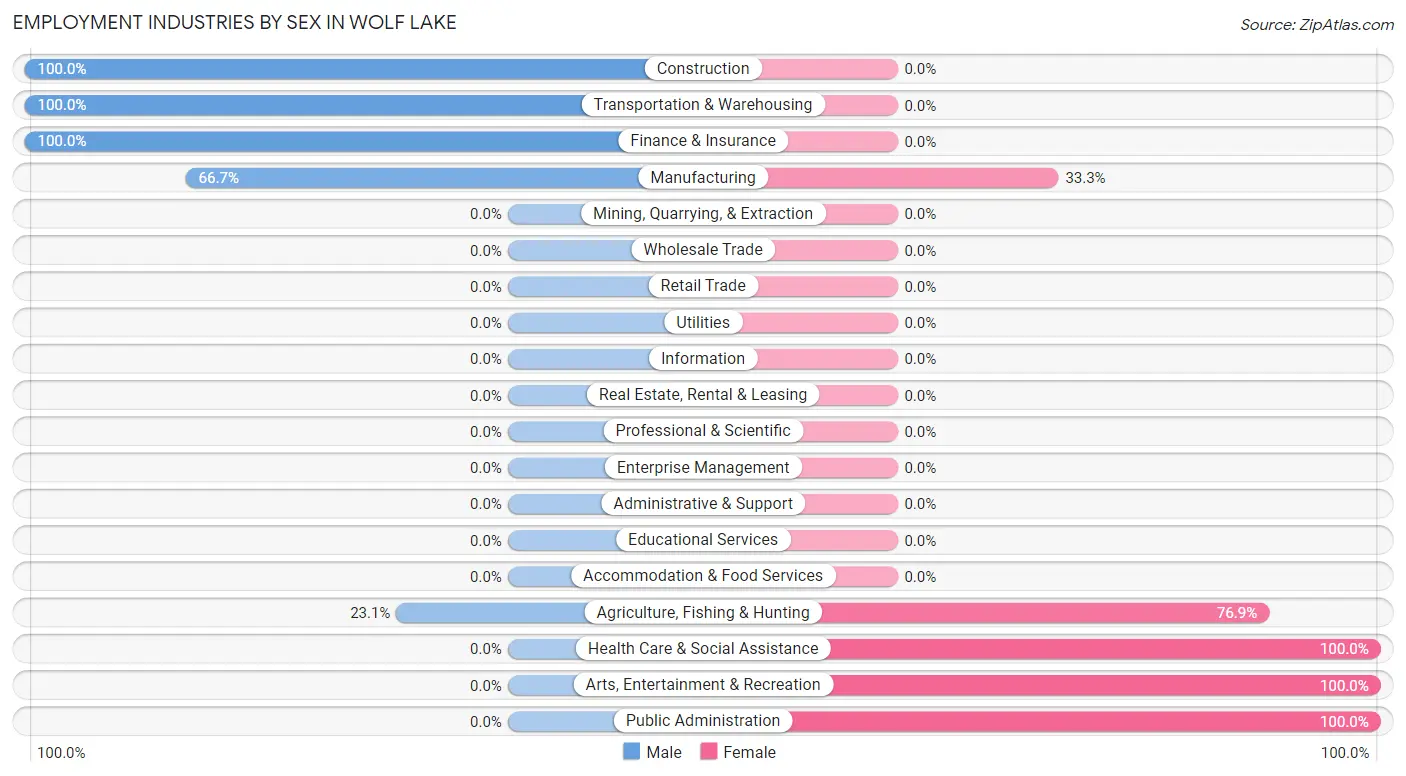
| Industry | Male | Female |
| Agriculture, Fishing & Hunting | 3 (23.1%) | 10 (76.9%) |
| Mining, Quarrying, & Extraction | 0 (0.0%) | 0 (0.0%) |
| Construction | 12 (100.0%) | 0 (0.0%) |
| Manufacturing | 4 (66.7%) | 2 (33.3%) |
| Wholesale Trade | 0 (0.0%) | 0 (0.0%) |
| Retail Trade | 0 (0.0%) | 0 (0.0%) |
| Transportation & Warehousing | 7 (100.0%) | 0 (0.0%) |
| Utilities | 0 (0.0%) | 0 (0.0%) |
| Information | 0 (0.0%) | 0 (0.0%) |
| Finance & Insurance | 1 (100.0%) | 0 (0.0%) |
| Real Estate, Rental & Leasing | 0 (0.0%) | 0 (0.0%) |
| Professional & Scientific | 0 (0.0%) | 0 (0.0%) |
| Enterprise Management | 0 (0.0%) | 0 (0.0%) |
| Administrative & Support | 0 (0.0%) | 0 (0.0%) |
| Educational Services | 0 (0.0%) | 0 (0.0%) |
| Health Care & Social Assistance | 0 (0.0%) | 1 (100.0%) |
| Arts, Entertainment & Recreation | 0 (0.0%) | 2 (100.0%) |
| Accommodation & Food Services | 0 (0.0%) | 0 (0.0%) |
| Public Administration | 0 (0.0%) | 3 (100.0%) |
| Total | 27 (57.5%) | 20 (42.5%) |
Education in Wolf Lake
School Enrollment in Wolf Lake
The most common levels of schooling among the 16 students in Wolf Lake are high school (8 | 50.0%), college / undergraduate (5 | 31.2%), and graduate / professional (2 | 12.5%).
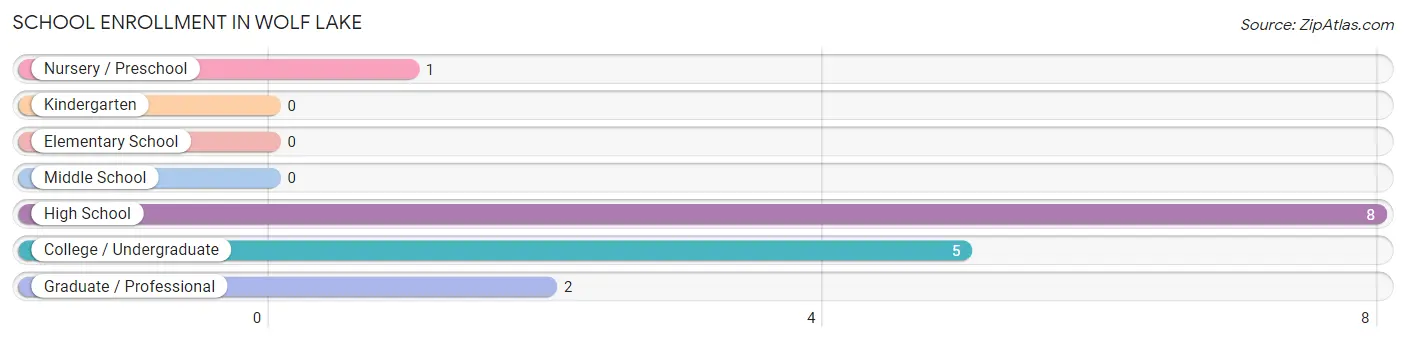
| School Level | # Students | % Students |
| Nursery / Preschool | 1 | 6.2% |
| Kindergarten | 0 | 0.0% |
| Elementary School | 0 | 0.0% |
| Middle School | 0 | 0.0% |
| High School | 8 | 50.0% |
| College / Undergraduate | 5 | 31.2% |
| Graduate / Professional | 2 | 12.5% |
| Total | 16 | 100.0% |
School Enrollment by Age by Funding Source in Wolf Lake
Out of a total of 16 students who are enrolled in schools in Wolf Lake, 8 (50.0%) attend a private institution, while the remaining 8 (50.0%) are enrolled in public schools. The age group of 15 to 17 year olds has the highest likelihood of being enrolled in private schools, with 6 (100.0% in the age bracket) enrolled. Conversely, the age group of 5 to 9 year old has the lowest likelihood of being enrolled in a private school, with 1 (100.0% in the age bracket) attending a public institution.
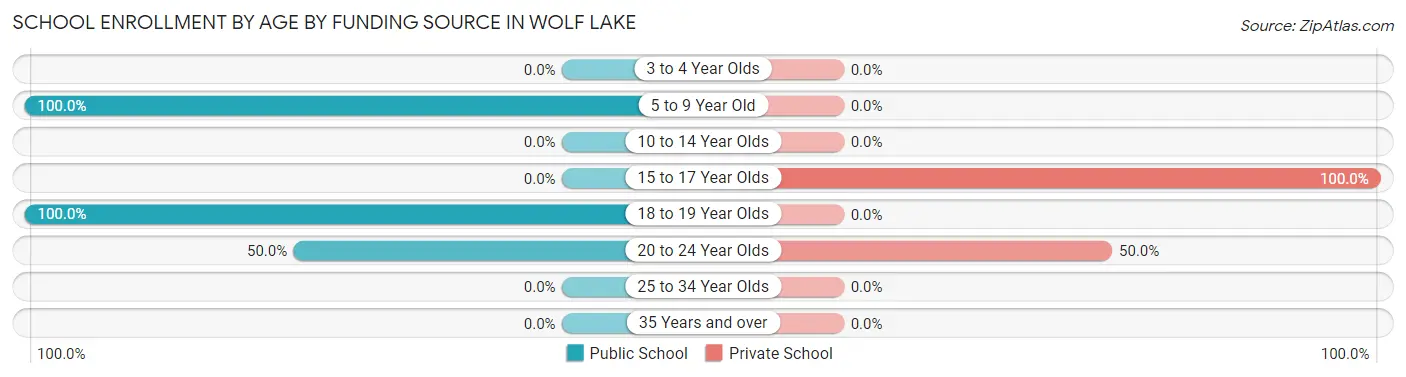
| Age Bracket | Public School | Private School |
| 3 to 4 Year Olds | 0 (0.0%) | 0 (0.0%) |
| 5 to 9 Year Old | 1 (100.0%) | 0 (0.0%) |
| 10 to 14 Year Olds | 0 (0.0%) | 0 (0.0%) |
| 15 to 17 Year Olds | 0 (0.0%) | 6 (100.0%) |
| 18 to 19 Year Olds | 5 (100.0%) | 0 (0.0%) |
| 20 to 24 Year Olds | 2 (50.0%) | 2 (50.0%) |
| 25 to 34 Year Olds | 0 (0.0%) | 0 (0.0%) |
| 35 Years and over | 0 (0.0%) | 0 (0.0%) |
| Total | 8 (50.0%) | 8 (50.0%) |
Educational Attainment by Field of Study in Wolf Lake
Business (4 | 50.0%), education (2 | 25.0%), and liberal arts & history (2 | 25.0%) are the most common fields of study among 8 individuals in Wolf Lake who have obtained a bachelor's degree or higher.
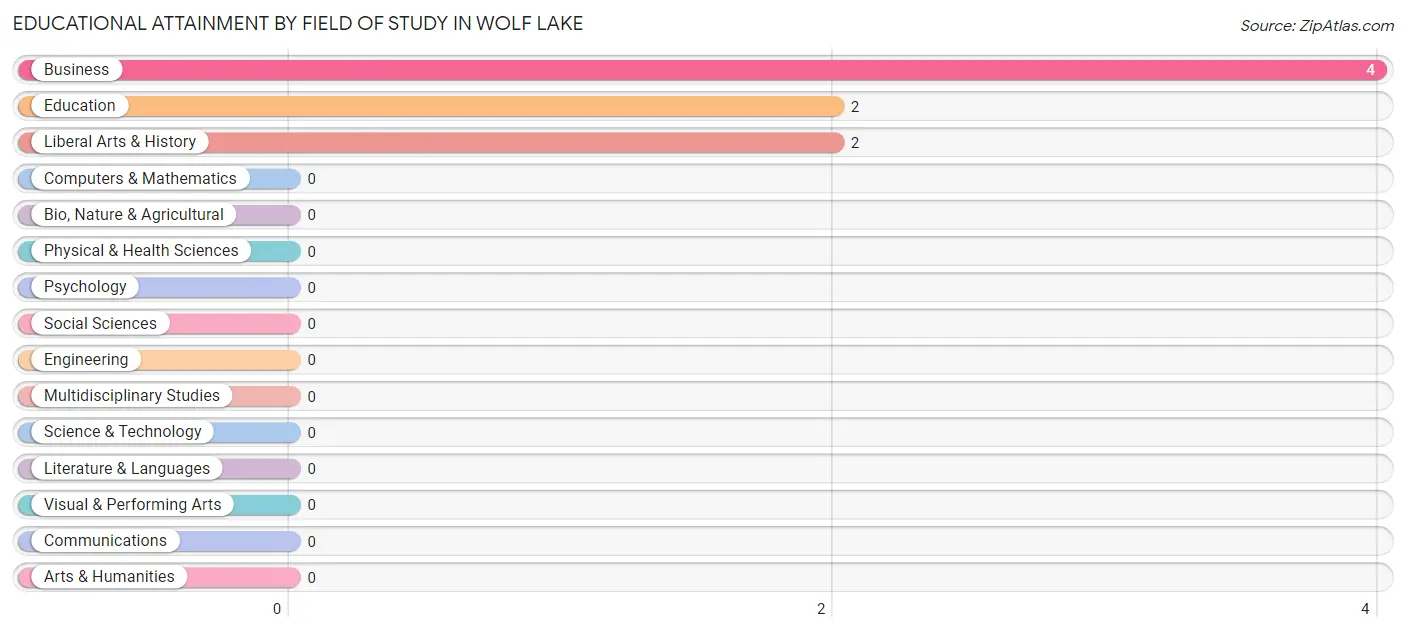
| Field of Study | # Graduates | % Graduates |
| Computers & Mathematics | 0 | 0.0% |
| Bio, Nature & Agricultural | 0 | 0.0% |
| Physical & Health Sciences | 0 | 0.0% |
| Psychology | 0 | 0.0% |
| Social Sciences | 0 | 0.0% |
| Engineering | 0 | 0.0% |
| Multidisciplinary Studies | 0 | 0.0% |
| Science & Technology | 0 | 0.0% |
| Business | 4 | 50.0% |
| Education | 2 | 25.0% |
| Literature & Languages | 0 | 0.0% |
| Liberal Arts & History | 2 | 25.0% |
| Visual & Performing Arts | 0 | 0.0% |
| Communications | 0 | 0.0% |
| Arts & Humanities | 0 | 0.0% |
| Total | 8 | 100.0% |
Transportation & Commute in Wolf Lake
Vehicle Availability by Sex in Wolf Lake
The most prevalent vehicle ownership categories in Wolf Lake are males with no vehicle (11, accounting for 40.7%) and females with no vehicle (0, making up 55.0%).
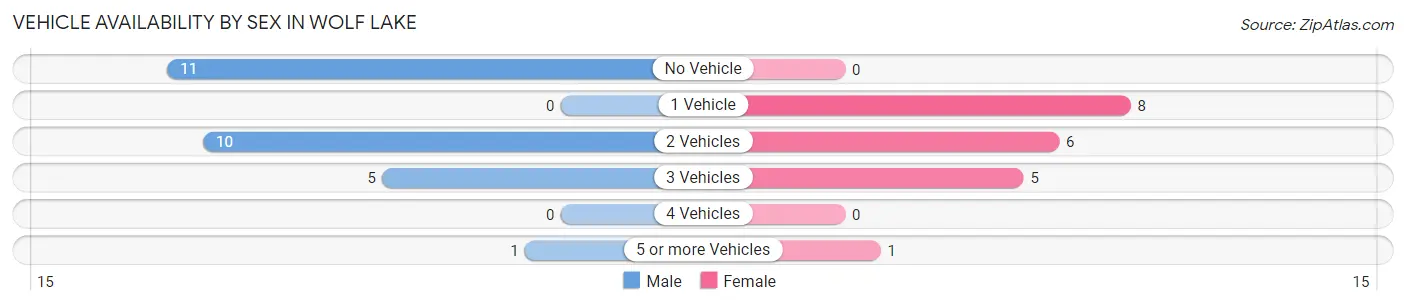
| Vehicles Available | Male | Female |
| No Vehicle | 11 (40.7%) | 0 (0.0%) |
| 1 Vehicle | 0 (0.0%) | 8 (40.0%) |
| 2 Vehicles | 10 (37.0%) | 6 (30.0%) |
| 3 Vehicles | 5 (18.5%) | 5 (25.0%) |
| 4 Vehicles | 0 (0.0%) | 0 (0.0%) |
| 5 or more Vehicles | 1 (3.7%) | 1 (5.0%) |
| Total | 27 (100.0%) | 20 (100.0%) |
Commute Time in Wolf Lake
The most frequently occuring commute durations in Wolf Lake are 5 to 9 minutes (14 commuters, 29.8%), 15 to 19 minutes (10 commuters, 21.3%), and 25 to 29 minutes (10 commuters, 21.3%).
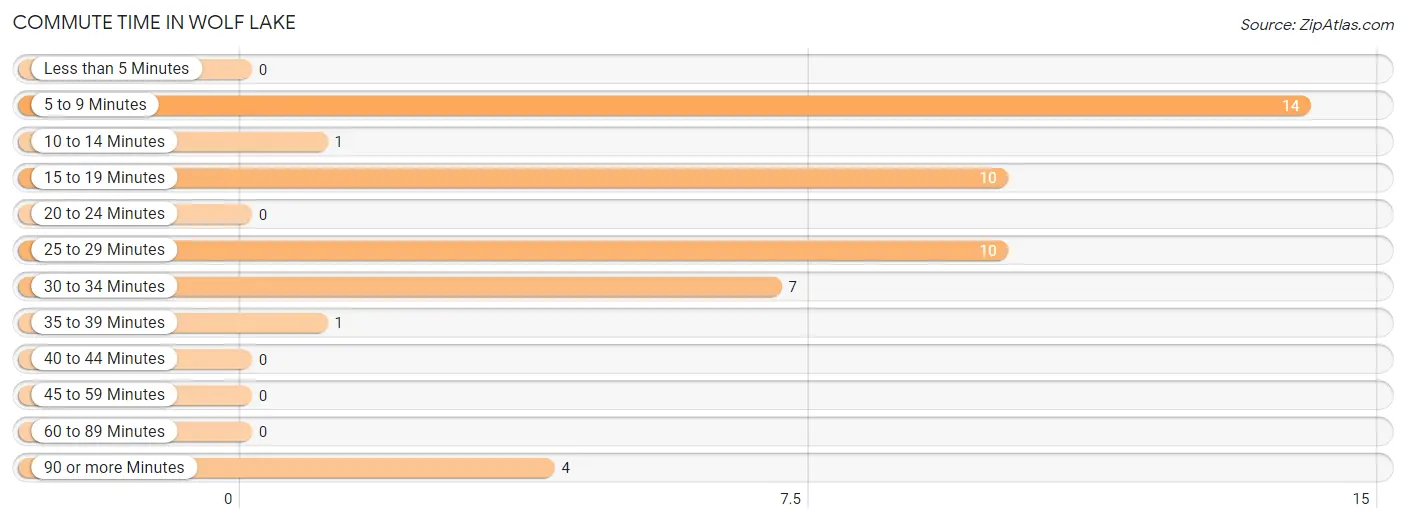
| Commute Time | # Commuters | % Commuters |
| Less than 5 Minutes | 0 | 0.0% |
| 5 to 9 Minutes | 14 | 29.8% |
| 10 to 14 Minutes | 1 | 2.1% |
| 15 to 19 Minutes | 10 | 21.3% |
| 20 to 24 Minutes | 0 | 0.0% |
| 25 to 29 Minutes | 10 | 21.3% |
| 30 to 34 Minutes | 7 | 14.9% |
| 35 to 39 Minutes | 1 | 2.1% |
| 40 to 44 Minutes | 0 | 0.0% |
| 45 to 59 Minutes | 0 | 0.0% |
| 60 to 89 Minutes | 0 | 0.0% |
| 90 or more Minutes | 4 | 8.5% |
Commute Time by Sex in Wolf Lake
The most common commute times in Wolf Lake are 5 to 9 minutes (12 commuters, 44.4%) for males and 15 to 19 minutes (8 commuters, 40.0%) for females.
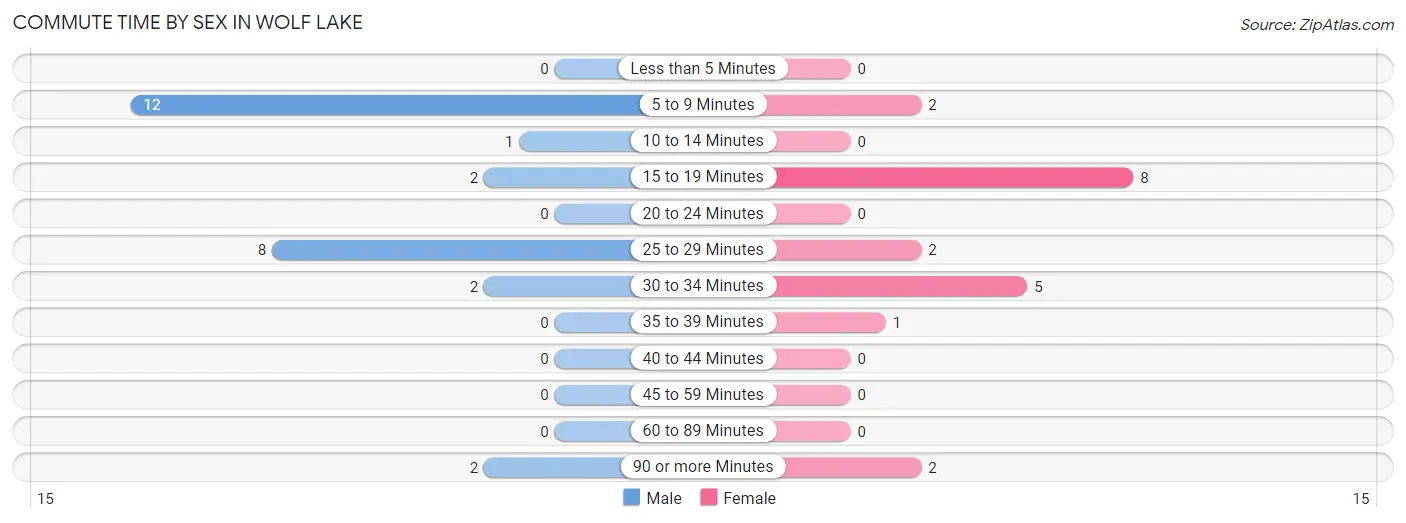
| Commute Time | Male | Female |
| Less than 5 Minutes | 0 (0.0%) | 0 (0.0%) |
| 5 to 9 Minutes | 12 (44.4%) | 2 (10.0%) |
| 10 to 14 Minutes | 1 (3.7%) | 0 (0.0%) |
| 15 to 19 Minutes | 2 (7.4%) | 8 (40.0%) |
| 20 to 24 Minutes | 0 (0.0%) | 0 (0.0%) |
| 25 to 29 Minutes | 8 (29.6%) | 2 (10.0%) |
| 30 to 34 Minutes | 2 (7.4%) | 5 (25.0%) |
| 35 to 39 Minutes | 0 (0.0%) | 1 (5.0%) |
| 40 to 44 Minutes | 0 (0.0%) | 0 (0.0%) |
| 45 to 59 Minutes | 0 (0.0%) | 0 (0.0%) |
| 60 to 89 Minutes | 0 (0.0%) | 0 (0.0%) |
| 90 or more Minutes | 2 (7.4%) | 2 (10.0%) |
Time of Departure to Work by Sex in Wolf Lake
The most frequent times of departure to work in Wolf Lake are 7:00 AM to 7:29 AM (11, 40.7%) for males and 7:30 AM to 7:59 AM (7, 35.0%) for females.
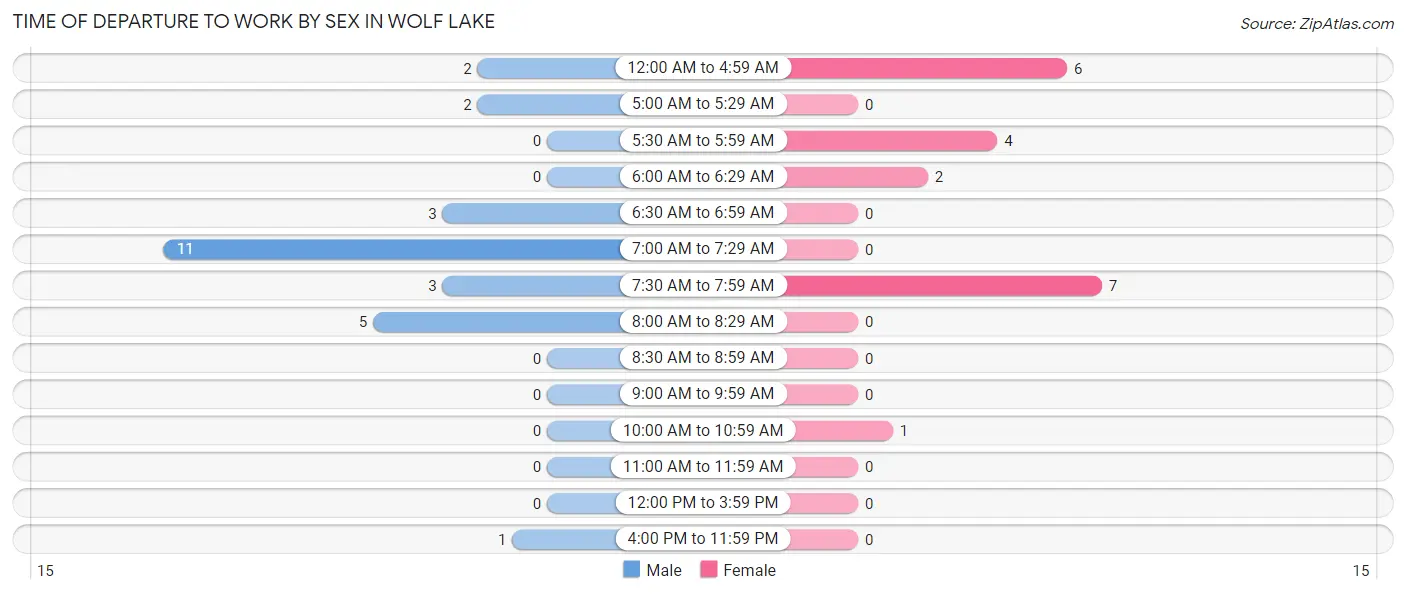
| Time of Departure | Male | Female |
| 12:00 AM to 4:59 AM | 2 (7.4%) | 6 (30.0%) |
| 5:00 AM to 5:29 AM | 2 (7.4%) | 0 (0.0%) |
| 5:30 AM to 5:59 AM | 0 (0.0%) | 4 (20.0%) |
| 6:00 AM to 6:29 AM | 0 (0.0%) | 2 (10.0%) |
| 6:30 AM to 6:59 AM | 3 (11.1%) | 0 (0.0%) |
| 7:00 AM to 7:29 AM | 11 (40.7%) | 0 (0.0%) |
| 7:30 AM to 7:59 AM | 3 (11.1%) | 7 (35.0%) |
| 8:00 AM to 8:29 AM | 5 (18.5%) | 0 (0.0%) |
| 8:30 AM to 8:59 AM | 0 (0.0%) | 0 (0.0%) |
| 9:00 AM to 9:59 AM | 0 (0.0%) | 0 (0.0%) |
| 10:00 AM to 10:59 AM | 0 (0.0%) | 1 (5.0%) |
| 11:00 AM to 11:59 AM | 0 (0.0%) | 0 (0.0%) |
| 12:00 PM to 3:59 PM | 0 (0.0%) | 0 (0.0%) |
| 4:00 PM to 11:59 PM | 1 (3.7%) | 0 (0.0%) |
| Total | 27 (100.0%) | 20 (100.0%) |
Housing Occupancy in Wolf Lake
Occupancy by Ownership in Wolf Lake
Of the total 32 dwellings in Wolf Lake, owner-occupied units account for 14 (43.8%), while renter-occupied units make up 18 (56.2%).
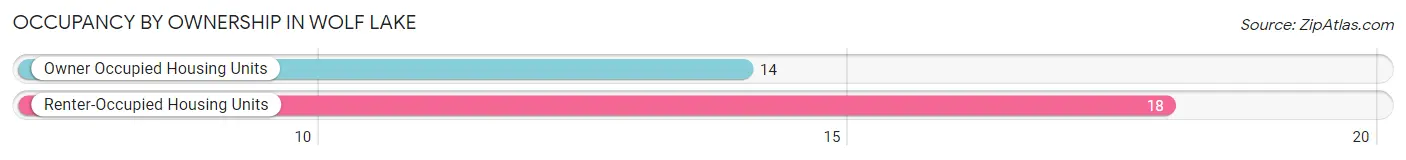
| Occupancy | # Housing Units | % Housing Units |
| Owner Occupied Housing Units | 14 | 43.8% |
| Renter-Occupied Housing Units | 18 | 56.2% |
| Total Occupied Housing Units | 32 | 100.0% |
Occupancy by Household Size in Wolf Lake
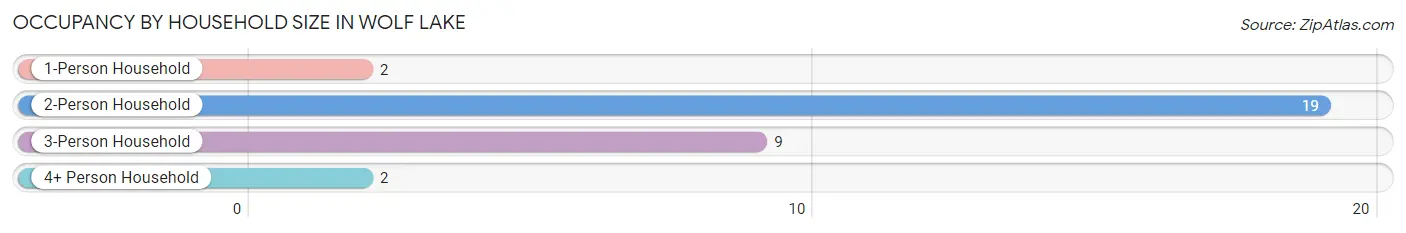
| Household Size | # Housing Units | % Housing Units |
| 1-Person Household | 2 | 6.2% |
| 2-Person Household | 19 | 59.4% |
| 3-Person Household | 9 | 28.1% |
| 4+ Person Household | 2 | 6.2% |
| Total Housing Units | 32 | 100.0% |
Occupancy by Ownership by Household Size in Wolf Lake
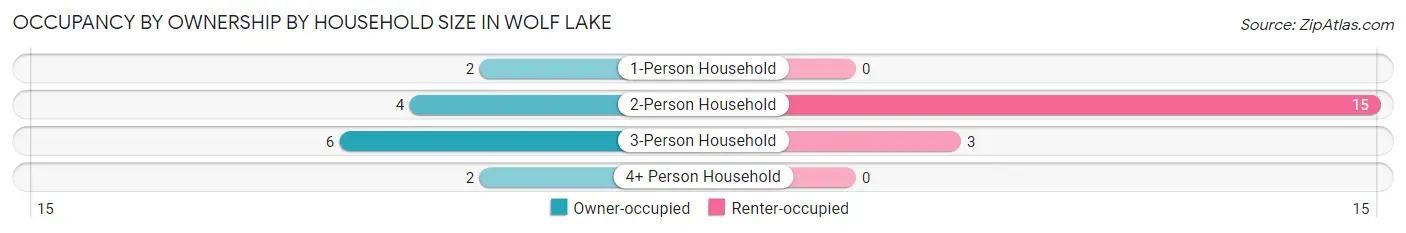
| Household Size | Owner-occupied | Renter-occupied |
| 1-Person Household | 2 (100.0%) | 0 (0.0%) |
| 2-Person Household | 4 (21.0%) | 15 (78.9%) |
| 3-Person Household | 6 (66.7%) | 3 (33.3%) |
| 4+ Person Household | 2 (100.0%) | 0 (0.0%) |
| Total Housing Units | 14 (43.8%) | 18 (56.2%) |
Occupancy by Educational Attainment in Wolf Lake
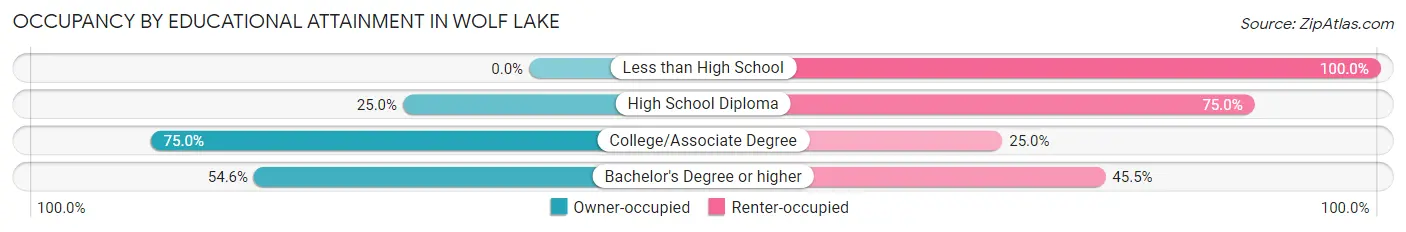
| Household Size | Owner-occupied | Renter-occupied |
| Less than High School | 0 (0.0%) | 5 (100.0%) |
| High School Diploma | 2 (25.0%) | 6 (75.0%) |
| College/Associate Degree | 6 (75.0%) | 2 (25.0%) |
| Bachelor's Degree or higher | 6 (54.5%) | 5 (45.5%) |
Occupancy by Age of Householder in Wolf Lake
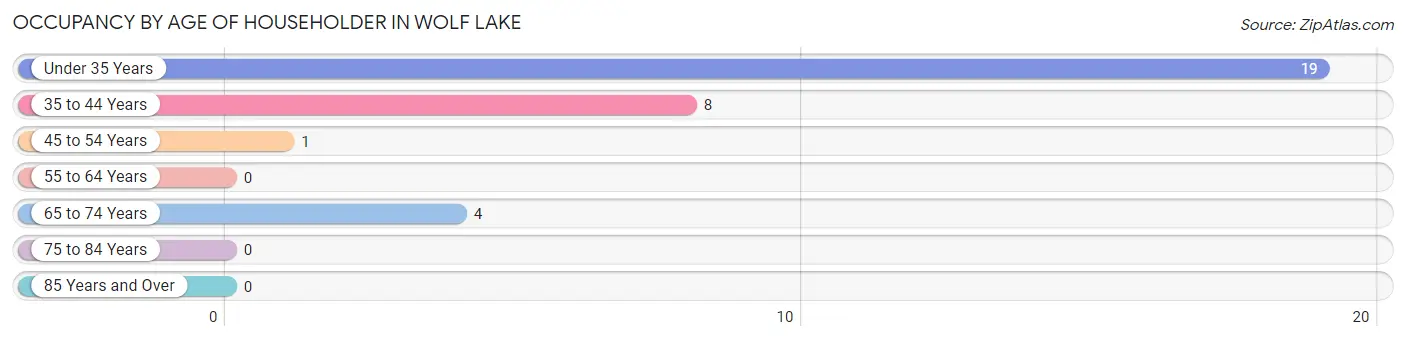
| Age Bracket | # Households | % Households |
| Under 35 Years | 19 | 59.4% |
| 35 to 44 Years | 8 | 25.0% |
| 45 to 54 Years | 1 | 3.1% |
| 55 to 64 Years | 0 | 0.0% |
| 65 to 74 Years | 4 | 12.5% |
| 75 to 84 Years | 0 | 0.0% |
| 85 Years and Over | 0 | 0.0% |
| Total | 32 | 100.0% |
Housing Finances in Wolf Lake
Median Income by Occupancy in Wolf Lake
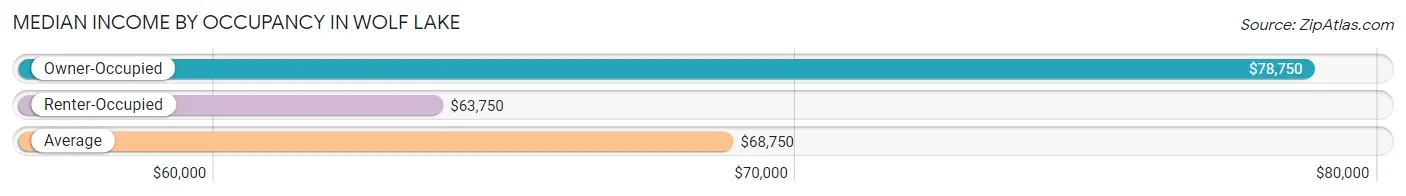
| Occupancy Type | # Households | Median Income |
| Owner-Occupied | 14 (43.8%) | $78,750 |
| Renter-Occupied | 18 (56.2%) | $63,750 |
| Average | 32 (100.0%) | $68,750 |
Occupancy by Householder Income Bracket in Wolf Lake
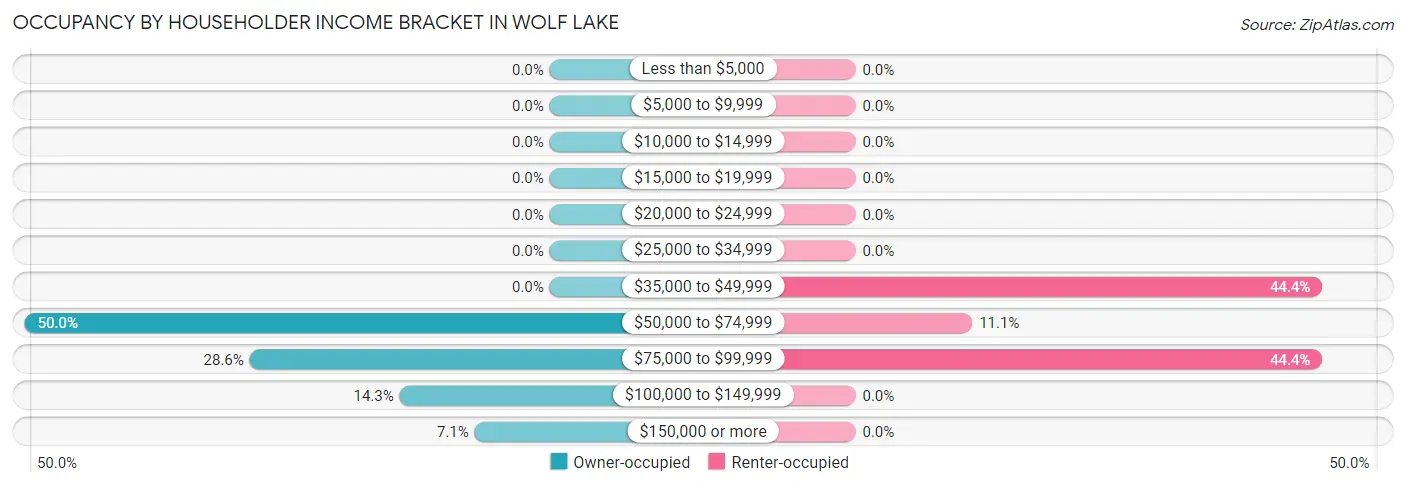
| Income Bracket | Owner-occupied | Renter-occupied |
| Less than $5,000 | 0 (0.0%) | 0 (0.0%) |
| $5,000 to $9,999 | 0 (0.0%) | 0 (0.0%) |
| $10,000 to $14,999 | 0 (0.0%) | 0 (0.0%) |
| $15,000 to $19,999 | 0 (0.0%) | 0 (0.0%) |
| $20,000 to $24,999 | 0 (0.0%) | 0 (0.0%) |
| $25,000 to $34,999 | 0 (0.0%) | 0 (0.0%) |
| $35,000 to $49,999 | 0 (0.0%) | 8 (44.4%) |
| $50,000 to $74,999 | 7 (50.0%) | 2 (11.1%) |
| $75,000 to $99,999 | 4 (28.6%) | 8 (44.4%) |
| $100,000 to $149,999 | 2 (14.3%) | 0 (0.0%) |
| $150,000 or more | 1 (7.1%) | 0 (0.0%) |
| Total | 14 (100.0%) | 18 (100.0%) |
Monthly Housing Cost Tiers in Wolf Lake
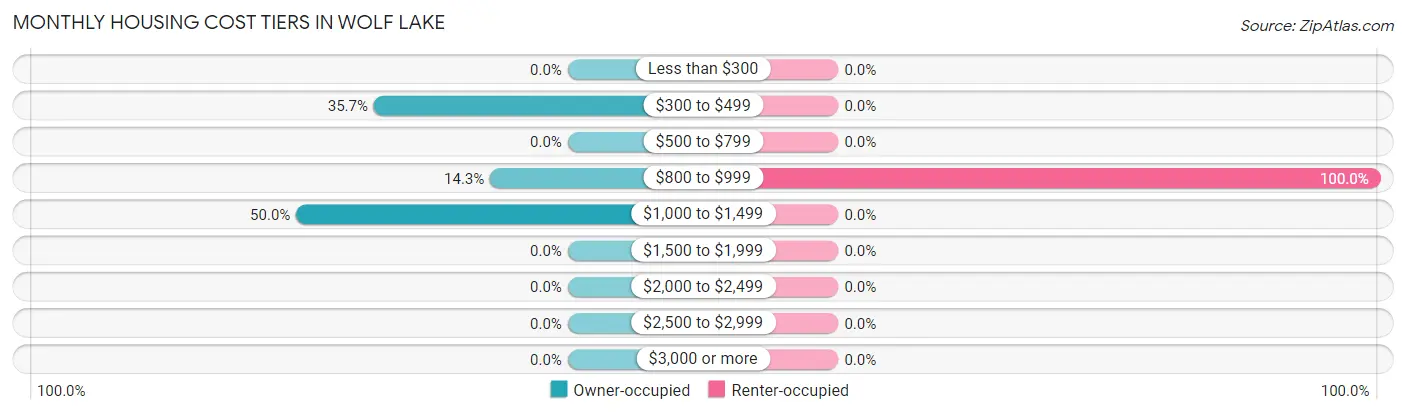
| Monthly Cost | Owner-occupied | Renter-occupied |
| Less than $300 | 0 (0.0%) | 0 (0.0%) |
| $300 to $499 | 5 (35.7%) | 0 (0.0%) |
| $500 to $799 | 0 (0.0%) | 0 (0.0%) |
| $800 to $999 | 2 (14.3%) | 18 (100.0%) |
| $1,000 to $1,499 | 7 (50.0%) | 0 (0.0%) |
| $1,500 to $1,999 | 0 (0.0%) | 0 (0.0%) |
| $2,000 to $2,499 | 0 (0.0%) | 0 (0.0%) |
| $2,500 to $2,999 | 0 (0.0%) | 0 (0.0%) |
| $3,000 or more | 0 (0.0%) | 0 (0.0%) |
| Total | 14 (100.0%) | 18 (100.0%) |
Physical Housing Characteristics in Wolf Lake
Housing Structures in Wolf Lake
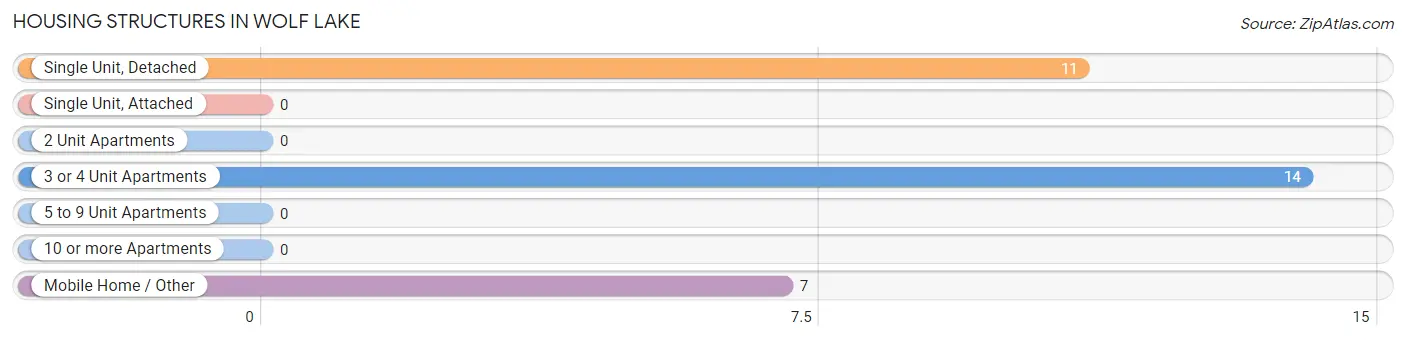
| Structure Type | # Housing Units | % Housing Units |
| Single Unit, Detached | 11 | 34.4% |
| Single Unit, Attached | 0 | 0.0% |
| 2 Unit Apartments | 0 | 0.0% |
| 3 or 4 Unit Apartments | 14 | 43.8% |
| 5 to 9 Unit Apartments | 0 | 0.0% |
| 10 or more Apartments | 0 | 0.0% |
| Mobile Home / Other | 7 | 21.9% |
| Total | 32 | 100.0% |
Housing Structures by Occupancy in Wolf Lake
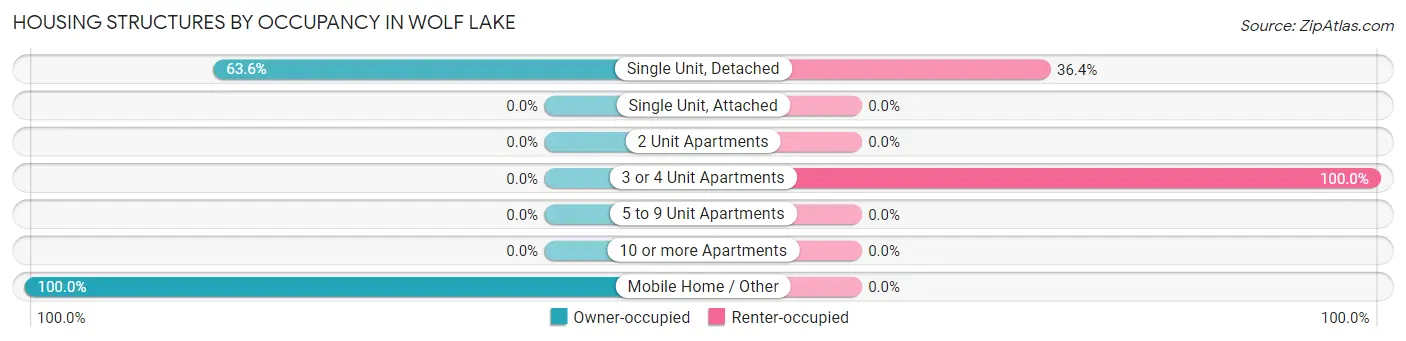
| Structure Type | Owner-occupied | Renter-occupied |
| Single Unit, Detached | 7 (63.6%) | 4 (36.4%) |
| Single Unit, Attached | 0 (0.0%) | 0 (0.0%) |
| 2 Unit Apartments | 0 (0.0%) | 0 (0.0%) |
| 3 or 4 Unit Apartments | 0 (0.0%) | 14 (100.0%) |
| 5 to 9 Unit Apartments | 0 (0.0%) | 0 (0.0%) |
| 10 or more Apartments | 0 (0.0%) | 0 (0.0%) |
| Mobile Home / Other | 7 (100.0%) | 0 (0.0%) |
| Total | 14 (43.8%) | 18 (56.2%) |
Housing Structures by Number of Rooms in Wolf Lake
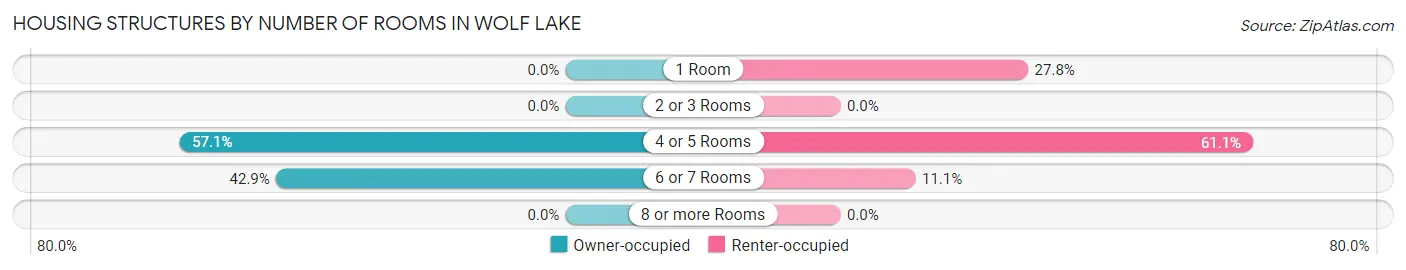
| Number of Rooms | Owner-occupied | Renter-occupied |
| 1 Room | 0 (0.0%) | 5 (27.8%) |
| 2 or 3 Rooms | 0 (0.0%) | 0 (0.0%) |
| 4 or 5 Rooms | 8 (57.1%) | 11 (61.1%) |
| 6 or 7 Rooms | 6 (42.9%) | 2 (11.1%) |
| 8 or more Rooms | 0 (0.0%) | 0 (0.0%) |
| Total | 14 (100.0%) | 18 (100.0%) |
Housing Structure by Heating Type in Wolf Lake
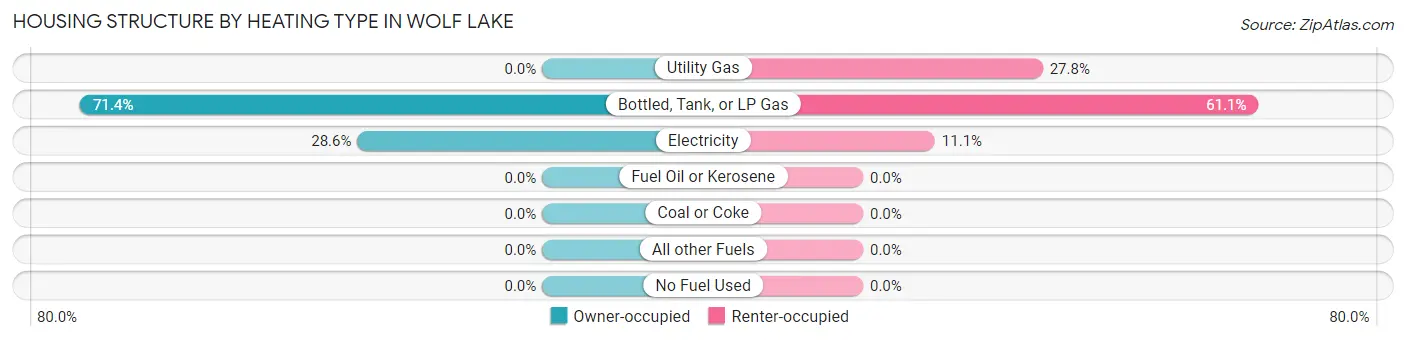
| Heating Type | Owner-occupied | Renter-occupied |
| Utility Gas | 0 (0.0%) | 5 (27.8%) |
| Bottled, Tank, or LP Gas | 10 (71.4%) | 11 (61.1%) |
| Electricity | 4 (28.6%) | 2 (11.1%) |
| Fuel Oil or Kerosene | 0 (0.0%) | 0 (0.0%) |
| Coal or Coke | 0 (0.0%) | 0 (0.0%) |
| All other Fuels | 0 (0.0%) | 0 (0.0%) |
| No Fuel Used | 0 (0.0%) | 0 (0.0%) |
| Total | 14 (100.0%) | 18 (100.0%) |
Household Vehicle Usage in Wolf Lake
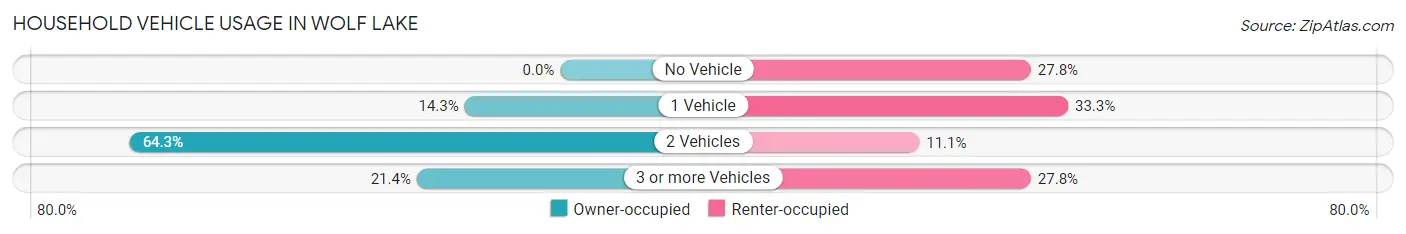
| Vehicles per Household | Owner-occupied | Renter-occupied |
| No Vehicle | 0 (0.0%) | 5 (27.8%) |
| 1 Vehicle | 2 (14.3%) | 6 (33.3%) |
| 2 Vehicles | 9 (64.3%) | 2 (11.1%) |
| 3 or more Vehicles | 3 (21.4%) | 5 (27.8%) |
| Total | 14 (100.0%) | 18 (100.0%) |
Real Estate & Mortgages in Wolf Lake
Real Estate and Mortgage Overview in Wolf Lake
| Characteristic | Without Mortgage | With Mortgage |
| Housing Units | 2 | 12 |
| Median Property Value | - | - |
| Median Household Income | - | - |
| Monthly Housing Costs | - | - |
| Real Estate Taxes | - | - |
Property Value by Mortgage Status in Wolf Lake
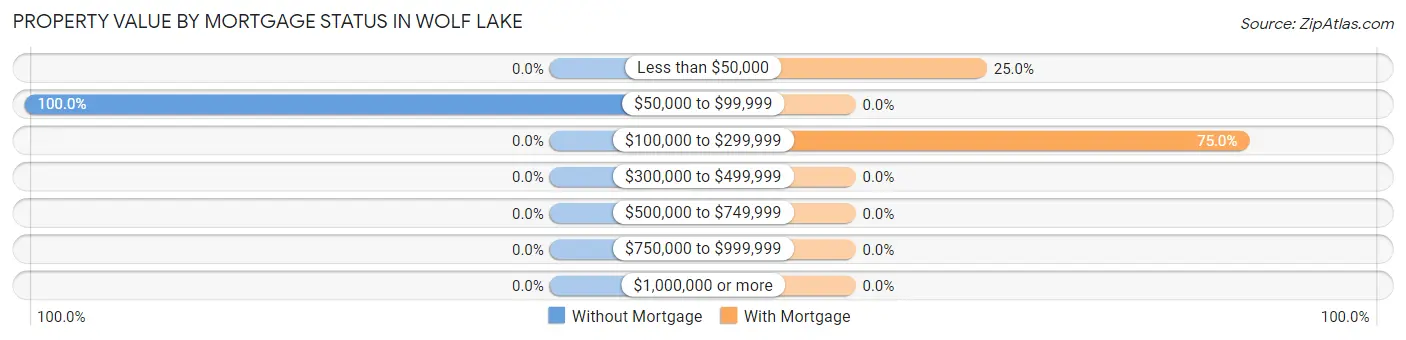
| Property Value | Without Mortgage | With Mortgage |
| Less than $50,000 | 0 (0.0%) | 3 (25.0%) |
| $50,000 to $99,999 | 2 (100.0%) | 0 (0.0%) |
| $100,000 to $299,999 | 0 (0.0%) | 9 (75.0%) |
| $300,000 to $499,999 | 0 (0.0%) | 0 (0.0%) |
| $500,000 to $749,999 | 0 (0.0%) | 0 (0.0%) |
| $750,000 to $999,999 | 0 (0.0%) | 0 (0.0%) |
| $1,000,000 or more | 0 (0.0%) | 0 (0.0%) |
| Total | 2 (100.0%) | 12 (100.0%) |
Household Income by Mortgage Status in Wolf Lake
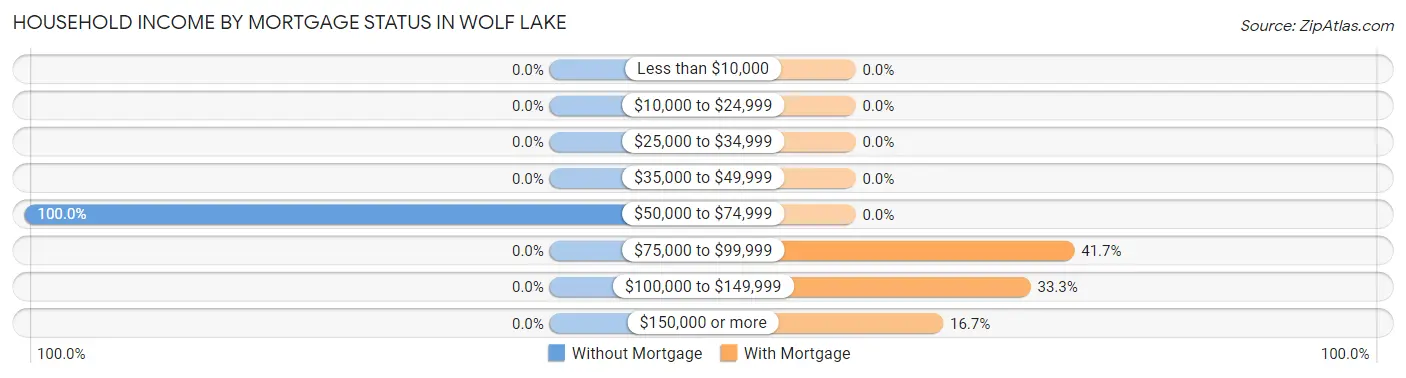
| Household Income | Without Mortgage | With Mortgage |
| Less than $10,000 | 0 (0.0%) | 0 (0.0%) |
| $10,000 to $24,999 | 0 (0.0%) | 0 (0.0%) |
| $25,000 to $34,999 | 0 (0.0%) | 0 (0.0%) |
| $35,000 to $49,999 | 0 (0.0%) | 0 (0.0%) |
| $50,000 to $74,999 | 2 (100.0%) | 0 (0.0%) |
| $75,000 to $99,999 | 0 (0.0%) | 5 (41.7%) |
| $100,000 to $149,999 | 0 (0.0%) | 4 (33.3%) |
| $150,000 or more | 0 (0.0%) | 2 (16.7%) |
| Total | 2 (100.0%) | 12 (100.0%) |
Property Value to Household Income Ratio in Wolf Lake
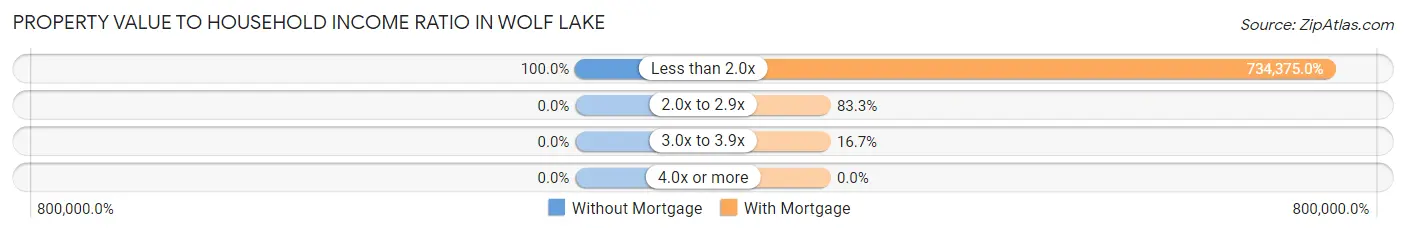
| Value-to-Income Ratio | Without Mortgage | With Mortgage |
| Less than 2.0x | 2 (100.0%) | 88,125 (734,375.0%) |
| 2.0x to 2.9x | 0 (0.0%) | 10 (83.3%) |
| 3.0x to 3.9x | 0 (0.0%) | 2 (16.7%) |
| 4.0x or more | 0 (0.0%) | 0 (0.0%) |
| Total | 2 (100.0%) | 12 (100.0%) |
Real Estate Taxes by Mortgage Status in Wolf Lake
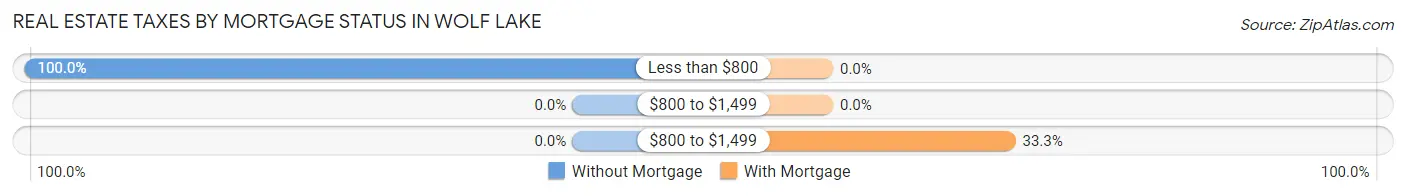
| Property Taxes | Without Mortgage | With Mortgage |
| Less than $800 | 2 (100.0%) | 0 (0.0%) |
| $800 to $1,499 | 0 (0.0%) | 0 (0.0%) |
| $800 to $1,499 | 0 (0.0%) | 4 (33.3%) |
| Total | 2 (100.0%) | 12 (100.0%) |
Health & Disability in Wolf Lake
Health Insurance Coverage by Age in Wolf Lake
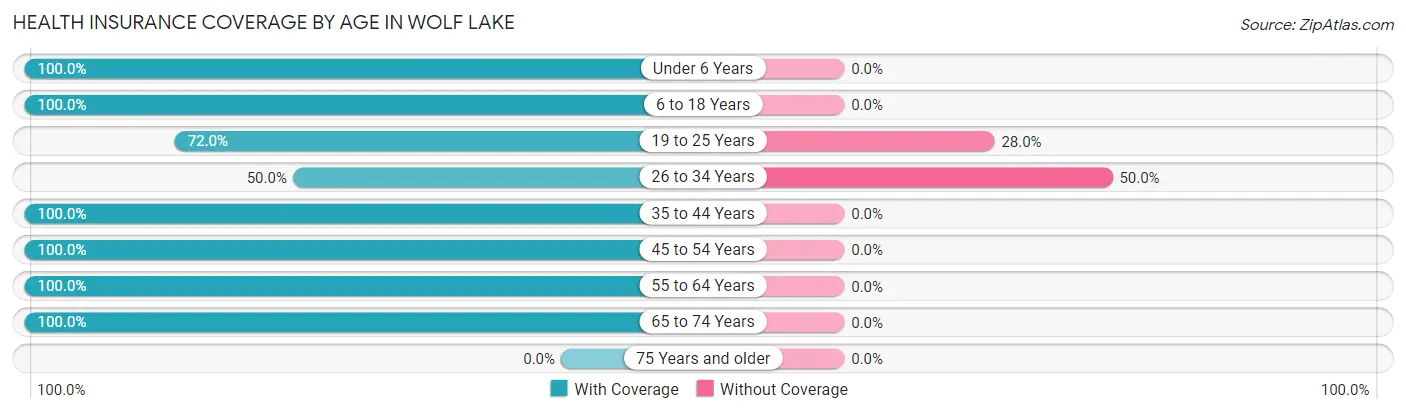
| Age Bracket | With Coverage | Without Coverage |
| Under 6 Years | 9 (100.0%) | 0 (0.0%) |
| 6 to 18 Years | 8 (100.0%) | 0 (0.0%) |
| 19 to 25 Years | 18 (72.0%) | 7 (28.0%) |
| 26 to 34 Years | 6 (50.0%) | 6 (50.0%) |
| 35 to 44 Years | 8 (100.0%) | 0 (0.0%) |
| 45 to 54 Years | 1 (100.0%) | 0 (0.0%) |
| 55 to 64 Years | 6 (100.0%) | 0 (0.0%) |
| 65 to 74 Years | 4 (100.0%) | 0 (0.0%) |
| 75 Years and older | 0 (0.0%) | 0 (0.0%) |
| Total | 60 (82.2%) | 13 (17.8%) |
Health Insurance Coverage by Citizenship Status in Wolf Lake
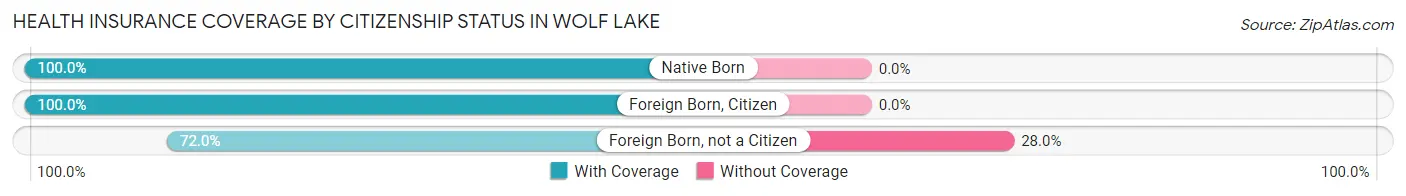
| Citizenship Status | With Coverage | Without Coverage |
| Native Born | 9 (100.0%) | 0 (0.0%) |
| Foreign Born, Citizen | 8 (100.0%) | 0 (0.0%) |
| Foreign Born, not a Citizen | 18 (72.0%) | 7 (28.0%) |
Health Insurance Coverage by Household Income in Wolf Lake

| Household Income | With Coverage | Without Coverage |
| Under $25,000 | 0 (0.0%) | 0 (0.0%) |
| $25,000 to $49,999 | 16 (100.0%) | 0 (0.0%) |
| $50,000 to $74,999 | 20 (100.0%) | 0 (0.0%) |
| $75,000 to $99,999 | 14 (56.0%) | 11 (44.0%) |
| $100,000 and over | 10 (83.3%) | 2 (16.7%) |
Public vs Private Health Insurance Coverage by Age in Wolf Lake
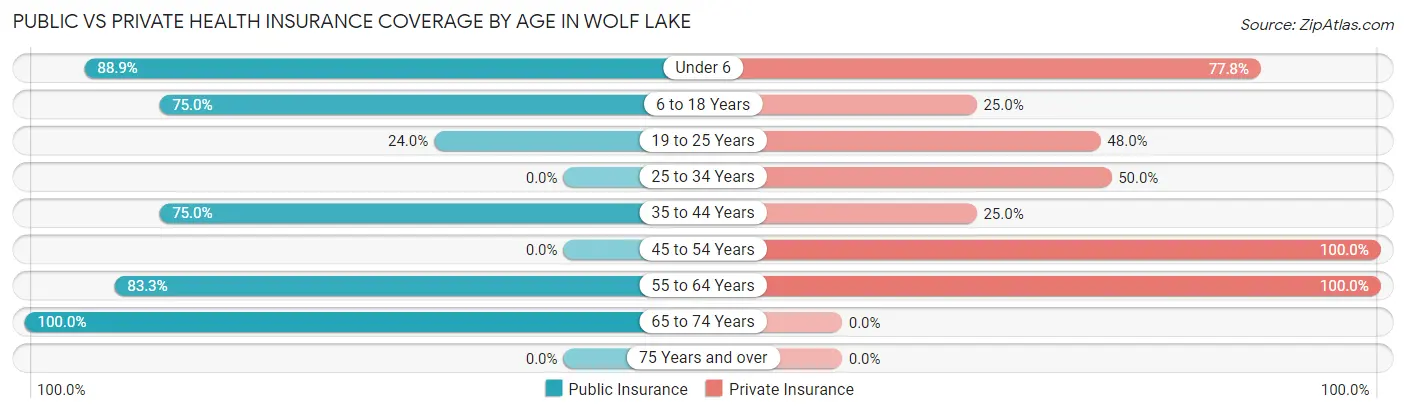
| Age Bracket | Public Insurance | Private Insurance |
| Under 6 | 8 (88.9%) | 7 (77.8%) |
| 6 to 18 Years | 6 (75.0%) | 2 (25.0%) |
| 19 to 25 Years | 6 (24.0%) | 12 (48.0%) |
| 25 to 34 Years | 0 (0.0%) | 6 (50.0%) |
| 35 to 44 Years | 6 (75.0%) | 2 (25.0%) |
| 45 to 54 Years | 0 (0.0%) | 1 (100.0%) |
| 55 to 64 Years | 5 (83.3%) | 6 (100.0%) |
| 65 to 74 Years | 4 (100.0%) | 0 (0.0%) |
| 75 Years and over | 0 (0.0%) | 0 (0.0%) |
| Total | 35 (47.9%) | 36 (49.3%) |
Disability Status by Sex by Age in Wolf Lake
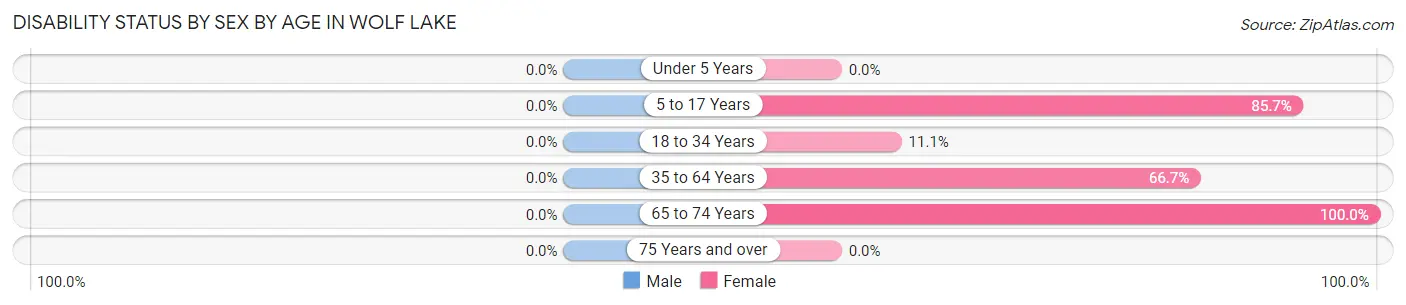
| Age Bracket | Male | Female |
| Under 5 Years | 0 (0.0%) | 0 (0.0%) |
| 5 to 17 Years | 0 (0.0%) | 6 (85.7%) |
| 18 to 34 Years | 0 (0.0%) | 2 (11.1%) |
| 35 to 64 Years | 0 (0.0%) | 6 (66.7%) |
| 65 to 74 Years | 0 (0.0%) | 4 (100.0%) |
| 75 Years and over | 0 (0.0%) | 0 (0.0%) |
Disability Class by Sex by Age in Wolf Lake
Disability Class: Hearing Difficulty
| Age Bracket | Male | Female |
| Under 5 Years | 0 (0.0%) | 0 (0.0%) |
| 5 to 17 Years | 0 (0.0%) | 0 (0.0%) |
| 18 to 34 Years | 0 (0.0%) | 0 (0.0%) |
| 35 to 64 Years | 0 (0.0%) | 0 (0.0%) |
| 65 to 74 Years | 0 (0.0%) | 0 (0.0%) |
| 75 Years and over | 0 (0.0%) | 0 (0.0%) |
Disability Class: Vision Difficulty
| Age Bracket | Male | Female |
| Under 5 Years | 0 (0.0%) | 0 (0.0%) |
| 5 to 17 Years | 0 (0.0%) | 0 (0.0%) |
| 18 to 34 Years | 0 (0.0%) | 0 (0.0%) |
| 35 to 64 Years | 0 (0.0%) | 0 (0.0%) |
| 65 to 74 Years | 0 (0.0%) | 0 (0.0%) |
| 75 Years and over | 0 (0.0%) | 0 (0.0%) |
Disability Class: Cognitive Difficulty
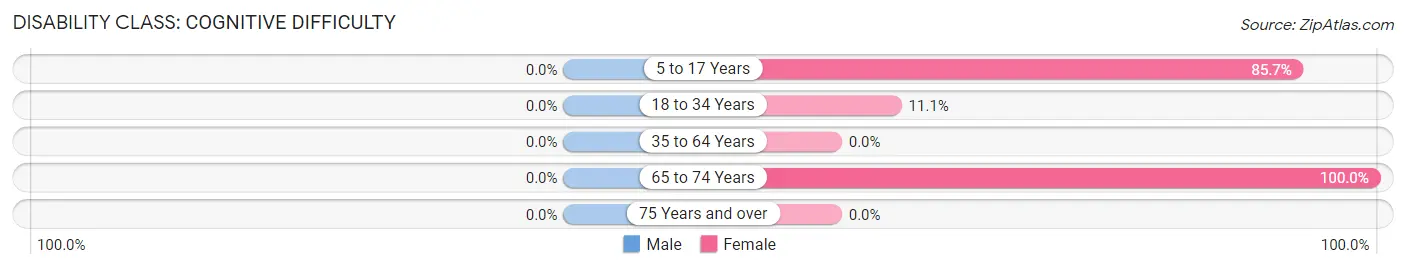
| Age Bracket | Male | Female |
| 5 to 17 Years | 0 (0.0%) | 6 (85.7%) |
| 18 to 34 Years | 0 (0.0%) | 2 (11.1%) |
| 35 to 64 Years | 0 (0.0%) | 0 (0.0%) |
| 65 to 74 Years | 0 (0.0%) | 4 (100.0%) |
| 75 Years and over | 0 (0.0%) | 0 (0.0%) |
Disability Class: Ambulatory Difficulty
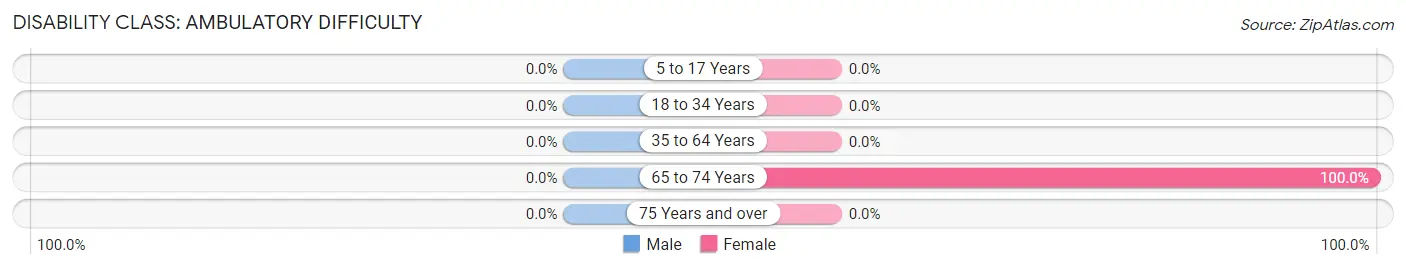
| Age Bracket | Male | Female |
| 5 to 17 Years | 0 (0.0%) | 0 (0.0%) |
| 18 to 34 Years | 0 (0.0%) | 0 (0.0%) |
| 35 to 64 Years | 0 (0.0%) | 0 (0.0%) |
| 65 to 74 Years | 0 (0.0%) | 4 (100.0%) |
| 75 Years and over | 0 (0.0%) | 0 (0.0%) |
Disability Class: Self-Care Difficulty
| Age Bracket | Male | Female |
| 5 to 17 Years | 0 (0.0%) | 0 (0.0%) |
| 18 to 34 Years | 0 (0.0%) | 0 (0.0%) |
| 35 to 64 Years | 0 (0.0%) | 0 (0.0%) |
| 65 to 74 Years | 0 (0.0%) | 0 (0.0%) |
| 75 Years and over | 0 (0.0%) | 0 (0.0%) |
Technology Access in Wolf Lake
Computing Device Access in Wolf Lake
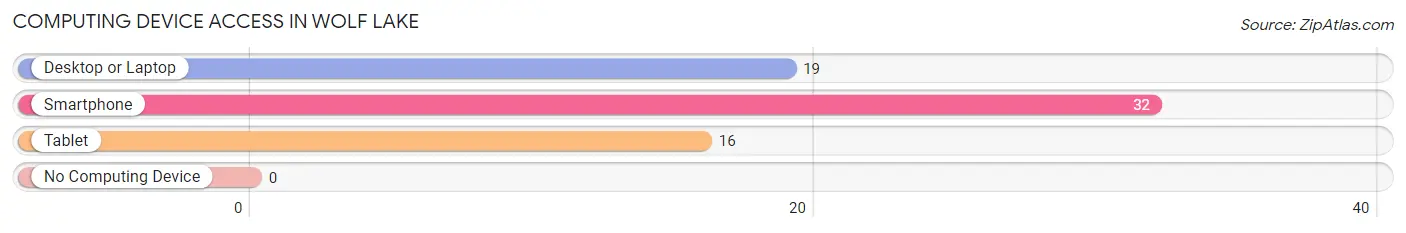
| Device Type | # Households | % Households |
| Desktop or Laptop | 19 | 59.4% |
| Smartphone | 32 | 100.0% |
| Tablet | 16 | 50.0% |
| No Computing Device | 0 | 0.0% |
| Total | 32 | 100.0% |
Internet Access in Wolf Lake
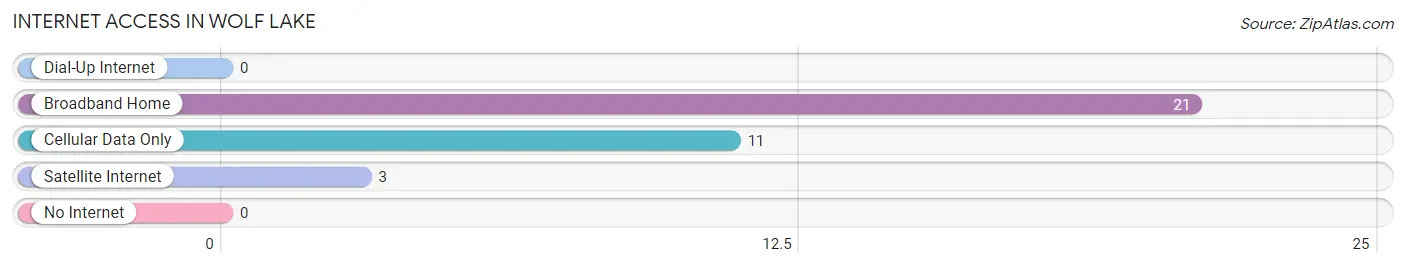
| Internet Type | # Households | % Households |
| Dial-Up Internet | 0 | 0.0% |
| Broadband Home | 21 | 65.6% |
| Cellular Data Only | 11 | 34.4% |
| Satellite Internet | 3 | 9.4% |
| No Internet | 0 | 0.0% |
| Total | 32 | 100.0% |
Wolf Lake Summary
Wolf Lake is a small city located in the state of Minnesota, United States. It is situated in the south-central part of the state, in the county of Becker. The city has a population of approximately 1,000 people, and is located on the shores of Wolf Lake, a large lake in the area.
History
The area around Wolf Lake has been inhabited for thousands of years, with evidence of human activity dating back to the Paleo-Indian period. The first recorded European settlers arrived in the area in the late 1800s, and the city of Wolf Lake was officially incorporated in 1891. The city was named after the nearby lake, which was named for the large number of wolves that inhabited the area at the time.
In the early 1900s, Wolf Lake was a thriving logging and farming community. The city was home to several sawmills, and the surrounding area was heavily logged. The city also had a thriving agricultural industry, with many farmers growing crops such as wheat, oats, and potatoes.
In the mid-1900s, Wolf Lake began to experience a decline in its economy. The logging industry had largely moved out of the area, and the agricultural industry was in decline. The city began to experience a population decline, and by the 1970s, the population had dropped to just over 500 people.
Geography
Wolf Lake is located in the south-central part of Minnesota, in the county of Becker. The city is situated on the shores of Wolf Lake, a large lake in the area. The lake is approximately 8 miles long and 4 miles wide, and is a popular destination for fishing, boating, and other recreational activities.
The city is located in a rural area, and is surrounded by forests and farmland. The nearest major city is Detroit Lakes, which is located approximately 25 miles to the north.
Economy
Wolf Lake’s economy is largely based on tourism and recreation. The city is home to several resorts and campgrounds, which attract visitors from all over the state and beyond. The city is also home to several restaurants, bars, and other businesses that cater to tourists.
The city also has a small manufacturing sector, with several small businesses producing a variety of products. The city is also home to a small airport, which serves the local area.
Demographics
As of the 2010 census, the population of Wolf Lake was 1,000 people. The racial makeup of the city was 97.2% White, 0.7% African American, 0.3% Native American, 0.2% Asian, 0.1% Pacific Islander, and 1.5% from other races. The median household income was $37,500, and the median family income was $45,000.
Conclusion
Wolf Lake is a small city located in the state of Minnesota, United States. It is situated in the south-central part of the state, in the county of Becker. The city has a population of approximately 1,000 people, and is located on the shores of Wolf Lake, a large lake in the area. The city’s economy is largely based on tourism and recreation, and the city is home to several resorts and campgrounds. The city also has a small manufacturing sector, with several small businesses producing a variety of products. The racial makeup of the city is predominantly White, with a small percentage of African American, Native American, Asian, and Pacific Islander residents.
Common Questions
What is Per Capita Income in Wolf Lake?
Per Capita income in Wolf Lake is $29,619.
What is the Median Family Income in Wolf Lake?
Median Family Income in Wolf Lake is $72,500.
What is the Median Household income in Wolf Lake?
Median Household Income in Wolf Lake is $68,750.
What is Income or Wage Gap in Wolf Lake?
Income or Wage Gap in Wolf Lake is 43.3%.
Women in Wolf Lake earn 56.7 cents for every dollar earned by a man.
What is Inequality or Gini Index in Wolf Lake?
Inequality or Gini Index in Wolf Lake is 0.21.
What is the Total Population of Wolf Lake?
Total Population of Wolf Lake is 73.
What is the Total Male Population of Wolf Lake?
Total Male Population of Wolf Lake is 31.
What is the Total Female Population of Wolf Lake?
Total Female Population of Wolf Lake is 42.
What is the Ratio of Males per 100 Females in Wolf Lake?
There are 73.81 Males per 100 Females in Wolf Lake.
What is the Ratio of Females per 100 Males in Wolf Lake?
There are 135.48 Females per 100 Males in Wolf Lake.
What is the Median Population Age in Wolf Lake?
Median Population Age in Wolf Lake is 24.1 Years.
What is the Average Family Size in Wolf Lake
Average Family Size in Wolf Lake is 2.4 People.
What is the Average Household Size in Wolf Lake
Average Household Size in Wolf Lake is 2.3 People.
How Large is the Labor Force in Wolf Lake?
There are 47 People in the Labor Forcein in Wolf Lake.
What is the Percentage of People in the Labor Force in Wolf Lake?
73.4% of People are in the Labor Force in Wolf Lake.