New Albany, IN Map & Demographics
New Albany Map
New Albany Overview
$29,688
PER CAPITA INCOME
$70,790
AVG FAMILY INCOME
$53,982
AVG HOUSEHOLD INCOME
23.8%
WAGE / INCOME GAP [ % ]
76.2¢/ $1
WAGE / INCOME GAP [ $ ]
$12,725
FAMILY INCOME DEFICIT
0.41
INEQUALITY / GINI INDEX
37,598
TOTAL POPULATION
17,893
MALE POPULATION
19,705
FEMALE POPULATION
90.80
MALES / 100 FEMALES
110.13
FEMALES / 100 MALES
38.0
MEDIAN AGE
3.1
AVG FAMILY SIZE
2.3
AVG HOUSEHOLD SIZE
18,868
LABOR FORCE [ PEOPLE ]
60.9%
PERCENT IN LABOR FORCE
4.9%
UNEMPLOYMENT RATE
New Albany Zip Codes
New Albany Area Codes
Income in New Albany
Income Overview in New Albany
Per Capita Income in New Albany is $29,688, while median incomes of families and households are $70,790 and $53,982 respectively.
| Characteristic | Number | Measure |
| Per Capita Income | 37,598 | $29,688 |
| Median Family Income | 8,458 | $70,790 |
| Mean Family Income | 8,458 | $80,766 |
| Median Household Income | 15,906 | $53,982 |
| Mean Household Income | 15,906 | $66,525 |
| Income Deficit | 8,458 | $12,725 |
| Wage / Income Gap (%) | 37,598 | 23.77% |
| Wage / Income Gap ($) | 37,598 | 76.23¢ per $1 |
| Gini / Inequality Index | 37,598 | 0.41 |
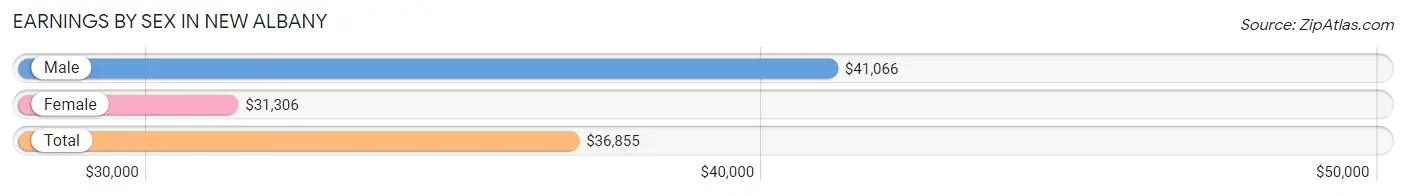
Earnings by Sex in New Albany
Average Earnings in New Albany are $36,855, $41,066 for men and $31,306 for women, a difference of 23.8%.
| Sex | Number | Average Earnings |
| Male | 10,218 (51.7%) | $41,066 |
| Female | 9,545 (48.3%) | $31,306 |
| Total | 19,763 (100.0%) | $36,855 |
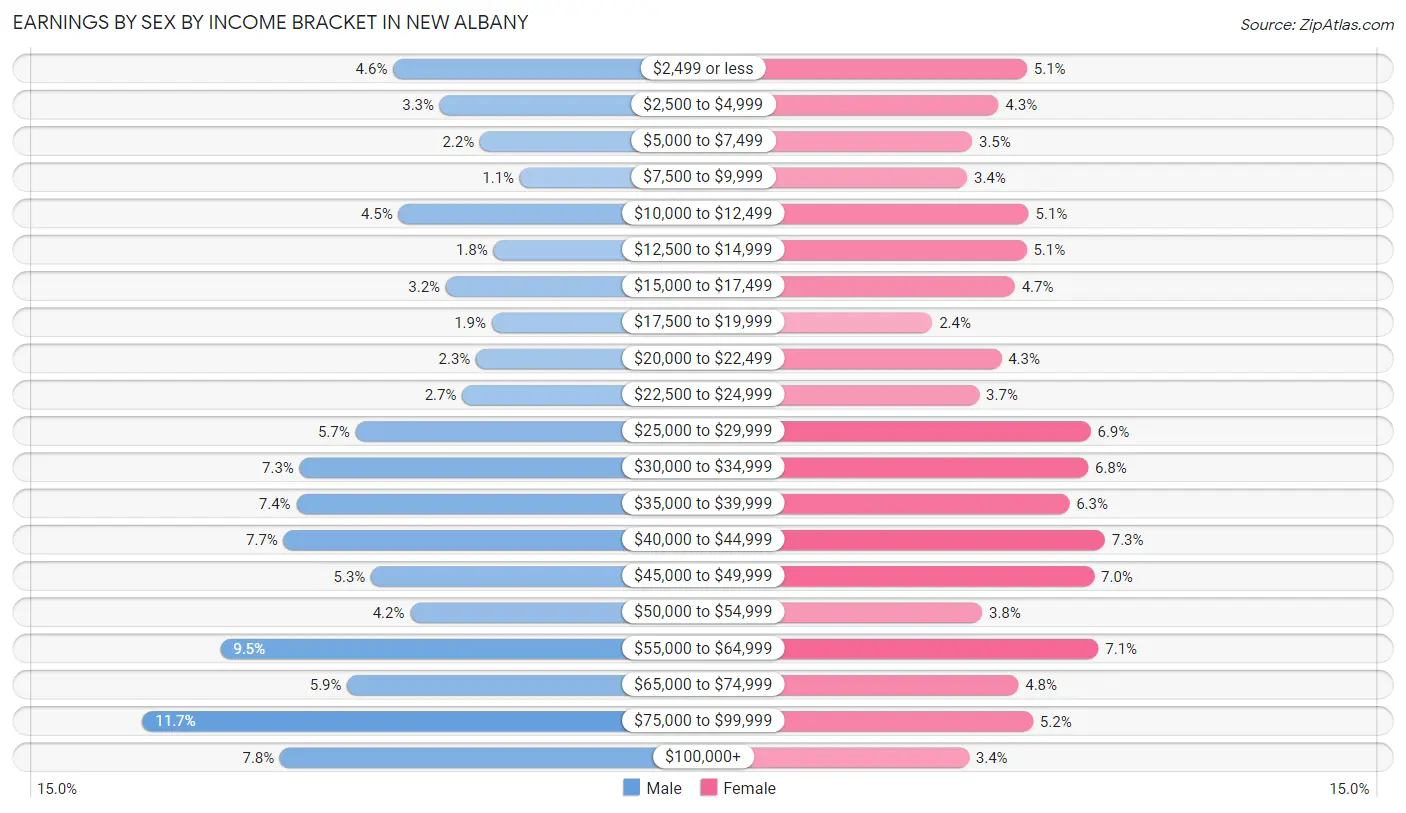
Earnings by Sex by Income Bracket in New Albany
The most common earnings brackets in New Albany are $75,000 to $99,999 for men (1,194 | 11.7%) and $40,000 to $44,999 for women (692 | 7.2%).
| Income | Male | Female |
| $2,499 or less | 474 (4.6%) | 483 (5.1%) |
| $2,500 to $4,999 | 340 (3.3%) | 407 (4.3%) |
| $5,000 to $7,499 | 225 (2.2%) | 336 (3.5%) |
| $7,500 to $9,999 | 110 (1.1%) | 323 (3.4%) |
| $10,000 to $12,499 | 459 (4.5%) | 488 (5.1%) |
| $12,500 to $14,999 | 186 (1.8%) | 482 (5.1%) |
| $15,000 to $17,499 | 323 (3.2%) | 451 (4.7%) |
| $17,500 to $19,999 | 191 (1.9%) | 229 (2.4%) |
| $20,000 to $22,499 | 236 (2.3%) | 414 (4.3%) |
| $22,500 to $24,999 | 276 (2.7%) | 355 (3.7%) |
| $25,000 to $29,999 | 582 (5.7%) | 654 (6.9%) |
| $30,000 to $34,999 | 743 (7.3%) | 647 (6.8%) |
| $35,000 to $39,999 | 752 (7.4%) | 597 (6.2%) |
| $40,000 to $44,999 | 789 (7.7%) | 692 (7.2%) |
| $45,000 to $49,999 | 537 (5.3%) | 663 (7.0%) |
| $50,000 to $54,999 | 425 (4.2%) | 363 (3.8%) |
| $55,000 to $64,999 | 971 (9.5%) | 675 (7.1%) |
| $65,000 to $74,999 | 606 (5.9%) | 460 (4.8%) |
| $75,000 to $99,999 | 1,194 (11.7%) | 499 (5.2%) |
| $100,000+ | 799 (7.8%) | 327 (3.4%) |
| Total | 10,218 (100.0%) | 9,545 (100.0%) |
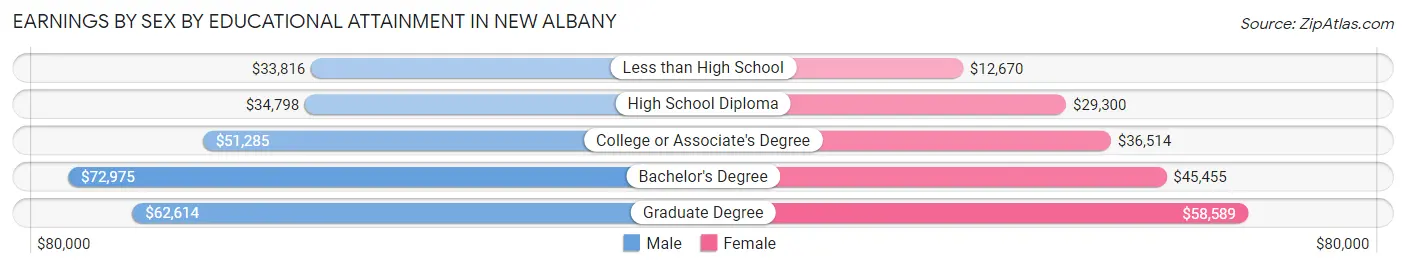
Earnings by Sex by Educational Attainment in New Albany
Average earnings in New Albany are $44,499 for men and $36,732 for women, a difference of 17.4%. Men with an educational attainment of bachelor's degree enjoy the highest average annual earnings of $72,975, while those with less than high school education earn the least with $33,816. Women with an educational attainment of graduate degree earn the most with the average annual earnings of $58,589, while those with less than high school education have the smallest earnings of $12,670.
| Educational Attainment | Male Income | Female Income |
| Less than High School | $33,816 | $12,670 |
| High School Diploma | $34,798 | $29,300 |
| College or Associate's Degree | $51,285 | $36,514 |
| Bachelor's Degree | $72,975 | $45,455 |
| Graduate Degree | $62,614 | $58,589 |
| Total | $44,499 | $36,732 |
Family Income in New Albany
Family Income Brackets in New Albany
According to the New Albany family income data, there are 1,759 families falling into the $50,000 to $74,999 income range, which is the most common income bracket and makes up 20.8% of all families. Conversely, the $10,000 to $14,999 income bracket is the least frequent group with only 304 families (3.6%) belonging to this category.
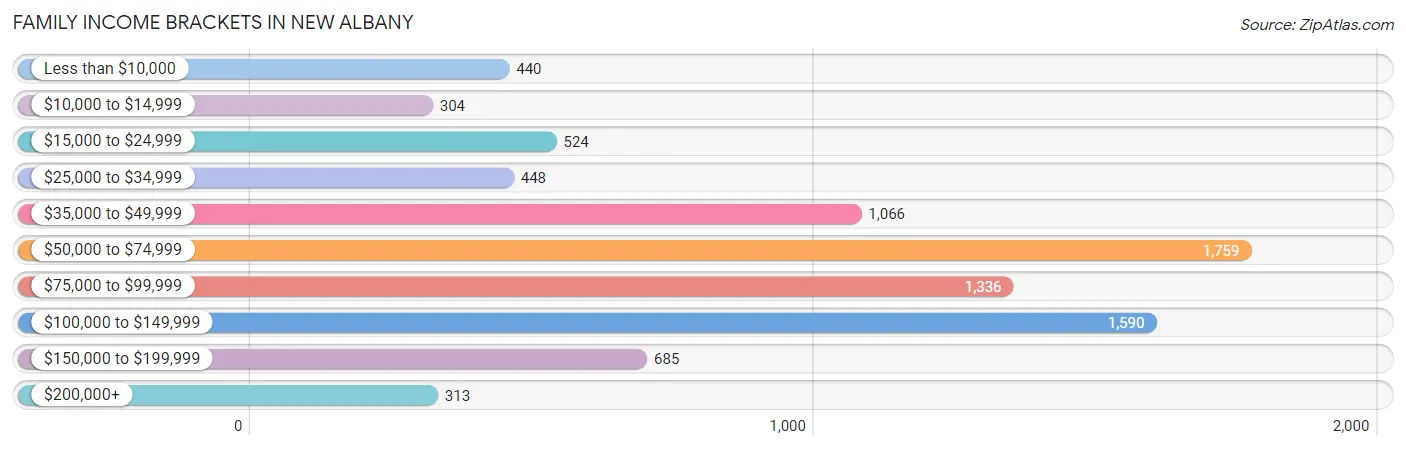
| Income Bracket | # Families | % Families |
| Less than $10,000 | 440 | 5.2% |
| $10,000 to $14,999 | 304 | 3.6% |
| $15,000 to $24,999 | 524 | 6.2% |
| $25,000 to $34,999 | 448 | 5.3% |
| $35,000 to $49,999 | 1,066 | 12.6% |
| $50,000 to $74,999 | 1,759 | 20.8% |
| $75,000 to $99,999 | 1,336 | 15.8% |
| $100,000 to $149,999 | 1,590 | 18.8% |
| $150,000 to $199,999 | 685 | 8.1% |
| $200,000+ | 313 | 3.7% |
Family Income by Famaliy Size in New Albany
4-person families (1,469 | 17.4%) account for the highest median family income in New Albany with $87,023 per family, while 2-person families (4,386 | 51.9%) have the highest median income of $32,244 per family member.
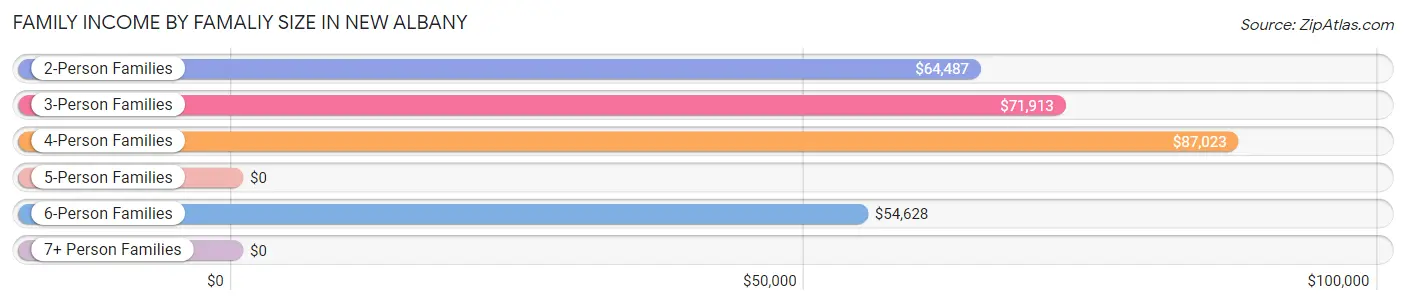
| Income Bracket | # Families | Median Income |
| 2-Person Families | 4,386 (51.9%) | $64,487 |
| 3-Person Families | 1,959 (23.2%) | $71,913 |
| 4-Person Families | 1,469 (17.4%) | $87,023 |
| 5-Person Families | 427 (5.1%) | $0 |
| 6-Person Families | 177 (2.1%) | $54,628 |
| 7+ Person Families | 40 (0.5%) | $0 |
| Total | 8,458 (100.0%) | $70,790 |
Family Income by Number of Earners in New Albany
The median family income in New Albany is $70,790, with families comprising 3+ earners (799) having the highest median family income of $113,466, while families with no earners (1,426) have the lowest median family income of $34,776, accounting for 9.5% and 16.9% of families, respectively.
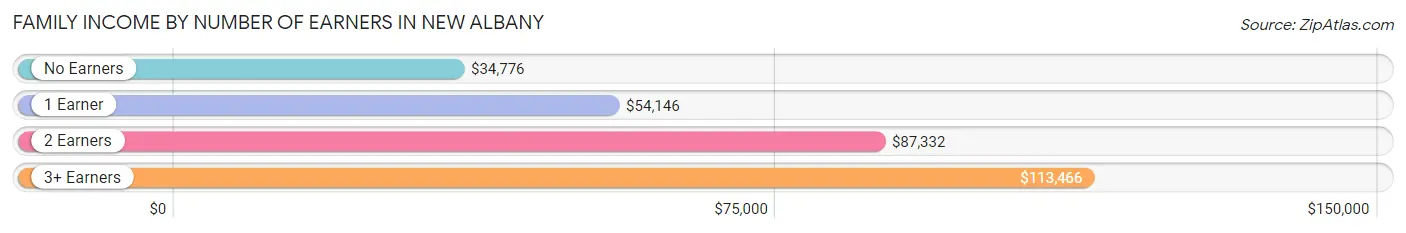
| Number of Earners | # Families | Median Income |
| No Earners | 1,426 (16.9%) | $34,776 |
| 1 Earner | 3,220 (38.1%) | $54,146 |
| 2 Earners | 3,013 (35.6%) | $87,332 |
| 3+ Earners | 799 (9.5%) | $113,466 |
| Total | 8,458 (100.0%) | $70,790 |
Household Income in New Albany
Household Income Brackets in New Albany
With 3,070 households falling in the category, the $50,000 to $74,999 income range is the most frequent in New Albany, accounting for 19.3% of all households. In contrast, only 350 households (2.2%) fall into the $200,000+ income bracket, making it the least populous group.
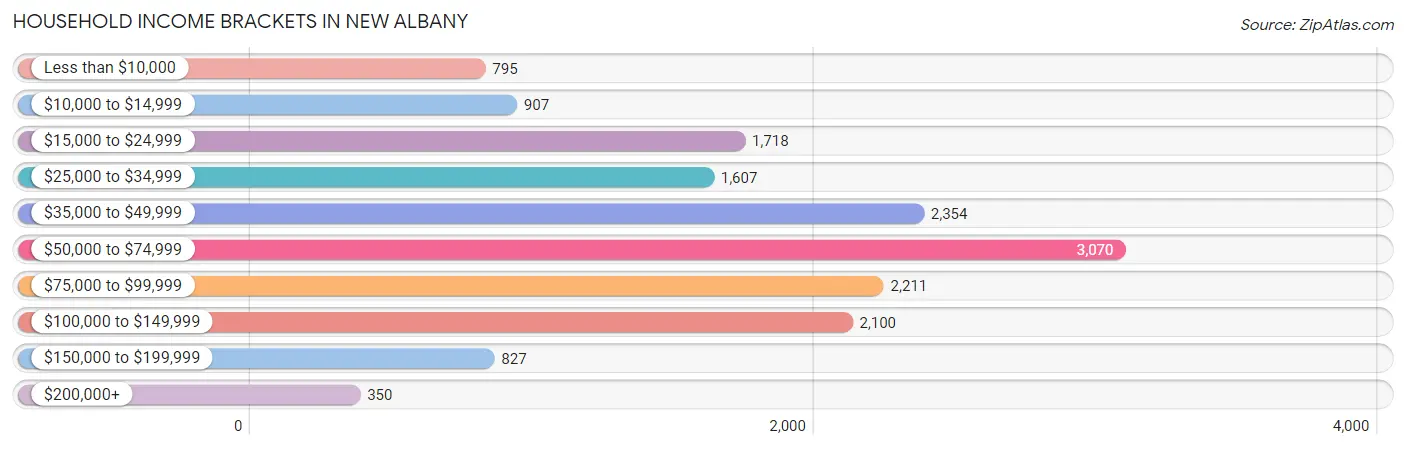
| Income Bracket | # Households | % Households |
| Less than $10,000 | 795 | 5.0% |
| $10,000 to $14,999 | 907 | 5.7% |
| $15,000 to $24,999 | 1,718 | 10.8% |
| $25,000 to $34,999 | 1,607 | 10.1% |
| $35,000 to $49,999 | 2,354 | 14.8% |
| $50,000 to $74,999 | 3,070 | 19.3% |
| $75,000 to $99,999 | 2,211 | 13.9% |
| $100,000 to $149,999 | 2,100 | 13.2% |
| $150,000 to $199,999 | 827 | 5.2% |
| $200,000+ | 350 | 2.2% |
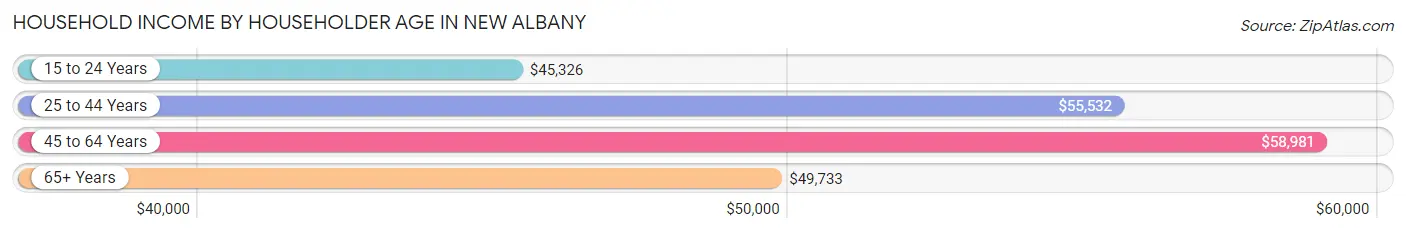
Household Income by Householder Age in New Albany
The median household income in New Albany is $53,982, with the highest median household income of $58,981 found in the 45 to 64 years age bracket for the primary householder. A total of 5,007 households (31.5%) fall into this category. Meanwhile, the 15 to 24 years age bracket for the primary householder has the lowest median household income of $45,326, with 744 households (4.7%) in this group.
| Income Bracket | # Households | Median Income |
| 15 to 24 Years | 744 (4.7%) | $45,326 |
| 25 to 44 Years | 5,939 (37.3%) | $55,532 |
| 45 to 64 Years | 5,007 (31.5%) | $58,981 |
| 65+ Years | 4,216 (26.5%) | $49,733 |
| Total | 15,906 (100.0%) | $53,982 |
Poverty in New Albany
Income Below Poverty by Sex and Age in New Albany
With 15.5% poverty level for males and 19.7% for females among the residents of New Albany, 5 year old males and under 5 year old females are the most vulnerable to poverty, with 136 males (54.8%) and 541 females (41.7%) in their respective age groups living below the poverty level.
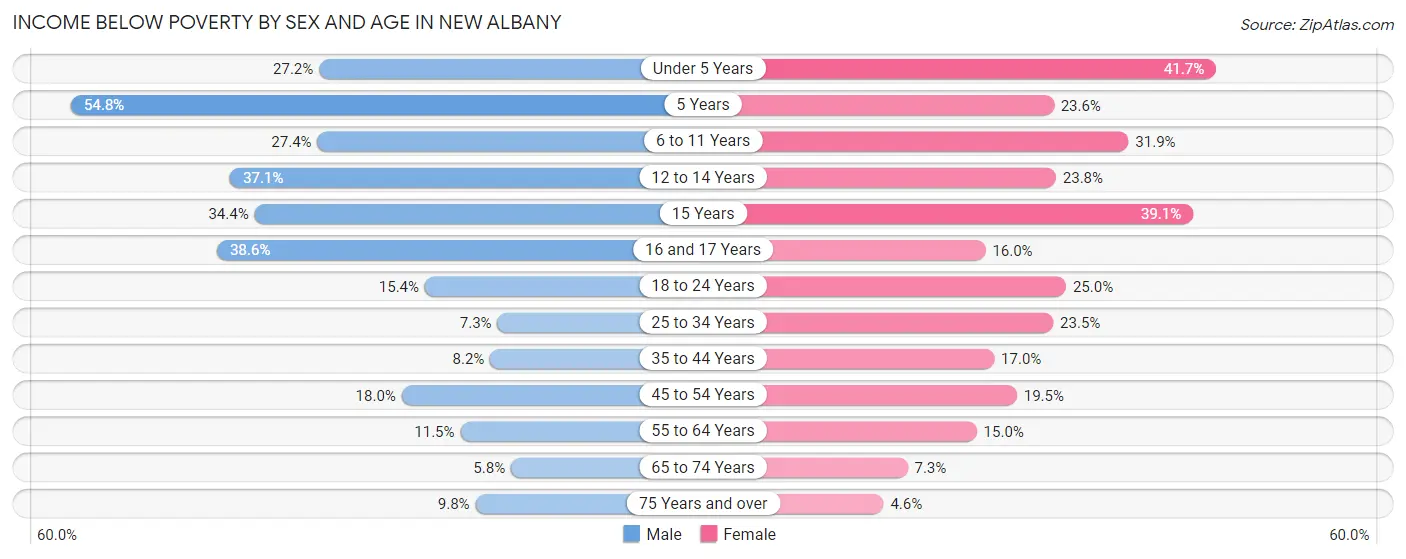
| Age Bracket | Male | Female |
| Under 5 Years | 266 (27.2%) | 541 (41.7%) |
| 5 Years | 136 (54.8%) | 42 (23.6%) |
| 6 to 11 Years | 307 (27.4%) | 361 (31.9%) |
| 12 to 14 Years | 232 (37.1%) | 108 (23.8%) |
| 15 Years | 97 (34.4%) | 70 (39.1%) |
| 16 and 17 Years | 221 (38.6%) | 80 (16.0%) |
| 18 to 24 Years | 219 (15.4%) | 423 (25.0%) |
| 25 to 34 Years | 229 (7.3%) | 704 (23.5%) |
| 35 to 44 Years | 176 (8.2%) | 469 (17.0%) |
| 45 to 54 Years | 351 (18.0%) | 380 (19.5%) |
| 55 to 64 Years | 271 (11.5%) | 347 (15.0%) |
| 65 to 74 Years | 100 (5.8%) | 160 (7.3%) |
| 75 Years and over | 79 (9.8%) | 66 (4.6%) |
| Total | 2,684 (15.5%) | 3,751 (19.7%) |
Income Above Poverty by Sex and Age in New Albany
According to the poverty statistics in New Albany, males aged 65 to 74 years and females aged 75 years and over are the age groups that are most secure financially, with 94.2% of males and 95.4% of females in these age groups living above the poverty line.
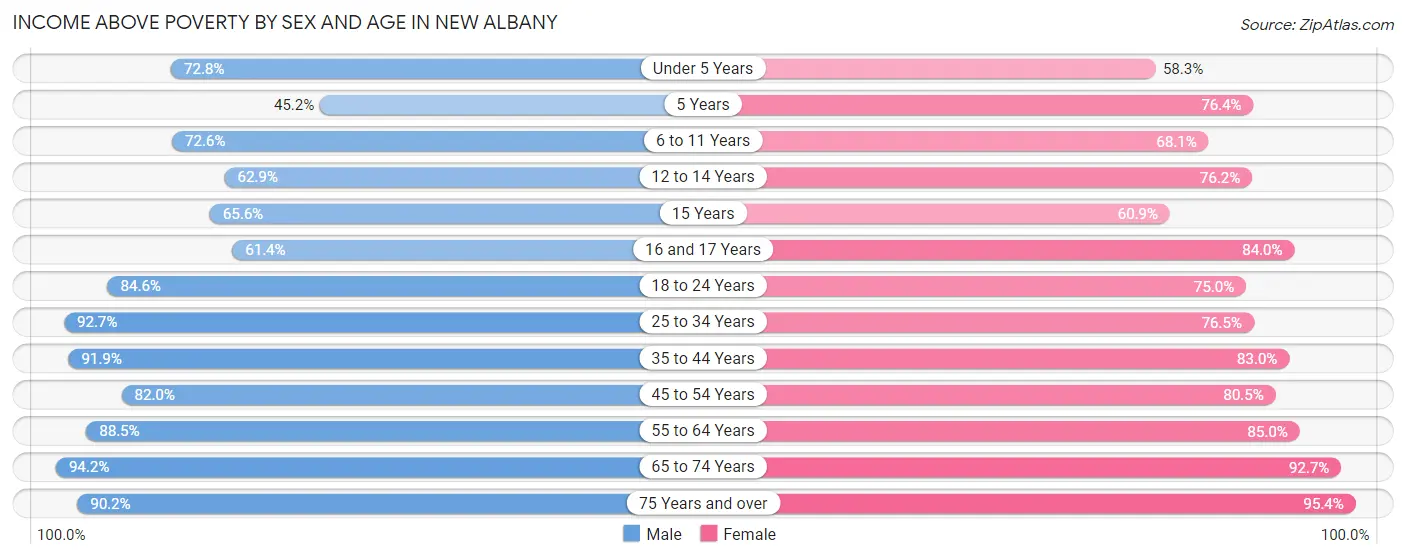
| Age Bracket | Male | Female |
| Under 5 Years | 712 (72.8%) | 757 (58.3%) |
| 5 Years | 112 (45.2%) | 136 (76.4%) |
| 6 to 11 Years | 814 (72.6%) | 770 (68.1%) |
| 12 to 14 Years | 393 (62.9%) | 345 (76.2%) |
| 15 Years | 185 (65.6%) | 109 (60.9%) |
| 16 and 17 Years | 352 (61.4%) | 420 (84.0%) |
| 18 to 24 Years | 1,201 (84.6%) | 1,271 (75.0%) |
| 25 to 34 Years | 2,891 (92.7%) | 2,287 (76.5%) |
| 35 to 44 Years | 1,984 (91.8%) | 2,295 (83.0%) |
| 45 to 54 Years | 1,598 (82.0%) | 1,570 (80.5%) |
| 55 to 64 Years | 2,092 (88.5%) | 1,963 (85.0%) |
| 65 to 74 Years | 1,616 (94.2%) | 2,025 (92.7%) |
| 75 Years and over | 728 (90.2%) | 1,357 (95.4%) |
| Total | 14,678 (84.5%) | 15,305 (80.3%) |
Income Below Poverty Among Married-Couple Families in New Albany
The poverty statistics for married-couple families in New Albany show that 3.8% or 210 of the total 5,449 families live below the poverty line. Families with 5 or more children have the highest poverty rate of 73.9%, comprising of 17 families. On the other hand, families with 1 or 2 children have the lowest poverty rate of 2.1%, which includes 34 families.
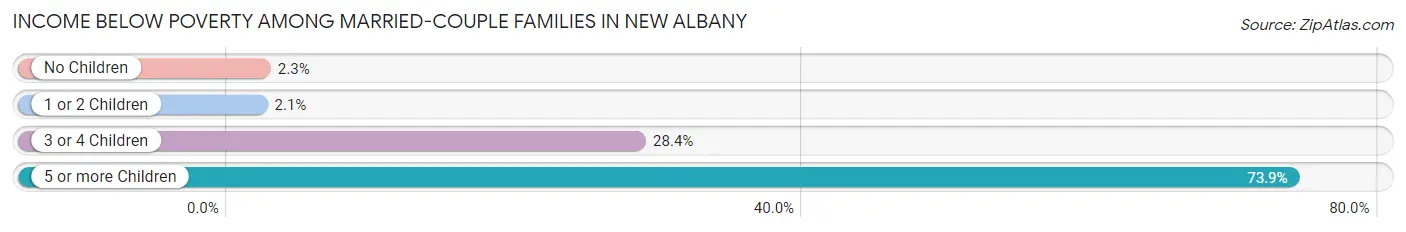
| Children | Above Poverty | Below Poverty |
| No Children | 3,414 (97.7%) | 80 (2.3%) |
| 1 or 2 Children | 1,620 (97.9%) | 34 (2.1%) |
| 3 or 4 Children | 199 (71.6%) | 79 (28.4%) |
| 5 or more Children | 6 (26.1%) | 17 (73.9%) |
| Total | 5,239 (96.2%) | 210 (3.8%) |
Income Below Poverty Among Single-Parent Households in New Albany
According to the poverty data in New Albany, 13.6% or 96 single-father households and 38.1% or 878 single-mother households are living below the poverty line. Among single-father households, those with 3 or 4 children have the highest poverty rate, with 32 households (88.9%) experiencing poverty. Likewise, among single-mother households, those with 5 or more children have the highest poverty rate, with 22 households (100.0%) falling below the poverty line.
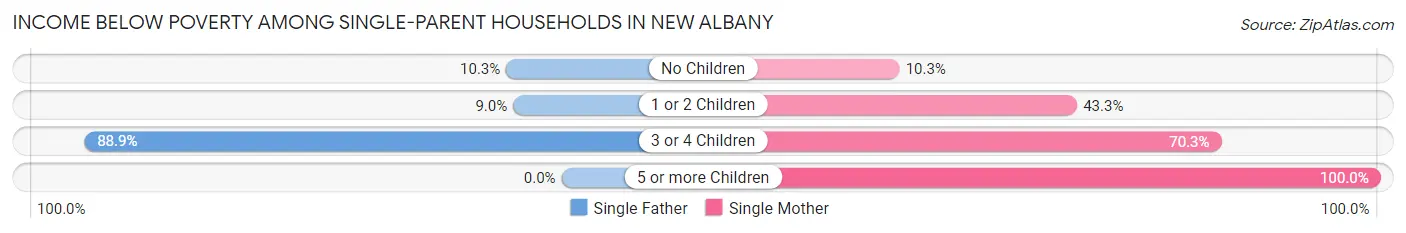
| Children | Single Father | Single Mother |
| No Children | 30 (10.3%) | 61 (10.2%) |
| 1 or 2 Children | 34 (9.0%) | 629 (43.3%) |
| 3 or 4 Children | 32 (88.9%) | 166 (70.3%) |
| 5 or more Children | 0 (0.0%) | 22 (100.0%) |
| Total | 96 (13.6%) | 878 (38.1%) |
Income Below Poverty Among Married-Couple vs Single-Parent Households in New Albany
The poverty data for New Albany shows that 210 of the married-couple family households (3.8%) and 974 of the single-parent households (32.4%) are living below the poverty level. Within the married-couple family households, those with 5 or more children have the highest poverty rate, with 17 households (73.9%) falling below the poverty line. Among the single-parent households, those with 5 or more children have the highest poverty rate, with 22 household (100.0%) living below poverty.
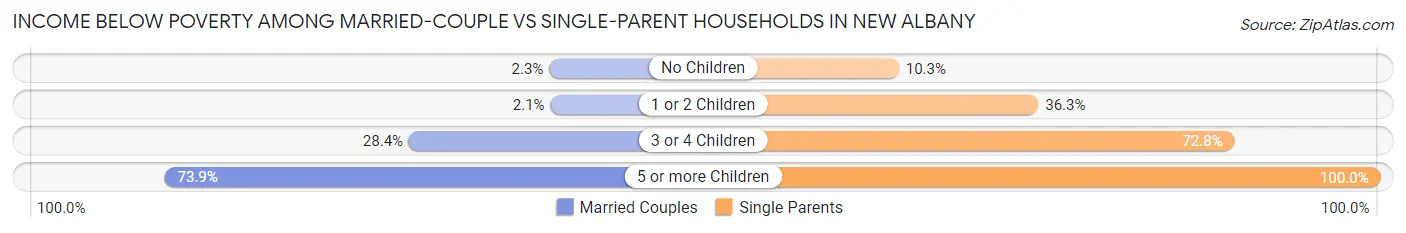
| Children | Married-Couple Families | Single-Parent Households |
| No Children | 80 (2.3%) | 91 (10.3%) |
| 1 or 2 Children | 34 (2.1%) | 663 (36.2%) |
| 3 or 4 Children | 79 (28.4%) | 198 (72.8%) |
| 5 or more Children | 17 (73.9%) | 22 (100.0%) |
| Total | 210 (3.8%) | 974 (32.4%) |
Race in New Albany
The most populous races in New Albany are White / Caucasian (31,148 | 82.8%), Black / African American (3,222 | 8.6%), and Two or more Races (2,271 | 6.0%).
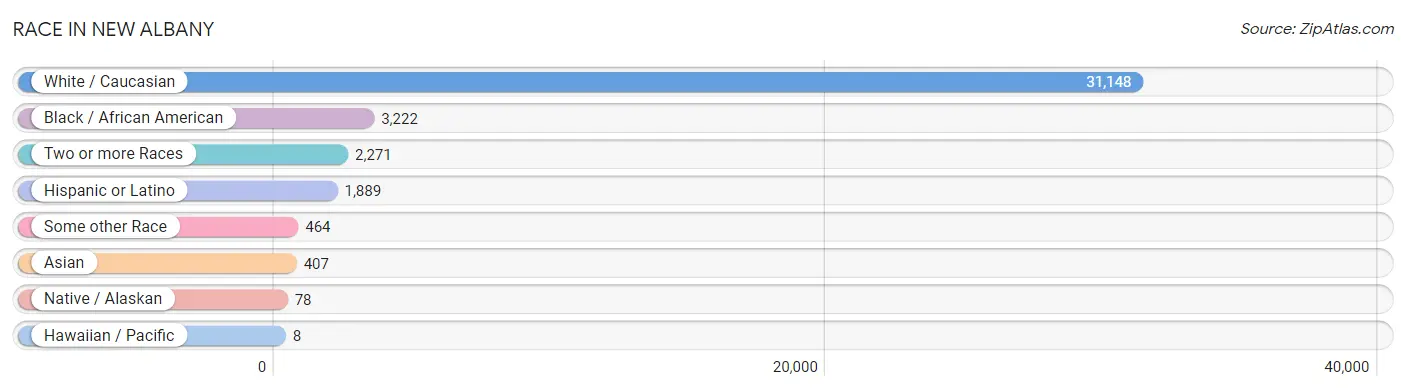
| Race | # Population | % Population |
| Asian | 407 | 1.1% |
| Black / African American | 3,222 | 8.6% |
| Hawaiian / Pacific | 8 | 0.0% |
| Hispanic or Latino | 1,889 | 5.0% |
| Native / Alaskan | 78 | 0.2% |
| White / Caucasian | 31,148 | 82.8% |
| Two or more Races | 2,271 | 6.0% |
| Some other Race | 464 | 1.2% |
| Total | 37,598 | 100.0% |
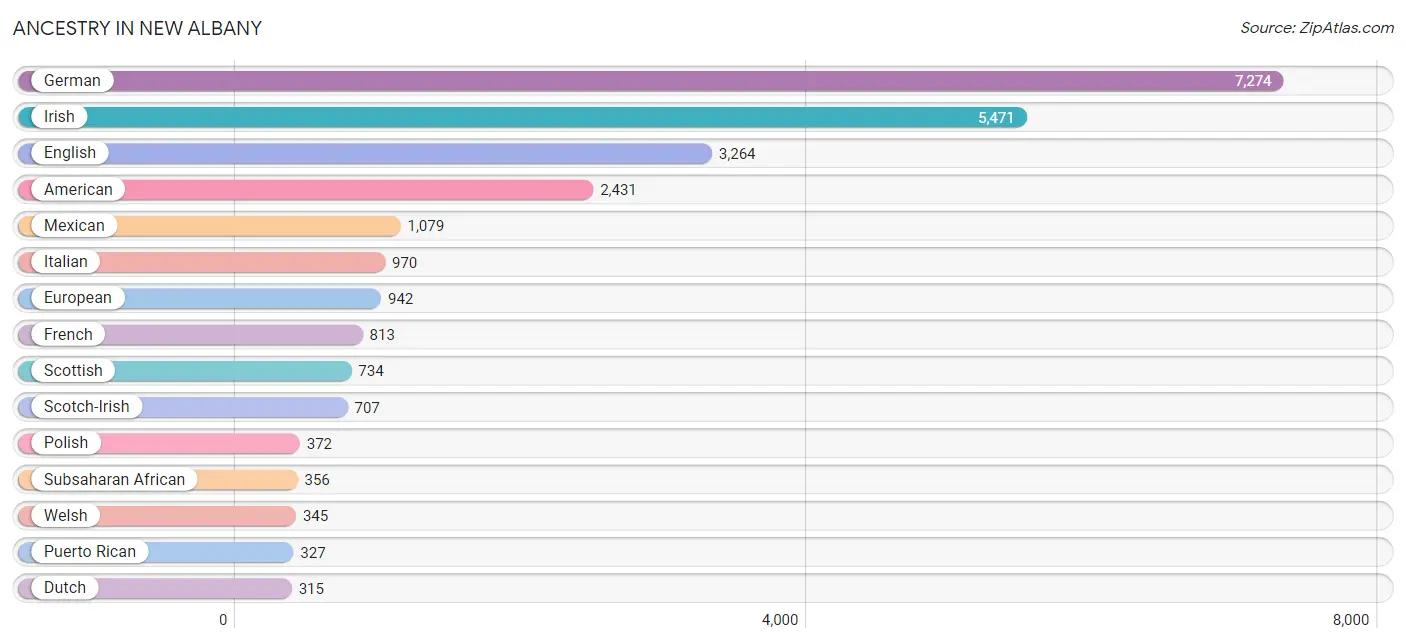
Ancestry in New Albany
The most populous ancestries reported in New Albany are German (7,274 | 19.4%), Irish (5,471 | 14.5%), English (3,264 | 8.7%), American (2,431 | 6.5%), and Mexican (1,079 | 2.9%), together accounting for 51.9% of all New Albany residents.
| Ancestry | # Population | % Population |
| African | 257 | 0.7% |
| Aleut | 14 | 0.0% |
| American | 2,431 | 6.5% |
| Arab | 76 | 0.2% |
| Assyrian / Chaldean / Syriac | 8 | 0.0% |
| Australian | 7 | 0.0% |
| Austrian | 21 | 0.1% |
| Belgian | 40 | 0.1% |
| Bhutanese | 43 | 0.1% |
| Blackfeet | 11 | 0.0% |
| British | 164 | 0.4% |
| Burmese | 56 | 0.2% |
| Canadian | 36 | 0.1% |
| Celtic | 2 | 0.0% |
| Central American | 153 | 0.4% |
| Cherokee | 142 | 0.4% |
| Choctaw | 19 | 0.1% |
| Colombian | 21 | 0.1% |
| Croatian | 4 | 0.0% |
| Cuban | 34 | 0.1% |
| Czech | 18 | 0.1% |
| Danish | 135 | 0.4% |
| Dominican | 143 | 0.4% |
| Dutch | 315 | 0.8% |
| Eastern European | 49 | 0.1% |
| English | 3,264 | 8.7% |
| Ethiopian | 5 | 0.0% |
| European | 942 | 2.5% |
| Filipino | 25 | 0.1% |
| Finnish | 41 | 0.1% |
| French | 813 | 2.2% |
| French Canadian | 22 | 0.1% |
| German | 7,274 | 19.4% |
| Ghanaian | 16 | 0.0% |
| Greek | 48 | 0.1% |
| Guatemalan | 70 | 0.2% |
| Hmong | 14 | 0.0% |
| Hungarian | 17 | 0.1% |
| Indian (Asian) | 125 | 0.3% |
| Irish | 5,471 | 14.5% |
| Italian | 970 | 2.6% |
| Korean | 131 | 0.4% |
| Laotian | 16 | 0.0% |
| Lebanese | 19 | 0.1% |
| Liberian | 61 | 0.2% |
| Lithuanian | 78 | 0.2% |
| Mexican | 1,079 | 2.9% |
| Mexican American Indian | 28 | 0.1% |
| Native Hawaiian | 31 | 0.1% |
| Navajo | 10 | 0.0% |
| Nicaraguan | 8 | 0.0% |
| Norwegian | 183 | 0.5% |
| Polish | 372 | 1.0% |
| Puerto Rican | 327 | 0.9% |
| Romanian | 8 | 0.0% |
| Russian | 82 | 0.2% |
| Salvadoran | 75 | 0.2% |
| Scandinavian | 25 | 0.1% |
| Scotch-Irish | 707 | 1.9% |
| Scottish | 734 | 1.9% |
| Sioux | 12 | 0.0% |
| Slavic | 7 | 0.0% |
| Slovak | 92 | 0.2% |
| South American | 35 | 0.1% |
| Spaniard | 110 | 0.3% |
| Spanish | 8 | 0.0% |
| Subsaharan African | 356 | 0.9% |
| Swedish | 152 | 0.4% |
| Swiss | 105 | 0.3% |
| Syrian | 57 | 0.2% |
| Thai | 223 | 0.6% |
| Trinidadian and Tobagonian | 28 | 0.1% |
| Ukrainian | 22 | 0.1% |
| Venezuelan | 14 | 0.0% |
| Welsh | 345 | 0.9% | View All 75 Rows |
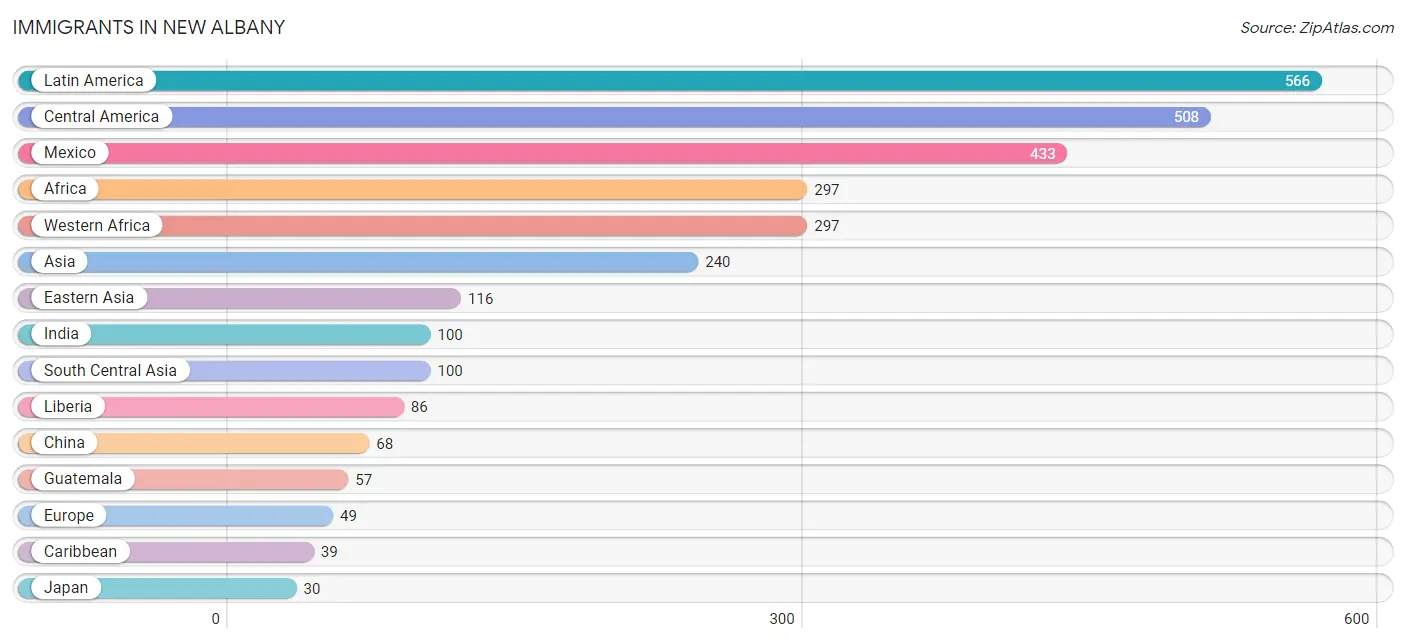
Immigrants in New Albany
The most numerous immigrant groups reported in New Albany came from Latin America (566 | 1.5%), Central America (508 | 1.3%), Mexico (433 | 1.1%), Africa (297 | 0.8%), and Western Africa (297 | 0.8%), together accounting for 5.6% of all New Albany residents.
| Immigration Origin | # Population | % Population |
| Africa | 297 | 0.8% |
| Asia | 240 | 0.6% |
| Cambodia | 7 | 0.0% |
| Canada | 10 | 0.0% |
| Caribbean | 39 | 0.1% |
| Central America | 508 | 1.3% |
| China | 68 | 0.2% |
| Colombia | 15 | 0.0% |
| Croatia | 14 | 0.0% |
| Eastern Asia | 116 | 0.3% |
| Eastern Europe | 21 | 0.1% |
| Ecuador | 4 | 0.0% |
| El Salvador | 18 | 0.1% |
| England | 5 | 0.0% |
| Europe | 49 | 0.1% |
| Germany | 6 | 0.0% |
| Ghana | 16 | 0.0% |
| Guatemala | 57 | 0.2% |
| India | 100 | 0.3% |
| Iraq | 8 | 0.0% |
| Italy | 9 | 0.0% |
| Jamaica | 11 | 0.0% |
| Japan | 30 | 0.1% |
| Korea | 18 | 0.1% |
| Latin America | 566 | 1.5% |
| Liberia | 86 | 0.2% |
| Mexico | 433 | 1.1% |
| Northern Europe | 7 | 0.0% |
| Philippines | 9 | 0.0% |
| South America | 19 | 0.1% |
| South Central Asia | 100 | 0.3% |
| South Eastern Asia | 16 | 0.0% |
| Southern Europe | 15 | 0.0% |
| Spain | 6 | 0.0% |
| Taiwan | 13 | 0.0% |
| Trinidad and Tobago | 28 | 0.1% |
| Ukraine | 7 | 0.0% |
| Western Africa | 297 | 0.8% |
| Western Asia | 8 | 0.0% |
| Western Europe | 6 | 0.0% | View All 40 Rows |
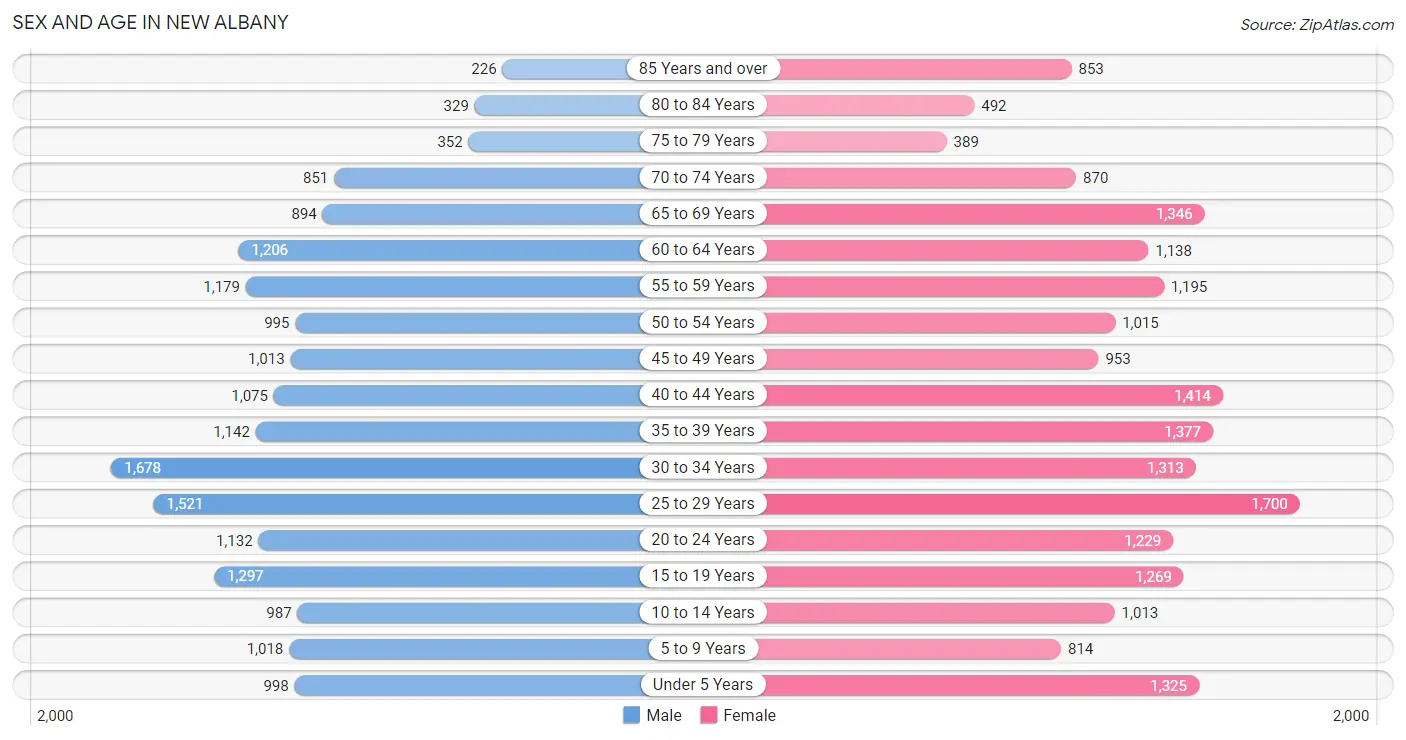
Sex and Age in New Albany
Sex and Age in New Albany
The most populous age groups in New Albany are 30 to 34 Years (1,678 | 9.4%) for men and 25 to 29 Years (1,700 | 8.6%) for women.
| Age Bracket | Male | Female |
| Under 5 Years | 998 (5.6%) | 1,325 (6.7%) |
| 5 to 9 Years | 1,018 (5.7%) | 814 (4.1%) |
| 10 to 14 Years | 987 (5.5%) | 1,013 (5.1%) |
| 15 to 19 Years | 1,297 (7.2%) | 1,269 (6.4%) |
| 20 to 24 Years | 1,132 (6.3%) | 1,229 (6.2%) |
| 25 to 29 Years | 1,521 (8.5%) | 1,700 (8.6%) |
| 30 to 34 Years | 1,678 (9.4%) | 1,313 (6.7%) |
| 35 to 39 Years | 1,142 (6.4%) | 1,377 (7.0%) |
| 40 to 44 Years | 1,075 (6.0%) | 1,414 (7.2%) |
| 45 to 49 Years | 1,013 (5.7%) | 953 (4.8%) |
| 50 to 54 Years | 995 (5.6%) | 1,015 (5.1%) |
| 55 to 59 Years | 1,179 (6.6%) | 1,195 (6.1%) |
| 60 to 64 Years | 1,206 (6.7%) | 1,138 (5.8%) |
| 65 to 69 Years | 894 (5.0%) | 1,346 (6.8%) |
| 70 to 74 Years | 851 (4.8%) | 870 (4.4%) |
| 75 to 79 Years | 352 (2.0%) | 389 (2.0%) |
| 80 to 84 Years | 329 (1.8%) | 492 (2.5%) |
| 85 Years and over | 226 (1.3%) | 853 (4.3%) |
| Total | 17,893 (100.0%) | 19,705 (100.0%) |
Families and Households in New Albany
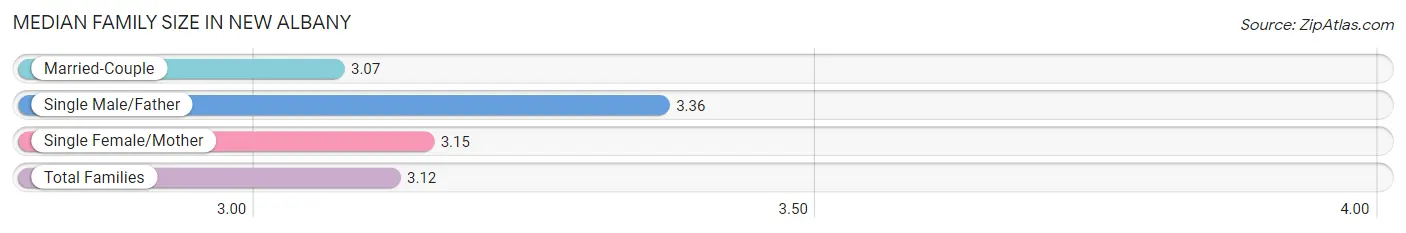
Median Family Size in New Albany
The median family size in New Albany is 3.12 persons per family, with single male/father families (704 | 8.3%) accounting for the largest median family size of 3.36 persons per family. On the other hand, married-couple families (5,449 | 64.4%) represent the smallest median family size with 3.07 persons per family.
| Family Type | # Families | Family Size |
| Married-Couple | 5,449 (64.4%) | 3.07 |
| Single Male/Father | 704 (8.3%) | 3.36 |
| Single Female/Mother | 2,305 (27.3%) | 3.15 |
| Total Families | 8,458 (100.0%) | 3.12 |
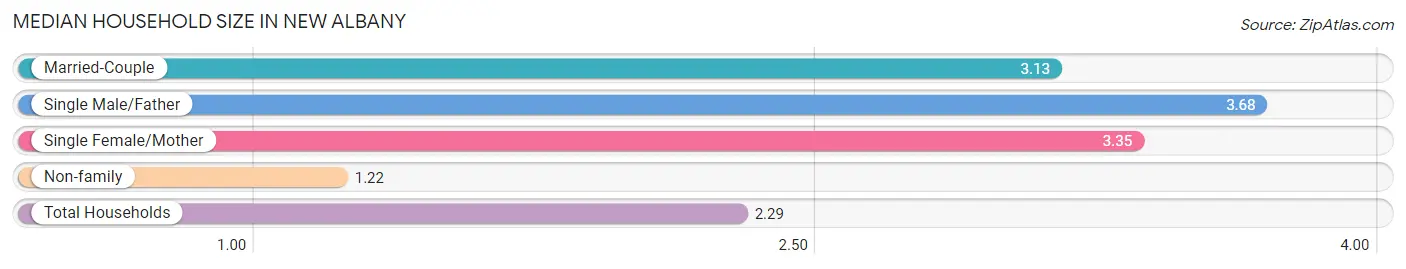
Median Household Size in New Albany
The median household size in New Albany is 2.29 persons per household, with single male/father households (704 | 4.4%) accounting for the largest median household size of 3.68 persons per household. non-family households (7,448 | 46.8%) represent the smallest median household size with 1.22 persons per household.
| Household Type | # Households | Household Size |
| Married-Couple | 5,449 (34.3%) | 3.13 |
| Single Male/Father | 704 (4.4%) | 3.68 |
| Single Female/Mother | 2,305 (14.5%) | 3.35 |
| Non-family | 7,448 (46.8%) | 1.22 |
| Total Households | 15,906 (100.0%) | 2.29 |
Household Size by Marriage Status in New Albany
Out of a total of 15,906 households in New Albany, 8,458 (53.2%) are family households, while 7,448 (46.8%) are nonfamily households. The most numerous type of family households are 2-person households, comprising 4,013, and the most common type of nonfamily households are 1-person households, comprising 6,168.
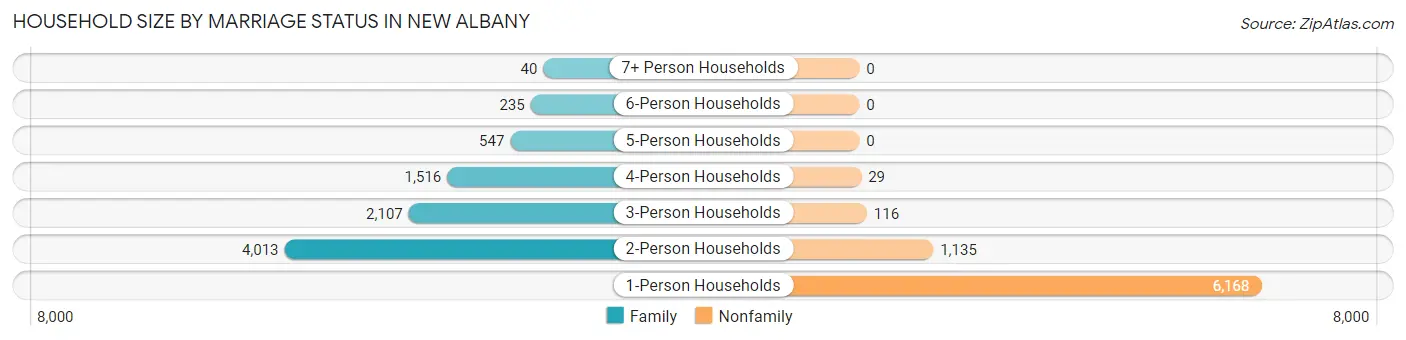
| Household Size | Family Households | Nonfamily Households |
| 1-Person Households | - | 6,168 (38.8%) |
| 2-Person Households | 4,013 (25.2%) | 1,135 (7.1%) |
| 3-Person Households | 2,107 (13.3%) | 116 (0.7%) |
| 4-Person Households | 1,516 (9.5%) | 29 (0.2%) |
| 5-Person Households | 547 (3.4%) | 0 (0.0%) |
| 6-Person Households | 235 (1.5%) | 0 (0.0%) |
| 7+ Person Households | 40 (0.3%) | 0 (0.0%) |
| Total | 8,458 (53.2%) | 7,448 (46.8%) |
Female Fertility in New Albany
Fertility by Age in New Albany
Average fertility rate in New Albany is 67.0 births per 1,000 women. Women in the age bracket of 20 to 34 years have the highest fertility rate with 100.0 births per 1,000 women. Women in the age bracket of 20 to 34 years acount for 67.6% of all women with births.
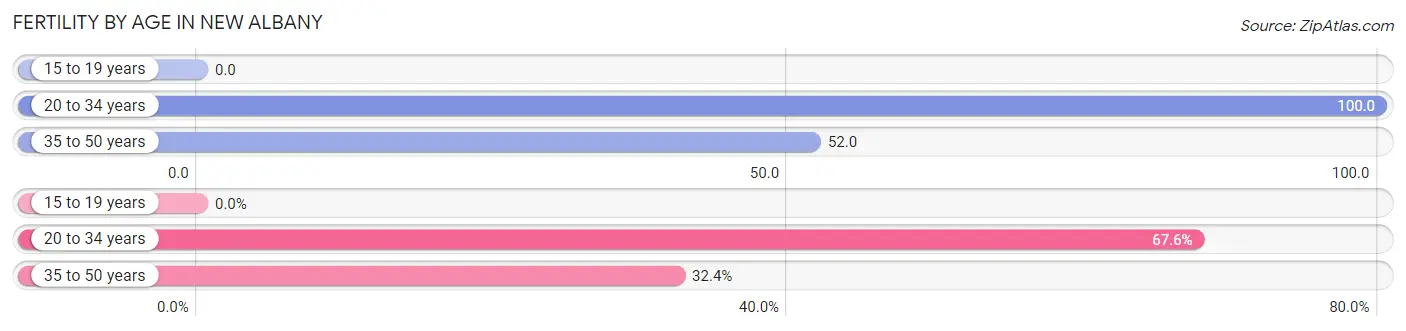
| Age Bracket | Women with Births | Births / 1,000 Women |
| 15 to 19 years | 0 (0.0%) | 0.0 |
| 20 to 34 years | 424 (67.6%) | 100.0 |
| 35 to 50 years | 203 (32.4%) | 52.0 |
| Total | 627 (100.0%) | 67.0 |
Fertility by Age by Marriage Status in New Albany
57.9% of women with births (627) in New Albany are married. The highest percentage of unmarried women with births falls into 20 to 34 years age bracket with 56.1% of them unmarried at the time of birth, while the lowest percentage of unmarried women with births belong to 35 to 50 years age bracket with 12.8% of them unmarried.
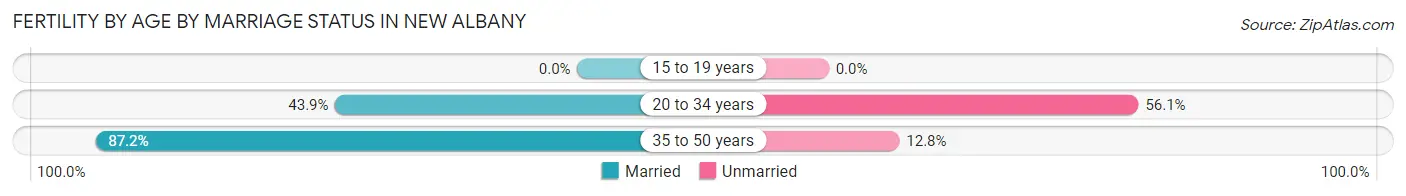
| Age Bracket | Married | Unmarried |
| 15 to 19 years | 0 (0.0%) | 0 (0.0%) |
| 20 to 34 years | 186 (43.9%) | 238 (56.1%) |
| 35 to 50 years | 177 (87.2%) | 26 (12.8%) |
| Total | 363 (57.9%) | 264 (42.1%) |
Fertility by Education in New Albany
Average fertility rate in New Albany is 67.0 births per 1,000 women. Women with the education attainment of graduate degree have the highest fertility rate of 88.0 births per 1,000 women, while women with the education attainment of bachelor's degree have the lowest fertility at 43.0 births per 1,000 women. Women with the education attainment of high school diploma represent 35.2% of all women with births.
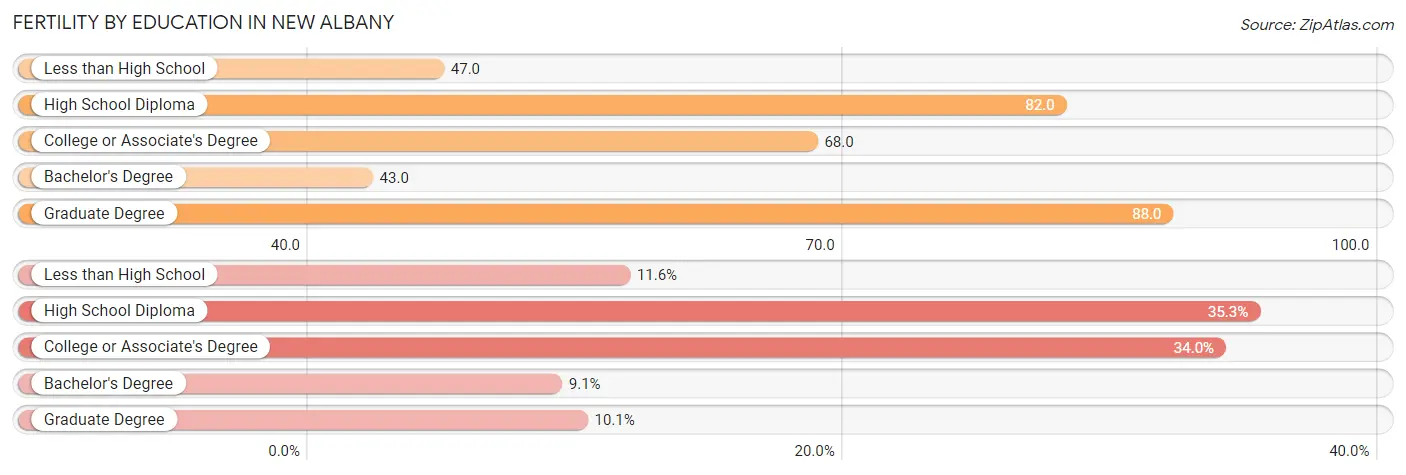
| Educational Attainment | Women with Births | Births / 1,000 Women |
| Less than High School | 73 (11.6%) | 47.0 |
| High School Diploma | 221 (35.2%) | 82.0 |
| College or Associate's Degree | 213 (34.0%) | 68.0 |
| Bachelor's Degree | 57 (9.1%) | 43.0 |
| Graduate Degree | 63 (10.1%) | 88.0 |
| Total | 627 (100.0%) | 67.0 |
Fertility by Education by Marriage Status in New Albany
42.1% of women with births in New Albany are unmarried. Women with the educational attainment of less than high school are most likely to be married with 100.0% of them married at childbirth, while women with the educational attainment of college or associate's degree are least likely to be married with 70.4% of them unmarried at childbirth.
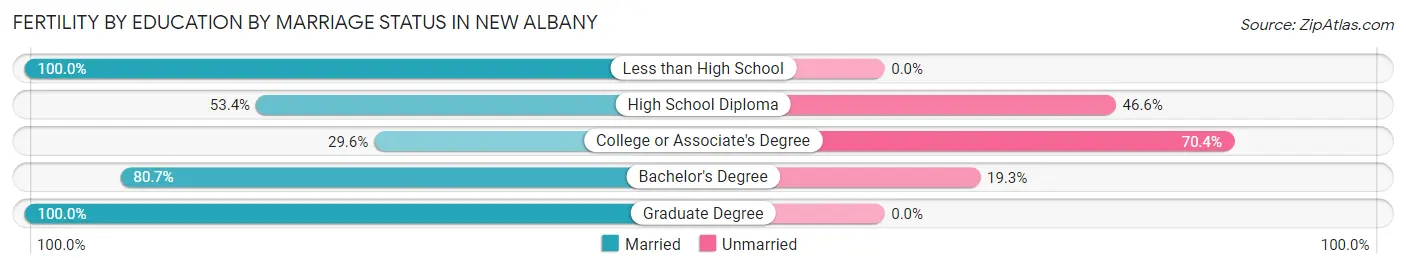
| Educational Attainment | Married | Unmarried |
| Less than High School | 73 (100.0%) | 0 (0.0%) |
| High School Diploma | 118 (53.4%) | 103 (46.6%) |
| College or Associate's Degree | 63 (29.6%) | 150 (70.4%) |
| Bachelor's Degree | 46 (80.7%) | 11 (19.3%) |
| Graduate Degree | 63 (100.0%) | 0 (0.0%) |
| Total | 363 (57.9%) | 264 (42.1%) |
Employment Characteristics in New Albany
Employment by Class of Employer in New Albany
Among the 17,551 employed individuals in New Albany, private company employees (12,934 | 73.7%), not-for-profit organizations (1,523 | 8.7%), and self-employed (not incorporated) (1,039 | 5.9%) make up the most common classes of employment.
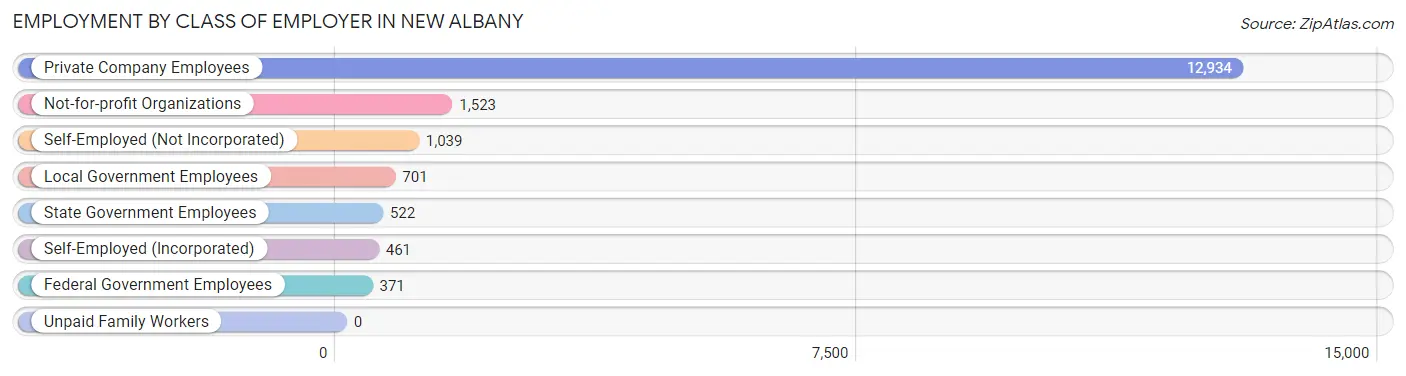
| Employer Class | # Employees | % Employees |
| Private Company Employees | 12,934 | 73.7% |
| Self-Employed (Incorporated) | 461 | 2.6% |
| Self-Employed (Not Incorporated) | 1,039 | 5.9% |
| Not-for-profit Organizations | 1,523 | 8.7% |
| Local Government Employees | 701 | 4.0% |
| State Government Employees | 522 | 3.0% |
| Federal Government Employees | 371 | 2.1% |
| Unpaid Family Workers | 0 | 0.0% |
| Total | 17,551 | 100.0% |
Employment Status by Age in New Albany
According to the labor force statistics for New Albany, out of the total population over 16 years of age (30,982), 60.9% or 18,868 individuals are in the labor force, with 4.9% or 925 of them unemployed. The age group with the highest labor force participation rate is 30 to 34 years, with 83.4% or 2,494 individuals in the labor force. Within the labor force, the 55 to 59 years age range has the highest percentage of unemployed individuals, with 12.9% or 199 of them being unemployed.
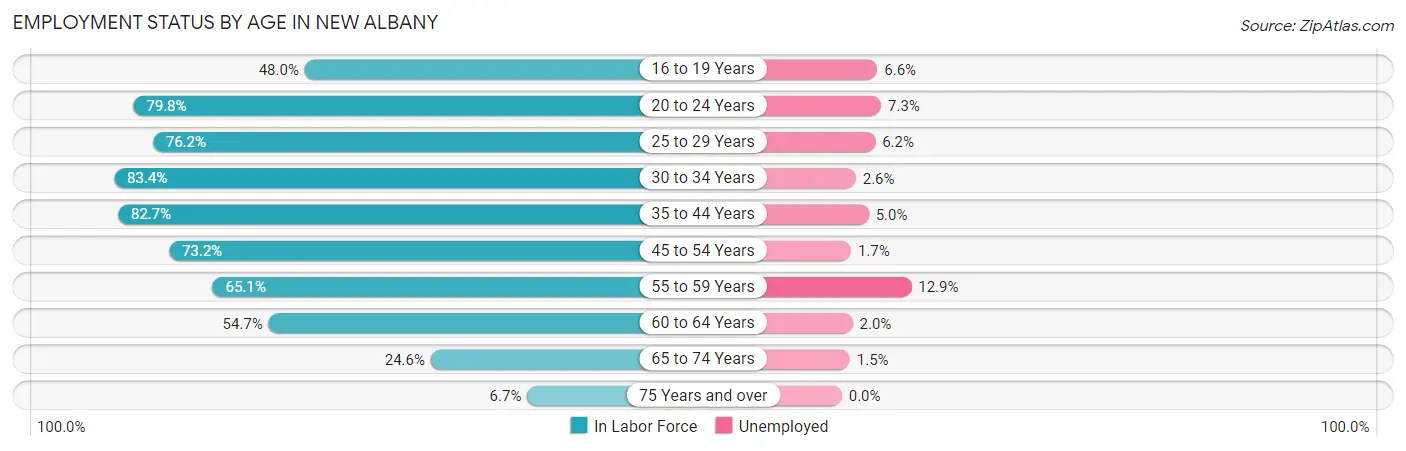
| Age Bracket | In Labor Force | Unemployed |
| 16 to 19 Years | 1,010 (48.0%) | 67 (6.6%) |
| 20 to 24 Years | 1,884 (79.8%) | 138 (7.3%) |
| 25 to 29 Years | 2,454 (76.2%) | 152 (6.2%) |
| 30 to 34 Years | 2,494 (83.4%) | 65 (2.6%) |
| 35 to 44 Years | 4,142 (82.7%) | 207 (5.0%) |
| 45 to 54 Years | 2,910 (73.2%) | 49 (1.7%) |
| 55 to 59 Years | 1,545 (65.1%) | 199 (12.9%) |
| 60 to 64 Years | 1,282 (54.7%) | 26 (2.0%) |
| 65 to 74 Years | 974 (24.6%) | 15 (1.5%) |
| 75 Years and over | 177 (6.7%) | 0 (0.0%) |
| Total | 18,868 (60.9%) | 925 (4.9%) |
Employment Status by Educational Attainment in New Albany
According to labor force statistics for New Albany, 74.5% of individuals (14,836) out of the total population between 25 and 64 years of age (19,914) are in the labor force, with 4.7% or 697 of them being unemployed. The group with the highest labor force participation rate are those with the educational attainment of bachelor's degree or higher, with 90.7% or 4,144 individuals in the labor force. Within the labor force, individuals with high school diploma education have the highest percentage of unemployment, with 7.9% or 368 of them being unemployed.
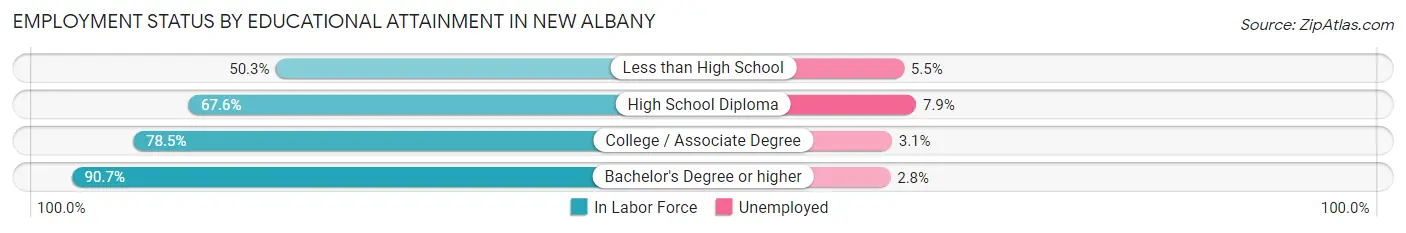
| Educational Attainment | In Labor Force | Unemployed |
| Less than High School | 1,093 (50.3%) | 120 (5.5%) |
| High School Diploma | 4,662 (67.6%) | 545 (7.9%) |
| College / Associate Degree | 4,927 (78.5%) | 195 (3.1%) |
| Bachelor's Degree or higher | 4,144 (90.7%) | 128 (2.8%) |
| Total | 14,836 (74.5%) | 936 (4.7%) |
Employment Occupations by Sex in New Albany
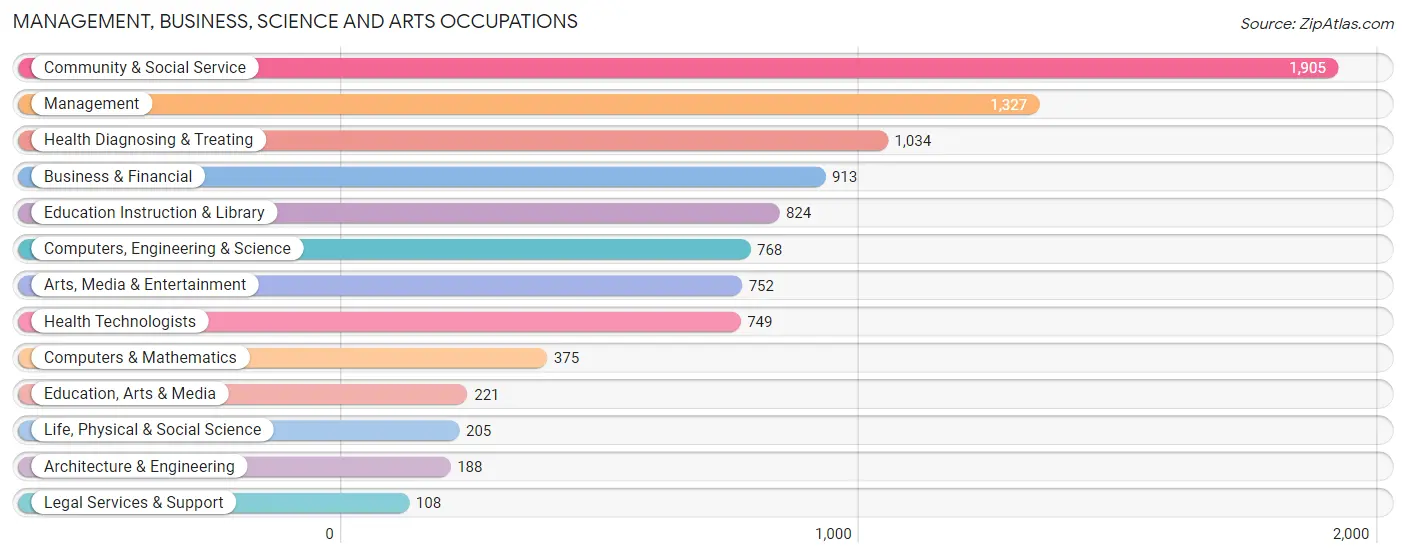
Management, Business, Science and Arts Occupations
The most common Management, Business, Science and Arts occupations in New Albany are Community & Social Service (1,905 | 10.7%), Management (1,327 | 7.4%), Health Diagnosing & Treating (1,034 | 5.8%), Business & Financial (913 | 5.1%), and Education Instruction & Library (824 | 4.6%).
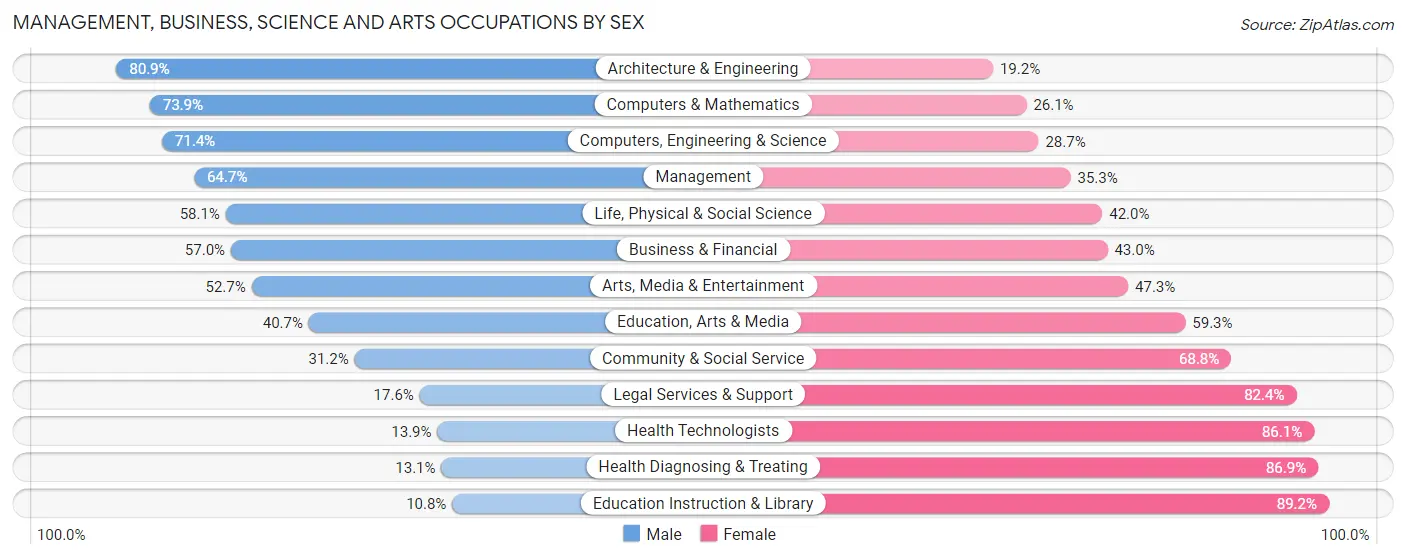
Management, Business, Science and Arts Occupations by Sex
Within the Management, Business, Science and Arts occupations in New Albany, the most male-oriented occupations are Architecture & Engineering (80.8%), Computers & Mathematics (73.9%), and Computers, Engineering & Science (71.4%), while the most female-oriented occupations are Education Instruction & Library (89.2%), Health Diagnosing & Treating (86.9%), and Health Technologists (86.1%).
| Occupation | Male | Female |
| Management | 858 (64.7%) | 469 (35.3%) |
| Business & Financial | 520 (57.0%) | 393 (43.0%) |
| Computers, Engineering & Science | 548 (71.4%) | 220 (28.6%) |
| Computers & Mathematics | 277 (73.9%) | 98 (26.1%) |
| Architecture & Engineering | 152 (80.8%) | 36 (19.2%) |
| Life, Physical & Social Science | 119 (58.1%) | 86 (41.9%) |
| Community & Social Service | 594 (31.2%) | 1,311 (68.8%) |
| Education, Arts & Media | 90 (40.7%) | 131 (59.3%) |
| Legal Services & Support | 19 (17.6%) | 89 (82.4%) |
| Education Instruction & Library | 89 (10.8%) | 735 (89.2%) |
| Arts, Media & Entertainment | 396 (52.7%) | 356 (47.3%) |
| Health Diagnosing & Treating | 135 (13.1%) | 899 (86.9%) |
| Health Technologists | 104 (13.9%) | 645 (86.1%) |
| Total (Category) | 2,655 (44.6%) | 3,292 (55.4%) |
| Total (Overall) | 9,168 (51.3%) | 8,695 (48.7%) |
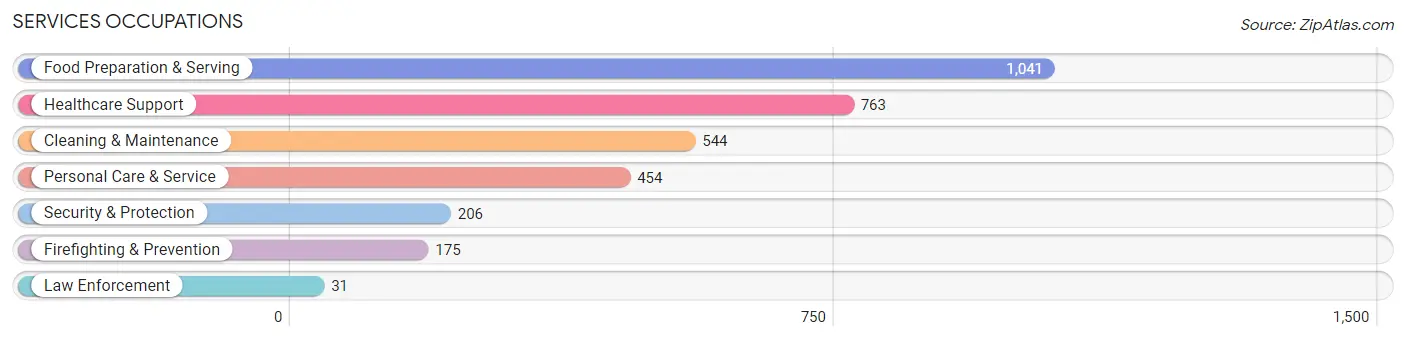
Services Occupations
The most common Services occupations in New Albany are Food Preparation & Serving (1,041 | 5.8%), Healthcare Support (763 | 4.3%), Cleaning & Maintenance (544 | 3.0%), Personal Care & Service (454 | 2.5%), and Security & Protection (206 | 1.1%).
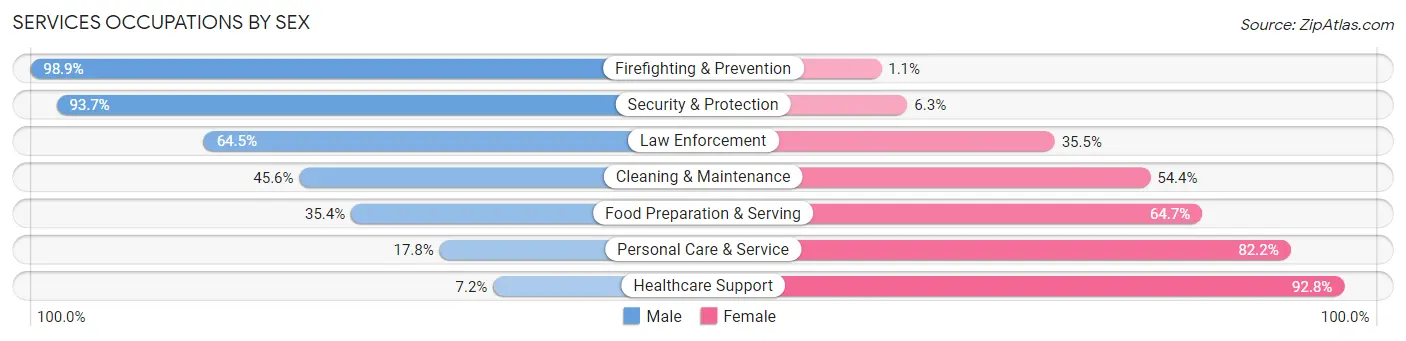
Services Occupations by Sex
Within the Services occupations in New Albany, the most male-oriented occupations are Firefighting & Prevention (98.9%), Security & Protection (93.7%), and Law Enforcement (64.5%), while the most female-oriented occupations are Healthcare Support (92.8%), Personal Care & Service (82.2%), and Food Preparation & Serving (64.6%).
| Occupation | Male | Female |
| Healthcare Support | 55 (7.2%) | 708 (92.8%) |
| Security & Protection | 193 (93.7%) | 13 (6.3%) |
| Firefighting & Prevention | 173 (98.9%) | 2 (1.1%) |
| Law Enforcement | 20 (64.5%) | 11 (35.5%) |
| Food Preparation & Serving | 368 (35.3%) | 673 (64.6%) |
| Cleaning & Maintenance | 248 (45.6%) | 296 (54.4%) |
| Personal Care & Service | 81 (17.8%) | 373 (82.2%) |
| Total (Category) | 945 (31.4%) | 2,063 (68.6%) |
| Total (Overall) | 9,168 (51.3%) | 8,695 (48.7%) |
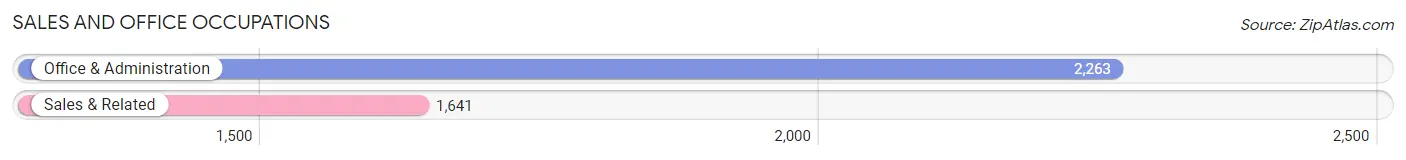
Sales and Office Occupations
The most common Sales and Office occupations in New Albany are Office & Administration (2,263 | 12.7%), and Sales & Related (1,641 | 9.2%).
Sales and Office Occupations by Sex
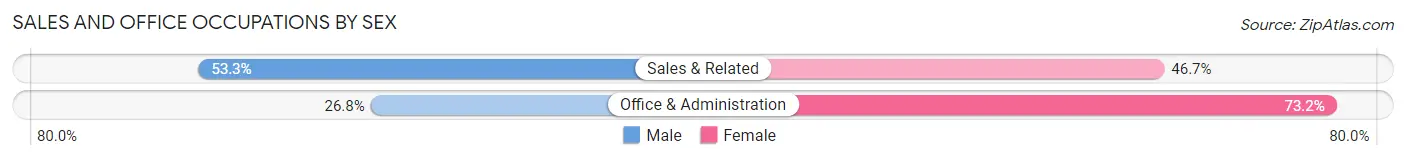
| Occupation | Male | Female |
| Sales & Related | 874 (53.3%) | 767 (46.7%) |
| Office & Administration | 606 (26.8%) | 1,657 (73.2%) |
| Total (Category) | 1,480 (37.9%) | 2,424 (62.1%) |
| Total (Overall) | 9,168 (51.3%) | 8,695 (48.7%) |
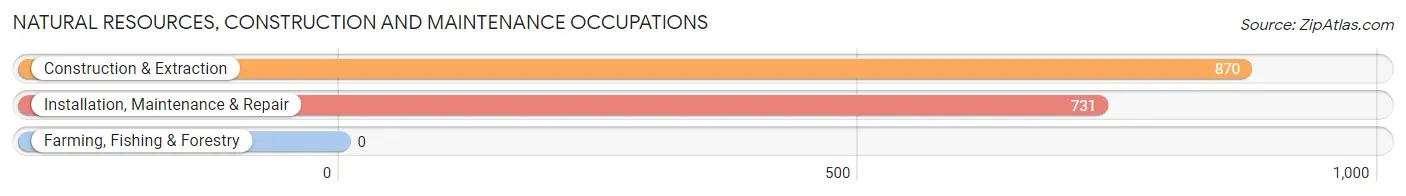
Natural Resources, Construction and Maintenance Occupations
The most common Natural Resources, Construction and Maintenance occupations in New Albany are Construction & Extraction (870 | 4.9%), and Installation, Maintenance & Repair (731 | 4.1%).
Natural Resources, Construction and Maintenance Occupations by Sex
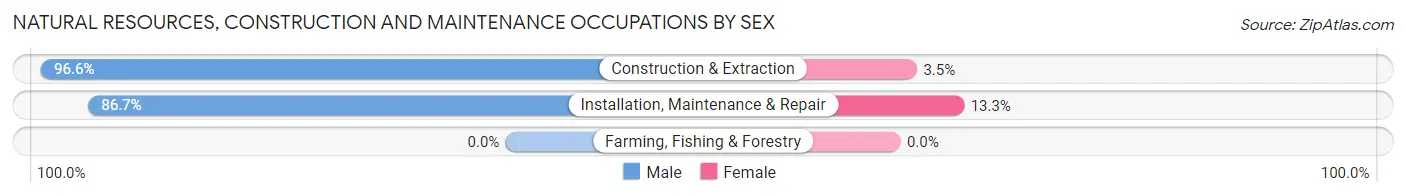
| Occupation | Male | Female |
| Farming, Fishing & Forestry | 0 (0.0%) | 0 (0.0%) |
| Construction & Extraction | 840 (96.6%) | 30 (3.5%) |
| Installation, Maintenance & Repair | 634 (86.7%) | 97 (13.3%) |
| Total (Category) | 1,474 (92.1%) | 127 (7.9%) |
| Total (Overall) | 9,168 (51.3%) | 8,695 (48.7%) |
Production, Transportation and Moving Occupations
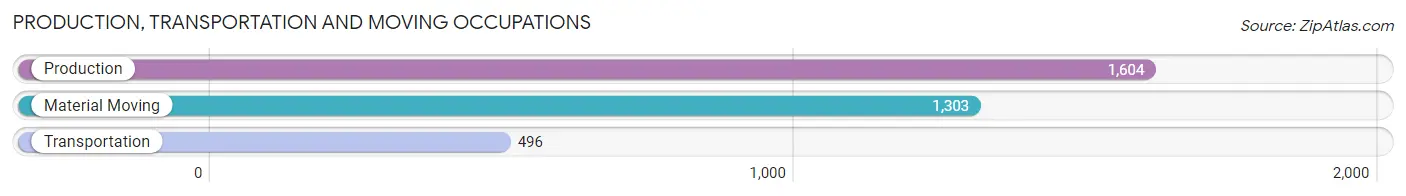
The most common Production, Transportation and Moving occupations in New Albany are Production (1,604 | 9.0%), Material Moving (1,303 | 7.3%), and Transportation (496 | 2.8%).
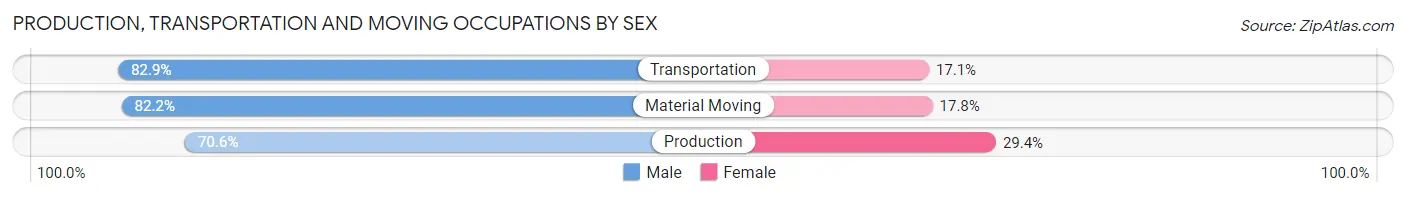
Production, Transportation and Moving Occupations by Sex
| Occupation | Male | Female |
| Production | 1,132 (70.6%) | 472 (29.4%) |
| Transportation | 411 (82.9%) | 85 (17.1%) |
| Material Moving | 1,071 (82.2%) | 232 (17.8%) |
| Total (Category) | 2,614 (76.8%) | 789 (23.2%) |
| Total (Overall) | 9,168 (51.3%) | 8,695 (48.7%) |
Employment Industries by Sex in New Albany
Employment Industries in New Albany
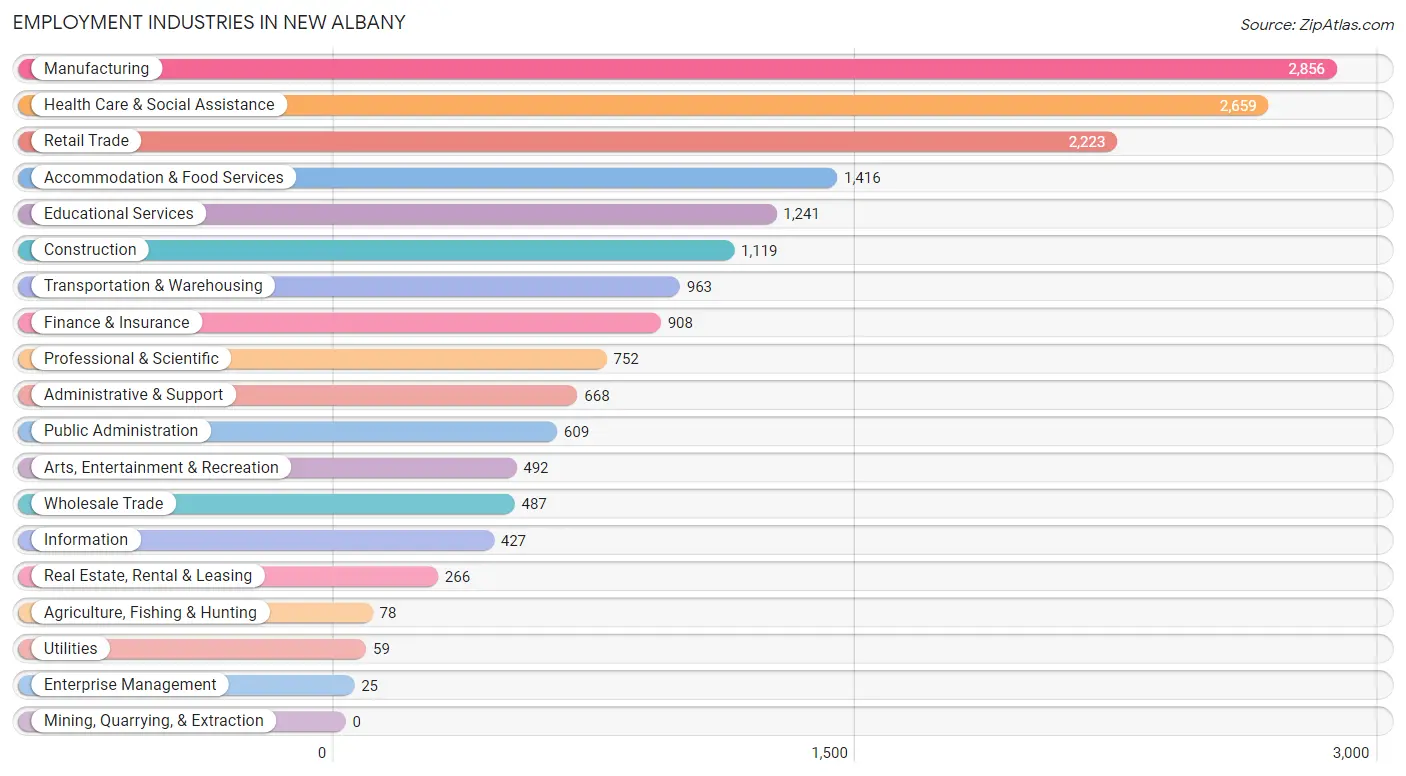
The major employment industries in New Albany include Manufacturing (2,856 | 16.0%), Health Care & Social Assistance (2,659 | 14.9%), Retail Trade (2,223 | 12.4%), Accommodation & Food Services (1,416 | 7.9%), and Educational Services (1,241 | 7.0%).
Employment Industries by Sex in New Albany
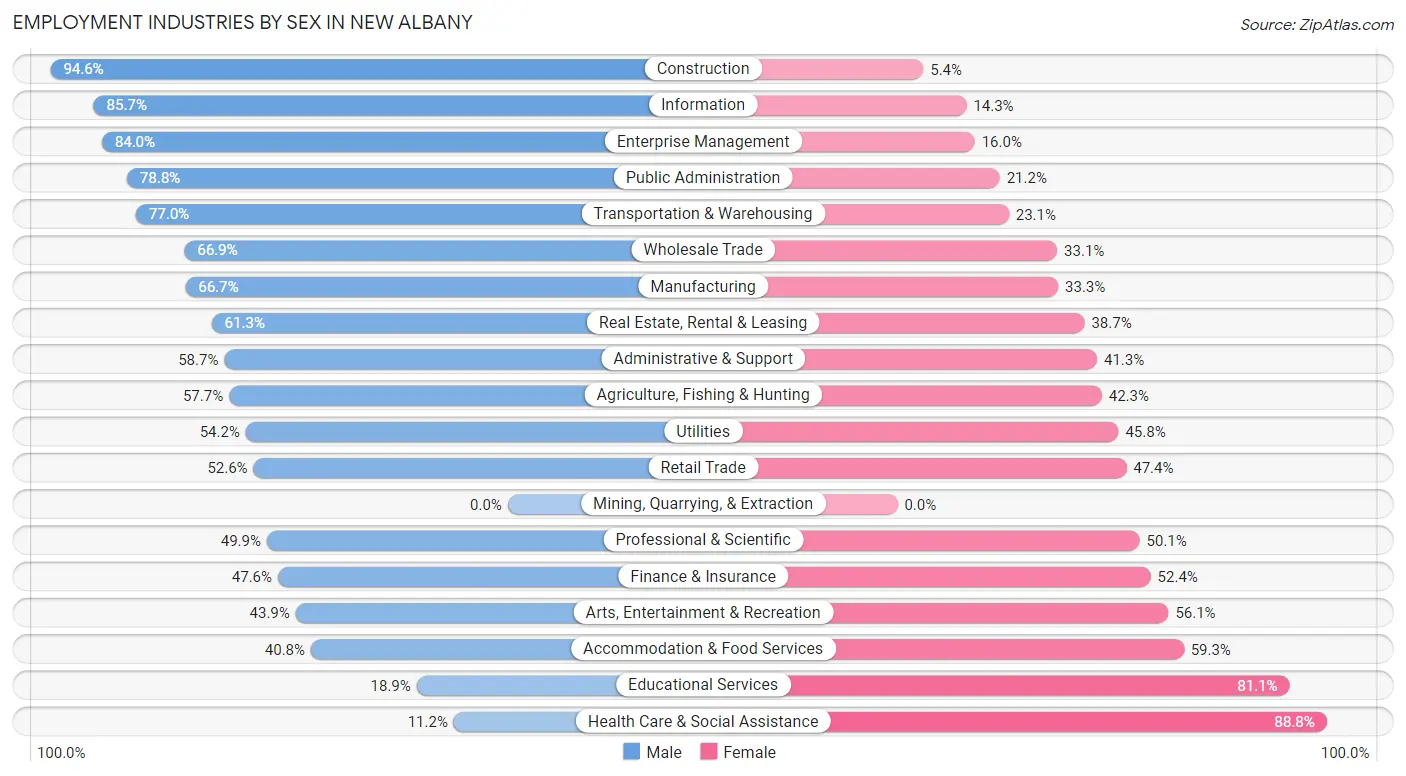
The New Albany industries that see more men than women are Construction (94.6%), Information (85.7%), and Enterprise Management (84.0%), whereas the industries that tend to have a higher number of women are Health Care & Social Assistance (88.8%), Educational Services (81.1%), and Accommodation & Food Services (59.3%).
| Industry | Male | Female |
| Agriculture, Fishing & Hunting | 45 (57.7%) | 33 (42.3%) |
| Mining, Quarrying, & Extraction | 0 (0.0%) | 0 (0.0%) |
| Construction | 1,059 (94.6%) | 60 (5.4%) |
| Manufacturing | 1,906 (66.7%) | 950 (33.3%) |
| Wholesale Trade | 326 (66.9%) | 161 (33.1%) |
| Retail Trade | 1,170 (52.6%) | 1,053 (47.4%) |
| Transportation & Warehousing | 741 (76.9%) | 222 (23.1%) |
| Utilities | 32 (54.2%) | 27 (45.8%) |
| Information | 366 (85.7%) | 61 (14.3%) |
| Finance & Insurance | 432 (47.6%) | 476 (52.4%) |
| Real Estate, Rental & Leasing | 163 (61.3%) | 103 (38.7%) |
| Professional & Scientific | 375 (49.9%) | 377 (50.1%) |
| Enterprise Management | 21 (84.0%) | 4 (16.0%) |
| Administrative & Support | 392 (58.7%) | 276 (41.3%) |
| Educational Services | 234 (18.9%) | 1,007 (81.1%) |
| Health Care & Social Assistance | 297 (11.2%) | 2,362 (88.8%) |
| Arts, Entertainment & Recreation | 216 (43.9%) | 276 (56.1%) |
| Accommodation & Food Services | 577 (40.7%) | 839 (59.3%) |
| Public Administration | 480 (78.8%) | 129 (21.2%) |
| Total | 9,168 (51.3%) | 8,695 (48.7%) |
Education in New Albany
School Enrollment in New Albany
The most common levels of schooling among the 7,762 students in New Albany are high school (2,196 | 28.3%), middle school (1,598 | 20.6%), and elementary school (1,464 | 18.9%).
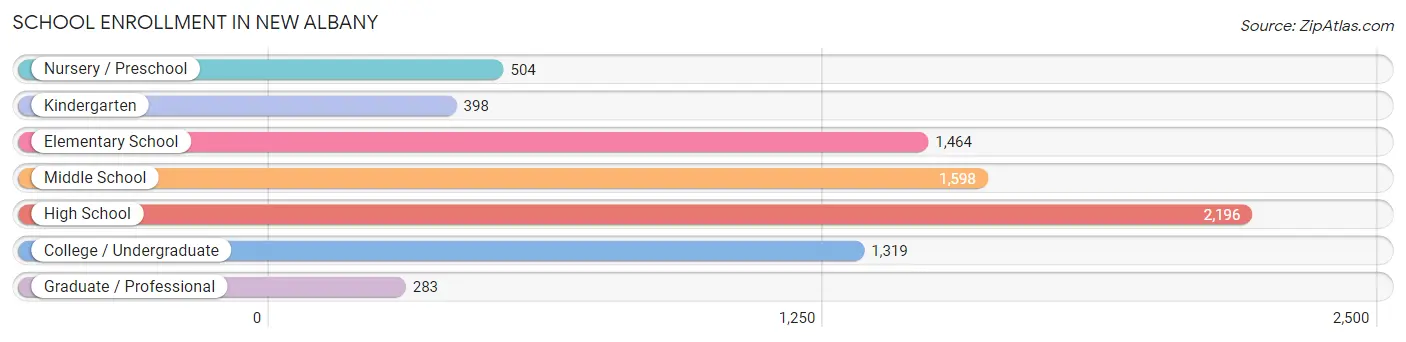
| School Level | # Students | % Students |
| Nursery / Preschool | 504 | 6.5% |
| Kindergarten | 398 | 5.1% |
| Elementary School | 1,464 | 18.9% |
| Middle School | 1,598 | 20.6% |
| High School | 2,196 | 28.3% |
| College / Undergraduate | 1,319 | 17.0% |
| Graduate / Professional | 283 | 3.6% |
| Total | 7,762 | 100.0% |
School Enrollment by Age by Funding Source in New Albany
Out of a total of 7,762 students who are enrolled in schools in New Albany, 862 (11.1%) attend a private institution, while the remaining 6,900 (88.9%) are enrolled in public schools. The age group of 3 to 4 year olds has the highest likelihood of being enrolled in private schools, with 163 (33.8% in the age bracket) enrolled. Conversely, the age group of 35 years and over has the lowest likelihood of being enrolled in a private school, with 325 (97.3% in the age bracket) attending a public institution.
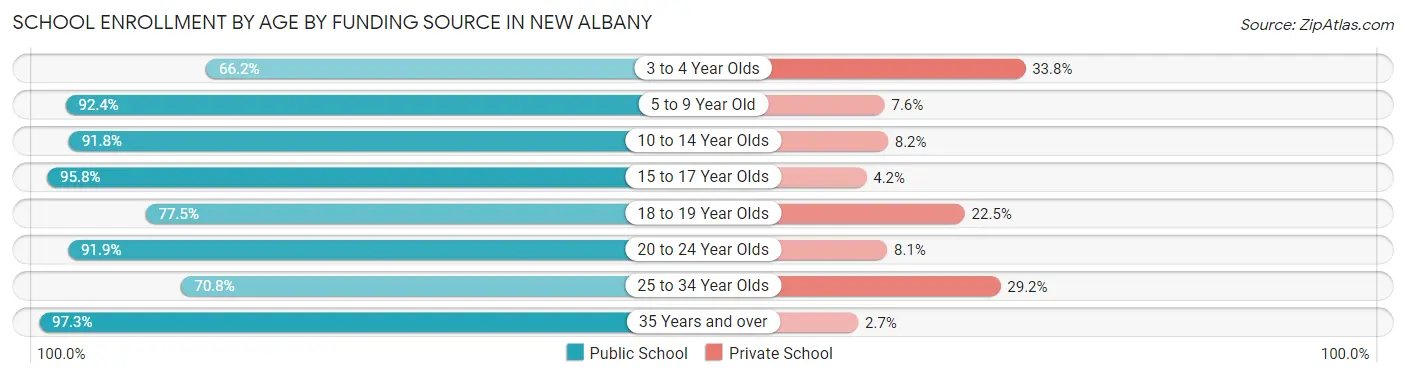
| Age Bracket | Public School | Private School |
| 3 to 4 Year Olds | 319 (66.2%) | 163 (33.8%) |
| 5 to 9 Year Old | 1,579 (92.4%) | 130 (7.6%) |
| 10 to 14 Year Olds | 1,765 (91.8%) | 158 (8.2%) |
| 15 to 17 Year Olds | 1,457 (95.8%) | 64 (4.2%) |
| 18 to 19 Year Olds | 567 (77.5%) | 165 (22.5%) |
| 20 to 24 Year Olds | 591 (91.9%) | 52 (8.1%) |
| 25 to 34 Year Olds | 296 (70.8%) | 122 (29.2%) |
| 35 Years and over | 325 (97.3%) | 9 (2.7%) |
| Total | 6,900 (88.9%) | 862 (11.1%) |
Educational Attainment by Field of Study in New Albany
Education (1,268 | 19.4%), business (929 | 14.2%), science & technology (674 | 10.3%), psychology (488 | 7.4%), and liberal arts & history (476 | 7.3%) are the most common fields of study among 6,553 individuals in New Albany who have obtained a bachelor's degree or higher.
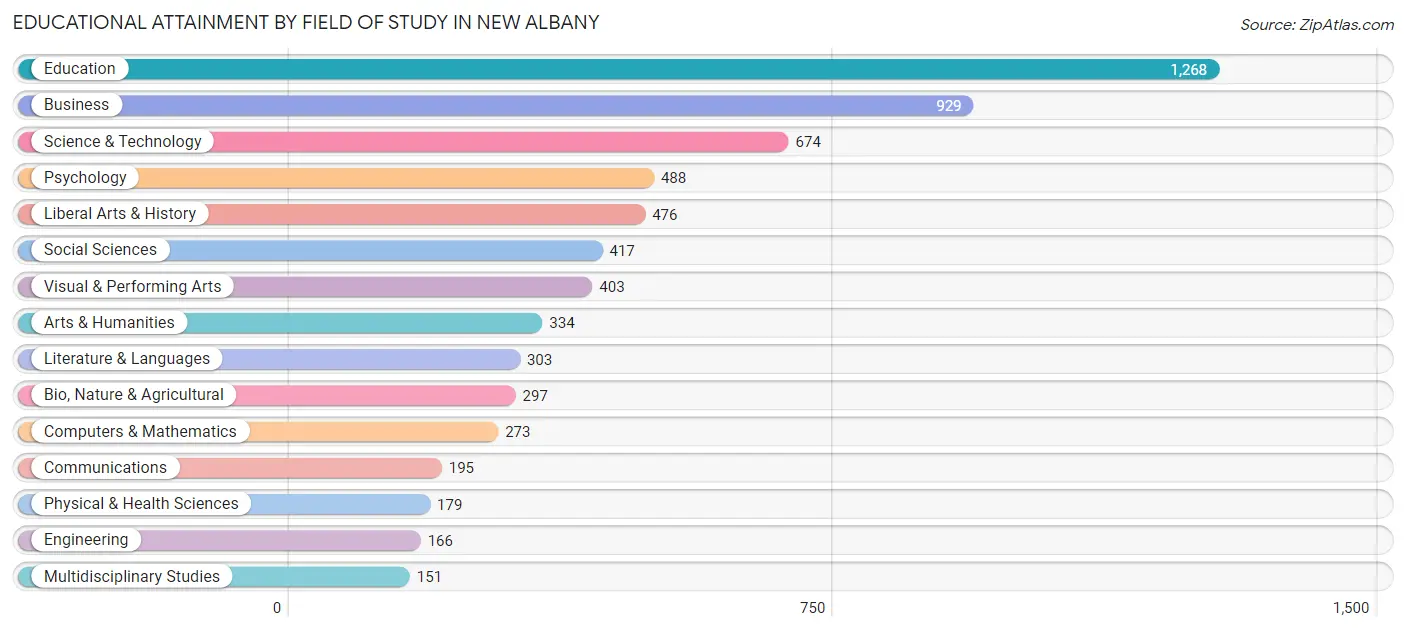
| Field of Study | # Graduates | % Graduates |
| Computers & Mathematics | 273 | 4.2% |
| Bio, Nature & Agricultural | 297 | 4.5% |
| Physical & Health Sciences | 179 | 2.7% |
| Psychology | 488 | 7.4% |
| Social Sciences | 417 | 6.4% |
| Engineering | 166 | 2.5% |
| Multidisciplinary Studies | 151 | 2.3% |
| Science & Technology | 674 | 10.3% |
| Business | 929 | 14.2% |
| Education | 1,268 | 19.4% |
| Literature & Languages | 303 | 4.6% |
| Liberal Arts & History | 476 | 7.3% |
| Visual & Performing Arts | 403 | 6.1% |
| Communications | 195 | 3.0% |
| Arts & Humanities | 334 | 5.1% |
| Total | 6,553 | 100.0% |
Transportation & Commute in New Albany
Vehicle Availability by Sex in New Albany
The most prevalent vehicle ownership categories in New Albany are males with 2 vehicles (3,914, accounting for 43.6%) and females with 2 vehicles (3,609, making up 46.7%).
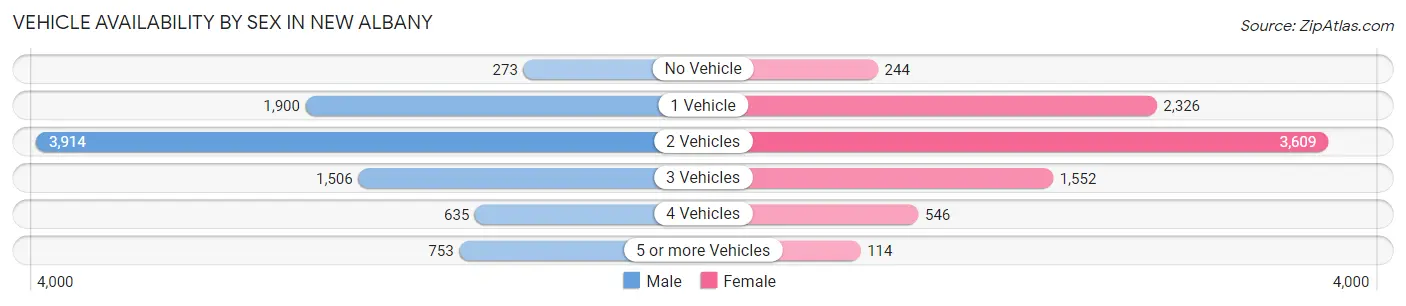
| Vehicles Available | Male | Female |
| No Vehicle | 273 (3.0%) | 244 (2.9%) |
| 1 Vehicle | 1,900 (21.2%) | 2,326 (27.7%) |
| 2 Vehicles | 3,914 (43.6%) | 3,609 (43.0%) |
| 3 Vehicles | 1,506 (16.8%) | 1,552 (18.5%) |
| 4 Vehicles | 635 (7.1%) | 546 (6.5%) |
| 5 or more Vehicles | 753 (8.4%) | 114 (1.4%) |
| Total | 8,981 (100.0%) | 8,391 (100.0%) |
Commute Time in New Albany
The most frequently occuring commute durations in New Albany are 15 to 19 minutes (3,394 commuters, 21.2%), 10 to 14 minutes (2,822 commuters, 17.6%), and 20 to 24 minutes (2,732 commuters, 17.1%).
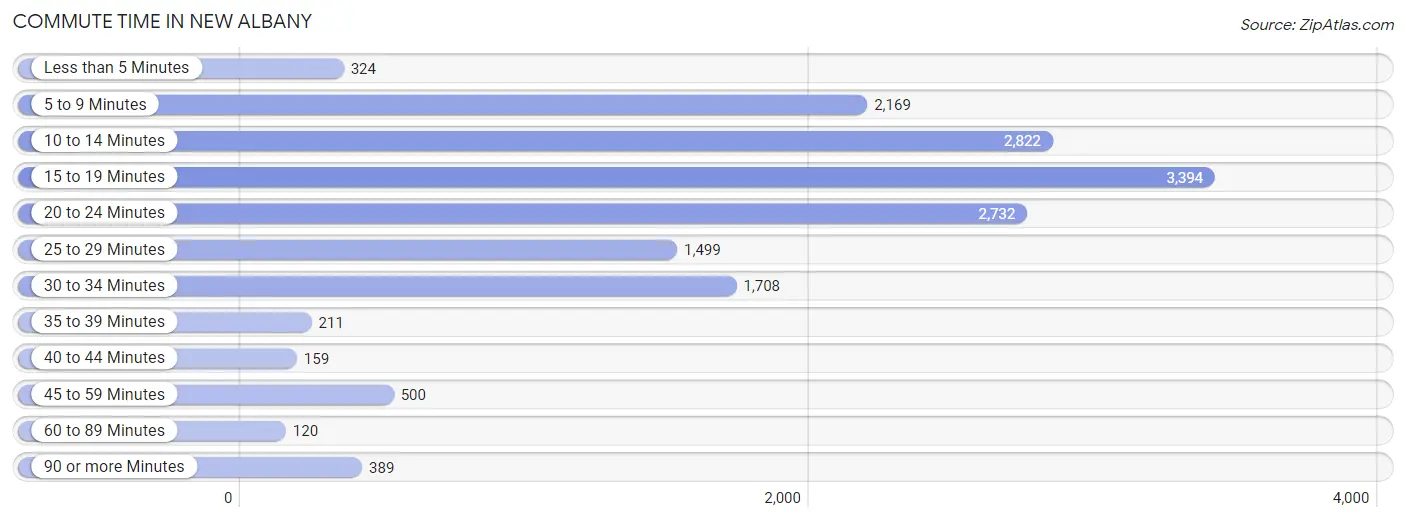
| Commute Time | # Commuters | % Commuters |
| Less than 5 Minutes | 324 | 2.0% |
| 5 to 9 Minutes | 2,169 | 13.5% |
| 10 to 14 Minutes | 2,822 | 17.6% |
| 15 to 19 Minutes | 3,394 | 21.2% |
| 20 to 24 Minutes | 2,732 | 17.1% |
| 25 to 29 Minutes | 1,499 | 9.3% |
| 30 to 34 Minutes | 1,708 | 10.7% |
| 35 to 39 Minutes | 211 | 1.3% |
| 40 to 44 Minutes | 159 | 1.0% |
| 45 to 59 Minutes | 500 | 3.1% |
| 60 to 89 Minutes | 120 | 0.7% |
| 90 or more Minutes | 389 | 2.4% |
Commute Time by Sex in New Albany
The most common commute times in New Albany are 15 to 19 minutes (1,846 commuters, 21.5%) for males and 15 to 19 minutes (1,548 commuters, 20.8%) for females.
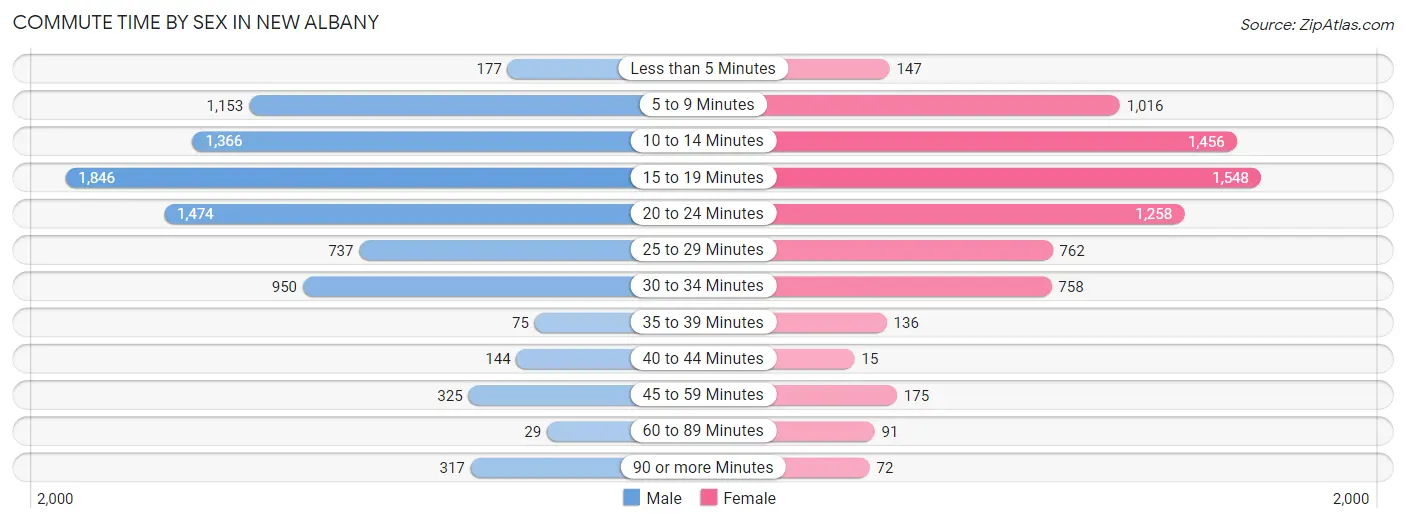
| Commute Time | Male | Female |
| Less than 5 Minutes | 177 (2.1%) | 147 (2.0%) |
| 5 to 9 Minutes | 1,153 (13.4%) | 1,016 (13.7%) |
| 10 to 14 Minutes | 1,366 (15.9%) | 1,456 (19.6%) |
| 15 to 19 Minutes | 1,846 (21.5%) | 1,548 (20.8%) |
| 20 to 24 Minutes | 1,474 (17.2%) | 1,258 (16.9%) |
| 25 to 29 Minutes | 737 (8.6%) | 762 (10.2%) |
| 30 to 34 Minutes | 950 (11.1%) | 758 (10.2%) |
| 35 to 39 Minutes | 75 (0.9%) | 136 (1.8%) |
| 40 to 44 Minutes | 144 (1.7%) | 15 (0.2%) |
| 45 to 59 Minutes | 325 (3.8%) | 175 (2.4%) |
| 60 to 89 Minutes | 29 (0.3%) | 91 (1.2%) |
| 90 or more Minutes | 317 (3.7%) | 72 (1.0%) |
Time of Departure to Work by Sex in New Albany
The most frequent times of departure to work in New Albany are 7:30 AM to 7:59 AM (1,056, 12.3%) for males and 7:30 AM to 7:59 AM (987, 13.3%) for females.
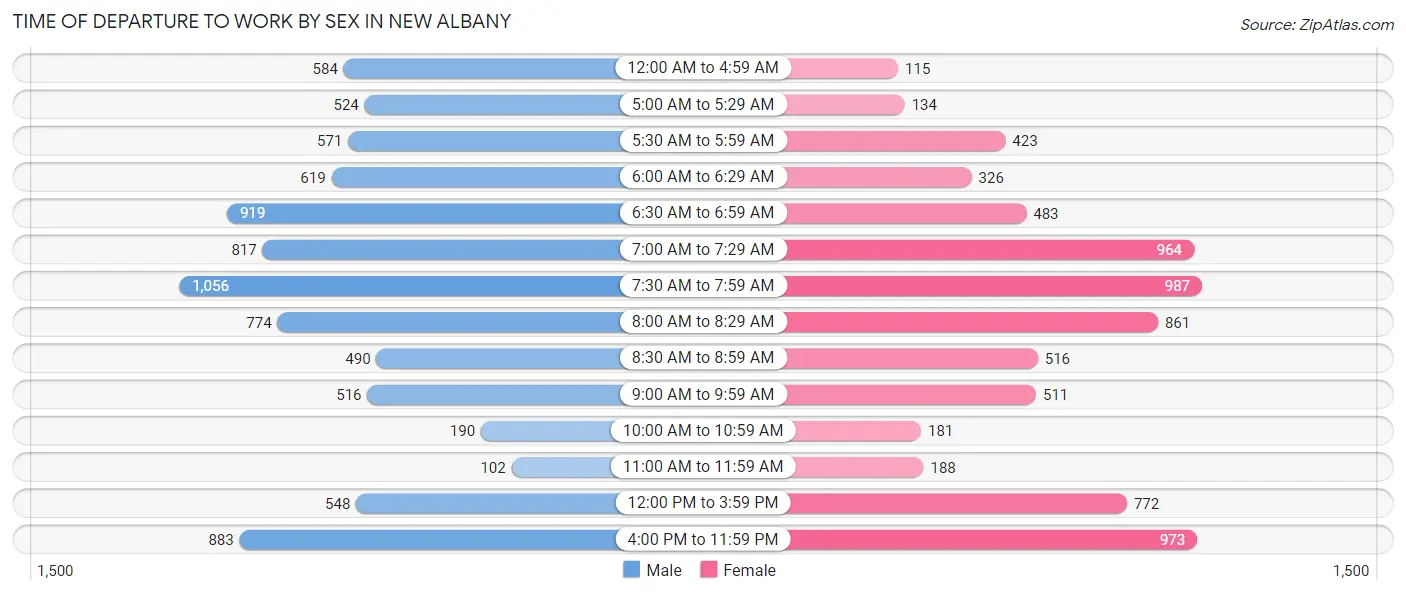
| Time of Departure | Male | Female |
| 12:00 AM to 4:59 AM | 584 (6.8%) | 115 (1.5%) |
| 5:00 AM to 5:29 AM | 524 (6.1%) | 134 (1.8%) |
| 5:30 AM to 5:59 AM | 571 (6.6%) | 423 (5.7%) |
| 6:00 AM to 6:29 AM | 619 (7.2%) | 326 (4.4%) |
| 6:30 AM to 6:59 AM | 919 (10.7%) | 483 (6.5%) |
| 7:00 AM to 7:29 AM | 817 (9.5%) | 964 (13.0%) |
| 7:30 AM to 7:59 AM | 1,056 (12.3%) | 987 (13.3%) |
| 8:00 AM to 8:29 AM | 774 (9.0%) | 861 (11.6%) |
| 8:30 AM to 8:59 AM | 490 (5.7%) | 516 (6.9%) |
| 9:00 AM to 9:59 AM | 516 (6.0%) | 511 (6.9%) |
| 10:00 AM to 10:59 AM | 190 (2.2%) | 181 (2.4%) |
| 11:00 AM to 11:59 AM | 102 (1.2%) | 188 (2.5%) |
| 12:00 PM to 3:59 PM | 548 (6.4%) | 772 (10.4%) |
| 4:00 PM to 11:59 PM | 883 (10.3%) | 973 (13.1%) |
| Total | 8,593 (100.0%) | 7,434 (100.0%) |
Housing Occupancy in New Albany
Occupancy by Ownership in New Albany
Of the total 15,906 dwellings in New Albany, owner-occupied units account for 9,104 (57.2%), while renter-occupied units make up 6,802 (42.8%).
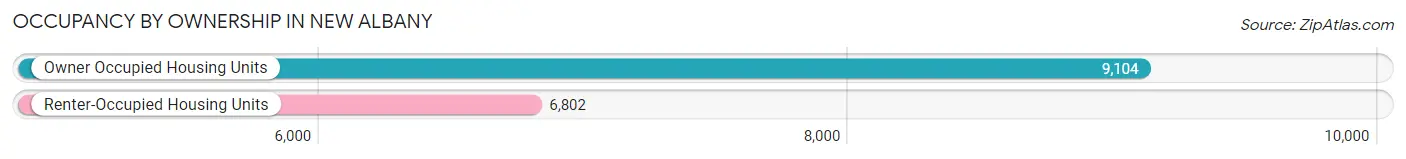
| Occupancy | # Housing Units | % Housing Units |
| Owner Occupied Housing Units | 9,104 | 57.2% |
| Renter-Occupied Housing Units | 6,802 | 42.8% |
| Total Occupied Housing Units | 15,906 | 100.0% |
Occupancy by Household Size in New Albany
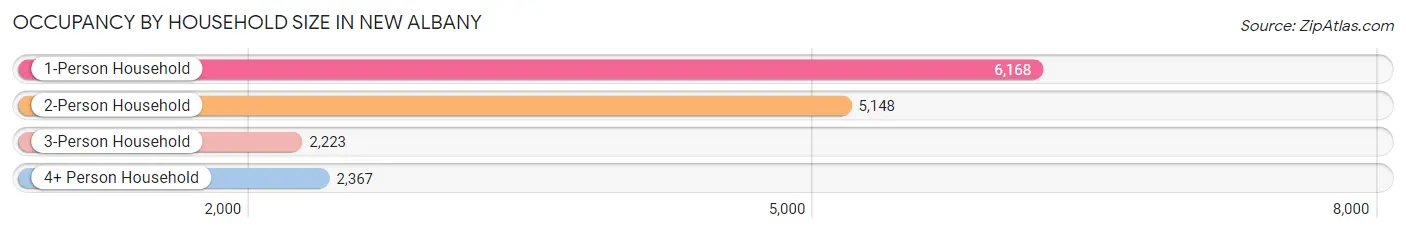
| Household Size | # Housing Units | % Housing Units |
| 1-Person Household | 6,168 | 38.8% |
| 2-Person Household | 5,148 | 32.4% |
| 3-Person Household | 2,223 | 14.0% |
| 4+ Person Household | 2,367 | 14.9% |
| Total Housing Units | 15,906 | 100.0% |
Occupancy by Ownership by Household Size in New Albany
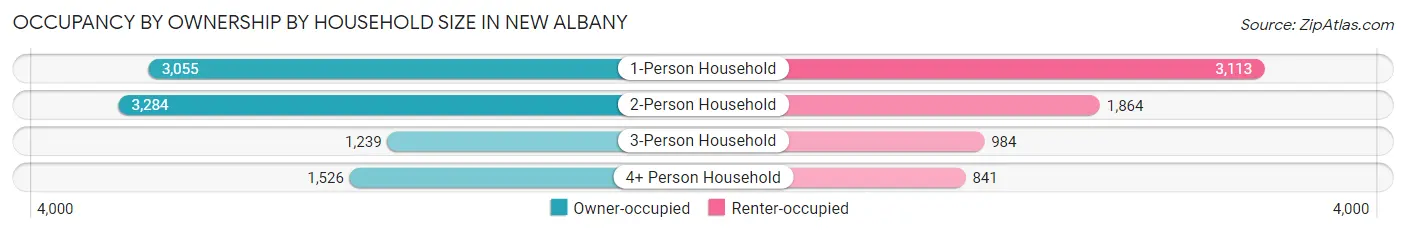
| Household Size | Owner-occupied | Renter-occupied |
| 1-Person Household | 3,055 (49.5%) | 3,113 (50.5%) |
| 2-Person Household | 3,284 (63.8%) | 1,864 (36.2%) |
| 3-Person Household | 1,239 (55.7%) | 984 (44.3%) |
| 4+ Person Household | 1,526 (64.5%) | 841 (35.5%) |
| Total Housing Units | 9,104 (57.2%) | 6,802 (42.8%) |
Occupancy by Educational Attainment in New Albany
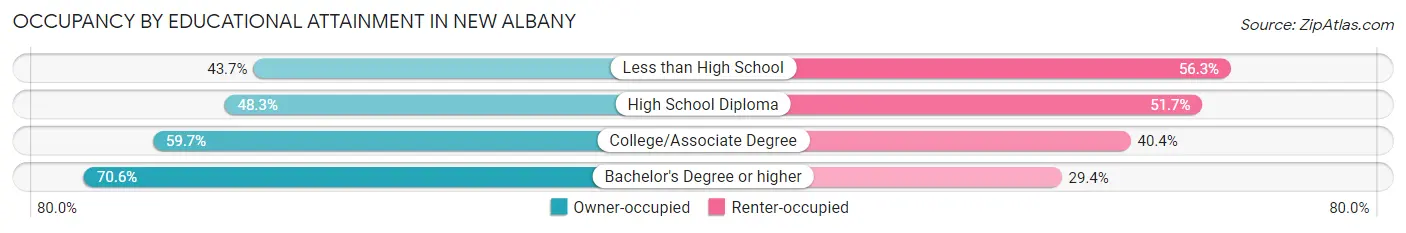
| Household Size | Owner-occupied | Renter-occupied |
| Less than High School | 666 (43.7%) | 857 (56.3%) |
| High School Diploma | 2,492 (48.3%) | 2,670 (51.7%) |
| College/Associate Degree | 3,070 (59.7%) | 2,077 (40.4%) |
| Bachelor's Degree or higher | 2,876 (70.6%) | 1,198 (29.4%) |
Occupancy by Age of Householder in New Albany
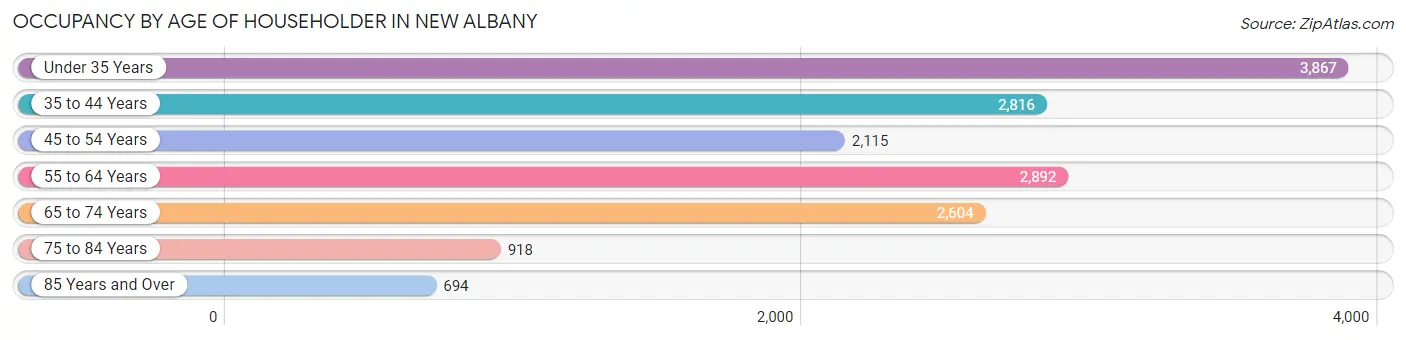
| Age Bracket | # Households | % Households |
| Under 35 Years | 3,867 | 24.3% |
| 35 to 44 Years | 2,816 | 17.7% |
| 45 to 54 Years | 2,115 | 13.3% |
| 55 to 64 Years | 2,892 | 18.2% |
| 65 to 74 Years | 2,604 | 16.4% |
| 75 to 84 Years | 918 | 5.8% |
| 85 Years and Over | 694 | 4.4% |
| Total | 15,906 | 100.0% |
Housing Finances in New Albany
Median Income by Occupancy in New Albany
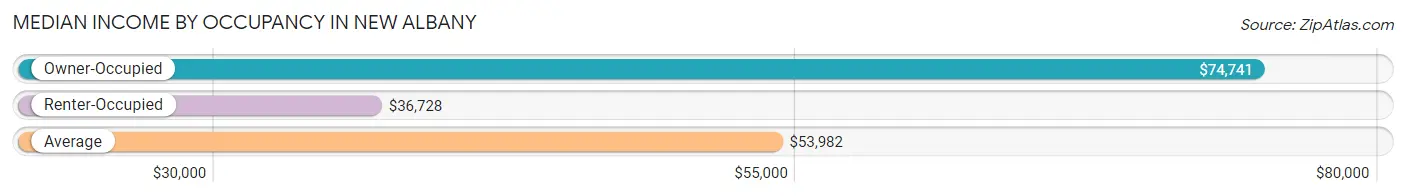
| Occupancy Type | # Households | Median Income |
| Owner-Occupied | 9,104 (57.2%) | $74,741 |
| Renter-Occupied | 6,802 (42.8%) | $36,728 |
| Average | 15,906 (100.0%) | $53,982 |
Occupancy by Householder Income Bracket in New Albany
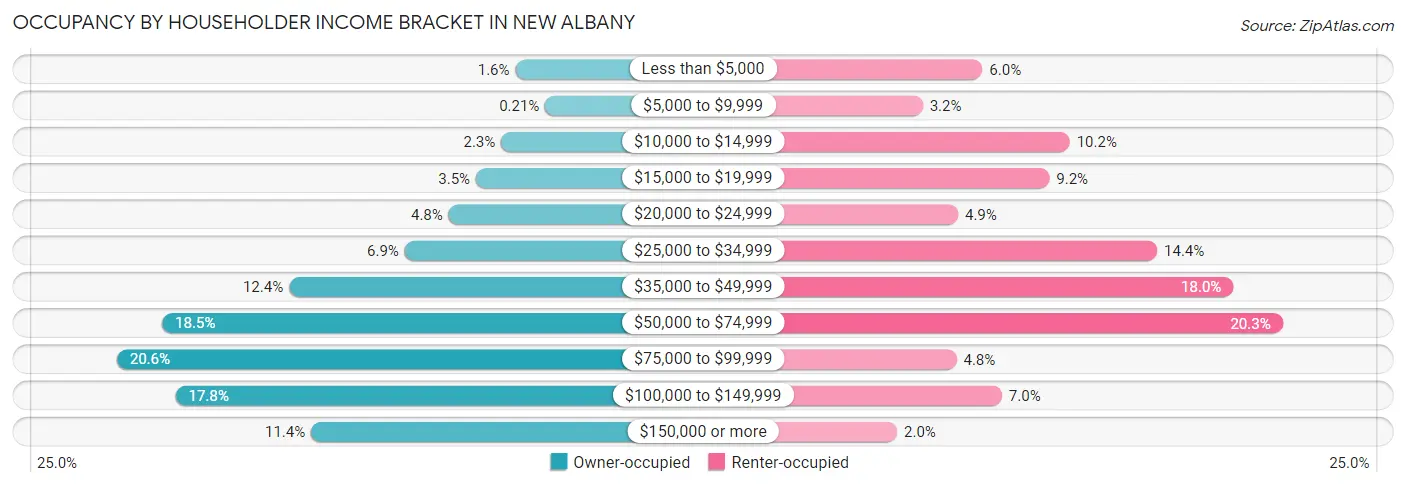
| Income Bracket | Owner-occupied | Renter-occupied |
| Less than $5,000 | 148 (1.6%) | 411 (6.0%) |
| $5,000 to $9,999 | 19 (0.2%) | 218 (3.2%) |
| $10,000 to $14,999 | 210 (2.3%) | 694 (10.2%) |
| $15,000 to $19,999 | 320 (3.5%) | 628 (9.2%) |
| $20,000 to $24,999 | 438 (4.8%) | 332 (4.9%) |
| $25,000 to $34,999 | 628 (6.9%) | 977 (14.4%) |
| $35,000 to $49,999 | 1,130 (12.4%) | 1,223 (18.0%) |
| $50,000 to $74,999 | 1,680 (18.4%) | 1,383 (20.3%) |
| $75,000 to $99,999 | 1,876 (20.6%) | 327 (4.8%) |
| $100,000 to $149,999 | 1,621 (17.8%) | 474 (7.0%) |
| $150,000 or more | 1,034 (11.4%) | 135 (2.0%) |
| Total | 9,104 (100.0%) | 6,802 (100.0%) |
Monthly Housing Cost Tiers in New Albany
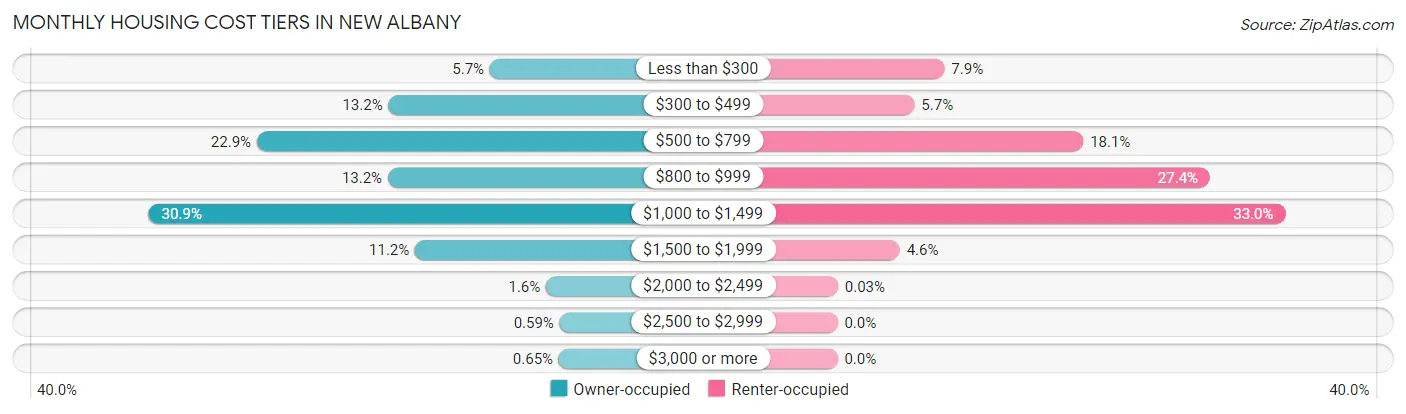
| Monthly Cost | Owner-occupied | Renter-occupied |
| Less than $300 | 522 (5.7%) | 536 (7.9%) |
| $300 to $499 | 1,202 (13.2%) | 386 (5.7%) |
| $500 to $799 | 2,084 (22.9%) | 1,231 (18.1%) |
| $800 to $999 | 1,205 (13.2%) | 1,866 (27.4%) |
| $1,000 to $1,499 | 2,810 (30.9%) | 2,243 (33.0%) |
| $1,500 to $1,999 | 1,023 (11.2%) | 312 (4.6%) |
| $2,000 to $2,499 | 145 (1.6%) | 2 (0.0%) |
| $2,500 to $2,999 | 54 (0.6%) | 0 (0.0%) |
| $3,000 or more | 59 (0.6%) | 0 (0.0%) |
| Total | 9,104 (100.0%) | 6,802 (100.0%) |
Physical Housing Characteristics in New Albany
Housing Structures in New Albany
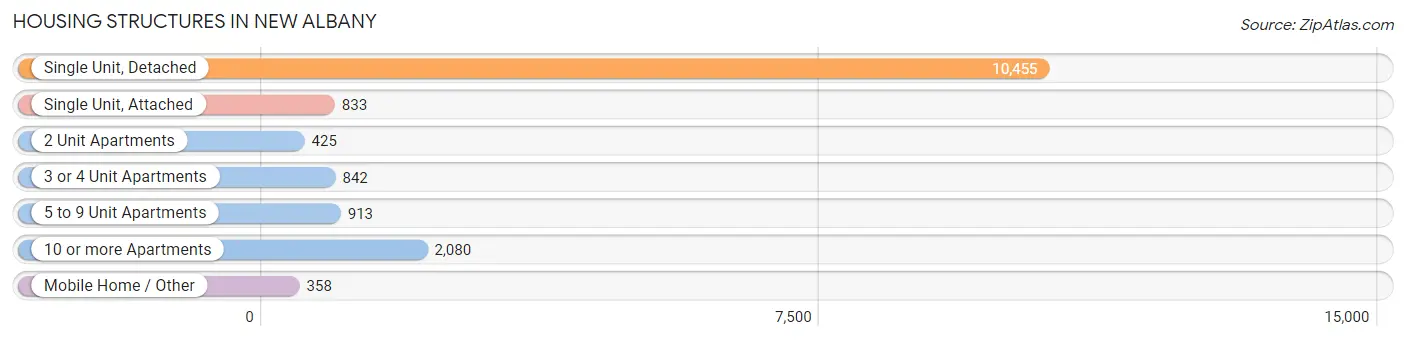
| Structure Type | # Housing Units | % Housing Units |
| Single Unit, Detached | 10,455 | 65.7% |
| Single Unit, Attached | 833 | 5.2% |
| 2 Unit Apartments | 425 | 2.7% |
| 3 or 4 Unit Apartments | 842 | 5.3% |
| 5 to 9 Unit Apartments | 913 | 5.7% |
| 10 or more Apartments | 2,080 | 13.1% |
| Mobile Home / Other | 358 | 2.2% |
| Total | 15,906 | 100.0% |
Housing Structures by Occupancy in New Albany
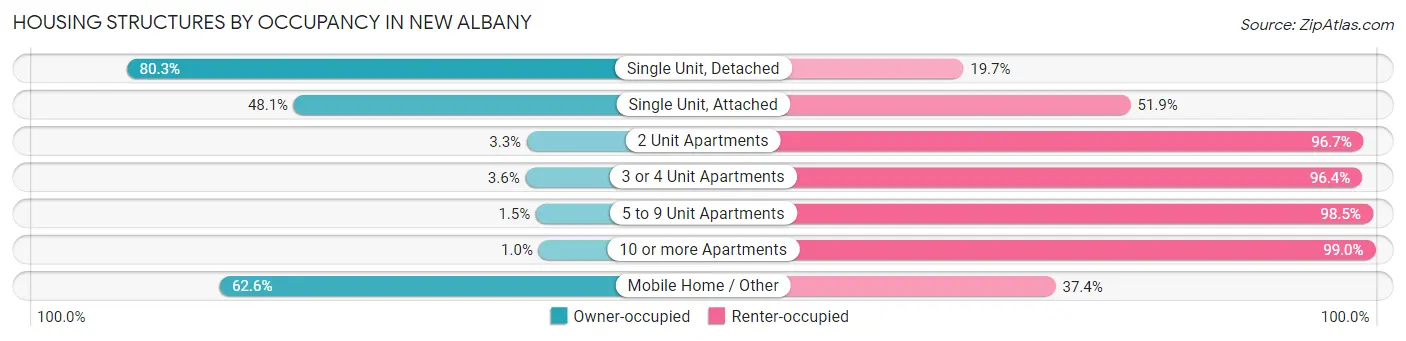
| Structure Type | Owner-occupied | Renter-occupied |
| Single Unit, Detached | 8,400 (80.3%) | 2,055 (19.7%) |
| Single Unit, Attached | 401 (48.1%) | 432 (51.9%) |
| 2 Unit Apartments | 14 (3.3%) | 411 (96.7%) |
| 3 or 4 Unit Apartments | 30 (3.6%) | 812 (96.4%) |
| 5 to 9 Unit Apartments | 14 (1.5%) | 899 (98.5%) |
| 10 or more Apartments | 21 (1.0%) | 2,059 (99.0%) |
| Mobile Home / Other | 224 (62.6%) | 134 (37.4%) |
| Total | 9,104 (57.2%) | 6,802 (42.8%) |
Housing Structures by Number of Rooms in New Albany
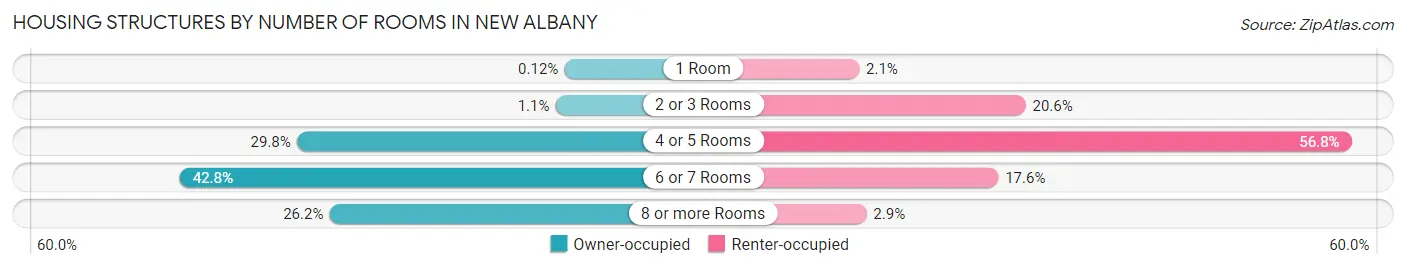
| Number of Rooms | Owner-occupied | Renter-occupied |
| 1 Room | 11 (0.1%) | 145 (2.1%) |
| 2 or 3 Rooms | 100 (1.1%) | 1,401 (20.6%) |
| 4 or 5 Rooms | 2,714 (29.8%) | 3,861 (56.8%) |
| 6 or 7 Rooms | 3,895 (42.8%) | 1,195 (17.6%) |
| 8 or more Rooms | 2,384 (26.2%) | 200 (2.9%) |
| Total | 9,104 (100.0%) | 6,802 (100.0%) |
Housing Structure by Heating Type in New Albany
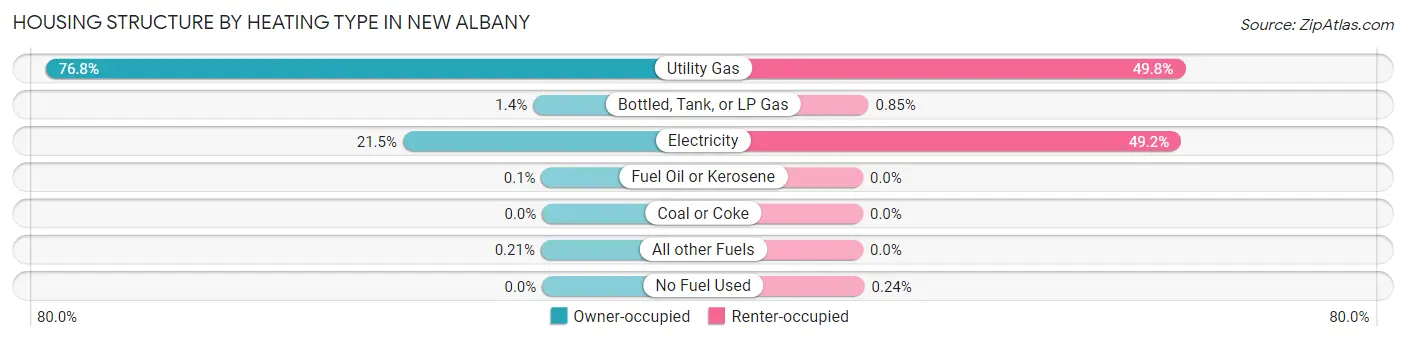
| Heating Type | Owner-occupied | Renter-occupied |
| Utility Gas | 6,988 (76.8%) | 3,385 (49.8%) |
| Bottled, Tank, or LP Gas | 128 (1.4%) | 58 (0.9%) |
| Electricity | 1,960 (21.5%) | 3,343 (49.1%) |
| Fuel Oil or Kerosene | 9 (0.1%) | 0 (0.0%) |
| Coal or Coke | 0 (0.0%) | 0 (0.0%) |
| All other Fuels | 19 (0.2%) | 0 (0.0%) |
| No Fuel Used | 0 (0.0%) | 16 (0.2%) |
| Total | 9,104 (100.0%) | 6,802 (100.0%) |
Household Vehicle Usage in New Albany
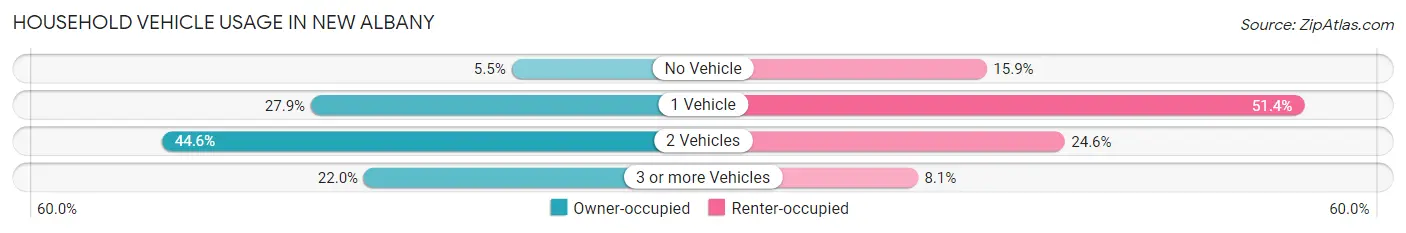
| Vehicles per Household | Owner-occupied | Renter-occupied |
| No Vehicle | 497 (5.5%) | 1,078 (15.9%) |
| 1 Vehicle | 2,543 (27.9%) | 3,499 (51.4%) |
| 2 Vehicles | 4,062 (44.6%) | 1,672 (24.6%) |
| 3 or more Vehicles | 2,002 (22.0%) | 553 (8.1%) |
| Total | 9,104 (100.0%) | 6,802 (100.0%) |
Real Estate & Mortgages in New Albany
Real Estate and Mortgage Overview in New Albany
| Characteristic | Without Mortgage | With Mortgage |
| Housing Units | 3,128 | 5,976 |
| Median Property Value | $150,500 | $163,900 |
| Median Household Income | $51,948 | $619 |
| Monthly Housing Costs | $506 | $42 |
| Real Estate Taxes | $1,264 | $282 |
Property Value by Mortgage Status in New Albany
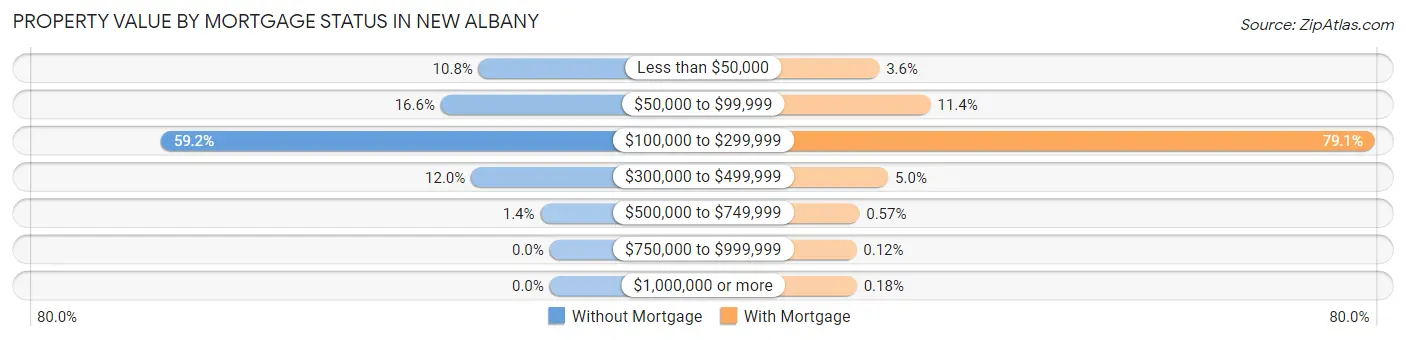
| Property Value | Without Mortgage | With Mortgage |
| Less than $50,000 | 338 (10.8%) | 216 (3.6%) |
| $50,000 to $99,999 | 519 (16.6%) | 683 (11.4%) |
| $100,000 to $299,999 | 1,853 (59.2%) | 4,728 (79.1%) |
| $300,000 to $499,999 | 374 (12.0%) | 297 (5.0%) |
| $500,000 to $749,999 | 44 (1.4%) | 34 (0.6%) |
| $750,000 to $999,999 | 0 (0.0%) | 7 (0.1%) |
| $1,000,000 or more | 0 (0.0%) | 11 (0.2%) |
| Total | 3,128 (100.0%) | 5,976 (100.0%) |
Household Income by Mortgage Status in New Albany
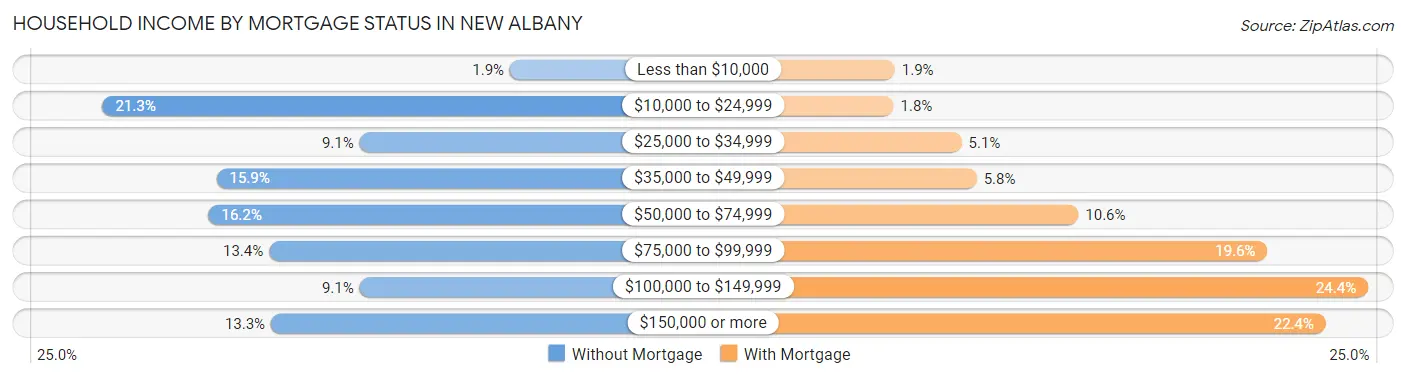
| Household Income | Without Mortgage | With Mortgage |
| Less than $10,000 | 59 (1.9%) | 112 (1.9%) |
| $10,000 to $24,999 | 666 (21.3%) | 108 (1.8%) |
| $25,000 to $34,999 | 283 (9.0%) | 302 (5.1%) |
| $35,000 to $49,999 | 496 (15.9%) | 345 (5.8%) |
| $50,000 to $74,999 | 508 (16.2%) | 634 (10.6%) |
| $75,000 to $99,999 | 418 (13.4%) | 1,172 (19.6%) |
| $100,000 to $149,999 | 283 (9.0%) | 1,458 (24.4%) |
| $150,000 or more | 415 (13.3%) | 1,338 (22.4%) |
| Total | 3,128 (100.0%) | 5,976 (100.0%) |
Property Value to Household Income Ratio in New Albany
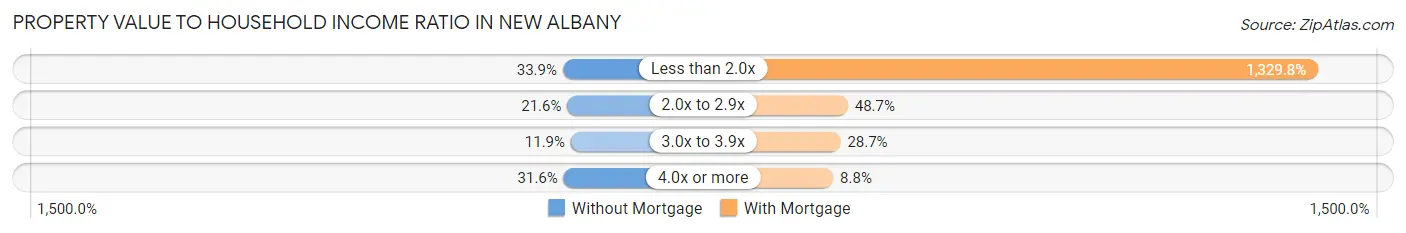
| Value-to-Income Ratio | Without Mortgage | With Mortgage |
| Less than 2.0x | 1,061 (33.9%) | 79,467 (1,329.8%) |
| 2.0x to 2.9x | 677 (21.6%) | 2,908 (48.7%) |
| 3.0x to 3.9x | 373 (11.9%) | 1,714 (28.7%) |
| 4.0x or more | 988 (31.6%) | 528 (8.8%) |
| Total | 3,128 (100.0%) | 5,976 (100.0%) |
Real Estate Taxes by Mortgage Status in New Albany
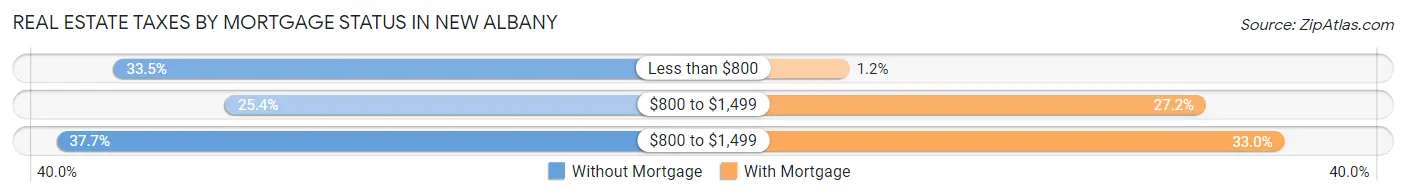
| Property Taxes | Without Mortgage | With Mortgage |
| Less than $800 | 1,048 (33.5%) | 73 (1.2%) |
| $800 to $1,499 | 793 (25.4%) | 1,628 (27.2%) |
| $800 to $1,499 | 1,178 (37.7%) | 1,971 (33.0%) |
| Total | 3,128 (100.0%) | 5,976 (100.0%) |
Health & Disability in New Albany
Health Insurance Coverage by Age in New Albany
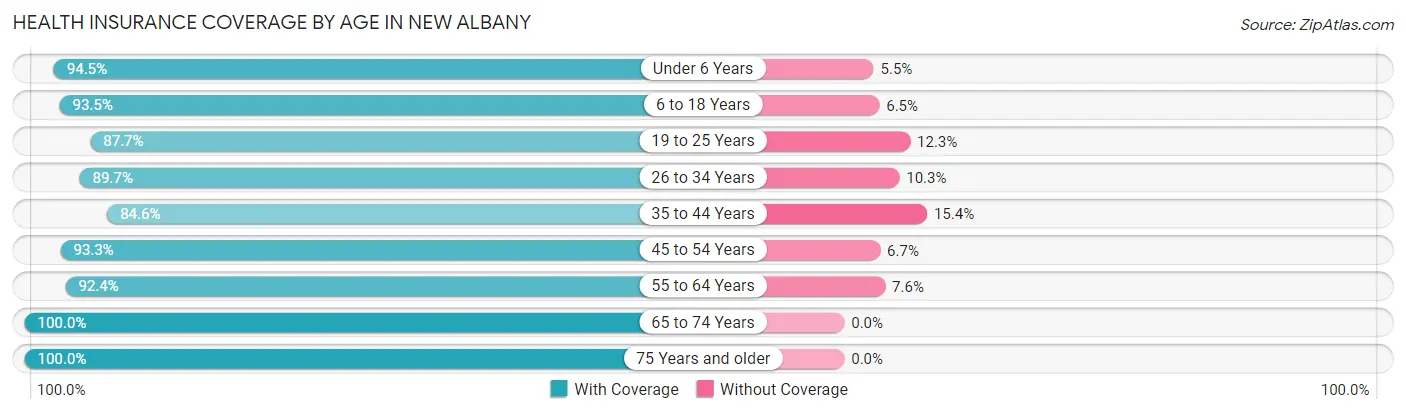
| Age Bracket | With Coverage | Without Coverage |
| Under 6 Years | 2,617 (94.5%) | 151 (5.5%) |
| 6 to 18 Years | 5,213 (93.5%) | 364 (6.5%) |
| 19 to 25 Years | 2,811 (87.7%) | 393 (12.3%) |
| 26 to 34 Years | 5,014 (89.7%) | 573 (10.3%) |
| 35 to 44 Years | 4,125 (84.6%) | 752 (15.4%) |
| 45 to 54 Years | 3,629 (93.3%) | 260 (6.7%) |
| 55 to 64 Years | 4,317 (92.4%) | 356 (7.6%) |
| 65 to 74 Years | 3,901 (100.0%) | 0 (0.0%) |
| 75 Years and older | 2,230 (100.0%) | 0 (0.0%) |
| Total | 33,857 (92.2%) | 2,849 (7.8%) |
Health Insurance Coverage by Citizenship Status in New Albany
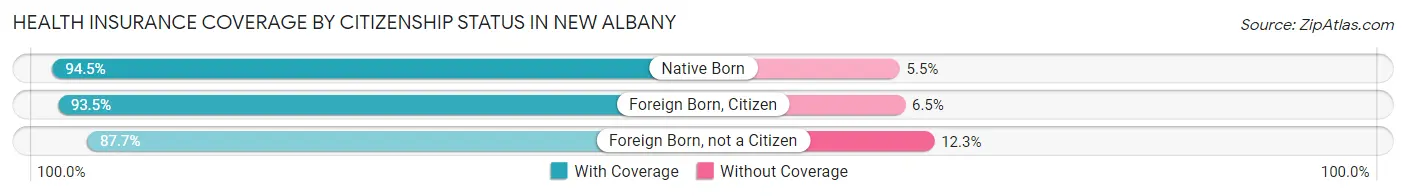
| Citizenship Status | With Coverage | Without Coverage |
| Native Born | 2,617 (94.5%) | 151 (5.5%) |
| Foreign Born, Citizen | 5,213 (93.5%) | 364 (6.5%) |
| Foreign Born, not a Citizen | 2,811 (87.7%) | 393 (12.3%) |
Health Insurance Coverage by Household Income in New Albany
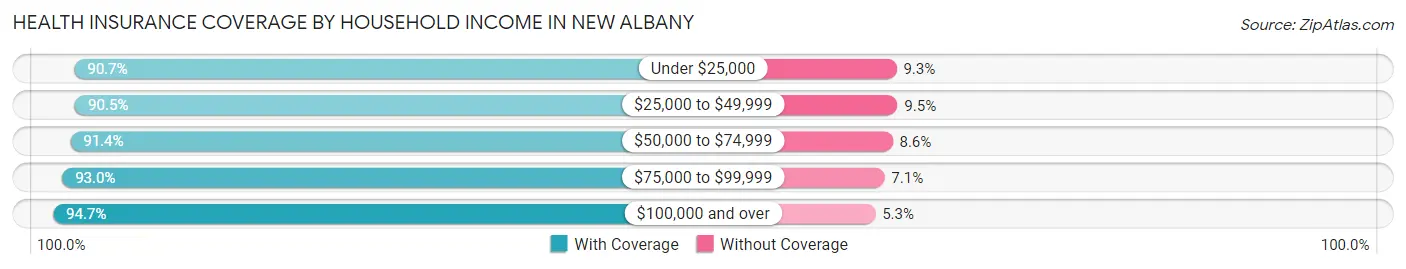
| Household Income | With Coverage | Without Coverage |
| Under $25,000 | 5,818 (90.7%) | 597 (9.3%) |
| $25,000 to $49,999 | 6,408 (90.5%) | 671 (9.5%) |
| $50,000 to $74,999 | 6,604 (91.4%) | 619 (8.6%) |
| $75,000 to $99,999 | 5,732 (92.9%) | 435 (7.0%) |
| $100,000 and over | 8,974 (94.7%) | 505 (5.3%) |
Public vs Private Health Insurance Coverage by Age in New Albany
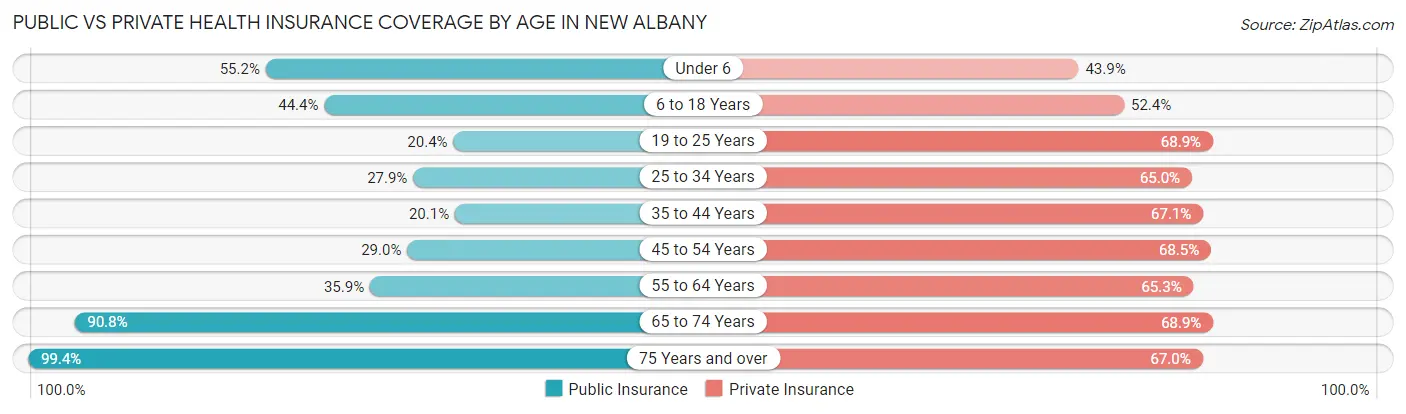
| Age Bracket | Public Insurance | Private Insurance |
| Under 6 | 1,529 (55.2%) | 1,216 (43.9%) |
| 6 to 18 Years | 2,475 (44.4%) | 2,922 (52.4%) |
| 19 to 25 Years | 654 (20.4%) | 2,207 (68.9%) |
| 25 to 34 Years | 1,557 (27.9%) | 3,631 (65.0%) |
| 35 to 44 Years | 981 (20.1%) | 3,271 (67.1%) |
| 45 to 54 Years | 1,127 (29.0%) | 2,665 (68.5%) |
| 55 to 64 Years | 1,677 (35.9%) | 3,050 (65.3%) |
| 65 to 74 Years | 3,541 (90.8%) | 2,689 (68.9%) |
| 75 Years and over | 2,216 (99.4%) | 1,493 (66.9%) |
| Total | 15,757 (42.9%) | 23,144 (63.0%) |
Disability Status by Sex by Age in New Albany
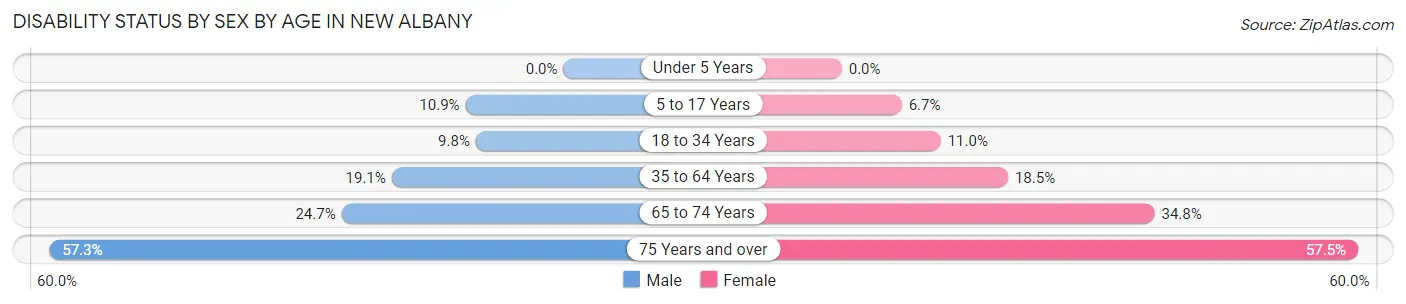
| Age Bracket | Male | Female |
| Under 5 Years | 0 (0.0%) | 0 (0.0%) |
| 5 to 17 Years | 312 (10.9%) | 167 (6.7%) |
| 18 to 34 Years | 453 (9.8%) | 530 (11.0%) |
| 35 to 64 Years | 1,225 (19.1%) | 1,302 (18.5%) |
| 65 to 74 Years | 424 (24.7%) | 761 (34.8%) |
| 75 Years and over | 462 (57.3%) | 818 (57.5%) |
Disability Class by Sex by Age in New Albany
Disability Class: Hearing Difficulty
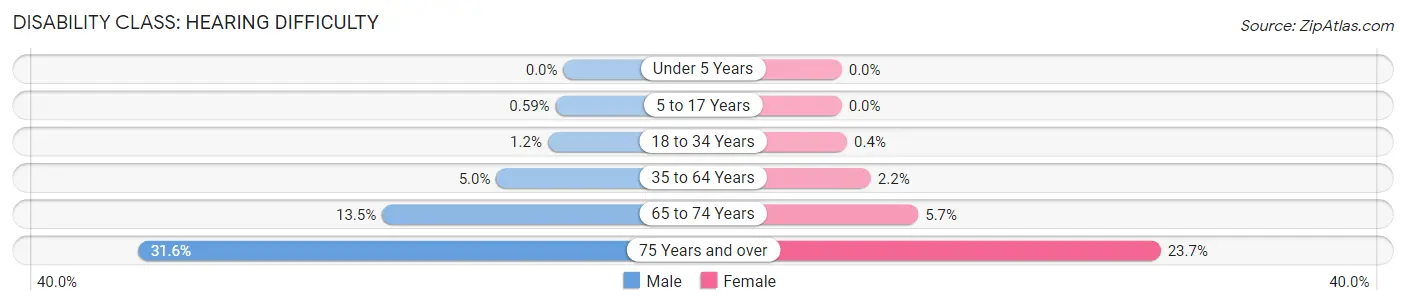
| Age Bracket | Male | Female |
| Under 5 Years | 0 (0.0%) | 0 (0.0%) |
| 5 to 17 Years | 17 (0.6%) | 0 (0.0%) |
| 18 to 34 Years | 54 (1.2%) | 19 (0.4%) |
| 35 to 64 Years | 319 (5.0%) | 152 (2.2%) |
| 65 to 74 Years | 231 (13.5%) | 124 (5.7%) |
| 75 Years and over | 255 (31.6%) | 337 (23.7%) |
Disability Class: Vision Difficulty
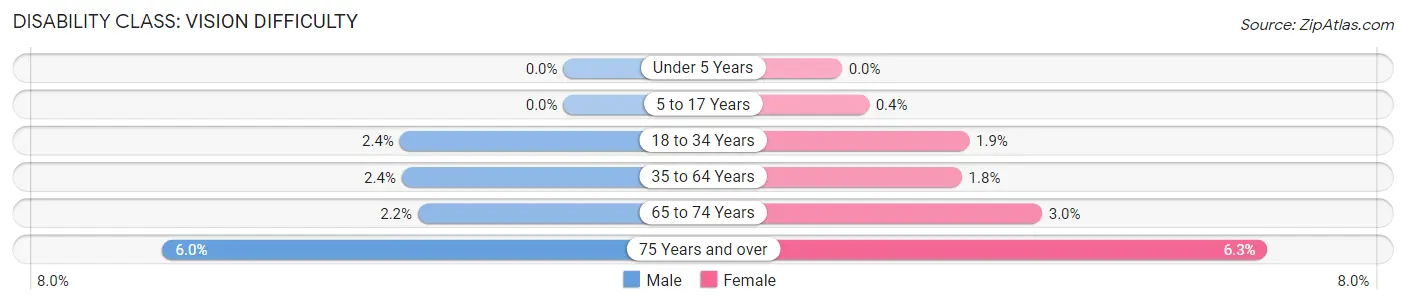
| Age Bracket | Male | Female |
| Under 5 Years | 0 (0.0%) | 0 (0.0%) |
| 5 to 17 Years | 0 (0.0%) | 10 (0.4%) |
| 18 to 34 Years | 113 (2.4%) | 91 (1.9%) |
| 35 to 64 Years | 154 (2.4%) | 125 (1.8%) |
| 65 to 74 Years | 37 (2.2%) | 65 (3.0%) |
| 75 Years and over | 48 (5.9%) | 90 (6.3%) |
Disability Class: Cognitive Difficulty
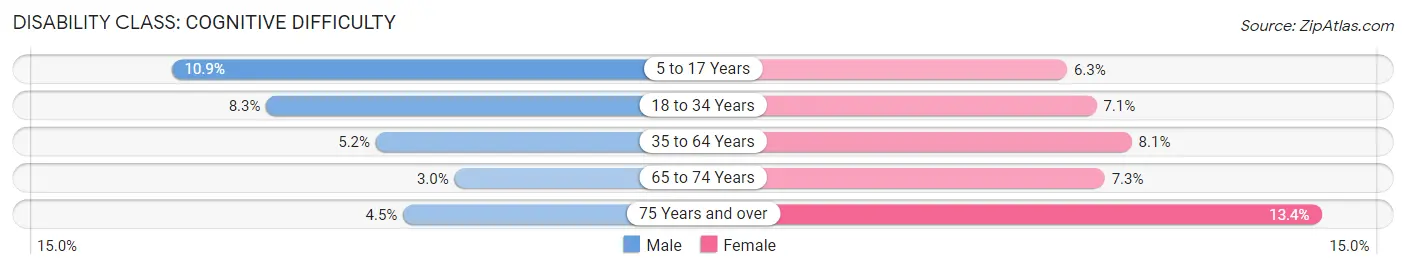
| Age Bracket | Male | Female |
| 5 to 17 Years | 312 (10.9%) | 157 (6.3%) |
| 18 to 34 Years | 384 (8.3%) | 341 (7.1%) |
| 35 to 64 Years | 334 (5.2%) | 568 (8.1%) |
| 65 to 74 Years | 52 (3.0%) | 160 (7.3%) |
| 75 Years and over | 36 (4.5%) | 190 (13.4%) |
Disability Class: Ambulatory Difficulty
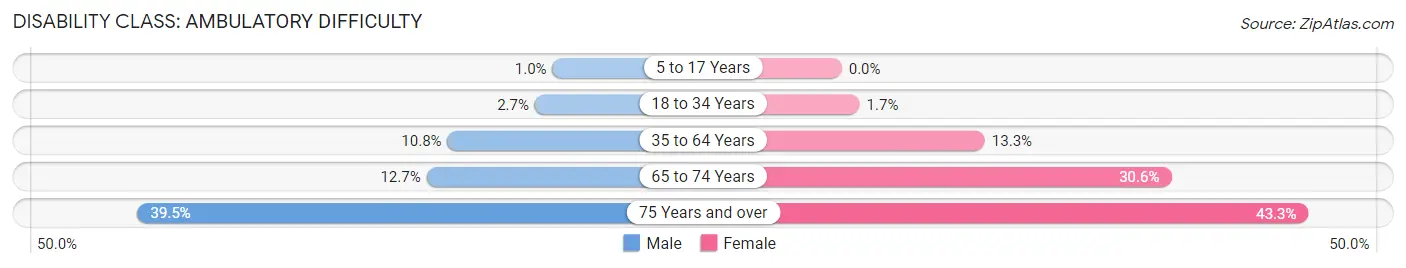
| Age Bracket | Male | Female |
| 5 to 17 Years | 29 (1.0%) | 0 (0.0%) |
| 18 to 34 Years | 123 (2.6%) | 80 (1.7%) |
| 35 to 64 Years | 689 (10.8%) | 934 (13.3%) |
| 65 to 74 Years | 218 (12.7%) | 668 (30.6%) |
| 75 Years and over | 319 (39.5%) | 616 (43.3%) |
Disability Class: Self-Care Difficulty
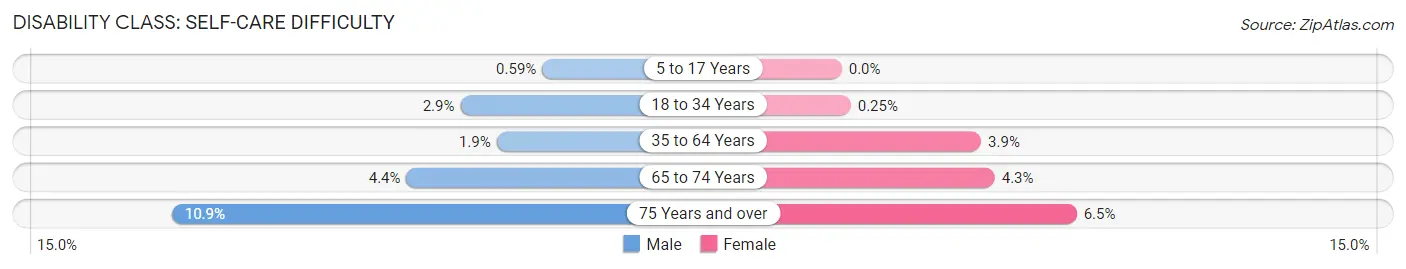
| Age Bracket | Male | Female |
| 5 to 17 Years | 17 (0.6%) | 0 (0.0%) |
| 18 to 34 Years | 133 (2.9%) | 12 (0.3%) |
| 35 to 64 Years | 119 (1.9%) | 273 (3.9%) |
| 65 to 74 Years | 75 (4.4%) | 93 (4.3%) |
| 75 Years and over | 88 (10.9%) | 93 (6.5%) |
Technology Access in New Albany
Computing Device Access in New Albany
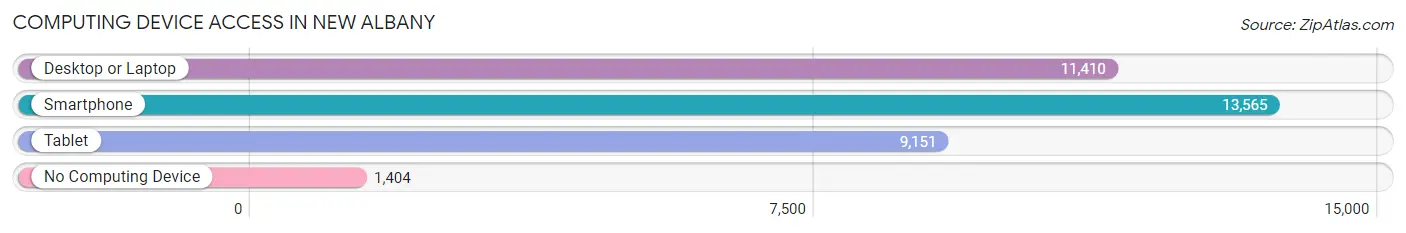
| Device Type | # Households | % Households |
| Desktop or Laptop | 11,410 | 71.7% |
| Smartphone | 13,565 | 85.3% |
| Tablet | 9,151 | 57.5% |
| No Computing Device | 1,404 | 8.8% |
| Total | 15,906 | 100.0% |
Internet Access in New Albany
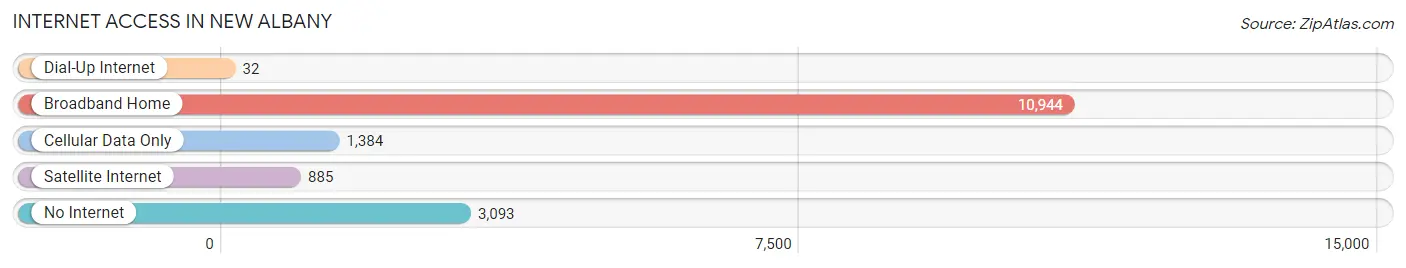
| Internet Type | # Households | % Households |
| Dial-Up Internet | 32 | 0.2% |
| Broadband Home | 10,944 | 68.8% |
| Cellular Data Only | 1,384 | 8.7% |
| Satellite Internet | 885 | 5.6% |
| No Internet | 3,093 | 19.5% |
| Total | 15,906 | 100.0% |
New Albany Summary
New Albany, Indiana is a city located in Floyd County, Indiana, United States. It is situated along the Ohio River, across from Louisville, Kentucky. The city is the county seat of Floyd County and is the most populous city in the county. As of the 2010 census, the city had a population of 36,372.
History
New Albany was founded in 1813 by three brothers from New York, Joel, Abner, and Nathaniel Scribner. The brothers purchased land along the Ohio River and established a settlement that they named after their hometown of New Albany, New York. The city quickly grew and by 1817, it had become the county seat of Floyd County.
In the early 19th century, New Albany was a major shipping port for goods traveling down the Ohio River. The city was also a major center for the production of iron and steel products. In 1864, the city was the site of a major Civil War battle, the Battle of New Albany.
In the late 19th century, New Albany experienced a period of rapid growth and industrialization. The city was home to several large factories, including the New Albany Iron Works, the New Albany Woolen Mills, and the New Albany Carriage Works. The city also became a major center for the production of glass products.
Geography
New Albany is located in Floyd County, Indiana, along the Ohio River. The city is situated at the intersection of Interstate 64 and Interstate 265. The city has a total area of 16.3 square miles, of which 16.2 square miles is land and 0.1 square miles is water.
Economy
New Albany is a major economic center in the region. The city is home to several large employers, including the New Albany-Floyd County School Corporation, the New Albany-Floyd County Public Library, and the New Albany-Floyd County Parks and Recreation Department. The city is also home to several large manufacturing companies, including the New Albany Iron Works, the New Albany Woolen Mills, and the New Albany Carriage Works.
Demographics
As of the 2010 census, the city had a population of 36,372. The racial makeup of the city was 79.2% White, 15.3% African American, 0.3% Native American, 1.2% Asian, 0.1% Pacific Islander, 1.7% from other races, and 2.4% from two or more races. Hispanic or Latino of any race were 4.2% of the population.
The median income for a household in the city was $41,945, and the median income for a family was $50,945. The per capita income for the city was $21,945. About 11.2% of families and 14.2% of the population were below the poverty line, including 20.2% of those under age 18 and 8.2% of those age 65 or over.
Common Questions
What is Per Capita Income in New Albany?
Per Capita income in New Albany is $29,688.
What is the Median Family Income in New Albany?
Median Family Income in New Albany is $70,790.
What is the Median Household income in New Albany?
Median Household Income in New Albany is $53,982.
What is Income or Wage Gap in New Albany?
Income or Wage Gap in New Albany is 23.8%.
Women in New Albany earn 76.2 cents for every dollar earned by a man.
What is Family Income Deficit in New Albany?
Family Income Deficit in New Albany is $12,725.
Families that are below poverty line in New Albany earn $12,725 less on average than the poverty threshold level.
What is Inequality or Gini Index in New Albany?
Inequality or Gini Index in New Albany is 0.41.
What is the Total Population of New Albany?
Total Population of New Albany is 37,598.
What is the Total Male Population of New Albany?
Total Male Population of New Albany is 17,893.
What is the Total Female Population of New Albany?
Total Female Population of New Albany is 19,705.
What is the Ratio of Males per 100 Females in New Albany?
There are 90.80 Males per 100 Females in New Albany.
What is the Ratio of Females per 100 Males in New Albany?
There are 110.13 Females per 100 Males in New Albany.
What is the Median Population Age in New Albany?
Median Population Age in New Albany is 38.0 Years.
What is the Average Family Size in New Albany
Average Family Size in New Albany is 3.1 People.
What is the Average Household Size in New Albany
Average Household Size in New Albany is 2.3 People.
How Large is the Labor Force in New Albany?
There are 18,868 People in the Labor Forcein in New Albany.
What is the Percentage of People in the Labor Force in New Albany?
60.9% of People are in the Labor Force in New Albany.
What is the Unemployment Rate in New Albany?
Unemployment Rate in New Albany is 4.9%.