Hartford, CT Map & Demographics
Hartford Map
Hartford Overview
$25,229
PER CAPITA INCOME
$49,771
AVG FAMILY INCOME
$41,841
AVG HOUSEHOLD INCOME
15.5%
WAGE / INCOME GAP [ % ]
84.5¢/ $1
WAGE / INCOME GAP [ $ ]
$11,248
FAMILY INCOME DEFICIT
0.51
INEQUALITY / GINI INDEX
121,057
TOTAL POPULATION
58,021
MALE POPULATION
63,036
FEMALE POPULATION
92.04
MALES / 100 FEMALES
108.64
FEMALES / 100 MALES
33.1
MEDIAN AGE
3.2
AVG FAMILY SIZE
2.3
AVG HOUSEHOLD SIZE
60,075
LABOR FORCE [ PEOPLE ]
62.5%
PERCENT IN LABOR FORCE
10.6%
UNEMPLOYMENT RATE
Hartford Area Codes
Income in Hartford
Income Overview in Hartford
Per Capita Income in Hartford is $25,229, while median incomes of families and households are $49,771 and $41,841 respectively.
| Characteristic | Number | Measure |
| Per Capita Income | 121,057 | $25,229 |
| Median Family Income | 26,325 | $49,771 |
| Mean Family Income | 26,325 | $71,994 |
| Median Household Income | 48,277 | $41,841 |
| Mean Household Income | 48,277 | $61,201 |
| Income Deficit | 26,325 | $11,248 |
| Wage / Income Gap (%) | 121,057 | 15.52% |
| Wage / Income Gap ($) | 121,057 | 84.48¢ per $1 |
| Gini / Inequality Index | 121,057 | 0.51 |
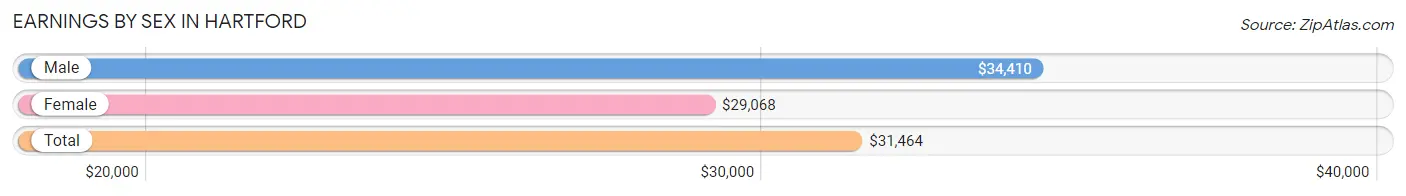
Earnings by Sex in Hartford
Average Earnings in Hartford are $31,464, $34,410 for men and $29,068 for women, a difference of 15.5%.
| Sex | Number | Average Earnings |
| Male | 29,202 (48.0%) | $34,410 |
| Female | 31,571 (51.9%) | $29,068 |
| Total | 60,773 (100.0%) | $31,464 |
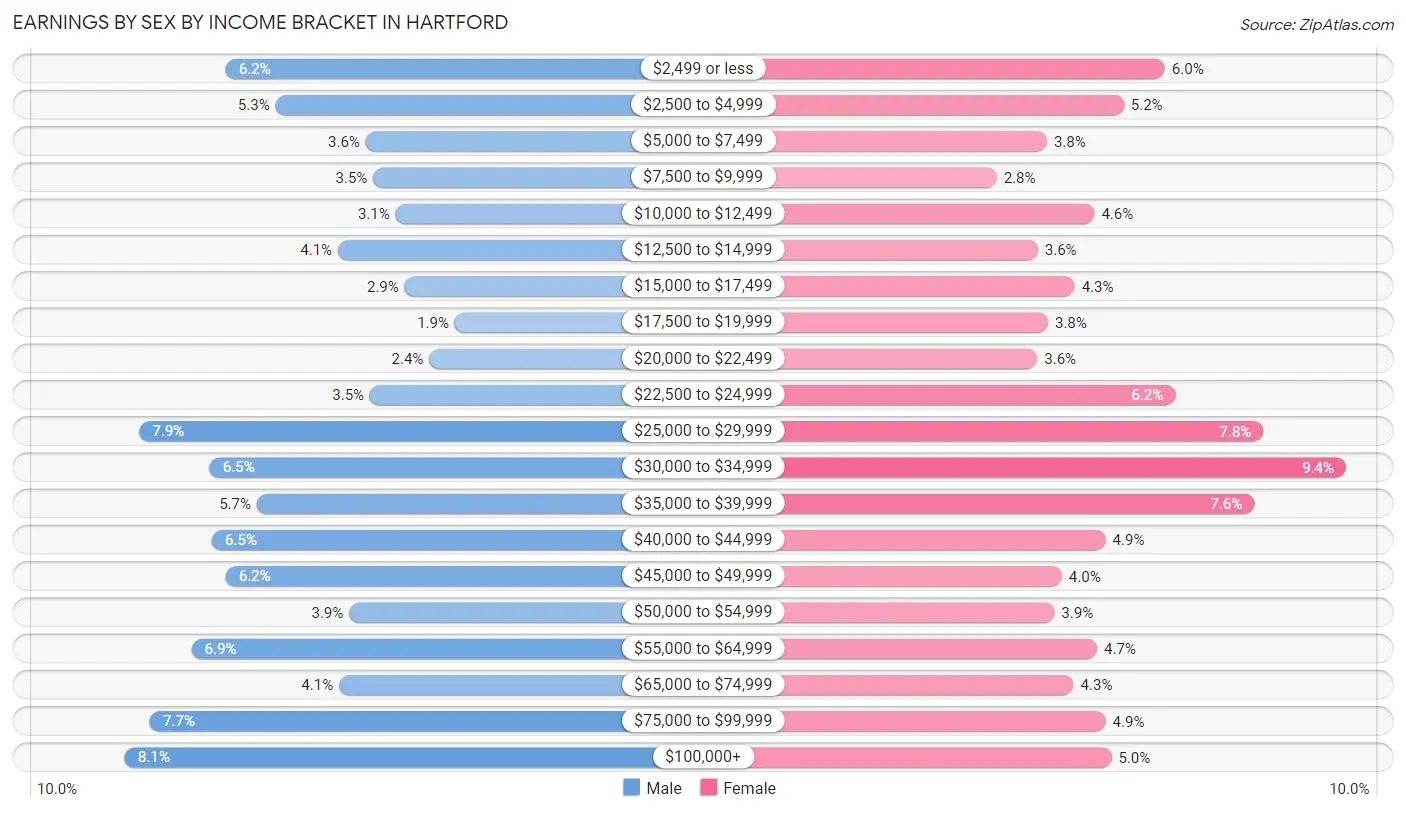
Earnings by Sex by Income Bracket in Hartford
The most common earnings brackets in Hartford are $100,000+ for men (2,372 | 8.1%) and $30,000 to $34,999 for women (2,952 | 9.3%).
| Income | Male | Female |
| $2,499 or less | 1,818 (6.2%) | 1,882 (6.0%) |
| $2,500 to $4,999 | 1,548 (5.3%) | 1,640 (5.2%) |
| $5,000 to $7,499 | 1,054 (3.6%) | 1,185 (3.7%) |
| $7,500 to $9,999 | 1,014 (3.5%) | 888 (2.8%) |
| $10,000 to $12,499 | 891 (3.0%) | 1,464 (4.6%) |
| $12,500 to $14,999 | 1,207 (4.1%) | 1,129 (3.6%) |
| $15,000 to $17,499 | 842 (2.9%) | 1,349 (4.3%) |
| $17,500 to $19,999 | 567 (1.9%) | 1,190 (3.8%) |
| $20,000 to $22,499 | 706 (2.4%) | 1,127 (3.6%) |
| $22,500 to $24,999 | 1,031 (3.5%) | 1,942 (6.1%) |
| $25,000 to $29,999 | 2,293 (7.9%) | 2,462 (7.8%) |
| $30,000 to $34,999 | 1,908 (6.5%) | 2,952 (9.3%) |
| $35,000 to $39,999 | 1,650 (5.7%) | 2,409 (7.6%) |
| $40,000 to $44,999 | 1,895 (6.5%) | 1,531 (4.9%) |
| $45,000 to $49,999 | 1,820 (6.2%) | 1,273 (4.0%) |
| $50,000 to $54,999 | 1,145 (3.9%) | 1,227 (3.9%) |
| $55,000 to $64,999 | 2,007 (6.9%) | 1,482 (4.7%) |
| $65,000 to $74,999 | 1,200 (4.1%) | 1,341 (4.3%) |
| $75,000 to $99,999 | 2,234 (7.6%) | 1,531 (4.9%) |
| $100,000+ | 2,372 (8.1%) | 1,567 (5.0%) |
| Total | 29,202 (100.0%) | 31,571 (100.0%) |
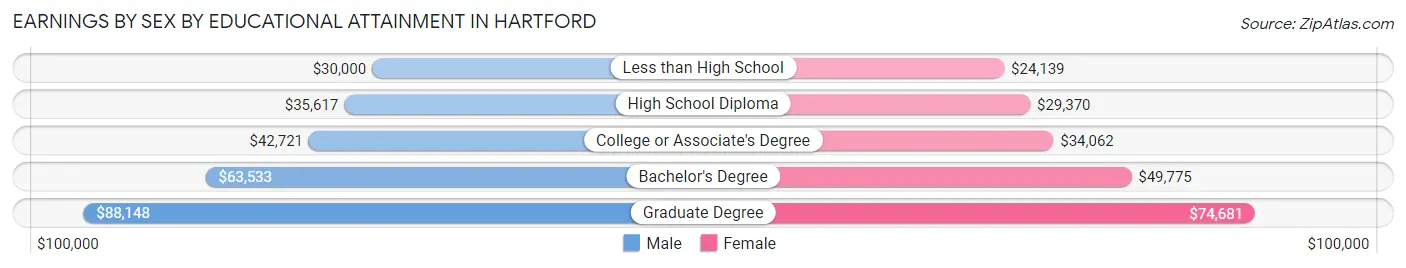
Earnings by Sex by Educational Attainment in Hartford
Average earnings in Hartford are $41,619 for men and $33,231 for women, a difference of 20.2%. Men with an educational attainment of graduate degree enjoy the highest average annual earnings of $88,148, while those with less than high school education earn the least with $30,000. Women with an educational attainment of graduate degree earn the most with the average annual earnings of $74,681, while those with less than high school education have the smallest earnings of $24,139.
| Educational Attainment | Male Income | Female Income |
| Less than High School | $30,000 | $24,139 |
| High School Diploma | $35,617 | $29,370 |
| College or Associate's Degree | $42,721 | $34,062 |
| Bachelor's Degree | $63,533 | $49,775 |
| Graduate Degree | $88,148 | $74,681 |
| Total | $41,619 | $33,231 |
Family Income in Hartford
Family Income Brackets in Hartford
According to the Hartford family income data, there are 4,607 families falling into the $50,000 to $74,999 income range, which is the most common income bracket and makes up 17.5% of all families. Conversely, the $200,000+ income bracket is the least frequent group with only 1,185 families (4.5%) belonging to this category.
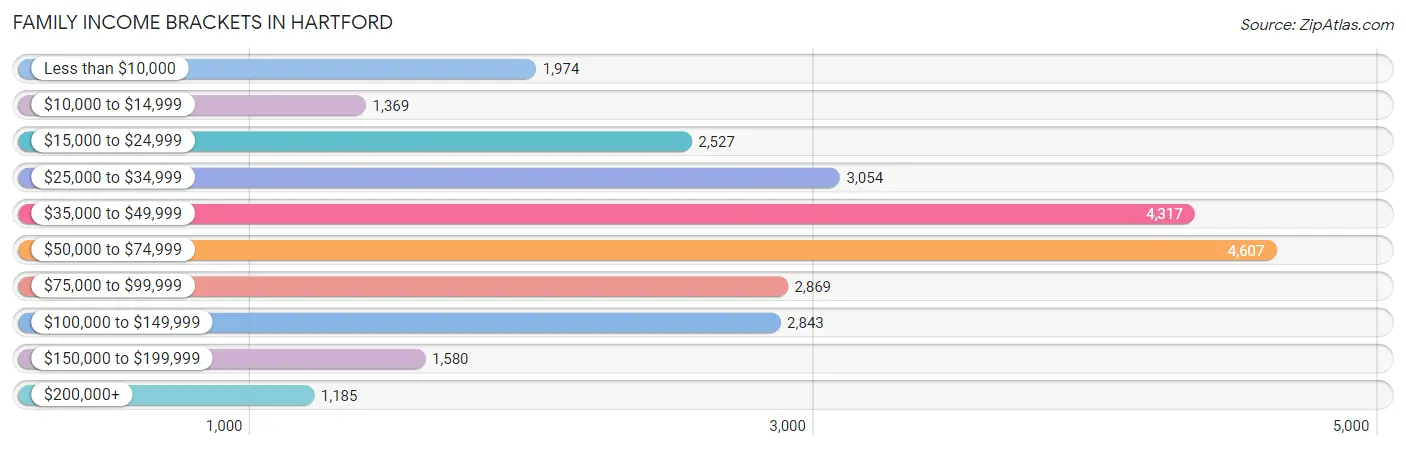
| Income Bracket | # Families | % Families |
| Less than $10,000 | 1,974 | 7.5% |
| $10,000 to $14,999 | 1,369 | 5.2% |
| $15,000 to $24,999 | 2,527 | 9.6% |
| $25,000 to $34,999 | 3,054 | 11.6% |
| $35,000 to $49,999 | 4,317 | 16.4% |
| $50,000 to $74,999 | 4,607 | 17.5% |
| $75,000 to $99,999 | 2,869 | 10.9% |
| $100,000 to $149,999 | 2,843 | 10.8% |
| $150,000 to $199,999 | 1,580 | 6.0% |
| $200,000+ | 1,185 | 4.5% |
Family Income by Famaliy Size in Hartford
5-person families (2,277 | 8.6%) account for the highest median family income in Hartford with $64,531 per family, while 2-person families (10,238 | 38.9%) have the highest median income of $21,286 per family member.
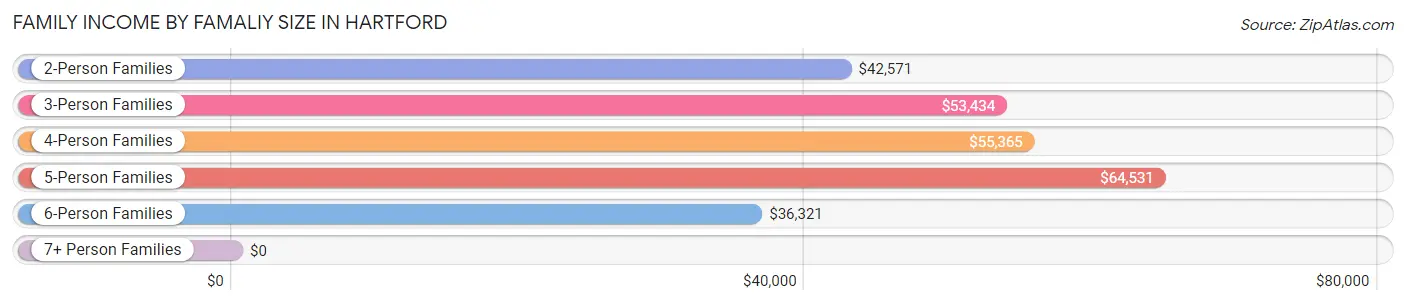
| Income Bracket | # Families | Median Income |
| 2-Person Families | 10,238 (38.9%) | $42,571 |
| 3-Person Families | 7,431 (28.2%) | $53,434 |
| 4-Person Families | 5,376 (20.4%) | $55,365 |
| 5-Person Families | 2,277 (8.6%) | $64,531 |
| 6-Person Families | 653 (2.5%) | $36,321 |
| 7+ Person Families | 350 (1.3%) | $0 |
| Total | 26,325 (100.0%) | $49,771 |
Family Income by Number of Earners in Hartford
The median family income in Hartford is $49,771, with families comprising 3+ earners (3,311) having the highest median family income of $111,771, while families with no earners (3,974) have the lowest median family income of $14,274, accounting for 12.6% and 15.1% of families, respectively.
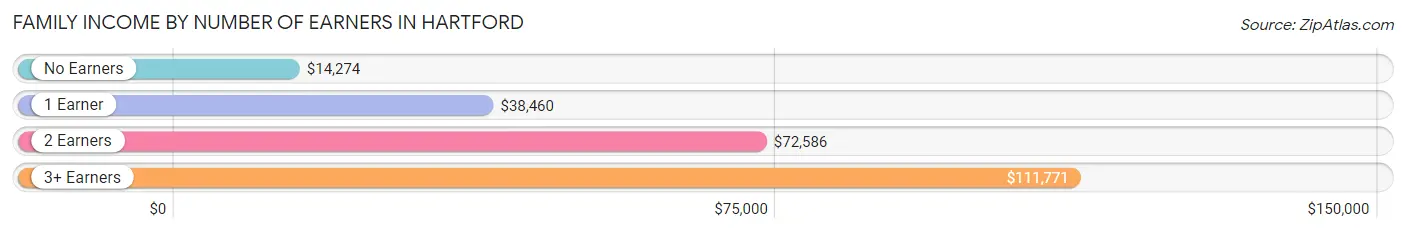
| Number of Earners | # Families | Median Income |
| No Earners | 3,974 (15.1%) | $14,274 |
| 1 Earner | 10,564 (40.1%) | $38,460 |
| 2 Earners | 8,476 (32.2%) | $72,586 |
| 3+ Earners | 3,311 (12.6%) | $111,771 |
| Total | 26,325 (100.0%) | $49,771 |
Household Income in Hartford
Household Income Brackets in Hartford
With 7,628 households falling in the category, the $50,000 to $74,999 income range is the most frequent in Hartford, accounting for 15.8% of all households. In contrast, only 1,738 households (3.6%) fall into the $200,000+ income bracket, making it the least populous group.
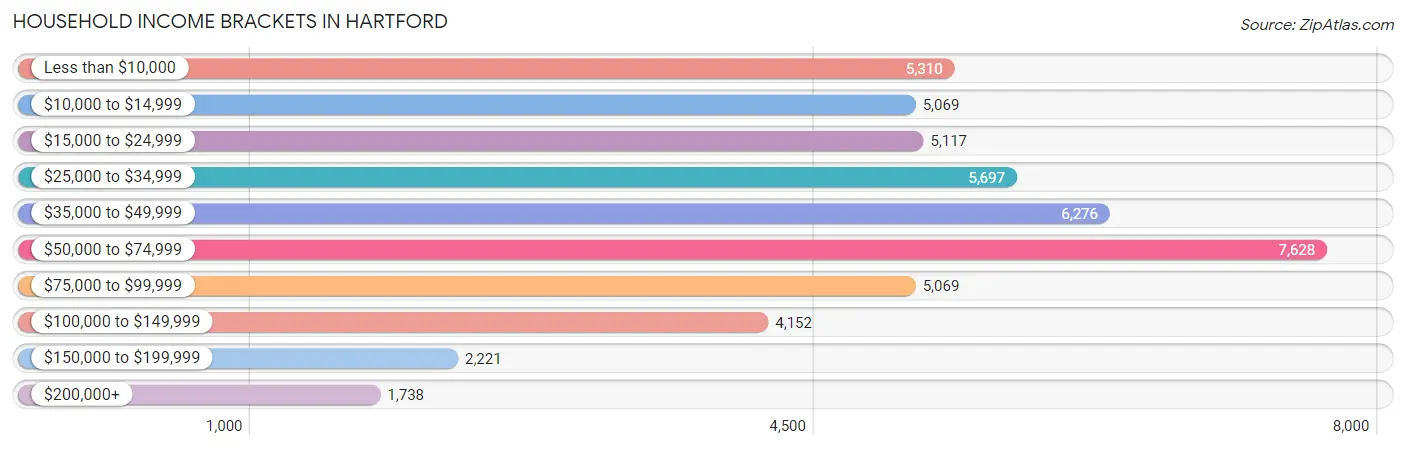
| Income Bracket | # Households | % Households |
| Less than $10,000 | 5,310 | 11.0% |
| $10,000 to $14,999 | 5,069 | 10.5% |
| $15,000 to $24,999 | 5,117 | 10.6% |
| $25,000 to $34,999 | 5,697 | 11.8% |
| $35,000 to $49,999 | 6,276 | 13.0% |
| $50,000 to $74,999 | 7,628 | 15.8% |
| $75,000 to $99,999 | 5,069 | 10.5% |
| $100,000 to $149,999 | 4,152 | 8.6% |
| $150,000 to $199,999 | 2,221 | 4.6% |
| $200,000+ | 1,738 | 3.6% |
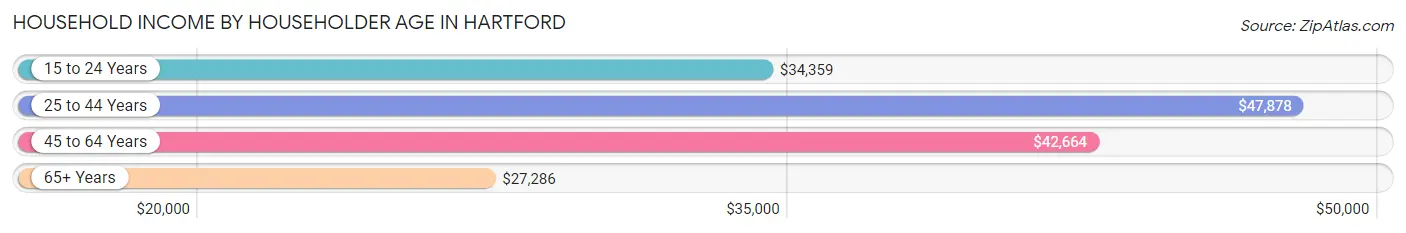
Household Income by Householder Age in Hartford
The median household income in Hartford is $41,841, with the highest median household income of $47,878 found in the 25 to 44 years age bracket for the primary householder. A total of 18,932 households (39.2%) fall into this category. Meanwhile, the 65+ years age bracket for the primary householder has the lowest median household income of $27,286, with 9,643 households (20.0%) in this group.
| Income Bracket | # Households | Median Income |
| 15 to 24 Years | 2,685 (5.6%) | $34,359 |
| 25 to 44 Years | 18,932 (39.2%) | $47,878 |
| 45 to 64 Years | 17,017 (35.2%) | $42,664 |
| 65+ Years | 9,643 (20.0%) | $27,286 |
| Total | 48,277 (100.0%) | $41,841 |
Poverty in Hartford
Income Below Poverty by Sex and Age in Hartford
With 26.3% poverty level for males and 27.4% for females among the residents of Hartford, 15 year old males and 6 to 11 year old females are the most vulnerable to poverty, with 308 males (51.2%) and 1,667 females (38.9%) in their respective age groups living below the poverty level.
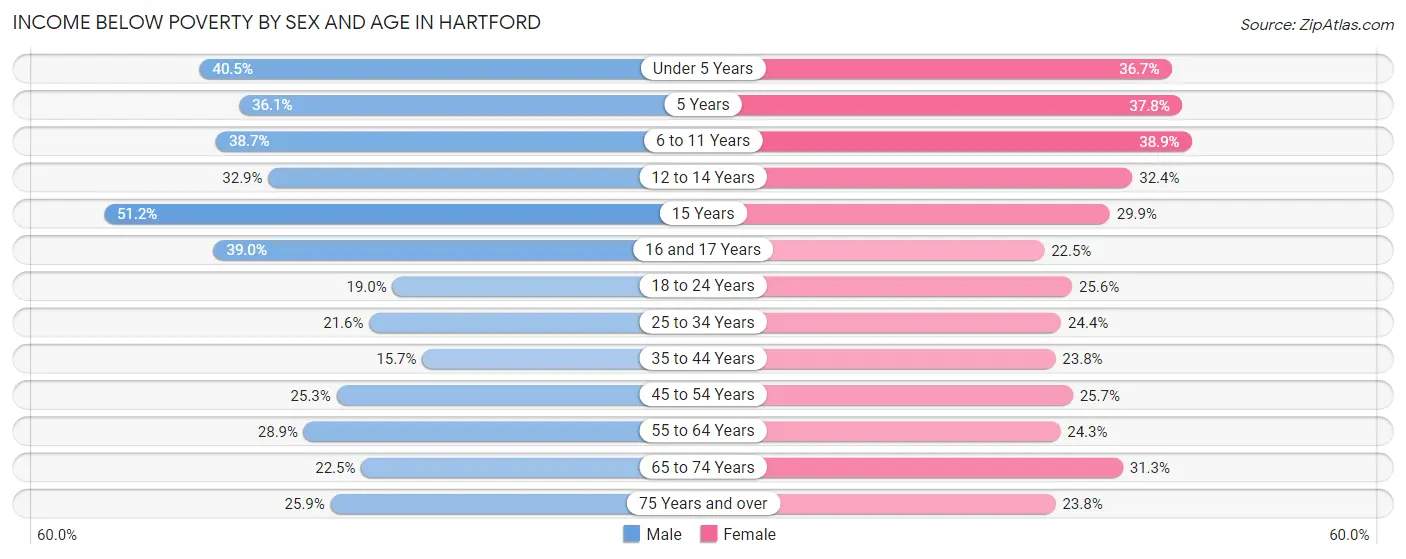
| Age Bracket | Male | Female |
| Under 5 Years | 1,344 (40.5%) | 1,147 (36.7%) |
| 5 Years | 291 (36.1%) | 316 (37.8%) |
| 6 to 11 Years | 2,047 (38.7%) | 1,667 (38.9%) |
| 12 to 14 Years | 819 (32.9%) | 846 (32.4%) |
| 15 Years | 308 (51.2%) | 320 (29.8%) |
| 16 and 17 Years | 548 (39.0%) | 332 (22.5%) |
| 18 to 24 Years | 1,122 (19.0%) | 1,486 (25.6%) |
| 25 to 34 Years | 1,972 (21.6%) | 2,269 (24.4%) |
| 35 to 44 Years | 1,123 (15.7%) | 2,107 (23.8%) |
| 45 to 54 Years | 1,797 (25.3%) | 1,961 (25.7%) |
| 55 to 64 Years | 1,478 (28.9%) | 1,701 (24.3%) |
| 65 to 74 Years | 777 (22.5%) | 1,574 (31.3%) |
| 75 Years and over | 465 (25.9%) | 721 (23.8%) |
| Total | 14,091 (26.3%) | 16,447 (27.4%) |
Income Above Poverty by Sex and Age in Hartford
According to the poverty statistics in Hartford, males aged 35 to 44 years and females aged 16 and 17 years are the age groups that are most secure financially, with 84.3% of males and 77.5% of females in these age groups living above the poverty line.
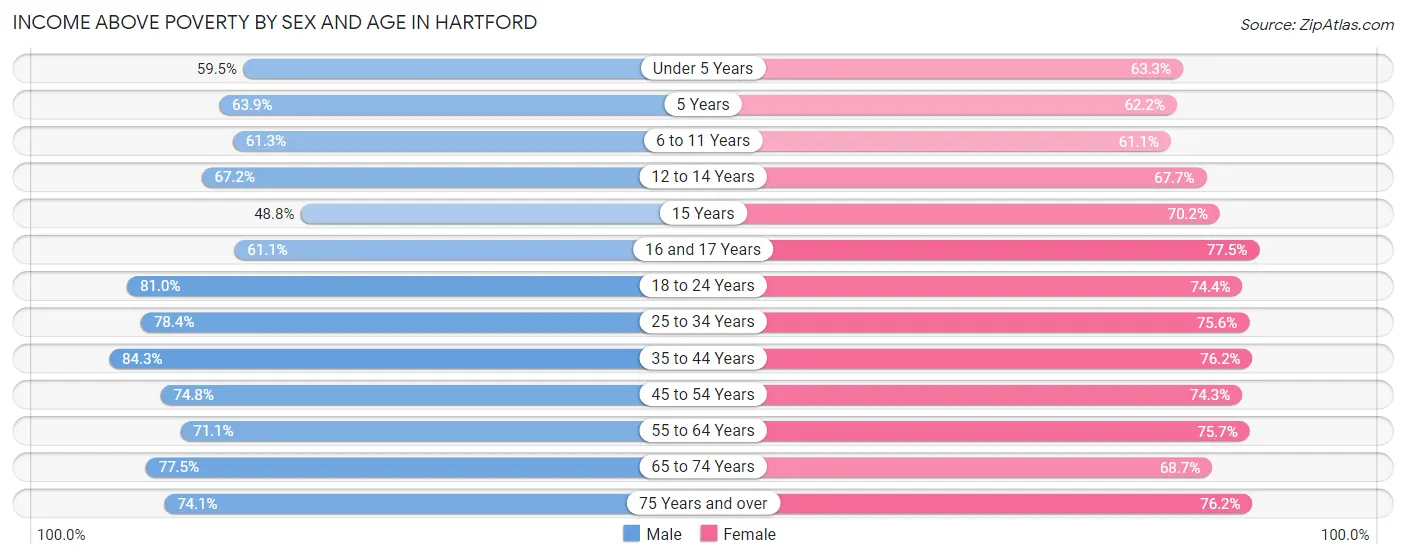
| Age Bracket | Male | Female |
| Under 5 Years | 1,974 (59.5%) | 1,978 (63.3%) |
| 5 Years | 515 (63.9%) | 519 (62.2%) |
| 6 to 11 Years | 3,248 (61.3%) | 2,615 (61.1%) |
| 12 to 14 Years | 1,674 (67.1%) | 1,769 (67.6%) |
| 15 Years | 294 (48.8%) | 752 (70.2%) |
| 16 and 17 Years | 859 (61.1%) | 1,141 (77.5%) |
| 18 to 24 Years | 4,776 (81.0%) | 4,309 (74.4%) |
| 25 to 34 Years | 7,154 (78.4%) | 7,020 (75.6%) |
| 35 to 44 Years | 6,032 (84.3%) | 6,749 (76.2%) |
| 45 to 54 Years | 5,320 (74.8%) | 5,664 (74.3%) |
| 55 to 64 Years | 3,636 (71.1%) | 5,290 (75.7%) |
| 65 to 74 Years | 2,676 (77.5%) | 3,456 (68.7%) |
| 75 Years and over | 1,329 (74.1%) | 2,309 (76.2%) |
| Total | 39,487 (73.7%) | 43,571 (72.6%) |
Income Below Poverty Among Married-Couple Families in Hartford
The poverty statistics for married-couple families in Hartford show that 11.1% or 1,089 of the total 9,846 families live below the poverty line. Families with 5 or more children have the highest poverty rate of 100.0%, comprising of 60 families. On the other hand, families with 1 or 2 children have the lowest poverty rate of 8.8%, which includes 350 families.
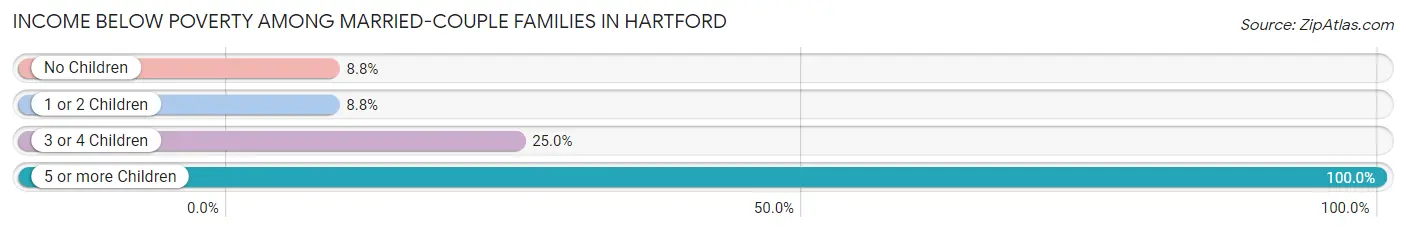
| Children | Above Poverty | Below Poverty |
| No Children | 4,372 (91.2%) | 424 (8.8%) |
| 1 or 2 Children | 3,620 (91.2%) | 350 (8.8%) |
| 3 or 4 Children | 765 (75.0%) | 255 (25.0%) |
| 5 or more Children | 0 (0.0%) | 60 (100.0%) |
| Total | 8,757 (88.9%) | 1,089 (11.1%) |
Income Below Poverty Among Single-Parent Households in Hartford
According to the poverty data in Hartford, 17.7% or 651 single-father households and 31.8% or 4,067 single-mother households are living below the poverty line. Among single-father households, those with 5 or more children have the highest poverty rate, with 4 households (100.0%) experiencing poverty. Likewise, among single-mother households, those with 5 or more children have the highest poverty rate, with 167 households (86.5%) falling below the poverty line.
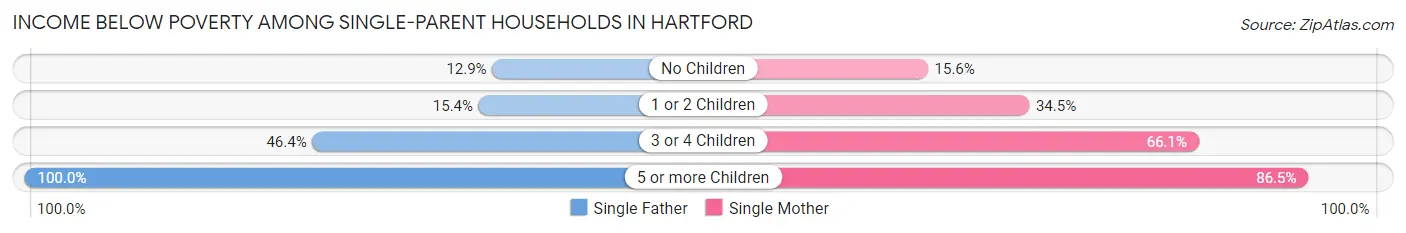
| Children | Single Father | Single Mother |
| No Children | 214 (12.9%) | 721 (15.6%) |
| 1 or 2 Children | 247 (15.4%) | 2,304 (34.5%) |
| 3 or 4 Children | 186 (46.4%) | 875 (66.1%) |
| 5 or more Children | 4 (100.0%) | 167 (86.5%) |
| Total | 651 (17.7%) | 4,067 (31.8%) |
Income Below Poverty Among Married-Couple vs Single-Parent Households in Hartford
The poverty data for Hartford shows that 1,089 of the married-couple family households (11.1%) and 4,718 of the single-parent households (28.6%) are living below the poverty level. Within the married-couple family households, those with 5 or more children have the highest poverty rate, with 60 households (100.0%) falling below the poverty line. Among the single-parent households, those with 5 or more children have the highest poverty rate, with 171 household (86.8%) living below poverty.
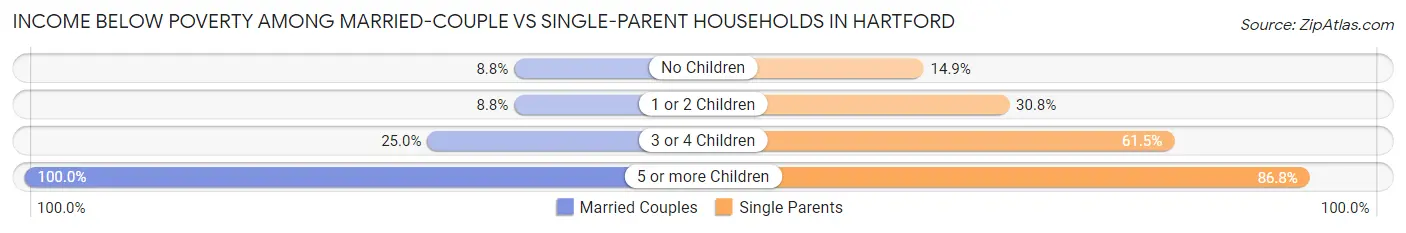
| Children | Married-Couple Families | Single-Parent Households |
| No Children | 424 (8.8%) | 935 (14.9%) |
| 1 or 2 Children | 350 (8.8%) | 2,551 (30.8%) |
| 3 or 4 Children | 255 (25.0%) | 1,061 (61.5%) |
| 5 or more Children | 60 (100.0%) | 171 (86.8%) |
| Total | 1,089 (11.1%) | 4,718 (28.6%) |
Race in Hartford
The most populous races in Hartford are Hispanic or Latino (55,823 | 46.1%), Black / African American (43,747 | 36.1%), and White / Caucasian (33,042 | 27.3%).
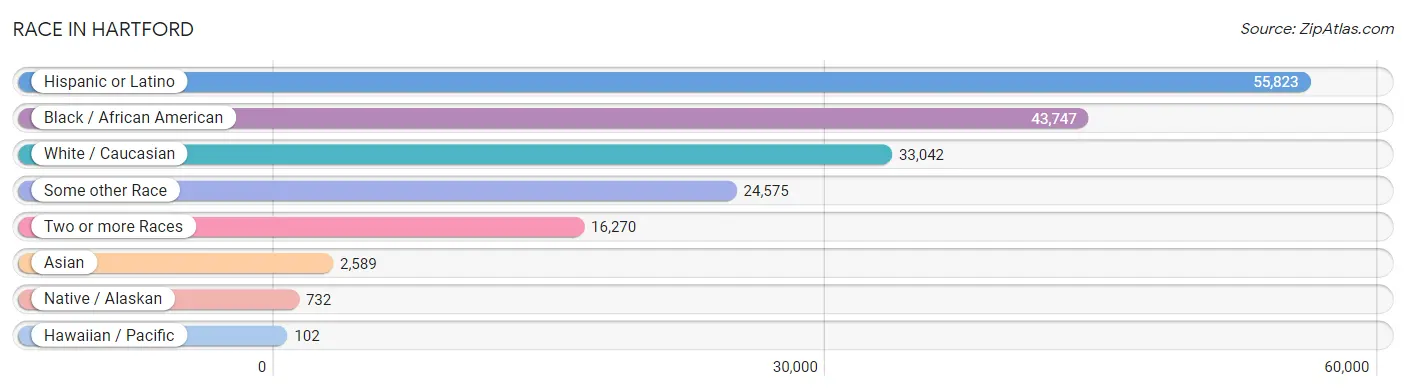
| Race | # Population | % Population |
| Asian | 2,589 | 2.1% |
| Black / African American | 43,747 | 36.1% |
| Hawaiian / Pacific | 102 | 0.1% |
| Hispanic or Latino | 55,823 | 46.1% |
| Native / Alaskan | 732 | 0.6% |
| White / Caucasian | 33,042 | 27.3% |
| Two or more Races | 16,270 | 13.4% |
| Some other Race | 24,575 | 20.3% |
| Total | 121,057 | 100.0% |
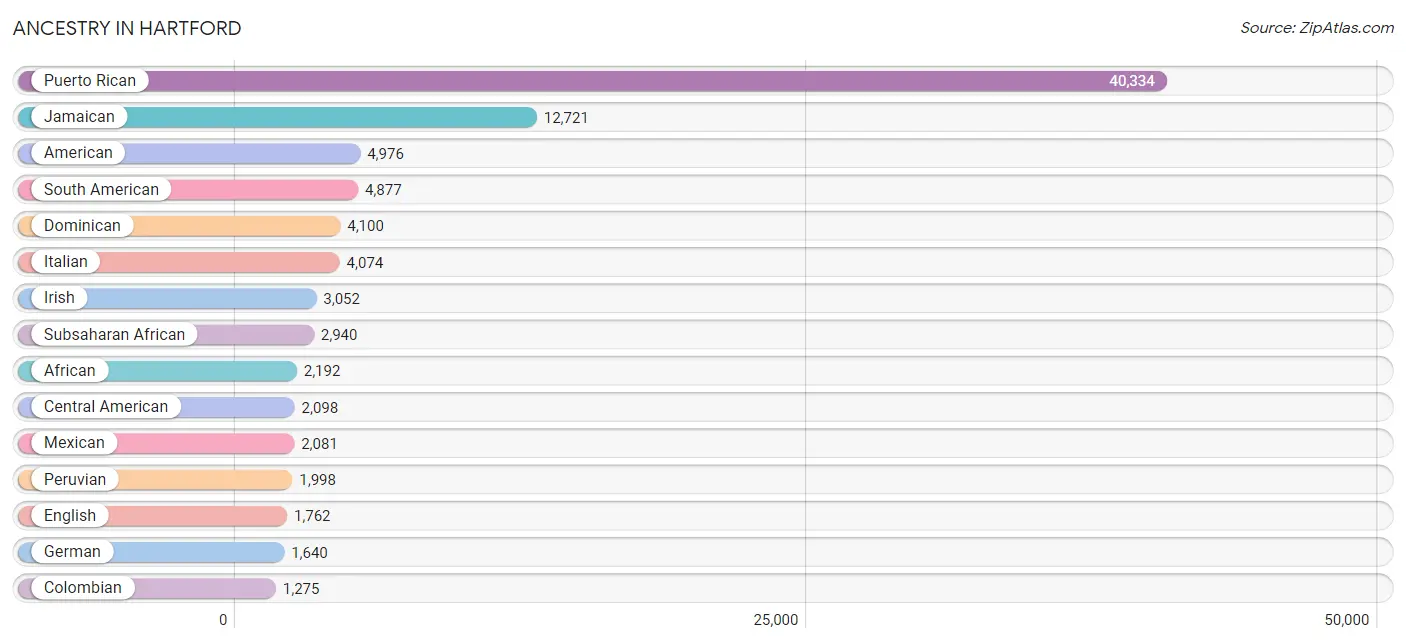
Ancestry in Hartford
The most populous ancestries reported in Hartford are Puerto Rican (40,334 | 33.3%), Jamaican (12,721 | 10.5%), American (4,976 | 4.1%), South American (4,877 | 4.0%), and Dominican (4,100 | 3.4%), together accounting for 55.4% of all Hartford residents.
| Ancestry | # Population | % Population |
| Afghan | 18 | 0.0% |
| African | 2,192 | 1.8% |
| Albanian | 189 | 0.2% |
| American | 4,976 | 4.1% |
| Arab | 279 | 0.2% |
| Argentinean | 99 | 0.1% |
| Armenian | 24 | 0.0% |
| Australian | 1 | 0.0% |
| Austrian | 39 | 0.0% |
| Bahamian | 54 | 0.0% |
| Barbadian | 132 | 0.1% |
| Belgian | 28 | 0.0% |
| Belizean | 13 | 0.0% |
| Bhutanese | 81 | 0.1% |
| Blackfeet | 166 | 0.1% |
| Bolivian | 44 | 0.0% |
| Brazilian | 622 | 0.5% |
| British | 242 | 0.2% |
| British West Indian | 362 | 0.3% |
| Bulgarian | 5 | 0.0% |
| Burmese | 90 | 0.1% |
| Canadian | 94 | 0.1% |
| Cape Verdean | 49 | 0.0% |
| Central American | 2,098 | 1.7% |
| Central American Indian | 654 | 0.5% |
| Cherokee | 234 | 0.2% |
| Chilean | 325 | 0.3% |
| Choctaw | 7 | 0.0% |
| Colombian | 1,275 | 1.1% |
| Costa Rican | 52 | 0.0% |
| Croatian | 11 | 0.0% |
| Cuban | 708 | 0.6% |
| Czech | 9 | 0.0% |
| Danish | 17 | 0.0% |
| Dominican | 4,100 | 3.4% |
| Dutch | 269 | 0.2% |
| Dutch West Indian | 6 | 0.0% |
| Eastern European | 94 | 0.1% |
| Ecuadorian | 471 | 0.4% |
| Egyptian | 12 | 0.0% |
| English | 1,762 | 1.5% |
| Ethiopian | 30 | 0.0% |
| European | 321 | 0.3% |
| Filipino | 57 | 0.1% |
| Finnish | 7 | 0.0% |
| French | 1,035 | 0.9% |
| French American Indian | 4 | 0.0% |
| French Canadian | 631 | 0.5% |
| German | 1,640 | 1.3% |
| Ghanaian | 172 | 0.1% |
| Greek | 142 | 0.1% |
| Guatemalan | 887 | 0.7% |
| Guyanese | 776 | 0.6% |
| Haitian | 301 | 0.3% |
| Honduran | 605 | 0.5% |
| Hungarian | 121 | 0.1% |
| Indian (Asian) | 526 | 0.4% |
| Indonesian | 278 | 0.2% |
| Inupiat | 19 | 0.0% |
| Iranian | 36 | 0.0% |
| Irish | 3,052 | 2.5% |
| Iroquois | 13 | 0.0% |
| Israeli | 39 | 0.0% |
| Italian | 4,074 | 3.4% |
| Jamaican | 12,721 | 10.5% |
| Japanese | 5 | 0.0% |
| Korean | 205 | 0.2% |
| Lebanese | 25 | 0.0% |
| Lithuanian | 171 | 0.1% |
| Macedonian | 1 | 0.0% |
| Malaysian | 62 | 0.1% |
| Mexican | 2,081 | 1.7% |
| Mexican American Indian | 11 | 0.0% |
| Moroccan | 55 | 0.1% |
| Native Hawaiian | 11 | 0.0% |
| Navajo | 3 | 0.0% |
| Nicaraguan | 21 | 0.0% |
| Nigerian | 81 | 0.1% |
| Northern European | 23 | 0.0% |
| Norwegian | 110 | 0.1% |
| Pakistani | 66 | 0.1% |
| Panamanian | 26 | 0.0% |
| Peruvian | 1,998 | 1.7% |
| Polish | 1,189 | 1.0% |
| Portuguese | 975 | 0.8% |
| Puerto Rican | 40,334 | 33.3% |
| Romanian | 196 | 0.2% |
| Russian | 393 | 0.3% |
| Salvadoran | 494 | 0.4% |
| Scandinavian | 16 | 0.0% |
| Scotch-Irish | 53 | 0.0% |
| Scottish | 192 | 0.2% |
| Senegalese | 19 | 0.0% |
| Sioux | 33 | 0.0% |
| Slavic | 7 | 0.0% |
| Slovak | 23 | 0.0% |
| Somali | 215 | 0.2% |
| South African | 17 | 0.0% |
| South American | 4,877 | 4.0% |
| South American Indian | 32 | 0.0% |
| Spaniard | 23 | 0.0% |
| Spanish | 89 | 0.1% |
| Sri Lankan | 337 | 0.3% |
| Subsaharan African | 2,940 | 2.4% |
| Swedish | 156 | 0.1% |
| Swiss | 58 | 0.1% |
| Thai | 1,156 | 0.9% |
| Tongan | 102 | 0.1% |
| Trinidadian and Tobagonian | 162 | 0.1% |
| Turkish | 6 | 0.0% |
| U.S. Virgin Islander | 22 | 0.0% |
| Ukrainian | 264 | 0.2% |
| Uruguayan | 100 | 0.1% |
| Venezuelan | 311 | 0.3% |
| Welsh | 106 | 0.1% |
| West Indian | 355 | 0.3% |
| Yugoslavian | 950 | 0.8% | View All 117 Rows |
Immigrants in Hartford
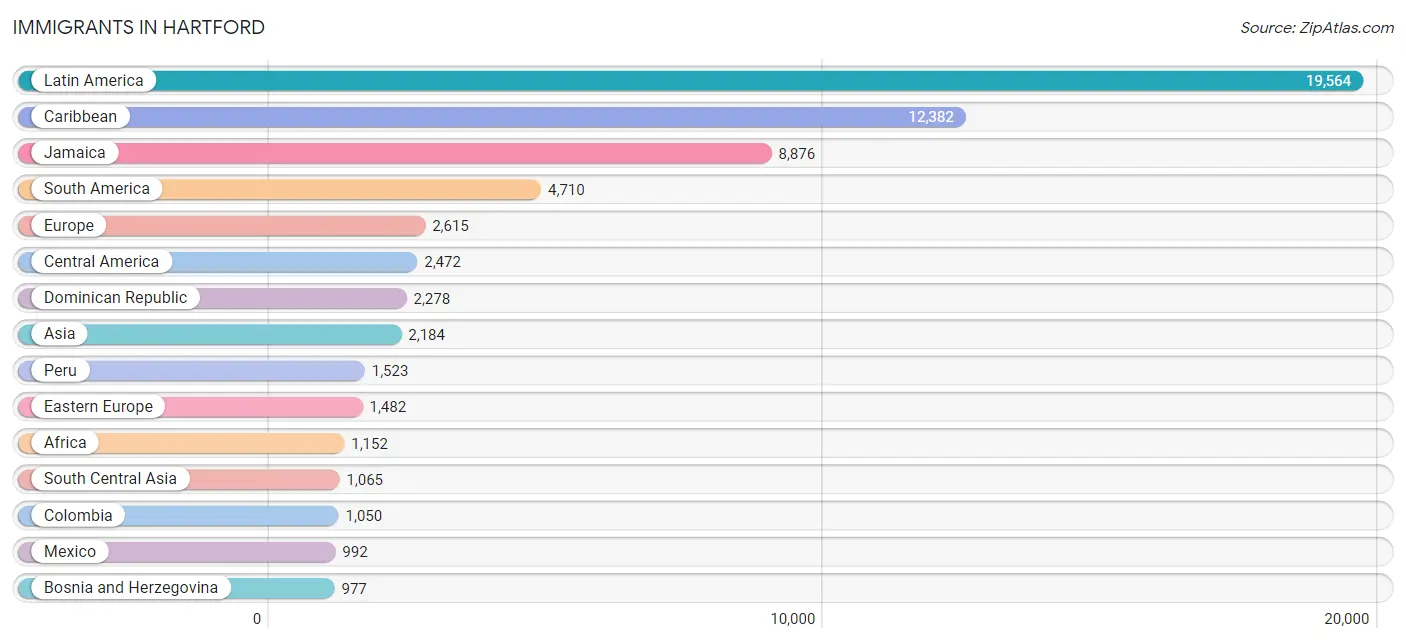
The most numerous immigrant groups reported in Hartford came from Latin America (19,564 | 16.2%), Caribbean (12,382 | 10.2%), Jamaica (8,876 | 7.3%), South America (4,710 | 3.9%), and Europe (2,615 | 2.2%), together accounting for 39.8% of all Hartford residents.
| Immigration Origin | # Population | % Population |
| Afghanistan | 18 | 0.0% |
| Africa | 1,152 | 0.9% |
| Albania | 111 | 0.1% |
| Argentina | 25 | 0.0% |
| Asia | 2,184 | 1.8% |
| Austria | 12 | 0.0% |
| Bahamas | 110 | 0.1% |
| Barbados | 116 | 0.1% |
| Belgium | 26 | 0.0% |
| Belize | 28 | 0.0% |
| Bolivia | 31 | 0.0% |
| Bosnia and Herzegovina | 977 | 0.8% |
| Brazil | 551 | 0.5% |
| Cabo Verde | 10 | 0.0% |
| Cambodia | 4 | 0.0% |
| Cameroon | 56 | 0.1% |
| Canada | 202 | 0.2% |
| Caribbean | 12,382 | 10.2% |
| Central America | 2,472 | 2.0% |
| Chile | 118 | 0.1% |
| China | 268 | 0.2% |
| Colombia | 1,050 | 0.9% |
| Cuba | 321 | 0.3% |
| Dominica | 30 | 0.0% |
| Dominican Republic | 2,278 | 1.9% |
| Eastern Africa | 220 | 0.2% |
| Eastern Asia | 316 | 0.3% |
| Eastern Europe | 1,482 | 1.2% |
| Ecuador | 180 | 0.2% |
| Egypt | 8 | 0.0% |
| El Salvador | 301 | 0.3% |
| England | 155 | 0.1% |
| Europe | 2,615 | 2.2% |
| France | 15 | 0.0% |
| Germany | 102 | 0.1% |
| Ghana | 205 | 0.2% |
| Greece | 92 | 0.1% |
| Guatemala | 728 | 0.6% |
| Guyana | 830 | 0.7% |
| Haiti | 137 | 0.1% |
| Honduras | 402 | 0.3% |
| India | 888 | 0.7% |
| Iran | 20 | 0.0% |
| Iraq | 26 | 0.0% |
| Ireland | 49 | 0.0% |
| Israel | 4 | 0.0% |
| Italy | 248 | 0.2% |
| Jamaica | 8,876 | 7.3% |
| Japan | 11 | 0.0% |
| Kenya | 17 | 0.0% |
| Korea | 37 | 0.0% |
| Kuwait | 128 | 0.1% |
| Laos | 48 | 0.0% |
| Latin America | 19,564 | 16.2% |
| Malaysia | 72 | 0.1% |
| Mexico | 992 | 0.8% |
| Middle Africa | 105 | 0.1% |
| Moldova | 64 | 0.1% |
| Morocco | 25 | 0.0% |
| Nepal | 23 | 0.0% |
| Nicaragua | 21 | 0.0% |
| Nigeria | 27 | 0.0% |
| Northern Africa | 137 | 0.1% |
| Northern Europe | 292 | 0.2% |
| Pakistan | 56 | 0.1% |
| Peru | 1,523 | 1.3% |
| Philippines | 152 | 0.1% |
| Poland | 149 | 0.1% |
| Portugal | 346 | 0.3% |
| Romania | 17 | 0.0% |
| Russia | 65 | 0.1% |
| Somalia | 52 | 0.0% |
| South America | 4,710 | 3.9% |
| South Central Asia | 1,065 | 0.9% |
| South Eastern Asia | 642 | 0.5% |
| Southern Europe | 686 | 0.6% |
| Sri Lanka | 38 | 0.0% |
| Sudan | 104 | 0.1% |
| Taiwan | 58 | 0.1% |
| Thailand | 98 | 0.1% |
| Trinidad and Tobago | 208 | 0.2% |
| Turkey | 3 | 0.0% |
| Ukraine | 92 | 0.1% |
| Uruguay | 83 | 0.1% |
| Venezuela | 283 | 0.2% |
| Vietnam | 114 | 0.1% |
| West Indies | 39 | 0.0% |
| Western Africa | 564 | 0.5% |
| Western Asia | 161 | 0.1% |
| Western Europe | 155 | 0.1% |
| Zaire | 38 | 0.0% | View All 91 Rows |
Sex and Age in Hartford
Sex and Age in Hartford
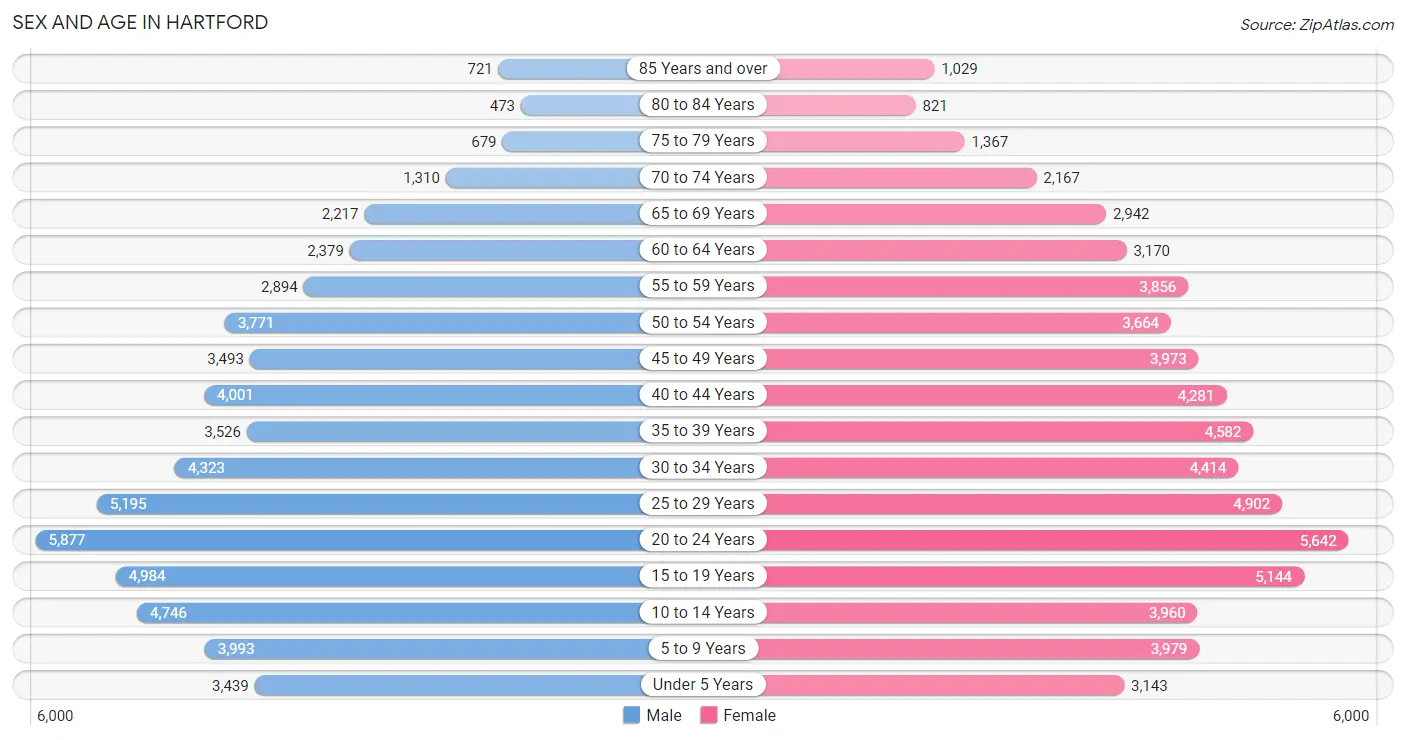
The most populous age groups in Hartford are 20 to 24 Years (5,877 | 10.1%) for men and 20 to 24 Years (5,642 | 8.9%) for women.
| Age Bracket | Male | Female |
| Under 5 Years | 3,439 (5.9%) | 3,143 (5.0%) |
| 5 to 9 Years | 3,993 (6.9%) | 3,979 (6.3%) |
| 10 to 14 Years | 4,746 (8.2%) | 3,960 (6.3%) |
| 15 to 19 Years | 4,984 (8.6%) | 5,144 (8.2%) |
| 20 to 24 Years | 5,877 (10.1%) | 5,642 (8.9%) |
| 25 to 29 Years | 5,195 (8.9%) | 4,902 (7.8%) |
| 30 to 34 Years | 4,323 (7.4%) | 4,414 (7.0%) |
| 35 to 39 Years | 3,526 (6.1%) | 4,582 (7.3%) |
| 40 to 44 Years | 4,001 (6.9%) | 4,281 (6.8%) |
| 45 to 49 Years | 3,493 (6.0%) | 3,973 (6.3%) |
| 50 to 54 Years | 3,771 (6.5%) | 3,664 (5.8%) |
| 55 to 59 Years | 2,894 (5.0%) | 3,856 (6.1%) |
| 60 to 64 Years | 2,379 (4.1%) | 3,170 (5.0%) |
| 65 to 69 Years | 2,217 (3.8%) | 2,942 (4.7%) |
| 70 to 74 Years | 1,310 (2.3%) | 2,167 (3.4%) |
| 75 to 79 Years | 679 (1.2%) | 1,367 (2.2%) |
| 80 to 84 Years | 473 (0.8%) | 821 (1.3%) |
| 85 Years and over | 721 (1.2%) | 1,029 (1.6%) |
| Total | 58,021 (100.0%) | 63,036 (100.0%) |
Families and Households in Hartford
Median Family Size in Hartford
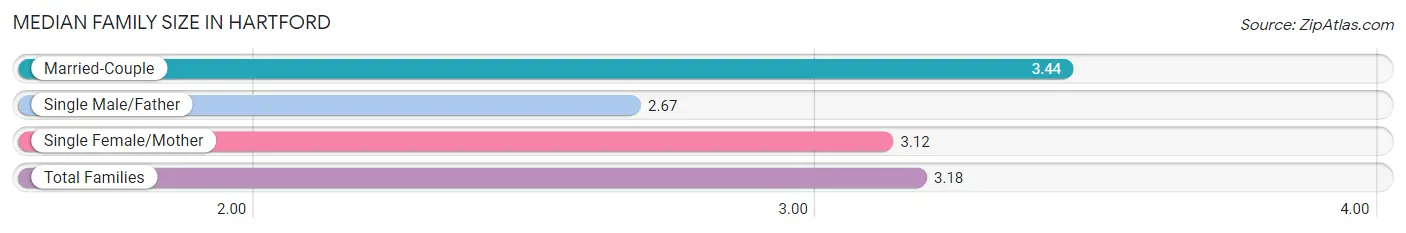
The median family size in Hartford is 3.18 persons per family, with married-couple families (9,846 | 37.4%) accounting for the largest median family size of 3.44 persons per family. On the other hand, single male/father families (3,674 | 14.0%) represent the smallest median family size with 2.67 persons per family.
| Family Type | # Families | Family Size |
| Married-Couple | 9,846 (37.4%) | 3.44 |
| Single Male/Father | 3,674 (14.0%) | 2.67 |
| Single Female/Mother | 12,805 (48.6%) | 3.12 |
| Total Families | 26,325 (100.0%) | 3.18 |
Median Household Size in Hartford
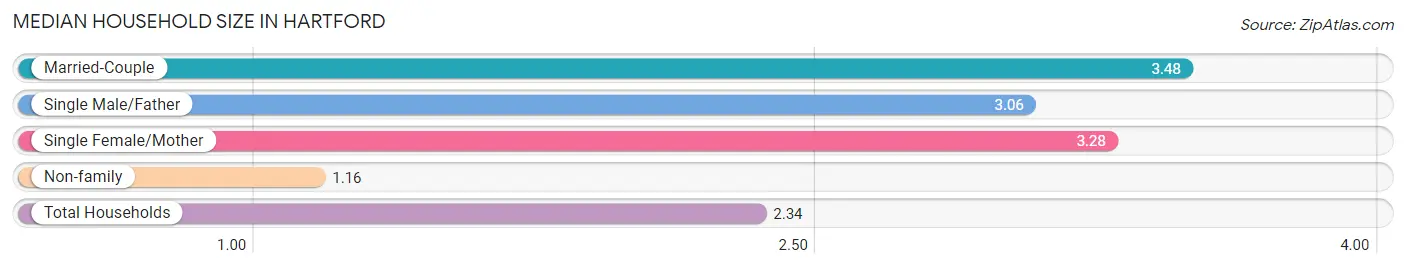
The median household size in Hartford is 2.34 persons per household, with married-couple households (9,846 | 20.4%) accounting for the largest median household size of 3.48 persons per household. non-family households (21,952 | 45.5%) represent the smallest median household size with 1.16 persons per household.
| Household Type | # Households | Household Size |
| Married-Couple | 9,846 (20.4%) | 3.48 |
| Single Male/Father | 3,674 (7.6%) | 3.06 |
| Single Female/Mother | 12,805 (26.5%) | 3.28 |
| Non-family | 21,952 (45.5%) | 1.16 |
| Total Households | 48,277 (100.0%) | 2.34 |
Household Size by Marriage Status in Hartford
Out of a total of 48,277 households in Hartford, 26,325 (54.5%) are family households, while 21,952 (45.5%) are nonfamily households. The most numerous type of family households are 2-person households, comprising 9,054, and the most common type of nonfamily households are 1-person households, comprising 19,164.
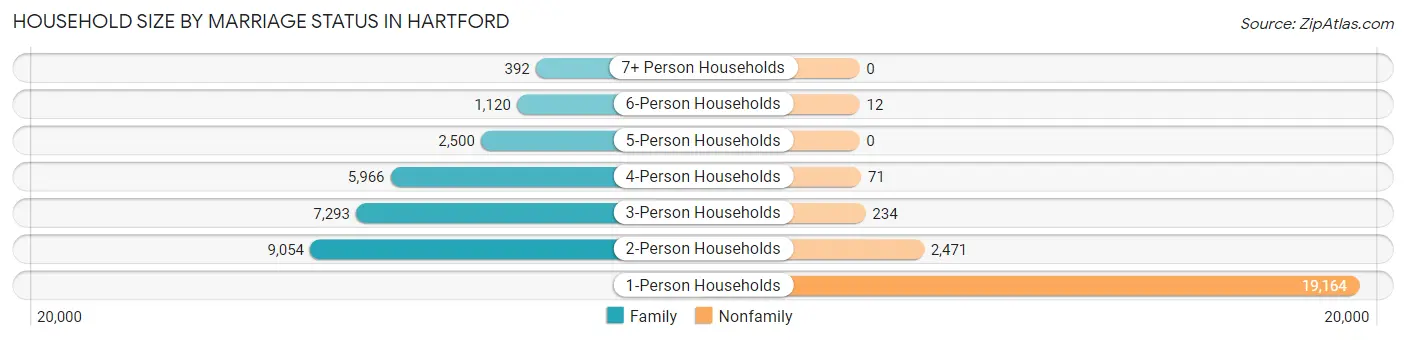
| Household Size | Family Households | Nonfamily Households |
| 1-Person Households | - | 19,164 (39.7%) |
| 2-Person Households | 9,054 (18.8%) | 2,471 (5.1%) |
| 3-Person Households | 7,293 (15.1%) | 234 (0.5%) |
| 4-Person Households | 5,966 (12.4%) | 71 (0.2%) |
| 5-Person Households | 2,500 (5.2%) | 0 (0.0%) |
| 6-Person Households | 1,120 (2.3%) | 12 (0.0%) |
| 7+ Person Households | 392 (0.8%) | 0 (0.0%) |
| Total | 26,325 (54.5%) | 21,952 (45.5%) |
Female Fertility in Hartford
Fertility by Age in Hartford
Average fertility rate in Hartford is 32.0 births per 1,000 women. Women in the age bracket of 20 to 34 years have the highest fertility rate with 51.0 births per 1,000 women. Women in the age bracket of 20 to 34 years acount for 70.3% of all women with births.
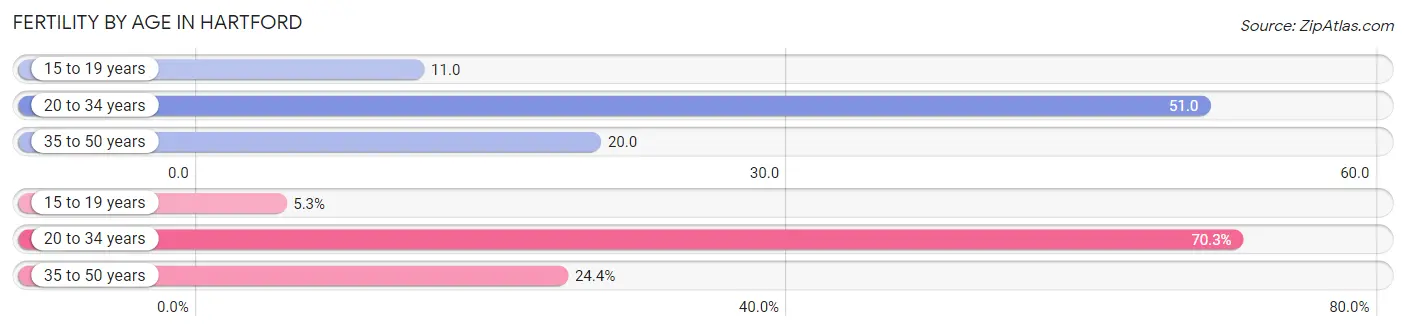
| Age Bracket | Women with Births | Births / 1,000 Women |
| 15 to 19 years | 58 (5.3%) | 11.0 |
| 20 to 34 years | 768 (70.3%) | 51.0 |
| 35 to 50 years | 267 (24.4%) | 20.0 |
| Total | 1,093 (100.0%) | 32.0 |
Fertility by Age by Marriage Status in Hartford
35.2% of women with births (1,093) in Hartford are married. The highest percentage of unmarried women with births falls into 15 to 19 years age bracket with 100.0% of them unmarried at the time of birth, while the lowest percentage of unmarried women with births belong to 35 to 50 years age bracket with 35.2% of them unmarried.
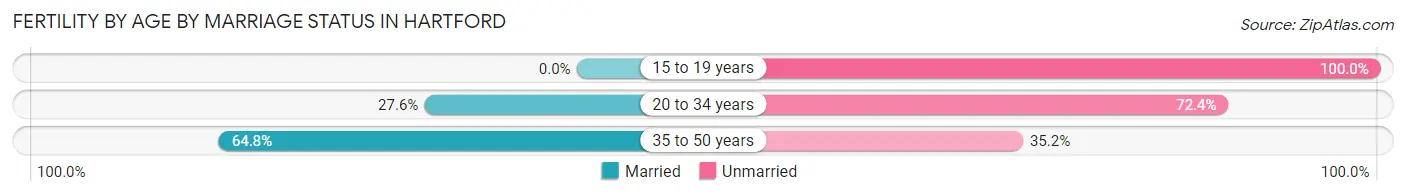
| Age Bracket | Married | Unmarried |
| 15 to 19 years | 0 (0.0%) | 58 (100.0%) |
| 20 to 34 years | 212 (27.6%) | 556 (72.4%) |
| 35 to 50 years | 173 (64.8%) | 94 (35.2%) |
| Total | 385 (35.2%) | 708 (64.8%) |
Fertility by Education in Hartford
Average fertility rate in Hartford is 32.0 births per 1,000 women. Women with the education attainment of high school diploma have the highest fertility rate of 48.0 births per 1,000 women, while women with the education attainment of less than high school have the lowest fertility at 21.0 births per 1,000 women. Women with the education attainment of high school diploma represent 41.7% of all women with births.
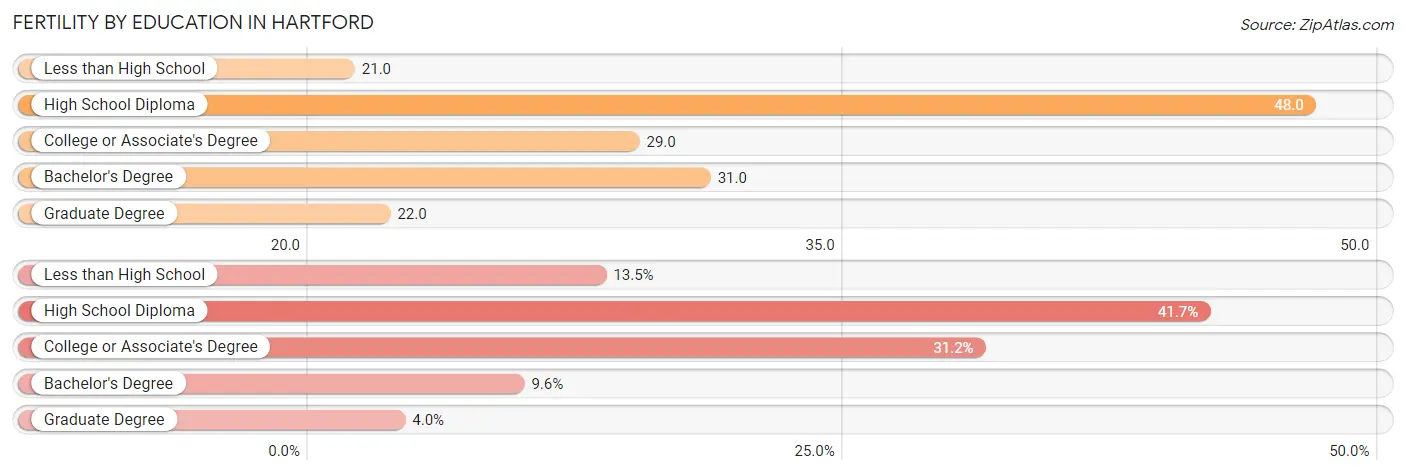
| Educational Attainment | Women with Births | Births / 1,000 Women |
| Less than High School | 147 (13.5%) | 21.0 |
| High School Diploma | 456 (41.7%) | 48.0 |
| College or Associate's Degree | 341 (31.2%) | 29.0 |
| Bachelor's Degree | 105 (9.6%) | 31.0 |
| Graduate Degree | 44 (4.0%) | 22.0 |
| Total | 1,093 (100.0%) | 32.0 |
Fertility by Education by Marriage Status in Hartford
64.8% of women with births in Hartford are unmarried. Women with the educational attainment of high school diploma are most likely to be married with 41.9% of them married at childbirth, while women with the educational attainment of bachelor's degree are least likely to be married with 79.0% of them unmarried at childbirth.
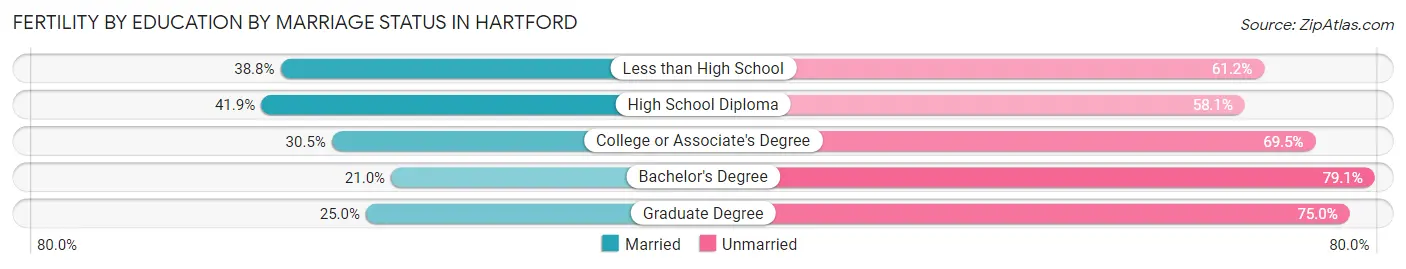
| Educational Attainment | Married | Unmarried |
| Less than High School | 57 (38.8%) | 90 (61.2%) |
| High School Diploma | 191 (41.9%) | 265 (58.1%) |
| College or Associate's Degree | 104 (30.5%) | 237 (69.5%) |
| Bachelor's Degree | 22 (20.9%) | 83 (79.0%) |
| Graduate Degree | 11 (25.0%) | 33 (75.0%) |
| Total | 385 (35.2%) | 708 (64.8%) |
Employment Characteristics in Hartford
Employment by Class of Employer in Hartford
Among the 51,904 employed individuals in Hartford, private company employees (38,536 | 74.2%), not-for-profit organizations (5,125 | 9.9%), and local government employees (2,630 | 5.1%) make up the most common classes of employment.
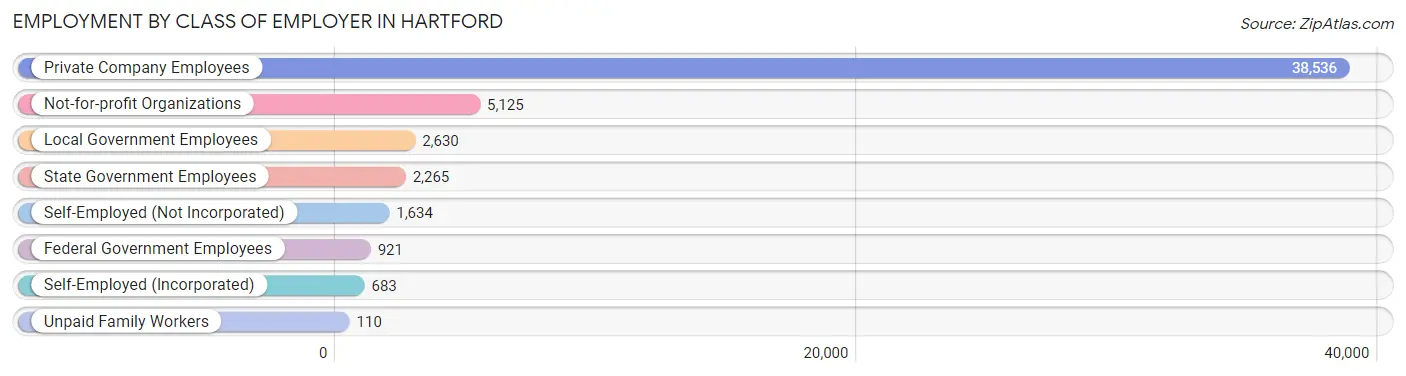
| Employer Class | # Employees | % Employees |
| Private Company Employees | 38,536 | 74.2% |
| Self-Employed (Incorporated) | 683 | 1.3% |
| Self-Employed (Not Incorporated) | 1,634 | 3.2% |
| Not-for-profit Organizations | 5,125 | 9.9% |
| Local Government Employees | 2,630 | 5.1% |
| State Government Employees | 2,265 | 4.4% |
| Federal Government Employees | 921 | 1.8% |
| Unpaid Family Workers | 110 | 0.2% |
| Total | 51,904 | 100.0% |
Employment Status by Age in Hartford
According to the labor force statistics for Hartford, out of the total population over 16 years of age (96,120), 62.5% or 60,075 individuals are in the labor force, with 10.6% or 6,368 of them unemployed. The age group with the highest labor force participation rate is 30 to 34 years, with 81.5% or 7,121 individuals in the labor force. Within the labor force, the 16 to 19 years age range has the highest percentage of unemployed individuals, with 27.7% or 969 of them being unemployed.
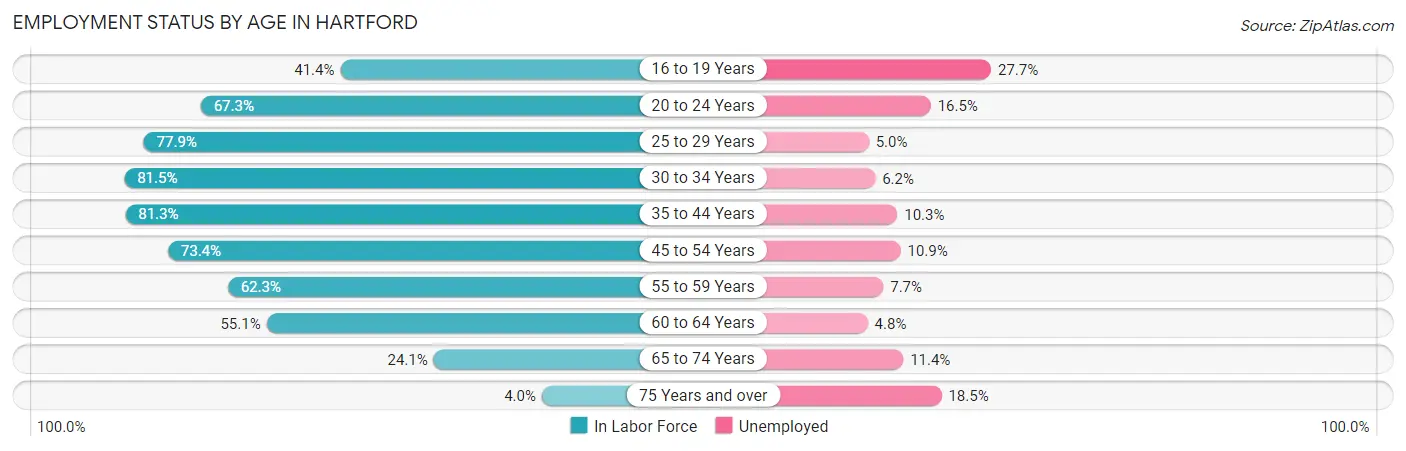
| Age Bracket | In Labor Force | Unemployed |
| 16 to 19 Years | 3,499 (41.4%) | 969 (27.7%) |
| 20 to 24 Years | 7,752 (67.3%) | 1,279 (16.5%) |
| 25 to 29 Years | 7,866 (77.9%) | 393 (5.0%) |
| 30 to 34 Years | 7,121 (81.5%) | 442 (6.2%) |
| 35 to 44 Years | 13,325 (81.3%) | 1,372 (10.3%) |
| 45 to 54 Years | 10,937 (73.4%) | 1,192 (10.9%) |
| 55 to 59 Years | 4,205 (62.3%) | 324 (7.7%) |
| 60 to 64 Years | 3,057 (55.1%) | 147 (4.8%) |
| 65 to 74 Years | 2,081 (24.1%) | 237 (11.4%) |
| 75 Years and over | 204 (4.0%) | 38 (18.5%) |
| Total | 60,075 (62.5%) | 6,368 (10.6%) |
Employment Status by Educational Attainment in Hartford
According to labor force statistics for Hartford, 74.5% of individuals (46,506) out of the total population between 25 and 64 years of age (62,424) are in the labor force, with 8.3% or 3,860 of them being unemployed. The group with the highest labor force participation rate are those with the educational attainment of bachelor's degree or higher, with 89.2% or 10,194 individuals in the labor force. Within the labor force, individuals with less than high school education have the highest percentage of unemployment, with 13.7% or 1,050 of them being unemployed.
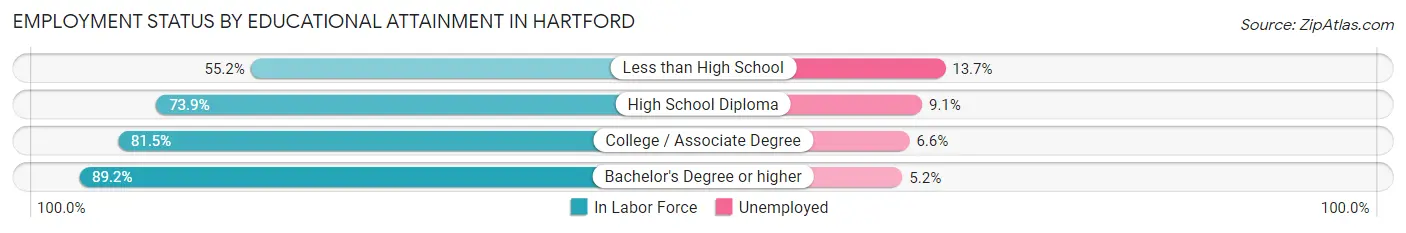
| Educational Attainment | In Labor Force | Unemployed |
| Less than High School | 7,663 (55.2%) | 1,902 (13.7%) |
| High School Diploma | 15,405 (73.9%) | 1,897 (9.1%) |
| College / Associate Degree | 13,258 (81.5%) | 1,074 (6.6%) |
| Bachelor's Degree or higher | 10,194 (89.2%) | 594 (5.2%) |
| Total | 46,506 (74.5%) | 5,181 (8.3%) |
Employment Occupations by Sex in Hartford
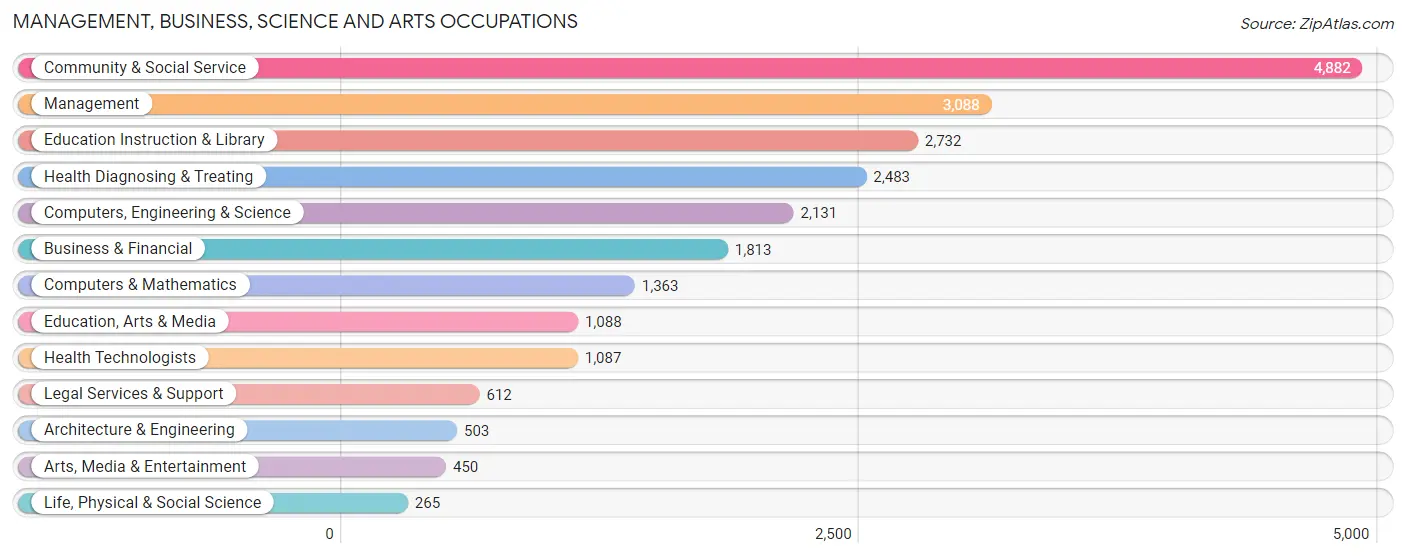
Management, Business, Science and Arts Occupations
The most common Management, Business, Science and Arts occupations in Hartford are Community & Social Service (4,882 | 9.1%), Management (3,088 | 5.8%), Education Instruction & Library (2,732 | 5.1%), Health Diagnosing & Treating (2,483 | 4.6%), and Computers, Engineering & Science (2,131 | 4.0%).
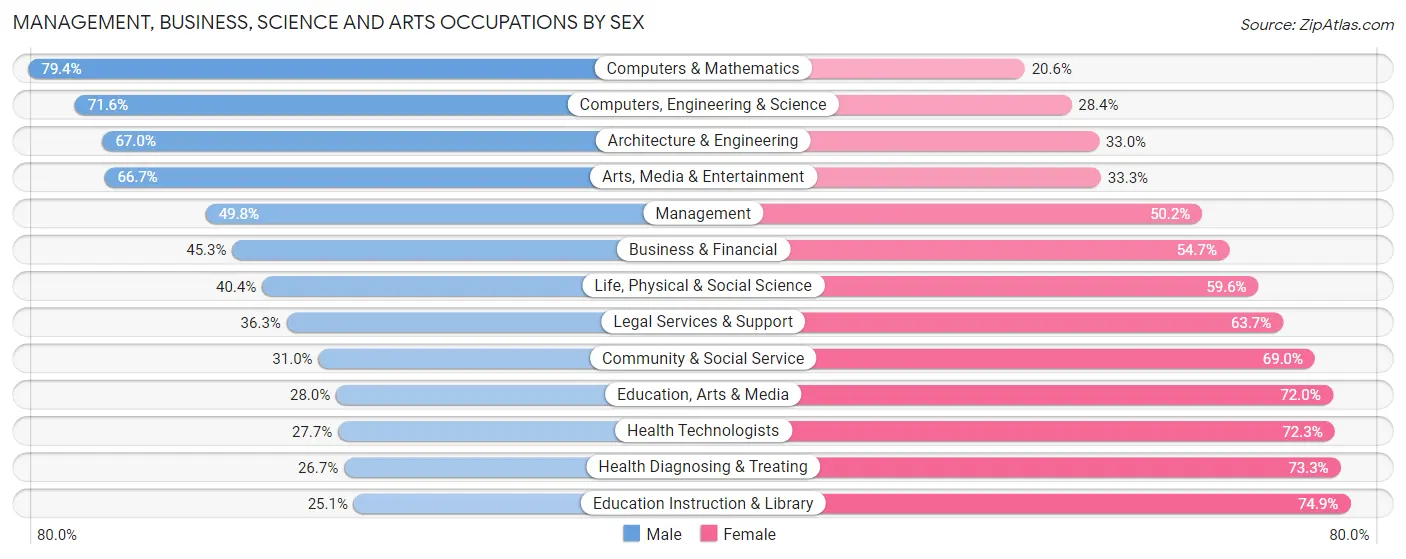
Management, Business, Science and Arts Occupations by Sex
Within the Management, Business, Science and Arts occupations in Hartford, the most male-oriented occupations are Computers & Mathematics (79.4%), Computers, Engineering & Science (71.6%), and Architecture & Engineering (67.0%), while the most female-oriented occupations are Education Instruction & Library (74.9%), Health Diagnosing & Treating (73.3%), and Health Technologists (72.3%).
| Occupation | Male | Female |
| Management | 1,537 (49.8%) | 1,551 (50.2%) |
| Business & Financial | 822 (45.3%) | 991 (54.7%) |
| Computers, Engineering & Science | 1,526 (71.6%) | 605 (28.4%) |
| Computers & Mathematics | 1,082 (79.4%) | 281 (20.6%) |
| Architecture & Engineering | 337 (67.0%) | 166 (33.0%) |
| Life, Physical & Social Science | 107 (40.4%) | 158 (59.6%) |
| Community & Social Service | 1,512 (31.0%) | 3,370 (69.0%) |
| Education, Arts & Media | 305 (28.0%) | 783 (72.0%) |
| Legal Services & Support | 222 (36.3%) | 390 (63.7%) |
| Education Instruction & Library | 685 (25.1%) | 2,047 (74.9%) |
| Arts, Media & Entertainment | 300 (66.7%) | 150 (33.3%) |
| Health Diagnosing & Treating | 663 (26.7%) | 1,820 (73.3%) |
| Health Technologists | 301 (27.7%) | 786 (72.3%) |
| Total (Category) | 6,060 (42.1%) | 8,337 (57.9%) |
| Total (Overall) | 25,108 (46.9%) | 28,490 (53.1%) |
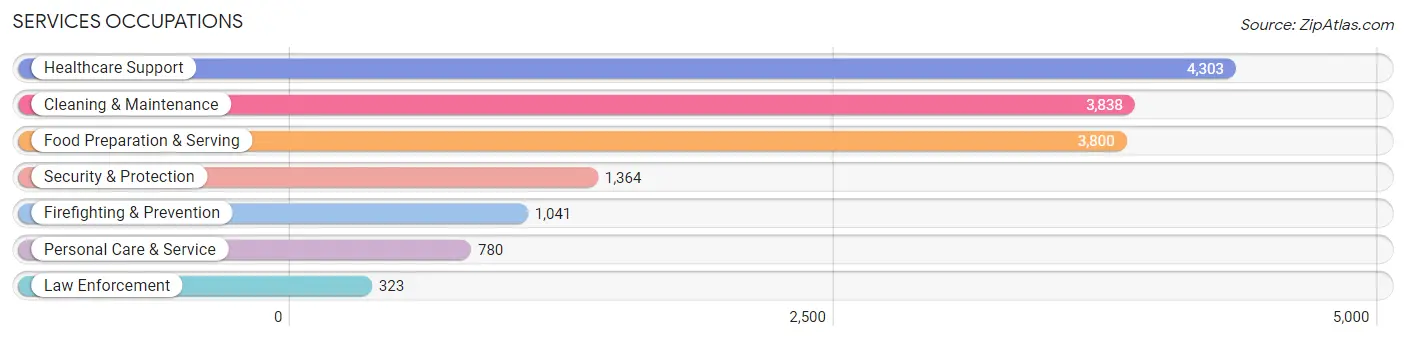
Services Occupations
The most common Services occupations in Hartford are Healthcare Support (4,303 | 8.0%), Cleaning & Maintenance (3,838 | 7.2%), Food Preparation & Serving (3,800 | 7.1%), Security & Protection (1,364 | 2.5%), and Firefighting & Prevention (1,041 | 1.9%).
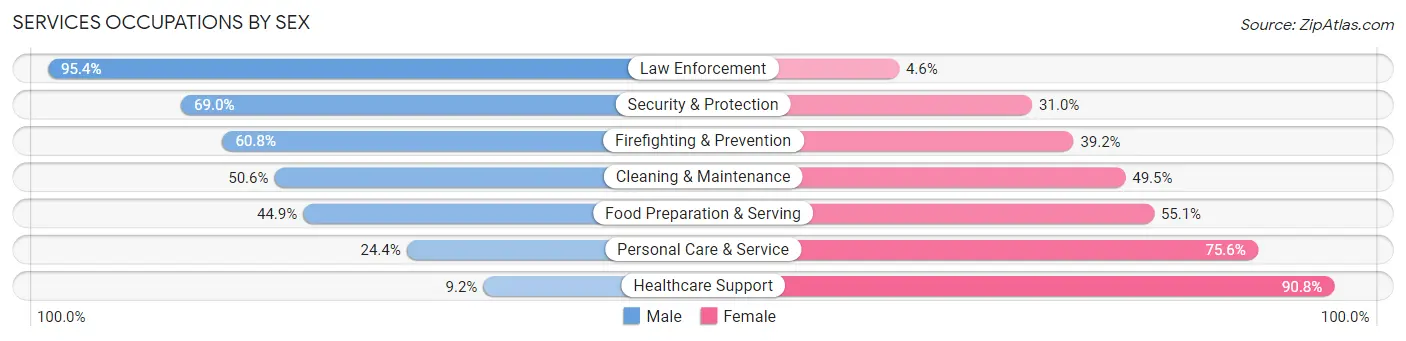
Services Occupations by Sex
Within the Services occupations in Hartford, the most male-oriented occupations are Law Enforcement (95.4%), Security & Protection (69.0%), and Firefighting & Prevention (60.8%), while the most female-oriented occupations are Healthcare Support (90.8%), Personal Care & Service (75.6%), and Food Preparation & Serving (55.1%).
| Occupation | Male | Female |
| Healthcare Support | 396 (9.2%) | 3,907 (90.8%) |
| Security & Protection | 941 (69.0%) | 423 (31.0%) |
| Firefighting & Prevention | 633 (60.8%) | 408 (39.2%) |
| Law Enforcement | 308 (95.4%) | 15 (4.6%) |
| Food Preparation & Serving | 1,705 (44.9%) | 2,095 (55.1%) |
| Cleaning & Maintenance | 1,940 (50.5%) | 1,898 (49.4%) |
| Personal Care & Service | 190 (24.4%) | 590 (75.6%) |
| Total (Category) | 5,172 (36.7%) | 8,913 (63.3%) |
| Total (Overall) | 25,108 (46.9%) | 28,490 (53.1%) |
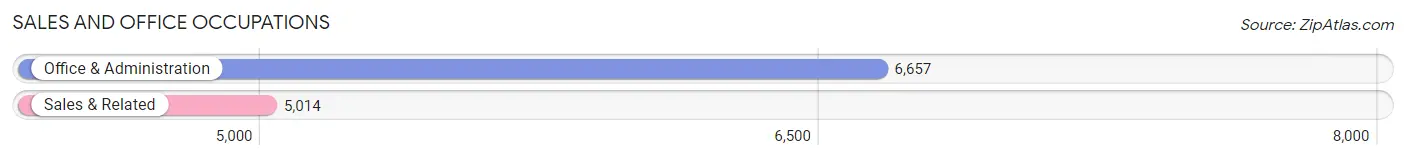
Sales and Office Occupations
The most common Sales and Office occupations in Hartford are Office & Administration (6,657 | 12.4%), and Sales & Related (5,014 | 9.3%).
Sales and Office Occupations by Sex
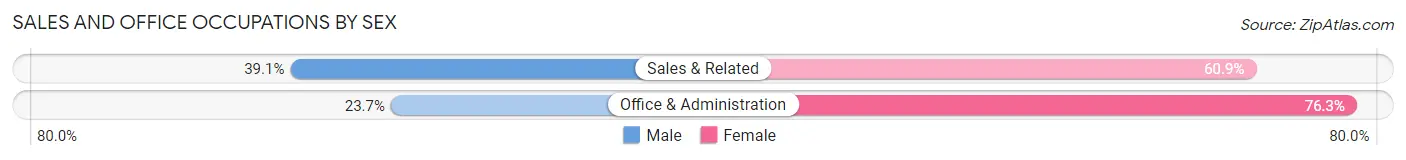
| Occupation | Male | Female |
| Sales & Related | 1,962 (39.1%) | 3,052 (60.9%) |
| Office & Administration | 1,575 (23.7%) | 5,082 (76.3%) |
| Total (Category) | 3,537 (30.3%) | 8,134 (69.7%) |
| Total (Overall) | 25,108 (46.9%) | 28,490 (53.1%) |
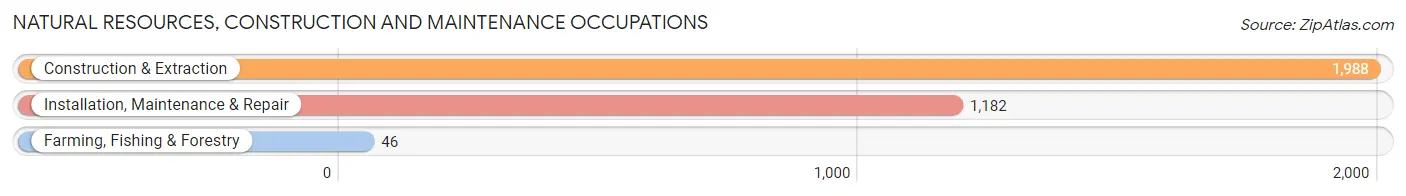
Natural Resources, Construction and Maintenance Occupations
The most common Natural Resources, Construction and Maintenance occupations in Hartford are Construction & Extraction (1,988 | 3.7%), Installation, Maintenance & Repair (1,182 | 2.2%), and Farming, Fishing & Forestry (46 | 0.1%).
Natural Resources, Construction and Maintenance Occupations by Sex
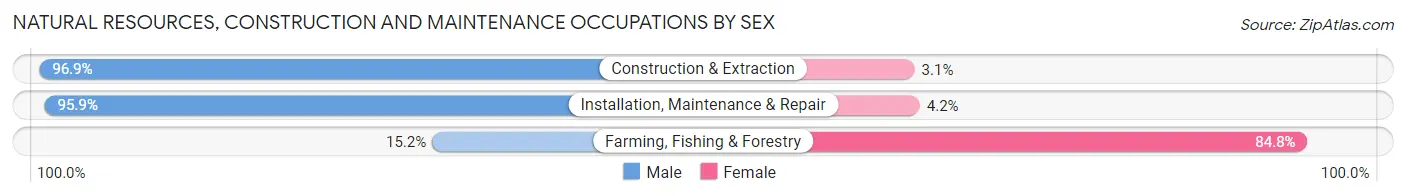
| Occupation | Male | Female |
| Farming, Fishing & Forestry | 7 (15.2%) | 39 (84.8%) |
| Construction & Extraction | 1,927 (96.9%) | 61 (3.1%) |
| Installation, Maintenance & Repair | 1,133 (95.9%) | 49 (4.2%) |
| Total (Category) | 3,067 (95.4%) | 149 (4.6%) |
| Total (Overall) | 25,108 (46.9%) | 28,490 (53.1%) |
Production, Transportation and Moving Occupations
The most common Production, Transportation and Moving occupations in Hartford are Material Moving (3,458 | 6.5%), Production (3,439 | 6.4%), and Transportation (3,332 | 6.2%).
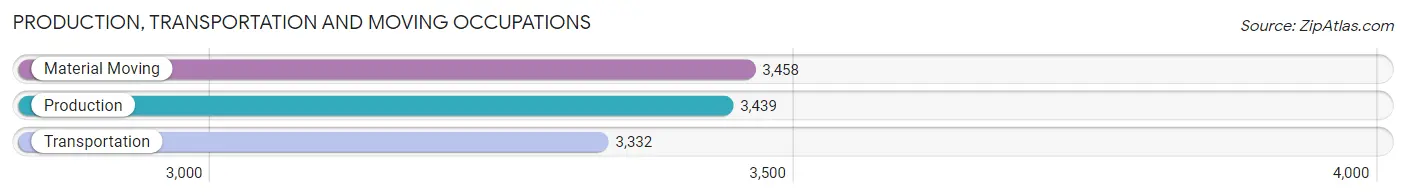
Production, Transportation and Moving Occupations by Sex
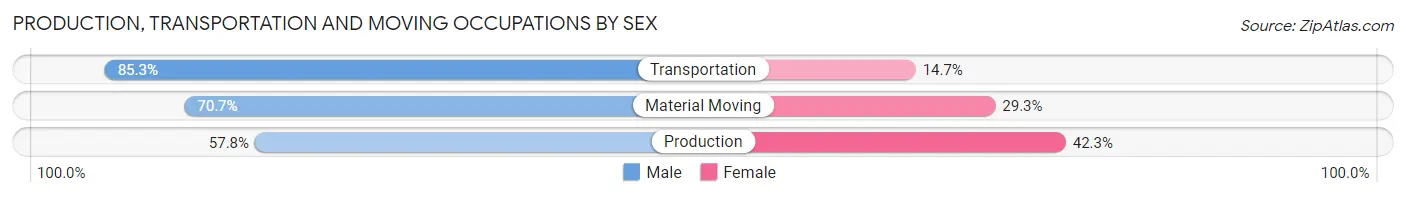
| Occupation | Male | Female |
| Production | 1,986 (57.8%) | 1,453 (42.2%) |
| Transportation | 2,842 (85.3%) | 490 (14.7%) |
| Material Moving | 2,444 (70.7%) | 1,014 (29.3%) |
| Total (Category) | 7,272 (71.1%) | 2,957 (28.9%) |
| Total (Overall) | 25,108 (46.9%) | 28,490 (53.1%) |
Employment Industries by Sex in Hartford
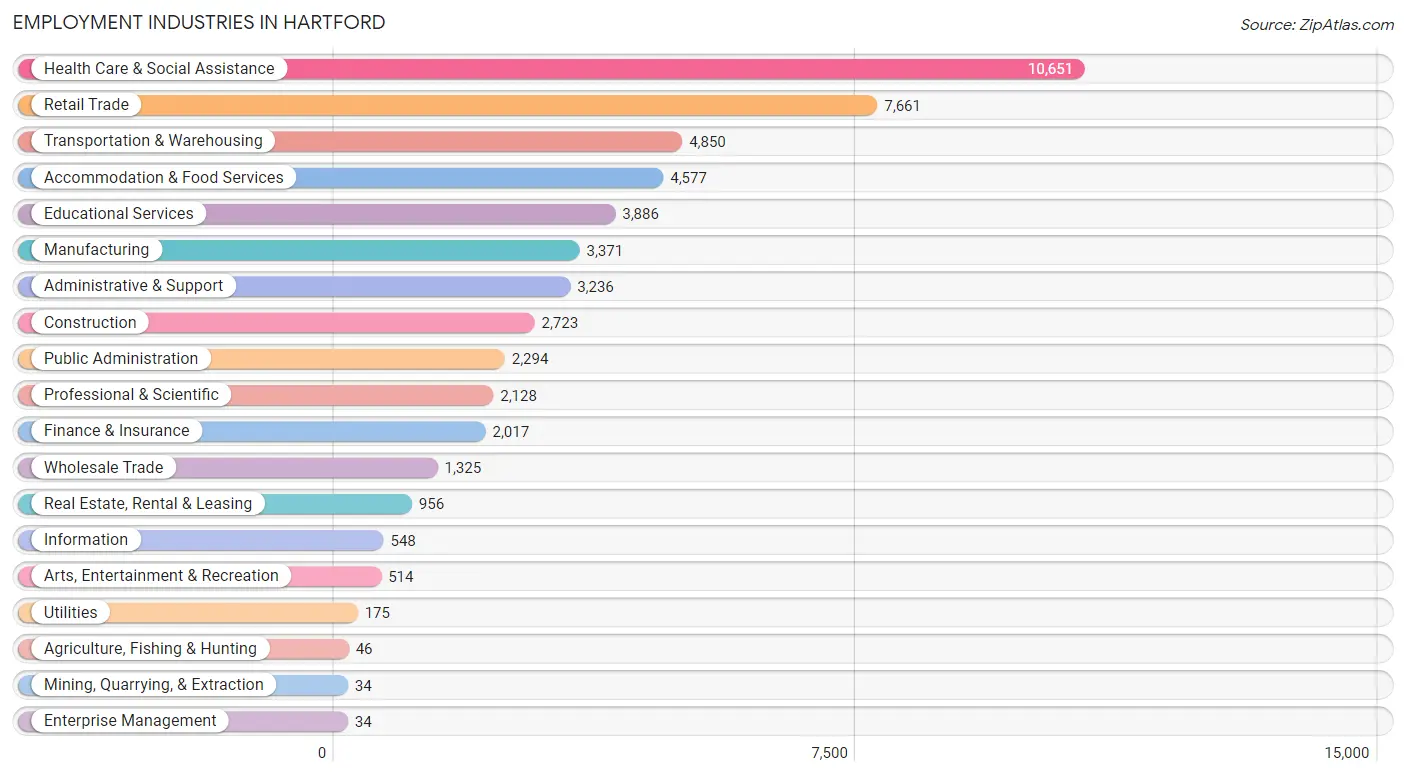
Employment Industries in Hartford
The major employment industries in Hartford include Health Care & Social Assistance (10,651 | 19.9%), Retail Trade (7,661 | 14.3%), Transportation & Warehousing (4,850 | 9.0%), Accommodation & Food Services (4,577 | 8.5%), and Educational Services (3,886 | 7.2%).
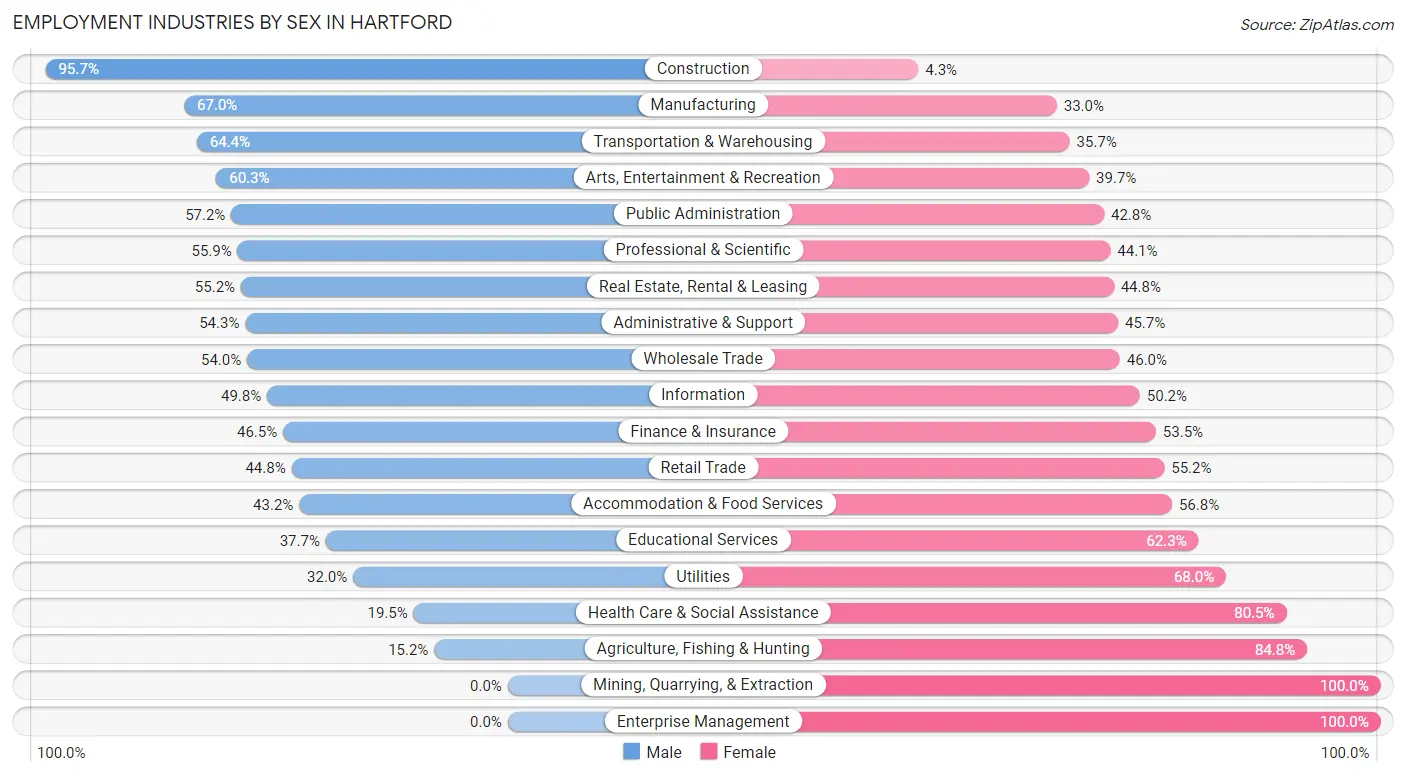
Employment Industries by Sex in Hartford
The Hartford industries that see more men than women are Construction (95.7%), Manufacturing (67.0%), and Transportation & Warehousing (64.3%), whereas the industries that tend to have a higher number of women are Mining, Quarrying, & Extraction (100.0%), Enterprise Management (100.0%), and Agriculture, Fishing & Hunting (84.8%).
| Industry | Male | Female |
| Agriculture, Fishing & Hunting | 7 (15.2%) | 39 (84.8%) |
| Mining, Quarrying, & Extraction | 0 (0.0%) | 34 (100.0%) |
| Construction | 2,605 (95.7%) | 118 (4.3%) |
| Manufacturing | 2,259 (67.0%) | 1,112 (33.0%) |
| Wholesale Trade | 715 (54.0%) | 610 (46.0%) |
| Retail Trade | 3,429 (44.8%) | 4,232 (55.2%) |
| Transportation & Warehousing | 3,121 (64.3%) | 1,729 (35.6%) |
| Utilities | 56 (32.0%) | 119 (68.0%) |
| Information | 273 (49.8%) | 275 (50.2%) |
| Finance & Insurance | 938 (46.5%) | 1,079 (53.5%) |
| Real Estate, Rental & Leasing | 528 (55.2%) | 428 (44.8%) |
| Professional & Scientific | 1,190 (55.9%) | 938 (44.1%) |
| Enterprise Management | 0 (0.0%) | 34 (100.0%) |
| Administrative & Support | 1,758 (54.3%) | 1,478 (45.7%) |
| Educational Services | 1,464 (37.7%) | 2,422 (62.3%) |
| Health Care & Social Assistance | 2,077 (19.5%) | 8,574 (80.5%) |
| Arts, Entertainment & Recreation | 310 (60.3%) | 204 (39.7%) |
| Accommodation & Food Services | 1,976 (43.2%) | 2,601 (56.8%) |
| Public Administration | 1,313 (57.2%) | 981 (42.8%) |
| Total | 25,108 (46.9%) | 28,490 (53.1%) |
Education in Hartford
School Enrollment in Hartford
The most common levels of schooling among the 35,062 students in Hartford are college / undergraduate (10,353 | 29.5%), high school (6,887 | 19.6%), and middle school (6,785 | 19.4%).
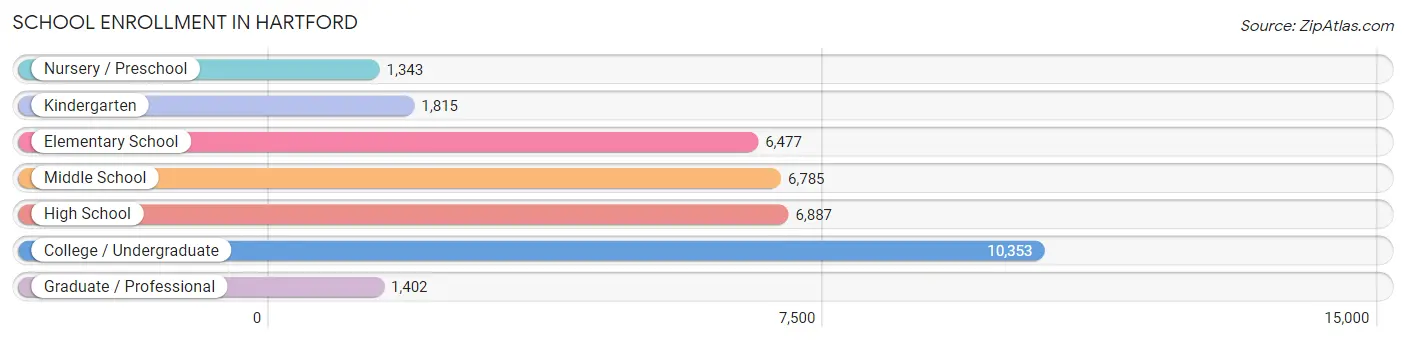
| School Level | # Students | % Students |
| Nursery / Preschool | 1,343 | 3.8% |
| Kindergarten | 1,815 | 5.2% |
| Elementary School | 6,477 | 18.5% |
| Middle School | 6,785 | 19.4% |
| High School | 6,887 | 19.6% |
| College / Undergraduate | 10,353 | 29.5% |
| Graduate / Professional | 1,402 | 4.0% |
| Total | 35,062 | 100.0% |
School Enrollment by Age by Funding Source in Hartford
Out of a total of 35,062 students who are enrolled in schools in Hartford, 4,348 (12.4%) attend a private institution, while the remaining 30,714 (87.6%) are enrolled in public schools. The age group of 25 to 34 year olds has the highest likelihood of being enrolled in private schools, with 470 (25.5% in the age bracket) enrolled. Conversely, the age group of 5 to 9 year old has the lowest likelihood of being enrolled in a private school, with 7,432 (96.5% in the age bracket) attending a public institution.
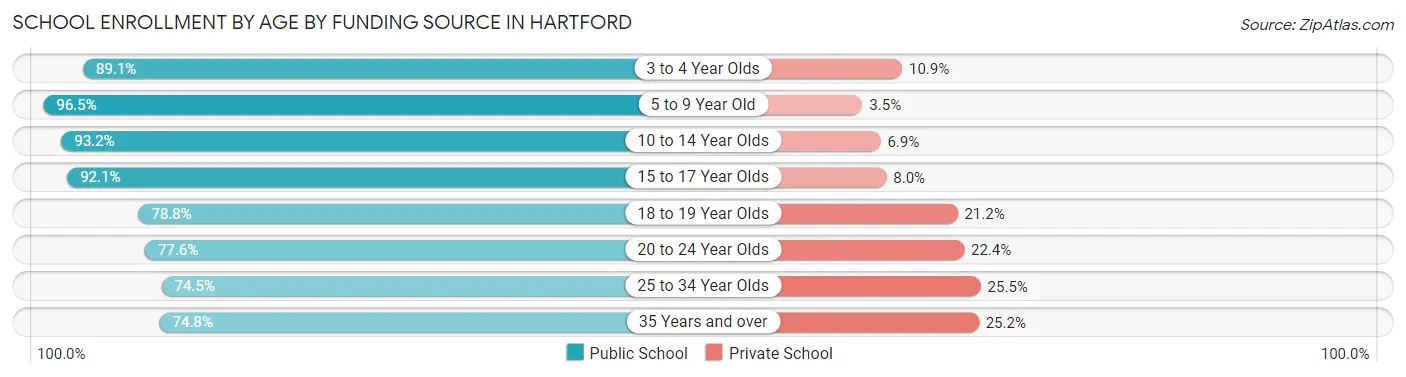
| Age Bracket | Public School | Private School |
| 3 to 4 Year Olds | 1,181 (89.1%) | 144 (10.9%) |
| 5 to 9 Year Old | 7,432 (96.5%) | 269 (3.5%) |
| 10 to 14 Year Olds | 7,874 (93.1%) | 579 (6.9%) |
| 15 to 17 Year Olds | 4,157 (92.0%) | 359 (8.0%) |
| 18 to 19 Year Olds | 3,218 (78.8%) | 866 (21.2%) |
| 20 to 24 Year Olds | 4,331 (77.6%) | 1,252 (22.4%) |
| 25 to 34 Year Olds | 1,372 (74.5%) | 470 (25.5%) |
| 35 Years and over | 1,166 (74.8%) | 392 (25.2%) |
| Total | 30,714 (87.6%) | 4,348 (12.4%) |
Educational Attainment by Field of Study in Hartford
Business (2,726 | 18.6%), social sciences (1,613 | 11.0%), arts & humanities (1,302 | 8.9%), education (1,196 | 8.1%), and engineering (1,116 | 7.6%) are the most common fields of study among 14,687 individuals in Hartford who have obtained a bachelor's degree or higher.
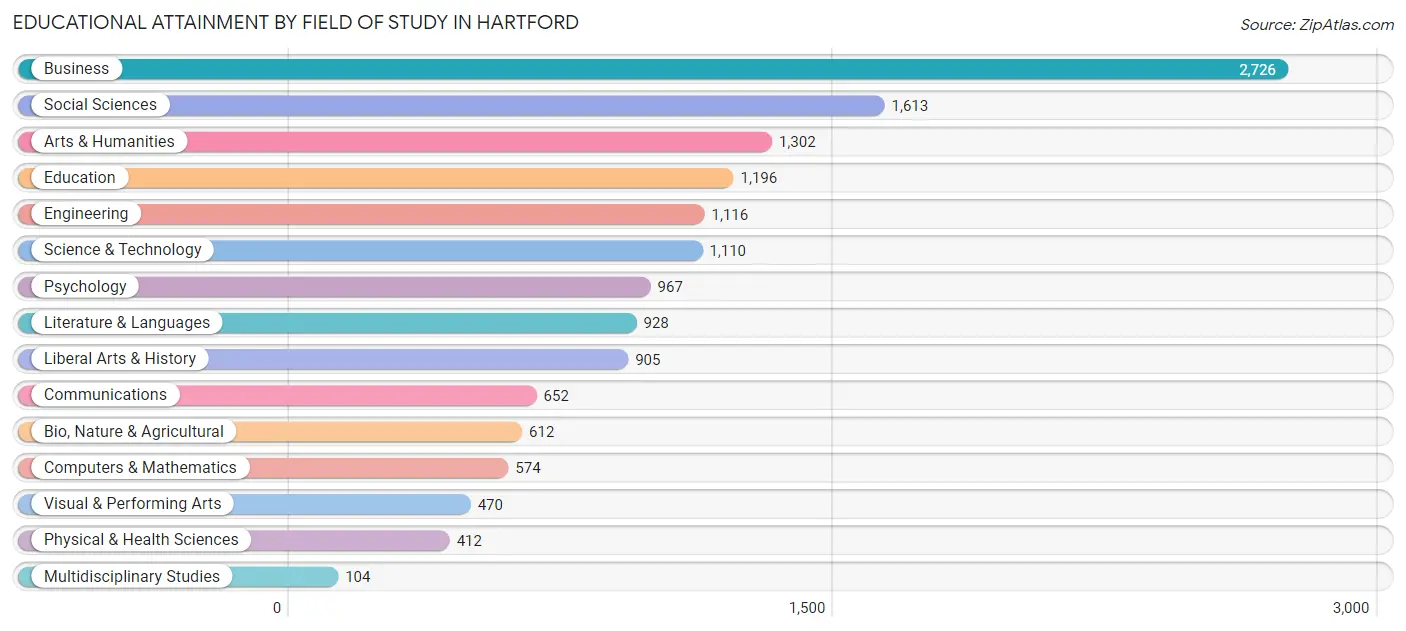
| Field of Study | # Graduates | % Graduates |
| Computers & Mathematics | 574 | 3.9% |
| Bio, Nature & Agricultural | 612 | 4.2% |
| Physical & Health Sciences | 412 | 2.8% |
| Psychology | 967 | 6.6% |
| Social Sciences | 1,613 | 11.0% |
| Engineering | 1,116 | 7.6% |
| Multidisciplinary Studies | 104 | 0.7% |
| Science & Technology | 1,110 | 7.6% |
| Business | 2,726 | 18.6% |
| Education | 1,196 | 8.1% |
| Literature & Languages | 928 | 6.3% |
| Liberal Arts & History | 905 | 6.2% |
| Visual & Performing Arts | 470 | 3.2% |
| Communications | 652 | 4.4% |
| Arts & Humanities | 1,302 | 8.9% |
| Total | 14,687 | 100.0% |
Transportation & Commute in Hartford
Vehicle Availability by Sex in Hartford
The most prevalent vehicle ownership categories in Hartford are males with 1 vehicle (9,254, accounting for 38.9%) and females with 1 vehicle (11,088, making up 34.5%).
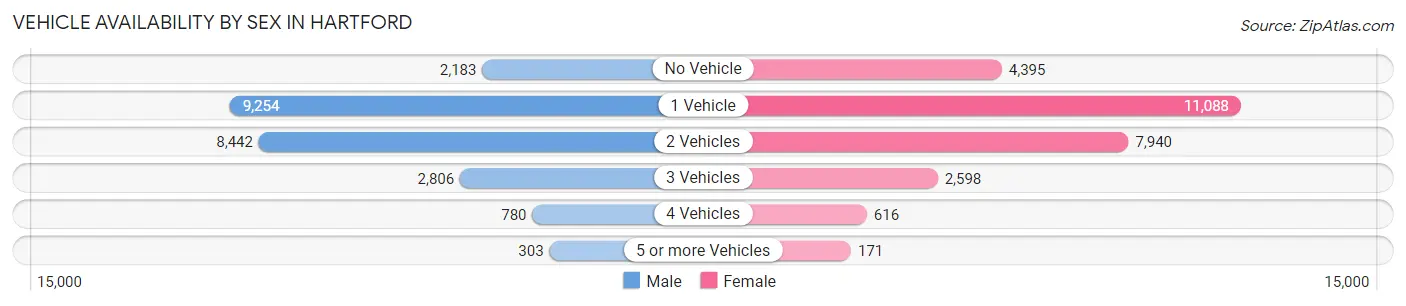
| Vehicles Available | Male | Female |
| No Vehicle | 2,183 (9.2%) | 4,395 (16.4%) |
| 1 Vehicle | 9,254 (38.9%) | 11,088 (41.4%) |
| 2 Vehicles | 8,442 (35.5%) | 7,940 (29.6%) |
| 3 Vehicles | 2,806 (11.8%) | 2,598 (9.7%) |
| 4 Vehicles | 780 (3.3%) | 616 (2.3%) |
| 5 or more Vehicles | 303 (1.3%) | 171 (0.6%) |
| Total | 23,768 (100.0%) | 26,808 (100.0%) |
Commute Time in Hartford
The most frequently occuring commute durations in Hartford are 15 to 19 minutes (10,420 commuters, 21.6%), 10 to 14 minutes (9,453 commuters, 19.6%), and 20 to 24 minutes (9,265 commuters, 19.3%).
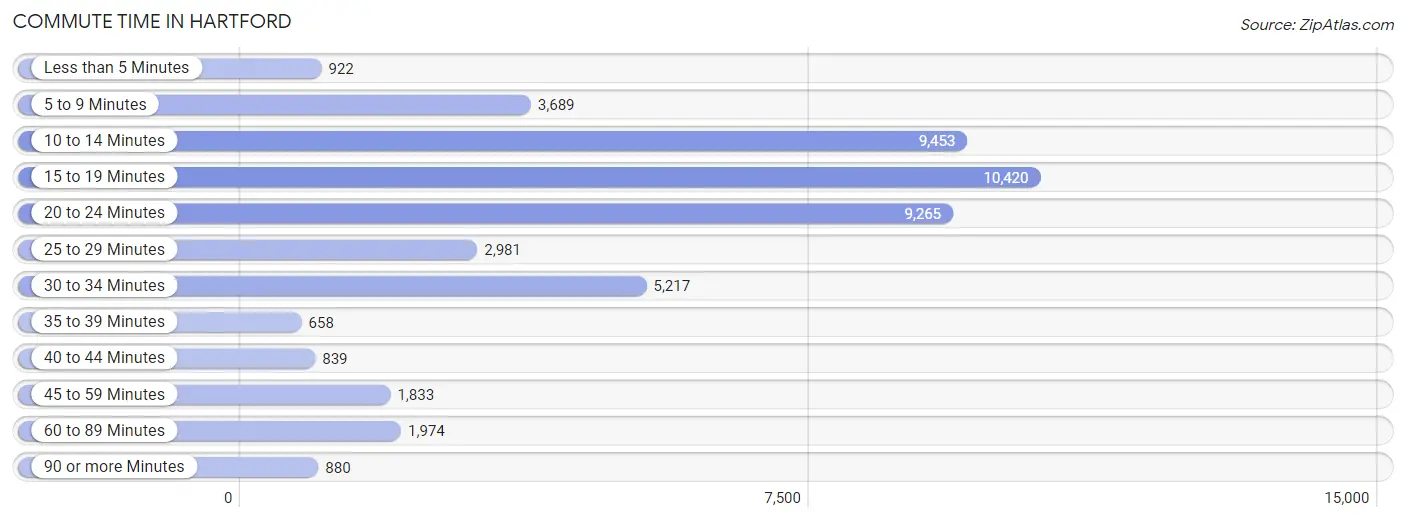
| Commute Time | # Commuters | % Commuters |
| Less than 5 Minutes | 922 | 1.9% |
| 5 to 9 Minutes | 3,689 | 7.7% |
| 10 to 14 Minutes | 9,453 | 19.6% |
| 15 to 19 Minutes | 10,420 | 21.6% |
| 20 to 24 Minutes | 9,265 | 19.3% |
| 25 to 29 Minutes | 2,981 | 6.2% |
| 30 to 34 Minutes | 5,217 | 10.8% |
| 35 to 39 Minutes | 658 | 1.4% |
| 40 to 44 Minutes | 839 | 1.7% |
| 45 to 59 Minutes | 1,833 | 3.8% |
| 60 to 89 Minutes | 1,974 | 4.1% |
| 90 or more Minutes | 880 | 1.8% |
Commute Time by Sex in Hartford
The most common commute times in Hartford are 15 to 19 minutes (5,025 commuters, 22.4%) for males and 15 to 19 minutes (5,395 commuters, 21.0%) for females.
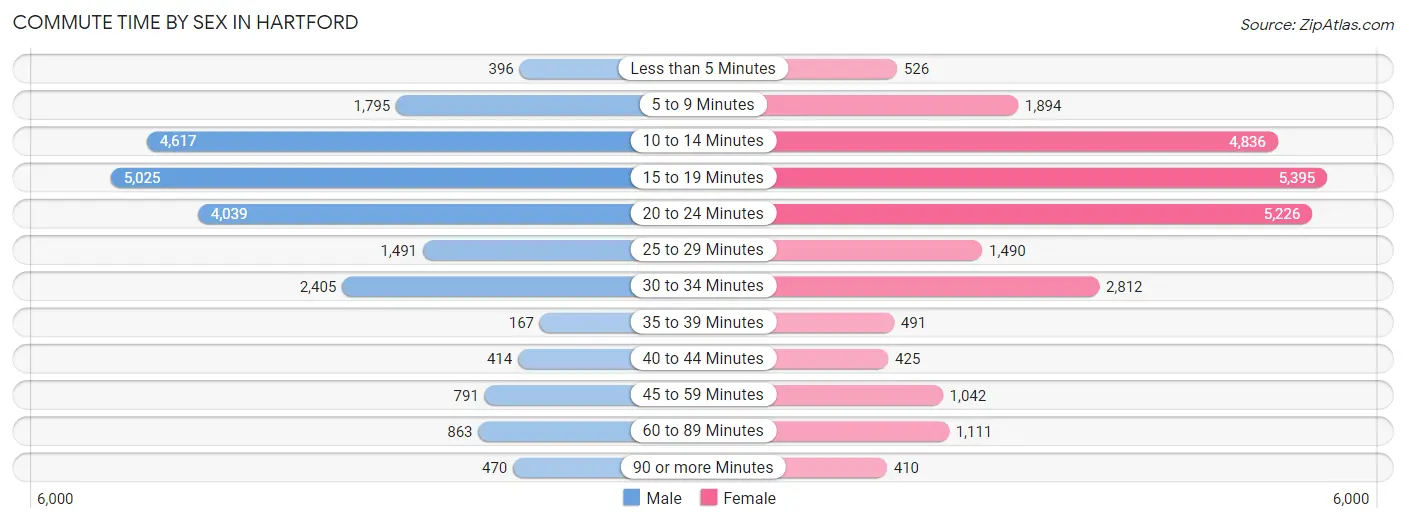
| Commute Time | Male | Female |
| Less than 5 Minutes | 396 (1.8%) | 526 (2.1%) |
| 5 to 9 Minutes | 1,795 (8.0%) | 1,894 (7.4%) |
| 10 to 14 Minutes | 4,617 (20.5%) | 4,836 (18.9%) |
| 15 to 19 Minutes | 5,025 (22.4%) | 5,395 (21.0%) |
| 20 to 24 Minutes | 4,039 (18.0%) | 5,226 (20.4%) |
| 25 to 29 Minutes | 1,491 (6.6%) | 1,490 (5.8%) |
| 30 to 34 Minutes | 2,405 (10.7%) | 2,812 (11.0%) |
| 35 to 39 Minutes | 167 (0.7%) | 491 (1.9%) |
| 40 to 44 Minutes | 414 (1.8%) | 425 (1.7%) |
| 45 to 59 Minutes | 791 (3.5%) | 1,042 (4.1%) |
| 60 to 89 Minutes | 863 (3.8%) | 1,111 (4.3%) |
| 90 or more Minutes | 470 (2.1%) | 410 (1.6%) |
Time of Departure to Work by Sex in Hartford
The most frequent times of departure to work in Hartford are 8:00 AM to 8:29 AM (2,626, 11.7%) for males and 8:00 AM to 8:29 AM (3,427, 13.4%) for females.

| Time of Departure | Male | Female |
| 12:00 AM to 4:59 AM | 1,505 (6.7%) | 1,110 (4.3%) |
| 5:00 AM to 5:29 AM | 1,149 (5.1%) | 1,034 (4.0%) |
| 5:30 AM to 5:59 AM | 1,042 (4.6%) | 982 (3.8%) |
| 6:00 AM to 6:29 AM | 1,891 (8.4%) | 2,768 (10.8%) |
| 6:30 AM to 6:59 AM | 1,889 (8.4%) | 1,896 (7.4%) |
| 7:00 AM to 7:29 AM | 2,560 (11.4%) | 3,021 (11.8%) |
| 7:30 AM to 7:59 AM | 1,692 (7.5%) | 2,264 (8.8%) |
| 8:00 AM to 8:29 AM | 2,626 (11.7%) | 3,427 (13.4%) |
| 8:30 AM to 8:59 AM | 1,143 (5.1%) | 1,527 (5.9%) |
| 9:00 AM to 9:59 AM | 1,221 (5.4%) | 1,839 (7.2%) |
| 10:00 AM to 10:59 AM | 695 (3.1%) | 506 (2.0%) |
| 11:00 AM to 11:59 AM | 320 (1.4%) | 469 (1.8%) |
| 12:00 PM to 3:59 PM | 2,176 (9.7%) | 2,485 (9.7%) |
| 4:00 PM to 11:59 PM | 2,564 (11.4%) | 2,330 (9.1%) |
| Total | 22,473 (100.0%) | 25,658 (100.0%) |
Housing Occupancy in Hartford
Occupancy by Ownership in Hartford
Of the total 48,277 dwellings in Hartford, owner-occupied units account for 12,378 (25.6%), while renter-occupied units make up 35,899 (74.4%).
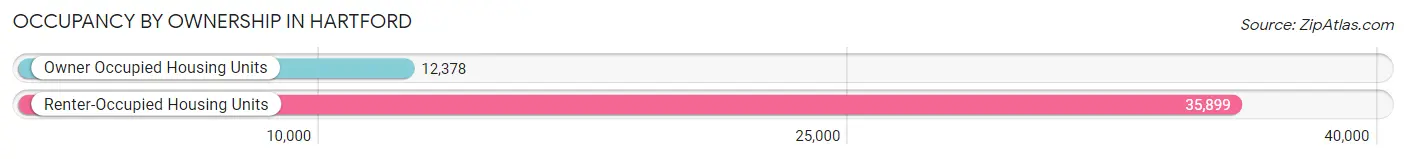
| Occupancy | # Housing Units | % Housing Units |
| Owner Occupied Housing Units | 12,378 | 25.6% |
| Renter-Occupied Housing Units | 35,899 | 74.4% |
| Total Occupied Housing Units | 48,277 | 100.0% |
Occupancy by Household Size in Hartford
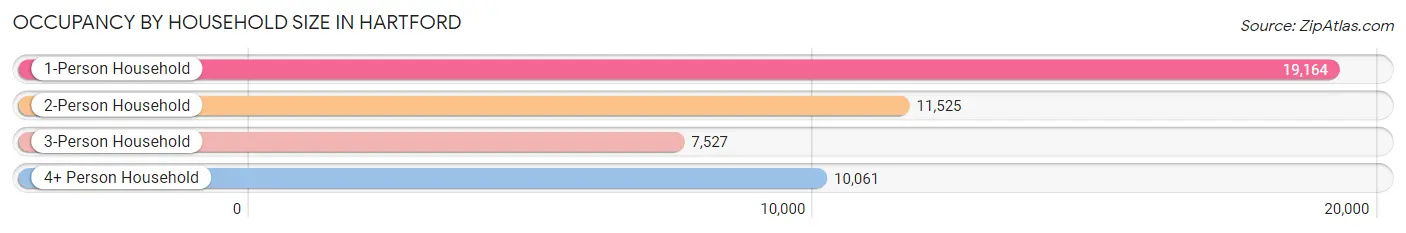
| Household Size | # Housing Units | % Housing Units |
| 1-Person Household | 19,164 | 39.7% |
| 2-Person Household | 11,525 | 23.9% |
| 3-Person Household | 7,527 | 15.6% |
| 4+ Person Household | 10,061 | 20.8% |
| Total Housing Units | 48,277 | 100.0% |
Occupancy by Ownership by Household Size in Hartford
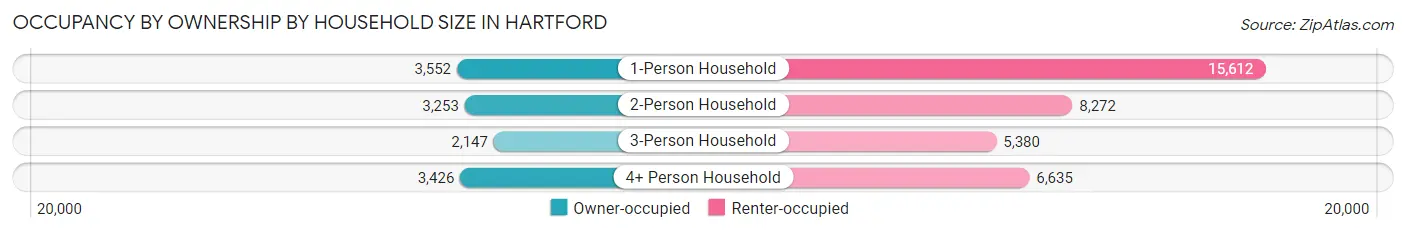
| Household Size | Owner-occupied | Renter-occupied |
| 1-Person Household | 3,552 (18.5%) | 15,612 (81.5%) |
| 2-Person Household | 3,253 (28.2%) | 8,272 (71.8%) |
| 3-Person Household | 2,147 (28.5%) | 5,380 (71.5%) |
| 4+ Person Household | 3,426 (34.1%) | 6,635 (65.9%) |
| Total Housing Units | 12,378 (25.6%) | 35,899 (74.4%) |
Occupancy by Educational Attainment in Hartford
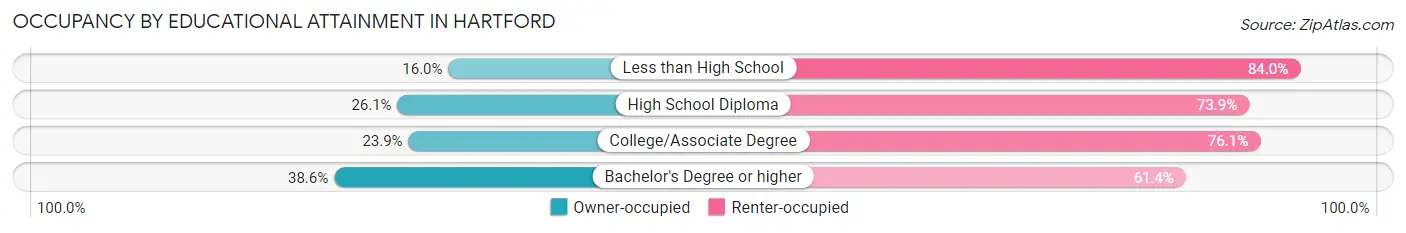
| Household Size | Owner-occupied | Renter-occupied |
| Less than High School | 1,725 (16.0%) | 9,070 (84.0%) |
| High School Diploma | 3,920 (26.1%) | 11,110 (73.9%) |
| College/Associate Degree | 3,150 (23.9%) | 10,029 (76.1%) |
| Bachelor's Degree or higher | 3,583 (38.6%) | 5,690 (61.4%) |
Occupancy by Age of Householder in Hartford
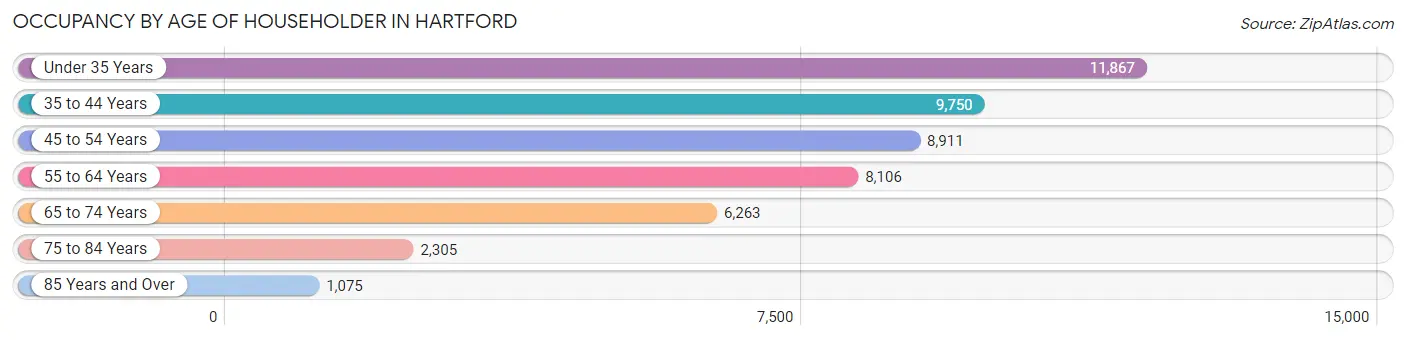
| Age Bracket | # Households | % Households |
| Under 35 Years | 11,867 | 24.6% |
| 35 to 44 Years | 9,750 | 20.2% |
| 45 to 54 Years | 8,911 | 18.5% |
| 55 to 64 Years | 8,106 | 16.8% |
| 65 to 74 Years | 6,263 | 13.0% |
| 75 to 84 Years | 2,305 | 4.8% |
| 85 Years and Over | 1,075 | 2.2% |
| Total | 48,277 | 100.0% |
Housing Finances in Hartford
Median Income by Occupancy in Hartford
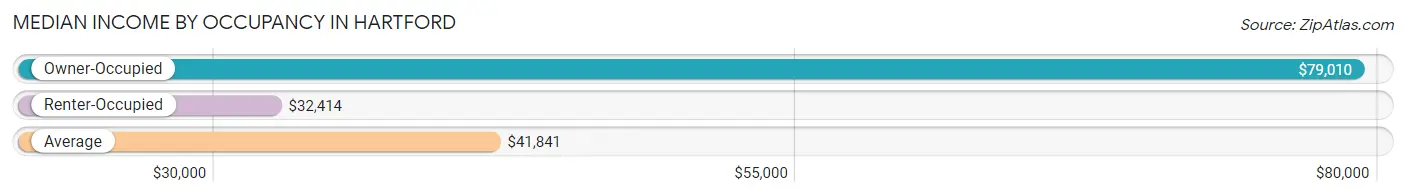
| Occupancy Type | # Households | Median Income |
| Owner-Occupied | 12,378 (25.6%) | $79,010 |
| Renter-Occupied | 35,899 (74.4%) | $32,414 |
| Average | 48,277 (100.0%) | $41,841 |
Occupancy by Householder Income Bracket in Hartford
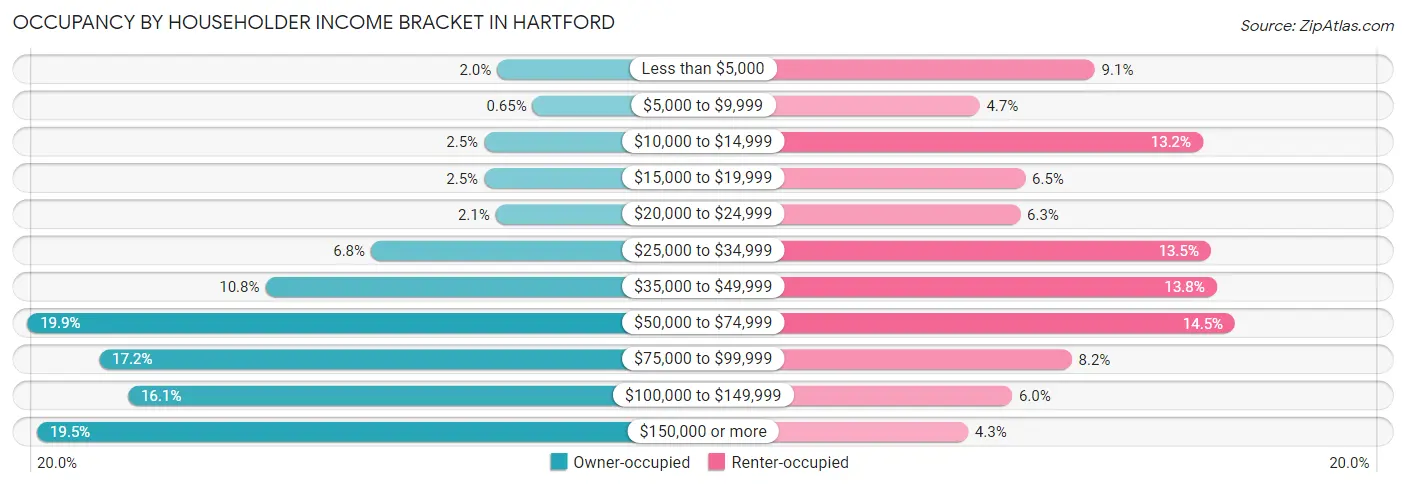
| Income Bracket | Owner-occupied | Renter-occupied |
| Less than $5,000 | 247 (2.0%) | 3,272 (9.1%) |
| $5,000 to $9,999 | 80 (0.6%) | 1,694 (4.7%) |
| $10,000 to $14,999 | 310 (2.5%) | 4,748 (13.2%) |
| $15,000 to $19,999 | 310 (2.5%) | 2,319 (6.5%) |
| $20,000 to $24,999 | 255 (2.1%) | 2,252 (6.3%) |
| $25,000 to $34,999 | 843 (6.8%) | 4,857 (13.5%) |
| $35,000 to $49,999 | 1,340 (10.8%) | 4,936 (13.8%) |
| $50,000 to $74,999 | 2,463 (19.9%) | 5,186 (14.4%) |
| $75,000 to $99,999 | 2,124 (17.2%) | 2,956 (8.2%) |
| $100,000 to $149,999 | 1,988 (16.1%) | 2,141 (6.0%) |
| $150,000 or more | 2,418 (19.5%) | 1,538 (4.3%) |
| Total | 12,378 (100.0%) | 35,899 (100.0%) |
Monthly Housing Cost Tiers in Hartford
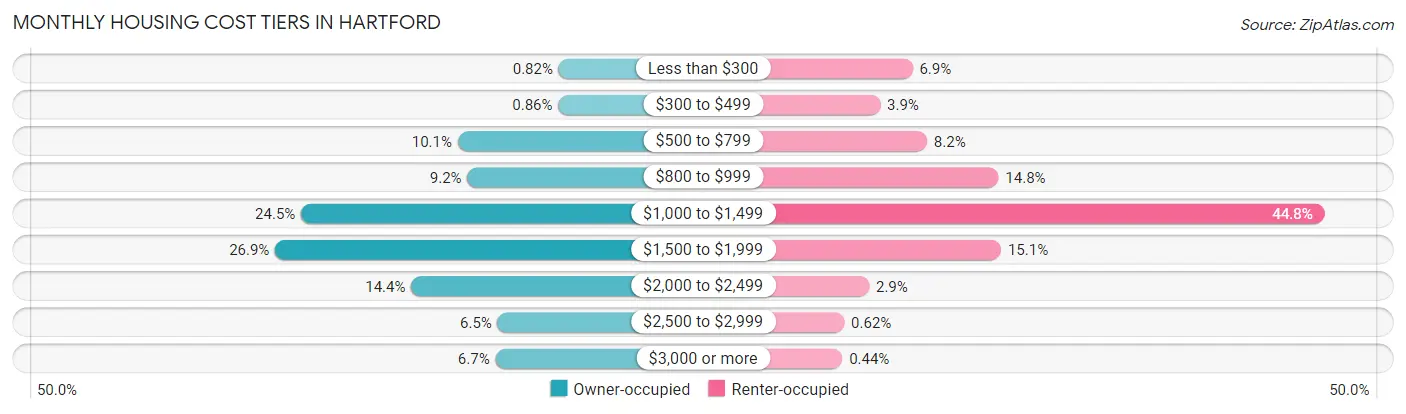
| Monthly Cost | Owner-occupied | Renter-occupied |
| Less than $300 | 101 (0.8%) | 2,479 (6.9%) |
| $300 to $499 | 107 (0.9%) | 1,410 (3.9%) |
| $500 to $799 | 1,253 (10.1%) | 2,957 (8.2%) |
| $800 to $999 | 1,142 (9.2%) | 5,320 (14.8%) |
| $1,000 to $1,499 | 3,038 (24.5%) | 16,096 (44.8%) |
| $1,500 to $1,999 | 3,334 (26.9%) | 5,408 (15.1%) |
| $2,000 to $2,499 | 1,782 (14.4%) | 1,043 (2.9%) |
| $2,500 to $2,999 | 798 (6.5%) | 223 (0.6%) |
| $3,000 or more | 823 (6.7%) | 157 (0.4%) |
| Total | 12,378 (100.0%) | 35,899 (100.0%) |
Physical Housing Characteristics in Hartford
Housing Structures in Hartford
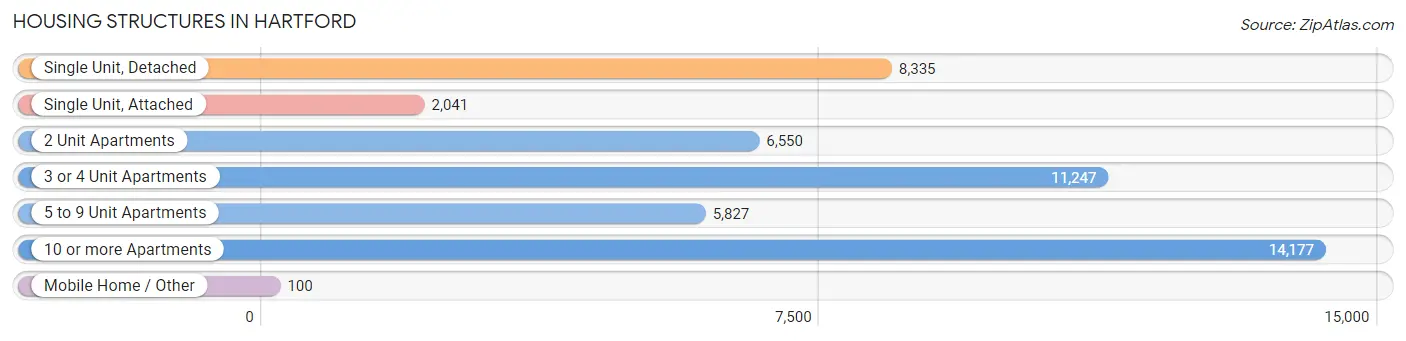
| Structure Type | # Housing Units | % Housing Units |
| Single Unit, Detached | 8,335 | 17.3% |
| Single Unit, Attached | 2,041 | 4.2% |
| 2 Unit Apartments | 6,550 | 13.6% |
| 3 or 4 Unit Apartments | 11,247 | 23.3% |
| 5 to 9 Unit Apartments | 5,827 | 12.1% |
| 10 or more Apartments | 14,177 | 29.4% |
| Mobile Home / Other | 100 | 0.2% |
| Total | 48,277 | 100.0% |
Housing Structures by Occupancy in Hartford
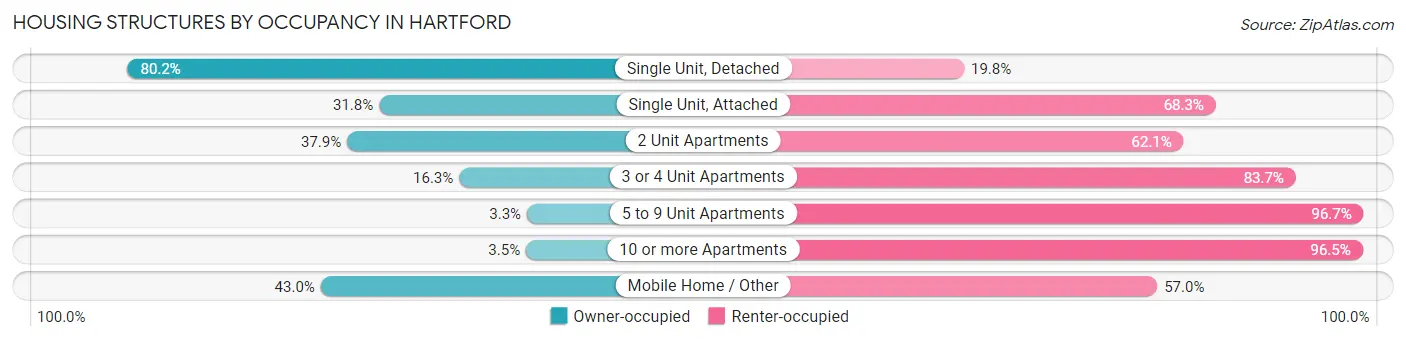
| Structure Type | Owner-occupied | Renter-occupied |
| Single Unit, Detached | 6,684 (80.2%) | 1,651 (19.8%) |
| Single Unit, Attached | 648 (31.8%) | 1,393 (68.2%) |
| 2 Unit Apartments | 2,484 (37.9%) | 4,066 (62.1%) |
| 3 or 4 Unit Apartments | 1,838 (16.3%) | 9,409 (83.7%) |
| 5 to 9 Unit Apartments | 191 (3.3%) | 5,636 (96.7%) |
| 10 or more Apartments | 490 (3.5%) | 13,687 (96.5%) |
| Mobile Home / Other | 43 (43.0%) | 57 (57.0%) |
| Total | 12,378 (25.6%) | 35,899 (74.4%) |
Housing Structures by Number of Rooms in Hartford
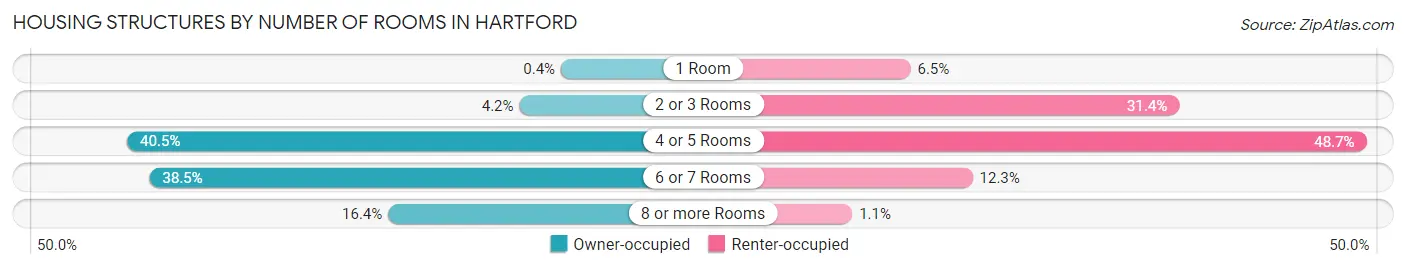
| Number of Rooms | Owner-occupied | Renter-occupied |
| 1 Room | 49 (0.4%) | 2,345 (6.5%) |
| 2 or 3 Rooms | 525 (4.2%) | 11,261 (31.4%) |
| 4 or 5 Rooms | 5,016 (40.5%) | 17,480 (48.7%) |
| 6 or 7 Rooms | 4,761 (38.5%) | 4,404 (12.3%) |
| 8 or more Rooms | 2,027 (16.4%) | 409 (1.1%) |
| Total | 12,378 (100.0%) | 35,899 (100.0%) |
Housing Structure by Heating Type in Hartford
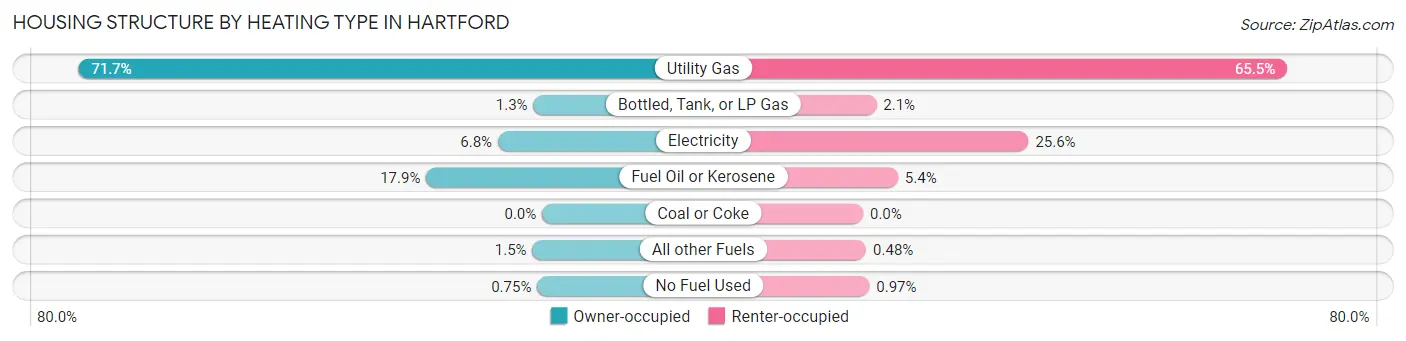
| Heating Type | Owner-occupied | Renter-occupied |
| Utility Gas | 8,873 (71.7%) | 23,524 (65.5%) |
| Bottled, Tank, or LP Gas | 166 (1.3%) | 740 (2.1%) |
| Electricity | 845 (6.8%) | 9,181 (25.6%) |
| Fuel Oil or Kerosene | 2,217 (17.9%) | 1,935 (5.4%) |
| Coal or Coke | 0 (0.0%) | 0 (0.0%) |
| All other Fuels | 184 (1.5%) | 171 (0.5%) |
| No Fuel Used | 93 (0.7%) | 348 (1.0%) |
| Total | 12,378 (100.0%) | 35,899 (100.0%) |
Household Vehicle Usage in Hartford
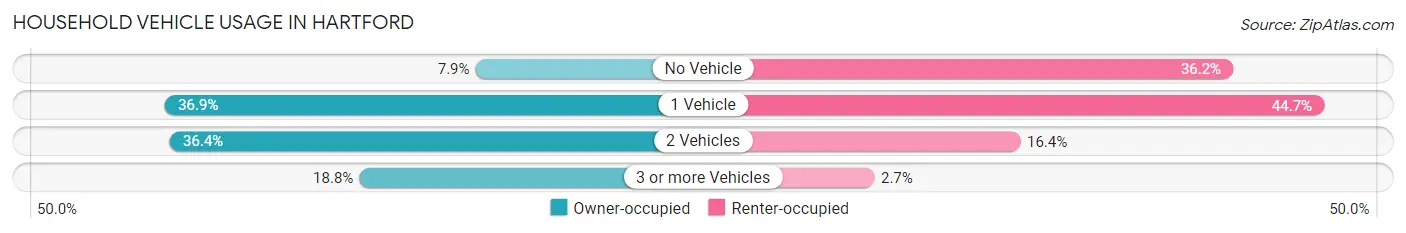
| Vehicles per Household | Owner-occupied | Renter-occupied |
| No Vehicle | 980 (7.9%) | 13,002 (36.2%) |
| 1 Vehicle | 4,566 (36.9%) | 16,052 (44.7%) |
| 2 Vehicles | 4,509 (36.4%) | 5,870 (16.4%) |
| 3 or more Vehicles | 2,323 (18.8%) | 975 (2.7%) |
| Total | 12,378 (100.0%) | 35,899 (100.0%) |
Real Estate & Mortgages in Hartford
Real Estate and Mortgage Overview in Hartford
| Characteristic | Without Mortgage | With Mortgage |
| Housing Units | 3,155 | 9,223 |
| Median Property Value | $191,400 | $200,400 |
| Median Household Income | $66,893 | $1,843 |
| Monthly Housing Costs | $892 | $807 |
| Real Estate Taxes | $4,405 | $283 |
Property Value by Mortgage Status in Hartford
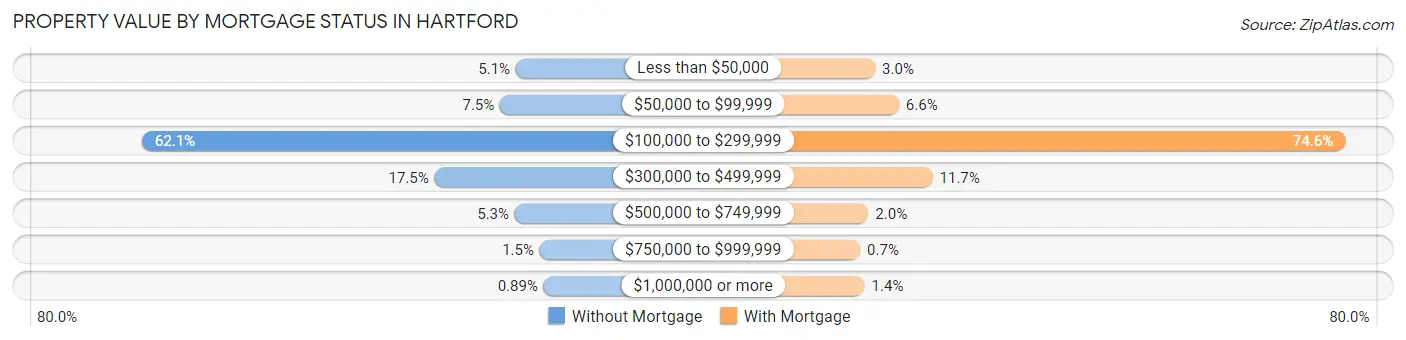
| Property Value | Without Mortgage | With Mortgage |
| Less than $50,000 | 162 (5.1%) | 276 (3.0%) |
| $50,000 to $99,999 | 238 (7.5%) | 610 (6.6%) |
| $100,000 to $299,999 | 1,960 (62.1%) | 6,880 (74.6%) |
| $300,000 to $499,999 | 553 (17.5%) | 1,083 (11.7%) |
| $500,000 to $749,999 | 167 (5.3%) | 181 (2.0%) |
| $750,000 to $999,999 | 47 (1.5%) | 65 (0.7%) |
| $1,000,000 or more | 28 (0.9%) | 128 (1.4%) |
| Total | 3,155 (100.0%) | 9,223 (100.0%) |
Household Income by Mortgage Status in Hartford
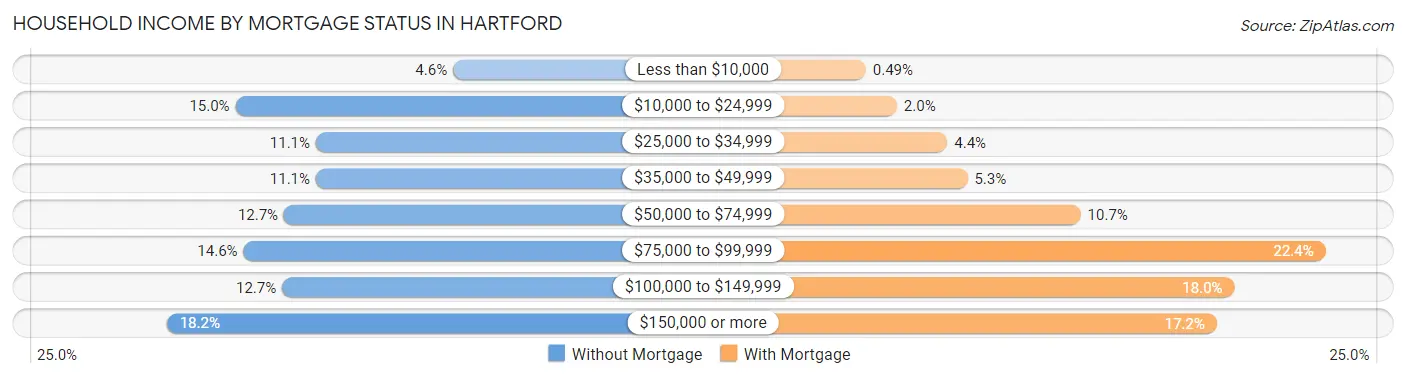
| Household Income | Without Mortgage | With Mortgage |
| Less than $10,000 | 145 (4.6%) | 45 (0.5%) |
| $10,000 to $24,999 | 472 (15.0%) | 182 (2.0%) |
| $25,000 to $34,999 | 351 (11.1%) | 403 (4.4%) |
| $35,000 to $49,999 | 351 (11.1%) | 492 (5.3%) |
| $50,000 to $74,999 | 399 (12.7%) | 989 (10.7%) |
| $75,000 to $99,999 | 460 (14.6%) | 2,064 (22.4%) |
| $100,000 to $149,999 | 402 (12.7%) | 1,664 (18.0%) |
| $150,000 or more | 575 (18.2%) | 1,586 (17.2%) |
| Total | 3,155 (100.0%) | 9,223 (100.0%) |
Property Value to Household Income Ratio in Hartford
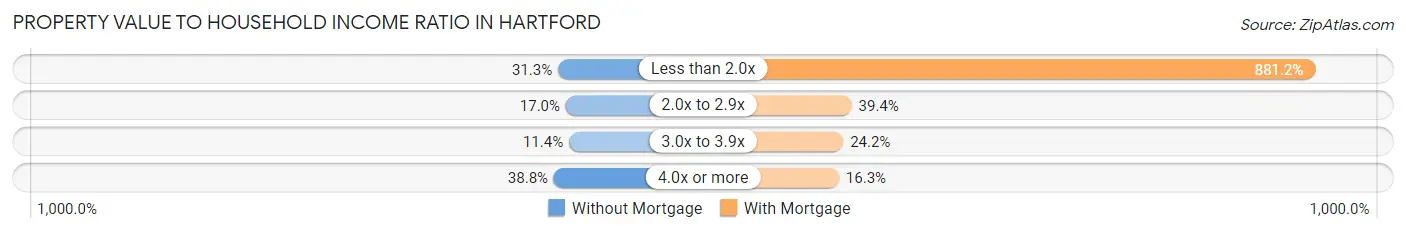
| Value-to-Income Ratio | Without Mortgage | With Mortgage |
| Less than 2.0x | 987 (31.3%) | 81,275 (881.2%) |
| 2.0x to 2.9x | 535 (17.0%) | 3,637 (39.4%) |
| 3.0x to 3.9x | 359 (11.4%) | 2,227 (24.1%) |
| 4.0x or more | 1,223 (38.8%) | 1,502 (16.3%) |
| Total | 3,155 (100.0%) | 9,223 (100.0%) |
Real Estate Taxes by Mortgage Status in Hartford
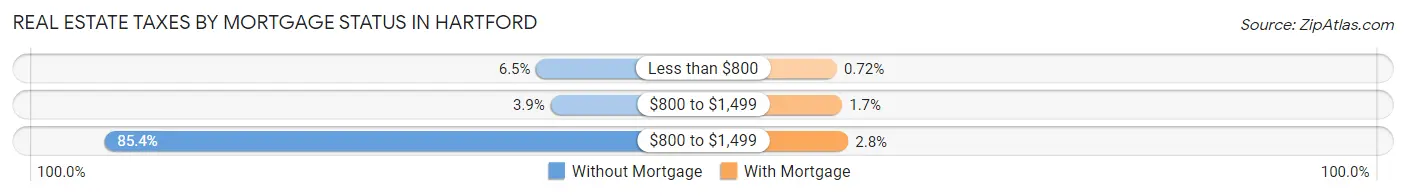
| Property Taxes | Without Mortgage | With Mortgage |
| Less than $800 | 206 (6.5%) | 66 (0.7%) |
| $800 to $1,499 | 124 (3.9%) | 156 (1.7%) |
| $800 to $1,499 | 2,695 (85.4%) | 257 (2.8%) |
| Total | 3,155 (100.0%) | 9,223 (100.0%) |
Health & Disability in Hartford
Health Insurance Coverage by Age in Hartford
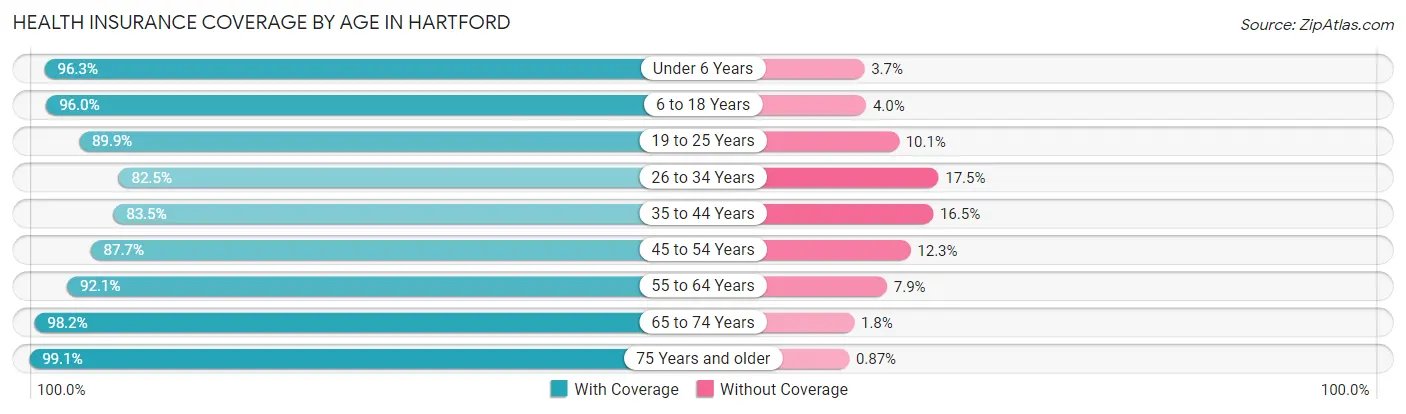
| Age Bracket | With Coverage | Without Coverage |
| Under 6 Years | 7,944 (96.3%) | 307 (3.7%) |
| 6 to 18 Years | 21,067 (96.0%) | 886 (4.0%) |
| 19 to 25 Years | 14,453 (89.9%) | 1,631 (10.1%) |
| 26 to 34 Years | 13,597 (82.5%) | 2,890 (17.5%) |
| 35 to 44 Years | 13,362 (83.5%) | 2,649 (16.5%) |
| 45 to 54 Years | 12,915 (87.7%) | 1,815 (12.3%) |
| 55 to 64 Years | 11,132 (92.1%) | 959 (7.9%) |
| 65 to 74 Years | 8,329 (98.2%) | 154 (1.8%) |
| 75 Years and older | 4,782 (99.1%) | 42 (0.9%) |
| Total | 107,581 (90.5%) | 11,333 (9.5%) |
Health Insurance Coverage by Citizenship Status in Hartford
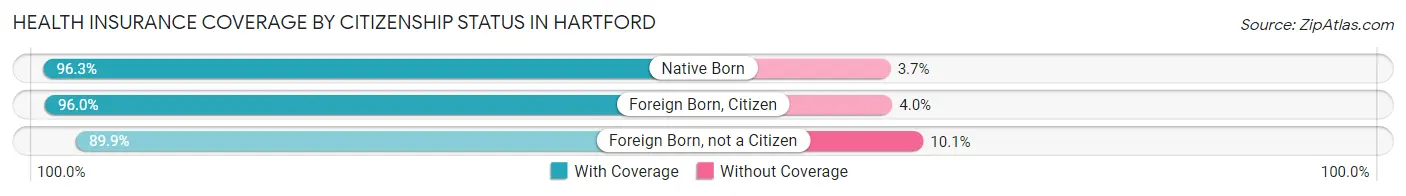
| Citizenship Status | With Coverage | Without Coverage |
| Native Born | 7,944 (96.3%) | 307 (3.7%) |
| Foreign Born, Citizen | 21,067 (96.0%) | 886 (4.0%) |
| Foreign Born, not a Citizen | 14,453 (89.9%) | 1,631 (10.1%) |
Health Insurance Coverage by Household Income in Hartford
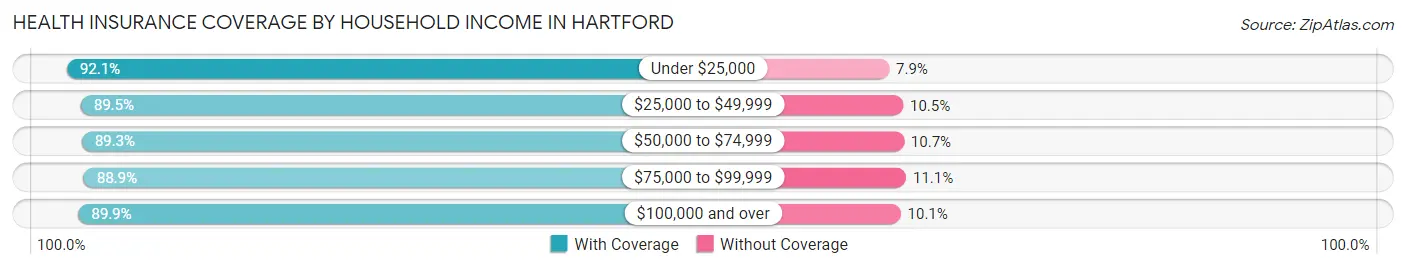
| Household Income | With Coverage | Without Coverage |
| Under $25,000 | 25,006 (92.1%) | 2,155 (7.9%) |
| $25,000 to $49,999 | 24,488 (89.5%) | 2,884 (10.5%) |
| $50,000 to $74,999 | 17,334 (89.3%) | 2,077 (10.7%) |
| $75,000 to $99,999 | 11,724 (88.9%) | 1,464 (11.1%) |
| $100,000 and over | 23,175 (89.9%) | 2,598 (10.1%) |
Public vs Private Health Insurance Coverage by Age in Hartford
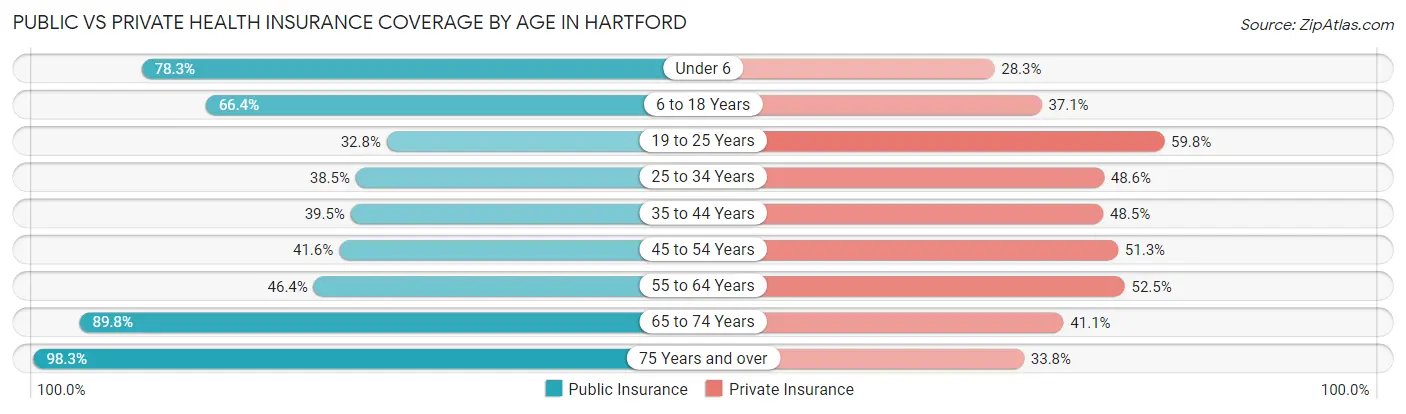
| Age Bracket | Public Insurance | Private Insurance |
| Under 6 | 6,458 (78.3%) | 2,336 (28.3%) |
| 6 to 18 Years | 14,571 (66.4%) | 8,136 (37.1%) |
| 19 to 25 Years | 5,273 (32.8%) | 9,621 (59.8%) |
| 25 to 34 Years | 6,352 (38.5%) | 8,017 (48.6%) |
| 35 to 44 Years | 6,319 (39.5%) | 7,763 (48.5%) |
| 45 to 54 Years | 6,132 (41.6%) | 7,549 (51.2%) |
| 55 to 64 Years | 5,604 (46.4%) | 6,347 (52.5%) |
| 65 to 74 Years | 7,618 (89.8%) | 3,489 (41.1%) |
| 75 Years and over | 4,744 (98.3%) | 1,630 (33.8%) |
| Total | 63,071 (53.0%) | 54,888 (46.2%) |
Disability Status by Sex by Age in Hartford
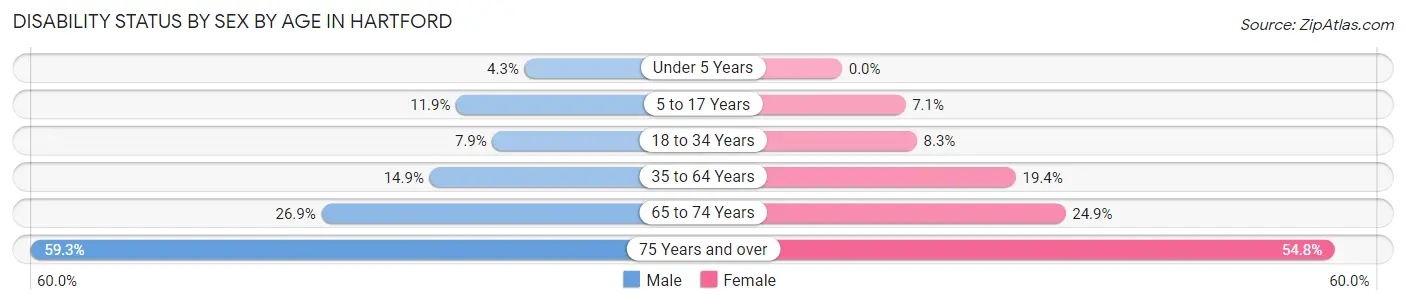
| Age Bracket | Male | Female |
| Under 5 Years | 148 (4.3%) | 0 (0.0%) |
| 5 to 17 Years | 1,281 (11.9%) | 742 (7.1%) |
| 18 to 34 Years | 1,389 (7.9%) | 1,442 (8.3%) |
| 35 to 64 Years | 2,881 (14.9%) | 4,541 (19.4%) |
| 65 to 74 Years | 930 (26.9%) | 1,252 (24.9%) |
| 75 Years and over | 1,063 (59.3%) | 1,661 (54.8%) |
Disability Class by Sex by Age in Hartford
Disability Class: Hearing Difficulty
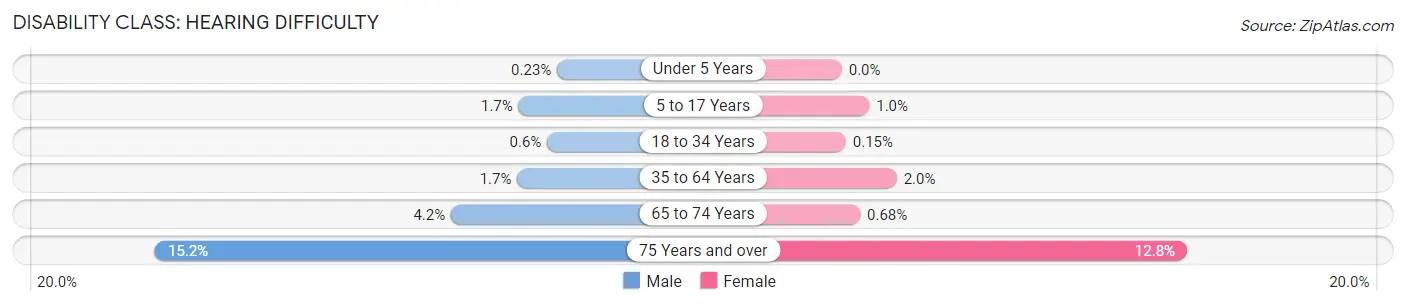
| Age Bracket | Male | Female |
| Under 5 Years | 8 (0.2%) | 0 (0.0%) |
| 5 to 17 Years | 178 (1.7%) | 107 (1.0%) |
| 18 to 34 Years | 105 (0.6%) | 26 (0.2%) |
| 35 to 64 Years | 332 (1.7%) | 478 (2.0%) |
| 65 to 74 Years | 144 (4.2%) | 34 (0.7%) |
| 75 Years and over | 272 (15.2%) | 388 (12.8%) |
Disability Class: Vision Difficulty
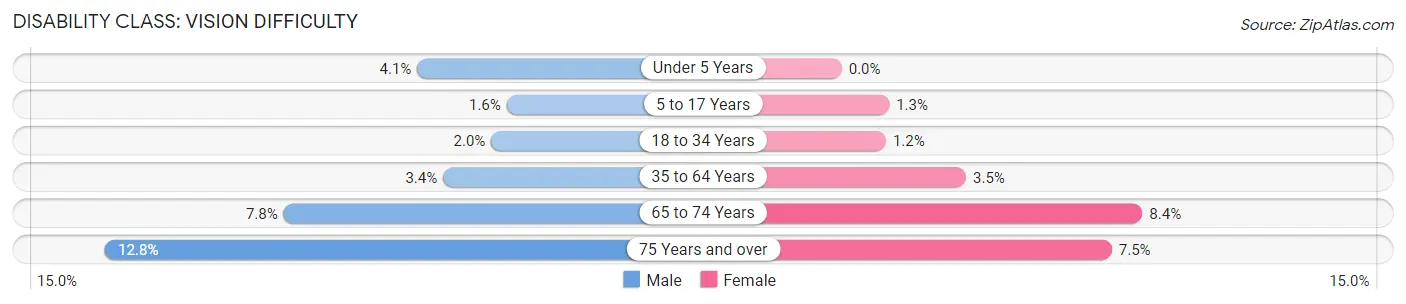
| Age Bracket | Male | Female |
| Under 5 Years | 140 (4.1%) | 0 (0.0%) |
| 5 to 17 Years | 170 (1.6%) | 139 (1.3%) |
| 18 to 34 Years | 355 (2.0%) | 213 (1.2%) |
| 35 to 64 Years | 648 (3.4%) | 813 (3.5%) |
| 65 to 74 Years | 269 (7.8%) | 421 (8.4%) |
| 75 Years and over | 229 (12.8%) | 228 (7.5%) |
Disability Class: Cognitive Difficulty
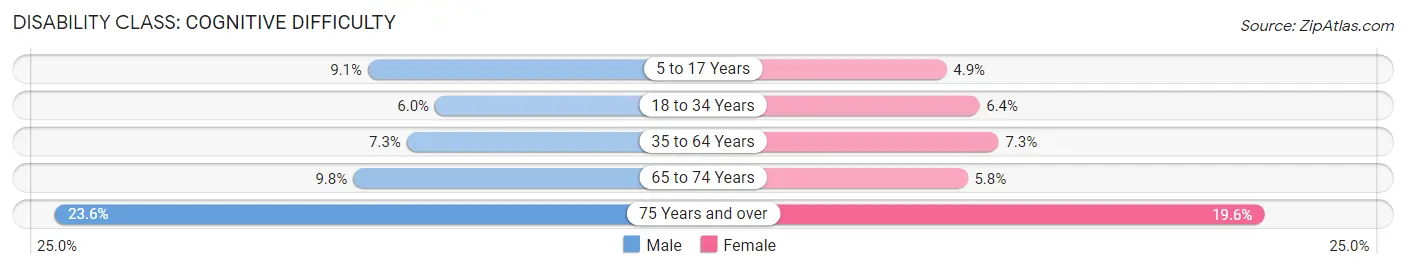
| Age Bracket | Male | Female |
| 5 to 17 Years | 975 (9.1%) | 510 (4.9%) |
| 18 to 34 Years | 1,050 (6.0%) | 1,105 (6.4%) |
| 35 to 64 Years | 1,407 (7.3%) | 1,707 (7.3%) |
| 65 to 74 Years | 337 (9.8%) | 293 (5.8%) |
| 75 Years and over | 423 (23.6%) | 594 (19.6%) |
Disability Class: Ambulatory Difficulty
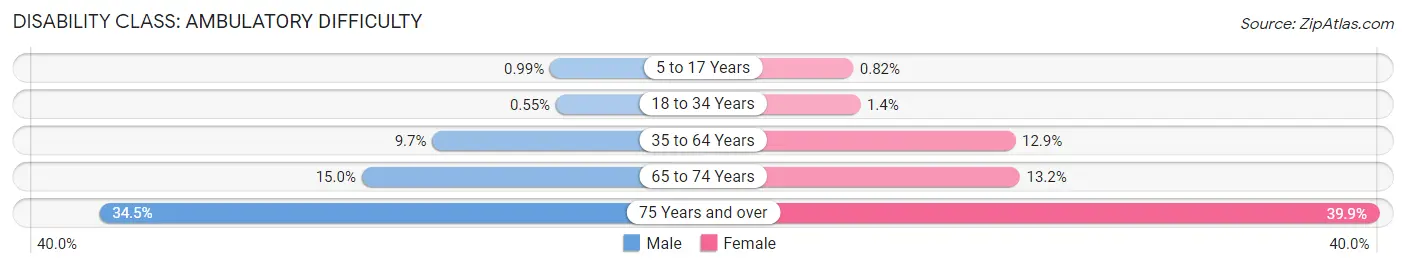
| Age Bracket | Male | Female |
| 5 to 17 Years | 106 (1.0%) | 86 (0.8%) |
| 18 to 34 Years | 97 (0.5%) | 234 (1.3%) |
| 35 to 64 Years | 1,884 (9.7%) | 3,018 (12.9%) |
| 65 to 74 Years | 517 (15.0%) | 664 (13.2%) |
| 75 Years and over | 618 (34.4%) | 1,208 (39.9%) |
Disability Class: Self-Care Difficulty
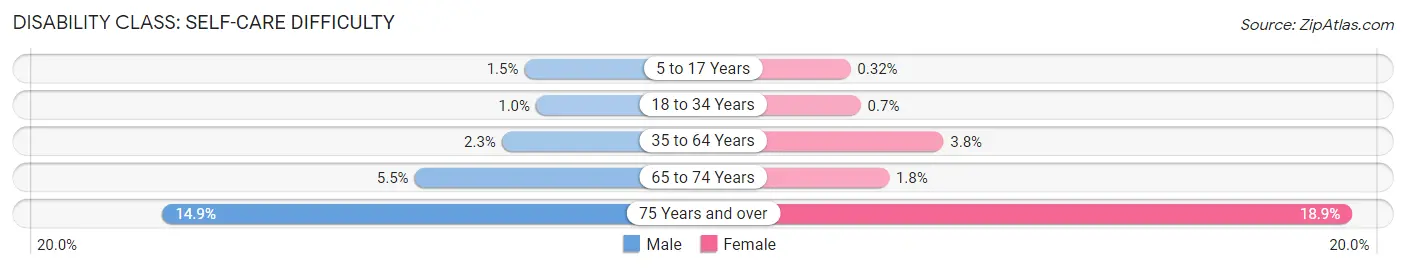
| Age Bracket | Male | Female |
| 5 to 17 Years | 156 (1.5%) | 34 (0.3%) |
| 18 to 34 Years | 180 (1.0%) | 121 (0.7%) |
| 35 to 64 Years | 443 (2.3%) | 884 (3.8%) |
| 65 to 74 Years | 191 (5.5%) | 88 (1.8%) |
| 75 Years and over | 267 (14.9%) | 574 (18.9%) |
Technology Access in Hartford
Computing Device Access in Hartford
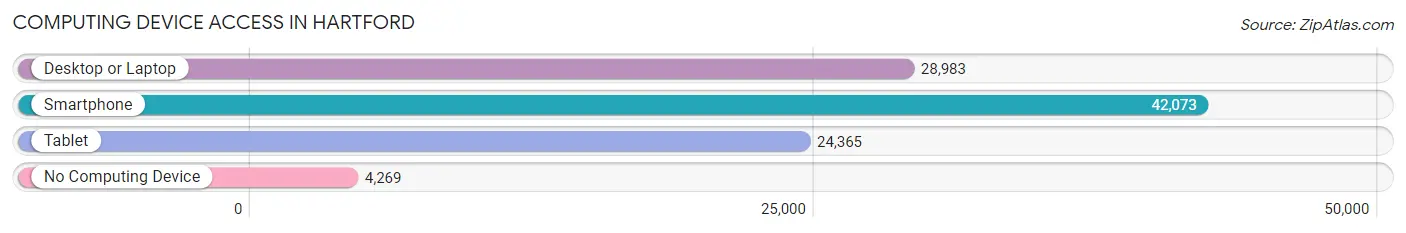
| Device Type | # Households | % Households |
| Desktop or Laptop | 28,983 | 60.0% |
| Smartphone | 42,073 | 87.2% |
| Tablet | 24,365 | 50.5% |
| No Computing Device | 4,269 | 8.8% |
| Total | 48,277 | 100.0% |
Internet Access in Hartford
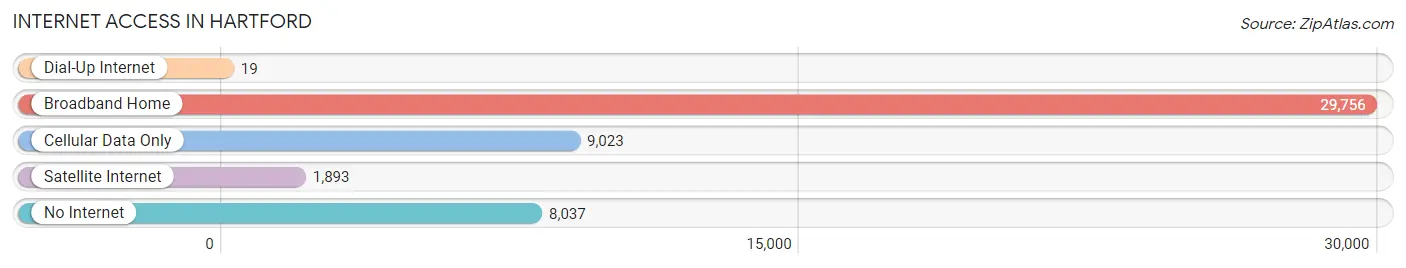
| Internet Type | # Households | % Households |
| Dial-Up Internet | 19 | 0.0% |
| Broadband Home | 29,756 | 61.6% |
| Cellular Data Only | 9,023 | 18.7% |
| Satellite Internet | 1,893 | 3.9% |
| No Internet | 8,037 | 16.7% |
| Total | 48,277 | 100.0% |
Hartford Summary
Hartford, Connecticut is the capital of the state of Connecticut and the county seat of Hartford County. It is located in the north-central part of the state, on the Connecticut River, and is the fourth-largest city in the state. Hartford is the economic and cultural center of the Hartford-Springfield metropolitan area, which is home to nearly one million people.
History
Hartford was founded in 1635 by settlers from the Massachusetts Bay Colony. The settlers named the area after Hertford, England, and the city was incorporated in 1784. During the Revolutionary War, Hartford was a major center of activity, and the city was the site of the signing of the Charter of the United States of America in 1787.
In the 19th century, Hartford was a major industrial center, and the city was home to several major insurance companies, including Aetna, Travelers, and Hartford Fire Insurance. The city was also home to several major manufacturing companies, including Colt Firearms and the Royal Typewriter Company.
Geography
Hartford is located in north-central Connecticut, on the west bank of the Connecticut River. The city is bordered by the towns of West Hartford, East Hartford, Wethersfield, and Windsor. The city covers an area of 18.4 square miles, and has an elevation of 33 feet.
The city is located in a humid continental climate zone, with hot, humid summers and cold, snowy winters. The average annual temperature is 48°F, and the average annual precipitation is 44 inches.
Economy
Hartford is the economic and cultural center of the Hartford-Springfield metropolitan area, which is home to nearly one million people. The city is home to several major corporations, including Aetna, The Hartford, United Technologies, and Travelers. The city is also home to several major universities, including the University of Connecticut, Trinity College, and the University of Hartford.
The city's economy is largely based on the service sector, with healthcare, education, and finance being the largest industries. The city is also home to several major cultural institutions, including the Wadsworth Atheneum, the Hartford Stage Company, and the Bushnell Center for the Performing Arts.
Demographics
As of the 2010 census, Hartford had a population of 124,775. The racial makeup of the city was 44.3% White, 37.3% African American, 0.4% Native American, 8.2% Asian, 0.1% Pacific Islander, and 9.7% from other races. The median household income was $30,848, and the median family income was $37,811.
The city is home to a large immigrant population, with nearly 20% of the population being foreign-born. The largest ethnic groups are Puerto Ricans, Dominicans, and Mexicans. The city is also home to a large LGBT population, with nearly 10% of the population identifying as LGBT.
Common Questions
What is Per Capita Income in Hartford?
Per Capita income in Hartford is $25,229.
What is the Median Family Income in Hartford?
Median Family Income in Hartford is $49,771.
What is the Median Household income in Hartford?
Median Household Income in Hartford is $41,841.
What is Income or Wage Gap in Hartford?
Income or Wage Gap in Hartford is 15.5%.
Women in Hartford earn 84.5 cents for every dollar earned by a man.
What is Family Income Deficit in Hartford?
Family Income Deficit in Hartford is $11,248.
Families that are below poverty line in Hartford earn $11,248 less on average than the poverty threshold level.
What is Inequality or Gini Index in Hartford?
Inequality or Gini Index in Hartford is 0.51.
What is the Total Population of Hartford?
Total Population of Hartford is 121,057.
What is the Total Male Population of Hartford?
Total Male Population of Hartford is 58,021.
What is the Total Female Population of Hartford?
Total Female Population of Hartford is 63,036.
What is the Ratio of Males per 100 Females in Hartford?
There are 92.04 Males per 100 Females in Hartford.
What is the Ratio of Females per 100 Males in Hartford?
There are 108.64 Females per 100 Males in Hartford.
What is the Median Population Age in Hartford?
Median Population Age in Hartford is 33.1 Years.
What is the Average Family Size in Hartford
Average Family Size in Hartford is 3.2 People.
What is the Average Household Size in Hartford
Average Household Size in Hartford is 2.3 People.
How Large is the Labor Force in Hartford?
There are 60,075 People in the Labor Forcein in Hartford.
What is the Percentage of People in the Labor Force in Hartford?
62.5% of People are in the Labor Force in Hartford.
What is the Unemployment Rate in Hartford?
Unemployment Rate in Hartford is 10.6%.