Goshen, IN Map & Demographics
Goshen Map
Goshen Overview
$25,908
PER CAPITA INCOME
$65,331
AVG FAMILY INCOME
$52,233
AVG HOUSEHOLD INCOME
24.9%
WAGE / INCOME GAP [ % ]
75.1¢/ $1
WAGE / INCOME GAP [ $ ]
$9,255
FAMILY INCOME DEFICIT
0.42
INEQUALITY / GINI INDEX
34,704
TOTAL POPULATION
16,691
MALE POPULATION
18,013
FEMALE POPULATION
92.66
MALES / 100 FEMALES
107.92
FEMALES / 100 MALES
38.0
MEDIAN AGE
3.5
AVG FAMILY SIZE
2.6
AVG HOUSEHOLD SIZE
16,157
LABOR FORCE [ PEOPLE ]
60.3%
PERCENT IN LABOR FORCE
4.8%
UNEMPLOYMENT RATE
Goshen Area Codes
Income in Goshen
Income Overview in Goshen
Per Capita Income in Goshen is $25,908, while median incomes of families and households are $65,331 and $52,233 respectively.
| Characteristic | Number | Measure |
| Per Capita Income | 34,704 | $25,908 |
| Median Family Income | 7,700 | $65,331 |
| Mean Family Income | 7,700 | $80,162 |
| Median Household Income | 12,614 | $52,233 |
| Mean Household Income | 12,614 | $67,253 |
| Income Deficit | 7,700 | $9,255 |
| Wage / Income Gap (%) | 34,704 | 24.87% |
| Wage / Income Gap ($) | 34,704 | 75.13¢ per $1 |
| Gini / Inequality Index | 34,704 | 0.42 |
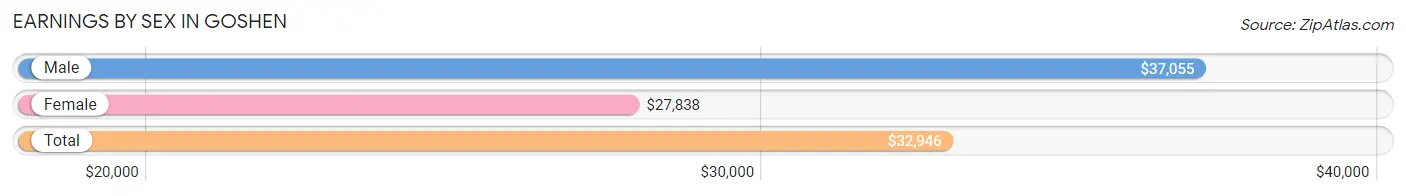
Earnings by Sex in Goshen
Average Earnings in Goshen are $32,946, $37,055 for men and $27,838 for women, a difference of 24.9%.
| Sex | Number | Average Earnings |
| Male | 9,108 (52.9%) | $37,055 |
| Female | 8,106 (47.1%) | $27,838 |
| Total | 17,214 (100.0%) | $32,946 |
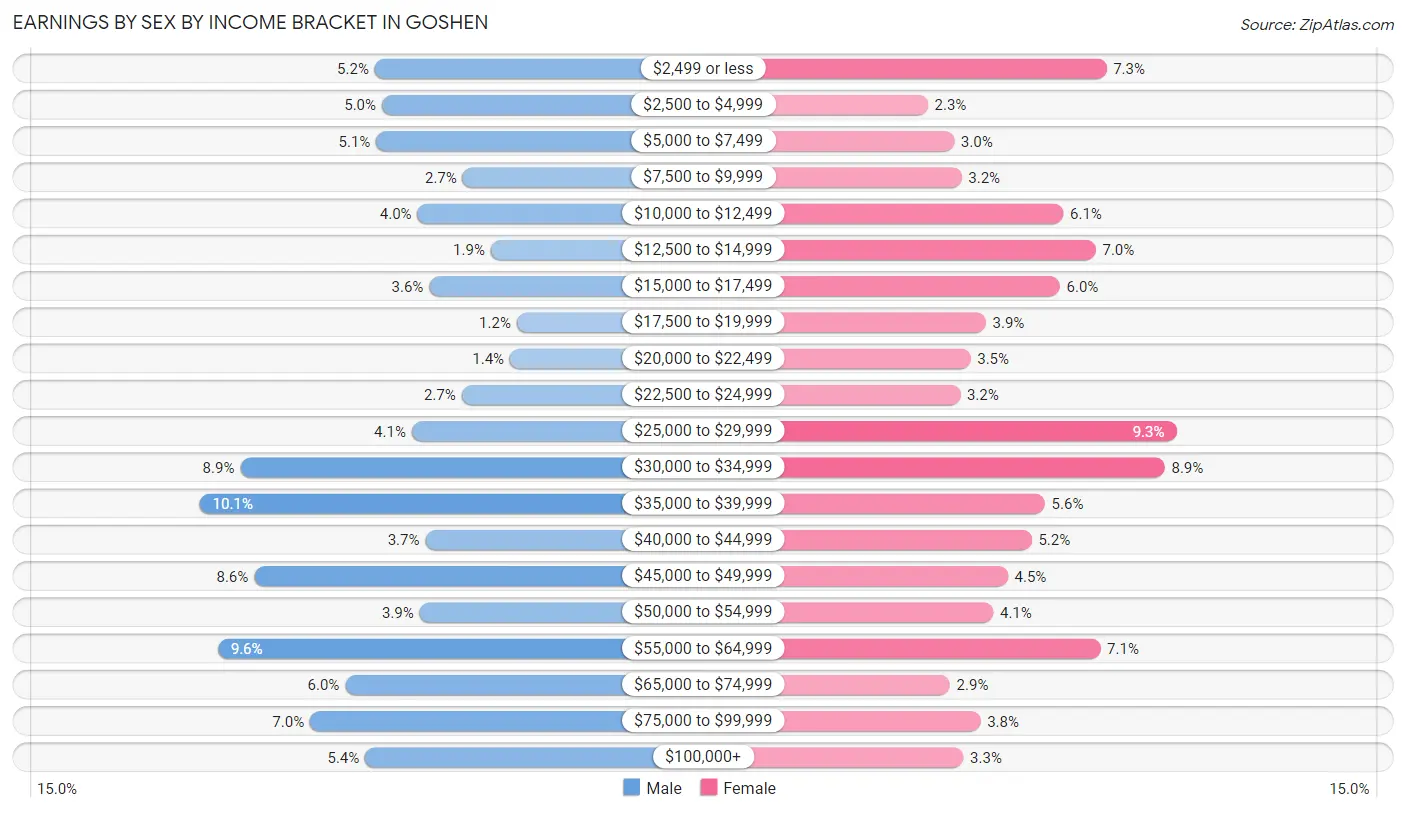
Earnings by Sex by Income Bracket in Goshen
The most common earnings brackets in Goshen are $35,000 to $39,999 for men (918 | 10.1%) and $25,000 to $29,999 for women (751 | 9.3%).
| Income | Male | Female |
| $2,499 or less | 470 (5.2%) | 591 (7.3%) |
| $2,500 to $4,999 | 452 (5.0%) | 184 (2.3%) |
| $5,000 to $7,499 | 466 (5.1%) | 244 (3.0%) |
| $7,500 to $9,999 | 245 (2.7%) | 261 (3.2%) |
| $10,000 to $12,499 | 361 (4.0%) | 493 (6.1%) |
| $12,500 to $14,999 | 173 (1.9%) | 567 (7.0%) |
| $15,000 to $17,499 | 331 (3.6%) | 485 (6.0%) |
| $17,500 to $19,999 | 107 (1.2%) | 316 (3.9%) |
| $20,000 to $22,499 | 124 (1.4%) | 281 (3.5%) |
| $22,500 to $24,999 | 248 (2.7%) | 258 (3.2%) |
| $25,000 to $29,999 | 375 (4.1%) | 751 (9.3%) |
| $30,000 to $34,999 | 814 (8.9%) | 724 (8.9%) |
| $35,000 to $39,999 | 918 (10.1%) | 451 (5.6%) |
| $40,000 to $44,999 | 341 (3.7%) | 421 (5.2%) |
| $45,000 to $49,999 | 779 (8.6%) | 366 (4.5%) |
| $50,000 to $54,999 | 355 (3.9%) | 333 (4.1%) |
| $55,000 to $64,999 | 872 (9.6%) | 577 (7.1%) |
| $65,000 to $74,999 | 546 (6.0%) | 234 (2.9%) |
| $75,000 to $99,999 | 636 (7.0%) | 304 (3.7%) |
| $100,000+ | 495 (5.4%) | 265 (3.3%) |
| Total | 9,108 (100.0%) | 8,106 (100.0%) |
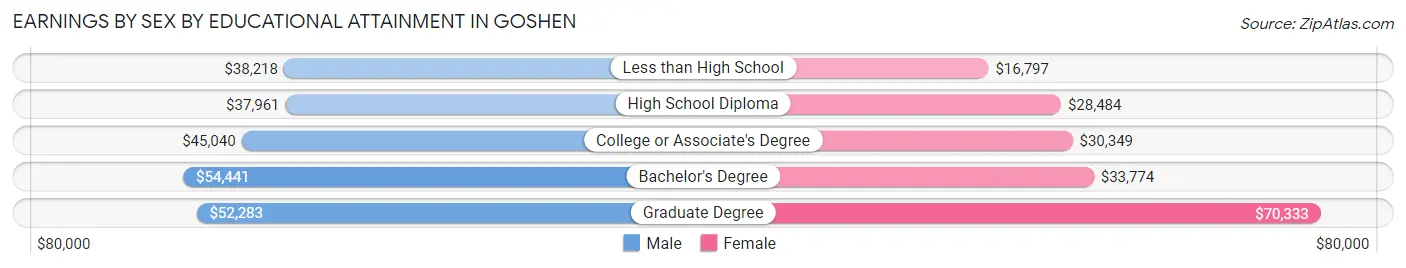
Earnings by Sex by Educational Attainment in Goshen
Average earnings in Goshen are $41,631 for men and $30,309 for women, a difference of 27.2%. Men with an educational attainment of bachelor's degree enjoy the highest average annual earnings of $54,441, while those with high school diploma education earn the least with $37,961. Women with an educational attainment of graduate degree earn the most with the average annual earnings of $70,333, while those with less than high school education have the smallest earnings of $16,797.
| Educational Attainment | Male Income | Female Income |
| Less than High School | $38,218 | $16,797 |
| High School Diploma | $37,961 | $28,484 |
| College or Associate's Degree | $45,040 | $30,349 |
| Bachelor's Degree | $54,441 | $33,774 |
| Graduate Degree | $52,283 | $70,333 |
| Total | $41,631 | $30,309 |
Family Income in Goshen
Family Income Brackets in Goshen
According to the Goshen family income data, there are 1,771 families falling into the $50,000 to $74,999 income range, which is the most common income bracket and makes up 23.0% of all families. Conversely, the less than $10,000 income bracket is the least frequent group with only 185 families (2.4%) belonging to this category.
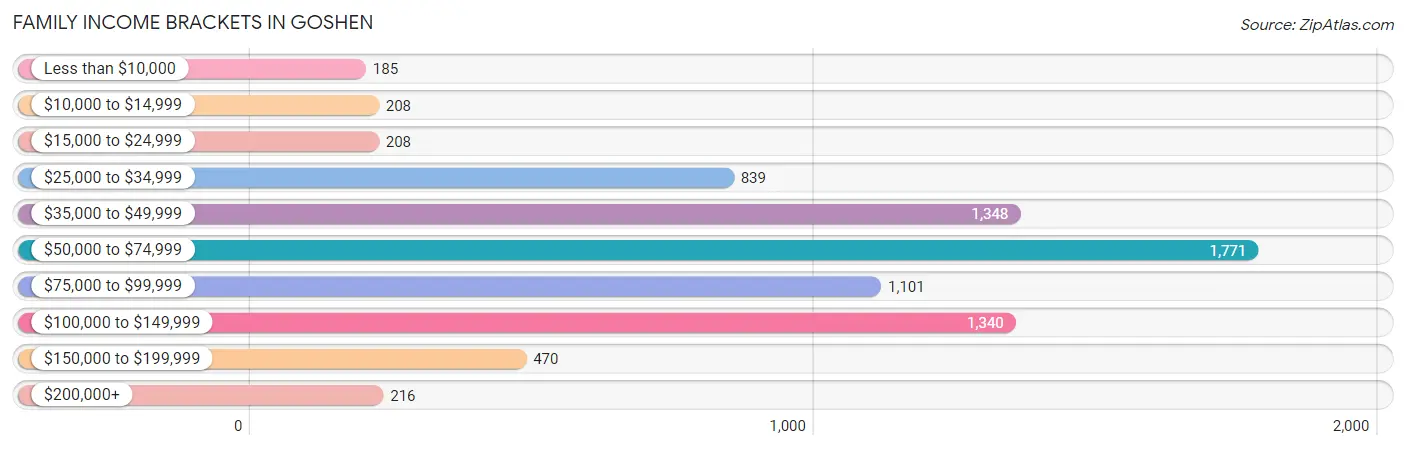
| Income Bracket | # Families | % Families |
| Less than $10,000 | 185 | 2.4% |
| $10,000 to $14,999 | 208 | 2.7% |
| $15,000 to $24,999 | 208 | 2.7% |
| $25,000 to $34,999 | 839 | 10.9% |
| $35,000 to $49,999 | 1,348 | 17.5% |
| $50,000 to $74,999 | 1,771 | 23.0% |
| $75,000 to $99,999 | 1,101 | 14.3% |
| $100,000 to $149,999 | 1,340 | 17.4% |
| $150,000 to $199,999 | 470 | 6.1% |
| $200,000+ | 216 | 2.8% |
Family Income by Famaliy Size in Goshen
4-person families (1,059 | 13.8%) account for the highest median family income in Goshen with $80,313 per family, while 2-person families (3,822 | 49.6%) have the highest median income of $27,951 per family member.
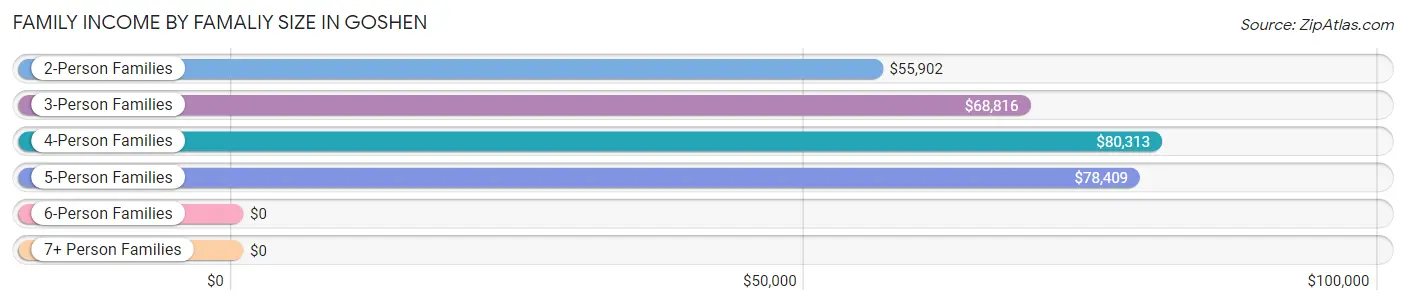
| Income Bracket | # Families | Median Income |
| 2-Person Families | 3,822 (49.6%) | $55,902 |
| 3-Person Families | 1,570 (20.4%) | $68,816 |
| 4-Person Families | 1,059 (13.8%) | $80,313 |
| 5-Person Families | 824 (10.7%) | $78,409 |
| 6-Person Families | 316 (4.1%) | $0 |
| 7+ Person Families | 109 (1.4%) | $0 |
| Total | 7,700 (100.0%) | $65,331 |
Family Income by Number of Earners in Goshen
The median family income in Goshen is $65,331, with families comprising 3+ earners (1,005) having the highest median family income of $126,875, while families with no earners (1,378) have the lowest median family income of $44,000, accounting for 13.1% and 17.9% of families, respectively.
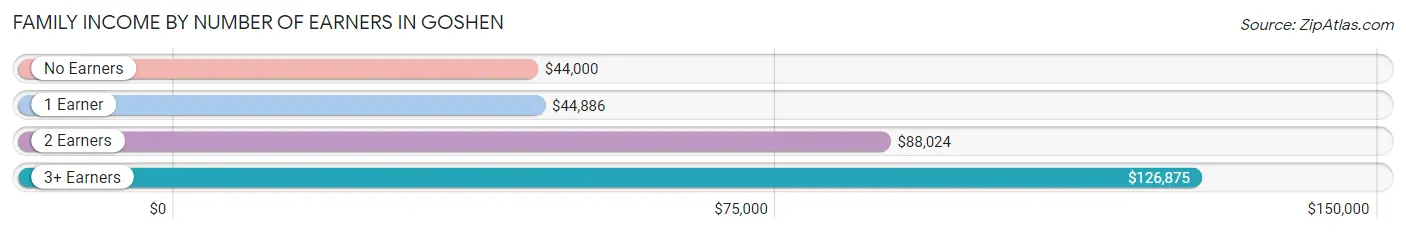
| Number of Earners | # Families | Median Income |
| No Earners | 1,378 (17.9%) | $44,000 |
| 1 Earner | 2,456 (31.9%) | $44,886 |
| 2 Earners | 2,861 (37.2%) | $88,024 |
| 3+ Earners | 1,005 (13.1%) | $126,875 |
| Total | 7,700 (100.0%) | $65,331 |
Household Income in Goshen
Household Income Brackets in Goshen
With 2,510 households falling in the category, the $50,000 to $74,999 income range is the most frequent in Goshen, accounting for 19.9% of all households. In contrast, only 278 households (2.2%) fall into the $200,000+ income bracket, making it the least populous group.
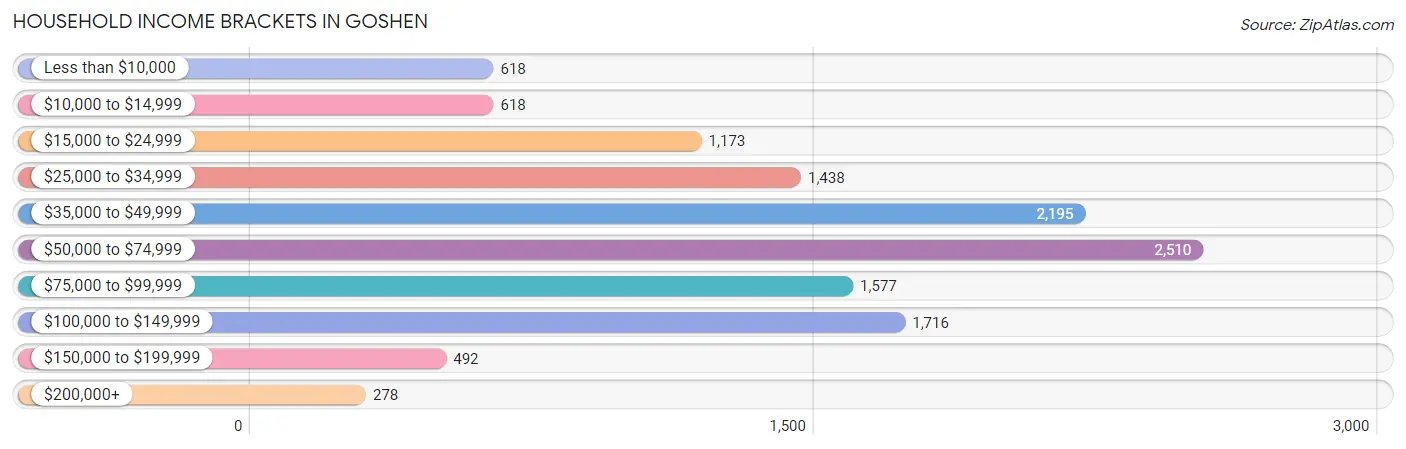
| Income Bracket | # Households | % Households |
| Less than $10,000 | 618 | 4.9% |
| $10,000 to $14,999 | 618 | 4.9% |
| $15,000 to $24,999 | 1,173 | 9.3% |
| $25,000 to $34,999 | 1,438 | 11.4% |
| $35,000 to $49,999 | 2,195 | 17.4% |
| $50,000 to $74,999 | 2,510 | 19.9% |
| $75,000 to $99,999 | 1,577 | 12.5% |
| $100,000 to $149,999 | 1,716 | 13.6% |
| $150,000 to $199,999 | 492 | 3.9% |
| $200,000+ | 278 | 2.2% |
Household Income by Householder Age in Goshen
The median household income in Goshen is $52,233, with the highest median household income of $75,870 found in the 45 to 64 years age bracket for the primary householder. A total of 4,047 households (32.1%) fall into this category. Meanwhile, the 15 to 24 years age bracket for the primary householder has the lowest median household income of $0, with 373 households (3.0%) in this group.
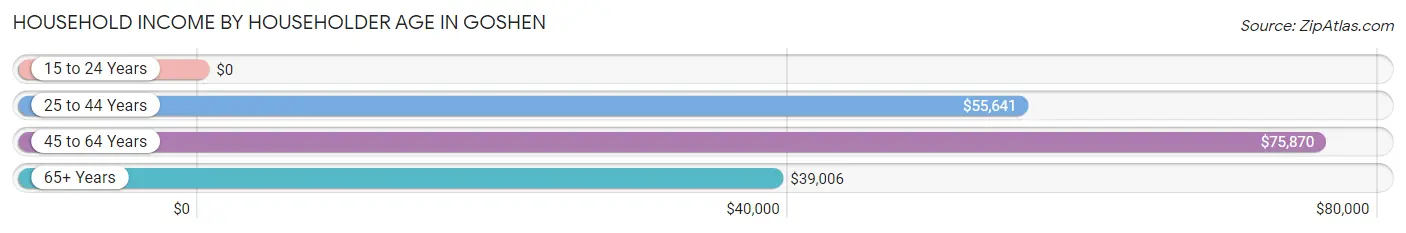
| Income Bracket | # Households | Median Income |
| 15 to 24 Years | 373 (3.0%) | $0 |
| 25 to 44 Years | 3,856 (30.6%) | $55,641 |
| 45 to 64 Years | 4,047 (32.1%) | $75,870 |
| 65+ Years | 4,338 (34.4%) | $39,006 |
| Total | 12,614 (100.0%) | $52,233 |
Poverty in Goshen
Income Below Poverty by Sex and Age in Goshen
With 16.1% poverty level for males and 15.1% for females among the residents of Goshen, 5 year old males and 6 to 11 year old females are the most vulnerable to poverty, with 139 males (57.0%) and 478 females (32.2%) in their respective age groups living below the poverty level.
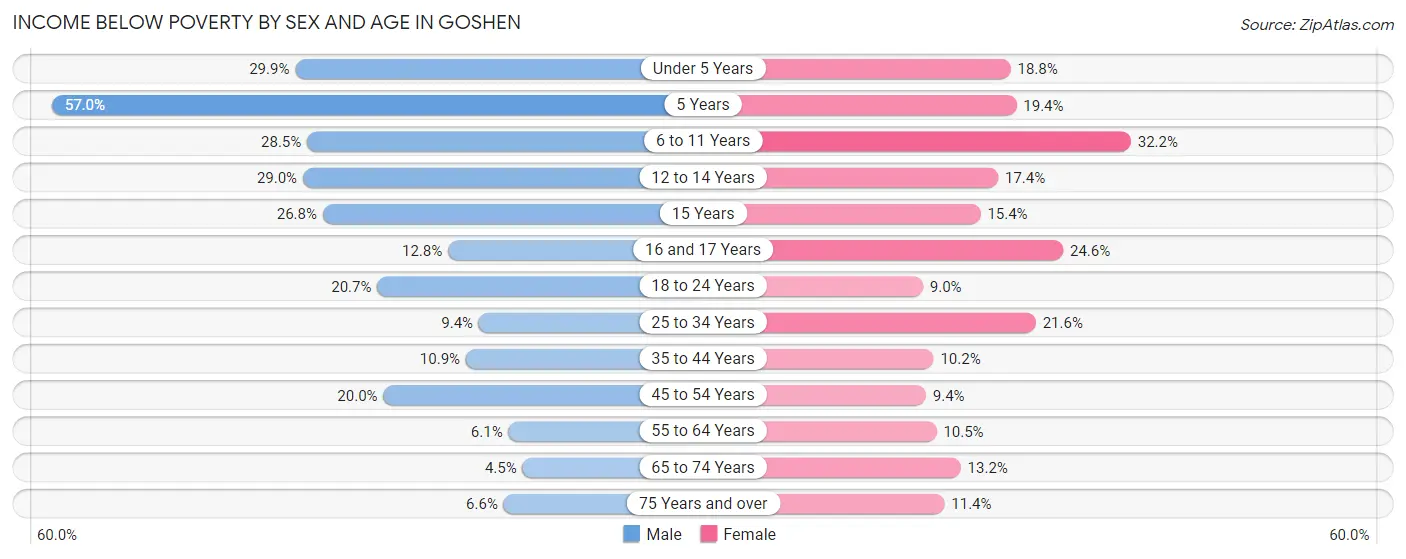
| Age Bracket | Male | Female |
| Under 5 Years | 218 (29.9%) | 233 (18.8%) |
| 5 Years | 139 (57.0%) | 42 (19.4%) |
| 6 to 11 Years | 429 (28.5%) | 478 (32.2%) |
| 12 to 14 Years | 230 (29.0%) | 158 (17.4%) |
| 15 Years | 90 (26.8%) | 42 (15.4%) |
| 16 and 17 Years | 57 (12.8%) | 51 (24.6%) |
| 18 to 24 Years | 398 (20.7%) | 128 (9.0%) |
| 25 to 34 Years | 189 (9.4%) | 435 (21.6%) |
| 35 to 44 Years | 211 (10.8%) | 236 (10.2%) |
| 45 to 54 Years | 397 (20.0%) | 165 (9.4%) |
| 55 to 64 Years | 93 (6.1%) | 191 (10.5%) |
| 65 to 74 Years | 62 (4.5%) | 234 (13.2%) |
| 75 Years and over | 87 (6.6%) | 221 (11.4%) |
| Total | 2,600 (16.1%) | 2,614 (15.1%) |
Income Above Poverty by Sex and Age in Goshen
According to the poverty statistics in Goshen, males aged 65 to 74 years and females aged 18 to 24 years are the age groups that are most secure financially, with 95.5% of males and 91.0% of females in these age groups living above the poverty line.
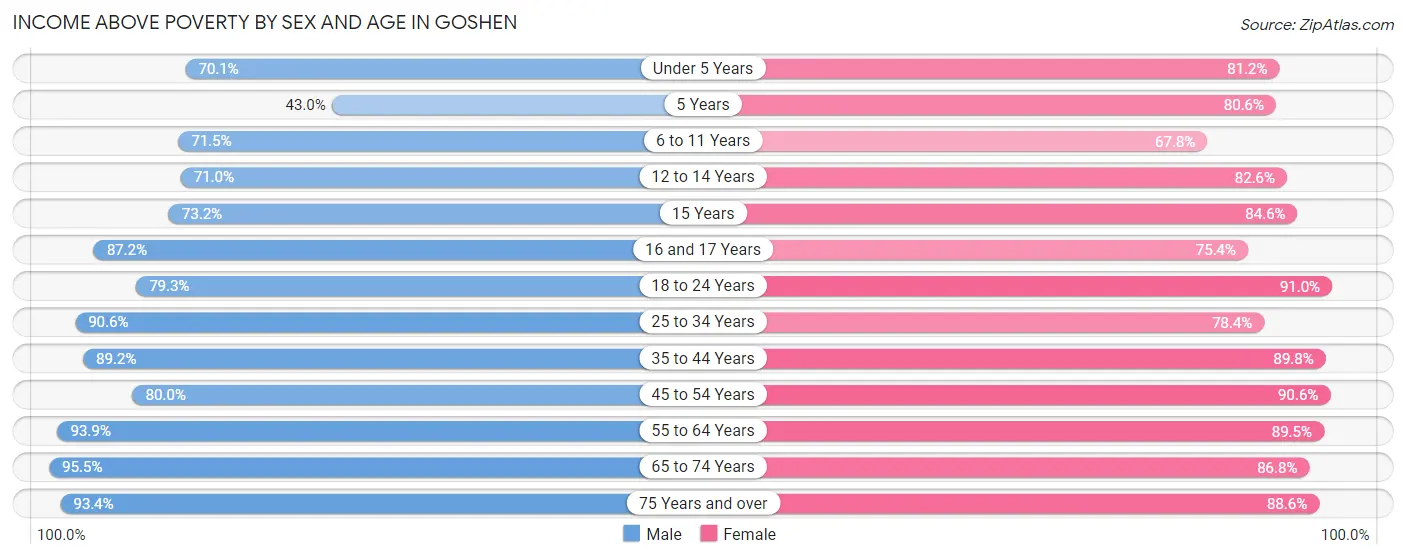
| Age Bracket | Male | Female |
| Under 5 Years | 512 (70.1%) | 1,007 (81.2%) |
| 5 Years | 105 (43.0%) | 174 (80.6%) |
| 6 to 11 Years | 1,074 (71.5%) | 1,007 (67.8%) |
| 12 to 14 Years | 563 (71.0%) | 750 (82.6%) |
| 15 Years | 246 (73.2%) | 230 (84.6%) |
| 16 and 17 Years | 387 (87.2%) | 156 (75.4%) |
| 18 to 24 Years | 1,523 (79.3%) | 1,290 (91.0%) |
| 25 to 34 Years | 1,822 (90.6%) | 1,579 (78.4%) |
| 35 to 44 Years | 1,733 (89.1%) | 2,076 (89.8%) |
| 45 to 54 Years | 1,584 (80.0%) | 1,598 (90.6%) |
| 55 to 64 Years | 1,429 (93.9%) | 1,621 (89.5%) |
| 65 to 74 Years | 1,304 (95.5%) | 1,534 (86.8%) |
| 75 Years and over | 1,223 (93.4%) | 1,714 (88.6%) |
| Total | 13,505 (83.9%) | 14,736 (84.9%) |
Income Below Poverty Among Married-Couple Families in Goshen
The poverty statistics for married-couple families in Goshen show that 5.2% or 301 of the total 5,801 families live below the poverty line. Families with 5 or more children have the highest poverty rate of 100.0%, comprising of 43 families. On the other hand, families with no children have the lowest poverty rate of 3.5%, which includes 127 families.
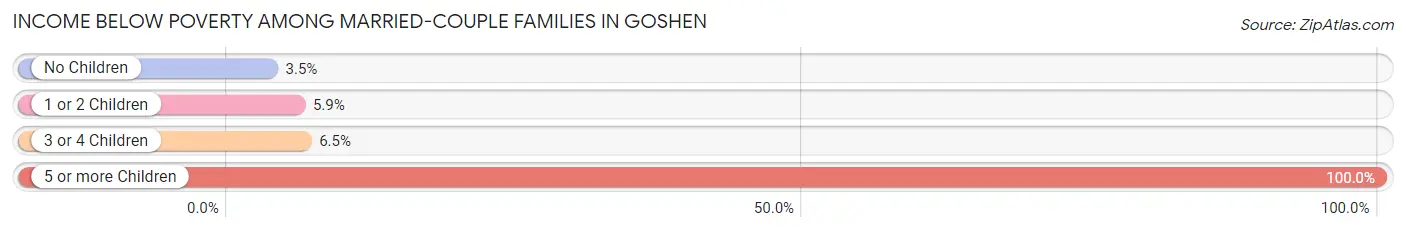
| Children | Above Poverty | Below Poverty |
| No Children | 3,470 (96.5%) | 127 (3.5%) |
| 1 or 2 Children | 1,465 (94.1%) | 92 (5.9%) |
| 3 or 4 Children | 565 (93.5%) | 39 (6.5%) |
| 5 or more Children | 0 (0.0%) | 43 (100.0%) |
| Total | 5,500 (94.8%) | 301 (5.2%) |
Income Below Poverty Among Single-Parent Households in Goshen
According to the poverty data in Goshen, 21.0% or 89 single-father households and 26.9% or 397 single-mother households are living below the poverty line. Among single-father households, those with 1 or 2 children have the highest poverty rate, with 83 households (38.6%) experiencing poverty. Likewise, among single-mother households, those with 5 or more children have the highest poverty rate, with 34 households (100.0%) falling below the poverty line.
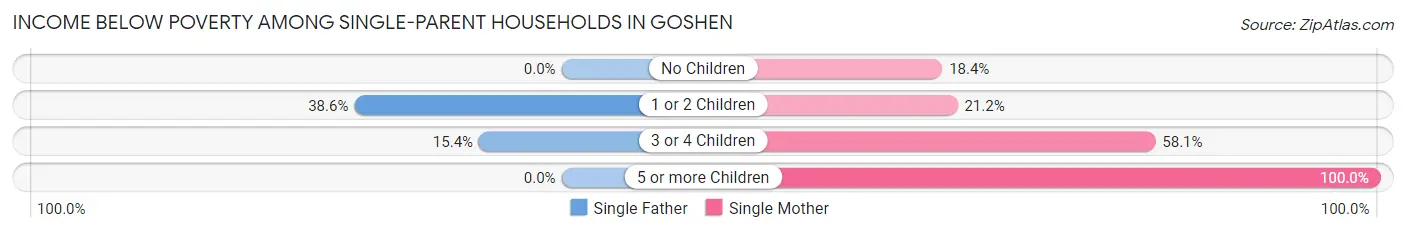
| Children | Single Father | Single Mother |
| No Children | 0 (0.0%) | 71 (18.3%) |
| 1 or 2 Children | 83 (38.6%) | 184 (21.2%) |
| 3 or 4 Children | 6 (15.4%) | 108 (58.1%) |
| 5 or more Children | 0 (0.0%) | 34 (100.0%) |
| Total | 89 (21.0%) | 397 (26.9%) |
Income Below Poverty Among Married-Couple vs Single-Parent Households in Goshen
The poverty data for Goshen shows that 301 of the married-couple family households (5.2%) and 486 of the single-parent households (25.6%) are living below the poverty level. Within the married-couple family households, those with 5 or more children have the highest poverty rate, with 43 households (100.0%) falling below the poverty line. Among the single-parent households, those with 5 or more children have the highest poverty rate, with 34 household (100.0%) living below poverty.
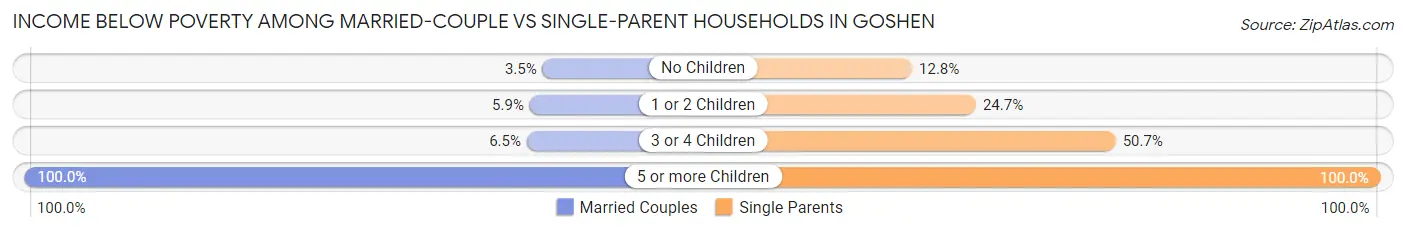
| Children | Married-Couple Families | Single-Parent Households |
| No Children | 127 (3.5%) | 71 (12.8%) |
| 1 or 2 Children | 92 (5.9%) | 267 (24.6%) |
| 3 or 4 Children | 39 (6.5%) | 114 (50.7%) |
| 5 or more Children | 43 (100.0%) | 34 (100.0%) |
| Total | 301 (5.2%) | 486 (25.6%) |
Race in Goshen
The most populous races in Goshen are White / Caucasian (25,662 | 74.0%), Hispanic or Latino (9,037 | 26.0%), and Two or more Races (3,743 | 10.8%).
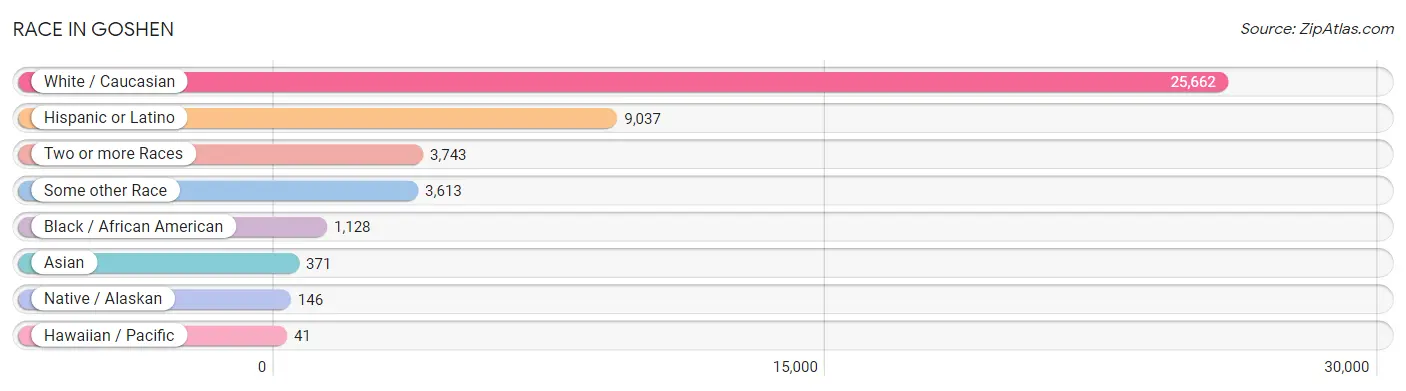
| Race | # Population | % Population |
| Asian | 371 | 1.1% |
| Black / African American | 1,128 | 3.3% |
| Hawaiian / Pacific | 41 | 0.1% |
| Hispanic or Latino | 9,037 | 26.0% |
| Native / Alaskan | 146 | 0.4% |
| White / Caucasian | 25,662 | 74.0% |
| Two or more Races | 3,743 | 10.8% |
| Some other Race | 3,613 | 10.4% |
| Total | 34,704 | 100.0% |
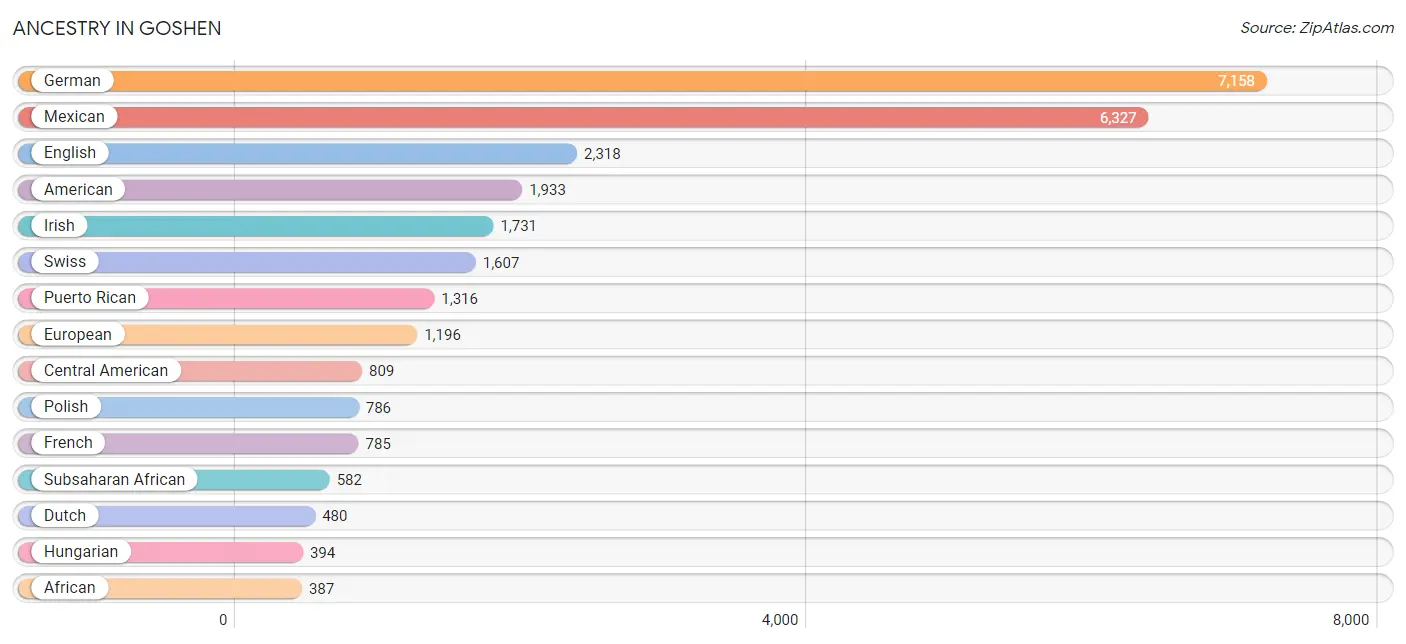
Ancestry in Goshen
The most populous ancestries reported in Goshen are German (7,158 | 20.6%), Mexican (6,327 | 18.2%), English (2,318 | 6.7%), American (1,933 | 5.6%), and Irish (1,731 | 5.0%), together accounting for 56.1% of all Goshen residents.
| Ancestry | # Population | % Population |
| African | 387 | 1.1% |
| American | 1,933 | 5.6% |
| Arab | 37 | 0.1% |
| Argentinean | 18 | 0.1% |
| Austrian | 81 | 0.2% |
| Basque | 20 | 0.1% |
| Belizean | 30 | 0.1% |
| Bhutanese | 3 | 0.0% |
| Bolivian | 40 | 0.1% |
| Brazilian | 3 | 0.0% |
| British | 107 | 0.3% |
| Burmese | 251 | 0.7% |
| Canadian | 16 | 0.1% |
| Central American | 809 | 2.3% |
| Central American Indian | 12 | 0.0% |
| Cherokee | 159 | 0.5% |
| Colombian | 201 | 0.6% |
| Cuban | 19 | 0.1% |
| Czech | 39 | 0.1% |
| Czechoslovakian | 18 | 0.1% |
| Dominican | 22 | 0.1% |
| Dutch | 480 | 1.4% |
| Eastern European | 56 | 0.2% |
| English | 2,318 | 6.7% |
| Estonian | 18 | 0.1% |
| European | 1,196 | 3.5% |
| Finnish | 28 | 0.1% |
| French | 785 | 2.3% |
| French Canadian | 79 | 0.2% |
| German | 7,158 | 20.6% |
| Guatemalan | 332 | 1.0% |
| Honduran | 223 | 0.6% |
| Hungarian | 394 | 1.1% |
| Indian (Asian) | 64 | 0.2% |
| Irish | 1,731 | 5.0% |
| Italian | 269 | 0.8% |
| Jamaican | 9 | 0.0% |
| Kenyan | 35 | 0.1% |
| Korean | 86 | 0.3% |
| Lebanese | 24 | 0.1% |
| Lithuanian | 15 | 0.0% |
| Malaysian | 43 | 0.1% |
| Mexican | 6,327 | 18.2% |
| Mexican American Indian | 63 | 0.2% |
| Northern European | 34 | 0.1% |
| Norwegian | 138 | 0.4% |
| Pennsylvania German | 183 | 0.5% |
| Peruvian | 14 | 0.0% |
| Polish | 786 | 2.3% |
| Portuguese | 8 | 0.0% |
| Puerto Rican | 1,316 | 3.8% |
| Romanian | 9 | 0.0% |
| Russian | 96 | 0.3% |
| Salvadoran | 254 | 0.7% |
| Scandinavian | 89 | 0.3% |
| Scotch-Irish | 174 | 0.5% |
| Scottish | 140 | 0.4% |
| Slovak | 7 | 0.0% |
| South American | 362 | 1.0% |
| Spanish | 20 | 0.1% |
| Sri Lankan | 44 | 0.1% |
| Subsaharan African | 582 | 1.7% |
| Swedish | 164 | 0.5% |
| Swiss | 1,607 | 4.6% |
| Thai | 47 | 0.1% |
| Trinidadian and Tobagonian | 74 | 0.2% |
| Ukrainian | 54 | 0.2% |
| Venezuelan | 89 | 0.3% |
| Welsh | 173 | 0.5% |
| West Indian | 19 | 0.1% | View All 70 Rows |
Immigrants in Goshen
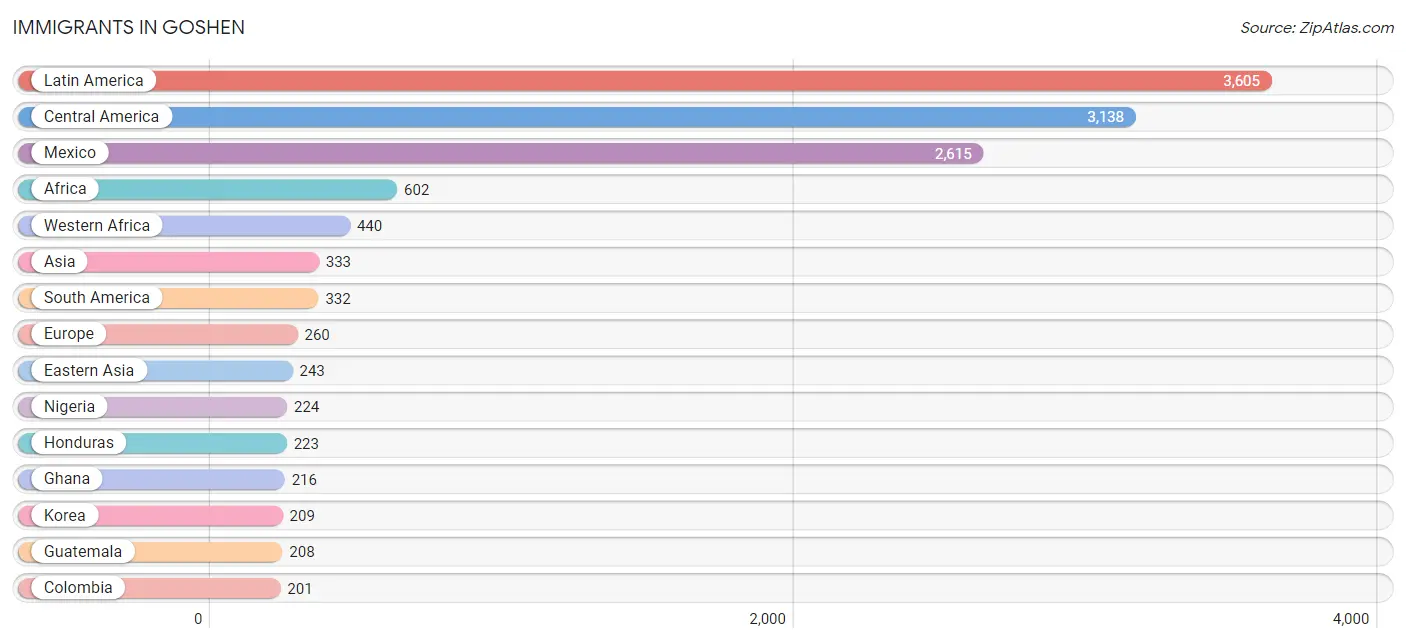
The most numerous immigrant groups reported in Goshen came from Latin America (3,605 | 10.4%), Central America (3,138 | 9.0%), Mexico (2,615 | 7.5%), Africa (602 | 1.7%), and Western Africa (440 | 1.3%), together accounting for 30.0% of all Goshen residents.
| Immigration Origin | # Population | % Population |
| Africa | 602 | 1.7% |
| Argentina | 18 | 0.1% |
| Asia | 333 | 1.0% |
| Australia | 12 | 0.0% |
| Bolivia | 24 | 0.1% |
| Brazil | 3 | 0.0% |
| Canada | 72 | 0.2% |
| Caribbean | 135 | 0.4% |
| Central America | 3,138 | 9.0% |
| China | 34 | 0.1% |
| Colombia | 201 | 0.6% |
| Costa Rica | 41 | 0.1% |
| Cuba | 19 | 0.1% |
| Dominican Republic | 22 | 0.1% |
| Eastern Africa | 15 | 0.0% |
| Eastern Asia | 243 | 0.7% |
| Eastern Europe | 143 | 0.4% |
| El Salvador | 51 | 0.2% |
| Europe | 260 | 0.7% |
| France | 11 | 0.0% |
| Germany | 70 | 0.2% |
| Ghana | 216 | 0.6% |
| Guatemala | 208 | 0.6% |
| Honduras | 223 | 0.6% |
| Hungary | 59 | 0.2% |
| Kenya | 15 | 0.0% |
| Korea | 209 | 0.6% |
| Laos | 28 | 0.1% |
| Latin America | 3,605 | 10.4% |
| Mexico | 2,615 | 7.5% |
| Middle Africa | 59 | 0.2% |
| Nigeria | 224 | 0.6% |
| Northern Europe | 16 | 0.1% |
| Oceania | 12 | 0.0% |
| Peru | 14 | 0.0% |
| Philippines | 34 | 0.1% |
| Poland | 7 | 0.0% |
| Russia | 15 | 0.0% |
| Scotland | 10 | 0.0% |
| South America | 332 | 1.0% |
| South Eastern Asia | 77 | 0.2% |
| Southern Europe | 20 | 0.1% |
| Spain | 20 | 0.1% |
| Trinidad and Tobago | 41 | 0.1% |
| Ukraine | 44 | 0.1% |
| Venezuela | 72 | 0.2% |
| Vietnam | 15 | 0.0% |
| West Indies | 53 | 0.2% |
| Western Africa | 440 | 1.3% |
| Western Asia | 13 | 0.0% |
| Western Europe | 81 | 0.2% |
| Yemen | 13 | 0.0% |
| Zaire | 59 | 0.2% | View All 53 Rows |
Sex and Age in Goshen
Sex and Age in Goshen
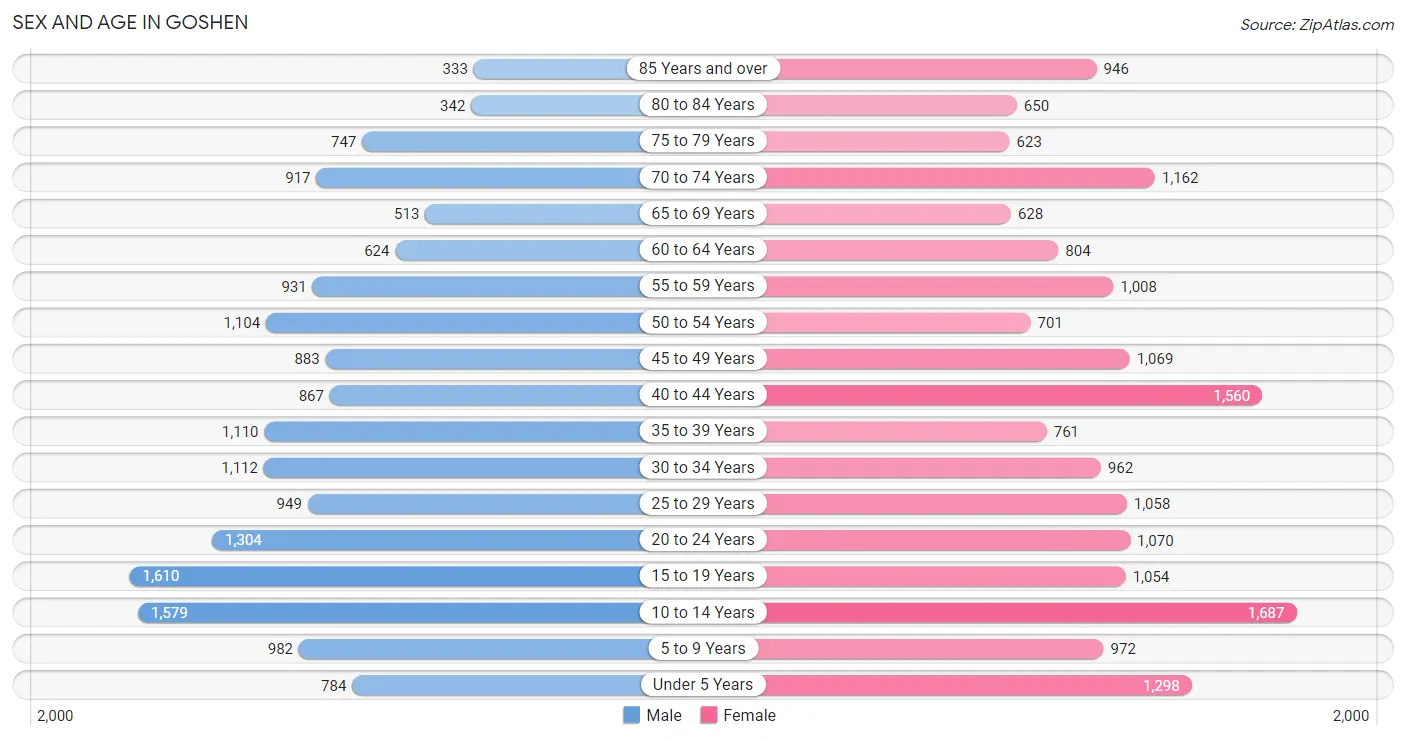
The most populous age groups in Goshen are 15 to 19 Years (1,610 | 9.7%) for men and 10 to 14 Years (1,687 | 9.4%) for women.
| Age Bracket | Male | Female |
| Under 5 Years | 784 (4.7%) | 1,298 (7.2%) |
| 5 to 9 Years | 982 (5.9%) | 972 (5.4%) |
| 10 to 14 Years | 1,579 (9.5%) | 1,687 (9.4%) |
| 15 to 19 Years | 1,610 (9.7%) | 1,054 (5.9%) |
| 20 to 24 Years | 1,304 (7.8%) | 1,070 (5.9%) |
| 25 to 29 Years | 949 (5.7%) | 1,058 (5.9%) |
| 30 to 34 Years | 1,112 (6.7%) | 962 (5.3%) |
| 35 to 39 Years | 1,110 (6.7%) | 761 (4.2%) |
| 40 to 44 Years | 867 (5.2%) | 1,560 (8.7%) |
| 45 to 49 Years | 883 (5.3%) | 1,069 (5.9%) |
| 50 to 54 Years | 1,104 (6.6%) | 701 (3.9%) |
| 55 to 59 Years | 931 (5.6%) | 1,008 (5.6%) |
| 60 to 64 Years | 624 (3.7%) | 804 (4.5%) |
| 65 to 69 Years | 513 (3.1%) | 628 (3.5%) |
| 70 to 74 Years | 917 (5.5%) | 1,162 (6.5%) |
| 75 to 79 Years | 747 (4.5%) | 623 (3.5%) |
| 80 to 84 Years | 342 (2.1%) | 650 (3.6%) |
| 85 Years and over | 333 (2.0%) | 946 (5.2%) |
| Total | 16,691 (100.0%) | 18,013 (100.0%) |
Families and Households in Goshen
Median Family Size in Goshen
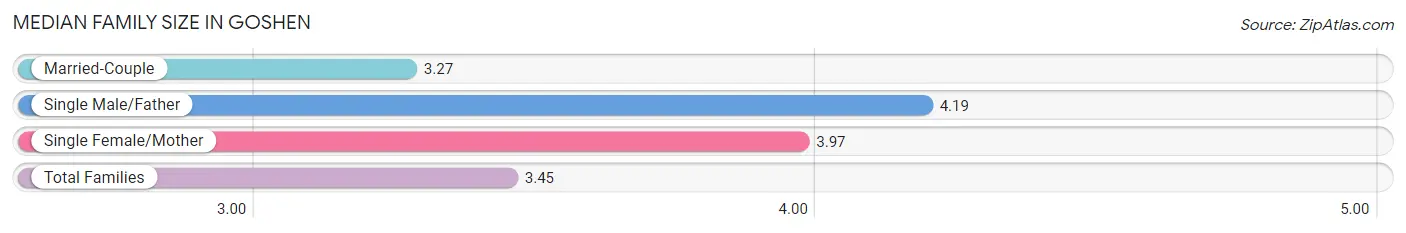
The median family size in Goshen is 3.45 persons per family, with single male/father families (424 | 5.5%) accounting for the largest median family size of 4.19 persons per family. On the other hand, married-couple families (5,801 | 75.3%) represent the smallest median family size with 3.27 persons per family.
| Family Type | # Families | Family Size |
| Married-Couple | 5,801 (75.3%) | 3.27 |
| Single Male/Father | 424 (5.5%) | 4.19 |
| Single Female/Mother | 1,475 (19.2%) | 3.97 |
| Total Families | 7,700 (100.0%) | 3.45 |
Median Household Size in Goshen
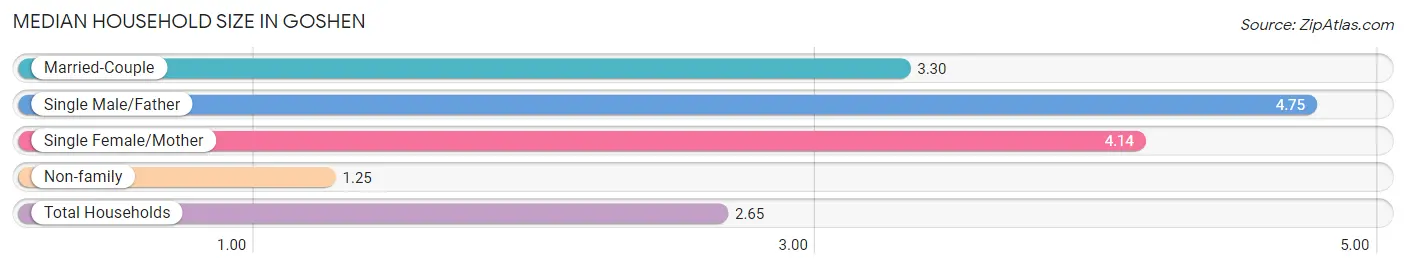
The median household size in Goshen is 2.65 persons per household, with single male/father households (424 | 3.4%) accounting for the largest median household size of 4.75 persons per household. non-family households (4,914 | 39.0%) represent the smallest median household size with 1.25 persons per household.
| Household Type | # Households | Household Size |
| Married-Couple | 5,801 (46.0%) | 3.30 |
| Single Male/Father | 424 (3.4%) | 4.75 |
| Single Female/Mother | 1,475 (11.7%) | 4.14 |
| Non-family | 4,914 (39.0%) | 1.25 |
| Total Households | 12,614 (100.0%) | 2.65 |
Household Size by Marriage Status in Goshen
Out of a total of 12,614 households in Goshen, 7,700 (61.0%) are family households, while 4,914 (39.0%) are nonfamily households. The most numerous type of family households are 2-person households, comprising 3,659, and the most common type of nonfamily households are 1-person households, comprising 4,259.
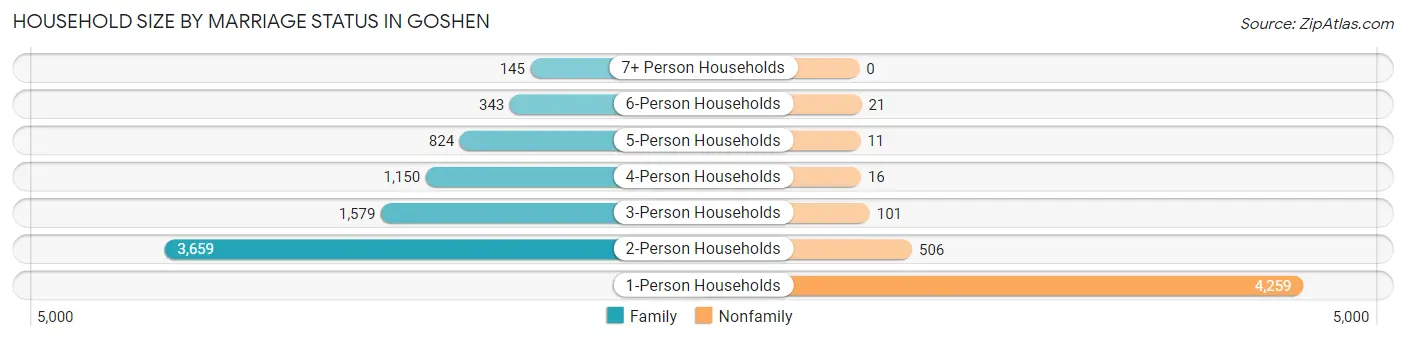
| Household Size | Family Households | Nonfamily Households |
| 1-Person Households | - | 4,259 (33.8%) |
| 2-Person Households | 3,659 (29.0%) | 506 (4.0%) |
| 3-Person Households | 1,579 (12.5%) | 101 (0.8%) |
| 4-Person Households | 1,150 (9.1%) | 16 (0.1%) |
| 5-Person Households | 824 (6.5%) | 11 (0.1%) |
| 6-Person Households | 343 (2.7%) | 21 (0.2%) |
| 7+ Person Households | 145 (1.1%) | 0 (0.0%) |
| Total | 7,700 (61.0%) | 4,914 (39.0%) |
Female Fertility in Goshen
Fertility by Age in Goshen
Average fertility rate in Goshen is 52.0 births per 1,000 women. Women in the age bracket of 20 to 34 years have the highest fertility rate with 89.0 births per 1,000 women. Women in the age bracket of 20 to 34 years acount for 68.1% of all women with births.
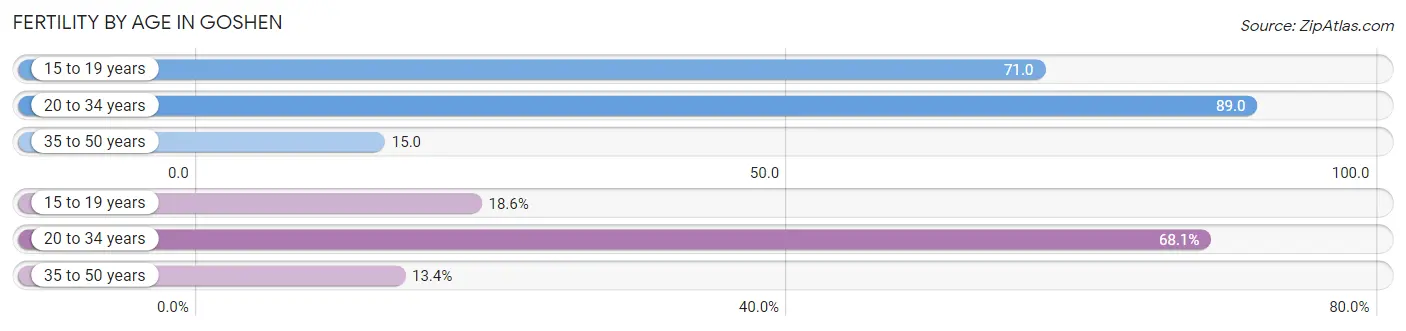
| Age Bracket | Women with Births | Births / 1,000 Women |
| 15 to 19 years | 75 (18.6%) | 71.0 |
| 20 to 34 years | 275 (68.1%) | 89.0 |
| 35 to 50 years | 54 (13.4%) | 15.0 |
| Total | 404 (100.0%) | 52.0 |
Fertility by Age by Marriage Status in Goshen
41.8% of women with births (404) in Goshen are married. The highest percentage of unmarried women with births falls into 15 to 19 years age bracket with 100.0% of them unmarried at the time of birth, while the lowest percentage of unmarried women with births belong to 35 to 50 years age bracket with 1.8% of them unmarried.
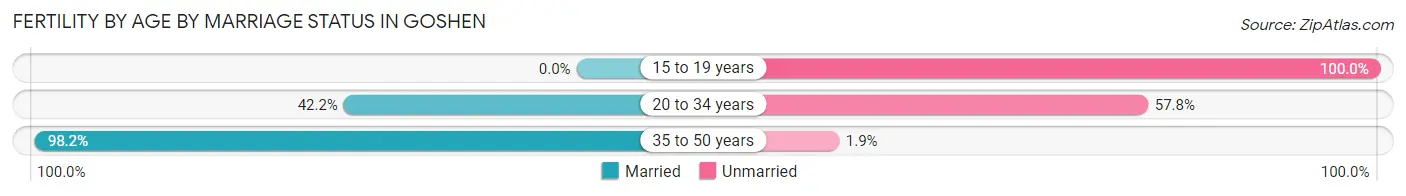
| Age Bracket | Married | Unmarried |
| 15 to 19 years | 0 (0.0%) | 75 (100.0%) |
| 20 to 34 years | 116 (42.2%) | 159 (57.8%) |
| 35 to 50 years | 53 (98.2%) | 1 (1.8%) |
| Total | 169 (41.8%) | 235 (58.2%) |
Fertility by Education in Goshen
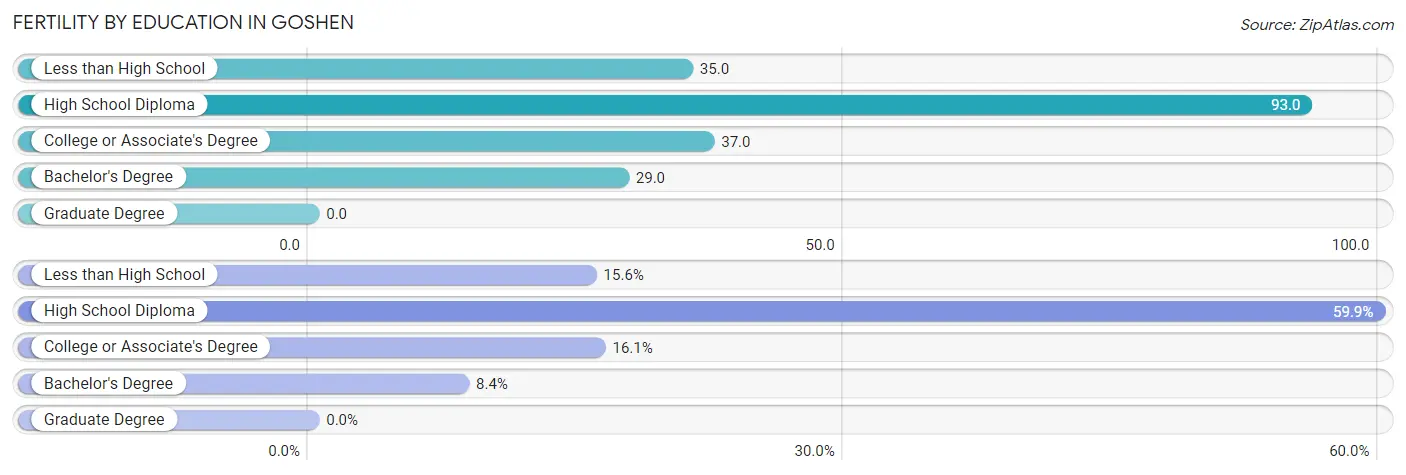
| Educational Attainment | Women with Births | Births / 1,000 Women |
| Less than High School | 63 (15.6%) | 35.0 |
| High School Diploma | 242 (59.9%) | 93.0 |
| College or Associate's Degree | 65 (16.1%) | 37.0 |
| Bachelor's Degree | 34 (8.4%) | 29.0 |
| Graduate Degree | 0 (0.0%) | 0.0 |
| Total | 404 (100.0%) | 52.0 |
Fertility by Education by Marriage Status in Goshen
58.2% of women with births in Goshen are unmarried. Women with the educational attainment of college or associate's degree are most likely to be married with 100.0% of them married at childbirth, while women with the educational attainment of less than high school are least likely to be married with 100.0% of them unmarried at childbirth.
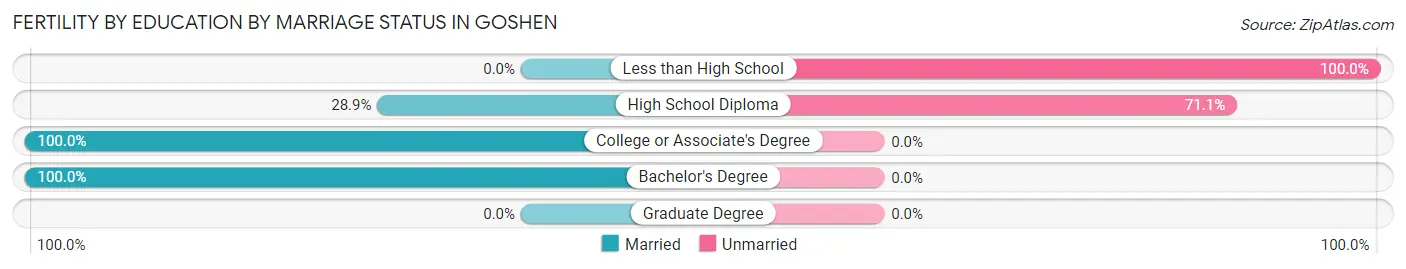
| Educational Attainment | Married | Unmarried |
| Less than High School | 0 (0.0%) | 63 (100.0%) |
| High School Diploma | 70 (28.9%) | 172 (71.1%) |
| College or Associate's Degree | 65 (100.0%) | 0 (0.0%) |
| Bachelor's Degree | 34 (100.0%) | 0 (0.0%) |
| Graduate Degree | 0 (0.0%) | 0 (0.0%) |
| Total | 169 (41.8%) | 235 (58.2%) |
Employment Characteristics in Goshen
Employment by Class of Employer in Goshen
Among the 15,093 employed individuals in Goshen, private company employees (10,520 | 69.7%), not-for-profit organizations (2,205 | 14.6%), and local government employees (787 | 5.2%) make up the most common classes of employment.
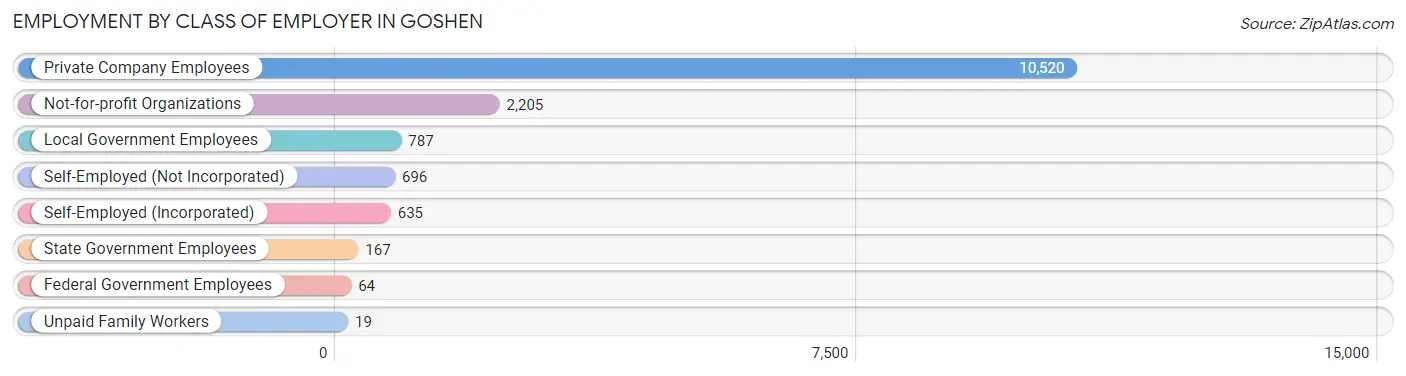
| Employer Class | # Employees | % Employees |
| Private Company Employees | 10,520 | 69.7% |
| Self-Employed (Incorporated) | 635 | 4.2% |
| Self-Employed (Not Incorporated) | 696 | 4.6% |
| Not-for-profit Organizations | 2,205 | 14.6% |
| Local Government Employees | 787 | 5.2% |
| State Government Employees | 167 | 1.1% |
| Federal Government Employees | 64 | 0.4% |
| Unpaid Family Workers | 19 | 0.1% |
| Total | 15,093 | 100.0% |
Employment Status by Age in Goshen
According to the labor force statistics for Goshen, out of the total population over 16 years of age (26,794), 60.3% or 16,157 individuals are in the labor force, with 4.8% or 776 of them unemployed. The age group with the highest labor force participation rate is 25 to 29 years, with 86.1% or 1,728 individuals in the labor force. Within the labor force, the 20 to 24 years age range has the highest percentage of unemployed individuals, with 10.1% or 168 of them being unemployed.
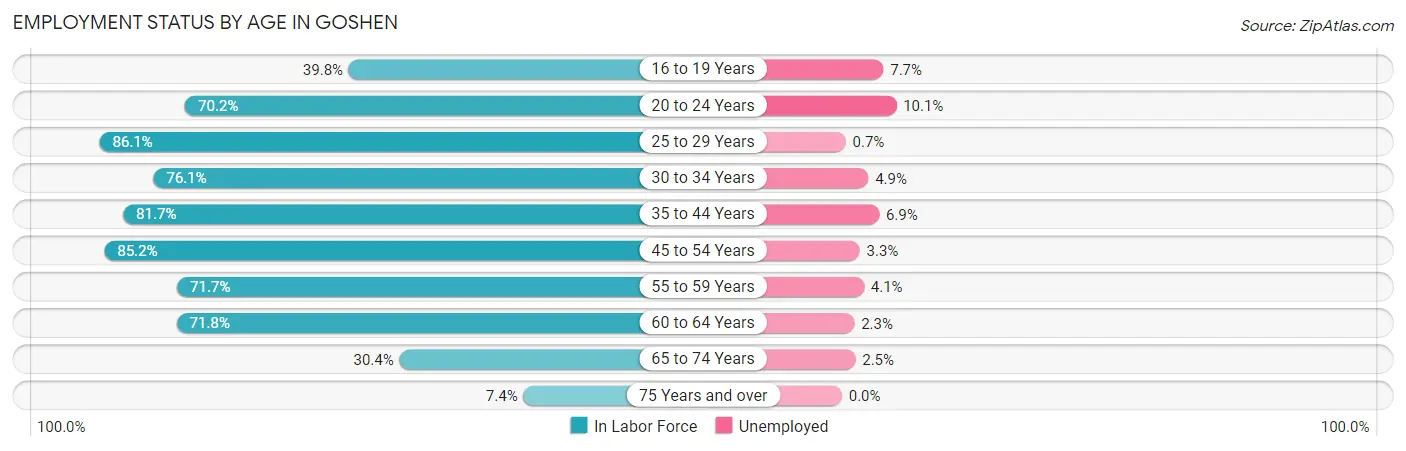
| Age Bracket | In Labor Force | Unemployed |
| 16 to 19 Years | 818 (39.8%) | 63 (7.7%) |
| 20 to 24 Years | 1,667 (70.2%) | 168 (10.1%) |
| 25 to 29 Years | 1,728 (86.1%) | 12 (0.7%) |
| 30 to 34 Years | 1,578 (76.1%) | 77 (4.9%) |
| 35 to 44 Years | 3,511 (81.7%) | 242 (6.9%) |
| 45 to 54 Years | 3,201 (85.2%) | 106 (3.3%) |
| 55 to 59 Years | 1,390 (71.7%) | 57 (4.1%) |
| 60 to 64 Years | 1,025 (71.8%) | 24 (2.3%) |
| 65 to 74 Years | 979 (30.4%) | 24 (2.5%) |
| 75 Years and over | 269 (7.4%) | 0 (0.0%) |
| Total | 16,157 (60.3%) | 776 (4.8%) |
Employment Status by Educational Attainment in Goshen
According to labor force statistics for Goshen, 80.2% of individuals (12,433) out of the total population between 25 and 64 years of age (15,503) are in the labor force, with 4.2% or 522 of them being unemployed. The group with the highest labor force participation rate are those with the educational attainment of bachelor's degree or higher, with 89.1% or 3,404 individuals in the labor force. Within the labor force, individuals with less than high school education have the highest percentage of unemployment, with 6.0% or 115 of them being unemployed.
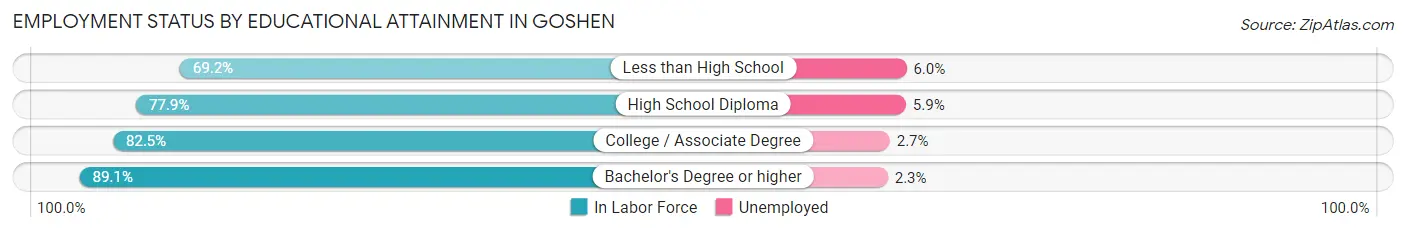
| Educational Attainment | In Labor Force | Unemployed |
| Less than High School | 1,912 (69.2%) | 166 (6.0%) |
| High School Diploma | 4,105 (77.9%) | 311 (5.9%) |
| College / Associate Degree | 3,012 (82.5%) | 99 (2.7%) |
| Bachelor's Degree or higher | 3,404 (89.1%) | 88 (2.3%) |
| Total | 12,433 (80.2%) | 651 (4.2%) |
Employment Occupations by Sex in Goshen
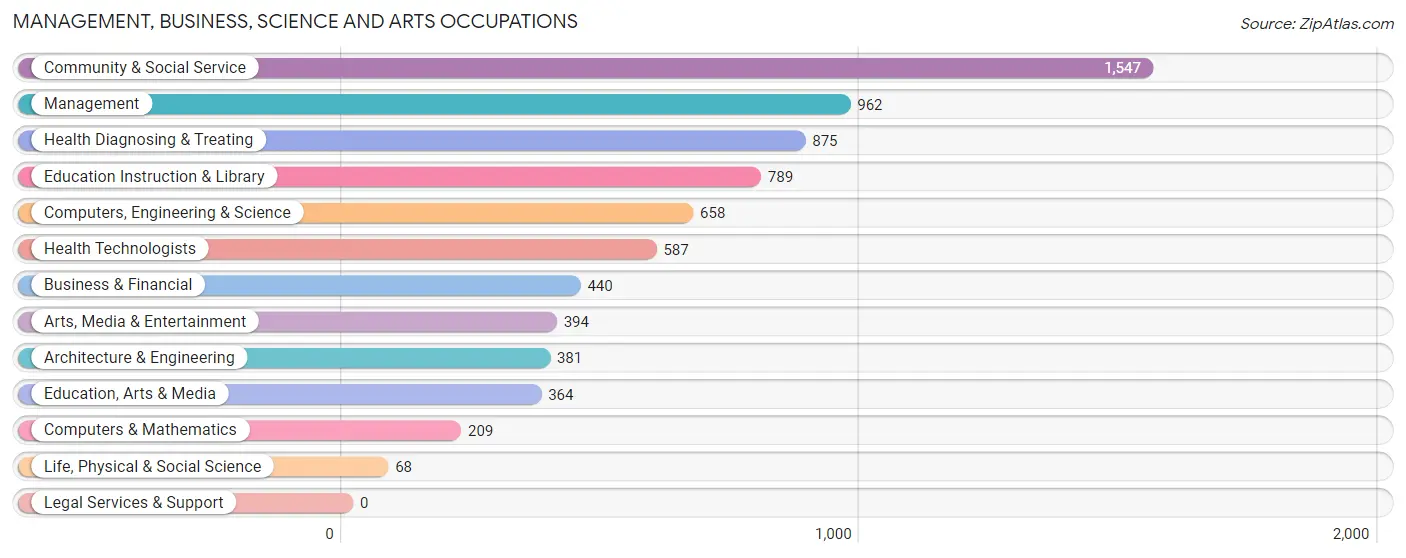
Management, Business, Science and Arts Occupations
The most common Management, Business, Science and Arts occupations in Goshen are Community & Social Service (1,547 | 10.1%), Management (962 | 6.2%), Health Diagnosing & Treating (875 | 5.7%), Education Instruction & Library (789 | 5.1%), and Computers, Engineering & Science (658 | 4.3%).
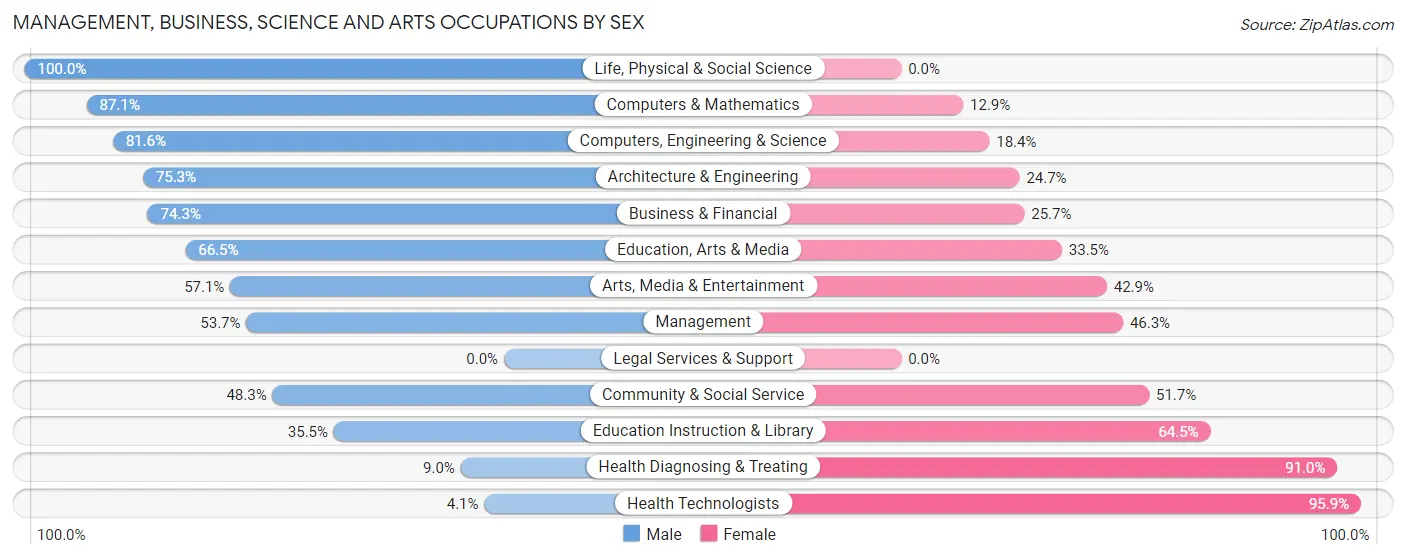
Management, Business, Science and Arts Occupations by Sex
Within the Management, Business, Science and Arts occupations in Goshen, the most male-oriented occupations are Life, Physical & Social Science (100.0%), Computers & Mathematics (87.1%), and Computers, Engineering & Science (81.6%), while the most female-oriented occupations are Health Technologists (95.9%), Health Diagnosing & Treating (91.0%), and Education Instruction & Library (64.5%).
| Occupation | Male | Female |
| Management | 517 (53.7%) | 445 (46.3%) |
| Business & Financial | 327 (74.3%) | 113 (25.7%) |
| Computers, Engineering & Science | 537 (81.6%) | 121 (18.4%) |
| Computers & Mathematics | 182 (87.1%) | 27 (12.9%) |
| Architecture & Engineering | 287 (75.3%) | 94 (24.7%) |
| Life, Physical & Social Science | 68 (100.0%) | 0 (0.0%) |
| Community & Social Service | 747 (48.3%) | 800 (51.7%) |
| Education, Arts & Media | 242 (66.5%) | 122 (33.5%) |
| Legal Services & Support | 0 (0.0%) | 0 (0.0%) |
| Education Instruction & Library | 280 (35.5%) | 509 (64.5%) |
| Arts, Media & Entertainment | 225 (57.1%) | 169 (42.9%) |
| Health Diagnosing & Treating | 79 (9.0%) | 796 (91.0%) |
| Health Technologists | 24 (4.1%) | 563 (95.9%) |
| Total (Category) | 2,207 (49.2%) | 2,275 (50.8%) |
| Total (Overall) | 8,129 (52.8%) | 7,265 (47.2%) |
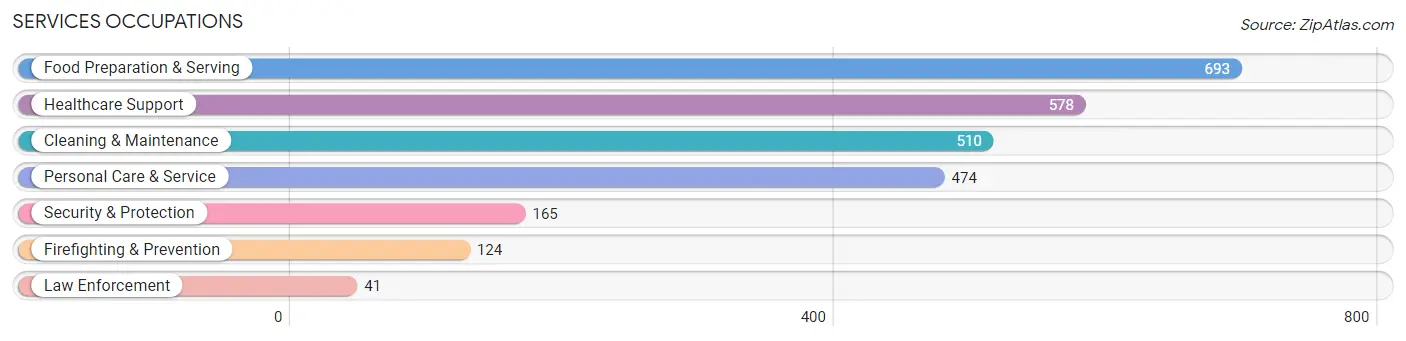
Services Occupations
The most common Services occupations in Goshen are Food Preparation & Serving (693 | 4.5%), Healthcare Support (578 | 3.7%), Cleaning & Maintenance (510 | 3.3%), Personal Care & Service (474 | 3.1%), and Security & Protection (165 | 1.1%).
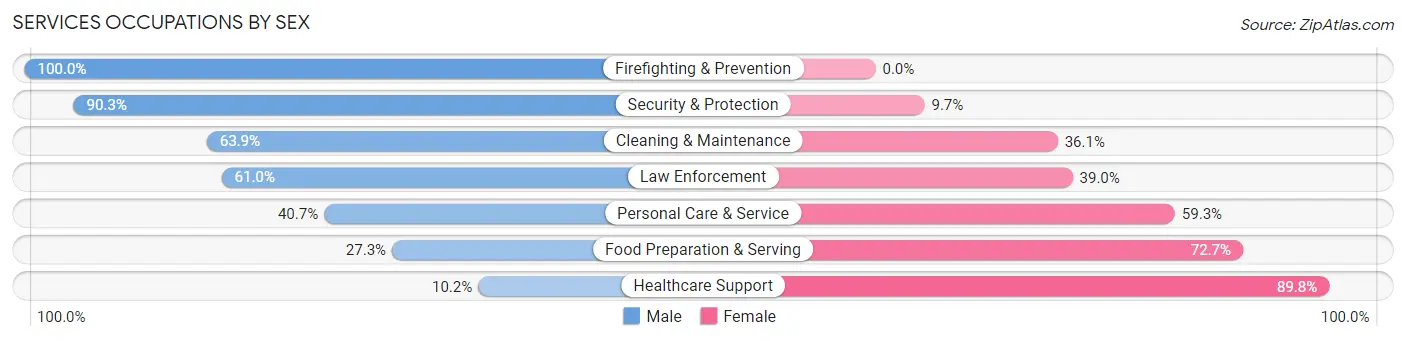
Services Occupations by Sex
Within the Services occupations in Goshen, the most male-oriented occupations are Firefighting & Prevention (100.0%), Security & Protection (90.3%), and Cleaning & Maintenance (63.9%), while the most female-oriented occupations are Healthcare Support (89.8%), Food Preparation & Serving (72.7%), and Personal Care & Service (59.3%).
| Occupation | Male | Female |
| Healthcare Support | 59 (10.2%) | 519 (89.8%) |
| Security & Protection | 149 (90.3%) | 16 (9.7%) |
| Firefighting & Prevention | 124 (100.0%) | 0 (0.0%) |
| Law Enforcement | 25 (61.0%) | 16 (39.0%) |
| Food Preparation & Serving | 189 (27.3%) | 504 (72.7%) |
| Cleaning & Maintenance | 326 (63.9%) | 184 (36.1%) |
| Personal Care & Service | 193 (40.7%) | 281 (59.3%) |
| Total (Category) | 916 (37.9%) | 1,504 (62.2%) |
| Total (Overall) | 8,129 (52.8%) | 7,265 (47.2%) |
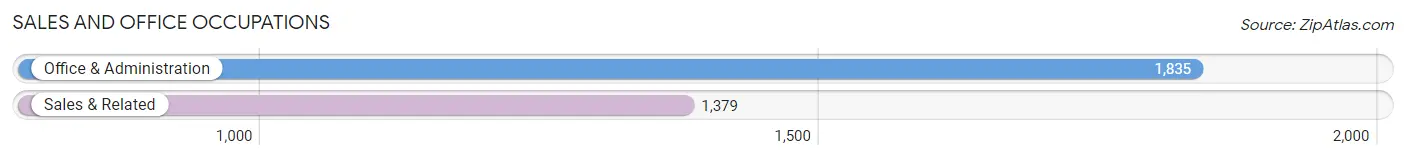
Sales and Office Occupations
The most common Sales and Office occupations in Goshen are Office & Administration (1,835 | 11.9%), and Sales & Related (1,379 | 9.0%).
Sales and Office Occupations by Sex
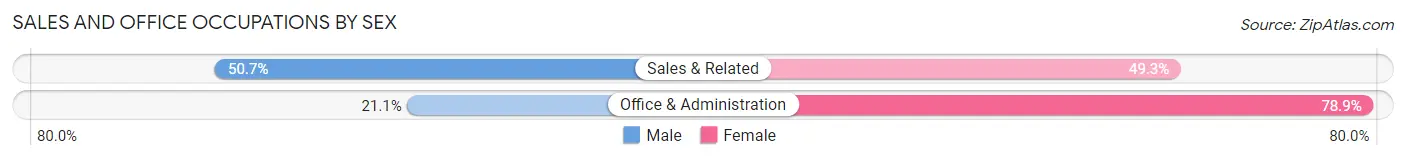
| Occupation | Male | Female |
| Sales & Related | 699 (50.7%) | 680 (49.3%) |
| Office & Administration | 387 (21.1%) | 1,448 (78.9%) |
| Total (Category) | 1,086 (33.8%) | 2,128 (66.2%) |
| Total (Overall) | 8,129 (52.8%) | 7,265 (47.2%) |
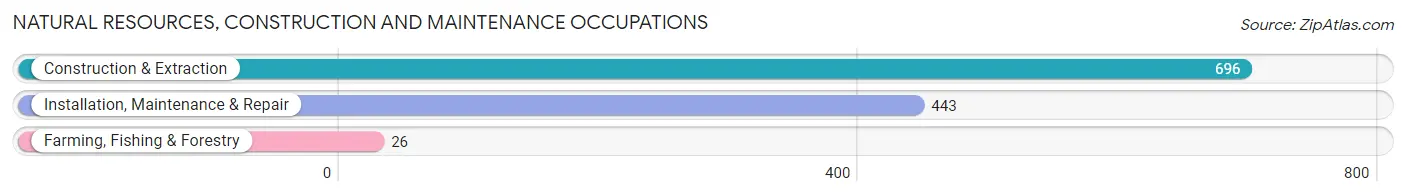
Natural Resources, Construction and Maintenance Occupations
The most common Natural Resources, Construction and Maintenance occupations in Goshen are Construction & Extraction (696 | 4.5%), Installation, Maintenance & Repair (443 | 2.9%), and Farming, Fishing & Forestry (26 | 0.2%).
Natural Resources, Construction and Maintenance Occupations by Sex
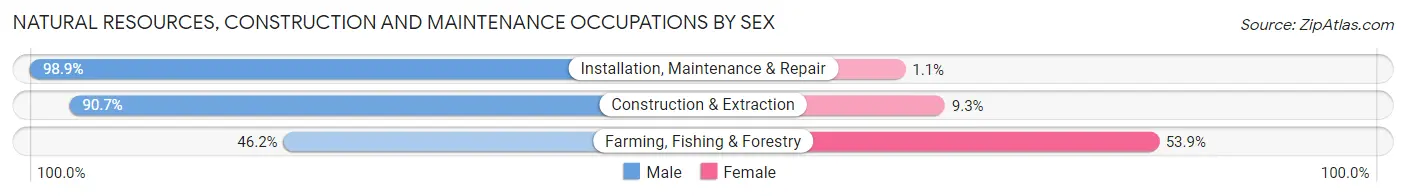
| Occupation | Male | Female |
| Farming, Fishing & Forestry | 12 (46.2%) | 14 (53.8%) |
| Construction & Extraction | 631 (90.7%) | 65 (9.3%) |
| Installation, Maintenance & Repair | 438 (98.9%) | 5 (1.1%) |
| Total (Category) | 1,081 (92.8%) | 84 (7.2%) |
| Total (Overall) | 8,129 (52.8%) | 7,265 (47.2%) |
Production, Transportation and Moving Occupations
The most common Production, Transportation and Moving occupations in Goshen are Production (2,840 | 18.4%), Material Moving (972 | 6.3%), and Transportation (301 | 2.0%).
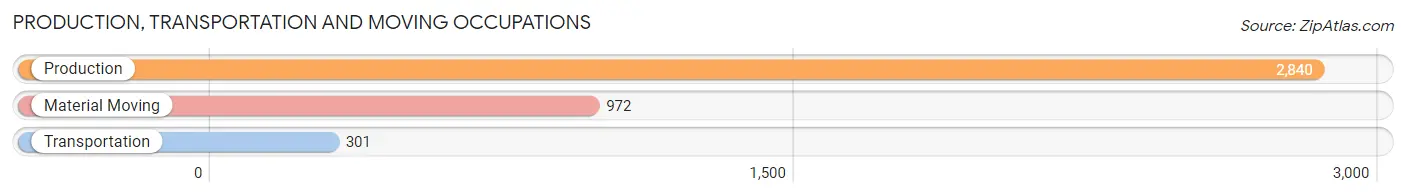
Production, Transportation and Moving Occupations by Sex
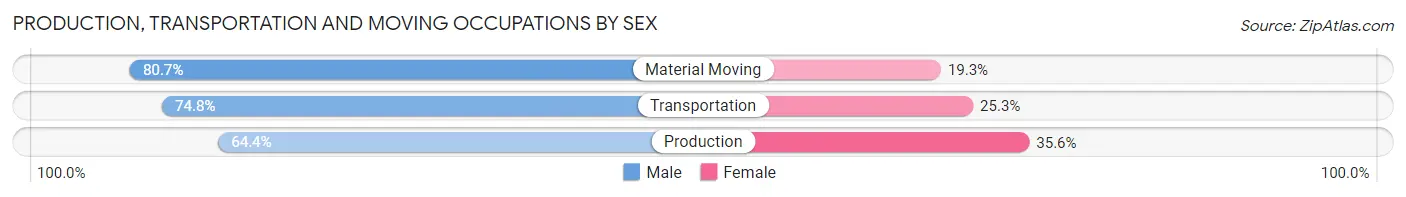
| Occupation | Male | Female |
| Production | 1,830 (64.4%) | 1,010 (35.6%) |
| Transportation | 225 (74.8%) | 76 (25.3%) |
| Material Moving | 784 (80.7%) | 188 (19.3%) |
| Total (Category) | 2,839 (69.0%) | 1,274 (31.0%) |
| Total (Overall) | 8,129 (52.8%) | 7,265 (47.2%) |
Employment Industries by Sex in Goshen
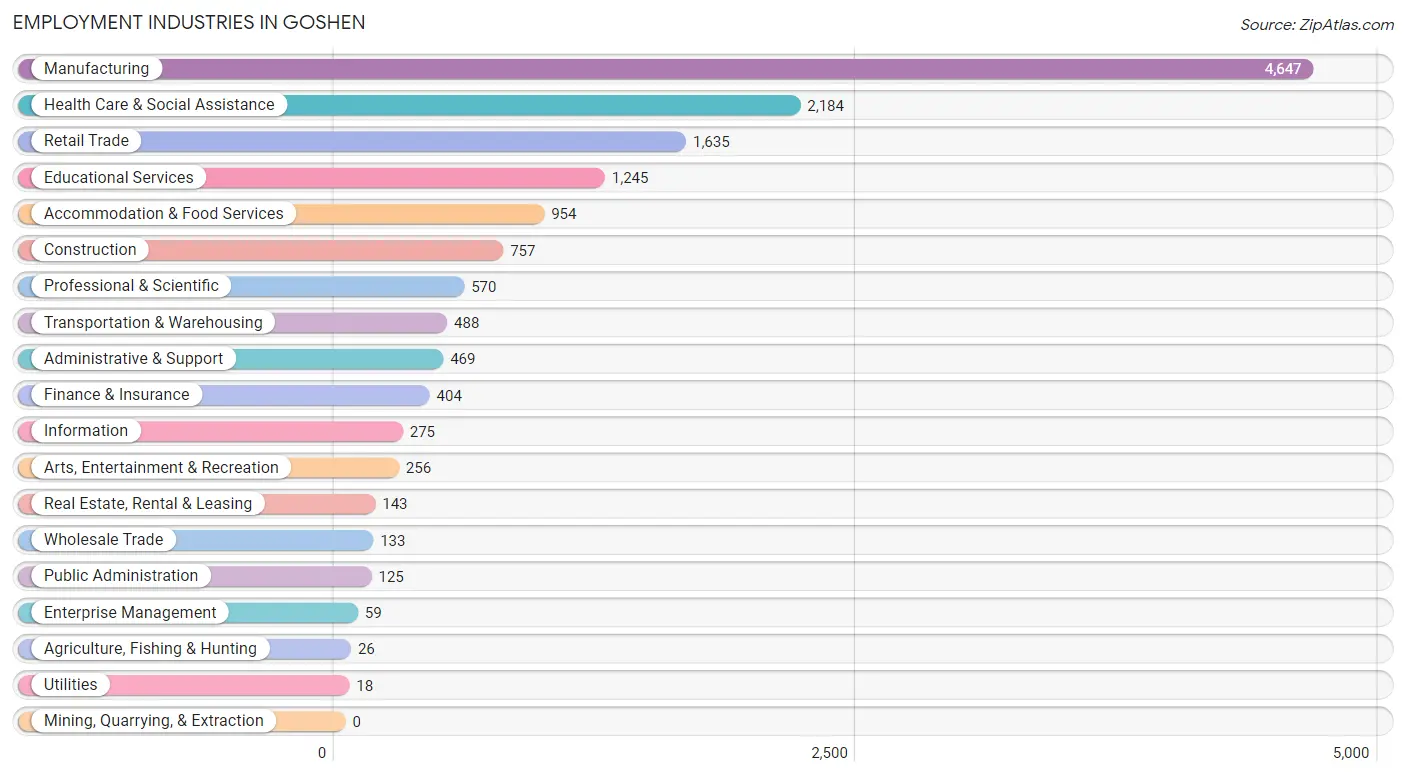
Employment Industries in Goshen
The major employment industries in Goshen include Manufacturing (4,647 | 30.2%), Health Care & Social Assistance (2,184 | 14.2%), Retail Trade (1,635 | 10.6%), Educational Services (1,245 | 8.1%), and Accommodation & Food Services (954 | 6.2%).
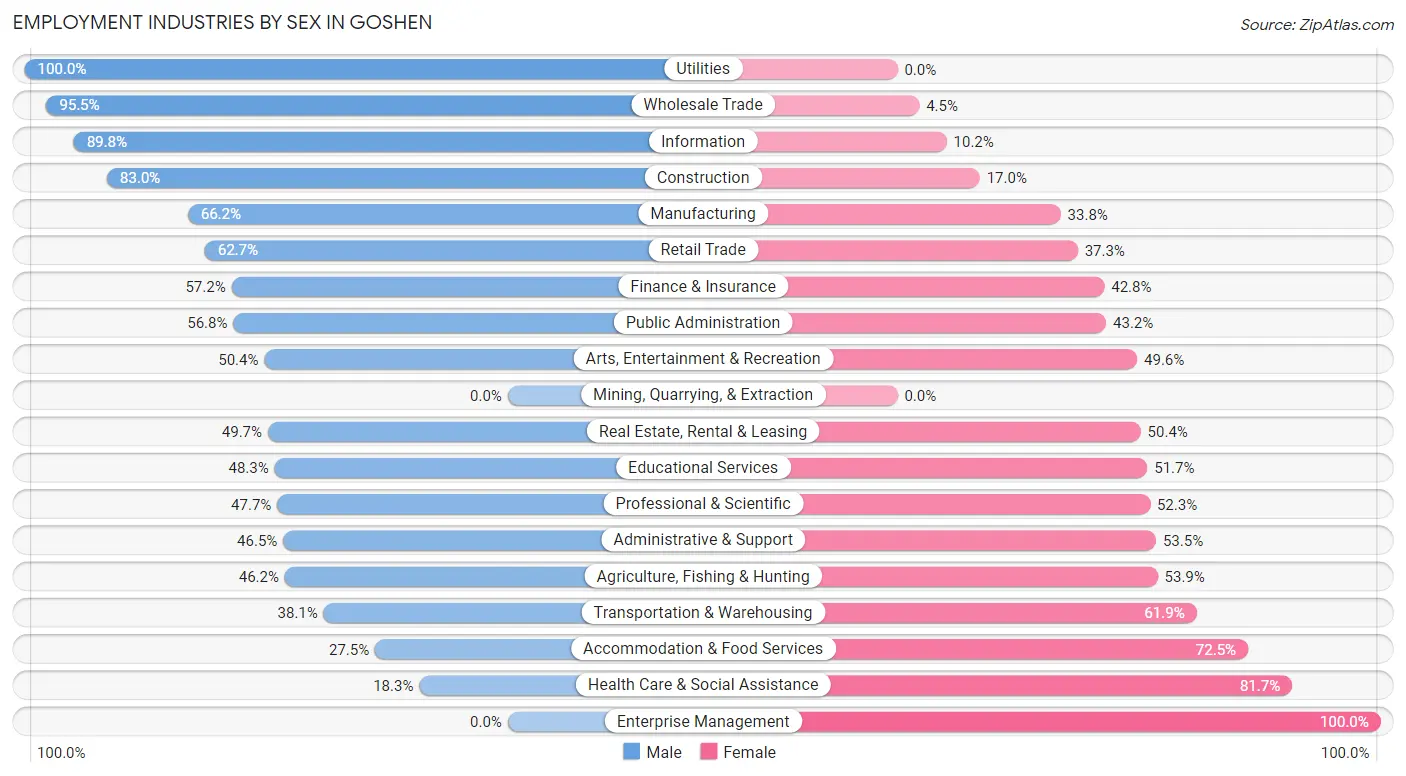
Employment Industries by Sex in Goshen
The Goshen industries that see more men than women are Utilities (100.0%), Wholesale Trade (95.5%), and Information (89.8%), whereas the industries that tend to have a higher number of women are Enterprise Management (100.0%), Health Care & Social Assistance (81.7%), and Accommodation & Food Services (72.5%).
| Industry | Male | Female |
| Agriculture, Fishing & Hunting | 12 (46.2%) | 14 (53.8%) |
| Mining, Quarrying, & Extraction | 0 (0.0%) | 0 (0.0%) |
| Construction | 628 (83.0%) | 129 (17.0%) |
| Manufacturing | 3,077 (66.2%) | 1,570 (33.8%) |
| Wholesale Trade | 127 (95.5%) | 6 (4.5%) |
| Retail Trade | 1,025 (62.7%) | 610 (37.3%) |
| Transportation & Warehousing | 186 (38.1%) | 302 (61.9%) |
| Utilities | 18 (100.0%) | 0 (0.0%) |
| Information | 247 (89.8%) | 28 (10.2%) |
| Finance & Insurance | 231 (57.2%) | 173 (42.8%) |
| Real Estate, Rental & Leasing | 71 (49.6%) | 72 (50.3%) |
| Professional & Scientific | 272 (47.7%) | 298 (52.3%) |
| Enterprise Management | 0 (0.0%) | 59 (100.0%) |
| Administrative & Support | 218 (46.5%) | 251 (53.5%) |
| Educational Services | 601 (48.3%) | 644 (51.7%) |
| Health Care & Social Assistance | 400 (18.3%) | 1,784 (81.7%) |
| Arts, Entertainment & Recreation | 129 (50.4%) | 127 (49.6%) |
| Accommodation & Food Services | 262 (27.5%) | 692 (72.5%) |
| Public Administration | 71 (56.8%) | 54 (43.2%) |
| Total | 8,129 (52.8%) | 7,265 (47.2%) |
Education in Goshen
School Enrollment in Goshen
The most common levels of schooling among the 7,846 students in Goshen are middle school (2,341 | 29.8%), high school (1,931 | 24.6%), and elementary school (1,734 | 22.1%).
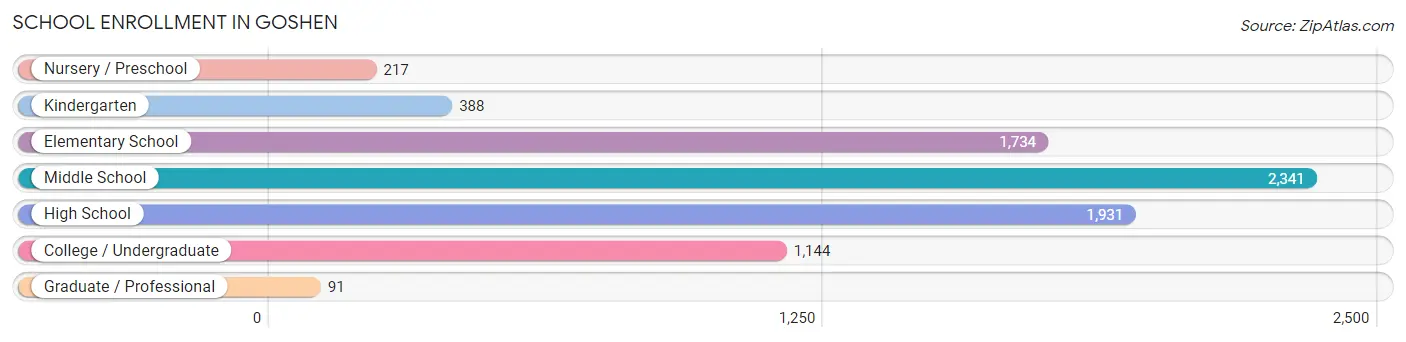
| School Level | # Students | % Students |
| Nursery / Preschool | 217 | 2.8% |
| Kindergarten | 388 | 5.0% |
| Elementary School | 1,734 | 22.1% |
| Middle School | 2,341 | 29.8% |
| High School | 1,931 | 24.6% |
| College / Undergraduate | 1,144 | 14.6% |
| Graduate / Professional | 91 | 1.2% |
| Total | 7,846 | 100.0% |
School Enrollment by Age by Funding Source in Goshen
Out of a total of 7,846 students who are enrolled in schools in Goshen, 1,138 (14.5%) attend a private institution, while the remaining 6,708 (85.5%) are enrolled in public schools. The age group of 3 to 4 year olds has the highest likelihood of being enrolled in private schools, with 49 (50.5% in the age bracket) enrolled. Conversely, the age group of 5 to 9 year old has the lowest likelihood of being enrolled in a private school, with 1,568 (93.9% in the age bracket) attending a public institution.
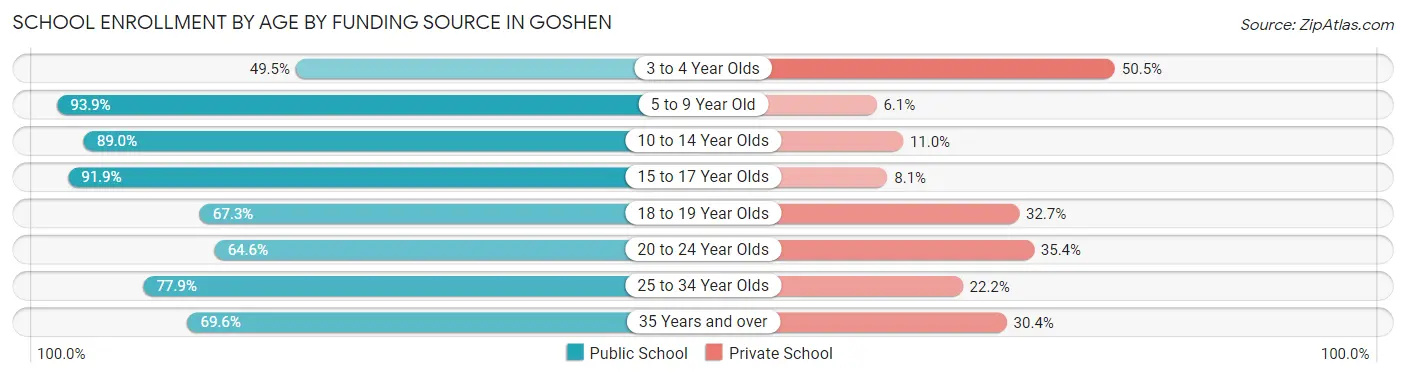
| Age Bracket | Public School | Private School |
| 3 to 4 Year Olds | 48 (49.5%) | 49 (50.5%) |
| 5 to 9 Year Old | 1,568 (93.9%) | 102 (6.1%) |
| 10 to 14 Year Olds | 2,803 (89.0%) | 348 (11.0%) |
| 15 to 17 Year Olds | 1,163 (91.9%) | 103 (8.1%) |
| 18 to 19 Year Olds | 497 (67.3%) | 241 (32.7%) |
| 20 to 24 Year Olds | 350 (64.6%) | 192 (35.4%) |
| 25 to 34 Year Olds | 123 (77.8%) | 35 (22.2%) |
| 35 Years and over | 156 (69.6%) | 68 (30.4%) |
| Total | 6,708 (85.5%) | 1,138 (14.5%) |
Educational Attainment by Field of Study in Goshen
Education (1,231 | 20.6%), business (683 | 11.4%), science & technology (559 | 9.4%), arts & humanities (515 | 8.6%), and liberal arts & history (453 | 7.6%) are the most common fields of study among 5,971 individuals in Goshen who have obtained a bachelor's degree or higher.
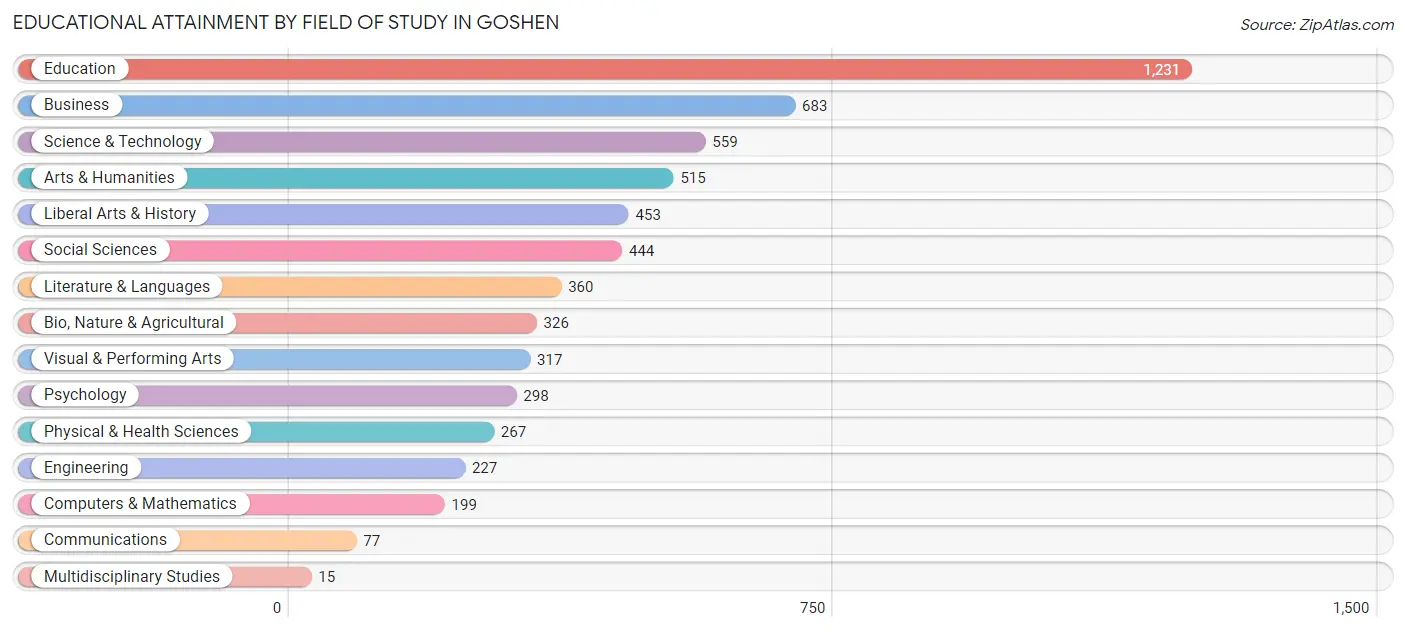
| Field of Study | # Graduates | % Graduates |
| Computers & Mathematics | 199 | 3.3% |
| Bio, Nature & Agricultural | 326 | 5.5% |
| Physical & Health Sciences | 267 | 4.5% |
| Psychology | 298 | 5.0% |
| Social Sciences | 444 | 7.4% |
| Engineering | 227 | 3.8% |
| Multidisciplinary Studies | 15 | 0.3% |
| Science & Technology | 559 | 9.4% |
| Business | 683 | 11.4% |
| Education | 1,231 | 20.6% |
| Literature & Languages | 360 | 6.0% |
| Liberal Arts & History | 453 | 7.6% |
| Visual & Performing Arts | 317 | 5.3% |
| Communications | 77 | 1.3% |
| Arts & Humanities | 515 | 8.6% |
| Total | 5,971 | 100.0% |
Transportation & Commute in Goshen
Vehicle Availability by Sex in Goshen
The most prevalent vehicle ownership categories in Goshen are males with 2 vehicles (3,160, accounting for 40.1%) and females with 2 vehicles (2,620, making up 45.2%).
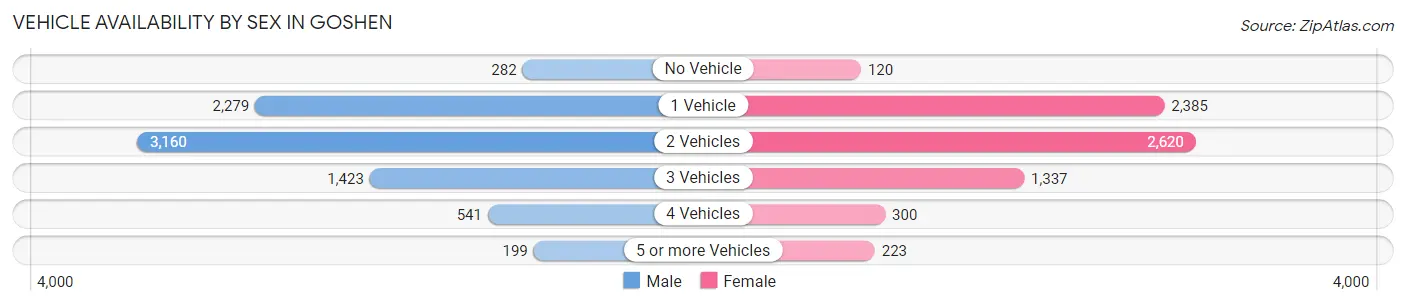
| Vehicles Available | Male | Female |
| No Vehicle | 282 (3.6%) | 120 (1.7%) |
| 1 Vehicle | 2,279 (28.9%) | 2,385 (34.1%) |
| 2 Vehicles | 3,160 (40.1%) | 2,620 (37.5%) |
| 3 Vehicles | 1,423 (18.0%) | 1,337 (19.1%) |
| 4 Vehicles | 541 (6.9%) | 300 (4.3%) |
| 5 or more Vehicles | 199 (2.5%) | 223 (3.2%) |
| Total | 7,884 (100.0%) | 6,985 (100.0%) |
Commute Time in Goshen
The most frequently occuring commute durations in Goshen are 15 to 19 minutes (3,203 commuters, 22.5%), 5 to 9 minutes (2,613 commuters, 18.3%), and 10 to 14 minutes (2,173 commuters, 15.2%).
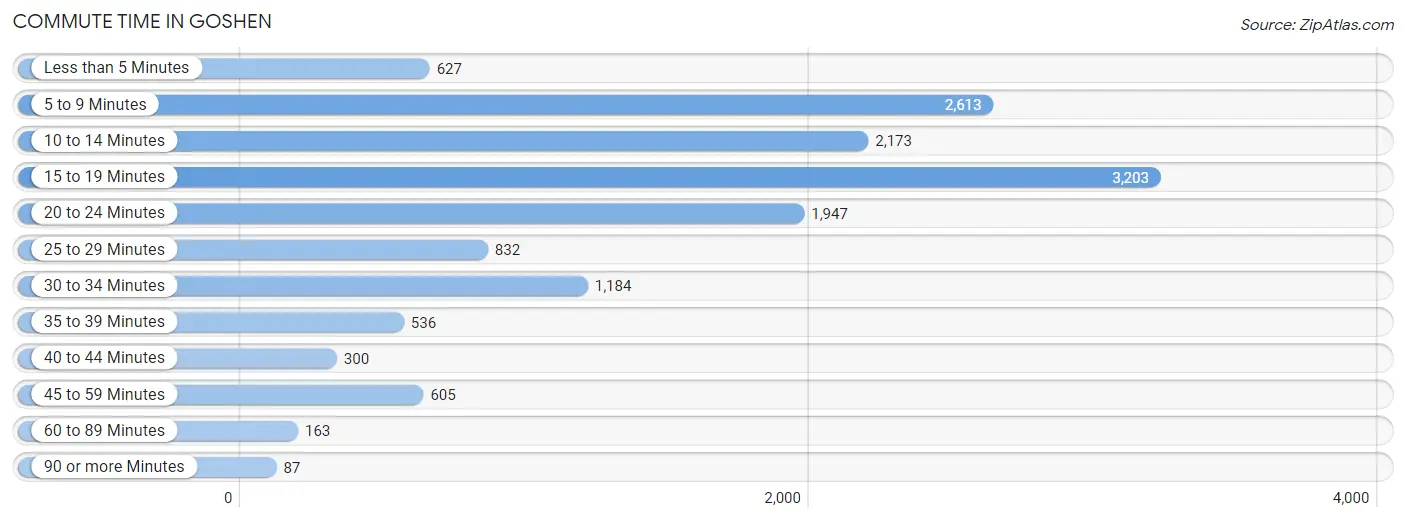
| Commute Time | # Commuters | % Commuters |
| Less than 5 Minutes | 627 | 4.4% |
| 5 to 9 Minutes | 2,613 | 18.3% |
| 10 to 14 Minutes | 2,173 | 15.2% |
| 15 to 19 Minutes | 3,203 | 22.5% |
| 20 to 24 Minutes | 1,947 | 13.6% |
| 25 to 29 Minutes | 832 | 5.8% |
| 30 to 34 Minutes | 1,184 | 8.3% |
| 35 to 39 Minutes | 536 | 3.8% |
| 40 to 44 Minutes | 300 | 2.1% |
| 45 to 59 Minutes | 605 | 4.2% |
| 60 to 89 Minutes | 163 | 1.1% |
| 90 or more Minutes | 87 | 0.6% |
Commute Time by Sex in Goshen
The most common commute times in Goshen are 15 to 19 minutes (1,399 commuters, 18.0%) for males and 15 to 19 minutes (1,804 commuters, 27.8%) for females.
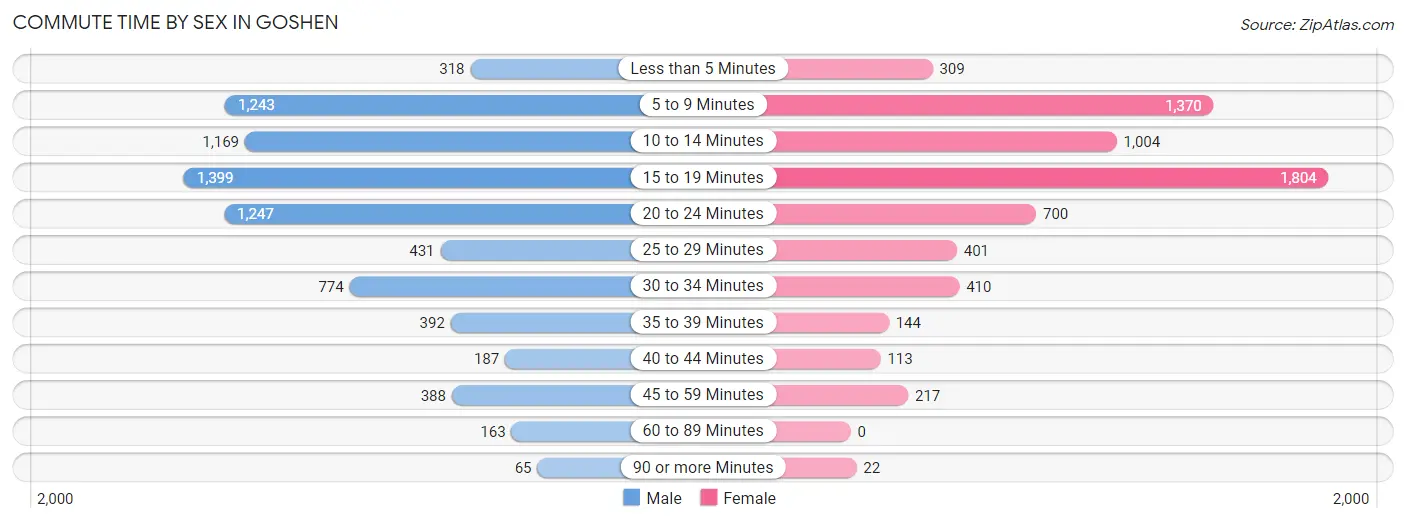
| Commute Time | Male | Female |
| Less than 5 Minutes | 318 (4.1%) | 309 (4.8%) |
| 5 to 9 Minutes | 1,243 (16.0%) | 1,370 (21.1%) |
| 10 to 14 Minutes | 1,169 (15.0%) | 1,004 (15.5%) |
| 15 to 19 Minutes | 1,399 (18.0%) | 1,804 (27.8%) |
| 20 to 24 Minutes | 1,247 (16.0%) | 700 (10.8%) |
| 25 to 29 Minutes | 431 (5.5%) | 401 (6.2%) |
| 30 to 34 Minutes | 774 (10.0%) | 410 (6.3%) |
| 35 to 39 Minutes | 392 (5.0%) | 144 (2.2%) |
| 40 to 44 Minutes | 187 (2.4%) | 113 (1.7%) |
| 45 to 59 Minutes | 388 (5.0%) | 217 (3.3%) |
| 60 to 89 Minutes | 163 (2.1%) | 0 (0.0%) |
| 90 or more Minutes | 65 (0.8%) | 22 (0.3%) |
Time of Departure to Work by Sex in Goshen
The most frequent times of departure to work in Goshen are 12:00 AM to 4:59 AM (2,241, 28.8%) for males and 7:30 AM to 7:59 AM (1,177, 18.1%) for females.
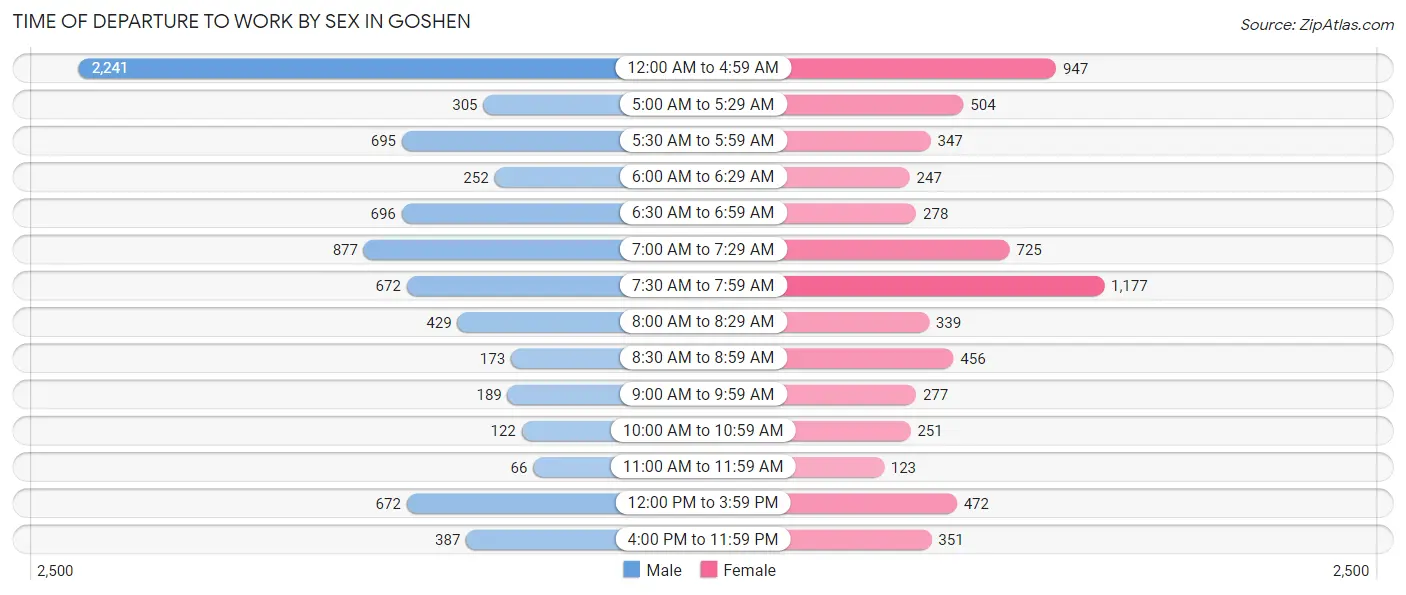
| Time of Departure | Male | Female |
| 12:00 AM to 4:59 AM | 2,241 (28.8%) | 947 (14.6%) |
| 5:00 AM to 5:29 AM | 305 (3.9%) | 504 (7.8%) |
| 5:30 AM to 5:59 AM | 695 (8.9%) | 347 (5.3%) |
| 6:00 AM to 6:29 AM | 252 (3.2%) | 247 (3.8%) |
| 6:30 AM to 6:59 AM | 696 (8.9%) | 278 (4.3%) |
| 7:00 AM to 7:29 AM | 877 (11.3%) | 725 (11.2%) |
| 7:30 AM to 7:59 AM | 672 (8.6%) | 1,177 (18.1%) |
| 8:00 AM to 8:29 AM | 429 (5.5%) | 339 (5.2%) |
| 8:30 AM to 8:59 AM | 173 (2.2%) | 456 (7.0%) |
| 9:00 AM to 9:59 AM | 189 (2.4%) | 277 (4.3%) |
| 10:00 AM to 10:59 AM | 122 (1.6%) | 251 (3.9%) |
| 11:00 AM to 11:59 AM | 66 (0.9%) | 123 (1.9%) |
| 12:00 PM to 3:59 PM | 672 (8.6%) | 472 (7.3%) |
| 4:00 PM to 11:59 PM | 387 (5.0%) | 351 (5.4%) |
| Total | 7,776 (100.0%) | 6,494 (100.0%) |
Housing Occupancy in Goshen
Occupancy by Ownership in Goshen
Of the total 12,614 dwellings in Goshen, owner-occupied units account for 7,906 (62.7%), while renter-occupied units make up 4,708 (37.3%).
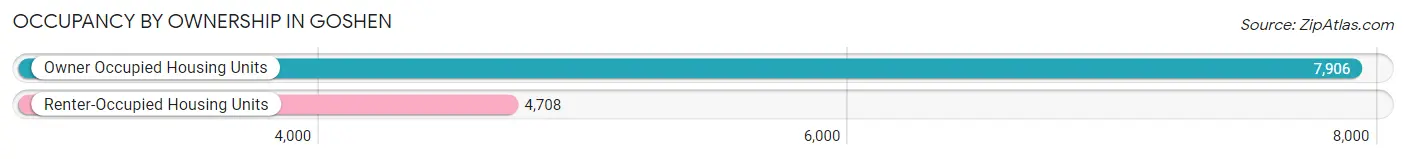
| Occupancy | # Housing Units | % Housing Units |
| Owner Occupied Housing Units | 7,906 | 62.7% |
| Renter-Occupied Housing Units | 4,708 | 37.3% |
| Total Occupied Housing Units | 12,614 | 100.0% |
Occupancy by Household Size in Goshen
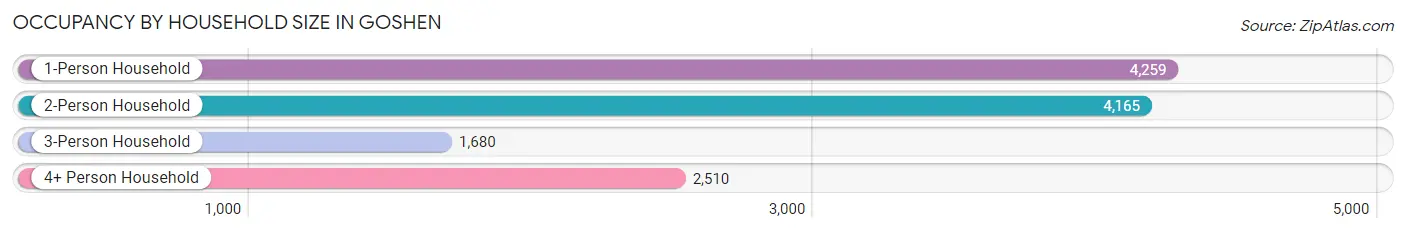
| Household Size | # Housing Units | % Housing Units |
| 1-Person Household | 4,259 | 33.8% |
| 2-Person Household | 4,165 | 33.0% |
| 3-Person Household | 1,680 | 13.3% |
| 4+ Person Household | 2,510 | 19.9% |
| Total Housing Units | 12,614 | 100.0% |
Occupancy by Ownership by Household Size in Goshen
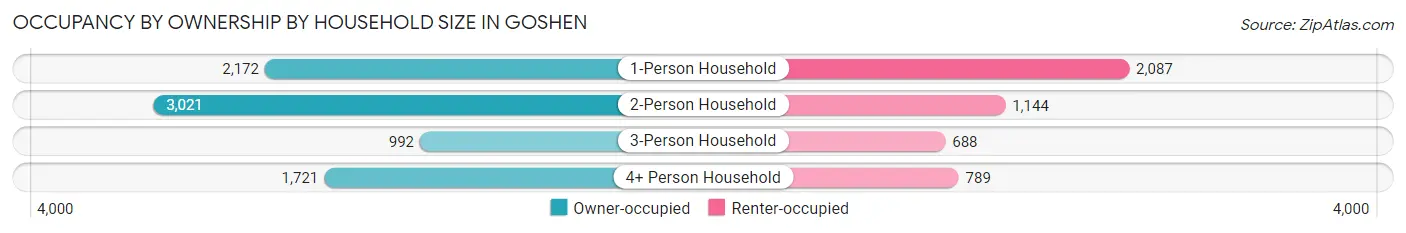
| Household Size | Owner-occupied | Renter-occupied |
| 1-Person Household | 2,172 (51.0%) | 2,087 (49.0%) |
| 2-Person Household | 3,021 (72.5%) | 1,144 (27.5%) |
| 3-Person Household | 992 (59.1%) | 688 (40.9%) |
| 4+ Person Household | 1,721 (68.6%) | 789 (31.4%) |
| Total Housing Units | 7,906 (62.7%) | 4,708 (37.3%) |
Occupancy by Educational Attainment in Goshen
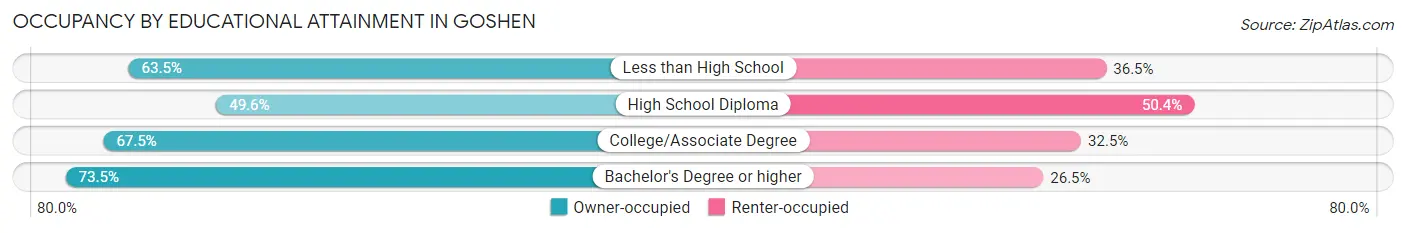
| Household Size | Owner-occupied | Renter-occupied |
| Less than High School | 1,174 (63.5%) | 675 (36.5%) |
| High School Diploma | 2,047 (49.6%) | 2,081 (50.4%) |
| College/Associate Degree | 2,161 (67.5%) | 1,041 (32.5%) |
| Bachelor's Degree or higher | 2,524 (73.5%) | 911 (26.5%) |
Occupancy by Age of Householder in Goshen
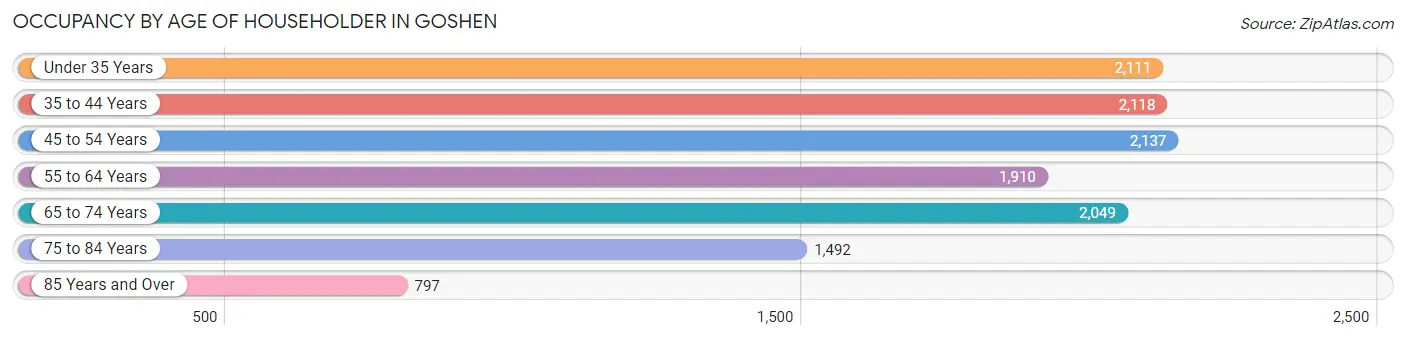
| Age Bracket | # Households | % Households |
| Under 35 Years | 2,111 | 16.7% |
| 35 to 44 Years | 2,118 | 16.8% |
| 45 to 54 Years | 2,137 | 16.9% |
| 55 to 64 Years | 1,910 | 15.1% |
| 65 to 74 Years | 2,049 | 16.2% |
| 75 to 84 Years | 1,492 | 11.8% |
| 85 Years and Over | 797 | 6.3% |
| Total | 12,614 | 100.0% |
Housing Finances in Goshen
Median Income by Occupancy in Goshen
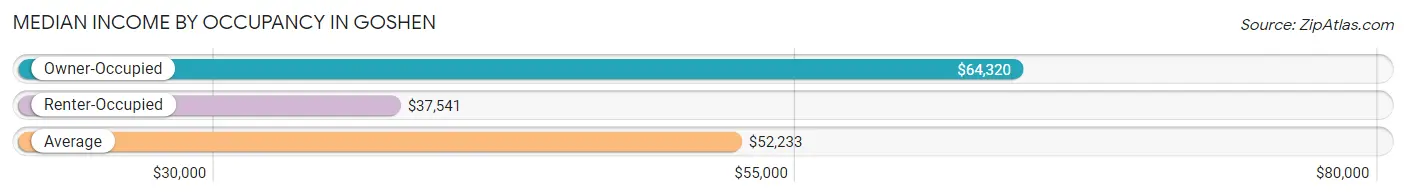
| Occupancy Type | # Households | Median Income |
| Owner-Occupied | 7,906 (62.7%) | $64,320 |
| Renter-Occupied | 4,708 (37.3%) | $37,541 |
| Average | 12,614 (100.0%) | $52,233 |
Occupancy by Householder Income Bracket in Goshen
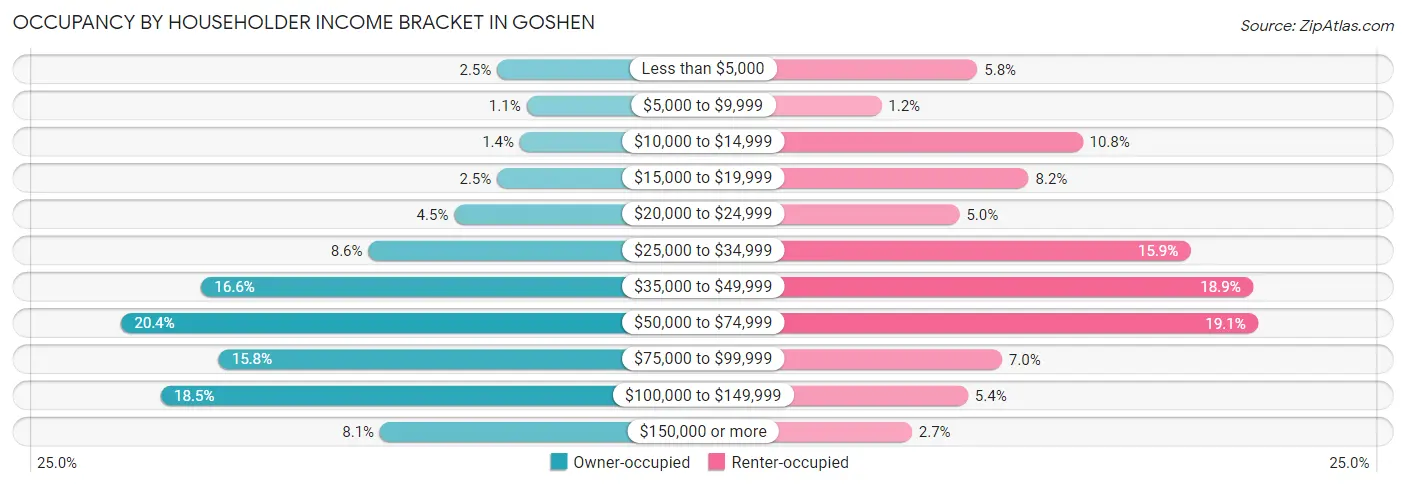
| Income Bracket | Owner-occupied | Renter-occupied |
| Less than $5,000 | 198 (2.5%) | 273 (5.8%) |
| $5,000 to $9,999 | 87 (1.1%) | 58 (1.2%) |
| $10,000 to $14,999 | 112 (1.4%) | 509 (10.8%) |
| $15,000 to $19,999 | 198 (2.5%) | 388 (8.2%) |
| $20,000 to $24,999 | 359 (4.5%) | 233 (5.0%) |
| $25,000 to $34,999 | 682 (8.6%) | 750 (15.9%) |
| $35,000 to $49,999 | 1,311 (16.6%) | 890 (18.9%) |
| $50,000 to $74,999 | 1,612 (20.4%) | 901 (19.1%) |
| $75,000 to $99,999 | 1,245 (15.8%) | 328 (7.0%) |
| $100,000 to $149,999 | 1,463 (18.5%) | 252 (5.3%) |
| $150,000 or more | 639 (8.1%) | 126 (2.7%) |
| Total | 7,906 (100.0%) | 4,708 (100.0%) |
Monthly Housing Cost Tiers in Goshen
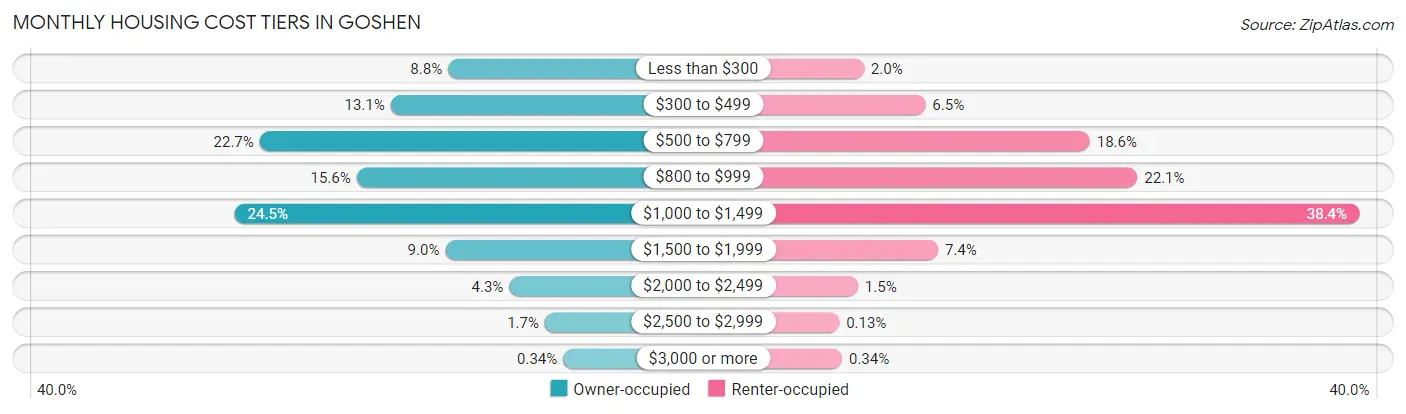
| Monthly Cost | Owner-occupied | Renter-occupied |
| Less than $300 | 697 (8.8%) | 92 (1.9%) |
| $300 to $499 | 1,032 (13.1%) | 305 (6.5%) |
| $500 to $799 | 1,794 (22.7%) | 875 (18.6%) |
| $800 to $999 | 1,229 (15.5%) | 1,040 (22.1%) |
| $1,000 to $1,499 | 1,939 (24.5%) | 1,808 (38.4%) |
| $1,500 to $1,999 | 713 (9.0%) | 349 (7.4%) |
| $2,000 to $2,499 | 341 (4.3%) | 71 (1.5%) |
| $2,500 to $2,999 | 134 (1.7%) | 6 (0.1%) |
| $3,000 or more | 27 (0.3%) | 16 (0.3%) |
| Total | 7,906 (100.0%) | 4,708 (100.0%) |
Physical Housing Characteristics in Goshen
Housing Structures in Goshen
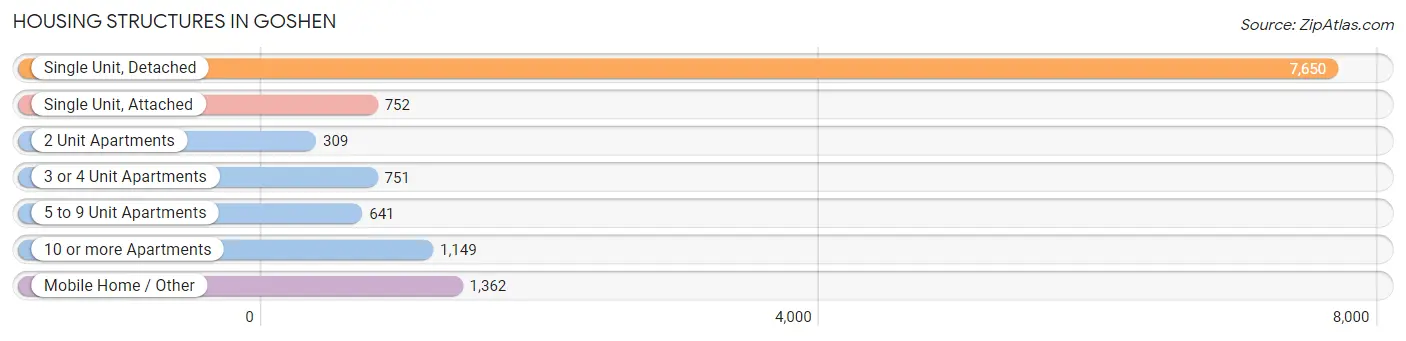
| Structure Type | # Housing Units | % Housing Units |
| Single Unit, Detached | 7,650 | 60.7% |
| Single Unit, Attached | 752 | 6.0% |
| 2 Unit Apartments | 309 | 2.5% |
| 3 or 4 Unit Apartments | 751 | 5.9% |
| 5 to 9 Unit Apartments | 641 | 5.1% |
| 10 or more Apartments | 1,149 | 9.1% |
| Mobile Home / Other | 1,362 | 10.8% |
| Total | 12,614 | 100.0% |
Housing Structures by Occupancy in Goshen
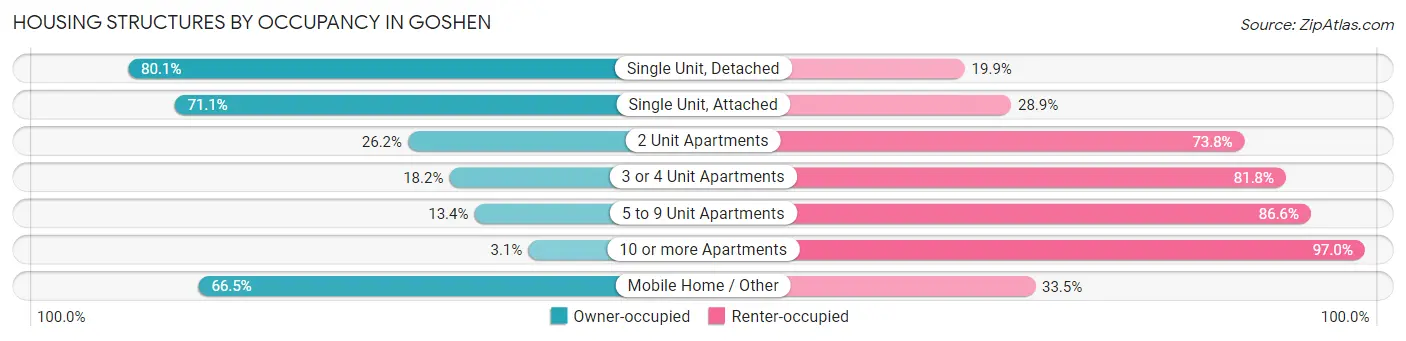
| Structure Type | Owner-occupied | Renter-occupied |
| Single Unit, Detached | 6,126 (80.1%) | 1,524 (19.9%) |
| Single Unit, Attached | 535 (71.1%) | 217 (28.9%) |
| 2 Unit Apartments | 81 (26.2%) | 228 (73.8%) |
| 3 or 4 Unit Apartments | 137 (18.2%) | 614 (81.8%) |
| 5 to 9 Unit Apartments | 86 (13.4%) | 555 (86.6%) |
| 10 or more Apartments | 35 (3.0%) | 1,114 (97.0%) |
| Mobile Home / Other | 906 (66.5%) | 456 (33.5%) |
| Total | 7,906 (62.7%) | 4,708 (37.3%) |
Housing Structures by Number of Rooms in Goshen
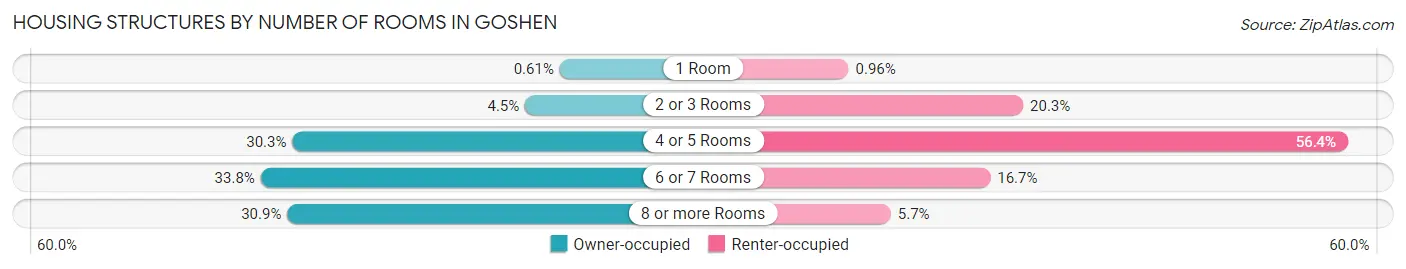
| Number of Rooms | Owner-occupied | Renter-occupied |
| 1 Room | 48 (0.6%) | 45 (1.0%) |
| 2 or 3 Rooms | 352 (4.4%) | 957 (20.3%) |
| 4 or 5 Rooms | 2,395 (30.3%) | 2,654 (56.4%) |
| 6 or 7 Rooms | 2,672 (33.8%) | 786 (16.7%) |
| 8 or more Rooms | 2,439 (30.8%) | 266 (5.7%) |
| Total | 7,906 (100.0%) | 4,708 (100.0%) |
Housing Structure by Heating Type in Goshen
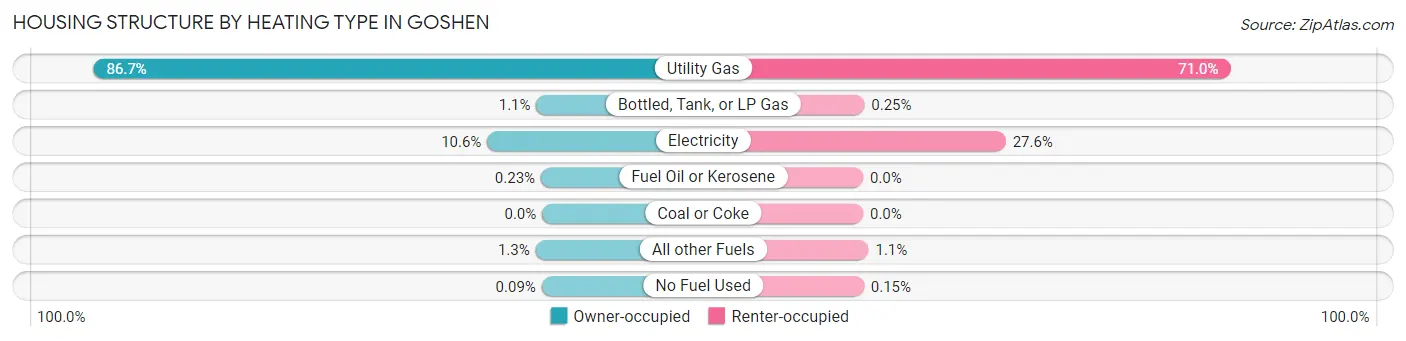
| Heating Type | Owner-occupied | Renter-occupied |
| Utility Gas | 6,854 (86.7%) | 3,341 (71.0%) |
| Bottled, Tank, or LP Gas | 88 (1.1%) | 12 (0.3%) |
| Electricity | 839 (10.6%) | 1,298 (27.6%) |
| Fuel Oil or Kerosene | 18 (0.2%) | 0 (0.0%) |
| Coal or Coke | 0 (0.0%) | 0 (0.0%) |
| All other Fuels | 100 (1.3%) | 50 (1.1%) |
| No Fuel Used | 7 (0.1%) | 7 (0.2%) |
| Total | 7,906 (100.0%) | 4,708 (100.0%) |
Household Vehicle Usage in Goshen
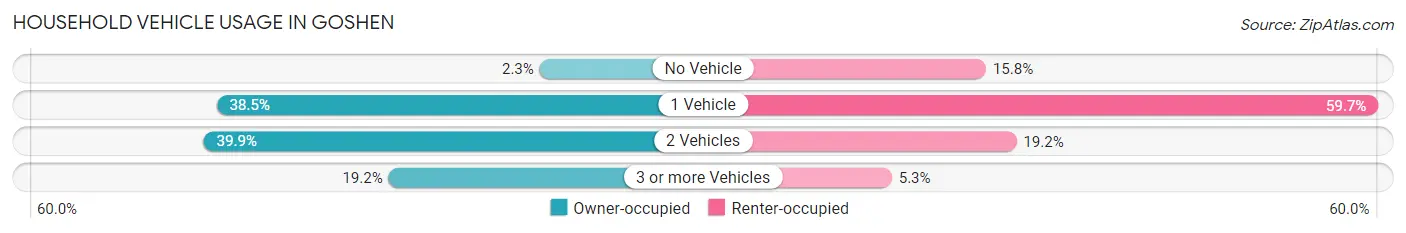
| Vehicles per Household | Owner-occupied | Renter-occupied |
| No Vehicle | 183 (2.3%) | 744 (15.8%) |
| 1 Vehicle | 3,044 (38.5%) | 2,812 (59.7%) |
| 2 Vehicles | 3,158 (39.9%) | 905 (19.2%) |
| 3 or more Vehicles | 1,521 (19.2%) | 247 (5.2%) |
| Total | 7,906 (100.0%) | 4,708 (100.0%) |
Real Estate & Mortgages in Goshen
Real Estate and Mortgage Overview in Goshen
| Characteristic | Without Mortgage | With Mortgage |
| Housing Units | 3,175 | 4,731 |
| Median Property Value | $160,400 | $165,600 |
| Median Household Income | $49,685 | $444 |
| Monthly Housing Costs | $496 | $27 |
| Real Estate Taxes | $1,429 | $39 |
Property Value by Mortgage Status in Goshen
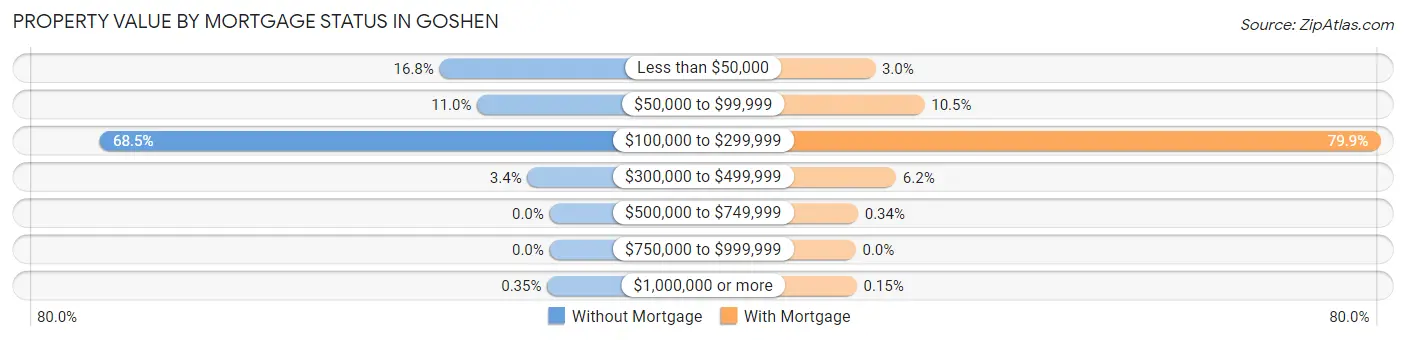
| Property Value | Without Mortgage | With Mortgage |
| Less than $50,000 | 532 (16.8%) | 140 (3.0%) |
| $50,000 to $99,999 | 350 (11.0%) | 496 (10.5%) |
| $100,000 to $299,999 | 2,175 (68.5%) | 3,781 (79.9%) |
| $300,000 to $499,999 | 107 (3.4%) | 291 (6.1%) |
| $500,000 to $749,999 | 0 (0.0%) | 16 (0.3%) |
| $750,000 to $999,999 | 0 (0.0%) | 0 (0.0%) |
| $1,000,000 or more | 11 (0.4%) | 7 (0.2%) |
| Total | 3,175 (100.0%) | 4,731 (100.0%) |
Household Income by Mortgage Status in Goshen
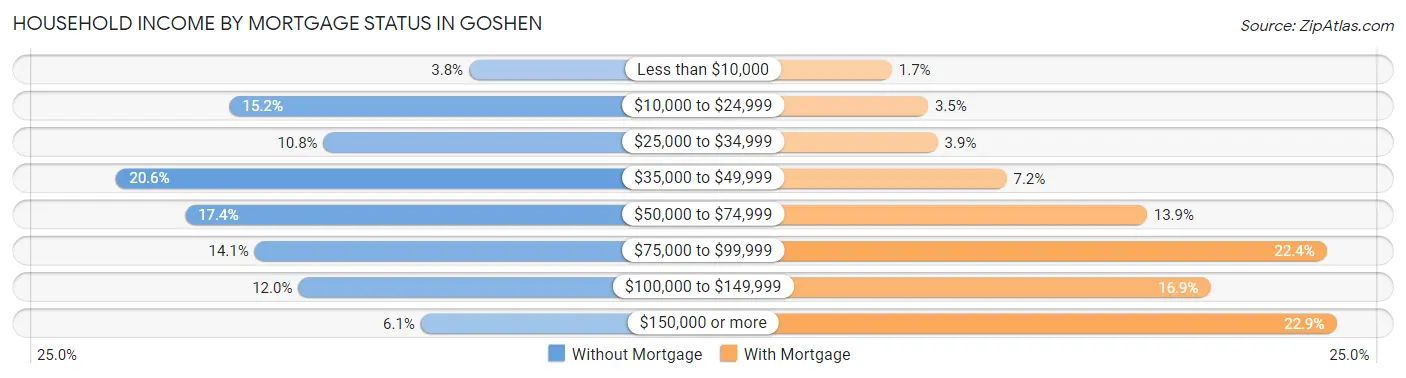
| Household Income | Without Mortgage | With Mortgage |
| Less than $10,000 | 122 (3.8%) | 82 (1.7%) |
| $10,000 to $24,999 | 484 (15.2%) | 163 (3.5%) |
| $25,000 to $34,999 | 342 (10.8%) | 185 (3.9%) |
| $35,000 to $49,999 | 655 (20.6%) | 340 (7.2%) |
| $50,000 to $74,999 | 551 (17.3%) | 656 (13.9%) |
| $75,000 to $99,999 | 446 (14.1%) | 1,061 (22.4%) |
| $100,000 to $149,999 | 380 (12.0%) | 799 (16.9%) |
| $150,000 or more | 195 (6.1%) | 1,083 (22.9%) |
| Total | 3,175 (100.0%) | 4,731 (100.0%) |
Property Value to Household Income Ratio in Goshen
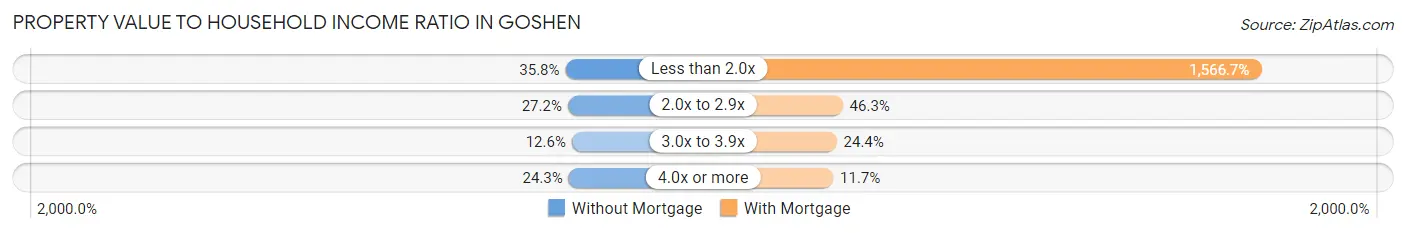
| Value-to-Income Ratio | Without Mortgage | With Mortgage |
| Less than 2.0x | 1,137 (35.8%) | 74,118 (1,566.6%) |
| 2.0x to 2.9x | 862 (27.2%) | 2,191 (46.3%) |
| 3.0x to 3.9x | 401 (12.6%) | 1,152 (24.3%) |
| 4.0x or more | 771 (24.3%) | 552 (11.7%) |
| Total | 3,175 (100.0%) | 4,731 (100.0%) |
Real Estate Taxes by Mortgage Status in Goshen
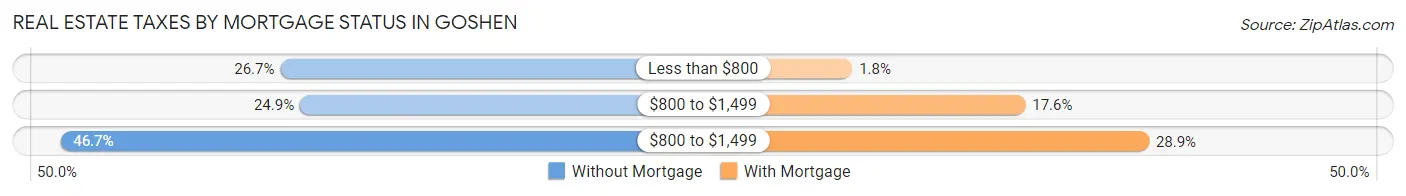
| Property Taxes | Without Mortgage | With Mortgage |
| Less than $800 | 846 (26.7%) | 83 (1.8%) |
| $800 to $1,499 | 789 (24.8%) | 831 (17.6%) |
| $800 to $1,499 | 1,484 (46.7%) | 1,365 (28.8%) |
| Total | 3,175 (100.0%) | 4,731 (100.0%) |
Health & Disability in Goshen
Health Insurance Coverage by Age in Goshen
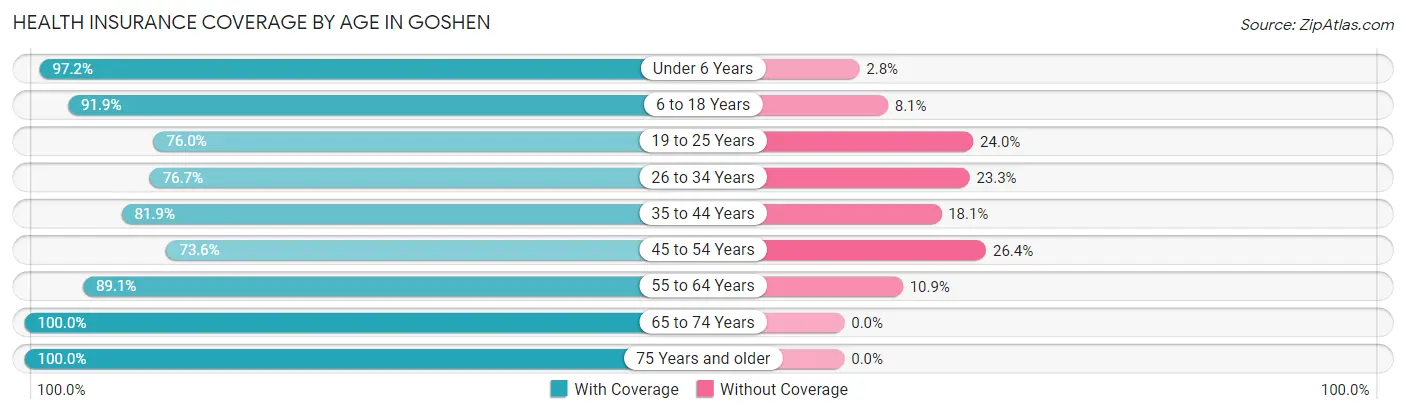
| Age Bracket | With Coverage | Without Coverage |
| Under 6 Years | 2,492 (97.2%) | 72 (2.8%) |
| 6 to 18 Years | 5,912 (91.9%) | 522 (8.1%) |
| 19 to 25 Years | 2,750 (76.0%) | 870 (24.0%) |
| 26 to 34 Years | 2,832 (76.7%) | 862 (23.3%) |
| 35 to 44 Years | 3,487 (81.9%) | 769 (18.1%) |
| 45 to 54 Years | 2,754 (73.6%) | 990 (26.4%) |
| 55 to 64 Years | 2,971 (89.1%) | 363 (10.9%) |
| 65 to 74 Years | 3,134 (100.0%) | 0 (0.0%) |
| 75 Years and older | 3,245 (100.0%) | 0 (0.0%) |
| Total | 29,577 (86.9%) | 4,448 (13.1%) |
Health Insurance Coverage by Citizenship Status in Goshen
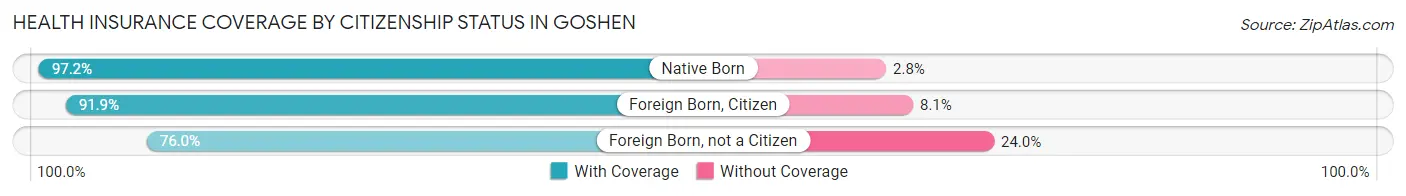
| Citizenship Status | With Coverage | Without Coverage |
| Native Born | 2,492 (97.2%) | 72 (2.8%) |
| Foreign Born, Citizen | 5,912 (91.9%) | 522 (8.1%) |
| Foreign Born, not a Citizen | 2,750 (76.0%) | 870 (24.0%) |
Health Insurance Coverage by Household Income in Goshen
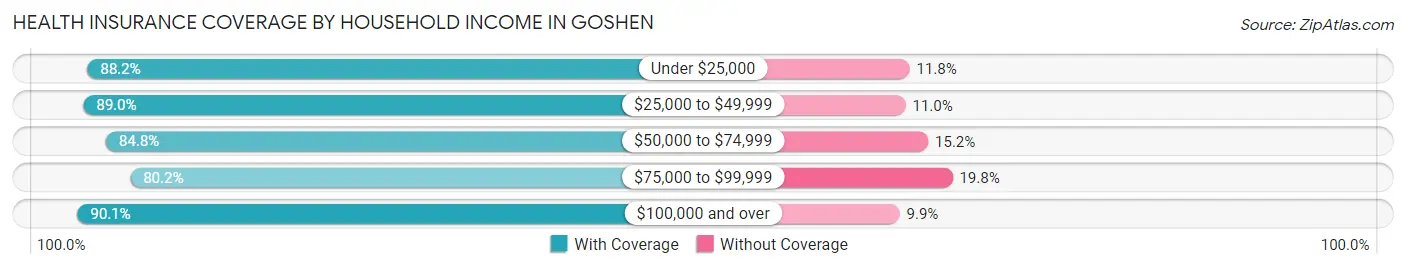
| Household Income | With Coverage | Without Coverage |
| Under $25,000 | 3,189 (88.2%) | 425 (11.8%) |
| $25,000 to $49,999 | 7,711 (89.0%) | 954 (11.0%) |
| $50,000 to $74,999 | 5,935 (84.8%) | 1,067 (15.2%) |
| $75,000 to $99,999 | 4,260 (80.2%) | 1,052 (19.8%) |
| $100,000 and over | 7,923 (90.1%) | 870 (9.9%) |
Public vs Private Health Insurance Coverage by Age in Goshen
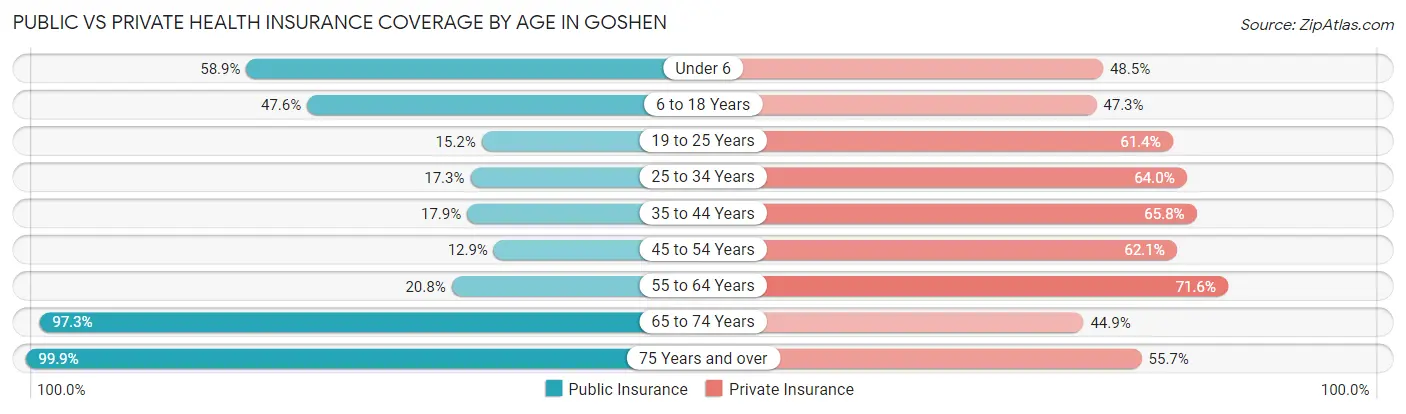
| Age Bracket | Public Insurance | Private Insurance |
| Under 6 | 1,509 (58.9%) | 1,243 (48.5%) |
| 6 to 18 Years | 3,061 (47.6%) | 3,040 (47.2%) |
| 19 to 25 Years | 549 (15.2%) | 2,222 (61.4%) |
| 25 to 34 Years | 638 (17.3%) | 2,363 (64.0%) |
| 35 to 44 Years | 761 (17.9%) | 2,801 (65.8%) |
| 45 to 54 Years | 484 (12.9%) | 2,326 (62.1%) |
| 55 to 64 Years | 692 (20.8%) | 2,388 (71.6%) |
| 65 to 74 Years | 3,048 (97.3%) | 1,406 (44.9%) |
| 75 Years and over | 3,240 (99.9%) | 1,806 (55.6%) |
| Total | 13,982 (41.1%) | 19,595 (57.6%) |
Disability Status by Sex by Age in Goshen
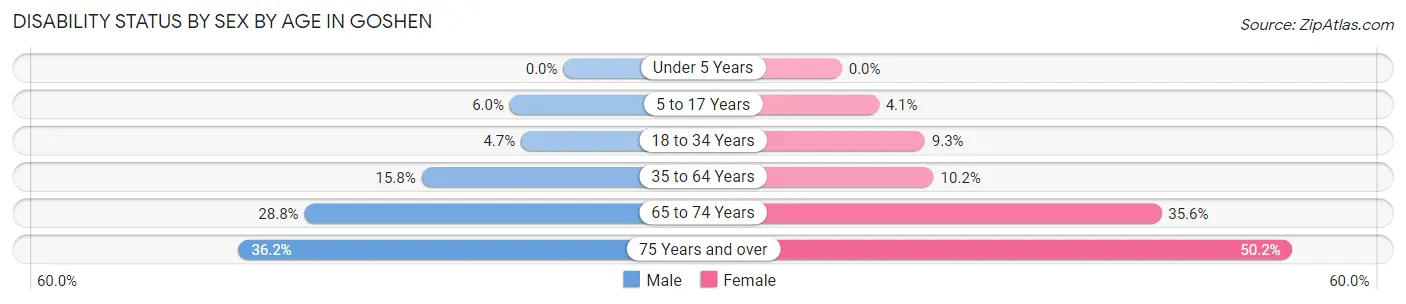
| Age Bracket | Male | Female |
| Under 5 Years | 0 (0.0%) | 0 (0.0%) |
| 5 to 17 Years | 199 (6.0%) | 129 (4.1%) |
| 18 to 34 Years | 193 (4.7%) | 338 (9.2%) |
| 35 to 64 Years | 860 (15.8%) | 602 (10.2%) |
| 65 to 74 Years | 394 (28.8%) | 629 (35.6%) |
| 75 Years and over | 474 (36.2%) | 971 (50.2%) |
Disability Class by Sex by Age in Goshen
Disability Class: Hearing Difficulty
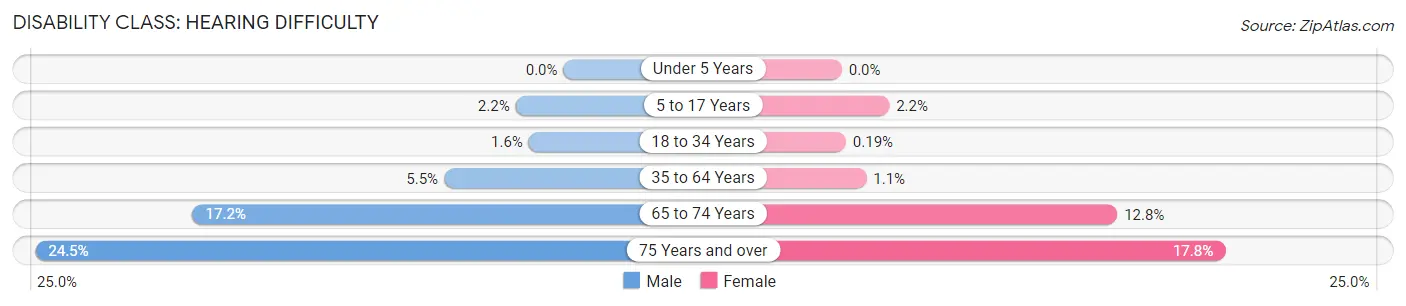
| Age Bracket | Male | Female |
| Under 5 Years | 0 (0.0%) | 0 (0.0%) |
| 5 to 17 Years | 74 (2.2%) | 69 (2.2%) |
| 18 to 34 Years | 66 (1.6%) | 7 (0.2%) |
| 35 to 64 Years | 302 (5.5%) | 67 (1.1%) |
| 65 to 74 Years | 235 (17.2%) | 226 (12.8%) |
| 75 Years and over | 321 (24.5%) | 344 (17.8%) |
Disability Class: Vision Difficulty
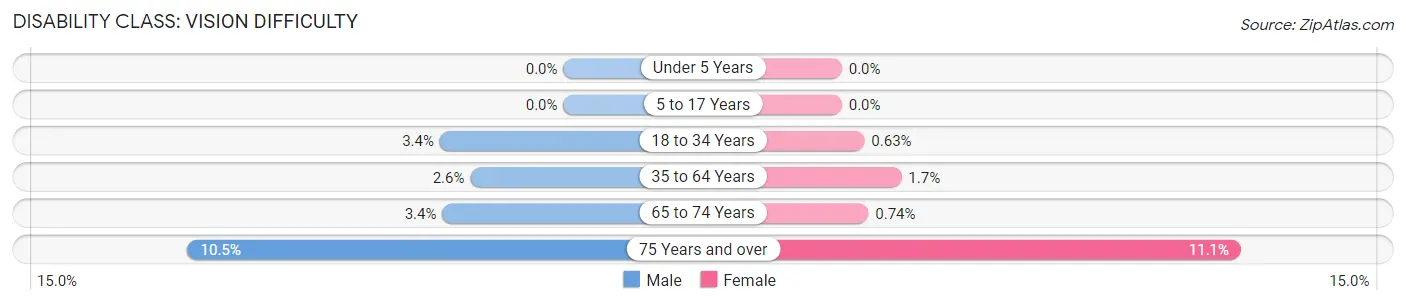
| Age Bracket | Male | Female |
| Under 5 Years | 0 (0.0%) | 0 (0.0%) |
| 5 to 17 Years | 0 (0.0%) | 0 (0.0%) |
| 18 to 34 Years | 141 (3.4%) | 23 (0.6%) |
| 35 to 64 Years | 141 (2.6%) | 98 (1.7%) |
| 65 to 74 Years | 46 (3.4%) | 13 (0.7%) |
| 75 Years and over | 137 (10.5%) | 215 (11.1%) |
Disability Class: Cognitive Difficulty
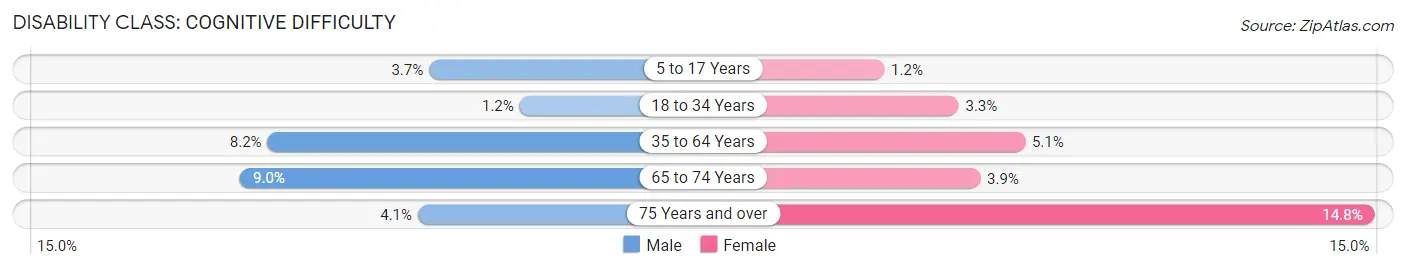
| Age Bracket | Male | Female |
| 5 to 17 Years | 125 (3.7%) | 37 (1.2%) |
| 18 to 34 Years | 50 (1.2%) | 119 (3.3%) |
| 35 to 64 Years | 449 (8.2%) | 300 (5.1%) |
| 65 to 74 Years | 123 (9.0%) | 68 (3.8%) |
| 75 Years and over | 53 (4.1%) | 287 (14.8%) |
Disability Class: Ambulatory Difficulty
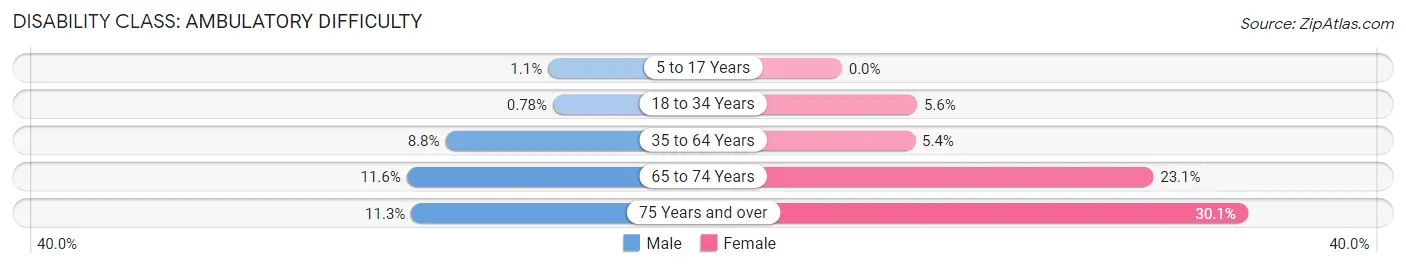
| Age Bracket | Male | Female |
| 5 to 17 Years | 38 (1.1%) | 0 (0.0%) |
| 18 to 34 Years | 32 (0.8%) | 204 (5.6%) |
| 35 to 64 Years | 477 (8.8%) | 320 (5.4%) |
| 65 to 74 Years | 159 (11.6%) | 409 (23.1%) |
| 75 Years and over | 148 (11.3%) | 583 (30.1%) |
Disability Class: Self-Care Difficulty
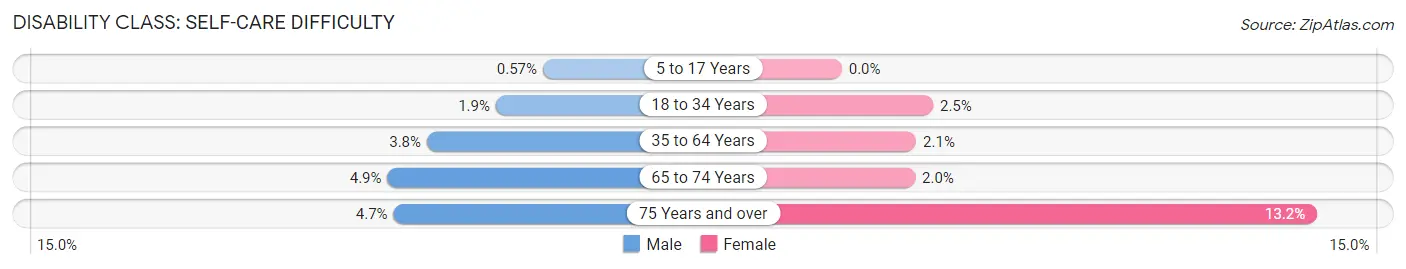
| Age Bracket | Male | Female |
| 5 to 17 Years | 19 (0.6%) | 0 (0.0%) |
| 18 to 34 Years | 77 (1.9%) | 93 (2.5%) |
| 35 to 64 Years | 207 (3.8%) | 122 (2.1%) |
| 65 to 74 Years | 67 (4.9%) | 36 (2.0%) |
| 75 Years and over | 62 (4.7%) | 256 (13.2%) |
Technology Access in Goshen
Computing Device Access in Goshen
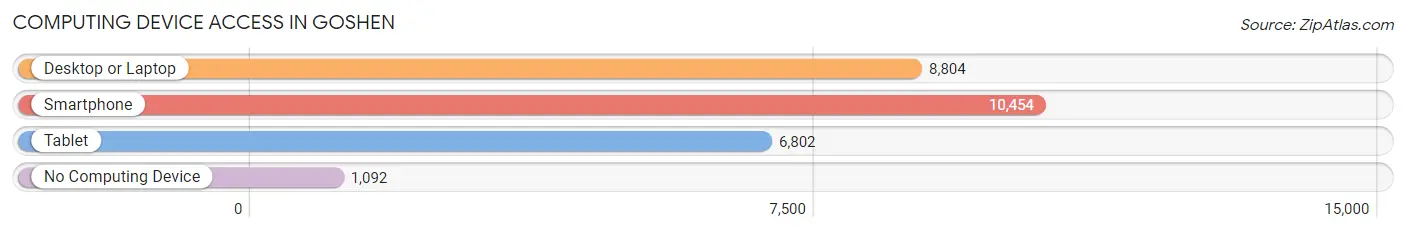
| Device Type | # Households | % Households |
| Desktop or Laptop | 8,804 | 69.8% |
| Smartphone | 10,454 | 82.9% |
| Tablet | 6,802 | 53.9% |
| No Computing Device | 1,092 | 8.7% |
| Total | 12,614 | 100.0% |
Internet Access in Goshen
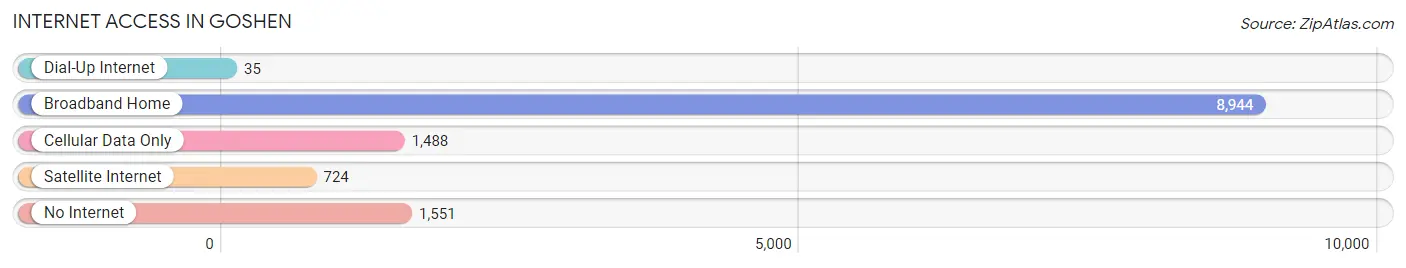
| Internet Type | # Households | % Households |
| Dial-Up Internet | 35 | 0.3% |
| Broadband Home | 8,944 | 70.9% |
| Cellular Data Only | 1,488 | 11.8% |
| Satellite Internet | 724 | 5.7% |
| No Internet | 1,551 | 12.3% |
| Total | 12,614 | 100.0% |
Goshen Summary
Goshen is a city located in Elkhart County, Indiana, United States. It is the county seat of Elkhart County and is located in the northern part of the state, about 15 miles east of South Bend. The population of Goshen was 31,719 at the 2010 census, which was an increase of 11.3% from 2000.
Geography
Goshen is located at 41°30'N 85°49'W (41.50, -85.82). According to the 2010 census, Goshen has a total area of 11.1 square miles (28.7 km2), of which 11.1 square miles (28.7 km2) is land and 0.04 square miles (0.1 km2) is water.
Goshen is located in the northern part of Indiana, about 15 miles east of South Bend. The city is situated in the heart of the Elkhart-Goshen metropolitan area, which is part of the larger South Bend-Elkhart-Mishawaka Combined Statistical Area.
History
Goshen was founded in 1831 by William B. Milroy, a Quaker from Pennsylvania. The city was named after the biblical Land of Goshen, which was the home of the Israelites during their time in Egypt. The city was incorporated in 1835 and became the county seat of Elkhart County in 1837.
Goshen was a major stop on the Underground Railroad, and many escaped slaves found refuge in the city. During the Civil War, Goshen was a major center of Union activity, and the city was the site of several major battles.
Goshen experienced a period of rapid growth in the late 19th and early 20th centuries, as the city became a major center for the manufacture of carriages and wagons. The city was also home to several major industries, including the Studebaker Corporation, which produced automobiles from 1902 to 1963.
Economy
Goshen is a major center for manufacturing in northern Indiana. The city is home to several major employers, including the Elkhart County government, the Elkhart County School Corporation, and the Elkhart General Hospital.
Goshen is also home to several major manufacturing companies, including Forest River, Inc., a manufacturer of recreational vehicles; Keystone RV Company, a manufacturer of recreational vehicles; and Monaco Coach Corporation, a manufacturer of motorhomes.
Demographics
As of the 2010 census, there were 31,719 people, 12,845 households, and 8,072 families residing in the city. The population density was 2,851.3 people per square mile (1,101.2/km2). There were 13,845 housing units at an average density of 1,241.3 per square mile (478.3/km2). The racial makeup of the city was 79.2% White, 0.7% African American, 0.5% Native American, 0.7% Asian, 0.1% Pacific Islander, 16.2% from other races, and 2.7% from two or more races. Hispanic or Latino of any race were 33.2% of the population.
The median income for a household in the city was $41,945, and the median income for a family was $50,945. Males had a median income of $37,945 versus $27,945 for females. The per capita income for the city was $20,945. About 11.2% of families and 14.3% of the population were below the poverty line, including 19.2% of those under age 18 and 8.2% of those age 65 or over.
Conclusion
Goshen is a city located in Elkhart County, Indiana, United States. It is the county seat of Elkhart County and is located in the northern part of the state, about 15 miles east of South Bend. The population of Goshen was 31,719 at the 2010 census, which was an increase of 11.3% from 2000. Goshen is a major center for manufacturing in northern Indiana, and the city is home to several major employers, including the Elkhart County government, the Elkhart County School Corporation, and the Elkhart General Hospital. The racial makeup of the city was 79.2% White, 0.7% African American, 0.5% Native American, 0.7% Asian, 0.1% Pacific Islander, 16.2% from other races, and 2.7% from two or more races. The median income for a household in the city was $41,945, and the median income for a family was $50,945. About 11.2% of families and 14.3% of the population were below the poverty line.
Common Questions
What is Per Capita Income in Goshen?
Per Capita income in Goshen is $25,908.
What is the Median Family Income in Goshen?
Median Family Income in Goshen is $65,331.
What is the Median Household income in Goshen?
Median Household Income in Goshen is $52,233.
What is Income or Wage Gap in Goshen?
Income or Wage Gap in Goshen is 24.9%.
Women in Goshen earn 75.1 cents for every dollar earned by a man.
What is Family Income Deficit in Goshen?
Family Income Deficit in Goshen is $9,255.
Families that are below poverty line in Goshen earn $9,255 less on average than the poverty threshold level.
What is Inequality or Gini Index in Goshen?
Inequality or Gini Index in Goshen is 0.42.
What is the Total Population of Goshen?
Total Population of Goshen is 34,704.
What is the Total Male Population of Goshen?
Total Male Population of Goshen is 16,691.
What is the Total Female Population of Goshen?
Total Female Population of Goshen is 18,013.
What is the Ratio of Males per 100 Females in Goshen?
There are 92.66 Males per 100 Females in Goshen.
What is the Ratio of Females per 100 Males in Goshen?
There are 107.92 Females per 100 Males in Goshen.
What is the Median Population Age in Goshen?
Median Population Age in Goshen is 38.0 Years.
What is the Average Family Size in Goshen
Average Family Size in Goshen is 3.5 People.
What is the Average Household Size in Goshen
Average Household Size in Goshen is 2.6 People.
How Large is the Labor Force in Goshen?
There are 16,157 People in the Labor Forcein in Goshen.
What is the Percentage of People in the Labor Force in Goshen?
60.3% of People are in the Labor Force in Goshen.
What is the Unemployment Rate in Goshen?
Unemployment Rate in Goshen is 4.8%.