North Amityville, NY Map & Demographics
North Amityville Map
North Amityville Overview
$39,430
PER CAPITA INCOME
$120,348
AVG FAMILY INCOME
$94,056
AVG HOUSEHOLD INCOME
12.0%
WAGE / INCOME GAP [ % ]
88.0¢/ $1
WAGE / INCOME GAP [ $ ]
0.44
INEQUALITY / GINI INDEX
20,336
TOTAL POPULATION
9,524
MALE POPULATION
10,812
FEMALE POPULATION
88.09
MALES / 100 FEMALES
113.52
FEMALES / 100 MALES
37.3
MEDIAN AGE
4.2
AVG FAMILY SIZE
3.5
AVG HOUSEHOLD SIZE
12,200
LABOR FORCE [ PEOPLE ]
74.4%
PERCENT IN LABOR FORCE
4.5%
UNEMPLOYMENT RATE
Income in North Amityville
Income Overview in North Amityville
Per Capita Income in North Amityville is $39,430, while median incomes of families and households are $120,348 and $94,056 respectively.
| Characteristic | Number | Measure |
| Per Capita Income | 20,336 | $39,430 |
| Median Family Income | 3,915 | $120,348 |
| Mean Family Income | 3,915 | $147,850 |
| Median Household Income | 5,679 | $94,056 |
| Mean Household Income | 5,679 | $131,727 |
| Income Deficit | 3,915 | $0 |
| Wage / Income Gap (%) | 20,336 | 12.01% |
| Wage / Income Gap ($) | 20,336 | 87.99¢ per $1 |
| Gini / Inequality Index | 20,336 | 0.44 |
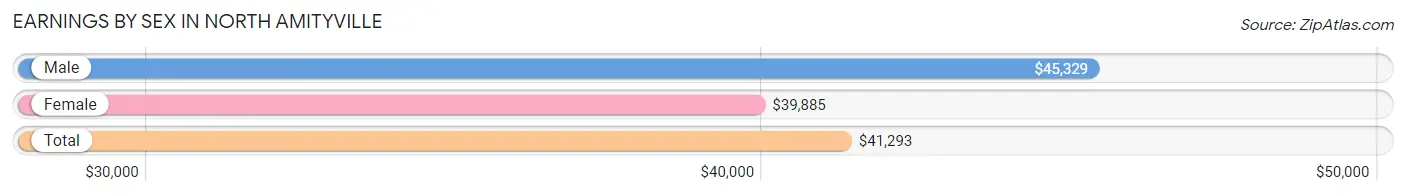
Earnings by Sex in North Amityville
Average Earnings in North Amityville are $41,293, $45,329 for men and $39,885 for women, a difference of 12.0%.
| Sex | Number | Average Earnings |
| Male | 5,916 (48.8%) | $45,329 |
| Female | 6,200 (51.2%) | $39,885 |
| Total | 12,116 (100.0%) | $41,293 |
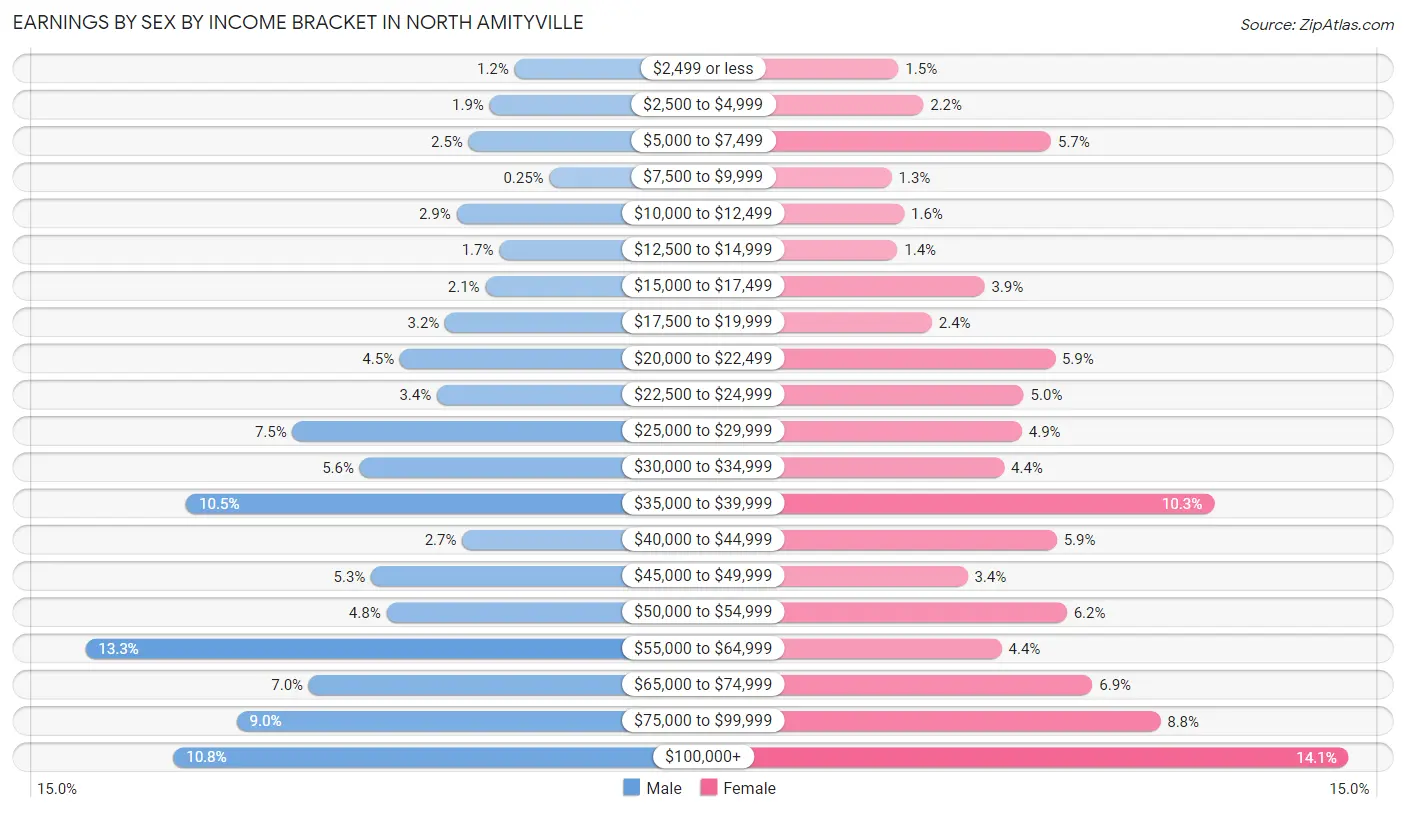
Earnings by Sex by Income Bracket in North Amityville
The most common earnings brackets in North Amityville are $55,000 to $64,999 for men (786 | 13.3%) and $100,000+ for women (874 | 14.1%).
| Income | Male | Female |
| $2,499 or less | 73 (1.2%) | 90 (1.5%) |
| $2,500 to $4,999 | 114 (1.9%) | 133 (2.1%) |
| $5,000 to $7,499 | 149 (2.5%) | 356 (5.7%) |
| $7,500 to $9,999 | 15 (0.3%) | 78 (1.3%) |
| $10,000 to $12,499 | 169 (2.9%) | 100 (1.6%) |
| $12,500 to $14,999 | 98 (1.7%) | 88 (1.4%) |
| $15,000 to $17,499 | 121 (2.1%) | 240 (3.9%) |
| $17,500 to $19,999 | 188 (3.2%) | 148 (2.4%) |
| $20,000 to $22,499 | 263 (4.4%) | 363 (5.9%) |
| $22,500 to $24,999 | 202 (3.4%) | 308 (5.0%) |
| $25,000 to $29,999 | 442 (7.5%) | 305 (4.9%) |
| $30,000 to $34,999 | 330 (5.6%) | 274 (4.4%) |
| $35,000 to $39,999 | 619 (10.5%) | 640 (10.3%) |
| $40,000 to $44,999 | 160 (2.7%) | 366 (5.9%) |
| $45,000 to $49,999 | 311 (5.3%) | 210 (3.4%) |
| $50,000 to $54,999 | 286 (4.8%) | 383 (6.2%) |
| $55,000 to $64,999 | 786 (13.3%) | 270 (4.3%) |
| $65,000 to $74,999 | 415 (7.0%) | 428 (6.9%) |
| $75,000 to $99,999 | 535 (9.0%) | 546 (8.8%) |
| $100,000+ | 640 (10.8%) | 874 (14.1%) |
| Total | 5,916 (100.0%) | 6,200 (100.0%) |
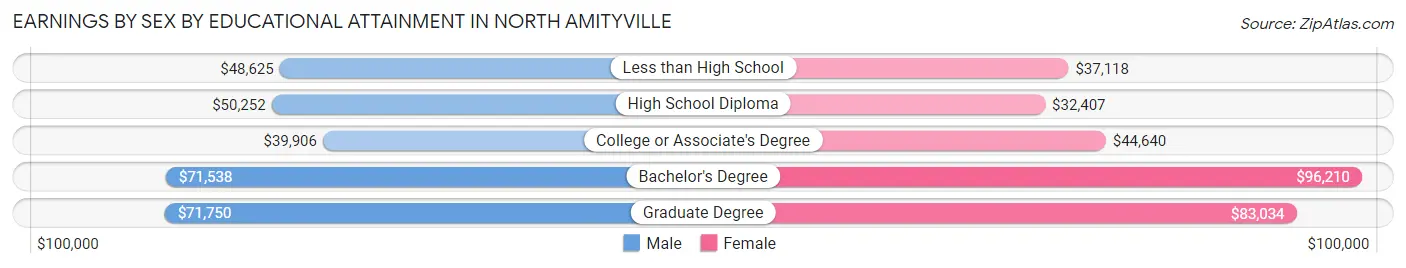
Earnings by Sex by Educational Attainment in North Amityville
Average earnings in North Amityville are $50,500 for men and $46,672 for women, a difference of 7.6%. Men with an educational attainment of graduate degree enjoy the highest average annual earnings of $71,750, while those with college or associate's degree education earn the least with $39,906. Women with an educational attainment of bachelor's degree earn the most with the average annual earnings of $96,210, while those with high school diploma education have the smallest earnings of $32,407.
| Educational Attainment | Male Income | Female Income |
| Less than High School | $48,625 | $37,118 |
| High School Diploma | $50,252 | $32,407 |
| College or Associate's Degree | $39,906 | $44,640 |
| Bachelor's Degree | $71,538 | $96,210 |
| Graduate Degree | $71,750 | $83,034 |
| Total | $50,500 | $46,672 |
Family Income in North Amityville
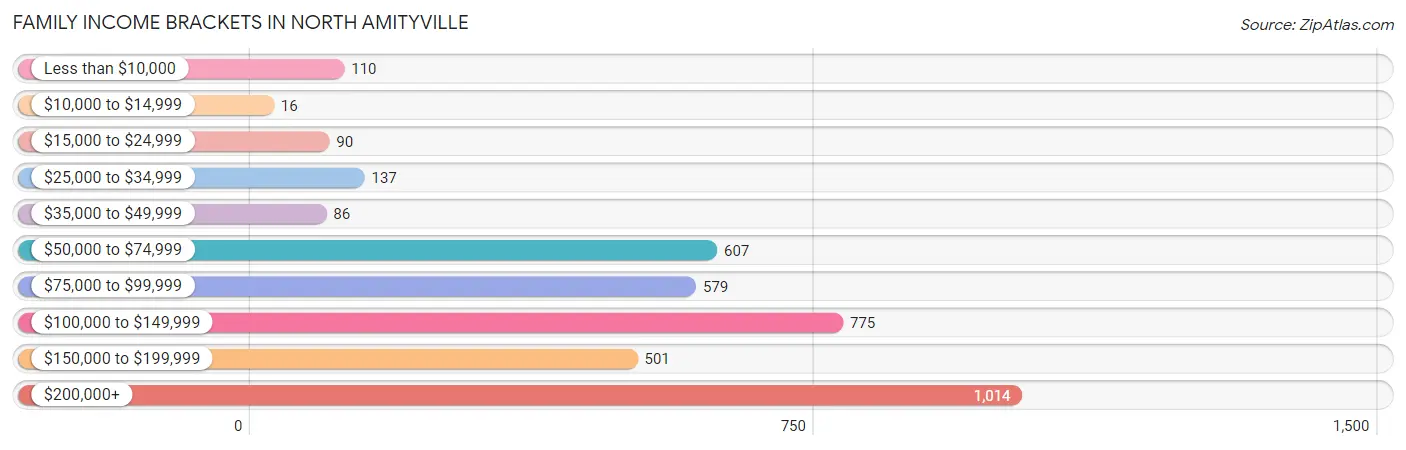
Family Income Brackets in North Amityville
According to the North Amityville family income data, there are 1,014 families falling into the $200,000+ income range, which is the most common income bracket and makes up 25.9% of all families. Conversely, the $10,000 to $14,999 income bracket is the least frequent group with only 16 families (0.4%) belonging to this category.
| Income Bracket | # Families | % Families |
| Less than $10,000 | 110 | 2.8% |
| $10,000 to $14,999 | 16 | 0.4% |
| $15,000 to $24,999 | 90 | 2.3% |
| $25,000 to $34,999 | 137 | 3.5% |
| $35,000 to $49,999 | 86 | 2.2% |
| $50,000 to $74,999 | 607 | 15.5% |
| $75,000 to $99,999 | 579 | 14.8% |
| $100,000 to $149,999 | 775 | 19.8% |
| $150,000 to $199,999 | 501 | 12.8% |
| $200,000+ | 1,014 | 25.9% |
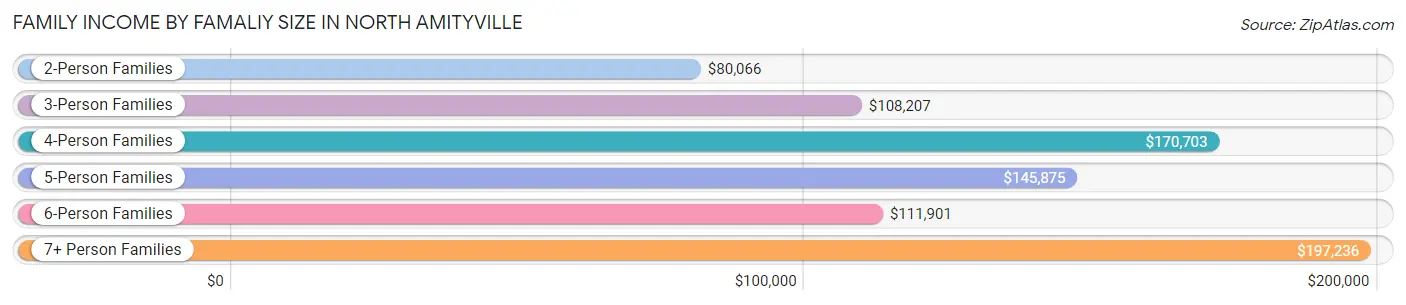
Family Income by Famaliy Size in North Amityville
7+ person families (363 | 9.3%) account for the highest median family income in North Amityville with $197,236 per family, while 4-person families (914 | 23.4%) have the highest median income of $42,676 per family member.
| Income Bracket | # Families | Median Income |
| 2-Person Families | 1,297 (33.1%) | $80,066 |
| 3-Person Families | 777 (19.9%) | $108,207 |
| 4-Person Families | 914 (23.4%) | $170,703 |
| 5-Person Families | 355 (9.1%) | $145,875 |
| 6-Person Families | 209 (5.3%) | $111,901 |
| 7+ Person Families | 363 (9.3%) | $197,236 |
| Total | 3,915 (100.0%) | $120,348 |
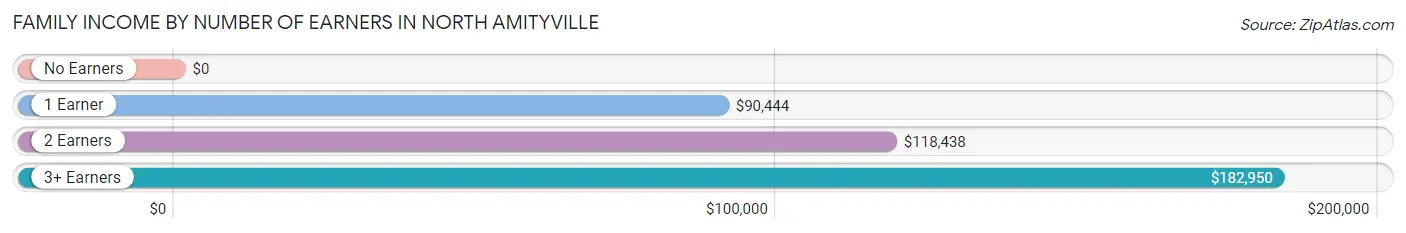
Family Income by Number of Earners in North Amityville
| Number of Earners | # Families | Median Income |
| No Earners | 291 (7.4%) | $0 |
| 1 Earner | 683 (17.4%) | $90,444 |
| 2 Earners | 1,491 (38.1%) | $118,438 |
| 3+ Earners | 1,450 (37.0%) | $182,950 |
| Total | 3,915 (100.0%) | $120,348 |
Household Income in North Amityville
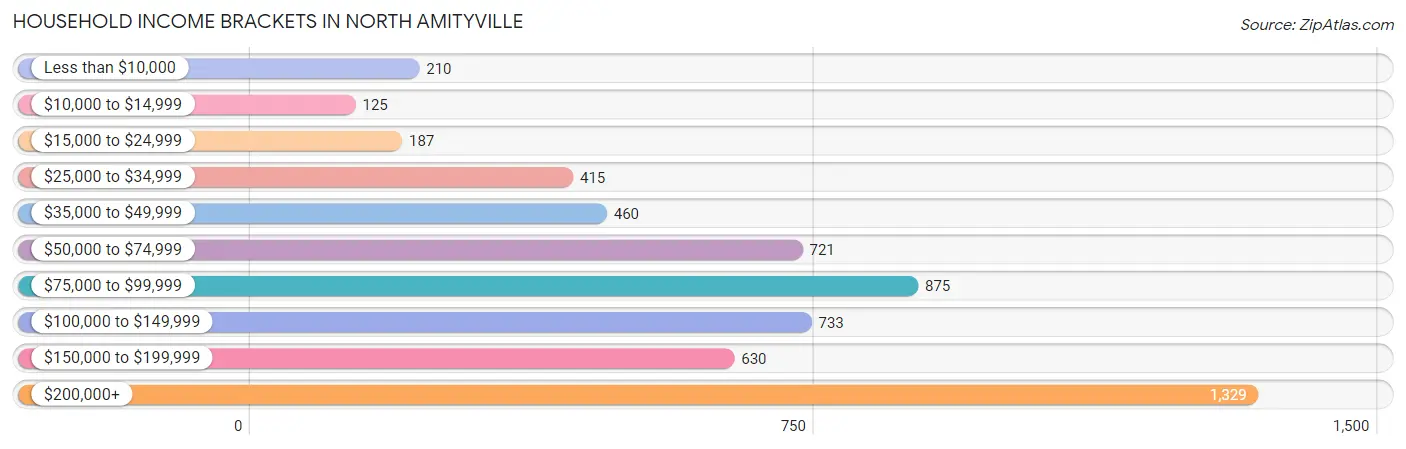
Household Income Brackets in North Amityville
With 1,329 households falling in the category, the $200,000+ income range is the most frequent in North Amityville, accounting for 23.4% of all households. In contrast, only 125 households (2.2%) fall into the $10,000 to $14,999 income bracket, making it the least populous group.
| Income Bracket | # Households | % Households |
| Less than $10,000 | 210 | 3.7% |
| $10,000 to $14,999 | 125 | 2.2% |
| $15,000 to $24,999 | 187 | 3.3% |
| $25,000 to $34,999 | 415 | 7.3% |
| $35,000 to $49,999 | 460 | 8.1% |
| $50,000 to $74,999 | 721 | 12.7% |
| $75,000 to $99,999 | 875 | 15.4% |
| $100,000 to $149,999 | 733 | 12.9% |
| $150,000 to $199,999 | 630 | 11.1% |
| $200,000+ | 1,329 | 23.4% |
Household Income by Householder Age in North Amityville
The median household income in North Amityville is $94,056, with the highest median household income of $114,933 found in the 45 to 64 years age bracket for the primary householder. A total of 3,192 households (56.2%) fall into this category. Meanwhile, the 15 to 24 years age bracket for the primary householder has the lowest median household income of $0, with 21 households (0.4%) in this group.
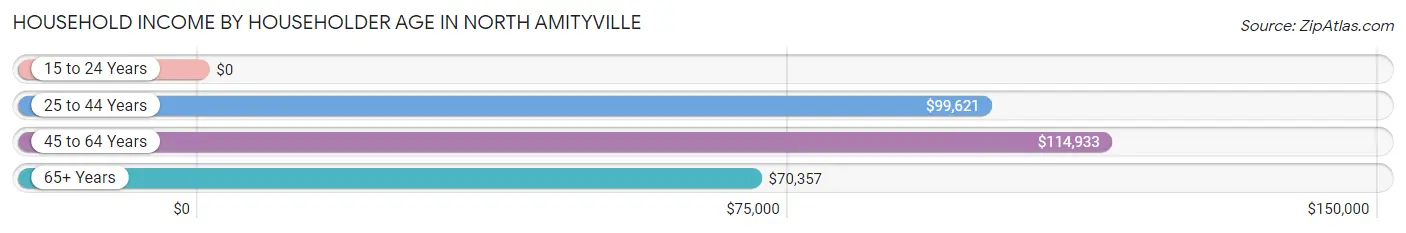
| Income Bracket | # Households | Median Income |
| 15 to 24 Years | 21 (0.4%) | $0 |
| 25 to 44 Years | 958 (16.9%) | $99,621 |
| 45 to 64 Years | 3,192 (56.2%) | $114,933 |
| 65+ Years | 1,508 (26.6%) | $70,357 |
| Total | 5,679 (100.0%) | $94,056 |
Poverty in North Amityville
Income Below Poverty by Sex and Age in North Amityville
With 8.4% poverty level for males and 8.5% for females among the residents of North Amityville, under 5 year old males and 16 and 17 year old females are the most vulnerable to poverty, with 137 males (37.1%) and 69 females (30.5%) in their respective age groups living below the poverty level.
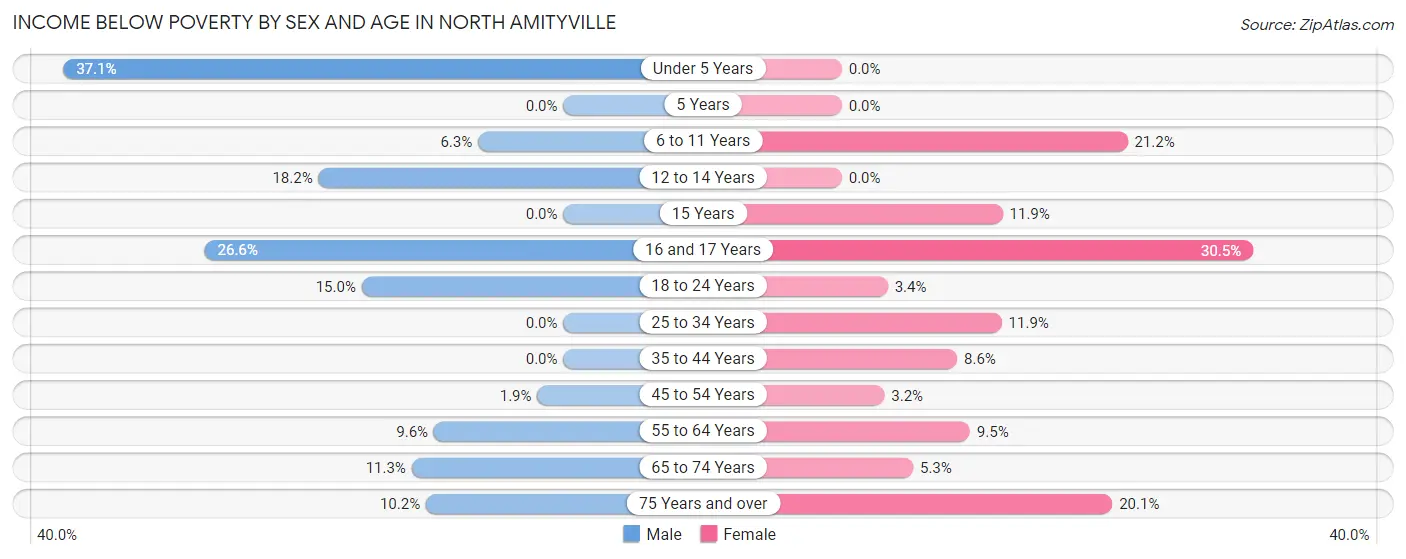
| Age Bracket | Male | Female |
| Under 5 Years | 137 (37.1%) | 0 (0.0%) |
| 5 Years | 0 (0.0%) | 0 (0.0%) |
| 6 to 11 Years | 31 (6.3%) | 112 (21.2%) |
| 12 to 14 Years | 68 (18.2%) | 0 (0.0%) |
| 15 Years | 0 (0.0%) | 16 (11.9%) |
| 16 and 17 Years | 106 (26.6%) | 69 (30.5%) |
| 18 to 24 Years | 219 (15.0%) | 34 (3.4%) |
| 25 to 34 Years | 0 (0.0%) | 134 (11.9%) |
| 35 to 44 Years | 0 (0.0%) | 92 (8.6%) |
| 45 to 54 Years | 27 (1.9%) | 65 (3.2%) |
| 55 to 64 Years | 94 (9.6%) | 142 (9.5%) |
| 65 to 74 Years | 68 (11.3%) | 38 (5.3%) |
| 75 Years and over | 45 (10.2%) | 199 (20.1%) |
| Total | 795 (8.4%) | 901 (8.5%) |
Income Above Poverty by Sex and Age in North Amityville
According to the poverty statistics in North Amityville, males aged 5 years and females aged under 5 years are the age groups that are most secure financially, with 100.0% of males and 100.0% of females in these age groups living above the poverty line.
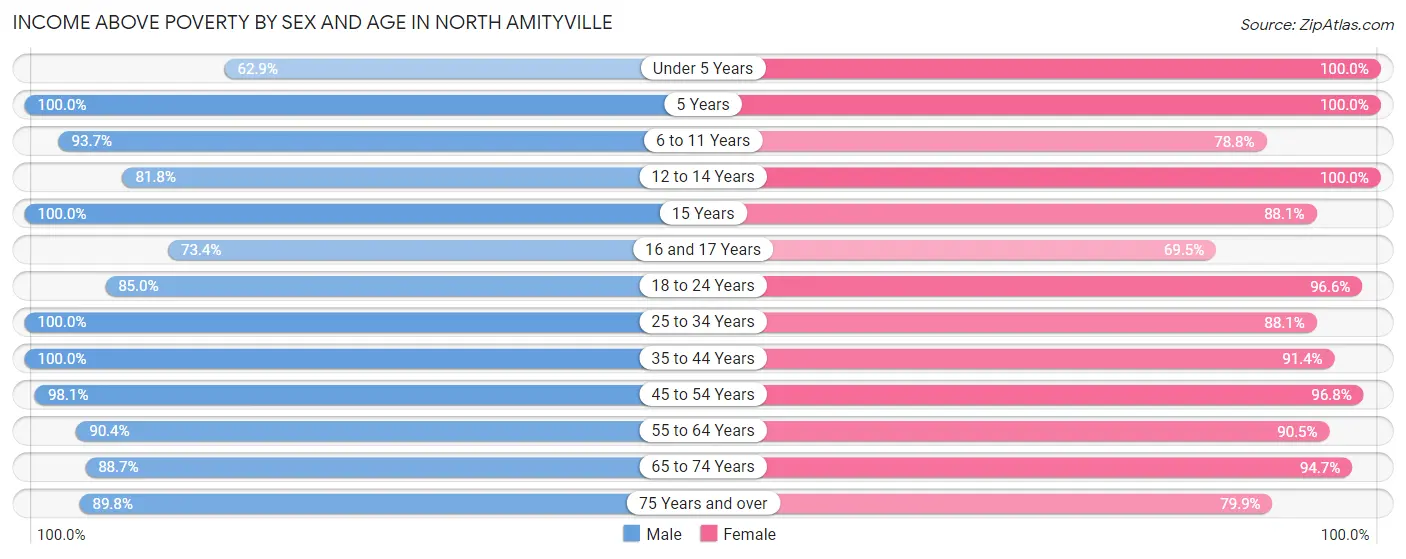
| Age Bracket | Male | Female |
| Under 5 Years | 232 (62.9%) | 632 (100.0%) |
| 5 Years | 221 (100.0%) | 119 (100.0%) |
| 6 to 11 Years | 459 (93.7%) | 416 (78.8%) |
| 12 to 14 Years | 306 (81.8%) | 553 (100.0%) |
| 15 Years | 292 (100.0%) | 118 (88.1%) |
| 16 and 17 Years | 292 (73.4%) | 157 (69.5%) |
| 18 to 24 Years | 1,244 (85.0%) | 964 (96.6%) |
| 25 to 34 Years | 1,655 (100.0%) | 995 (88.1%) |
| 35 to 44 Years | 759 (100.0%) | 983 (91.4%) |
| 45 to 54 Years | 1,372 (98.1%) | 1,995 (96.8%) |
| 55 to 64 Years | 884 (90.4%) | 1,351 (90.5%) |
| 65 to 74 Years | 536 (88.7%) | 681 (94.7%) |
| 75 Years and over | 396 (89.8%) | 792 (79.9%) |
| Total | 8,648 (91.6%) | 9,756 (91.5%) |
Income Below Poverty Among Married-Couple Families in North Amityville
The poverty statistics for married-couple families in North Amityville show that 1.0% or 20 of the total 2,089 families live below the poverty line. Families with 1 or 2 children have the highest poverty rate of 2.6%, comprising of 20 families. On the other hand, families with no children have the lowest poverty rate of 0.0%, which includes 0 families.
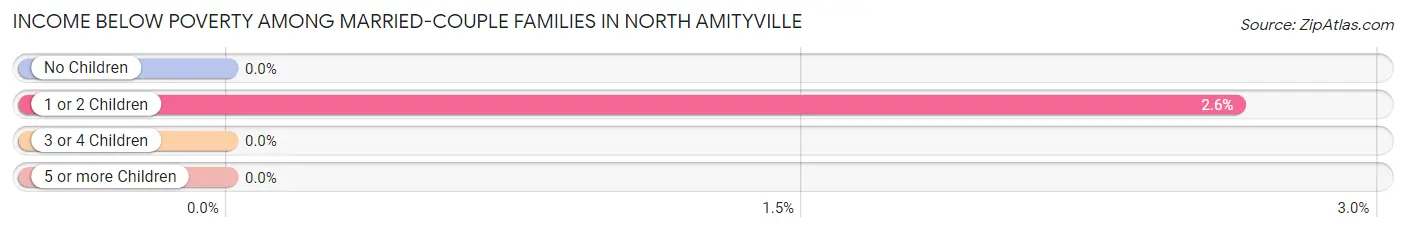
| Children | Above Poverty | Below Poverty |
| No Children | 1,082 (100.0%) | 0 (0.0%) |
| 1 or 2 Children | 741 (97.4%) | 20 (2.6%) |
| 3 or 4 Children | 87 (100.0%) | 0 (0.0%) |
| 5 or more Children | 159 (100.0%) | 0 (0.0%) |
| Total | 2,069 (99.0%) | 20 (1.0%) |
Income Below Poverty Among Single-Parent Households in North Amityville
According to the poverty data in North Amityville, 4.5% or 15 single-father households and 15.3% or 228 single-mother households are living below the poverty line. Among single-father households, those with 1 or 2 children have the highest poverty rate, with 15 households (14.0%) experiencing poverty. Likewise, among single-mother households, those with 3 or 4 children have the highest poverty rate, with 23 households (47.9%) falling below the poverty line.
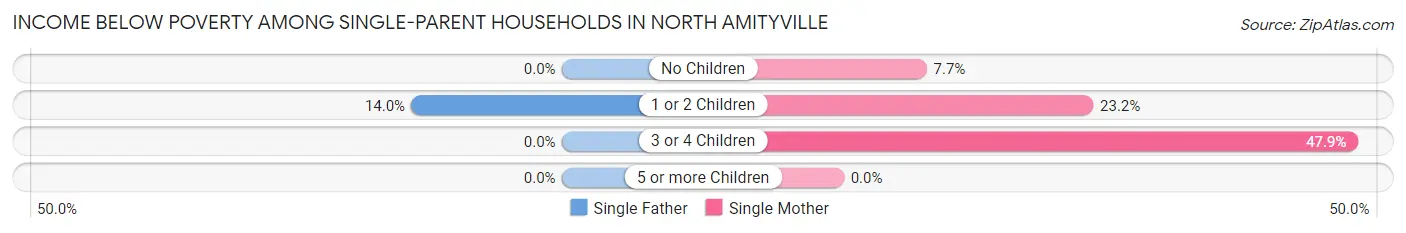
| Children | Single Father | Single Mother |
| No Children | 0 (0.0%) | 61 (7.7%) |
| 1 or 2 Children | 15 (14.0%) | 144 (23.2%) |
| 3 or 4 Children | 0 (0.0%) | 23 (47.9%) |
| 5 or more Children | 0 (0.0%) | 0 (0.0%) |
| Total | 15 (4.5%) | 228 (15.3%) |
Income Below Poverty Among Married-Couple vs Single-Parent Households in North Amityville
The poverty data for North Amityville shows that 20 of the married-couple family households (1.0%) and 243 of the single-parent households (13.3%) are living below the poverty level. Within the married-couple family households, those with 1 or 2 children have the highest poverty rate, with 20 households (2.6%) falling below the poverty line. Among the single-parent households, those with 3 or 4 children have the highest poverty rate, with 23 household (36.5%) living below poverty.
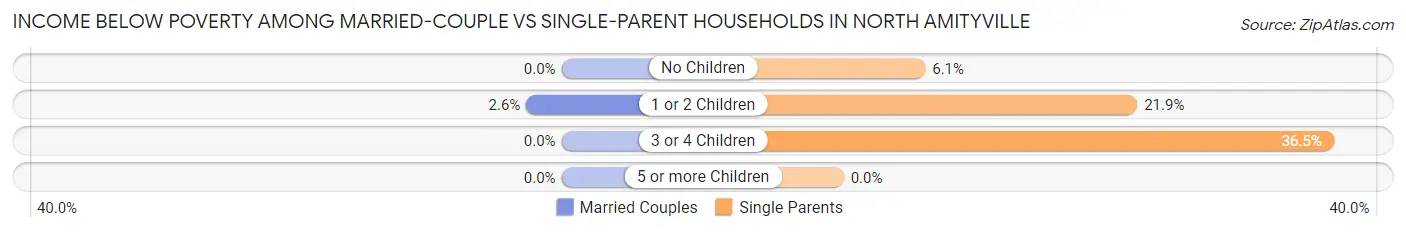
| Children | Married-Couple Families | Single-Parent Households |
| No Children | 0 (0.0%) | 61 (6.1%) |
| 1 or 2 Children | 20 (2.6%) | 159 (21.9%) |
| 3 or 4 Children | 0 (0.0%) | 23 (36.5%) |
| 5 or more Children | 0 (0.0%) | 0 (0.0%) |
| Total | 20 (1.0%) | 243 (13.3%) |
Race in North Amityville
The most populous races in North Amityville are Black / African American (10,518 | 51.7%), Hispanic or Latino (6,643 | 32.7%), and White / Caucasian (3,408 | 16.8%).
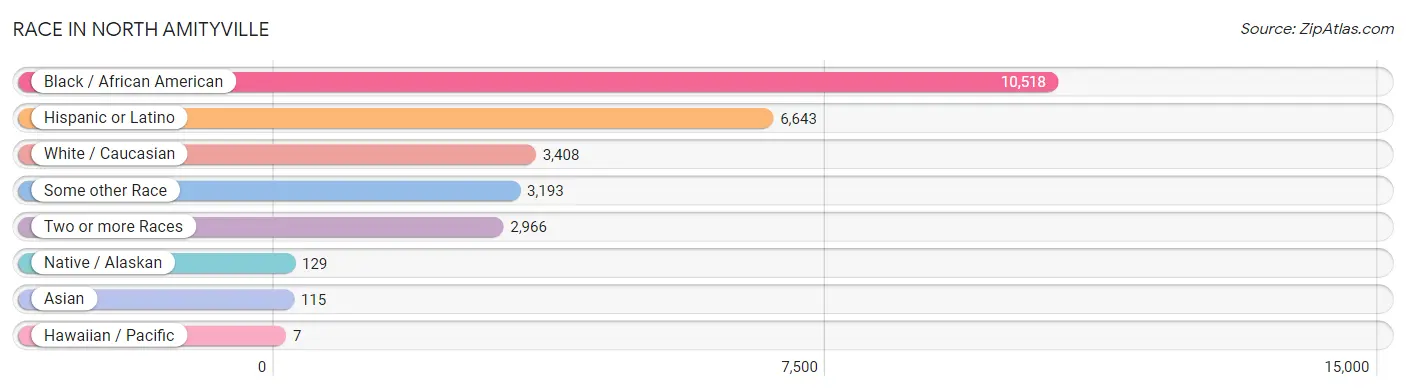
| Race | # Population | % Population |
| Asian | 115 | 0.6% |
| Black / African American | 10,518 | 51.7% |
| Hawaiian / Pacific | 7 | 0.0% |
| Hispanic or Latino | 6,643 | 32.7% |
| Native / Alaskan | 129 | 0.6% |
| White / Caucasian | 3,408 | 16.8% |
| Two or more Races | 2,966 | 14.6% |
| Some other Race | 3,193 | 15.7% |
| Total | 20,336 | 100.0% |
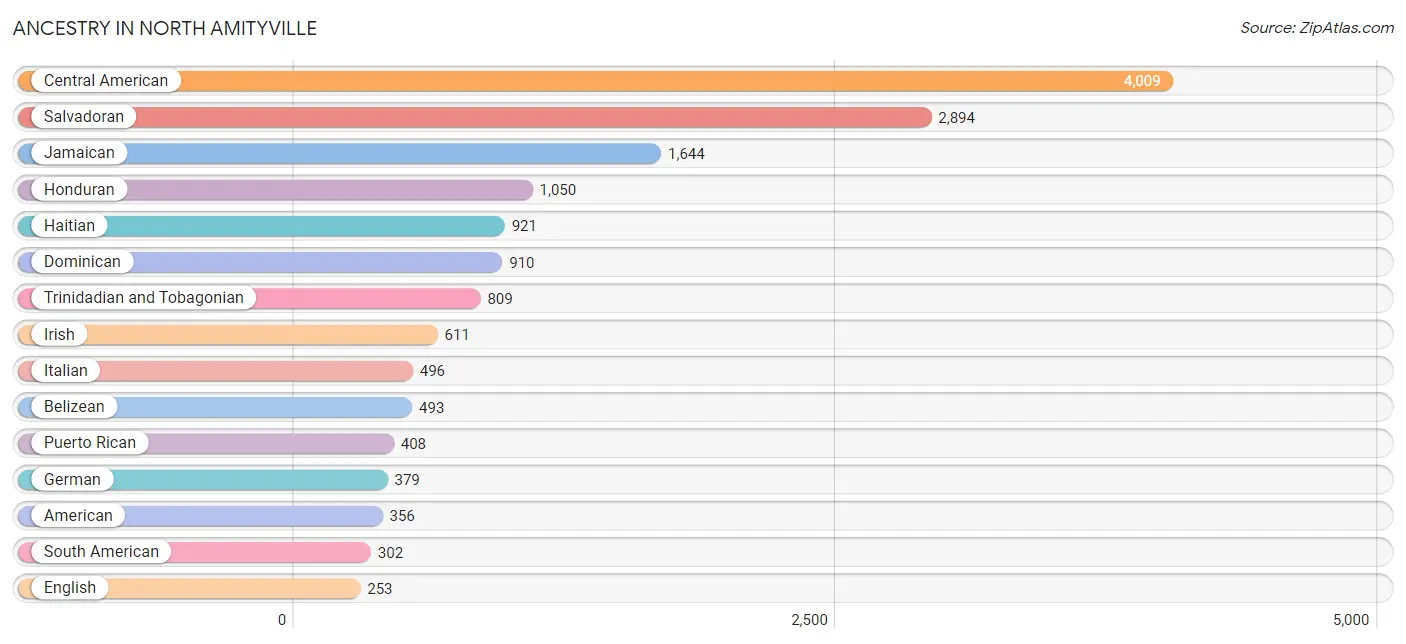
Ancestry in North Amityville
The most populous ancestries reported in North Amityville are Central American (4,009 | 19.7%), Salvadoran (2,894 | 14.2%), Jamaican (1,644 | 8.1%), Honduran (1,050 | 5.2%), and Haitian (921 | 4.5%), together accounting for 51.7% of all North Amityville residents.
| Ancestry | # Population | % Population |
| African | 51 | 0.3% |
| American | 356 | 1.8% |
| Arab | 51 | 0.3% |
| Belizean | 493 | 2.4% |
| Cape Verdean | 35 | 0.2% |
| Central American | 4,009 | 19.7% |
| Central American Indian | 112 | 0.5% |
| Cherokee | 13 | 0.1% |
| Colombian | 235 | 1.2% |
| Cuban | 63 | 0.3% |
| Delaware | 6 | 0.0% |
| Dominican | 910 | 4.5% |
| Ecuadorian | 67 | 0.3% |
| Egyptian | 51 | 0.3% |
| English | 253 | 1.2% |
| French | 102 | 0.5% |
| German | 379 | 1.9% |
| Greek | 121 | 0.6% |
| Guamanian / Chamorro | 7 | 0.0% |
| Guyanese | 153 | 0.7% |
| Haitian | 921 | 4.5% |
| Honduran | 1,050 | 5.2% |
| Indian (Asian) | 100 | 0.5% |
| Irish | 611 | 3.0% |
| Israeli | 39 | 0.2% |
| Italian | 496 | 2.4% |
| Jamaican | 1,644 | 8.1% |
| Korean | 59 | 0.3% |
| Lithuanian | 64 | 0.3% |
| Mexican | 95 | 0.5% |
| Nigerian | 89 | 0.4% |
| Norwegian | 46 | 0.2% |
| Polish | 80 | 0.4% |
| Portuguese | 53 | 0.3% |
| Puerto Rican | 408 | 2.0% |
| Romanian | 31 | 0.2% |
| Russian | 18 | 0.1% |
| Salvadoran | 2,894 | 14.2% |
| Scotch-Irish | 35 | 0.2% |
| Scottish | 32 | 0.2% |
| Seminole | 52 | 0.3% |
| South American | 302 | 1.5% |
| Subsaharan African | 192 | 0.9% |
| Thai | 207 | 1.0% |
| Trinidadian and Tobagonian | 809 | 4.0% |
| West Indian | 38 | 0.2% | View All 46 Rows |
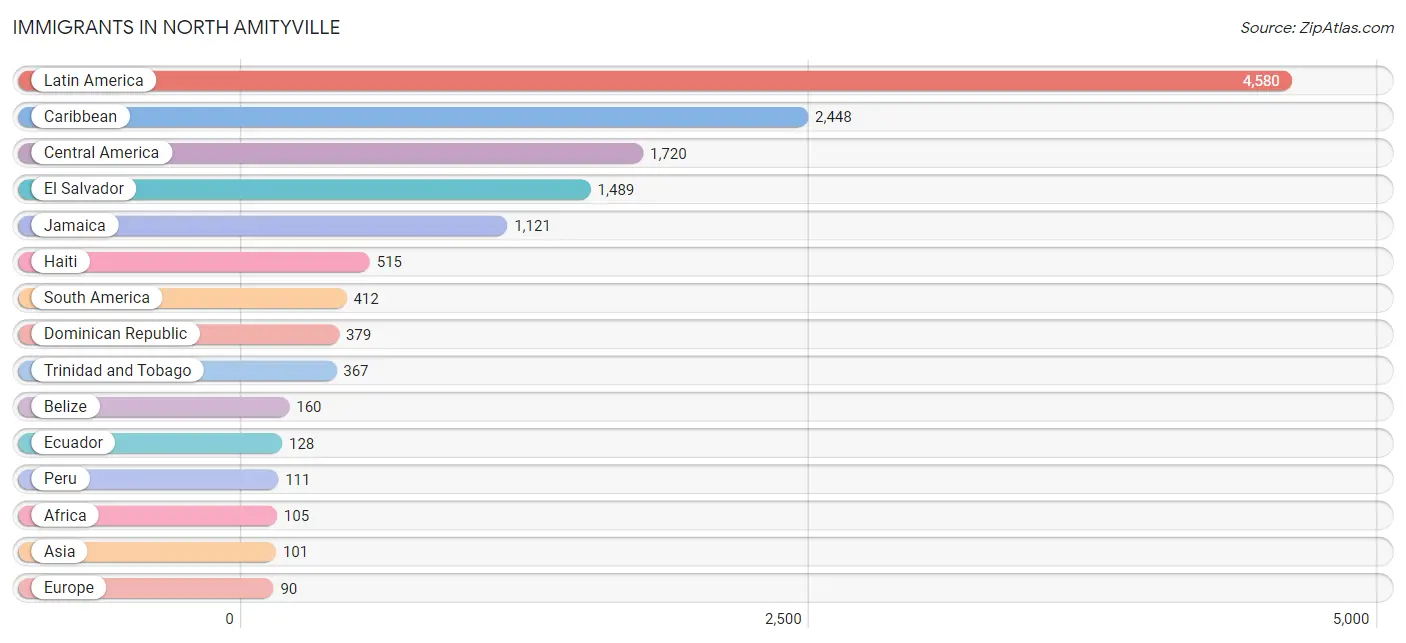
Immigrants in North Amityville
The most numerous immigrant groups reported in North Amityville came from Latin America (4,580 | 22.5%), Caribbean (2,448 | 12.0%), Central America (1,720 | 8.5%), El Salvador (1,489 | 7.3%), and Jamaica (1,121 | 5.5%), together accounting for 55.9% of all North Amityville residents.
| Immigration Origin | # Population | % Population |
| Africa | 105 | 0.5% |
| Argentina | 45 | 0.2% |
| Asia | 101 | 0.5% |
| Belize | 160 | 0.8% |
| Caribbean | 2,448 | 12.0% |
| Central America | 1,720 | 8.5% |
| China | 87 | 0.4% |
| Colombia | 73 | 0.4% |
| Dominican Republic | 379 | 1.9% |
| Eastern Asia | 87 | 0.4% |
| Eastern Europe | 31 | 0.2% |
| Ecuador | 128 | 0.6% |
| Egypt | 16 | 0.1% |
| El Salvador | 1,489 | 7.3% |
| England | 24 | 0.1% |
| Europe | 90 | 0.4% |
| Germany | 28 | 0.1% |
| Guyana | 55 | 0.3% |
| Haiti | 515 | 2.5% |
| Honduras | 34 | 0.2% |
| Ireland | 7 | 0.0% |
| Jamaica | 1,121 | 5.5% |
| Latin America | 4,580 | 22.5% |
| Mexico | 37 | 0.2% |
| Nigeria | 89 | 0.4% |
| Northern Africa | 16 | 0.1% |
| Northern Europe | 31 | 0.2% |
| Peru | 111 | 0.5% |
| Philippines | 14 | 0.1% |
| Romania | 31 | 0.2% |
| South America | 412 | 2.0% |
| South Eastern Asia | 14 | 0.1% |
| Trinidad and Tobago | 367 | 1.8% |
| West Indies | 66 | 0.3% |
| Western Africa | 89 | 0.4% |
| Western Europe | 28 | 0.1% | View All 36 Rows |
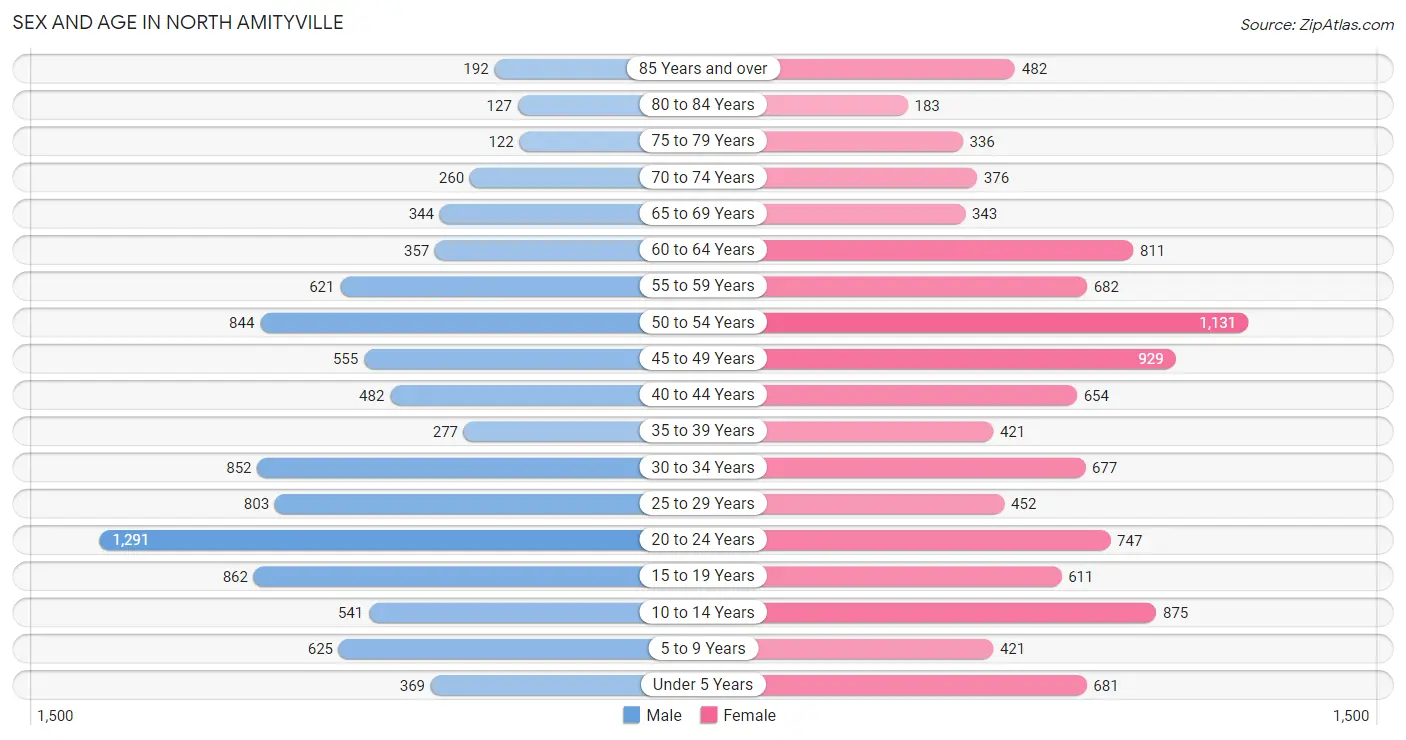
Sex and Age in North Amityville
Sex and Age in North Amityville
The most populous age groups in North Amityville are 20 to 24 Years (1,291 | 13.6%) for men and 50 to 54 Years (1,131 | 10.5%) for women.
| Age Bracket | Male | Female |
| Under 5 Years | 369 (3.9%) | 681 (6.3%) |
| 5 to 9 Years | 625 (6.6%) | 421 (3.9%) |
| 10 to 14 Years | 541 (5.7%) | 875 (8.1%) |
| 15 to 19 Years | 862 (9.0%) | 611 (5.7%) |
| 20 to 24 Years | 1,291 (13.6%) | 747 (6.9%) |
| 25 to 29 Years | 803 (8.4%) | 452 (4.2%) |
| 30 to 34 Years | 852 (8.9%) | 677 (6.3%) |
| 35 to 39 Years | 277 (2.9%) | 421 (3.9%) |
| 40 to 44 Years | 482 (5.1%) | 654 (6.0%) |
| 45 to 49 Years | 555 (5.8%) | 929 (8.6%) |
| 50 to 54 Years | 844 (8.9%) | 1,131 (10.5%) |
| 55 to 59 Years | 621 (6.5%) | 682 (6.3%) |
| 60 to 64 Years | 357 (3.7%) | 811 (7.5%) |
| 65 to 69 Years | 344 (3.6%) | 343 (3.2%) |
| 70 to 74 Years | 260 (2.7%) | 376 (3.5%) |
| 75 to 79 Years | 122 (1.3%) | 336 (3.1%) |
| 80 to 84 Years | 127 (1.3%) | 183 (1.7%) |
| 85 Years and over | 192 (2.0%) | 482 (4.5%) |
| Total | 9,524 (100.0%) | 10,812 (100.0%) |
Families and Households in North Amityville
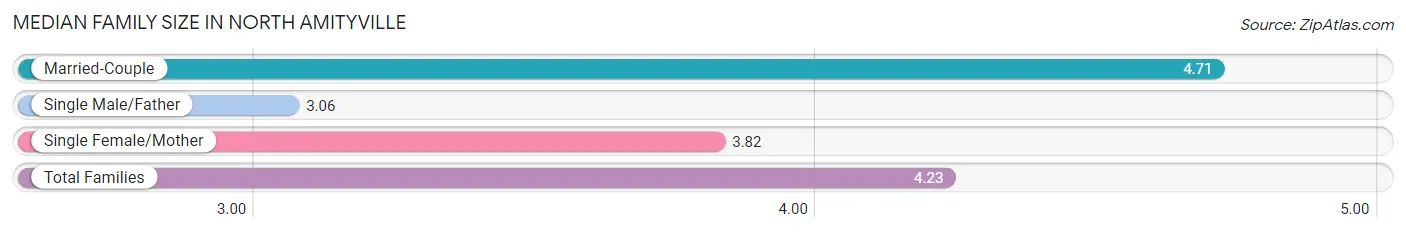
Median Family Size in North Amityville
The median family size in North Amityville is 4.23 persons per family, with married-couple families (2,089 | 53.4%) accounting for the largest median family size of 4.71 persons per family. On the other hand, single male/father families (335 | 8.6%) represent the smallest median family size with 3.06 persons per family.
| Family Type | # Families | Family Size |
| Married-Couple | 2,089 (53.4%) | 4.71 |
| Single Male/Father | 335 (8.6%) | 3.06 |
| Single Female/Mother | 1,491 (38.1%) | 3.82 |
| Total Families | 3,915 (100.0%) | 4.23 |
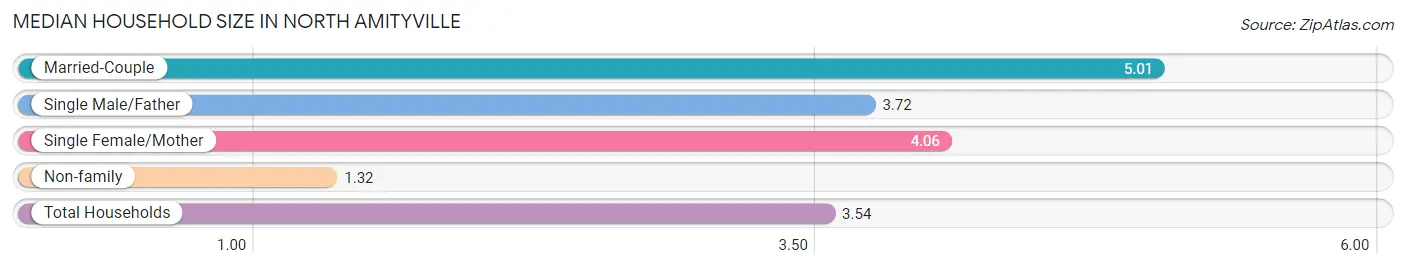
Median Household Size in North Amityville
The median household size in North Amityville is 3.54 persons per household, with married-couple households (2,089 | 36.8%) accounting for the largest median household size of 5.01 persons per household. non-family households (1,764 | 31.1%) represent the smallest median household size with 1.32 persons per household.
| Household Type | # Households | Household Size |
| Married-Couple | 2,089 (36.8%) | 5.01 |
| Single Male/Father | 335 (5.9%) | 3.72 |
| Single Female/Mother | 1,491 (26.3%) | 4.06 |
| Non-family | 1,764 (31.1%) | 1.32 |
| Total Households | 5,679 (100.0%) | 3.54 |
Household Size by Marriage Status in North Amityville
Out of a total of 5,679 households in North Amityville, 3,915 (68.9%) are family households, while 1,764 (31.1%) are nonfamily households. The most numerous type of family households are 2-person households, comprising 1,173, and the most common type of nonfamily households are 1-person households, comprising 1,455.
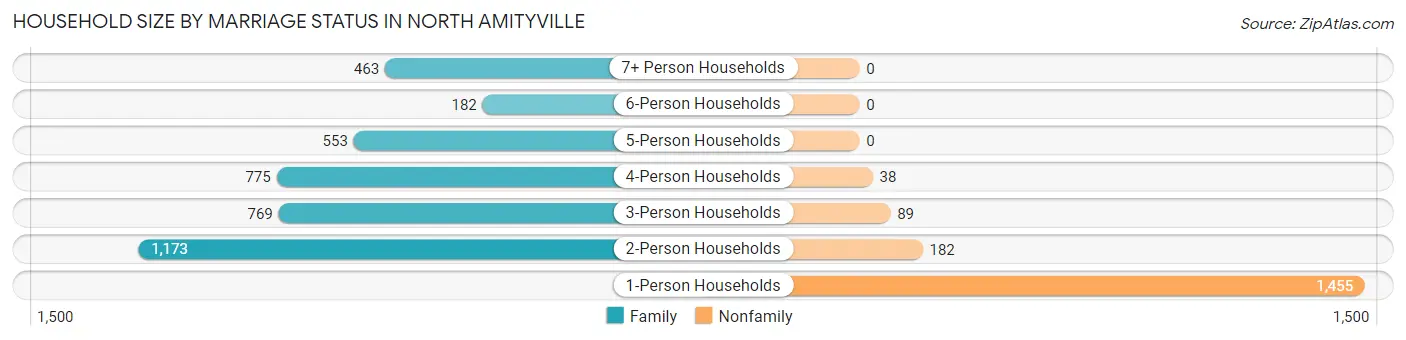
| Household Size | Family Households | Nonfamily Households |
| 1-Person Households | - | 1,455 (25.6%) |
| 2-Person Households | 1,173 (20.7%) | 182 (3.2%) |
| 3-Person Households | 769 (13.5%) | 89 (1.6%) |
| 4-Person Households | 775 (13.7%) | 38 (0.7%) |
| 5-Person Households | 553 (9.7%) | 0 (0.0%) |
| 6-Person Households | 182 (3.2%) | 0 (0.0%) |
| 7+ Person Households | 463 (8.2%) | 0 (0.0%) |
| Total | 3,915 (68.9%) | 1,764 (31.1%) |
Female Fertility in North Amityville
Fertility by Age in North Amityville
Average fertility rate in North Amityville is 25.0 births per 1,000 women. Women in the age bracket of 20 to 34 years have the highest fertility rate with 30.0 births per 1,000 women. Women in the age bracket of 35 to 50 years acount for 51.3% of all women with births.
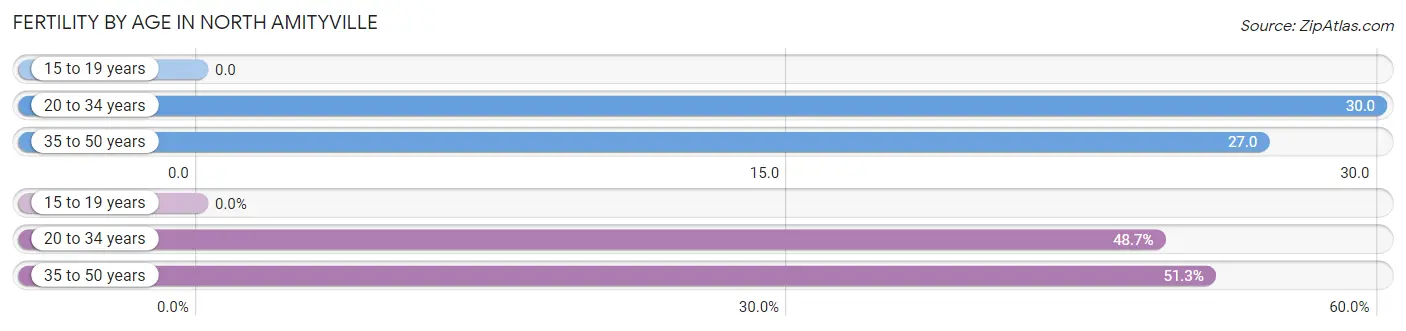
| Age Bracket | Women with Births | Births / 1,000 Women |
| 15 to 19 years | 0 (0.0%) | 0.0 |
| 20 to 34 years | 57 (48.7%) | 30.0 |
| 35 to 50 years | 60 (51.3%) | 27.0 |
| Total | 117 (100.0%) | 25.0 |
Fertility by Age by Marriage Status in North Amityville
74.4% of women with births (117) in North Amityville are married. The highest percentage of unmarried women with births falls into 20 to 34 years age bracket with 52.6% of them unmarried at the time of birth, while the lowest percentage of unmarried women with births belong to 35 to 50 years age bracket with 0.0% of them unmarried.
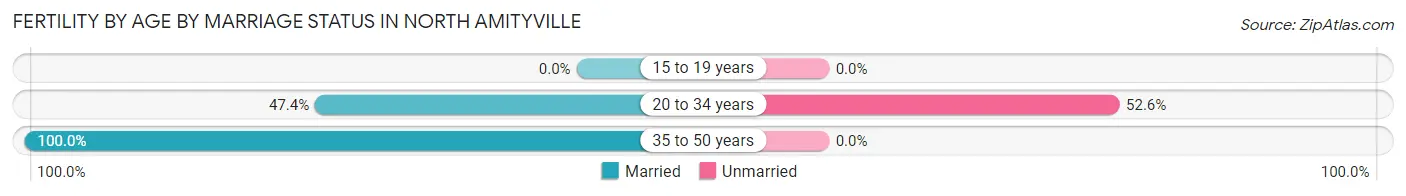
| Age Bracket | Married | Unmarried |
| 15 to 19 years | 0 (0.0%) | 0 (0.0%) |
| 20 to 34 years | 27 (47.4%) | 30 (52.6%) |
| 35 to 50 years | 60 (100.0%) | 0 (0.0%) |
| Total | 87 (74.4%) | 30 (25.6%) |
Fertility by Education in North Amityville
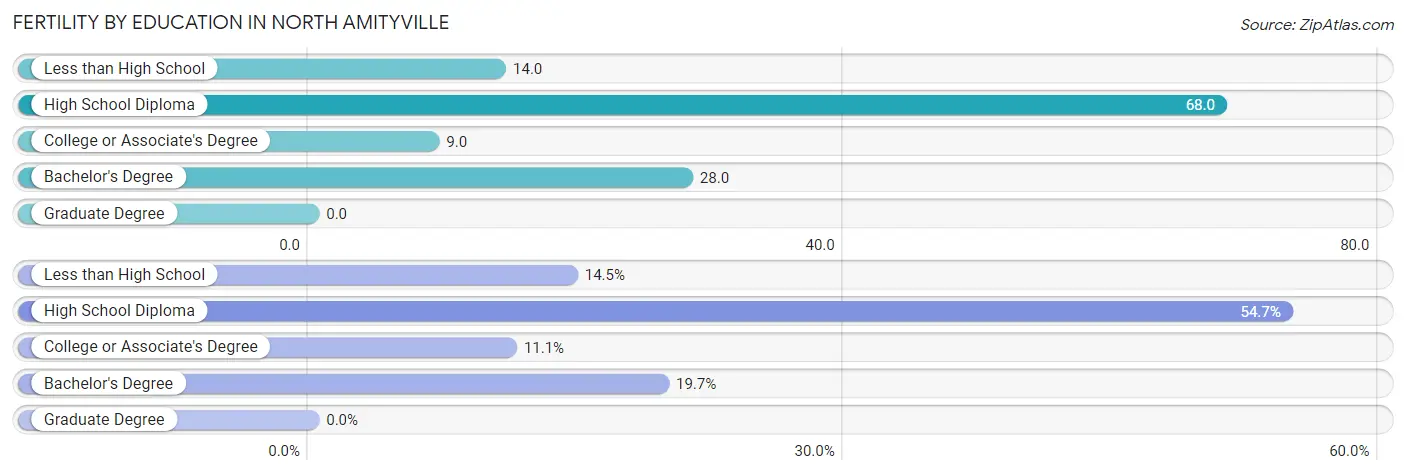
| Educational Attainment | Women with Births | Births / 1,000 Women |
| Less than High School | 17 (14.5%) | 14.0 |
| High School Diploma | 64 (54.7%) | 68.0 |
| College or Associate's Degree | 13 (11.1%) | 9.0 |
| Bachelor's Degree | 23 (19.7%) | 28.0 |
| Graduate Degree | 0 (0.0%) | 0.0 |
| Total | 117 (100.0%) | 25.0 |
Fertility by Education by Marriage Status in North Amityville
25.6% of women with births in North Amityville are unmarried. Women with the educational attainment of high school diploma are most likely to be married with 100.0% of them married at childbirth, while women with the educational attainment of less than high school are least likely to be married with 100.0% of them unmarried at childbirth.
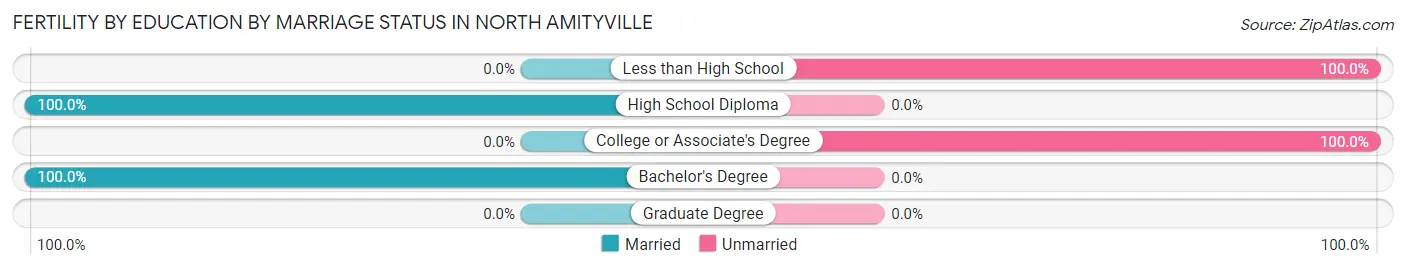
| Educational Attainment | Married | Unmarried |
| Less than High School | 0 (0.0%) | 17 (100.0%) |
| High School Diploma | 64 (100.0%) | 0 (0.0%) |
| College or Associate's Degree | 0 (0.0%) | 13 (100.0%) |
| Bachelor's Degree | 23 (100.0%) | 0 (0.0%) |
| Graduate Degree | 0 (0.0%) | 0 (0.0%) |
| Total | 87 (74.4%) | 30 (25.6%) |
Employment Characteristics in North Amityville
Employment by Class of Employer in North Amityville
Among the 11,411 employed individuals in North Amityville, private company employees (8,292 | 72.7%), not-for-profit organizations (969 | 8.5%), and local government employees (788 | 6.9%) make up the most common classes of employment.
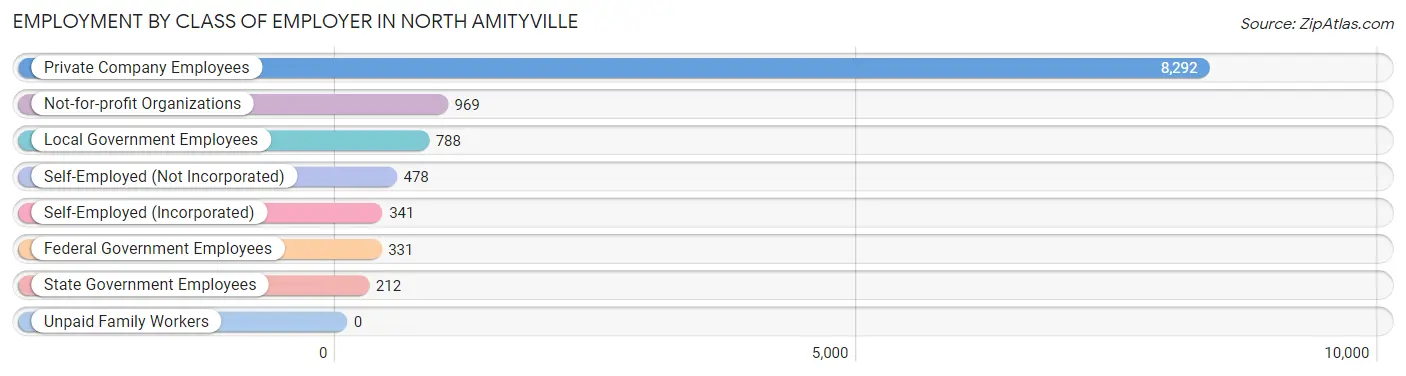
| Employer Class | # Employees | % Employees |
| Private Company Employees | 8,292 | 72.7% |
| Self-Employed (Incorporated) | 341 | 3.0% |
| Self-Employed (Not Incorporated) | 478 | 4.2% |
| Not-for-profit Organizations | 969 | 8.5% |
| Local Government Employees | 788 | 6.9% |
| State Government Employees | 212 | 1.9% |
| Federal Government Employees | 331 | 2.9% |
| Unpaid Family Workers | 0 | 0.0% |
| Total | 11,411 | 100.0% |
Employment Status by Age in North Amityville
According to the labor force statistics for North Amityville, out of the total population over 16 years of age (16,398), 74.4% or 12,200 individuals are in the labor force, with 4.5% or 549 of them unemployed. The age group with the highest labor force participation rate is 45 to 54 years, with 94.9% or 3,283 individuals in the labor force. Within the labor force, the 16 to 19 years age range has the highest percentage of unemployed individuals, with 23.3% or 121 of them being unemployed.
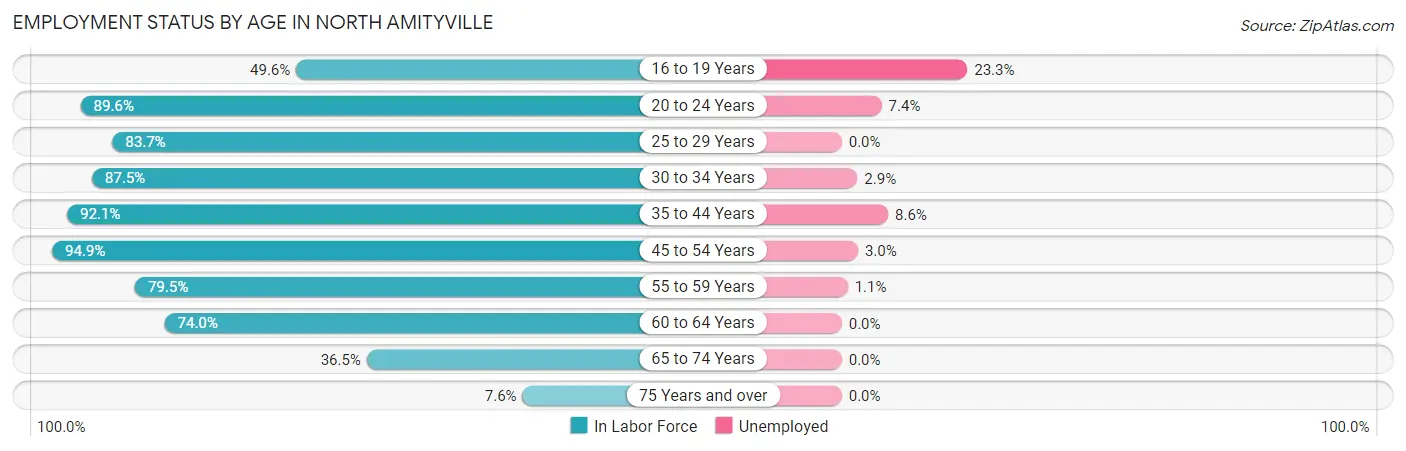
| Age Bracket | In Labor Force | Unemployed |
| 16 to 19 Years | 519 (49.6%) | 121 (23.3%) |
| 20 to 24 Years | 1,826 (89.6%) | 135 (7.4%) |
| 25 to 29 Years | 1,050 (83.7%) | 0 (0.0%) |
| 30 to 34 Years | 1,338 (87.5%) | 39 (2.9%) |
| 35 to 44 Years | 1,689 (92.1%) | 145 (8.6%) |
| 45 to 54 Years | 3,283 (94.9%) | 98 (3.0%) |
| 55 to 59 Years | 1,036 (79.5%) | 11 (1.1%) |
| 60 to 64 Years | 864 (74.0%) | 0 (0.0%) |
| 65 to 74 Years | 483 (36.5%) | 0 (0.0%) |
| 75 Years and over | 110 (7.6%) | 0 (0.0%) |
| Total | 12,200 (74.4%) | 549 (4.5%) |
Employment Status by Educational Attainment in North Amityville
According to labor force statistics for North Amityville, 87.8% of individuals (9,261) out of the total population between 25 and 64 years of age (10,548) are in the labor force, with 3.2% or 296 of them being unemployed. The group with the highest labor force participation rate are those with the educational attainment of bachelor's degree or higher, with 91.5% or 2,535 individuals in the labor force. Within the labor force, individuals with less than high school education have the highest percentage of unemployment, with 5.6% or 103 of them being unemployed.
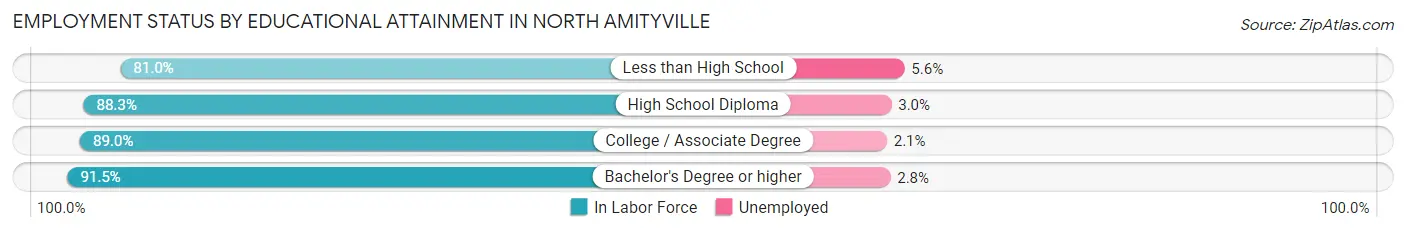
| Educational Attainment | In Labor Force | Unemployed |
| Less than High School | 1,837 (81.0%) | 127 (5.6%) |
| High School Diploma | 2,093 (88.3%) | 71 (3.0%) |
| College / Associate Degree | 2,795 (89.0%) | 66 (2.1%) |
| Bachelor's Degree or higher | 2,535 (91.5%) | 78 (2.8%) |
| Total | 9,261 (87.8%) | 338 (3.2%) |
Employment Occupations by Sex in North Amityville
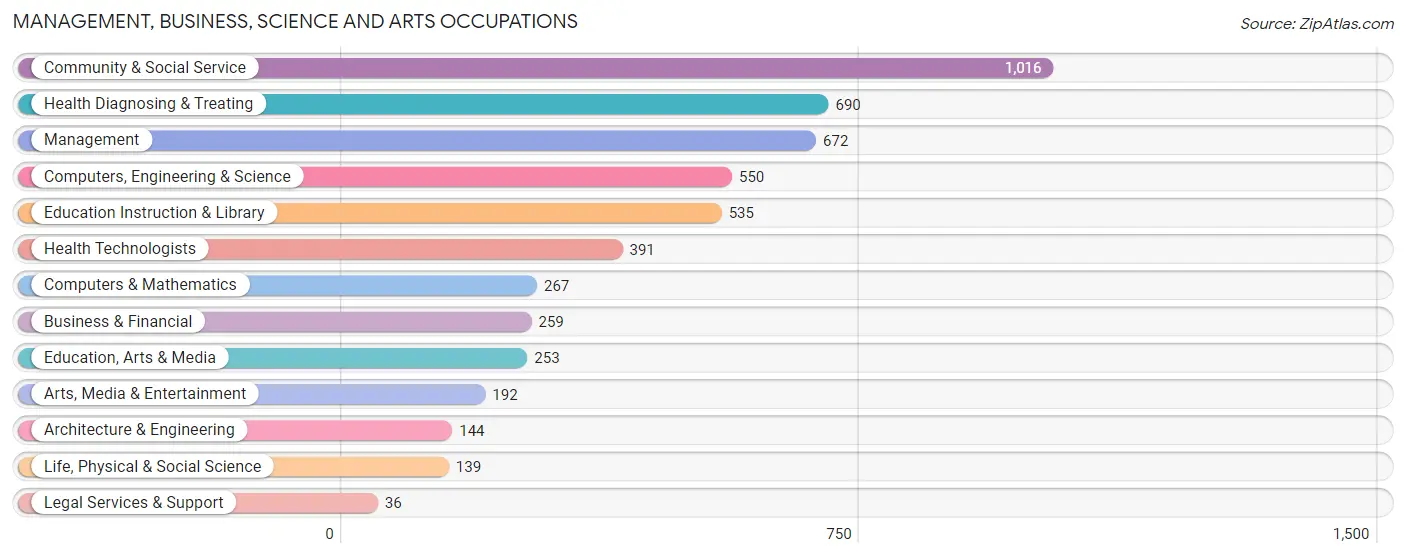
Management, Business, Science and Arts Occupations
The most common Management, Business, Science and Arts occupations in North Amityville are Community & Social Service (1,016 | 8.8%), Health Diagnosing & Treating (690 | 5.9%), Management (672 | 5.8%), Computers, Engineering & Science (550 | 4.7%), and Education Instruction & Library (535 | 4.6%).
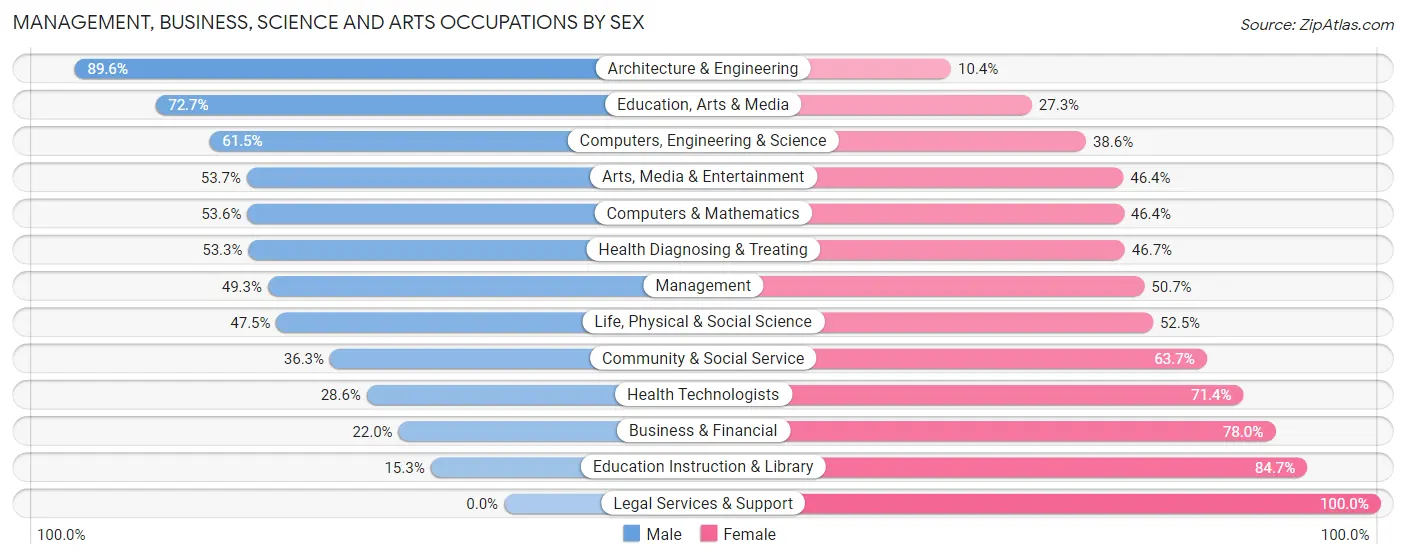
Management, Business, Science and Arts Occupations by Sex
Within the Management, Business, Science and Arts occupations in North Amityville, the most male-oriented occupations are Architecture & Engineering (89.6%), Education, Arts & Media (72.7%), and Computers, Engineering & Science (61.5%), while the most female-oriented occupations are Legal Services & Support (100.0%), Education Instruction & Library (84.7%), and Business & Financial (78.0%).
| Occupation | Male | Female |
| Management | 331 (49.3%) | 341 (50.7%) |
| Business & Financial | 57 (22.0%) | 202 (78.0%) |
| Computers, Engineering & Science | 338 (61.5%) | 212 (38.6%) |
| Computers & Mathematics | 143 (53.6%) | 124 (46.4%) |
| Architecture & Engineering | 129 (89.6%) | 15 (10.4%) |
| Life, Physical & Social Science | 66 (47.5%) | 73 (52.5%) |
| Community & Social Service | 369 (36.3%) | 647 (63.7%) |
| Education, Arts & Media | 184 (72.7%) | 69 (27.3%) |
| Legal Services & Support | 0 (0.0%) | 36 (100.0%) |
| Education Instruction & Library | 82 (15.3%) | 453 (84.7%) |
| Arts, Media & Entertainment | 103 (53.6%) | 89 (46.4%) |
| Health Diagnosing & Treating | 368 (53.3%) | 322 (46.7%) |
| Health Technologists | 112 (28.6%) | 279 (71.4%) |
| Total (Category) | 1,463 (45.9%) | 1,724 (54.1%) |
| Total (Overall) | 5,756 (49.6%) | 5,844 (50.4%) |
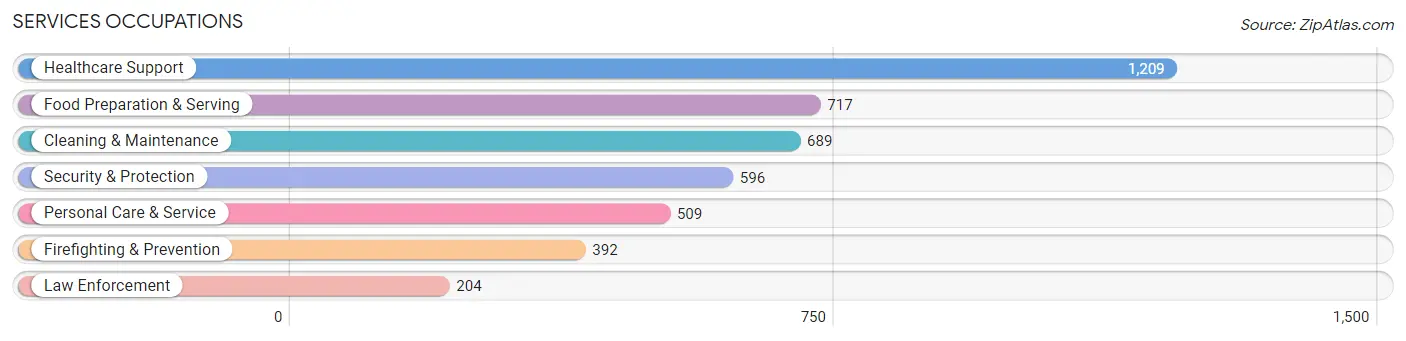
Services Occupations
The most common Services occupations in North Amityville are Healthcare Support (1,209 | 10.4%), Food Preparation & Serving (717 | 6.2%), Cleaning & Maintenance (689 | 5.9%), Security & Protection (596 | 5.1%), and Personal Care & Service (509 | 4.4%).
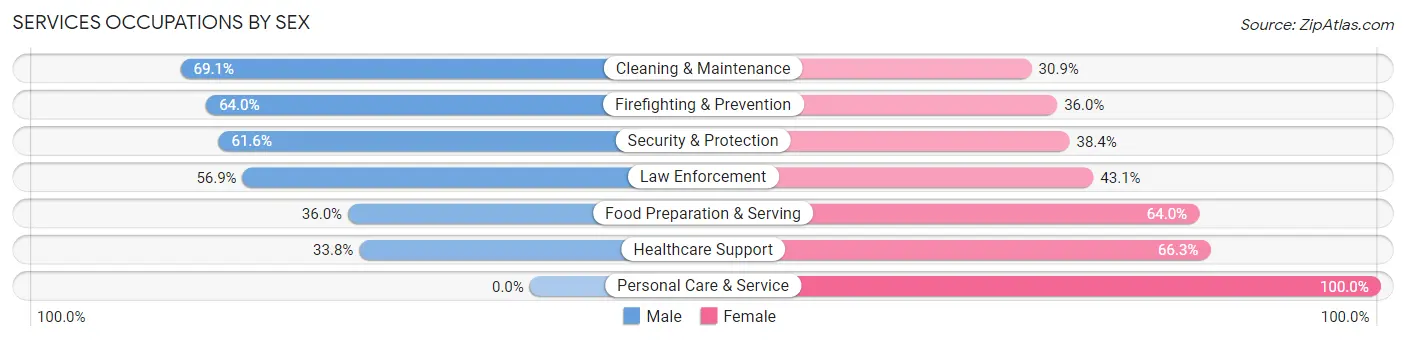
Services Occupations by Sex
Within the Services occupations in North Amityville, the most male-oriented occupations are Cleaning & Maintenance (69.1%), Firefighting & Prevention (64.0%), and Security & Protection (61.6%), while the most female-oriented occupations are Personal Care & Service (100.0%), Healthcare Support (66.2%), and Food Preparation & Serving (64.0%).
| Occupation | Male | Female |
| Healthcare Support | 408 (33.8%) | 801 (66.2%) |
| Security & Protection | 367 (61.6%) | 229 (38.4%) |
| Firefighting & Prevention | 251 (64.0%) | 141 (36.0%) |
| Law Enforcement | 116 (56.9%) | 88 (43.1%) |
| Food Preparation & Serving | 258 (36.0%) | 459 (64.0%) |
| Cleaning & Maintenance | 476 (69.1%) | 213 (30.9%) |
| Personal Care & Service | 0 (0.0%) | 509 (100.0%) |
| Total (Category) | 1,509 (40.6%) | 2,211 (59.4%) |
| Total (Overall) | 5,756 (49.6%) | 5,844 (50.4%) |
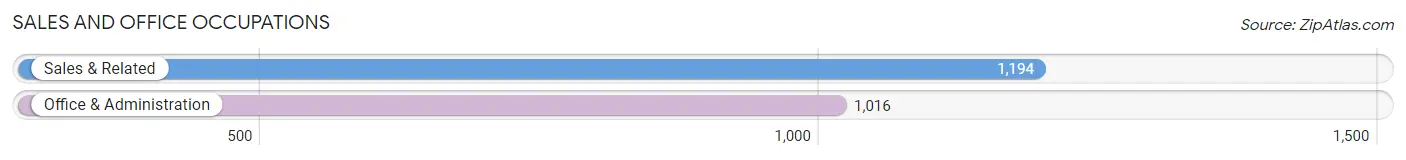
Sales and Office Occupations
The most common Sales and Office occupations in North Amityville are Sales & Related (1,194 | 10.3%), and Office & Administration (1,016 | 8.8%).
Sales and Office Occupations by Sex
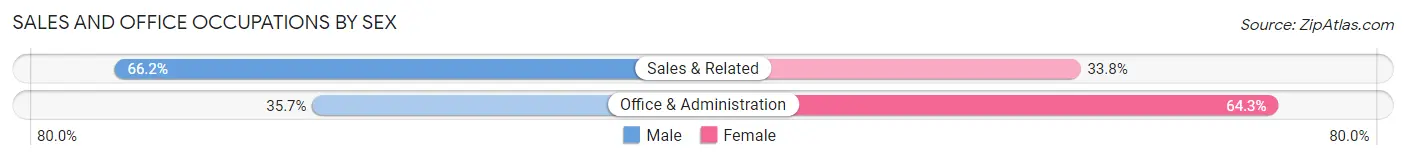
| Occupation | Male | Female |
| Sales & Related | 790 (66.2%) | 404 (33.8%) |
| Office & Administration | 363 (35.7%) | 653 (64.3%) |
| Total (Category) | 1,153 (52.2%) | 1,057 (47.8%) |
| Total (Overall) | 5,756 (49.6%) | 5,844 (50.4%) |
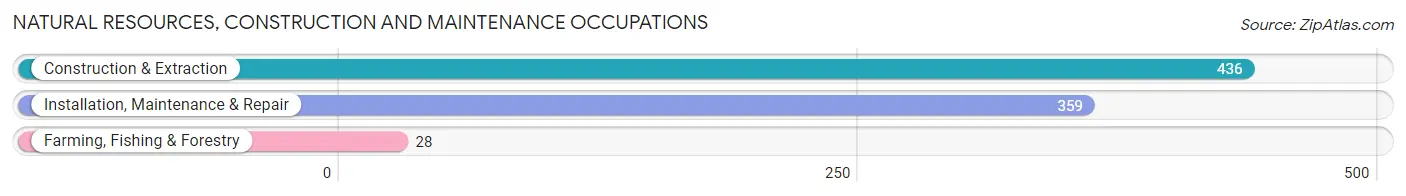
Natural Resources, Construction and Maintenance Occupations
The most common Natural Resources, Construction and Maintenance occupations in North Amityville are Construction & Extraction (436 | 3.8%), Installation, Maintenance & Repair (359 | 3.1%), and Farming, Fishing & Forestry (28 | 0.2%).
Natural Resources, Construction and Maintenance Occupations by Sex
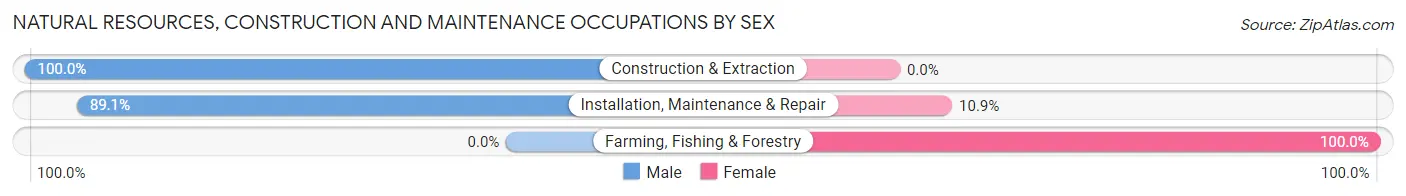
| Occupation | Male | Female |
| Farming, Fishing & Forestry | 0 (0.0%) | 28 (100.0%) |
| Construction & Extraction | 436 (100.0%) | 0 (0.0%) |
| Installation, Maintenance & Repair | 320 (89.1%) | 39 (10.9%) |
| Total (Category) | 756 (91.9%) | 67 (8.1%) |
| Total (Overall) | 5,756 (49.6%) | 5,844 (50.4%) |
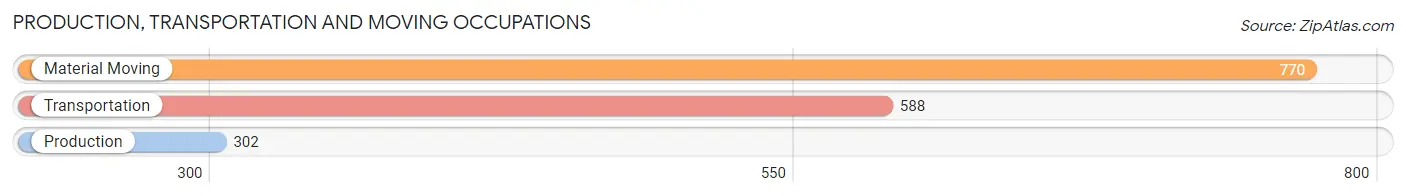
Production, Transportation and Moving Occupations
The most common Production, Transportation and Moving occupations in North Amityville are Material Moving (770 | 6.6%), Transportation (588 | 5.1%), and Production (302 | 2.6%).
Production, Transportation and Moving Occupations by Sex
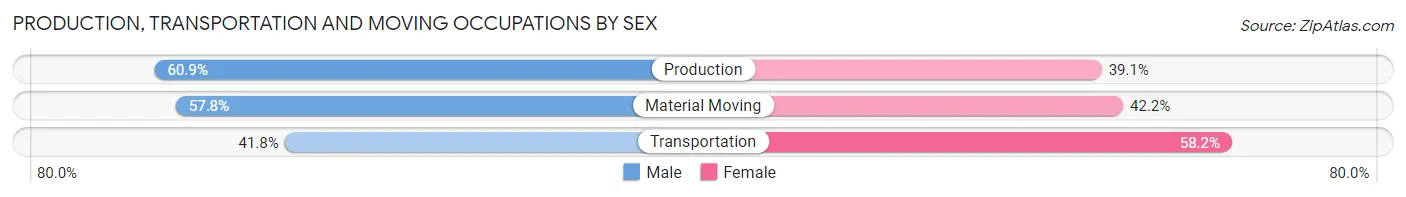
| Occupation | Male | Female |
| Production | 184 (60.9%) | 118 (39.1%) |
| Transportation | 246 (41.8%) | 342 (58.2%) |
| Material Moving | 445 (57.8%) | 325 (42.2%) |
| Total (Category) | 875 (52.7%) | 785 (47.3%) |
| Total (Overall) | 5,756 (49.6%) | 5,844 (50.4%) |
Employment Industries by Sex in North Amityville
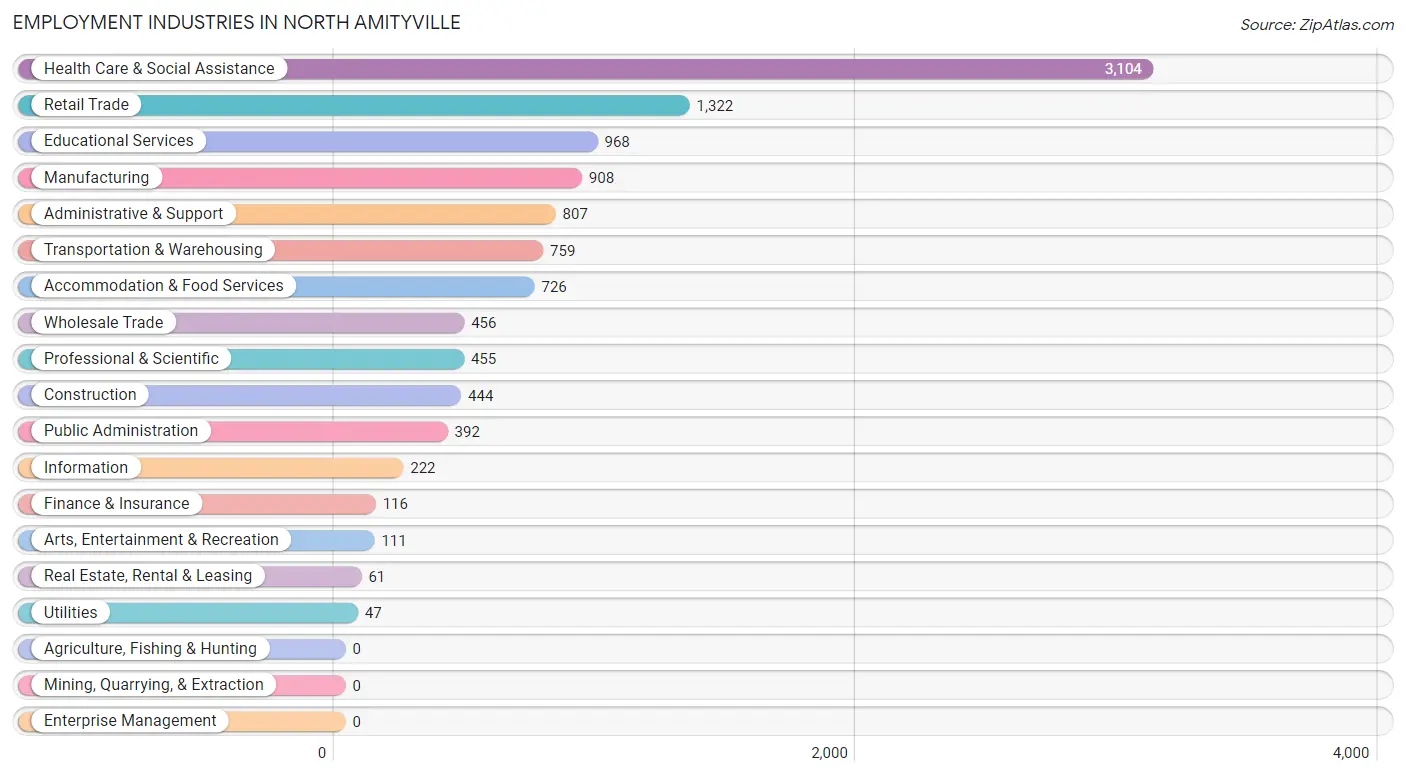
Employment Industries in North Amityville
The major employment industries in North Amityville include Health Care & Social Assistance (3,104 | 26.8%), Retail Trade (1,322 | 11.4%), Educational Services (968 | 8.3%), Manufacturing (908 | 7.8%), and Administrative & Support (807 | 7.0%).
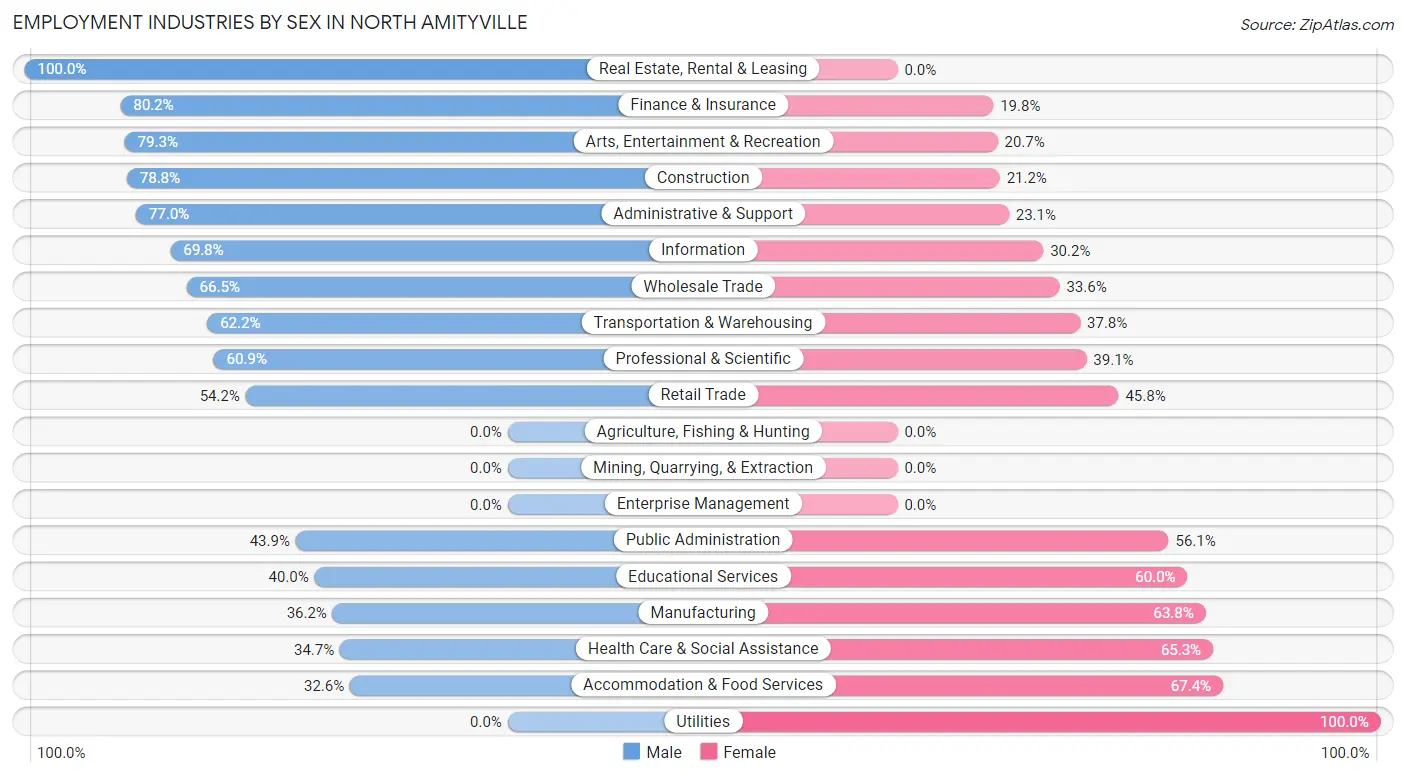
Employment Industries by Sex in North Amityville
The North Amityville industries that see more men than women are Real Estate, Rental & Leasing (100.0%), Finance & Insurance (80.2%), and Arts, Entertainment & Recreation (79.3%), whereas the industries that tend to have a higher number of women are Utilities (100.0%), Accommodation & Food Services (67.4%), and Health Care & Social Assistance (65.3%).
| Industry | Male | Female |
| Agriculture, Fishing & Hunting | 0 (0.0%) | 0 (0.0%) |
| Mining, Quarrying, & Extraction | 0 (0.0%) | 0 (0.0%) |
| Construction | 350 (78.8%) | 94 (21.2%) |
| Manufacturing | 329 (36.2%) | 579 (63.8%) |
| Wholesale Trade | 303 (66.4%) | 153 (33.6%) |
| Retail Trade | 717 (54.2%) | 605 (45.8%) |
| Transportation & Warehousing | 472 (62.2%) | 287 (37.8%) |
| Utilities | 0 (0.0%) | 47 (100.0%) |
| Information | 155 (69.8%) | 67 (30.2%) |
| Finance & Insurance | 93 (80.2%) | 23 (19.8%) |
| Real Estate, Rental & Leasing | 61 (100.0%) | 0 (0.0%) |
| Professional & Scientific | 277 (60.9%) | 178 (39.1%) |
| Enterprise Management | 0 (0.0%) | 0 (0.0%) |
| Administrative & Support | 621 (76.9%) | 186 (23.1%) |
| Educational Services | 387 (40.0%) | 581 (60.0%) |
| Health Care & Social Assistance | 1,077 (34.7%) | 2,027 (65.3%) |
| Arts, Entertainment & Recreation | 88 (79.3%) | 23 (20.7%) |
| Accommodation & Food Services | 237 (32.6%) | 489 (67.4%) |
| Public Administration | 172 (43.9%) | 220 (56.1%) |
| Total | 5,756 (49.6%) | 5,844 (50.4%) |
Education in North Amityville
School Enrollment in North Amityville
The most common levels of schooling among the 4,944 students in North Amityville are high school (1,308 | 26.5%), middle school (1,087 | 22.0%), and college / undergraduate (1,040 | 21.0%).
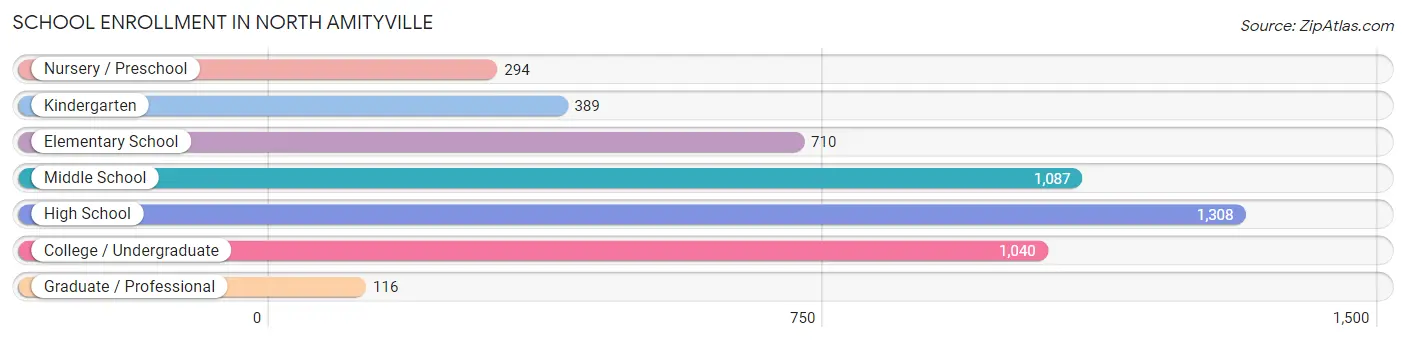
| School Level | # Students | % Students |
| Nursery / Preschool | 294 | 5.9% |
| Kindergarten | 389 | 7.9% |
| Elementary School | 710 | 14.4% |
| Middle School | 1,087 | 22.0% |
| High School | 1,308 | 26.5% |
| College / Undergraduate | 1,040 | 21.0% |
| Graduate / Professional | 116 | 2.4% |
| Total | 4,944 | 100.0% |
School Enrollment by Age by Funding Source in North Amityville
Out of a total of 4,944 students who are enrolled in schools in North Amityville, 742 (15.0%) attend a private institution, while the remaining 4,202 (85.0%) are enrolled in public schools. The age group of 18 to 19 year olds has the highest likelihood of being enrolled in private schools, with 137 (44.6% in the age bracket) enrolled. Conversely, the age group of 10 to 14 year olds has the lowest likelihood of being enrolled in a private school, with 1,320 (100.0% in the age bracket) attending a public institution.
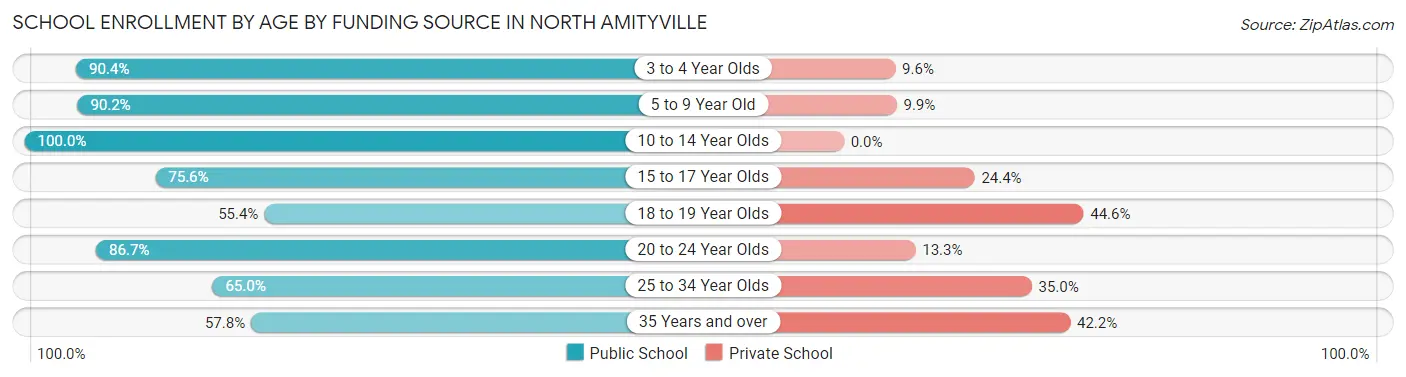
| Age Bracket | Public School | Private School |
| 3 to 4 Year Olds | 264 (90.4%) | 28 (9.6%) |
| 5 to 9 Year Old | 943 (90.1%) | 103 (9.9%) |
| 10 to 14 Year Olds | 1,320 (100.0%) | 0 (0.0%) |
| 15 to 17 Year Olds | 705 (75.6%) | 227 (24.4%) |
| 18 to 19 Year Olds | 170 (55.4%) | 137 (44.6%) |
| 20 to 24 Year Olds | 552 (86.7%) | 85 (13.3%) |
| 25 to 34 Year Olds | 117 (65.0%) | 63 (35.0%) |
| 35 Years and over | 133 (57.8%) | 97 (42.2%) |
| Total | 4,202 (85.0%) | 742 (15.0%) |
Educational Attainment by Field of Study in North Amityville
Business (600 | 15.4%), education (586 | 15.0%), social sciences (431 | 11.0%), science & technology (372 | 9.5%), and liberal arts & history (318 | 8.2%) are the most common fields of study among 3,903 individuals in North Amityville who have obtained a bachelor's degree or higher.
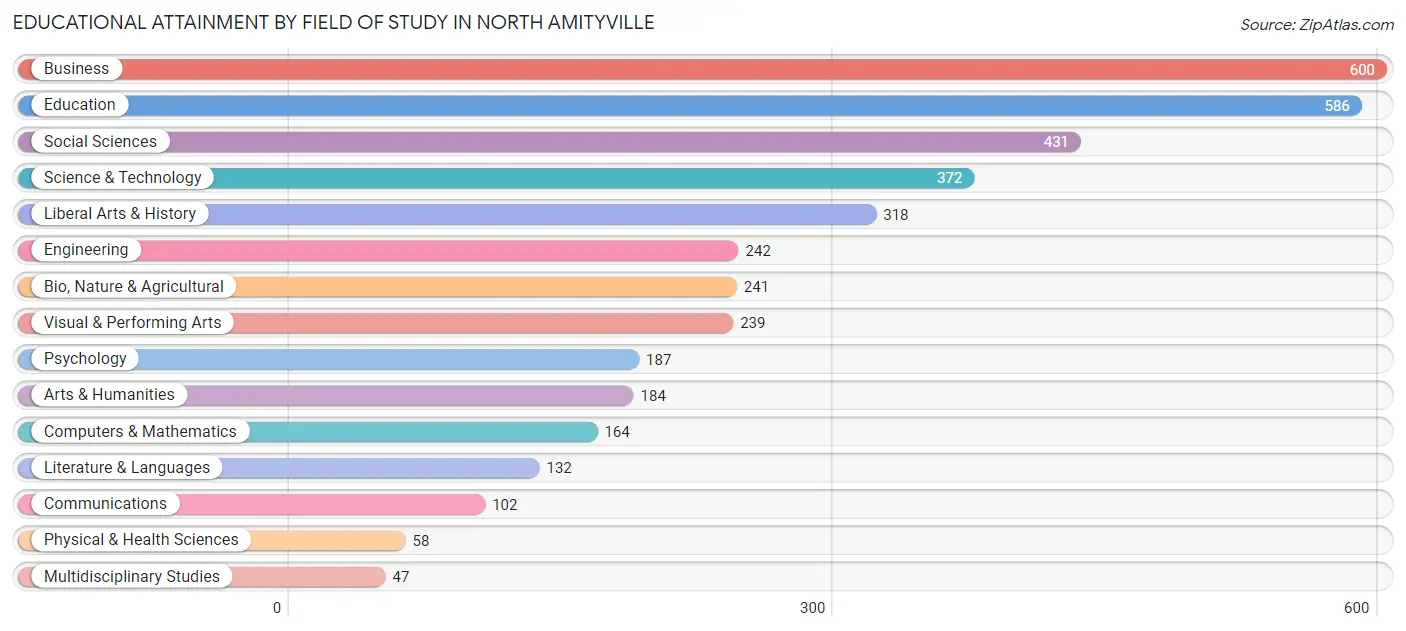
| Field of Study | # Graduates | % Graduates |
| Computers & Mathematics | 164 | 4.2% |
| Bio, Nature & Agricultural | 241 | 6.2% |
| Physical & Health Sciences | 58 | 1.5% |
| Psychology | 187 | 4.8% |
| Social Sciences | 431 | 11.0% |
| Engineering | 242 | 6.2% |
| Multidisciplinary Studies | 47 | 1.2% |
| Science & Technology | 372 | 9.5% |
| Business | 600 | 15.4% |
| Education | 586 | 15.0% |
| Literature & Languages | 132 | 3.4% |
| Liberal Arts & History | 318 | 8.2% |
| Visual & Performing Arts | 239 | 6.1% |
| Communications | 102 | 2.6% |
| Arts & Humanities | 184 | 4.7% |
| Total | 3,903 | 100.0% |
Transportation & Commute in North Amityville
Vehicle Availability by Sex in North Amityville
The most prevalent vehicle ownership categories in North Amityville are males with 2 vehicles (1,708, accounting for 29.5%) and females with 2 vehicles (2,056, making up 30.3%).
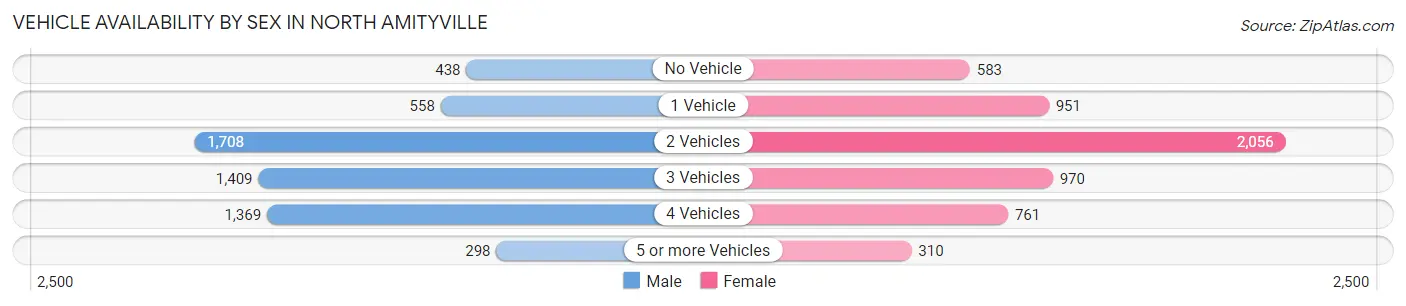
| Vehicles Available | Male | Female |
| No Vehicle | 438 (7.6%) | 583 (10.3%) |
| 1 Vehicle | 558 (9.7%) | 951 (16.9%) |
| 2 Vehicles | 1,708 (29.5%) | 2,056 (36.5%) |
| 3 Vehicles | 1,409 (24.4%) | 970 (17.2%) |
| 4 Vehicles | 1,369 (23.7%) | 761 (13.5%) |
| 5 or more Vehicles | 298 (5.2%) | 310 (5.5%) |
| Total | 5,780 (100.0%) | 5,631 (100.0%) |
Commute Time in North Amityville
The most frequently occuring commute durations in North Amityville are 20 to 24 minutes (1,728 commuters, 16.6%), 10 to 14 minutes (1,553 commuters, 14.9%), and 15 to 19 minutes (1,404 commuters, 13.5%).
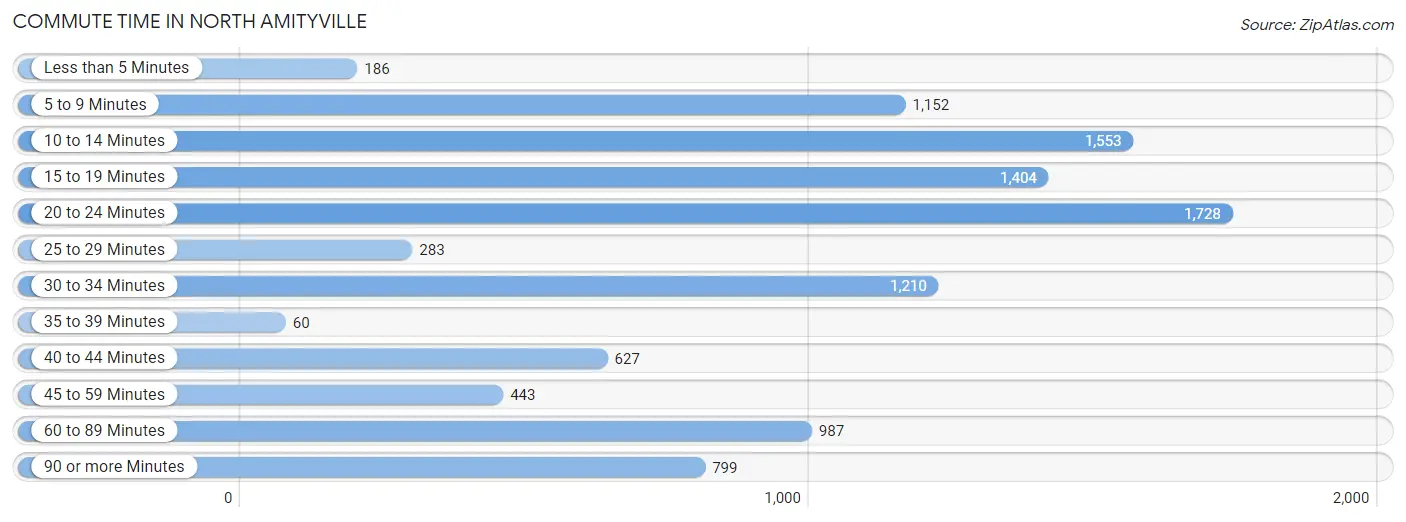
| Commute Time | # Commuters | % Commuters |
| Less than 5 Minutes | 186 | 1.8% |
| 5 to 9 Minutes | 1,152 | 11.0% |
| 10 to 14 Minutes | 1,553 | 14.9% |
| 15 to 19 Minutes | 1,404 | 13.5% |
| 20 to 24 Minutes | 1,728 | 16.6% |
| 25 to 29 Minutes | 283 | 2.7% |
| 30 to 34 Minutes | 1,210 | 11.6% |
| 35 to 39 Minutes | 60 | 0.6% |
| 40 to 44 Minutes | 627 | 6.0% |
| 45 to 59 Minutes | 443 | 4.3% |
| 60 to 89 Minutes | 987 | 9.5% |
| 90 or more Minutes | 799 | 7.7% |
Commute Time by Sex in North Amityville
The most common commute times in North Amityville are 20 to 24 minutes (945 commuters, 17.6%) for males and 10 to 14 minutes (866 commuters, 17.1%) for females.
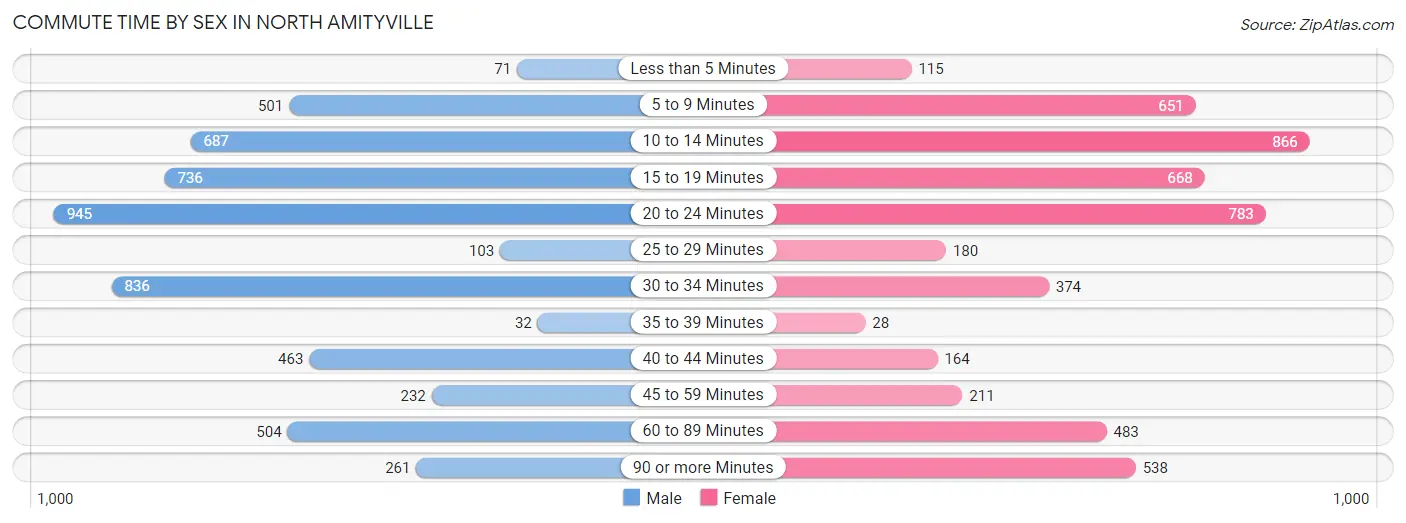
| Commute Time | Male | Female |
| Less than 5 Minutes | 71 (1.3%) | 115 (2.3%) |
| 5 to 9 Minutes | 501 (9.3%) | 651 (12.9%) |
| 10 to 14 Minutes | 687 (12.8%) | 866 (17.1%) |
| 15 to 19 Minutes | 736 (13.7%) | 668 (13.2%) |
| 20 to 24 Minutes | 945 (17.6%) | 783 (15.5%) |
| 25 to 29 Minutes | 103 (1.9%) | 180 (3.6%) |
| 30 to 34 Minutes | 836 (15.6%) | 374 (7.4%) |
| 35 to 39 Minutes | 32 (0.6%) | 28 (0.5%) |
| 40 to 44 Minutes | 463 (8.6%) | 164 (3.2%) |
| 45 to 59 Minutes | 232 (4.3%) | 211 (4.2%) |
| 60 to 89 Minutes | 504 (9.4%) | 483 (9.5%) |
| 90 or more Minutes | 261 (4.9%) | 538 (10.6%) |
Time of Departure to Work by Sex in North Amityville
The most frequent times of departure to work in North Amityville are 8:00 AM to 8:29 AM (827, 15.4%) for males and 8:00 AM to 8:29 AM (1,032, 20.4%) for females.
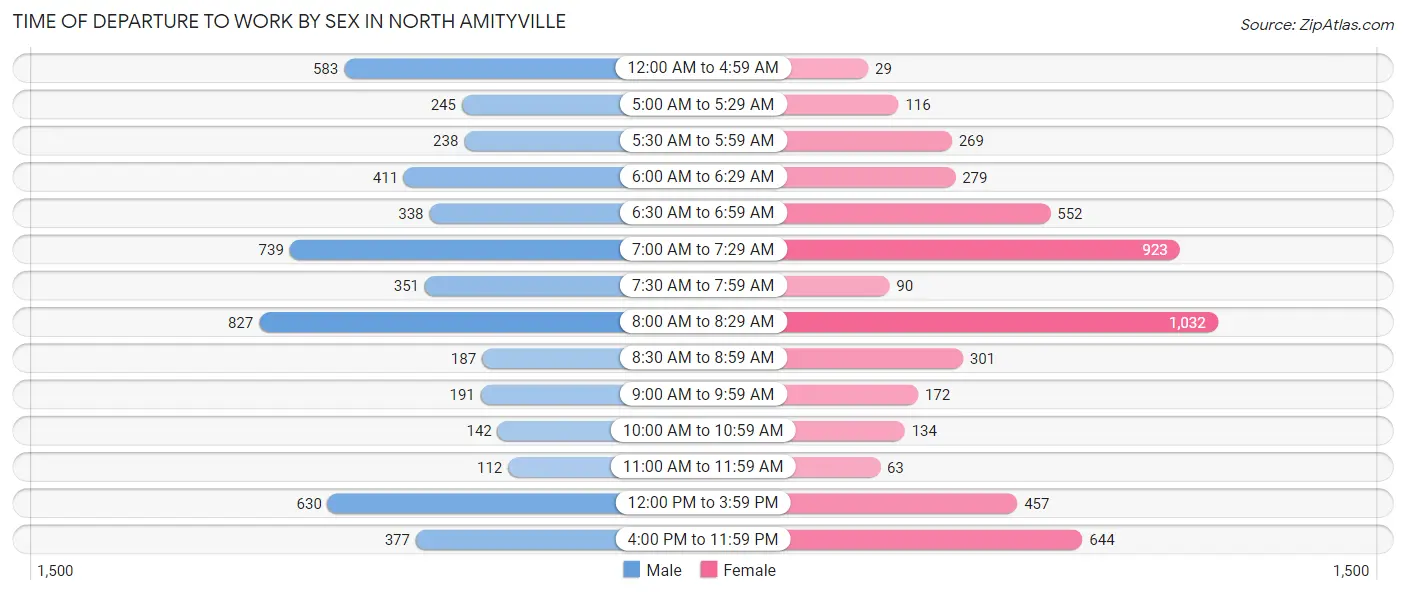
| Time of Departure | Male | Female |
| 12:00 AM to 4:59 AM | 583 (10.8%) | 29 (0.6%) |
| 5:00 AM to 5:29 AM | 245 (4.6%) | 116 (2.3%) |
| 5:30 AM to 5:59 AM | 238 (4.4%) | 269 (5.3%) |
| 6:00 AM to 6:29 AM | 411 (7.6%) | 279 (5.5%) |
| 6:30 AM to 6:59 AM | 338 (6.3%) | 552 (10.9%) |
| 7:00 AM to 7:29 AM | 739 (13.8%) | 923 (18.2%) |
| 7:30 AM to 7:59 AM | 351 (6.5%) | 90 (1.8%) |
| 8:00 AM to 8:29 AM | 827 (15.4%) | 1,032 (20.4%) |
| 8:30 AM to 8:59 AM | 187 (3.5%) | 301 (5.9%) |
| 9:00 AM to 9:59 AM | 191 (3.6%) | 172 (3.4%) |
| 10:00 AM to 10:59 AM | 142 (2.6%) | 134 (2.6%) |
| 11:00 AM to 11:59 AM | 112 (2.1%) | 63 (1.2%) |
| 12:00 PM to 3:59 PM | 630 (11.7%) | 457 (9.0%) |
| 4:00 PM to 11:59 PM | 377 (7.0%) | 644 (12.7%) |
| Total | 5,371 (100.0%) | 5,061 (100.0%) |
Housing Occupancy in North Amityville
Occupancy by Ownership in North Amityville
Of the total 5,679 dwellings in North Amityville, owner-occupied units account for 3,378 (59.5%), while renter-occupied units make up 2,301 (40.5%).
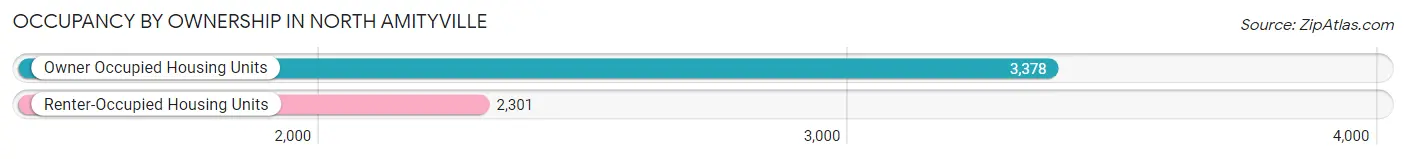
| Occupancy | # Housing Units | % Housing Units |
| Owner Occupied Housing Units | 3,378 | 59.5% |
| Renter-Occupied Housing Units | 2,301 | 40.5% |
| Total Occupied Housing Units | 5,679 | 100.0% |
Occupancy by Household Size in North Amityville
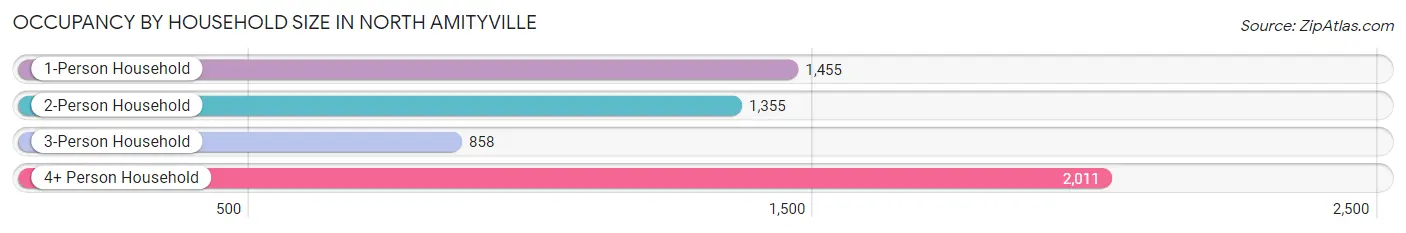
| Household Size | # Housing Units | % Housing Units |
| 1-Person Household | 1,455 | 25.6% |
| 2-Person Household | 1,355 | 23.9% |
| 3-Person Household | 858 | 15.1% |
| 4+ Person Household | 2,011 | 35.4% |
| Total Housing Units | 5,679 | 100.0% |
Occupancy by Ownership by Household Size in North Amityville
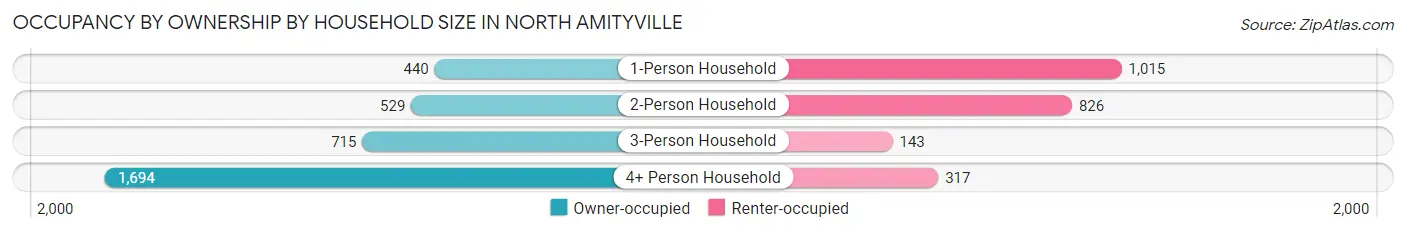
| Household Size | Owner-occupied | Renter-occupied |
| 1-Person Household | 440 (30.2%) | 1,015 (69.8%) |
| 2-Person Household | 529 (39.0%) | 826 (61.0%) |
| 3-Person Household | 715 (83.3%) | 143 (16.7%) |
| 4+ Person Household | 1,694 (84.2%) | 317 (15.8%) |
| Total Housing Units | 3,378 (59.5%) | 2,301 (40.5%) |
Occupancy by Educational Attainment in North Amityville
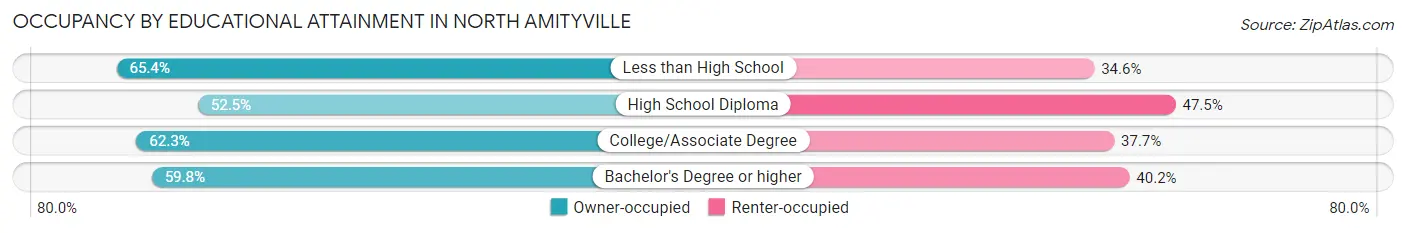
| Household Size | Owner-occupied | Renter-occupied |
| Less than High School | 537 (65.4%) | 284 (34.6%) |
| High School Diploma | 773 (52.5%) | 699 (47.5%) |
| College/Associate Degree | 1,082 (62.3%) | 656 (37.7%) |
| Bachelor's Degree or higher | 986 (59.8%) | 662 (40.2%) |
Occupancy by Age of Householder in North Amityville
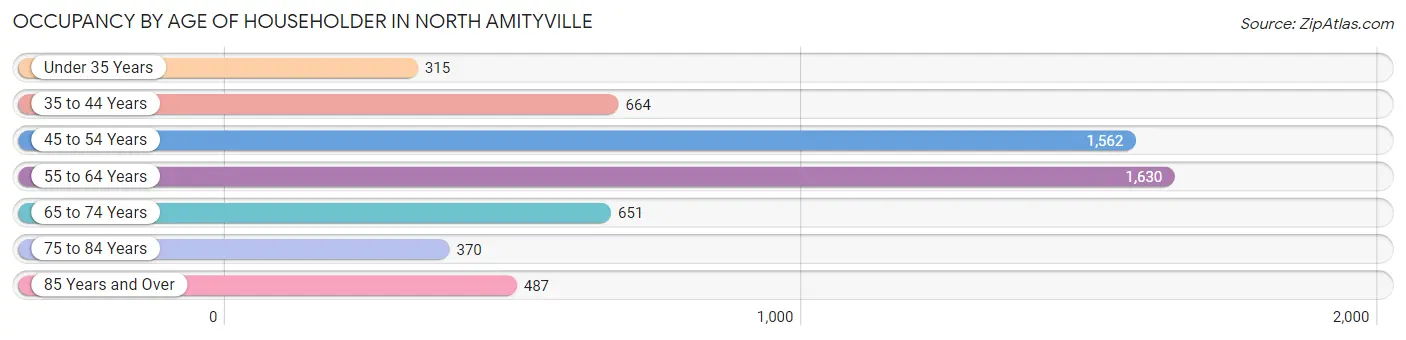
| Age Bracket | # Households | % Households |
| Under 35 Years | 315 | 5.6% |
| 35 to 44 Years | 664 | 11.7% |
| 45 to 54 Years | 1,562 | 27.5% |
| 55 to 64 Years | 1,630 | 28.7% |
| 65 to 74 Years | 651 | 11.5% |
| 75 to 84 Years | 370 | 6.5% |
| 85 Years and Over | 487 | 8.6% |
| Total | 5,679 | 100.0% |
Housing Finances in North Amityville
Median Income by Occupancy in North Amityville
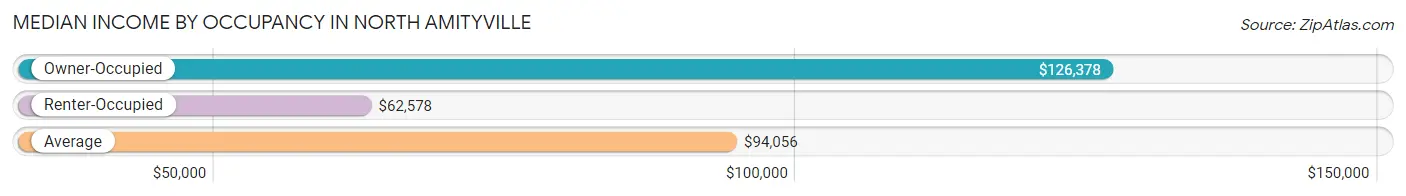
| Occupancy Type | # Households | Median Income |
| Owner-Occupied | 3,378 (59.5%) | $126,378 |
| Renter-Occupied | 2,301 (40.5%) | $62,578 |
| Average | 5,679 (100.0%) | $94,056 |
Occupancy by Householder Income Bracket in North Amityville
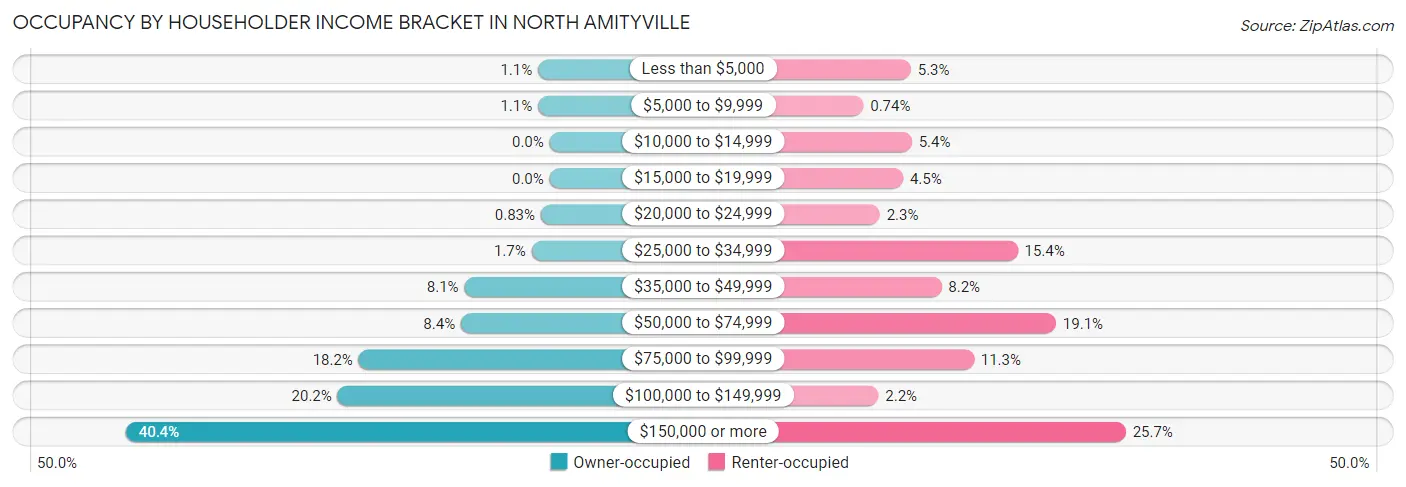
| Income Bracket | Owner-occupied | Renter-occupied |
| Less than $5,000 | 37 (1.1%) | 121 (5.3%) |
| $5,000 to $9,999 | 37 (1.1%) | 17 (0.7%) |
| $10,000 to $14,999 | 0 (0.0%) | 123 (5.3%) |
| $15,000 to $19,999 | 0 (0.0%) | 104 (4.5%) |
| $20,000 to $24,999 | 28 (0.8%) | 53 (2.3%) |
| $25,000 to $34,999 | 58 (1.7%) | 355 (15.4%) |
| $35,000 to $49,999 | 274 (8.1%) | 188 (8.2%) |
| $50,000 to $74,999 | 285 (8.4%) | 439 (19.1%) |
| $75,000 to $99,999 | 614 (18.2%) | 259 (11.3%) |
| $100,000 to $149,999 | 682 (20.2%) | 50 (2.2%) |
| $150,000 or more | 1,363 (40.4%) | 592 (25.7%) |
| Total | 3,378 (100.0%) | 2,301 (100.0%) |
Monthly Housing Cost Tiers in North Amityville
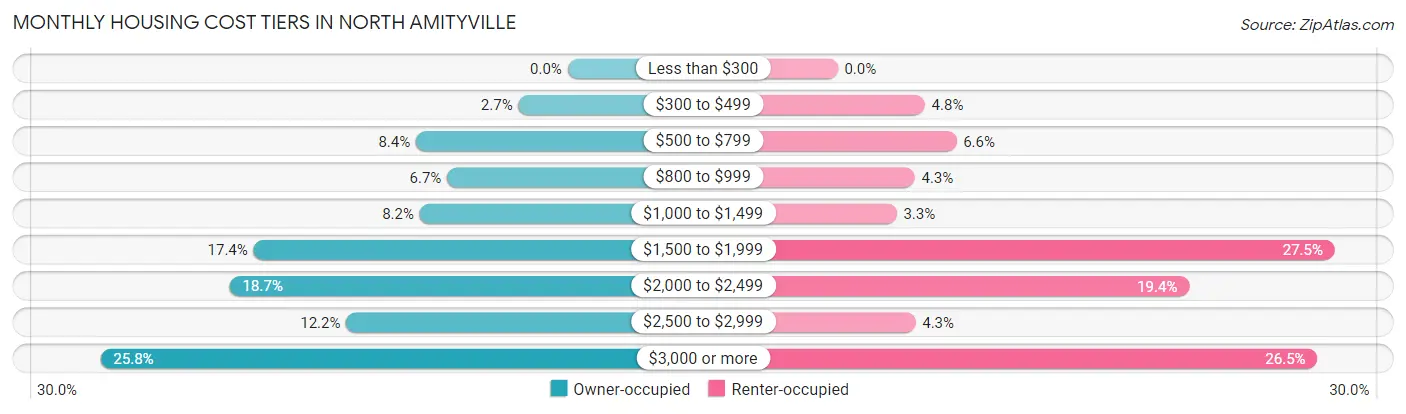
| Monthly Cost | Owner-occupied | Renter-occupied |
| Less than $300 | 0 (0.0%) | 0 (0.0%) |
| $300 to $499 | 92 (2.7%) | 111 (4.8%) |
| $500 to $799 | 283 (8.4%) | 151 (6.6%) |
| $800 to $999 | 225 (6.7%) | 98 (4.3%) |
| $1,000 to $1,499 | 276 (8.2%) | 75 (3.3%) |
| $1,500 to $1,999 | 586 (17.3%) | 632 (27.5%) |
| $2,000 to $2,499 | 631 (18.7%) | 447 (19.4%) |
| $2,500 to $2,999 | 413 (12.2%) | 99 (4.3%) |
| $3,000 or more | 872 (25.8%) | 610 (26.5%) |
| Total | 3,378 (100.0%) | 2,301 (100.0%) |
Physical Housing Characteristics in North Amityville
Housing Structures in North Amityville
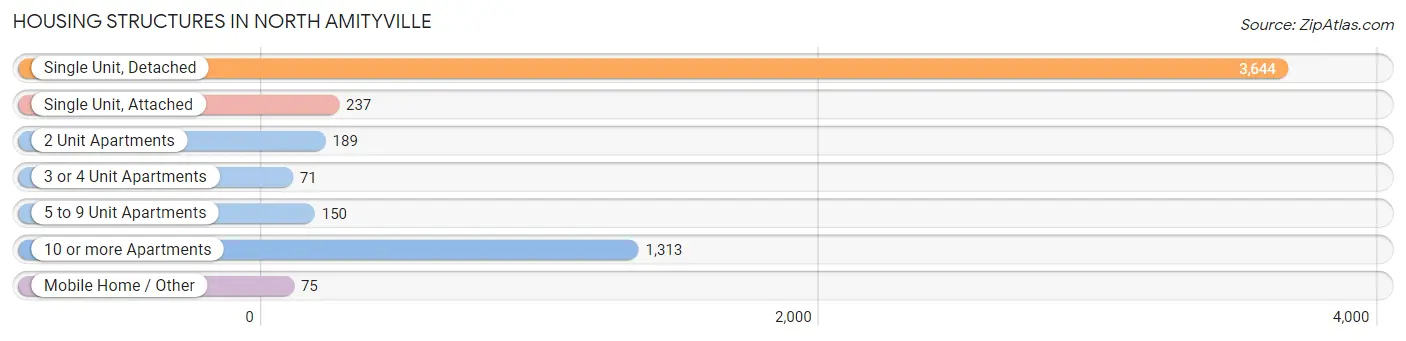
| Structure Type | # Housing Units | % Housing Units |
| Single Unit, Detached | 3,644 | 64.2% |
| Single Unit, Attached | 237 | 4.2% |
| 2 Unit Apartments | 189 | 3.3% |
| 3 or 4 Unit Apartments | 71 | 1.3% |
| 5 to 9 Unit Apartments | 150 | 2.6% |
| 10 or more Apartments | 1,313 | 23.1% |
| Mobile Home / Other | 75 | 1.3% |
| Total | 5,679 | 100.0% |
Housing Structures by Occupancy in North Amityville
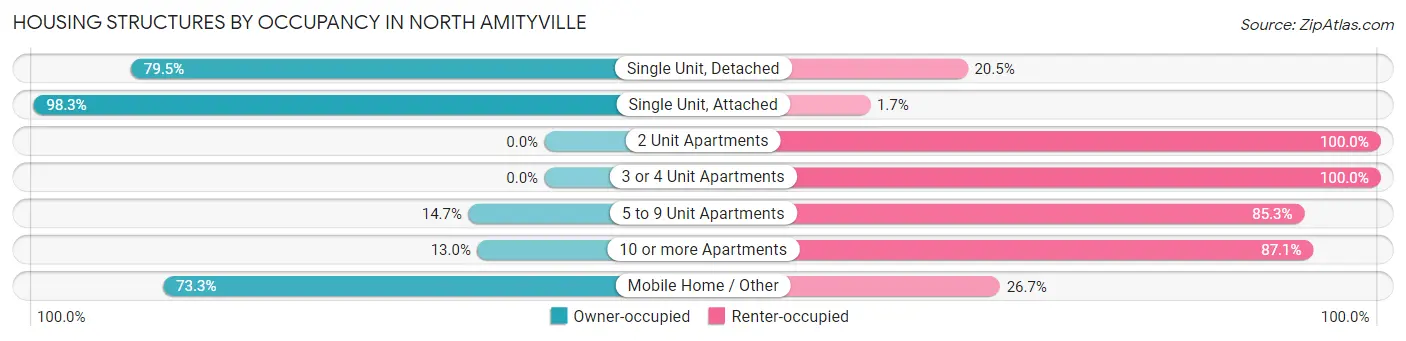
| Structure Type | Owner-occupied | Renter-occupied |
| Single Unit, Detached | 2,898 (79.5%) | 746 (20.5%) |
| Single Unit, Attached | 233 (98.3%) | 4 (1.7%) |
| 2 Unit Apartments | 0 (0.0%) | 189 (100.0%) |
| 3 or 4 Unit Apartments | 0 (0.0%) | 71 (100.0%) |
| 5 to 9 Unit Apartments | 22 (14.7%) | 128 (85.3%) |
| 10 or more Apartments | 170 (13.0%) | 1,143 (87.1%) |
| Mobile Home / Other | 55 (73.3%) | 20 (26.7%) |
| Total | 3,378 (59.5%) | 2,301 (40.5%) |
Housing Structures by Number of Rooms in North Amityville
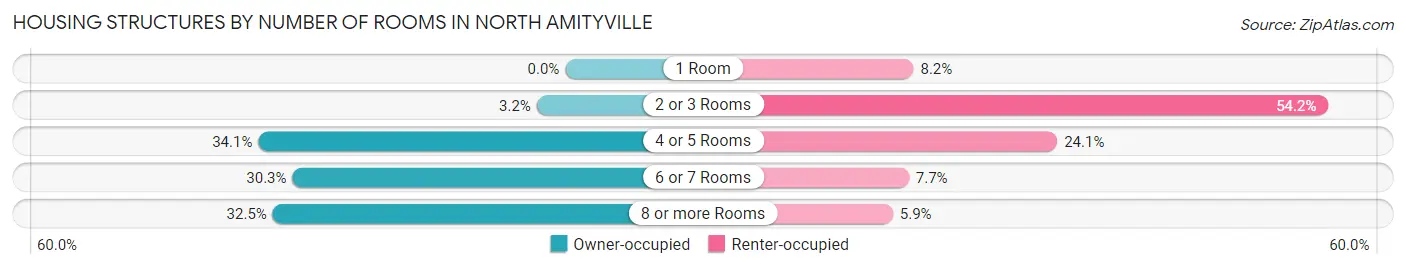
| Number of Rooms | Owner-occupied | Renter-occupied |
| 1 Room | 0 (0.0%) | 188 (8.2%) |
| 2 or 3 Rooms | 107 (3.2%) | 1,247 (54.2%) |
| 4 or 5 Rooms | 1,151 (34.1%) | 555 (24.1%) |
| 6 or 7 Rooms | 1,023 (30.3%) | 176 (7.6%) |
| 8 or more Rooms | 1,097 (32.5%) | 135 (5.9%) |
| Total | 3,378 (100.0%) | 2,301 (100.0%) |
Housing Structure by Heating Type in North Amityville
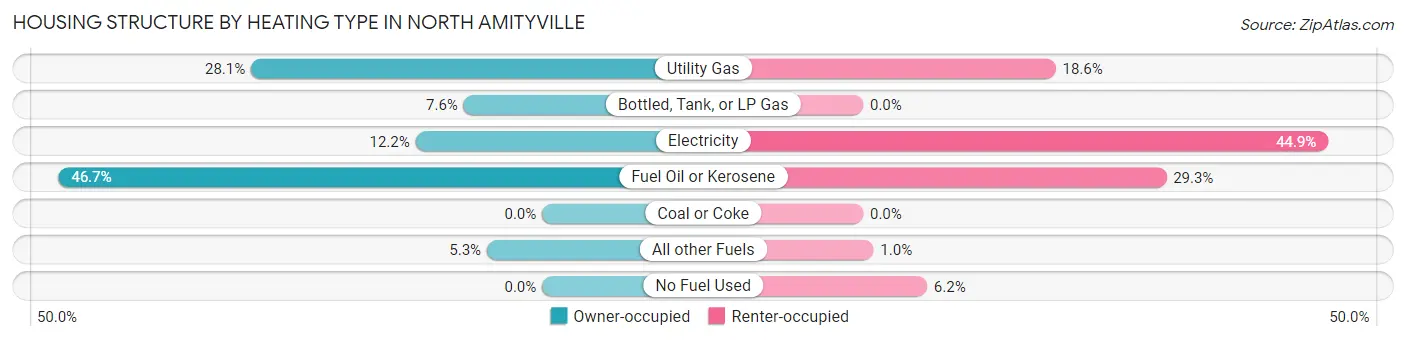
| Heating Type | Owner-occupied | Renter-occupied |
| Utility Gas | 950 (28.1%) | 428 (18.6%) |
| Bottled, Tank, or LP Gas | 256 (7.6%) | 0 (0.0%) |
| Electricity | 413 (12.2%) | 1,034 (44.9%) |
| Fuel Oil or Kerosene | 1,579 (46.7%) | 674 (29.3%) |
| Coal or Coke | 0 (0.0%) | 0 (0.0%) |
| All other Fuels | 180 (5.3%) | 23 (1.0%) |
| No Fuel Used | 0 (0.0%) | 142 (6.2%) |
| Total | 3,378 (100.0%) | 2,301 (100.0%) |
Household Vehicle Usage in North Amityville
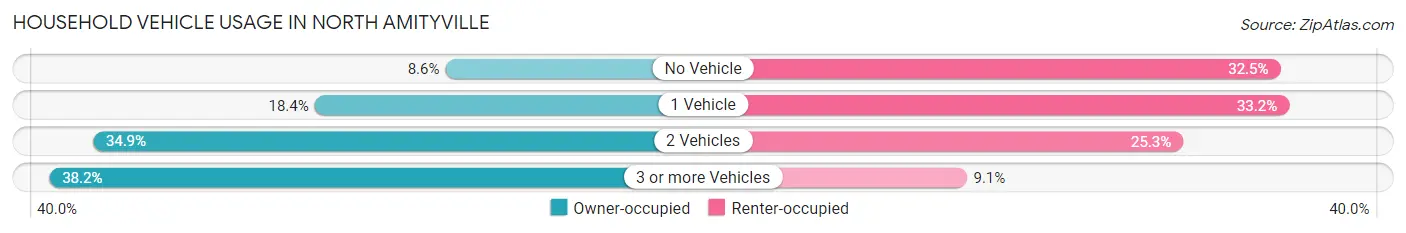
| Vehicles per Household | Owner-occupied | Renter-occupied |
| No Vehicle | 290 (8.6%) | 748 (32.5%) |
| 1 Vehicle | 620 (18.3%) | 763 (33.2%) |
| 2 Vehicles | 1,179 (34.9%) | 581 (25.3%) |
| 3 or more Vehicles | 1,289 (38.2%) | 209 (9.1%) |
| Total | 3,378 (100.0%) | 2,301 (100.0%) |
Real Estate & Mortgages in North Amityville
Real Estate and Mortgage Overview in North Amityville
| Characteristic | Without Mortgage | With Mortgage |
| Housing Units | 1,062 | 2,316 |
| Median Property Value | $329,400 | $444,000 |
| Median Household Income | $91,790 | $967 |
| Monthly Housing Costs | $1,018 | $872 |
| Real Estate Taxes | $8,753 | $17 |
Property Value by Mortgage Status in North Amityville
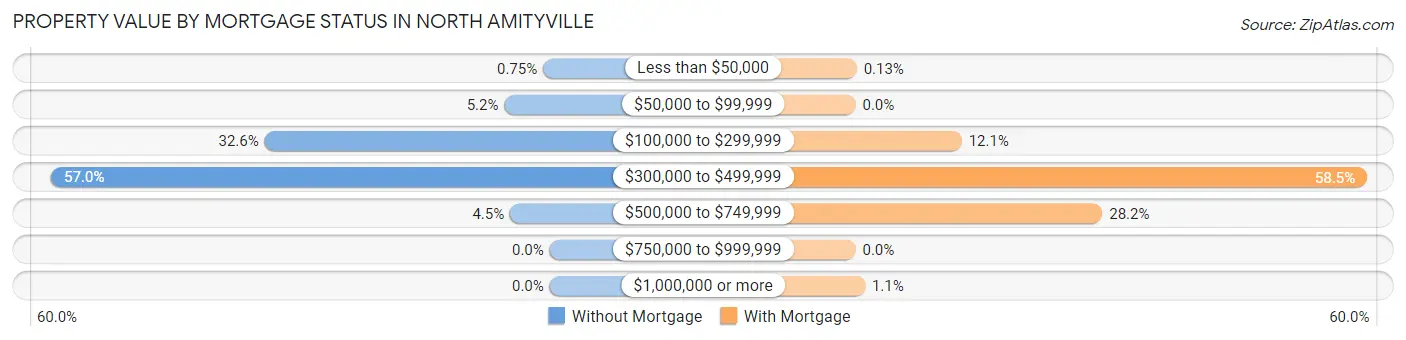
| Property Value | Without Mortgage | With Mortgage |
| Less than $50,000 | 8 (0.7%) | 3 (0.1%) |
| $50,000 to $99,999 | 55 (5.2%) | 0 (0.0%) |
| $100,000 to $299,999 | 346 (32.6%) | 281 (12.1%) |
| $300,000 to $499,999 | 605 (57.0%) | 1,354 (58.5%) |
| $500,000 to $749,999 | 48 (4.5%) | 653 (28.2%) |
| $750,000 to $999,999 | 0 (0.0%) | 0 (0.0%) |
| $1,000,000 or more | 0 (0.0%) | 25 (1.1%) |
| Total | 1,062 (100.0%) | 2,316 (100.0%) |
Household Income by Mortgage Status in North Amityville
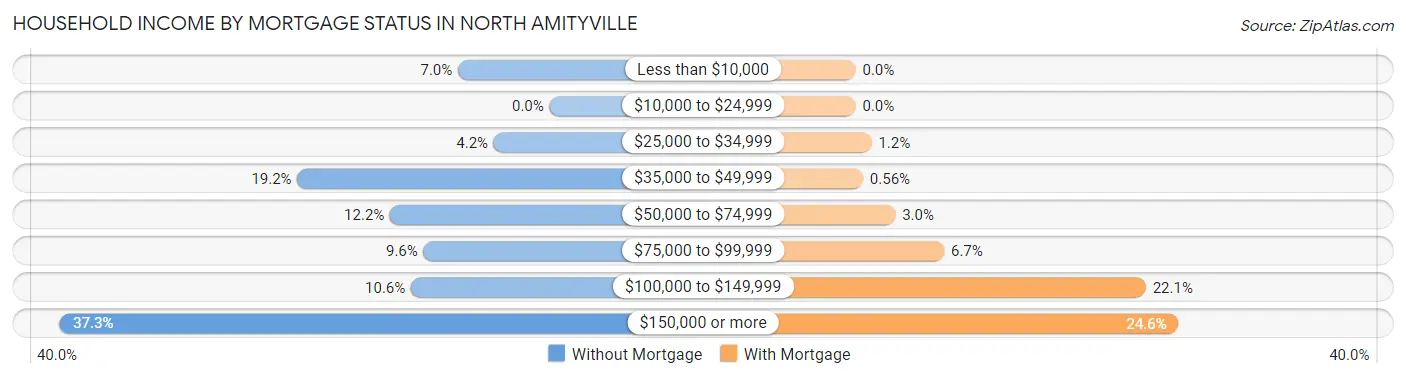
| Household Income | Without Mortgage | With Mortgage |
| Less than $10,000 | 74 (7.0%) | 0 (0.0%) |
| $10,000 to $24,999 | 0 (0.0%) | 0 (0.0%) |
| $25,000 to $34,999 | 45 (4.2%) | 28 (1.2%) |
| $35,000 to $49,999 | 204 (19.2%) | 13 (0.6%) |
| $50,000 to $74,999 | 129 (12.1%) | 70 (3.0%) |
| $75,000 to $99,999 | 102 (9.6%) | 156 (6.7%) |
| $100,000 to $149,999 | 112 (10.5%) | 512 (22.1%) |
| $150,000 or more | 396 (37.3%) | 570 (24.6%) |
| Total | 1,062 (100.0%) | 2,316 (100.0%) |
Property Value to Household Income Ratio in North Amityville
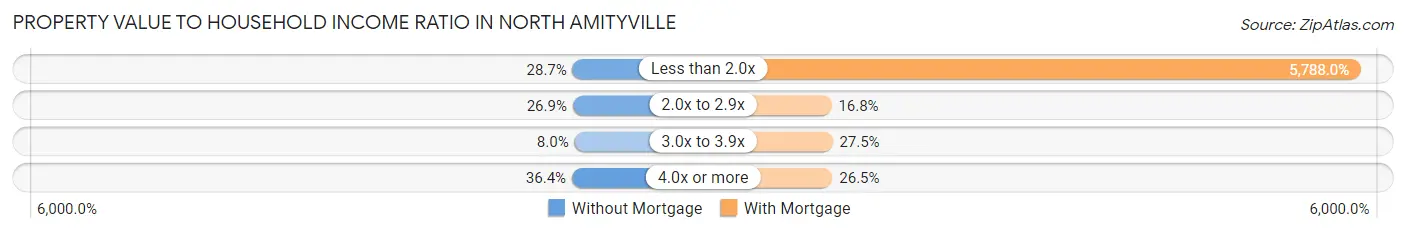
| Value-to-Income Ratio | Without Mortgage | With Mortgage |
| Less than 2.0x | 305 (28.7%) | 134,049 (5,788.0%) |
| 2.0x to 2.9x | 286 (26.9%) | 388 (16.8%) |
| 3.0x to 3.9x | 85 (8.0%) | 637 (27.5%) |
| 4.0x or more | 386 (36.3%) | 613 (26.5%) |
| Total | 1,062 (100.0%) | 2,316 (100.0%) |
Real Estate Taxes by Mortgage Status in North Amityville
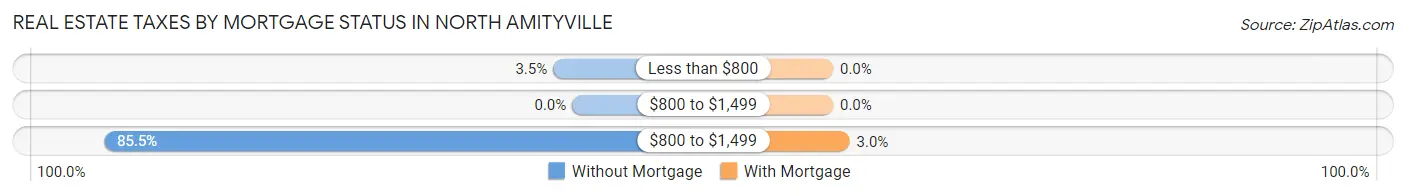
| Property Taxes | Without Mortgage | With Mortgage |
| Less than $800 | 37 (3.5%) | 0 (0.0%) |
| $800 to $1,499 | 0 (0.0%) | 0 (0.0%) |
| $800 to $1,499 | 908 (85.5%) | 70 (3.0%) |
| Total | 1,062 (100.0%) | 2,316 (100.0%) |
Health & Disability in North Amityville
Health Insurance Coverage by Age in North Amityville
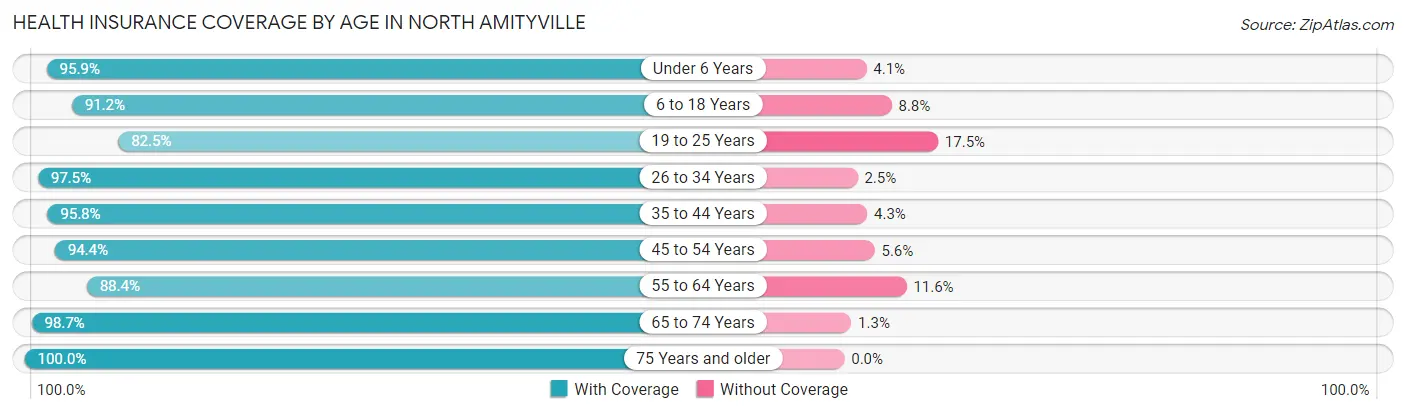
| Age Bracket | With Coverage | Without Coverage |
| Under 6 Years | 1,354 (95.9%) | 58 (4.1%) |
| 6 to 18 Years | 3,096 (91.2%) | 299 (8.8%) |
| 19 to 25 Years | 2,080 (82.5%) | 440 (17.5%) |
| 26 to 34 Years | 2,419 (97.5%) | 61 (2.5%) |
| 35 to 44 Years | 1,756 (95.8%) | 78 (4.3%) |
| 45 to 54 Years | 3,264 (94.4%) | 195 (5.6%) |
| 55 to 64 Years | 2,144 (88.4%) | 281 (11.6%) |
| 65 to 74 Years | 1,306 (98.7%) | 17 (1.3%) |
| 75 Years and older | 1,432 (100.0%) | 0 (0.0%) |
| Total | 18,851 (92.9%) | 1,429 (7.0%) |
Health Insurance Coverage by Citizenship Status in North Amityville
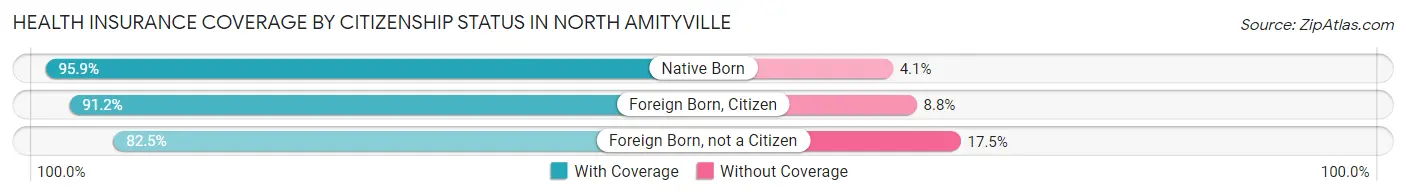
| Citizenship Status | With Coverage | Without Coverage |
| Native Born | 1,354 (95.9%) | 58 (4.1%) |
| Foreign Born, Citizen | 3,096 (91.2%) | 299 (8.8%) |
| Foreign Born, not a Citizen | 2,080 (82.5%) | 440 (17.5%) |
Health Insurance Coverage by Household Income in North Amityville
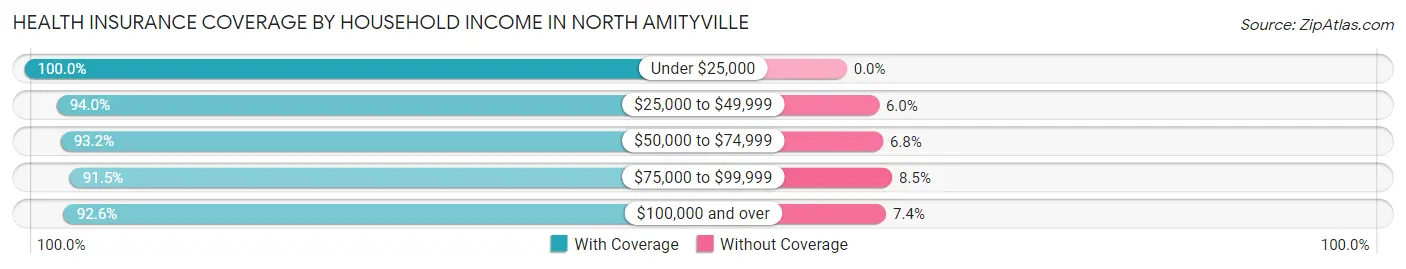
| Household Income | With Coverage | Without Coverage |
| Under $25,000 | 882 (100.0%) | 0 (0.0%) |
| $25,000 to $49,999 | 1,310 (94.0%) | 84 (6.0%) |
| $50,000 to $74,999 | 1,499 (93.2%) | 109 (6.8%) |
| $75,000 to $99,999 | 2,725 (91.5%) | 253 (8.5%) |
| $100,000 and over | 12,216 (92.6%) | 972 (7.4%) |
Public vs Private Health Insurance Coverage by Age in North Amityville
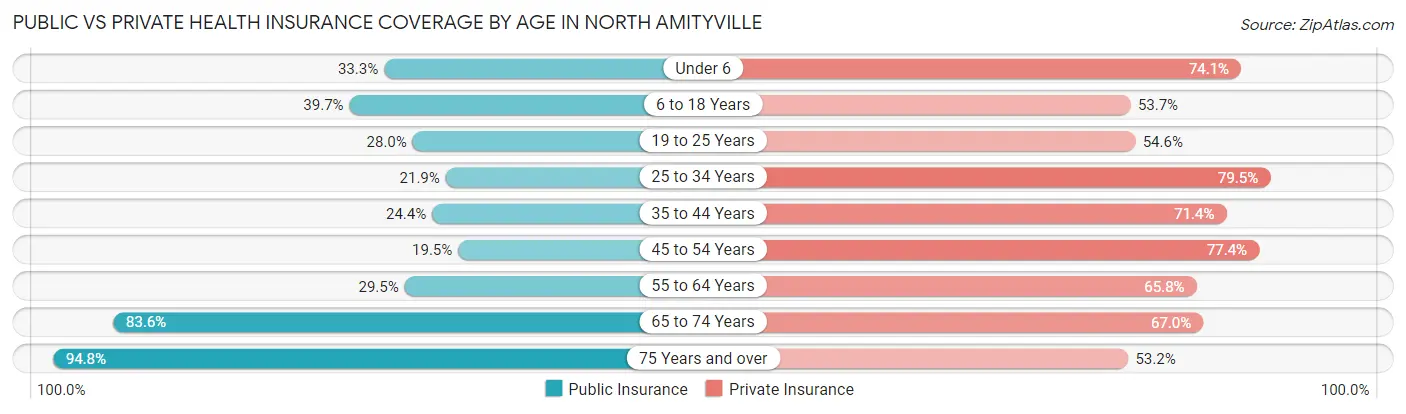
| Age Bracket | Public Insurance | Private Insurance |
| Under 6 | 470 (33.3%) | 1,046 (74.1%) |
| 6 to 18 Years | 1,348 (39.7%) | 1,822 (53.7%) |
| 19 to 25 Years | 705 (28.0%) | 1,375 (54.6%) |
| 25 to 34 Years | 542 (21.8%) | 1,971 (79.5%) |
| 35 to 44 Years | 447 (24.4%) | 1,309 (71.4%) |
| 45 to 54 Years | 676 (19.5%) | 2,678 (77.4%) |
| 55 to 64 Years | 715 (29.5%) | 1,596 (65.8%) |
| 65 to 74 Years | 1,106 (83.6%) | 887 (67.0%) |
| 75 Years and over | 1,357 (94.8%) | 762 (53.2%) |
| Total | 7,366 (36.3%) | 13,446 (66.3%) |
Disability Status by Sex by Age in North Amityville
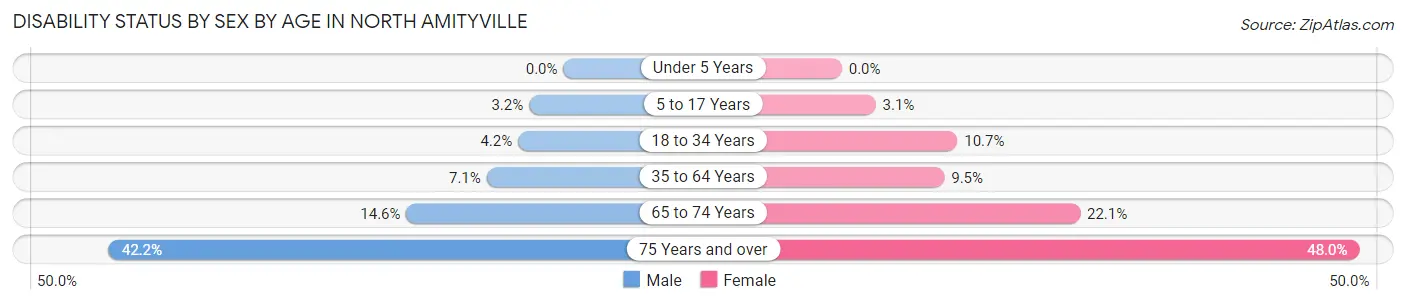
| Age Bracket | Male | Female |
| Under 5 Years | 0 (0.0%) | 0 (0.0%) |
| 5 to 17 Years | 59 (3.2%) | 52 (3.1%) |
| 18 to 34 Years | 131 (4.2%) | 228 (10.7%) |
| 35 to 64 Years | 220 (7.1%) | 440 (9.5%) |
| 65 to 74 Years | 88 (14.6%) | 159 (22.1%) |
| 75 Years and over | 186 (42.2%) | 476 (48.0%) |
Disability Class by Sex by Age in North Amityville
Disability Class: Hearing Difficulty
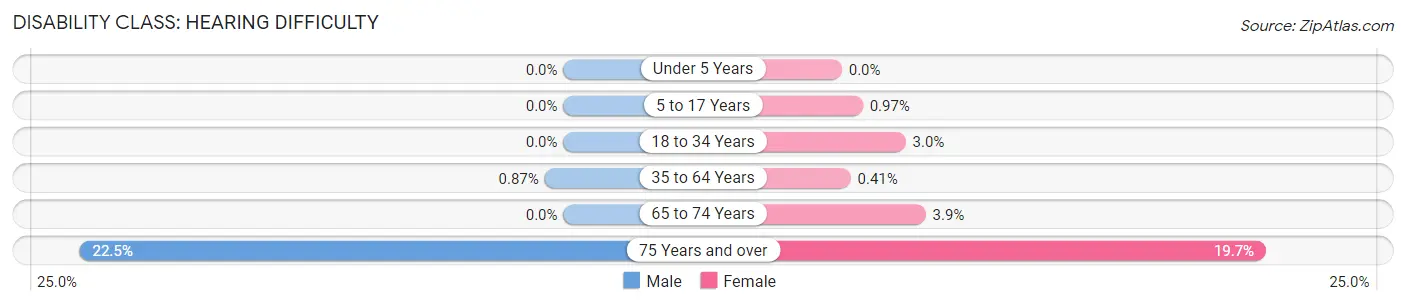
| Age Bracket | Male | Female |
| Under 5 Years | 0 (0.0%) | 0 (0.0%) |
| 5 to 17 Years | 0 (0.0%) | 16 (1.0%) |
| 18 to 34 Years | 0 (0.0%) | 63 (3.0%) |
| 35 to 64 Years | 27 (0.9%) | 19 (0.4%) |
| 65 to 74 Years | 0 (0.0%) | 28 (3.9%) |
| 75 Years and over | 99 (22.5%) | 195 (19.7%) |
Disability Class: Vision Difficulty
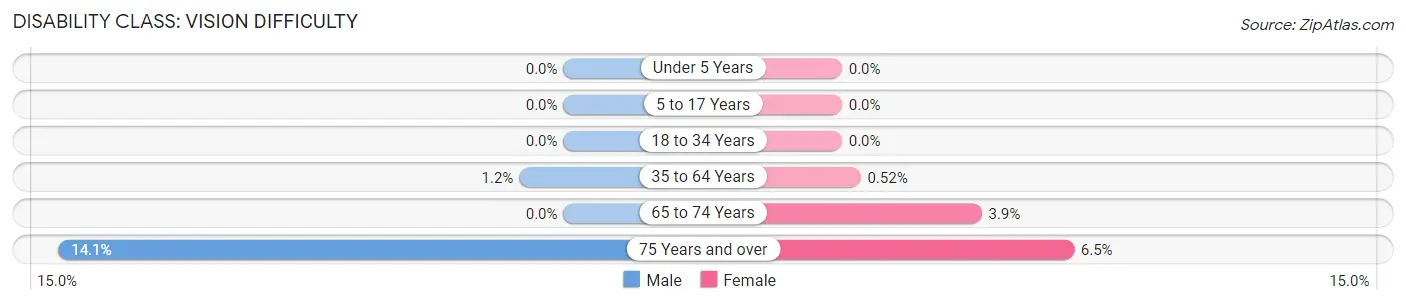
| Age Bracket | Male | Female |
| Under 5 Years | 0 (0.0%) | 0 (0.0%) |
| 5 to 17 Years | 0 (0.0%) | 0 (0.0%) |
| 18 to 34 Years | 0 (0.0%) | 0 (0.0%) |
| 35 to 64 Years | 38 (1.2%) | 24 (0.5%) |
| 65 to 74 Years | 0 (0.0%) | 28 (3.9%) |
| 75 Years and over | 62 (14.1%) | 64 (6.5%) |
Disability Class: Cognitive Difficulty
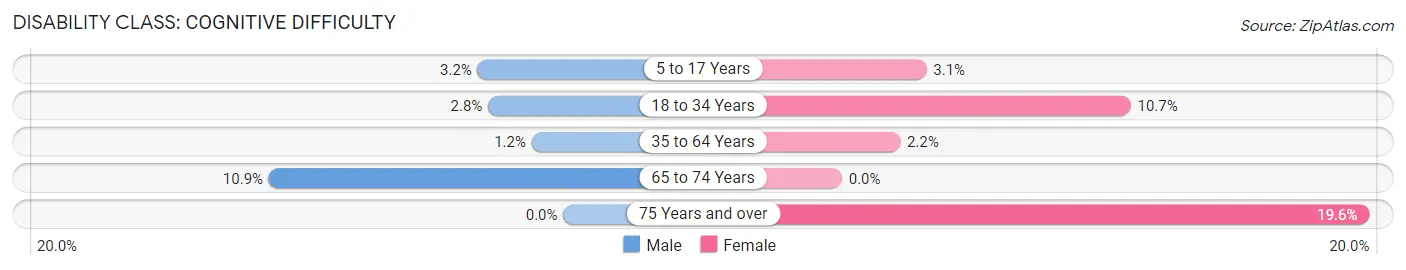
| Age Bracket | Male | Female |
| 5 to 17 Years | 59 (3.2%) | 52 (3.1%) |
| 18 to 34 Years | 87 (2.8%) | 228 (10.7%) |
| 35 to 64 Years | 36 (1.2%) | 100 (2.2%) |
| 65 to 74 Years | 66 (10.9%) | 0 (0.0%) |
| 75 Years and over | 0 (0.0%) | 194 (19.6%) |
Disability Class: Ambulatory Difficulty
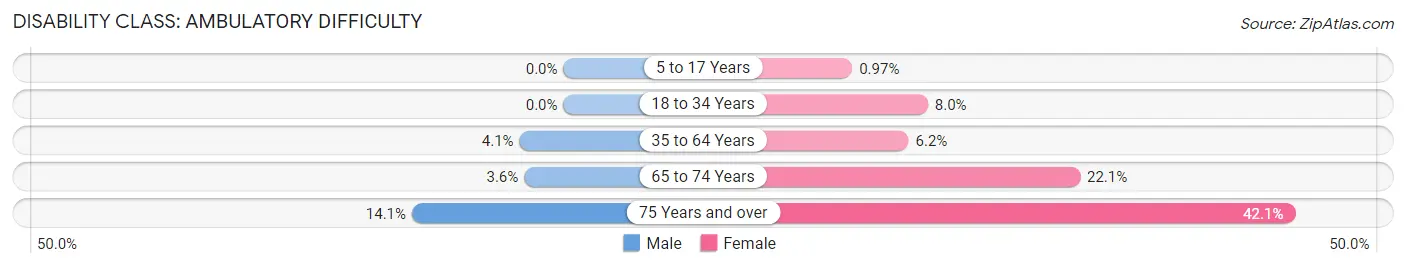
| Age Bracket | Male | Female |
| 5 to 17 Years | 0 (0.0%) | 16 (1.0%) |
| 18 to 34 Years | 0 (0.0%) | 170 (8.0%) |
| 35 to 64 Years | 126 (4.1%) | 287 (6.2%) |
| 65 to 74 Years | 22 (3.6%) | 159 (22.1%) |
| 75 Years and over | 62 (14.1%) | 417 (42.1%) |
Disability Class: Self-Care Difficulty
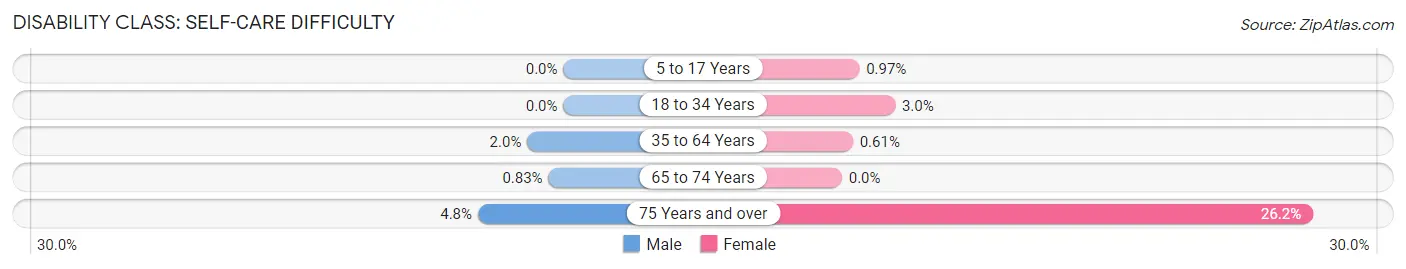
| Age Bracket | Male | Female |
| 5 to 17 Years | 0 (0.0%) | 16 (1.0%) |
| 18 to 34 Years | 0 (0.0%) | 63 (3.0%) |
| 35 to 64 Years | 62 (2.0%) | 28 (0.6%) |
| 65 to 74 Years | 5 (0.8%) | 0 (0.0%) |
| 75 Years and over | 21 (4.8%) | 260 (26.2%) |
Technology Access in North Amityville
Computing Device Access in North Amityville
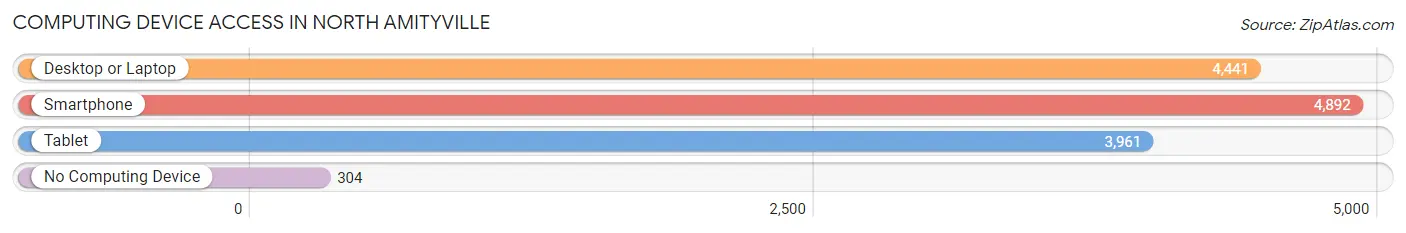
| Device Type | # Households | % Households |
| Desktop or Laptop | 4,441 | 78.2% |
| Smartphone | 4,892 | 86.1% |
| Tablet | 3,961 | 69.8% |
| No Computing Device | 304 | 5.3% |
| Total | 5,679 | 100.0% |
Internet Access in North Amityville
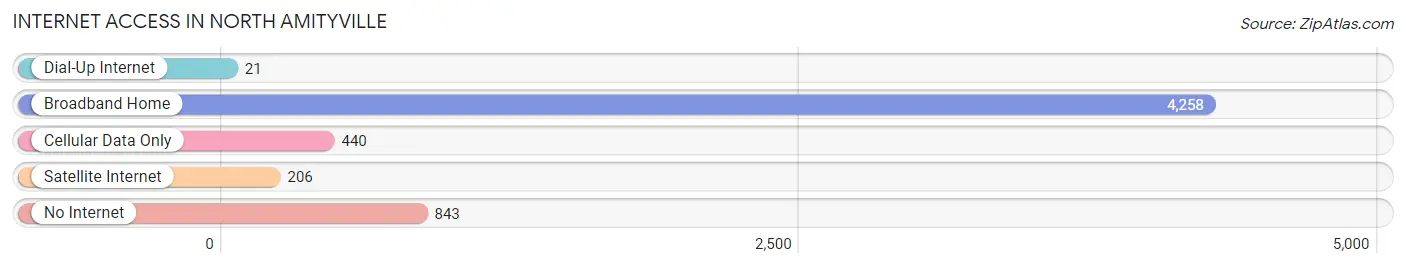
| Internet Type | # Households | % Households |
| Dial-Up Internet | 21 | 0.4% |
| Broadband Home | 4,258 | 75.0% |
| Cellular Data Only | 440 | 7.7% |
| Satellite Internet | 206 | 3.6% |
| No Internet | 843 | 14.8% |
| Total | 5,679 | 100.0% |
North Amityville Summary
North Amityville is a hamlet located in the Town of Babylon in Suffolk County, New York, United States. It is located on the South Shore of Long Island, approximately 50 miles east of Manhattan. The hamlet is bordered by Copiague to the west, East Massapequa to the east, North Lindenhurst to the north, and South Farmingdale to the south. As of the 2010 census, the population of North Amityville was 8,443.
History
The area now known as North Amityville was originally inhabited by the Secatogue Indians, a branch of the Algonquin tribe. The first European settlers arrived in the area in the 1650s, and the hamlet was officially established in 1753. The hamlet was originally known as "Great Neck South", and was part of the Town of Oyster Bay. In 1853, the hamlet was renamed "Amityville", after the Amityville Creek, which runs through the area.
In the late 19th century, the hamlet began to grow rapidly, and by the early 20th century, it had become a popular summer resort destination. The hamlet was officially incorporated as the Village of Amityville in 1925. In the 1950s, the hamlet began to experience a population boom, and in the 1960s, the hamlet was split into two parts: North Amityville and South Amityville.
Geography
North Amityville is located at 40°41'25"N 73°24'45"W (40.690278, -73.412500). The hamlet has a total area of 2.2 square miles, all of which is land. The hamlet is located on the South Shore of Long Island, approximately 50 miles east of Manhattan. The hamlet is bordered by Copiague to the west, East Massapequa to the east, North Lindenhurst to the north, and South Farmingdale to the south.
Economy
North Amityville is primarily a residential community, and the majority of its residents are employed in the service sector. The hamlet is home to several small businesses, including restaurants, retail stores, and professional services. The hamlet is also home to a number of industrial and manufacturing businesses, including a plastics factory and a printing company.
Demographics
As of the 2010 census, the population of North Amityville was 8,443. The racial makeup of the hamlet was 57.2% White, 28.2% African American, 0.5% Native American, 2.2% Asian, 0.1% Pacific Islander, 8.2% from other races, and 3.7% from two or more races. Hispanic or Latino of any race were 18.3% of the population.
The median household income in North Amityville was $63,917, and the median family income was $71,917. The per capita income for the hamlet was $25,917. About 8.2% of families and 10.2% of the population were below the poverty line, including 14.2% of those under age 18 and 8.2% of those age 65 or over.
Common Questions
What is Per Capita Income in North Amityville?
Per Capita income in North Amityville is $39,430.
What is the Median Family Income in North Amityville?
Median Family Income in North Amityville is $120,348.
What is the Median Household income in North Amityville?
Median Household Income in North Amityville is $94,056.
What is Income or Wage Gap in North Amityville?
Income or Wage Gap in North Amityville is 12.0%.
Women in North Amityville earn 88.0 cents for every dollar earned by a man.
What is Inequality or Gini Index in North Amityville?
Inequality or Gini Index in North Amityville is 0.44.
What is the Total Population of North Amityville?
Total Population of North Amityville is 20,336.
What is the Total Male Population of North Amityville?
Total Male Population of North Amityville is 9,524.
What is the Total Female Population of North Amityville?
Total Female Population of North Amityville is 10,812.
What is the Ratio of Males per 100 Females in North Amityville?
There are 88.09 Males per 100 Females in North Amityville.
What is the Ratio of Females per 100 Males in North Amityville?
There are 113.52 Females per 100 Males in North Amityville.
What is the Median Population Age in North Amityville?
Median Population Age in North Amityville is 37.3 Years.
What is the Average Family Size in North Amityville
Average Family Size in North Amityville is 4.2 People.
What is the Average Household Size in North Amityville
Average Household Size in North Amityville is 3.5 People.
How Large is the Labor Force in North Amityville?
There are 12,200 People in the Labor Forcein in North Amityville.
What is the Percentage of People in the Labor Force in North Amityville?
74.4% of People are in the Labor Force in North Amityville.
What is the Unemployment Rate in North Amityville?
Unemployment Rate in North Amityville is 4.5%.