Coram, NY Map & Demographics
Coram Map
Coram Overview
$46,480
PER CAPITA INCOME
$119,410
AVG FAMILY INCOME
$95,940
AVG HOUSEHOLD INCOME
23.4%
WAGE / INCOME GAP [ % ]
76.6¢/ $1
WAGE / INCOME GAP [ $ ]
0.42
INEQUALITY / GINI INDEX
42,169
TOTAL POPULATION
20,148
MALE POPULATION
22,021
FEMALE POPULATION
91.49
MALES / 100 FEMALES
109.30
FEMALES / 100 MALES
40.7
MEDIAN AGE
3.4
AVG FAMILY SIZE
2.7
AVG HOUSEHOLD SIZE
22,872
LABOR FORCE [ PEOPLE ]
66.8%
PERCENT IN LABOR FORCE
3.7%
UNEMPLOYMENT RATE
Coram Zip Codes
Coram Area Codes
Income in Coram
Income Overview in Coram
Per Capita Income in Coram is $46,480, while median incomes of families and households are $119,410 and $95,940 respectively.
| Characteristic | Number | Measure |
| Per Capita Income | 42,169 | $46,480 |
| Median Family Income | 9,962 | $119,410 |
| Mean Family Income | 9,962 | $145,539 |
| Median Household Income | 15,496 | $95,940 |
| Mean Household Income | 15,496 | $122,508 |
| Income Deficit | 9,962 | $0 |
| Wage / Income Gap (%) | 42,169 | 23.44% |
| Wage / Income Gap ($) | 42,169 | 76.56¢ per $1 |
| Gini / Inequality Index | 42,169 | 0.42 |
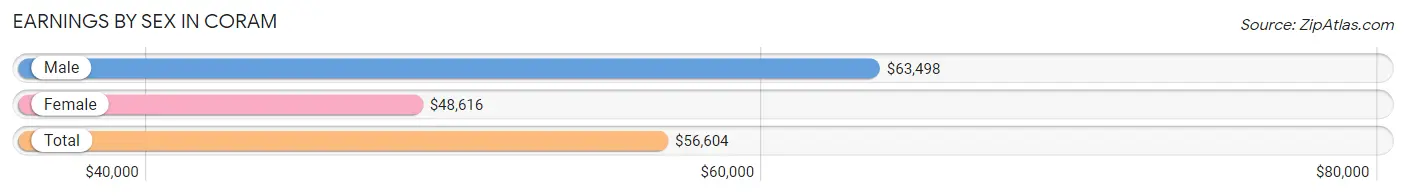
Earnings by Sex in Coram
Average Earnings in Coram are $56,604, $63,498 for men and $48,616 for women, a difference of 23.4%.
| Sex | Number | Average Earnings |
| Male | 11,442 (49.3%) | $63,498 |
| Female | 11,784 (50.7%) | $48,616 |
| Total | 23,226 (100.0%) | $56,604 |
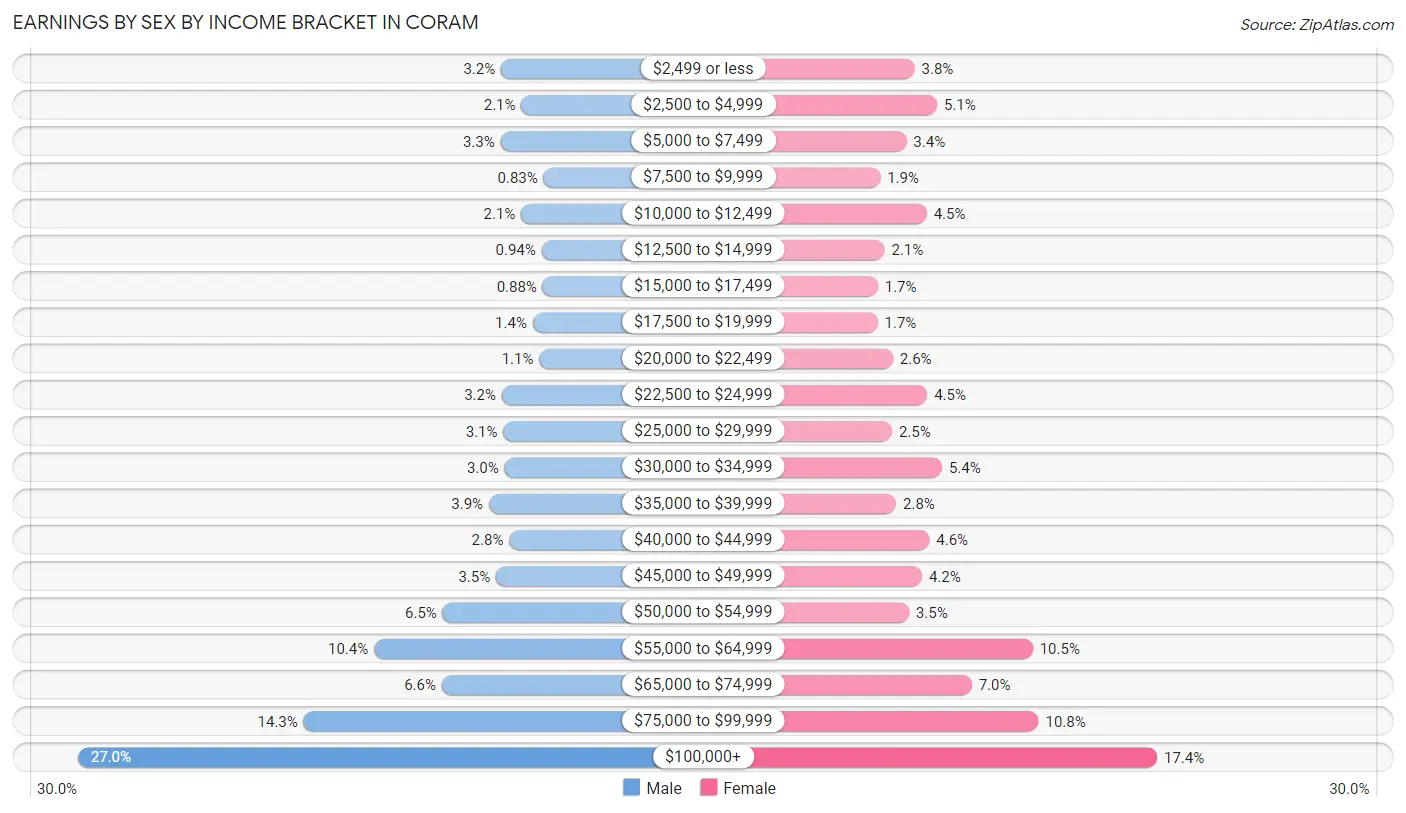
Earnings by Sex by Income Bracket in Coram
The most common earnings brackets in Coram are $100,000+ for men (3,091 | 27.0%) and $100,000+ for women (2,055 | 17.4%).
| Income | Male | Female |
| $2,499 or less | 368 (3.2%) | 449 (3.8%) |
| $2,500 to $4,999 | 238 (2.1%) | 597 (5.1%) |
| $5,000 to $7,499 | 372 (3.3%) | 395 (3.4%) |
| $7,500 to $9,999 | 95 (0.8%) | 222 (1.9%) |
| $10,000 to $12,499 | 239 (2.1%) | 529 (4.5%) |
| $12,500 to $14,999 | 107 (0.9%) | 250 (2.1%) |
| $15,000 to $17,499 | 101 (0.9%) | 205 (1.7%) |
| $17,500 to $19,999 | 165 (1.4%) | 204 (1.7%) |
| $20,000 to $22,499 | 122 (1.1%) | 305 (2.6%) |
| $22,500 to $24,999 | 364 (3.2%) | 533 (4.5%) |
| $25,000 to $29,999 | 354 (3.1%) | 299 (2.5%) |
| $30,000 to $34,999 | 346 (3.0%) | 630 (5.3%) |
| $35,000 to $39,999 | 446 (3.9%) | 326 (2.8%) |
| $40,000 to $44,999 | 316 (2.8%) | 547 (4.6%) |
| $45,000 to $49,999 | 400 (3.5%) | 499 (4.2%) |
| $50,000 to $54,999 | 744 (6.5%) | 411 (3.5%) |
| $55,000 to $64,999 | 1,185 (10.4%) | 1,231 (10.4%) |
| $65,000 to $74,999 | 750 (6.6%) | 827 (7.0%) |
| $75,000 to $99,999 | 1,639 (14.3%) | 1,270 (10.8%) |
| $100,000+ | 3,091 (27.0%) | 2,055 (17.4%) |
| Total | 11,442 (100.0%) | 11,784 (100.0%) |
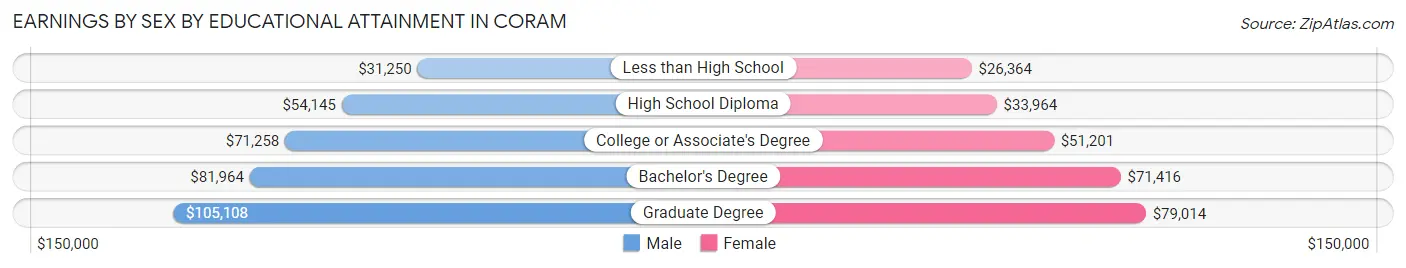
Earnings by Sex by Educational Attainment in Coram
Average earnings in Coram are $70,353 for men and $56,508 for women, a difference of 19.7%. Men with an educational attainment of graduate degree enjoy the highest average annual earnings of $105,108, while those with less than high school education earn the least with $31,250. Women with an educational attainment of graduate degree earn the most with the average annual earnings of $79,014, while those with less than high school education have the smallest earnings of $26,364.
| Educational Attainment | Male Income | Female Income |
| Less than High School | $31,250 | $26,364 |
| High School Diploma | $54,145 | $33,964 |
| College or Associate's Degree | $71,258 | $51,201 |
| Bachelor's Degree | $81,964 | $71,416 |
| Graduate Degree | $105,108 | $79,014 |
| Total | $70,353 | $56,508 |
Family Income in Coram
Family Income Brackets in Coram
According to the Coram family income data, there are 2,281 families falling into the $100,000 to $149,999 income range, which is the most common income bracket and makes up 22.9% of all families. Conversely, the $10,000 to $14,999 income bracket is the least frequent group with only 120 families (1.2%) belonging to this category.
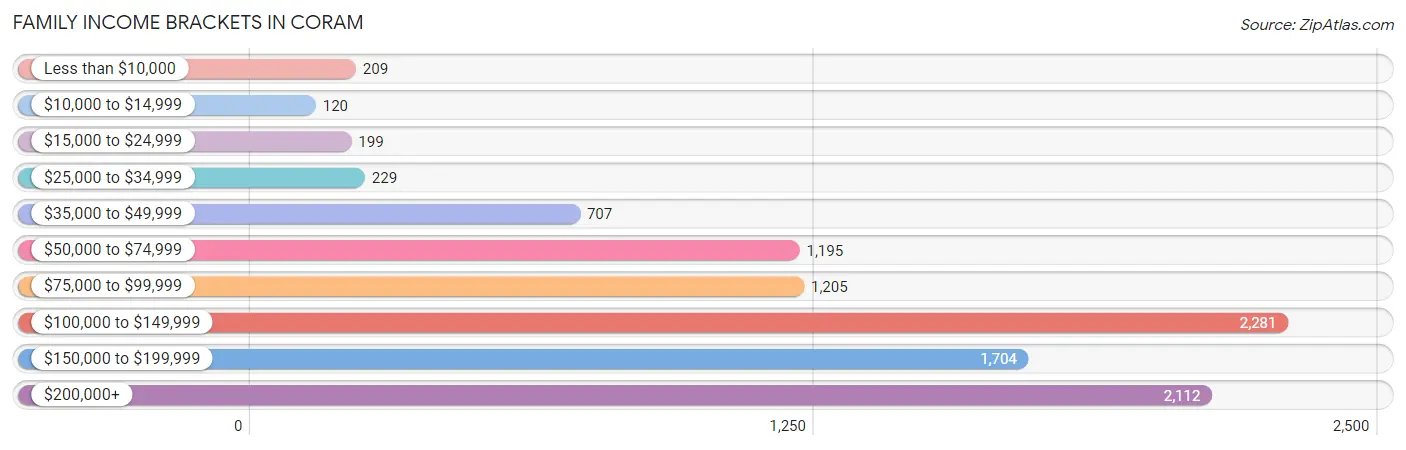
| Income Bracket | # Families | % Families |
| Less than $10,000 | 209 | 2.1% |
| $10,000 to $14,999 | 120 | 1.2% |
| $15,000 to $24,999 | 199 | 2.0% |
| $25,000 to $34,999 | 229 | 2.3% |
| $35,000 to $49,999 | 707 | 7.1% |
| $50,000 to $74,999 | 1,195 | 12.0% |
| $75,000 to $99,999 | 1,205 | 12.1% |
| $100,000 to $149,999 | 2,281 | 22.9% |
| $150,000 to $199,999 | 1,704 | 17.1% |
| $200,000+ | 2,112 | 21.2% |
Family Income by Famaliy Size in Coram
5-person families (789 | 7.9%) account for the highest median family income in Coram with $186,078 per family, while 2-person families (4,185 | 42.0%) have the highest median income of $50,094 per family member.
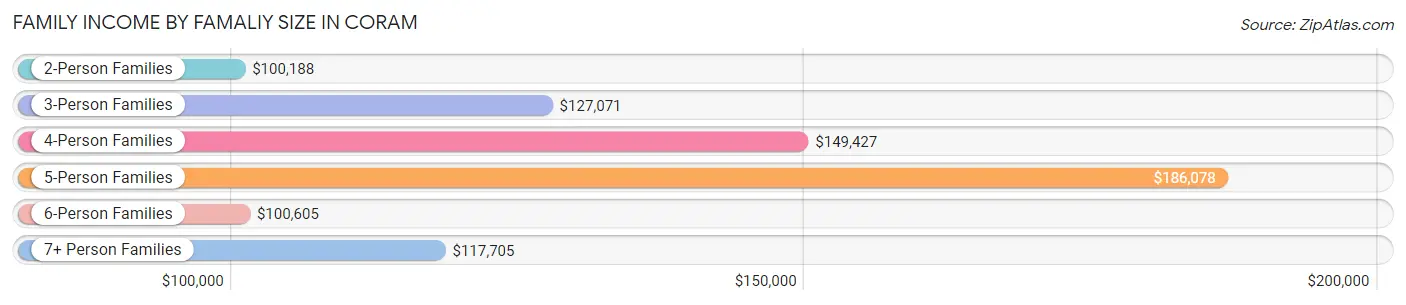
| Income Bracket | # Families | Median Income |
| 2-Person Families | 4,185 (42.0%) | $100,188 |
| 3-Person Families | 2,080 (20.9%) | $127,071 |
| 4-Person Families | 2,098 (21.1%) | $149,427 |
| 5-Person Families | 789 (7.9%) | $186,078 |
| 6-Person Families | 601 (6.0%) | $100,605 |
| 7+ Person Families | 209 (2.1%) | $117,705 |
| Total | 9,962 (100.0%) | $119,410 |
Family Income by Number of Earners in Coram
The median family income in Coram is $119,410, with families comprising 3+ earners (1,413) having the highest median family income of $182,008, while families with no earners (1,321) have the lowest median family income of $64,153, accounting for 14.2% and 13.3% of families, respectively.
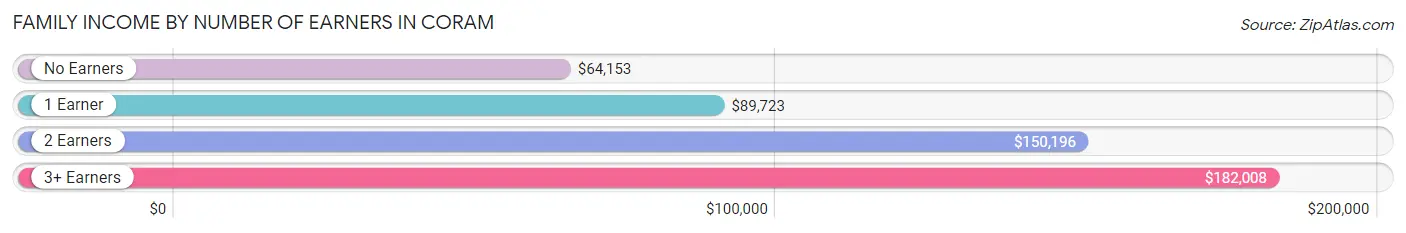
| Number of Earners | # Families | Median Income |
| No Earners | 1,321 (13.3%) | $64,153 |
| 1 Earner | 2,683 (26.9%) | $89,723 |
| 2 Earners | 4,545 (45.6%) | $150,196 |
| 3+ Earners | 1,413 (14.2%) | $182,008 |
| Total | 9,962 (100.0%) | $119,410 |
Household Income in Coram
Household Income Brackets in Coram
With 3,068 households falling in the category, the $100,000 to $149,999 income range is the most frequent in Coram, accounting for 19.8% of all households. In contrast, only 418 households (2.7%) fall into the $10,000 to $14,999 income bracket, making it the least populous group.
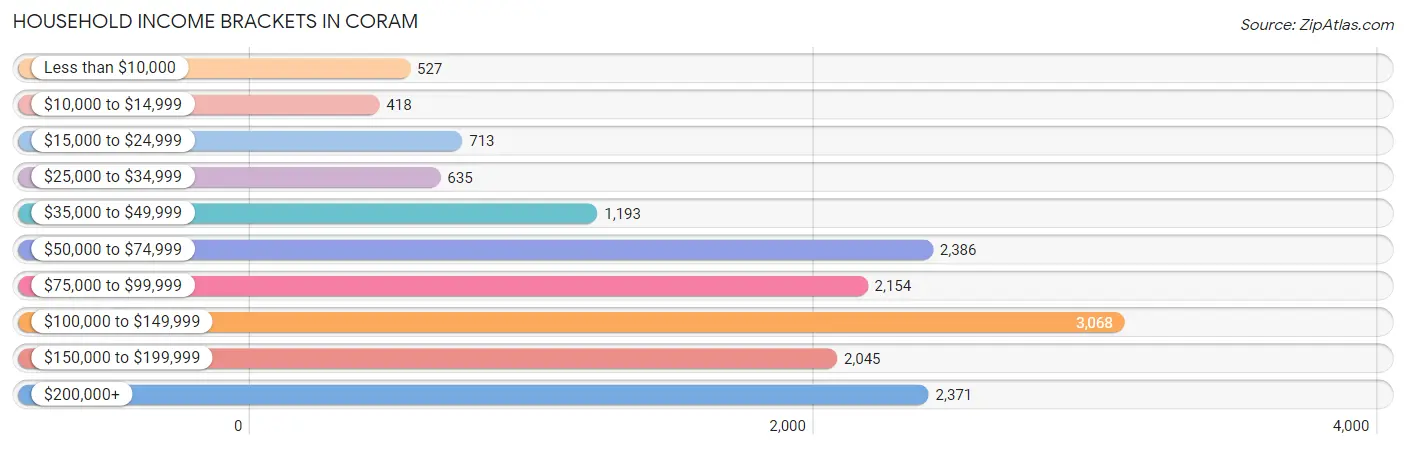
| Income Bracket | # Households | % Households |
| Less than $10,000 | 527 | 3.4% |
| $10,000 to $14,999 | 418 | 2.7% |
| $15,000 to $24,999 | 713 | 4.6% |
| $25,000 to $34,999 | 635 | 4.1% |
| $35,000 to $49,999 | 1,193 | 7.7% |
| $50,000 to $74,999 | 2,386 | 15.4% |
| $75,000 to $99,999 | 2,154 | 13.9% |
| $100,000 to $149,999 | 3,068 | 19.8% |
| $150,000 to $199,999 | 2,045 | 13.2% |
| $200,000+ | 2,371 | 15.3% |
Household Income by Householder Age in Coram
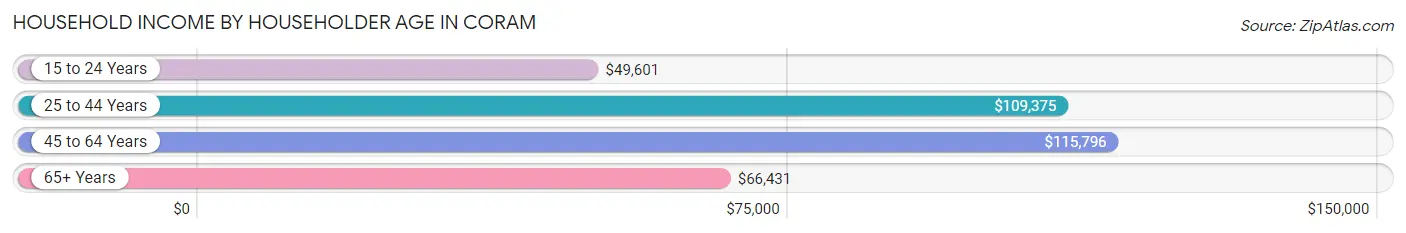
The median household income in Coram is $95,940, with the highest median household income of $115,796 found in the 45 to 64 years age bracket for the primary householder. A total of 6,974 households (45.0%) fall into this category. Meanwhile, the 15 to 24 years age bracket for the primary householder has the lowest median household income of $49,601, with 281 households (1.8%) in this group.
| Income Bracket | # Households | Median Income |
| 15 to 24 Years | 281 (1.8%) | $49,601 |
| 25 to 44 Years | 4,092 (26.4%) | $109,375 |
| 45 to 64 Years | 6,974 (45.0%) | $115,796 |
| 65+ Years | 4,149 (26.8%) | $66,431 |
| Total | 15,496 (100.0%) | $95,940 |
Poverty in Coram
Income Below Poverty by Sex and Age in Coram
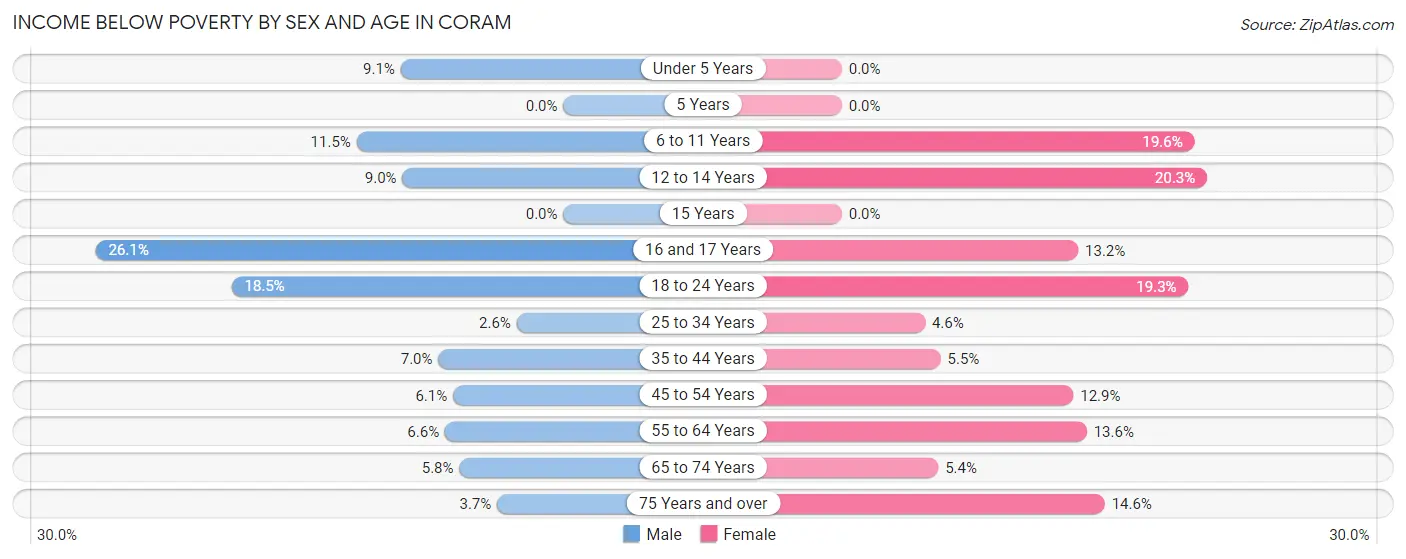
With 7.5% poverty level for males and 11.1% for females among the residents of Coram, 16 and 17 year old males and 12 to 14 year old females are the most vulnerable to poverty, with 87 males (26.1%) and 189 females (20.3%) in their respective age groups living below the poverty level.
| Age Bracket | Male | Female |
| Under 5 Years | 146 (9.1%) | 0 (0.0%) |
| 5 Years | 0 (0.0%) | 0 (0.0%) |
| 6 to 11 Years | 146 (11.5%) | 272 (19.6%) |
| 12 to 14 Years | 55 (9.0%) | 189 (20.3%) |
| 15 Years | 0 (0.0%) | 0 (0.0%) |
| 16 and 17 Years | 87 (26.1%) | 65 (13.2%) |
| 18 to 24 Years | 329 (18.5%) | 416 (19.3%) |
| 25 to 34 Years | 73 (2.6%) | 142 (4.6%) |
| 35 to 44 Years | 138 (7.0%) | 116 (5.5%) |
| 45 to 54 Years | 211 (6.1%) | 467 (12.9%) |
| 55 to 64 Years | 179 (6.6%) | 388 (13.6%) |
| 65 to 74 Years | 114 (5.8%) | 120 (5.4%) |
| 75 Years and over | 37 (3.7%) | 231 (14.6%) |
| Total | 1,515 (7.5%) | 2,406 (11.1%) |
Income Above Poverty by Sex and Age in Coram
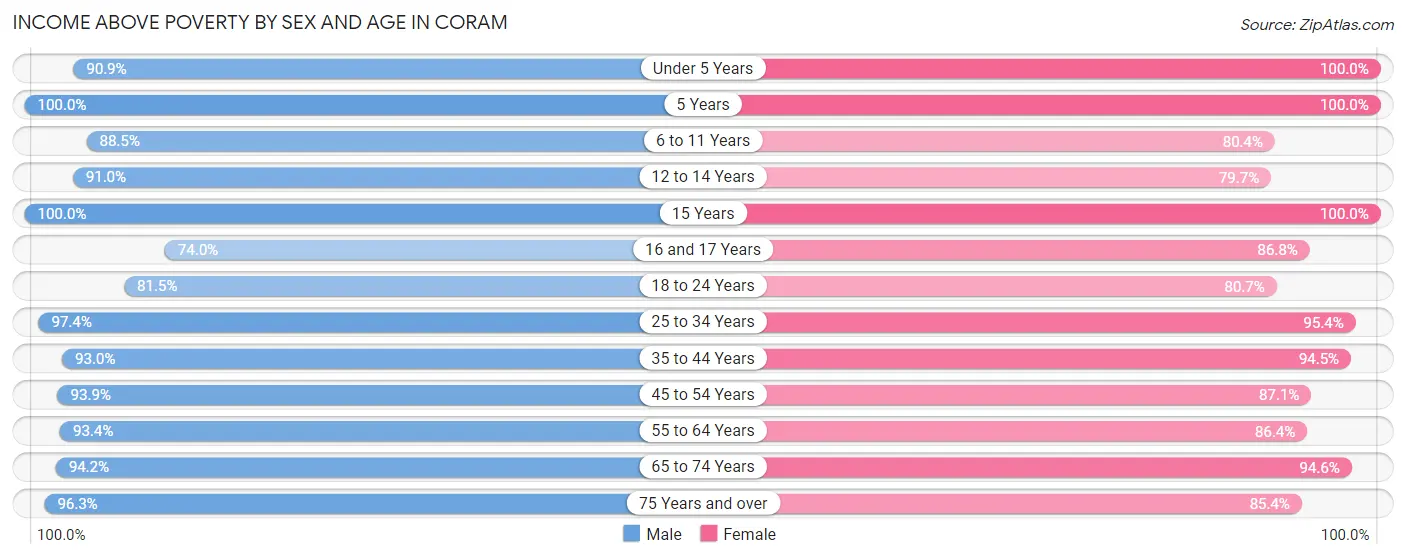
According to the poverty statistics in Coram, males aged 5 years and females aged under 5 years are the age groups that are most secure financially, with 100.0% of males and 100.0% of females in these age groups living above the poverty line.
| Age Bracket | Male | Female |
| Under 5 Years | 1,465 (90.9%) | 1,009 (100.0%) |
| 5 Years | 273 (100.0%) | 100 (100.0%) |
| 6 to 11 Years | 1,122 (88.5%) | 1,113 (80.4%) |
| 12 to 14 Years | 559 (91.0%) | 740 (79.7%) |
| 15 Years | 328 (100.0%) | 169 (100.0%) |
| 16 and 17 Years | 247 (74.0%) | 429 (86.8%) |
| 18 to 24 Years | 1,451 (81.5%) | 1,739 (80.7%) |
| 25 to 34 Years | 2,731 (97.4%) | 2,925 (95.4%) |
| 35 to 44 Years | 1,845 (93.0%) | 1,994 (94.5%) |
| 45 to 54 Years | 3,228 (93.9%) | 3,157 (87.1%) |
| 55 to 64 Years | 2,537 (93.4%) | 2,456 (86.4%) |
| 65 to 74 Years | 1,856 (94.2%) | 2,115 (94.6%) |
| 75 Years and over | 965 (96.3%) | 1,347 (85.4%) |
| Total | 18,607 (92.5%) | 19,293 (88.9%) |
Income Below Poverty Among Married-Couple Families in Coram
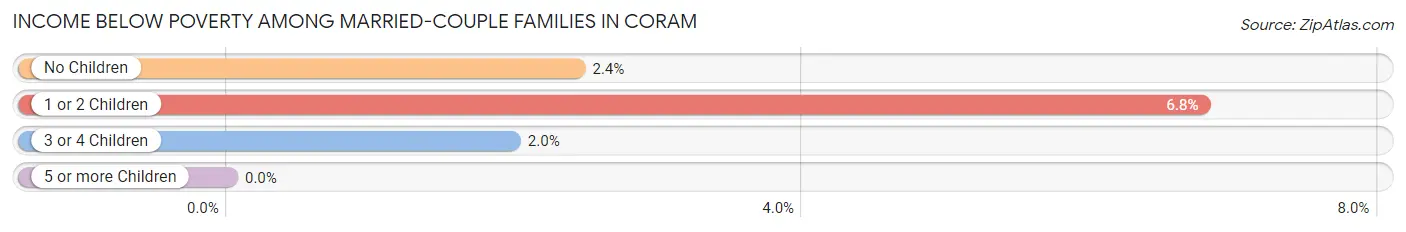
The poverty statistics for married-couple families in Coram show that 3.9% or 289 of the total 7,420 families live below the poverty line. Families with 1 or 2 children have the highest poverty rate of 6.8%, comprising of 177 families. On the other hand, families with 5 or more children have the lowest poverty rate of 0.0%, which includes 0 families.
| Children | Above Poverty | Below Poverty |
| No Children | 4,108 (97.6%) | 102 (2.4%) |
| 1 or 2 Children | 2,438 (93.2%) | 177 (6.8%) |
| 3 or 4 Children | 497 (98.0%) | 10 (2.0%) |
| 5 or more Children | 88 (100.0%) | 0 (0.0%) |
| Total | 7,131 (96.1%) | 289 (3.9%) |
Income Below Poverty Among Single-Parent Households in Coram
According to the poverty data in Coram, 4.4% or 27 single-father households and 14.1% or 271 single-mother households are living below the poverty line. Among single-father households, those with 1 or 2 children have the highest poverty rate, with 13 households (5.8%) experiencing poverty. Likewise, among single-mother households, those with 3 or 4 children have the highest poverty rate, with 79 households (64.7%) falling below the poverty line.
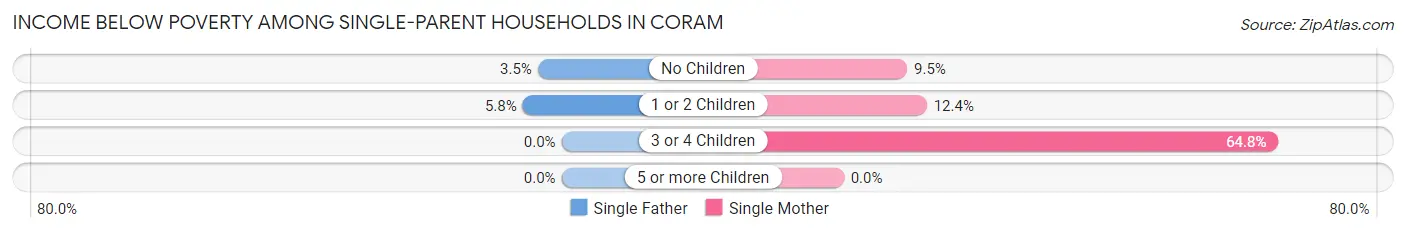
| Children | Single Father | Single Mother |
| No Children | 14 (3.5%) | 100 (9.5%) |
| 1 or 2 Children | 13 (5.8%) | 92 (12.4%) |
| 3 or 4 Children | 0 (0.0%) | 79 (64.7%) |
| 5 or more Children | 0 (0.0%) | 0 (0.0%) |
| Total | 27 (4.4%) | 271 (14.1%) |
Income Below Poverty Among Married-Couple vs Single-Parent Households in Coram
The poverty data for Coram shows that 289 of the married-couple family households (3.9%) and 298 of the single-parent households (11.7%) are living below the poverty level. Within the married-couple family households, those with 1 or 2 children have the highest poverty rate, with 177 households (6.8%) falling below the poverty line. Among the single-parent households, those with 3 or 4 children have the highest poverty rate, with 79 household (64.7%) living below poverty.
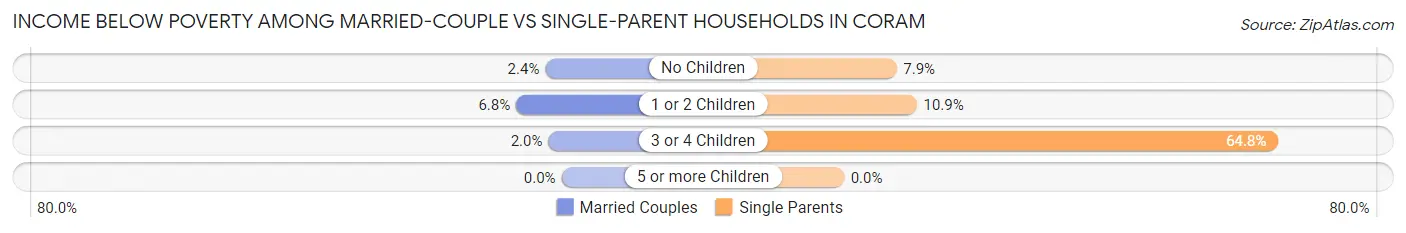
| Children | Married-Couple Families | Single-Parent Households |
| No Children | 102 (2.4%) | 114 (7.9%) |
| 1 or 2 Children | 177 (6.8%) | 105 (10.9%) |
| 3 or 4 Children | 10 (2.0%) | 79 (64.7%) |
| 5 or more Children | 0 (0.0%) | 0 (0.0%) |
| Total | 289 (3.9%) | 298 (11.7%) |
Race in Coram
The most populous races in Coram are White / Caucasian (28,432 | 67.4%), Hispanic or Latino (7,935 | 18.8%), and Black / African American (6,176 | 14.6%).
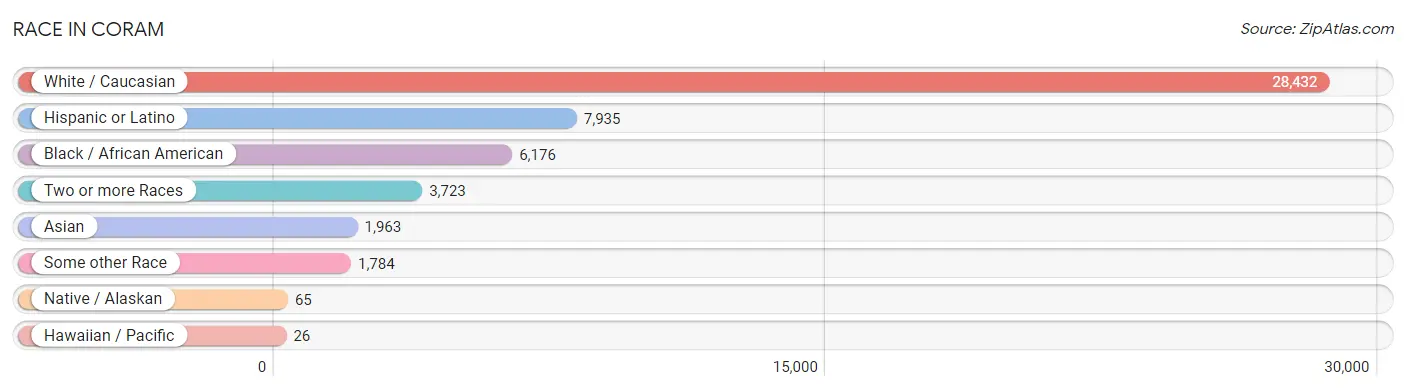
| Race | # Population | % Population |
| Asian | 1,963 | 4.7% |
| Black / African American | 6,176 | 14.6% |
| Hawaiian / Pacific | 26 | 0.1% |
| Hispanic or Latino | 7,935 | 18.8% |
| Native / Alaskan | 65 | 0.2% |
| White / Caucasian | 28,432 | 67.4% |
| Two or more Races | 3,723 | 8.8% |
| Some other Race | 1,784 | 4.2% |
| Total | 42,169 | 100.0% |
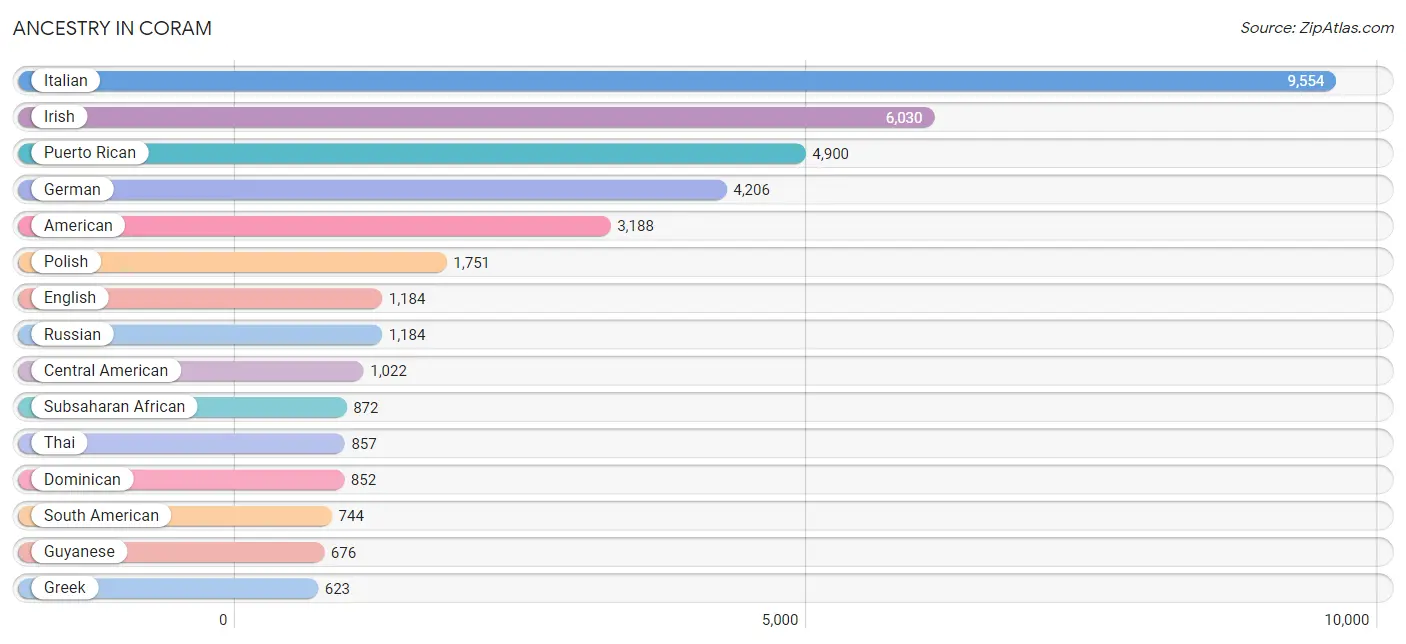
Ancestry in Coram
The most populous ancestries reported in Coram are Italian (9,554 | 22.7%), Irish (6,030 | 14.3%), Puerto Rican (4,900 | 11.6%), German (4,206 | 10.0%), and American (3,188 | 7.6%), together accounting for 66.1% of all Coram residents.
| Ancestry | # Population | % Population |
| Afghan | 353 | 0.8% |
| African | 261 | 0.6% |
| American | 3,188 | 7.6% |
| Arab | 522 | 1.2% |
| Argentinean | 76 | 0.2% |
| Austrian | 168 | 0.4% |
| Barbadian | 49 | 0.1% |
| Bhutanese | 190 | 0.4% |
| Blackfeet | 11 | 0.0% |
| Brazilian | 105 | 0.3% |
| British | 16 | 0.0% |
| Bulgarian | 14 | 0.0% |
| Burmese | 233 | 0.5% |
| Canadian | 103 | 0.2% |
| Central American | 1,022 | 2.4% |
| Cherokee | 61 | 0.1% |
| Colombian | 291 | 0.7% |
| Costa Rican | 21 | 0.1% |
| Croatian | 8 | 0.0% |
| Cuban | 59 | 0.1% |
| Czech | 51 | 0.1% |
| Czechoslovakian | 55 | 0.1% |
| Danish | 62 | 0.2% |
| Delaware | 24 | 0.1% |
| Dominican | 852 | 2.0% |
| Dutch | 138 | 0.3% |
| Eastern European | 353 | 0.8% |
| Ecuadorian | 272 | 0.6% |
| Egyptian | 432 | 1.0% |
| English | 1,184 | 2.8% |
| European | 248 | 0.6% |
| Finnish | 58 | 0.1% |
| French | 404 | 1.0% |
| French Canadian | 32 | 0.1% |
| German | 4,206 | 10.0% |
| Greek | 623 | 1.5% |
| Guatemalan | 115 | 0.3% |
| Guyanese | 676 | 1.6% |
| Haitian | 105 | 0.3% |
| Honduran | 265 | 0.6% |
| Hungarian | 90 | 0.2% |
| Indian (Asian) | 382 | 0.9% |
| Iranian | 74 | 0.2% |
| Irish | 6,030 | 14.3% |
| Israeli | 10 | 0.0% |
| Italian | 9,554 | 22.7% |
| Jamaican | 400 | 0.9% |
| Jordanian | 20 | 0.1% |
| Korean | 350 | 0.8% |
| Laotian | 36 | 0.1% |
| Lithuanian | 32 | 0.1% |
| Lumbee | 20 | 0.1% |
| Maltese | 10 | 0.0% |
| Mexican | 268 | 0.6% |
| Nicaraguan | 72 | 0.2% |
| Nigerian | 139 | 0.3% |
| Norwegian | 489 | 1.2% |
| Panamanian | 18 | 0.0% |
| Peruvian | 95 | 0.2% |
| Polish | 1,751 | 4.2% |
| Portuguese | 170 | 0.4% |
| Puerto Rican | 4,900 | 11.6% |
| Romanian | 37 | 0.1% |
| Russian | 1,184 | 2.8% |
| Salvadoran | 531 | 1.3% |
| Scandinavian | 62 | 0.2% |
| Scotch-Irish | 20 | 0.1% |
| Scottish | 129 | 0.3% |
| Slovak | 15 | 0.0% |
| South American | 744 | 1.8% |
| Spanish | 5 | 0.0% |
| Sri Lankan | 64 | 0.2% |
| Subsaharan African | 872 | 2.1% |
| Sudanese | 18 | 0.0% |
| Swedish | 224 | 0.5% |
| Swiss | 23 | 0.1% |
| Syrian | 9 | 0.0% |
| Thai | 857 | 2.0% |
| Trinidadian and Tobagonian | 110 | 0.3% |
| Turkish | 123 | 0.3% |
| Ukrainian | 104 | 0.3% |
| Uruguayan | 10 | 0.0% |
| Vietnamese | 12 | 0.0% |
| Welsh | 38 | 0.1% |
| West Indian | 45 | 0.1% |
| Yugoslavian | 14 | 0.0% | View All 86 Rows |
Immigrants in Coram
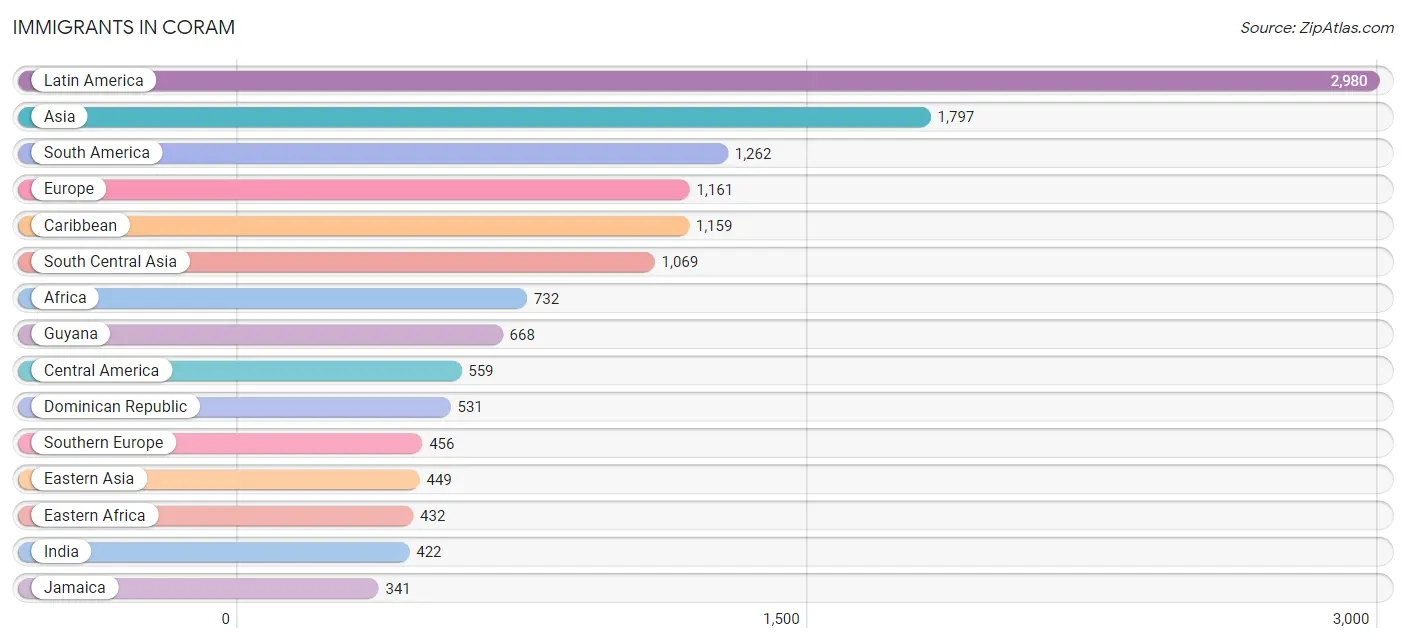
The most numerous immigrant groups reported in Coram came from Latin America (2,980 | 7.1%), Asia (1,797 | 4.3%), South America (1,262 | 3.0%), Europe (1,161 | 2.8%), and Caribbean (1,159 | 2.8%), together accounting for 19.8% of all Coram residents.
| Immigration Origin | # Population | % Population |
| Afghanistan | 178 | 0.4% |
| Africa | 732 | 1.7% |
| Argentina | 76 | 0.2% |
| Asia | 1,797 | 4.3% |
| Bangladesh | 36 | 0.1% |
| Barbados | 22 | 0.1% |
| Belize | 31 | 0.1% |
| Brazil | 90 | 0.2% |
| Bulgaria | 14 | 0.0% |
| Canada | 128 | 0.3% |
| Caribbean | 1,159 | 2.8% |
| Central America | 559 | 1.3% |
| China | 206 | 0.5% |
| Colombia | 292 | 0.7% |
| Costa Rica | 21 | 0.1% |
| Croatia | 20 | 0.1% |
| Dominican Republic | 531 | 1.3% |
| Eastern Africa | 432 | 1.0% |
| Eastern Asia | 449 | 1.1% |
| Eastern Europe | 306 | 0.7% |
| Ecuador | 58 | 0.1% |
| Egypt | 161 | 0.4% |
| El Salvador | 249 | 0.6% |
| England | 58 | 0.1% |
| Europe | 1,161 | 2.8% |
| France | 190 | 0.4% |
| Germany | 51 | 0.1% |
| Greece | 163 | 0.4% |
| Guatemala | 98 | 0.2% |
| Guyana | 668 | 1.6% |
| Haiti | 48 | 0.1% |
| Honduras | 128 | 0.3% |
| Hong Kong | 6 | 0.0% |
| India | 422 | 1.0% |
| Iran | 76 | 0.2% |
| Ireland | 84 | 0.2% |
| Israel | 10 | 0.0% |
| Italy | 180 | 0.4% |
| Jamaica | 341 | 0.8% |
| Korea | 243 | 0.6% |
| Kuwait | 17 | 0.0% |
| Latin America | 2,980 | 7.1% |
| Malaysia | 57 | 0.1% |
| Mexico | 9 | 0.0% |
| Nepal | 65 | 0.2% |
| Netherlands | 16 | 0.0% |
| Nicaragua | 23 | 0.1% |
| Nigeria | 109 | 0.3% |
| Northern Africa | 191 | 0.4% |
| Northern Europe | 142 | 0.3% |
| Pakistan | 287 | 0.7% |
| Peru | 78 | 0.2% |
| Philippines | 52 | 0.1% |
| Poland | 159 | 0.4% |
| Portugal | 113 | 0.3% |
| Romania | 25 | 0.1% |
| Russia | 88 | 0.2% |
| Saudi Arabia | 20 | 0.1% |
| South America | 1,262 | 3.0% |
| South Central Asia | 1,069 | 2.5% |
| South Eastern Asia | 170 | 0.4% |
| Southern Europe | 456 | 1.1% |
| St. Vincent and the Grenadines | 13 | 0.0% |
| Thailand | 11 | 0.0% |
| Trinidad and Tobago | 141 | 0.3% |
| Turkey | 62 | 0.2% |
| Uzbekistan | 5 | 0.0% |
| Vietnam | 50 | 0.1% |
| West Indies | 48 | 0.1% |
| Western Africa | 109 | 0.3% |
| Western Asia | 109 | 0.3% |
| Western Europe | 257 | 0.6% | View All 72 Rows |
Sex and Age in Coram
Sex and Age in Coram
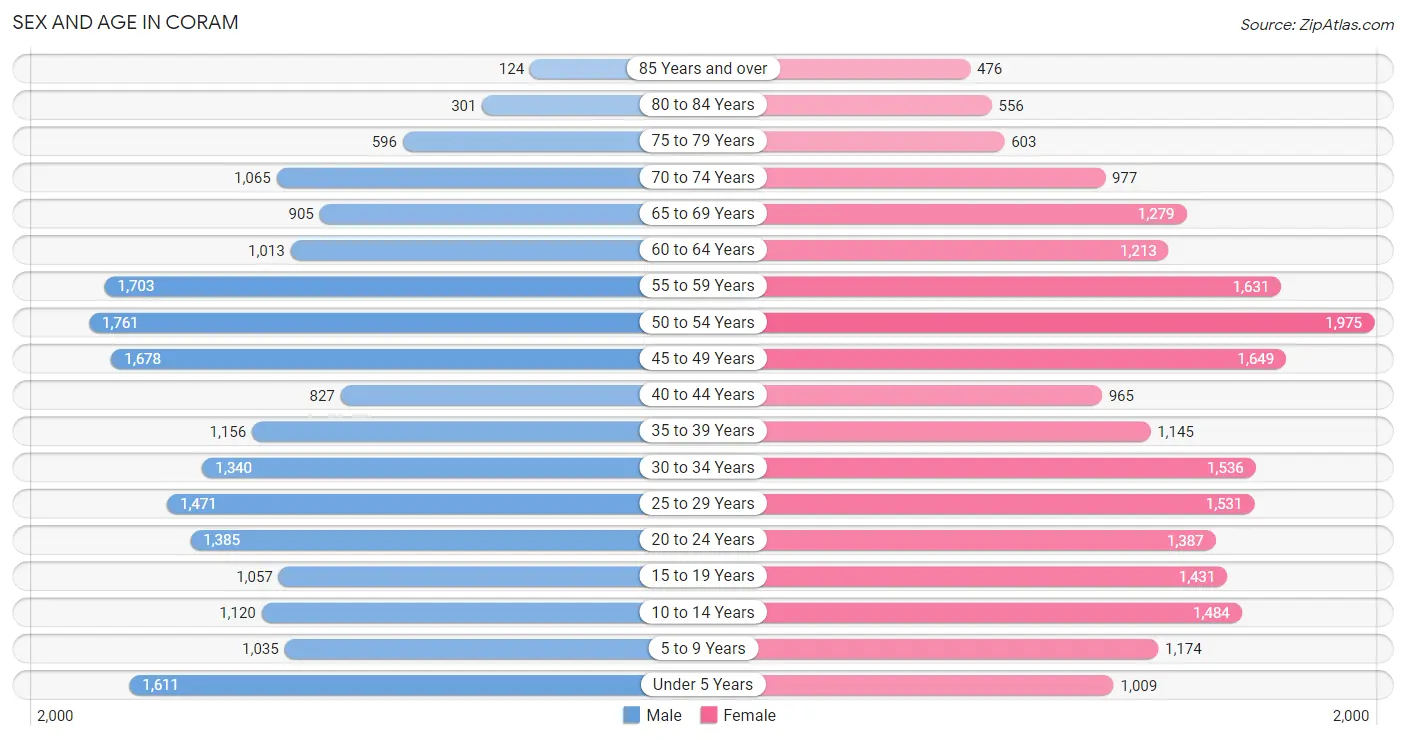
The most populous age groups in Coram are 50 to 54 Years (1,761 | 8.7%) for men and 50 to 54 Years (1,975 | 9.0%) for women.
| Age Bracket | Male | Female |
| Under 5 Years | 1,611 (8.0%) | 1,009 (4.6%) |
| 5 to 9 Years | 1,035 (5.1%) | 1,174 (5.3%) |
| 10 to 14 Years | 1,120 (5.6%) | 1,484 (6.7%) |
| 15 to 19 Years | 1,057 (5.2%) | 1,431 (6.5%) |
| 20 to 24 Years | 1,385 (6.9%) | 1,387 (6.3%) |
| 25 to 29 Years | 1,471 (7.3%) | 1,531 (7.0%) |
| 30 to 34 Years | 1,340 (6.7%) | 1,536 (7.0%) |
| 35 to 39 Years | 1,156 (5.7%) | 1,145 (5.2%) |
| 40 to 44 Years | 827 (4.1%) | 965 (4.4%) |
| 45 to 49 Years | 1,678 (8.3%) | 1,649 (7.5%) |
| 50 to 54 Years | 1,761 (8.7%) | 1,975 (9.0%) |
| 55 to 59 Years | 1,703 (8.5%) | 1,631 (7.4%) |
| 60 to 64 Years | 1,013 (5.0%) | 1,213 (5.5%) |
| 65 to 69 Years | 905 (4.5%) | 1,279 (5.8%) |
| 70 to 74 Years | 1,065 (5.3%) | 977 (4.4%) |
| 75 to 79 Years | 596 (3.0%) | 603 (2.7%) |
| 80 to 84 Years | 301 (1.5%) | 556 (2.5%) |
| 85 Years and over | 124 (0.6%) | 476 (2.2%) |
| Total | 20,148 (100.0%) | 22,021 (100.0%) |
Families and Households in Coram
Median Family Size in Coram
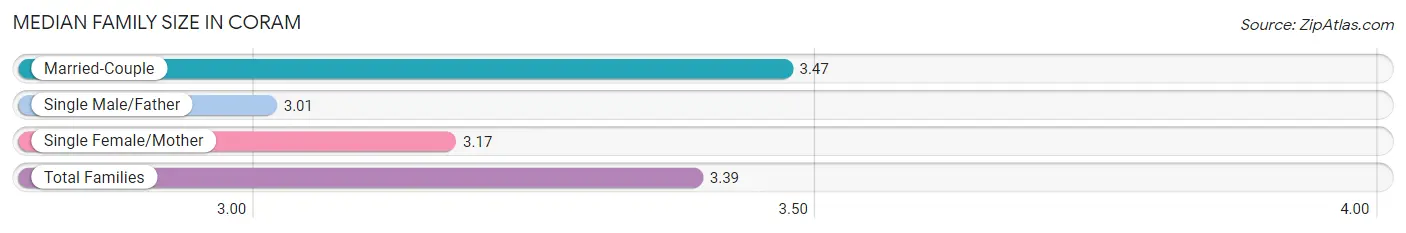
The median family size in Coram is 3.39 persons per family, with married-couple families (7,420 | 74.5%) accounting for the largest median family size of 3.47 persons per family. On the other hand, single male/father families (619 | 6.2%) represent the smallest median family size with 3.01 persons per family.
| Family Type | # Families | Family Size |
| Married-Couple | 7,420 (74.5%) | 3.47 |
| Single Male/Father | 619 (6.2%) | 3.01 |
| Single Female/Mother | 1,923 (19.3%) | 3.17 |
| Total Families | 9,962 (100.0%) | 3.39 |
Median Household Size in Coram
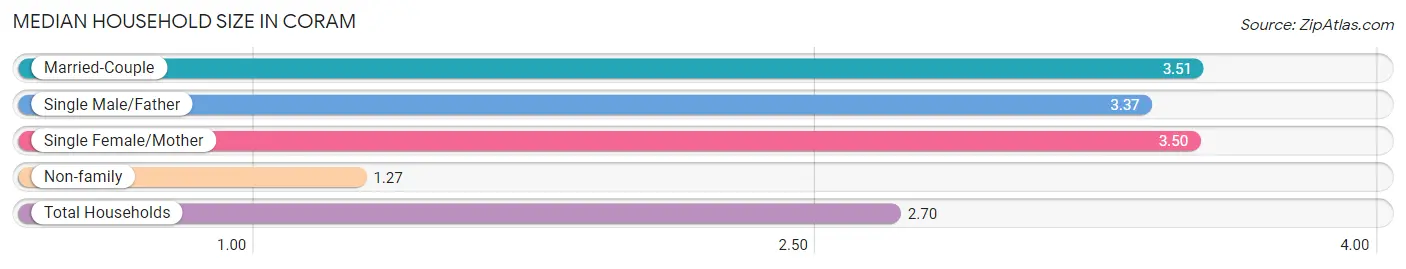
The median household size in Coram is 2.70 persons per household, with married-couple households (7,420 | 47.9%) accounting for the largest median household size of 3.51 persons per household. non-family households (5,534 | 35.7%) represent the smallest median household size with 1.27 persons per household.
| Household Type | # Households | Household Size |
| Married-Couple | 7,420 (47.9%) | 3.51 |
| Single Male/Father | 619 (4.0%) | 3.37 |
| Single Female/Mother | 1,923 (12.4%) | 3.50 |
| Non-family | 5,534 (35.7%) | 1.27 |
| Total Households | 15,496 (100.0%) | 2.70 |
Household Size by Marriage Status in Coram
Out of a total of 15,496 households in Coram, 9,962 (64.3%) are family households, while 5,534 (35.7%) are nonfamily households. The most numerous type of family households are 2-person households, comprising 3,726, and the most common type of nonfamily households are 1-person households, comprising 4,421.
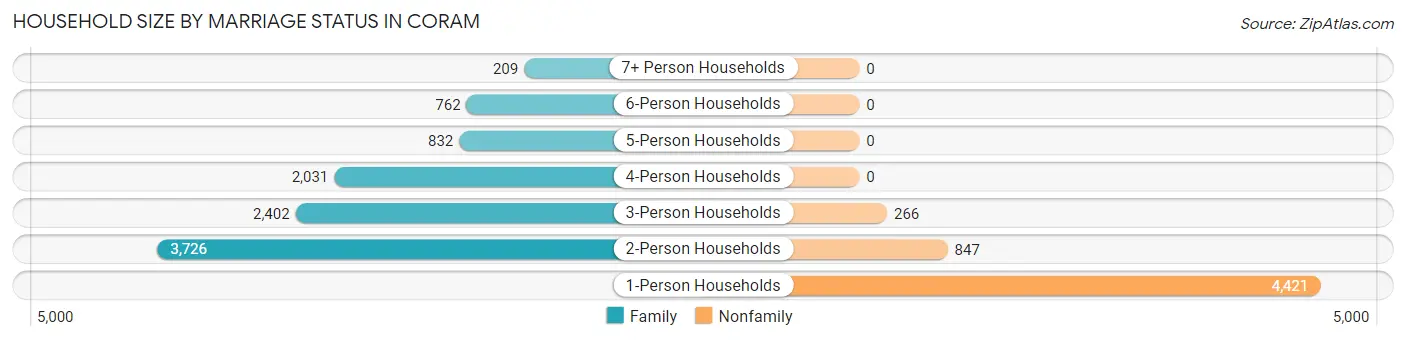
| Household Size | Family Households | Nonfamily Households |
| 1-Person Households | - | 4,421 (28.5%) |
| 2-Person Households | 3,726 (24.0%) | 847 (5.5%) |
| 3-Person Households | 2,402 (15.5%) | 266 (1.7%) |
| 4-Person Households | 2,031 (13.1%) | 0 (0.0%) |
| 5-Person Households | 832 (5.4%) | 0 (0.0%) |
| 6-Person Households | 762 (4.9%) | 0 (0.0%) |
| 7+ Person Households | 209 (1.3%) | 0 (0.0%) |
| Total | 9,962 (64.3%) | 5,534 (35.7%) |
Female Fertility in Coram
Fertility by Age in Coram
Average fertility rate in Coram is 52.0 births per 1,000 women. Women in the age bracket of 35 to 50 years have the highest fertility rate with 64.0 births per 1,000 women. Women in the age bracket of 35 to 50 years acount for 50.9% of all women with births.
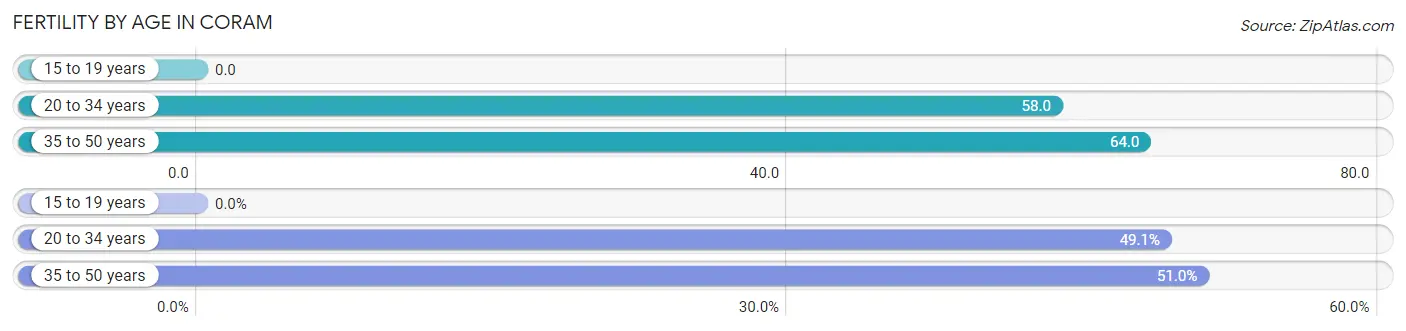
| Age Bracket | Women with Births | Births / 1,000 Women |
| 15 to 19 years | 0 (0.0%) | 0.0 |
| 20 to 34 years | 257 (49.0%) | 58.0 |
| 35 to 50 years | 267 (50.9%) | 64.0 |
| Total | 524 (100.0%) | 52.0 |
Fertility by Age by Marriage Status in Coram
79.2% of women with births (524) in Coram are married. The highest percentage of unmarried women with births falls into 35 to 50 years age bracket with 32.2% of them unmarried at the time of birth, while the lowest percentage of unmarried women with births belong to 20 to 34 years age bracket with 9.0% of them unmarried.
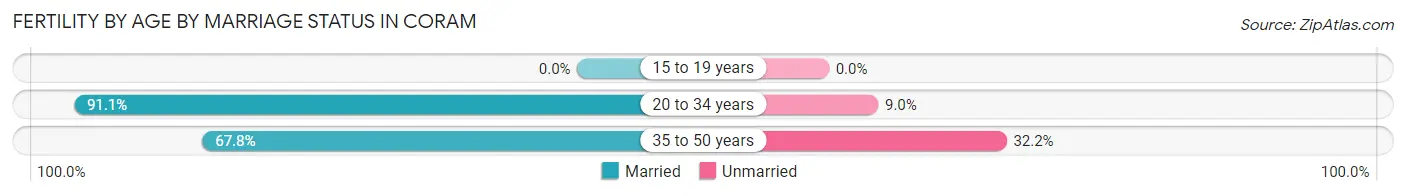
| Age Bracket | Married | Unmarried |
| 15 to 19 years | 0 (0.0%) | 0 (0.0%) |
| 20 to 34 years | 234 (91.0%) | 23 (8.9%) |
| 35 to 50 years | 181 (67.8%) | 86 (32.2%) |
| Total | 415 (79.2%) | 109 (20.8%) |
Fertility by Education in Coram
Average fertility rate in Coram is 52.0 births per 1,000 women. Women with the education attainment of bachelor's degree have the highest fertility rate of 83.0 births per 1,000 women, while women with the education attainment of high school diploma have the lowest fertility at 5.0 births per 1,000 women. Women with the education attainment of college or associate's degree represent 43.9% of all women with births.
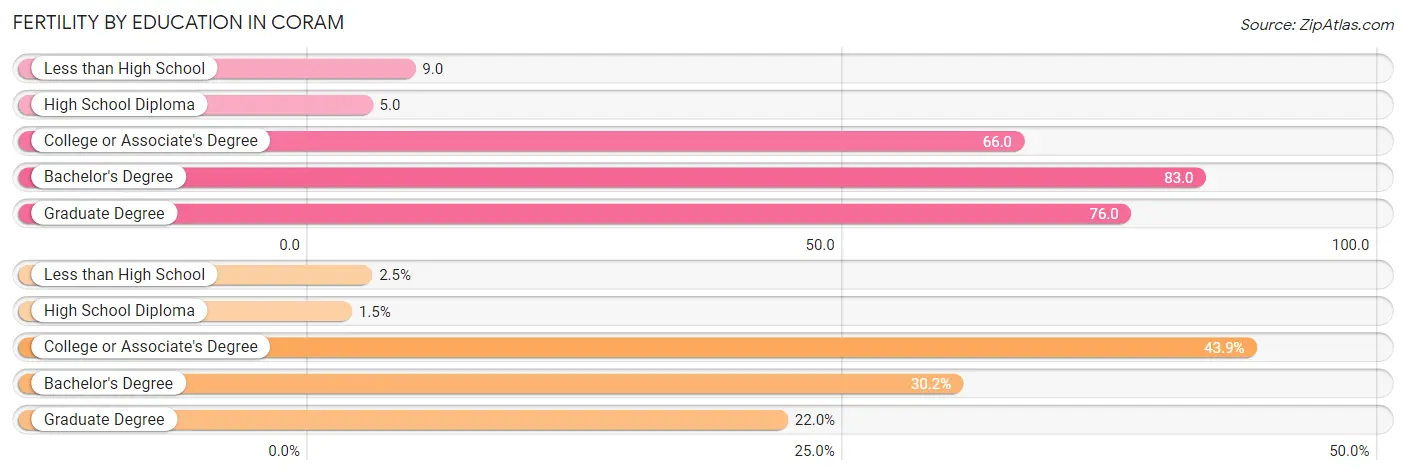
| Educational Attainment | Women with Births | Births / 1,000 Women |
| Less than High School | 13 (2.5%) | 9.0 |
| High School Diploma | 8 (1.5%) | 5.0 |
| College or Associate's Degree | 230 (43.9%) | 66.0 |
| Bachelor's Degree | 158 (30.1%) | 83.0 |
| Graduate Degree | 115 (22.0%) | 76.0 |
| Total | 524 (100.0%) | 52.0 |
Fertility by Education by Marriage Status in Coram
20.8% of women with births in Coram are unmarried. Women with the educational attainment of less than high school are most likely to be married with 100.0% of them married at childbirth, while women with the educational attainment of high school diploma are least likely to be married with 100.0% of them unmarried at childbirth.
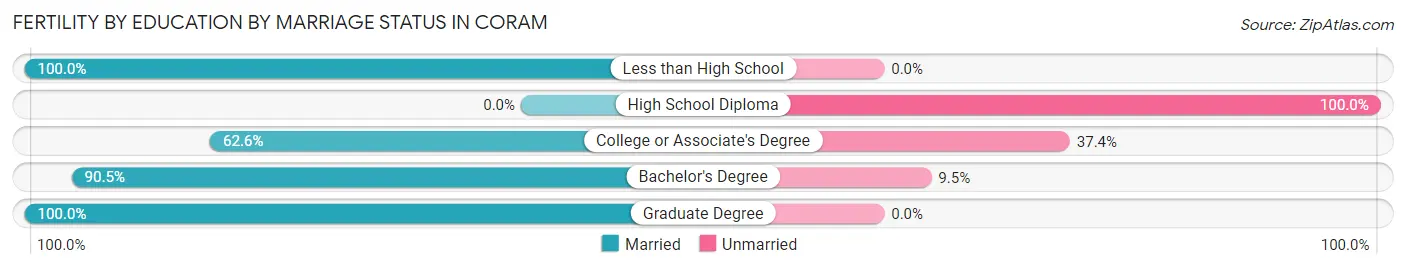
| Educational Attainment | Married | Unmarried |
| Less than High School | 13 (100.0%) | 0 (0.0%) |
| High School Diploma | 0 (0.0%) | 8 (100.0%) |
| College or Associate's Degree | 144 (62.6%) | 86 (37.4%) |
| Bachelor's Degree | 143 (90.5%) | 15 (9.5%) |
| Graduate Degree | 115 (100.0%) | 0 (0.0%) |
| Total | 415 (79.2%) | 109 (20.8%) |
Employment Characteristics in Coram
Employment by Class of Employer in Coram
Among the 21,552 employed individuals in Coram, private company employees (12,947 | 60.1%), local government employees (2,095 | 9.7%), and not-for-profit organizations (2,067 | 9.6%) make up the most common classes of employment.
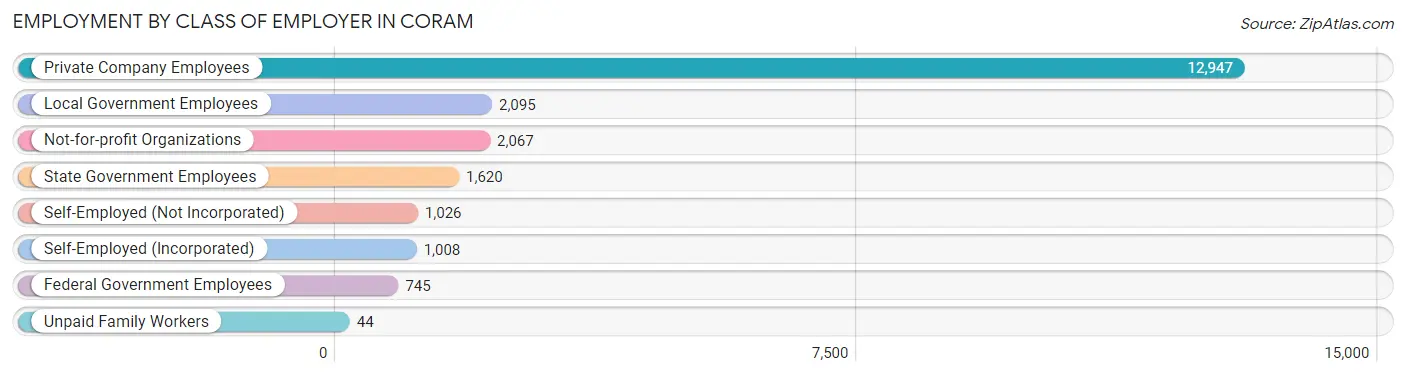
| Employer Class | # Employees | % Employees |
| Private Company Employees | 12,947 | 60.1% |
| Self-Employed (Incorporated) | 1,008 | 4.7% |
| Self-Employed (Not Incorporated) | 1,026 | 4.8% |
| Not-for-profit Organizations | 2,067 | 9.6% |
| Local Government Employees | 2,095 | 9.7% |
| State Government Employees | 1,620 | 7.5% |
| Federal Government Employees | 745 | 3.5% |
| Unpaid Family Workers | 44 | 0.2% |
| Total | 21,552 | 100.0% |
Employment Status by Age in Coram
According to the labor force statistics for Coram, out of the total population over 16 years of age (34,239), 66.8% or 22,872 individuals are in the labor force, with 3.7% or 846 of them unemployed. The age group with the highest labor force participation rate is 25 to 29 years, with 92.2% or 2,768 individuals in the labor force. Within the labor force, the 16 to 19 years age range has the highest percentage of unemployed individuals, with 11.0% or 78 of them being unemployed.
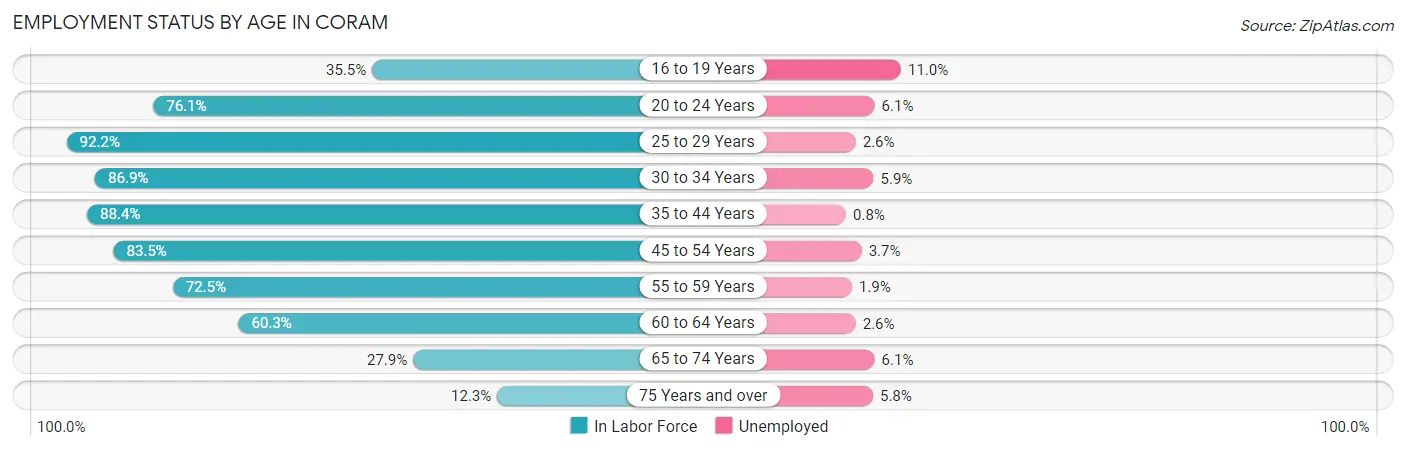
| Age Bracket | In Labor Force | Unemployed |
| 16 to 19 Years | 707 (35.5%) | 78 (11.0%) |
| 20 to 24 Years | 2,109 (76.1%) | 129 (6.1%) |
| 25 to 29 Years | 2,768 (92.2%) | 72 (2.6%) |
| 30 to 34 Years | 2,499 (86.9%) | 147 (5.9%) |
| 35 to 44 Years | 3,618 (88.4%) | 29 (0.8%) |
| 45 to 54 Years | 5,898 (83.5%) | 218 (3.7%) |
| 55 to 59 Years | 2,417 (72.5%) | 46 (1.9%) |
| 60 to 64 Years | 1,342 (60.3%) | 35 (2.6%) |
| 65 to 74 Years | 1,179 (27.9%) | 72 (6.1%) |
| 75 Years and over | 327 (12.3%) | 19 (5.8%) |
| Total | 22,872 (66.8%) | 846 (3.7%) |
Employment Status by Educational Attainment in Coram
According to labor force statistics for Coram, 82.1% of individuals (18,550) out of the total population between 25 and 64 years of age (22,594) are in the labor force, with 3.0% or 556 of them being unemployed. The group with the highest labor force participation rate are those with the educational attainment of bachelor's degree or higher, with 90.1% or 7,183 individuals in the labor force. Within the labor force, individuals with high school diploma education have the highest percentage of unemployment, with 4.3% or 188 of them being unemployed.
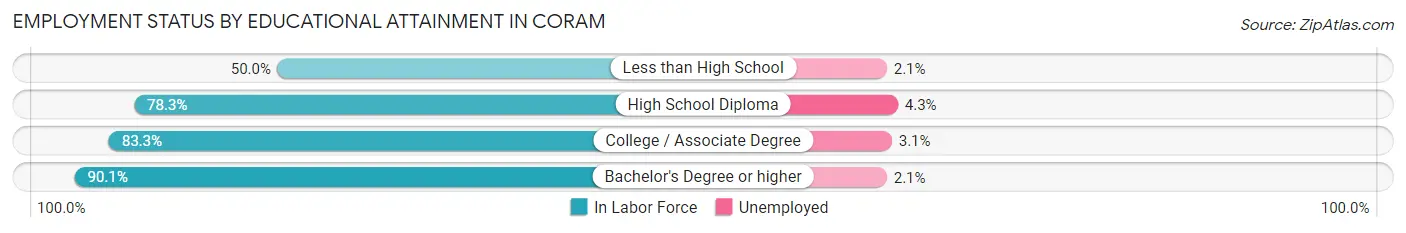
| Educational Attainment | In Labor Force | Unemployed |
| Less than High School | 821 (50.0%) | 34 (2.1%) |
| High School Diploma | 4,361 (78.3%) | 240 (4.3%) |
| College / Associate Degree | 6,173 (83.3%) | 230 (3.1%) |
| Bachelor's Degree or higher | 7,183 (90.1%) | 167 (2.1%) |
| Total | 18,550 (82.1%) | 678 (3.0%) |
Employment Occupations by Sex in Coram
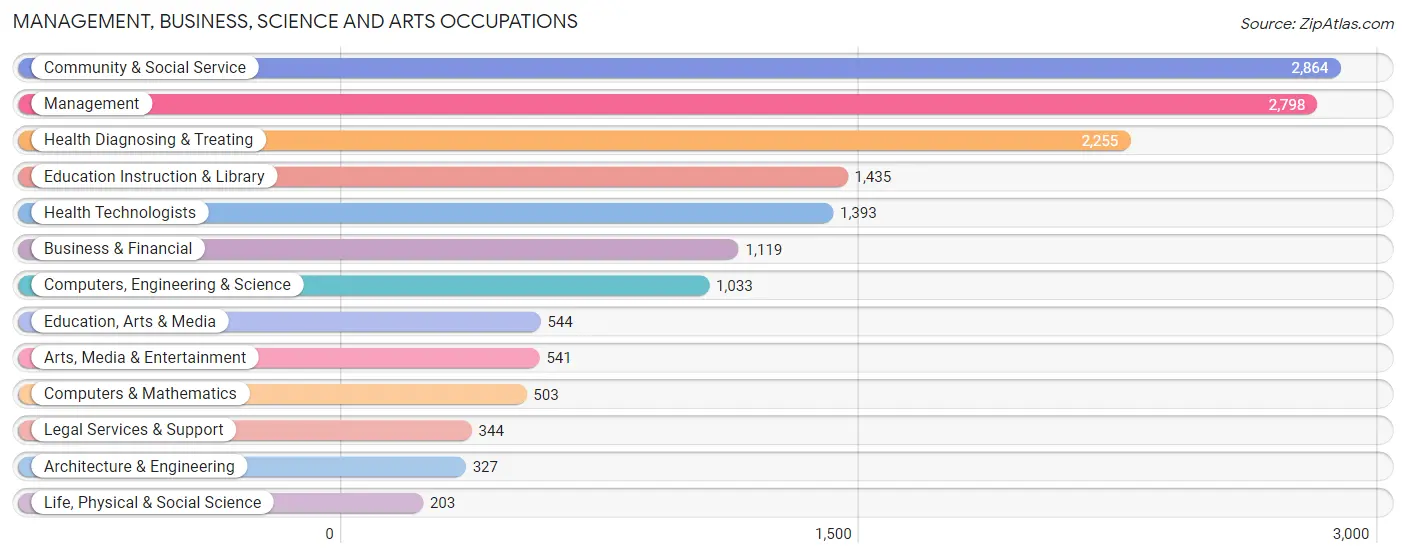
Management, Business, Science and Arts Occupations
The most common Management, Business, Science and Arts occupations in Coram are Community & Social Service (2,864 | 13.0%), Management (2,798 | 12.7%), Health Diagnosing & Treating (2,255 | 10.3%), Education Instruction & Library (1,435 | 6.5%), and Health Technologists (1,393 | 6.3%).
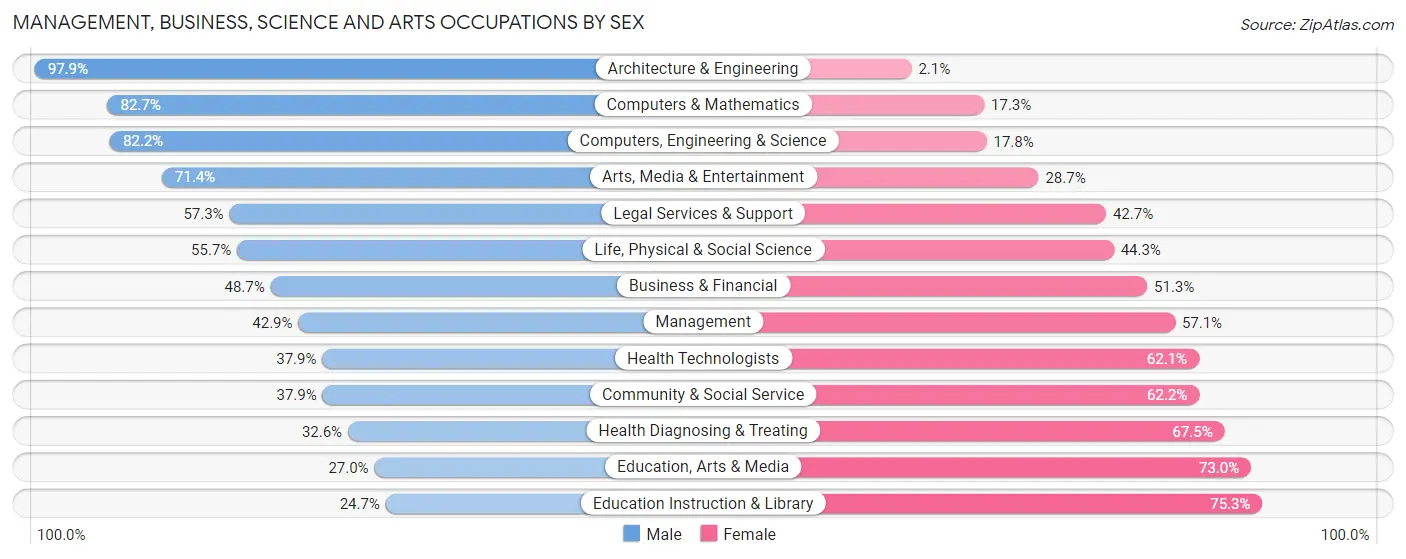
Management, Business, Science and Arts Occupations by Sex
Within the Management, Business, Science and Arts occupations in Coram, the most male-oriented occupations are Architecture & Engineering (97.9%), Computers & Mathematics (82.7%), and Computers, Engineering & Science (82.2%), while the most female-oriented occupations are Education Instruction & Library (75.3%), Education, Arts & Media (73.0%), and Health Diagnosing & Treating (67.4%).
| Occupation | Male | Female |
| Management | 1,200 (42.9%) | 1,598 (57.1%) |
| Business & Financial | 545 (48.7%) | 574 (51.3%) |
| Computers, Engineering & Science | 849 (82.2%) | 184 (17.8%) |
| Computers & Mathematics | 416 (82.7%) | 87 (17.3%) |
| Architecture & Engineering | 320 (97.9%) | 7 (2.1%) |
| Life, Physical & Social Science | 113 (55.7%) | 90 (44.3%) |
| Community & Social Service | 1,084 (37.9%) | 1,780 (62.2%) |
| Education, Arts & Media | 147 (27.0%) | 397 (73.0%) |
| Legal Services & Support | 197 (57.3%) | 147 (42.7%) |
| Education Instruction & Library | 354 (24.7%) | 1,081 (75.3%) |
| Arts, Media & Entertainment | 386 (71.4%) | 155 (28.6%) |
| Health Diagnosing & Treating | 734 (32.6%) | 1,521 (67.4%) |
| Health Technologists | 528 (37.9%) | 865 (62.1%) |
| Total (Category) | 4,412 (43.8%) | 5,657 (56.2%) |
| Total (Overall) | 10,895 (49.5%) | 11,091 (50.4%) |
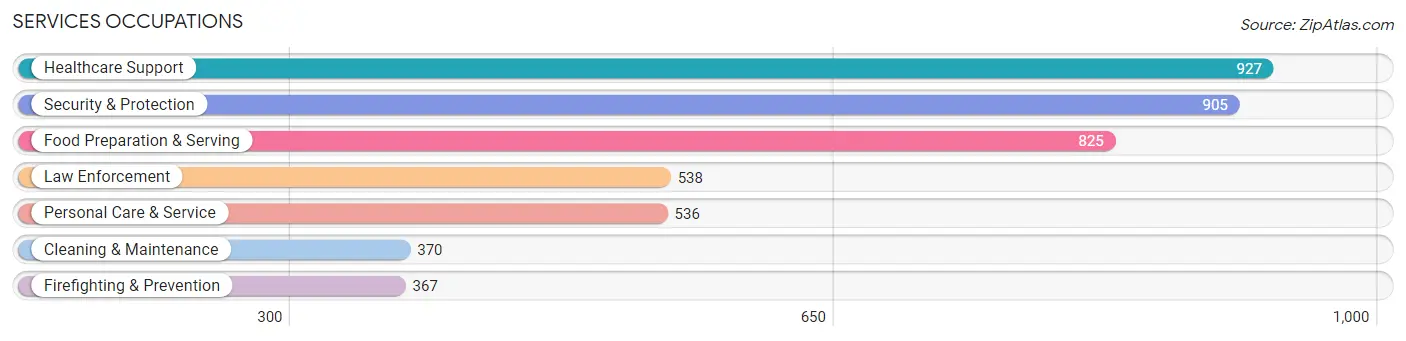
Services Occupations
The most common Services occupations in Coram are Healthcare Support (927 | 4.2%), Security & Protection (905 | 4.1%), Food Preparation & Serving (825 | 3.7%), Law Enforcement (538 | 2.5%), and Personal Care & Service (536 | 2.4%).
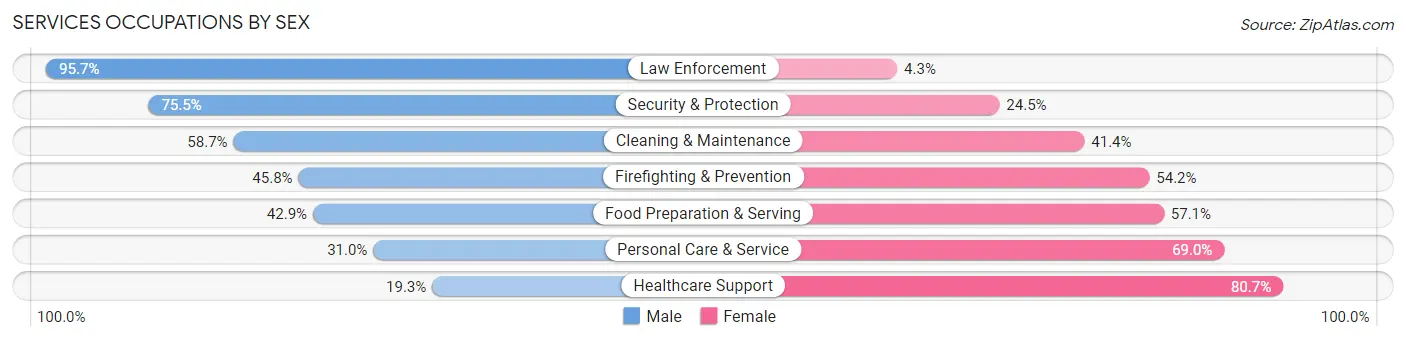
Services Occupations by Sex
Within the Services occupations in Coram, the most male-oriented occupations are Law Enforcement (95.7%), Security & Protection (75.5%), and Cleaning & Maintenance (58.7%), while the most female-oriented occupations are Healthcare Support (80.7%), Personal Care & Service (69.0%), and Food Preparation & Serving (57.1%).
| Occupation | Male | Female |
| Healthcare Support | 179 (19.3%) | 748 (80.7%) |
| Security & Protection | 683 (75.5%) | 222 (24.5%) |
| Firefighting & Prevention | 168 (45.8%) | 199 (54.2%) |
| Law Enforcement | 515 (95.7%) | 23 (4.3%) |
| Food Preparation & Serving | 354 (42.9%) | 471 (57.1%) |
| Cleaning & Maintenance | 217 (58.7%) | 153 (41.3%) |
| Personal Care & Service | 166 (31.0%) | 370 (69.0%) |
| Total (Category) | 1,599 (44.9%) | 1,964 (55.1%) |
| Total (Overall) | 10,895 (49.5%) | 11,091 (50.4%) |
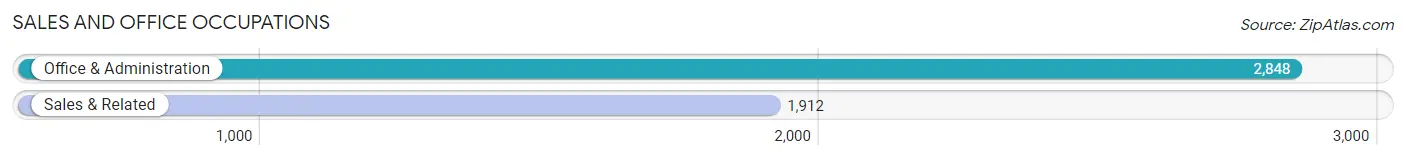
Sales and Office Occupations
The most common Sales and Office occupations in Coram are Office & Administration (2,848 | 13.0%), and Sales & Related (1,912 | 8.7%).
Sales and Office Occupations by Sex
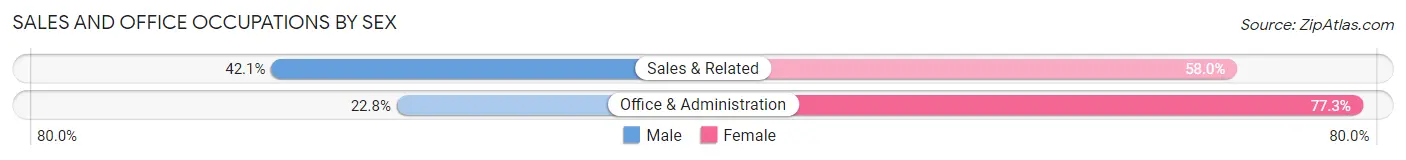
| Occupation | Male | Female |
| Sales & Related | 804 (42.0%) | 1,108 (58.0%) |
| Office & Administration | 648 (22.8%) | 2,200 (77.2%) |
| Total (Category) | 1,452 (30.5%) | 3,308 (69.5%) |
| Total (Overall) | 10,895 (49.5%) | 11,091 (50.4%) |
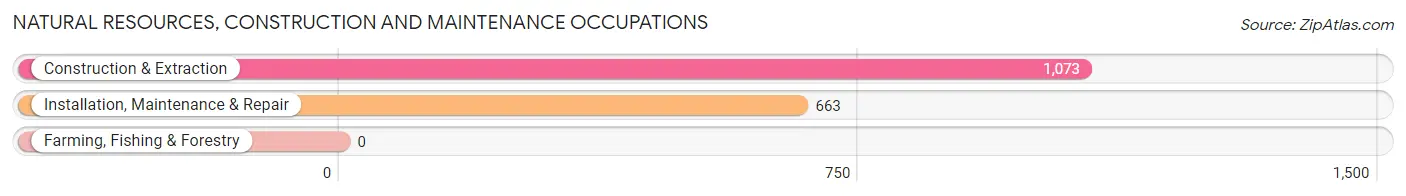
Natural Resources, Construction and Maintenance Occupations
The most common Natural Resources, Construction and Maintenance occupations in Coram are Construction & Extraction (1,073 | 4.9%), and Installation, Maintenance & Repair (663 | 3.0%).
Natural Resources, Construction and Maintenance Occupations by Sex
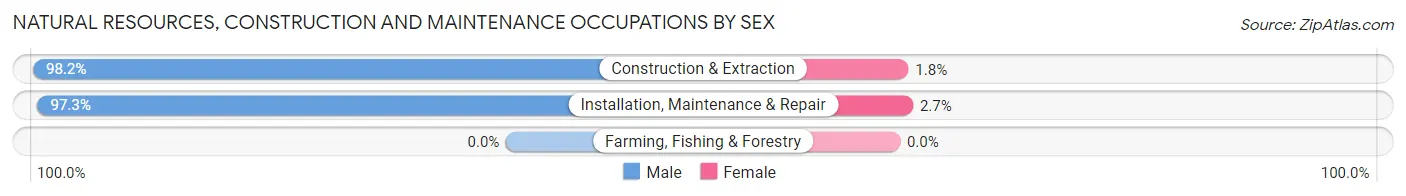
| Occupation | Male | Female |
| Farming, Fishing & Forestry | 0 (0.0%) | 0 (0.0%) |
| Construction & Extraction | 1,054 (98.2%) | 19 (1.8%) |
| Installation, Maintenance & Repair | 645 (97.3%) | 18 (2.7%) |
| Total (Category) | 1,699 (97.9%) | 37 (2.1%) |
| Total (Overall) | 10,895 (49.5%) | 11,091 (50.4%) |
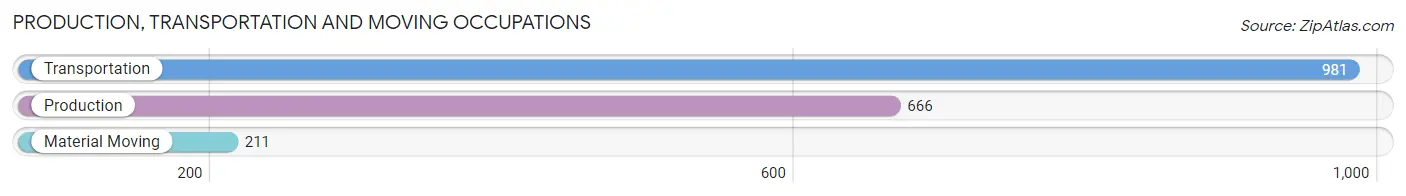
Production, Transportation and Moving Occupations
The most common Production, Transportation and Moving occupations in Coram are Transportation (981 | 4.5%), Production (666 | 3.0%), and Material Moving (211 | 1.0%).
Production, Transportation and Moving Occupations by Sex
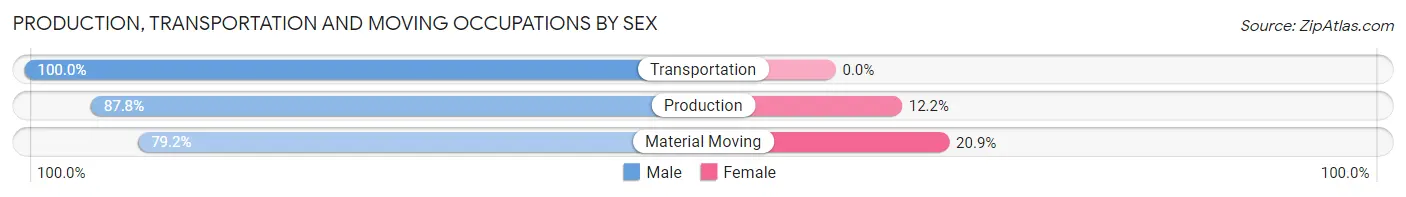
| Occupation | Male | Female |
| Production | 585 (87.8%) | 81 (12.2%) |
| Transportation | 981 (100.0%) | 0 (0.0%) |
| Material Moving | 167 (79.1%) | 44 (20.8%) |
| Total (Category) | 1,733 (93.3%) | 125 (6.7%) |
| Total (Overall) | 10,895 (49.5%) | 11,091 (50.4%) |
Employment Industries by Sex in Coram
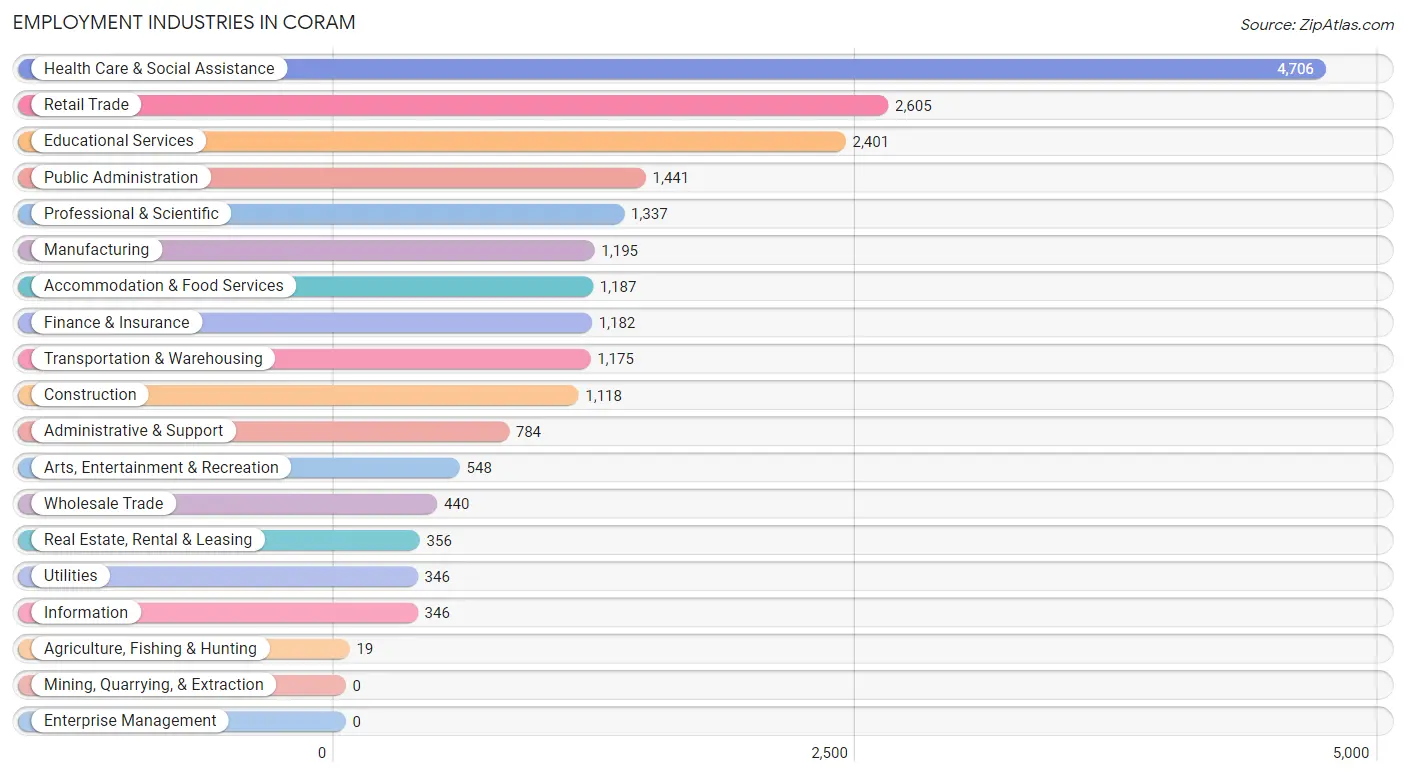
Employment Industries in Coram
The major employment industries in Coram include Health Care & Social Assistance (4,706 | 21.4%), Retail Trade (2,605 | 11.8%), Educational Services (2,401 | 10.9%), Public Administration (1,441 | 6.6%), and Professional & Scientific (1,337 | 6.1%).
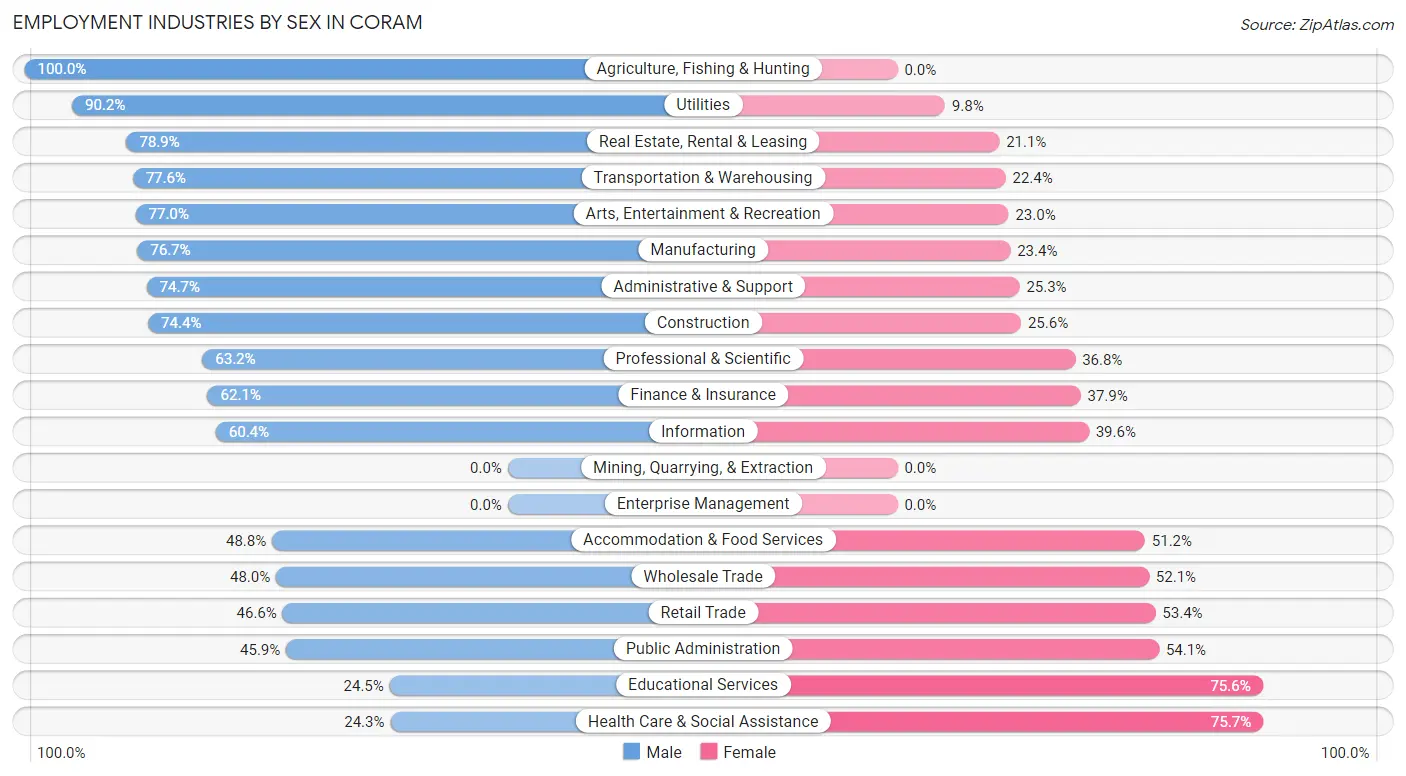
Employment Industries by Sex in Coram
The Coram industries that see more men than women are Agriculture, Fishing & Hunting (100.0%), Utilities (90.2%), and Real Estate, Rental & Leasing (78.9%), whereas the industries that tend to have a higher number of women are Health Care & Social Assistance (75.7%), Educational Services (75.5%), and Public Administration (54.1%).
| Industry | Male | Female |
| Agriculture, Fishing & Hunting | 19 (100.0%) | 0 (0.0%) |
| Mining, Quarrying, & Extraction | 0 (0.0%) | 0 (0.0%) |
| Construction | 832 (74.4%) | 286 (25.6%) |
| Manufacturing | 916 (76.6%) | 279 (23.4%) |
| Wholesale Trade | 211 (47.9%) | 229 (52.0%) |
| Retail Trade | 1,214 (46.6%) | 1,391 (53.4%) |
| Transportation & Warehousing | 912 (77.6%) | 263 (22.4%) |
| Utilities | 312 (90.2%) | 34 (9.8%) |
| Information | 209 (60.4%) | 137 (39.6%) |
| Finance & Insurance | 734 (62.1%) | 448 (37.9%) |
| Real Estate, Rental & Leasing | 281 (78.9%) | 75 (21.1%) |
| Professional & Scientific | 845 (63.2%) | 492 (36.8%) |
| Enterprise Management | 0 (0.0%) | 0 (0.0%) |
| Administrative & Support | 586 (74.7%) | 198 (25.3%) |
| Educational Services | 587 (24.4%) | 1,814 (75.5%) |
| Health Care & Social Assistance | 1,144 (24.3%) | 3,562 (75.7%) |
| Arts, Entertainment & Recreation | 422 (77.0%) | 126 (23.0%) |
| Accommodation & Food Services | 579 (48.8%) | 608 (51.2%) |
| Public Administration | 661 (45.9%) | 780 (54.1%) |
| Total | 10,895 (49.5%) | 11,091 (50.4%) |
Education in Coram
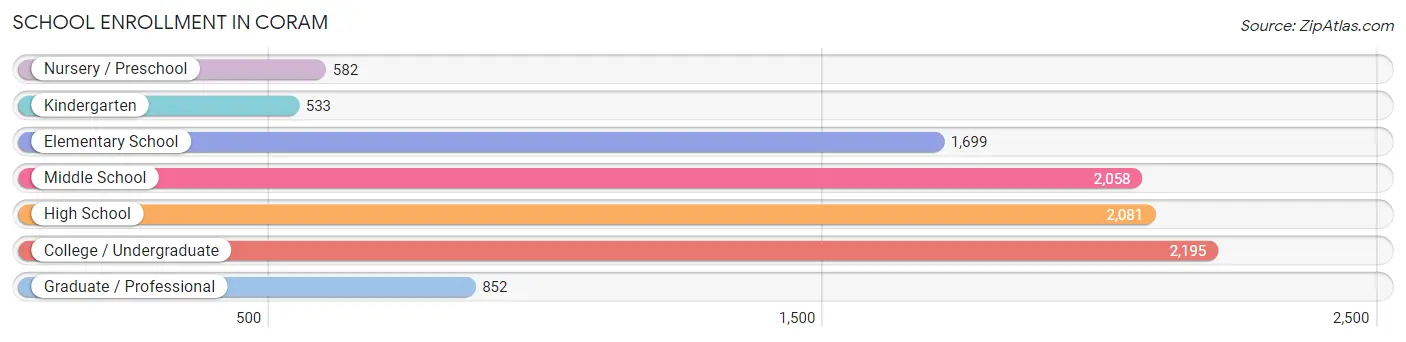
School Enrollment in Coram
The most common levels of schooling among the 10,000 students in Coram are college / undergraduate (2,195 | 22.0%), high school (2,081 | 20.8%), and middle school (2,058 | 20.6%).
| School Level | # Students | % Students |
| Nursery / Preschool | 582 | 5.8% |
| Kindergarten | 533 | 5.3% |
| Elementary School | 1,699 | 17.0% |
| Middle School | 2,058 | 20.6% |
| High School | 2,081 | 20.8% |
| College / Undergraduate | 2,195 | 22.0% |
| Graduate / Professional | 852 | 8.5% |
| Total | 10,000 | 100.0% |
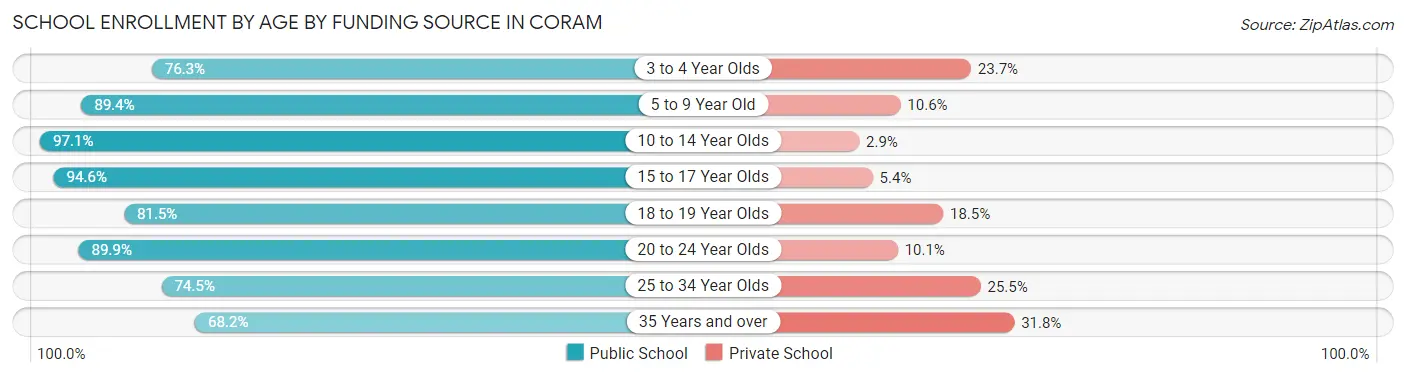
School Enrollment by Age by Funding Source in Coram
Out of a total of 10,000 students who are enrolled in schools in Coram, 1,180 (11.8%) attend a private institution, while the remaining 8,820 (88.2%) are enrolled in public schools. The age group of 35 years and over has the highest likelihood of being enrolled in private schools, with 189 (31.8% in the age bracket) enrolled. Conversely, the age group of 10 to 14 year olds has the lowest likelihood of being enrolled in a private school, with 2,529 (97.1% in the age bracket) attending a public institution.
| Age Bracket | Public School | Private School |
| 3 to 4 Year Olds | 412 (76.3%) | 128 (23.7%) |
| 5 to 9 Year Old | 1,946 (89.4%) | 230 (10.6%) |
| 10 to 14 Year Olds | 2,529 (97.1%) | 75 (2.9%) |
| 15 to 17 Year Olds | 1,103 (94.6%) | 63 (5.4%) |
| 18 to 19 Year Olds | 845 (81.5%) | 192 (18.5%) |
| 20 to 24 Year Olds | 1,019 (89.9%) | 114 (10.1%) |
| 25 to 34 Year Olds | 558 (74.5%) | 191 (25.5%) |
| 35 Years and over | 406 (68.2%) | 189 (31.8%) |
| Total | 8,820 (88.2%) | 1,180 (11.8%) |
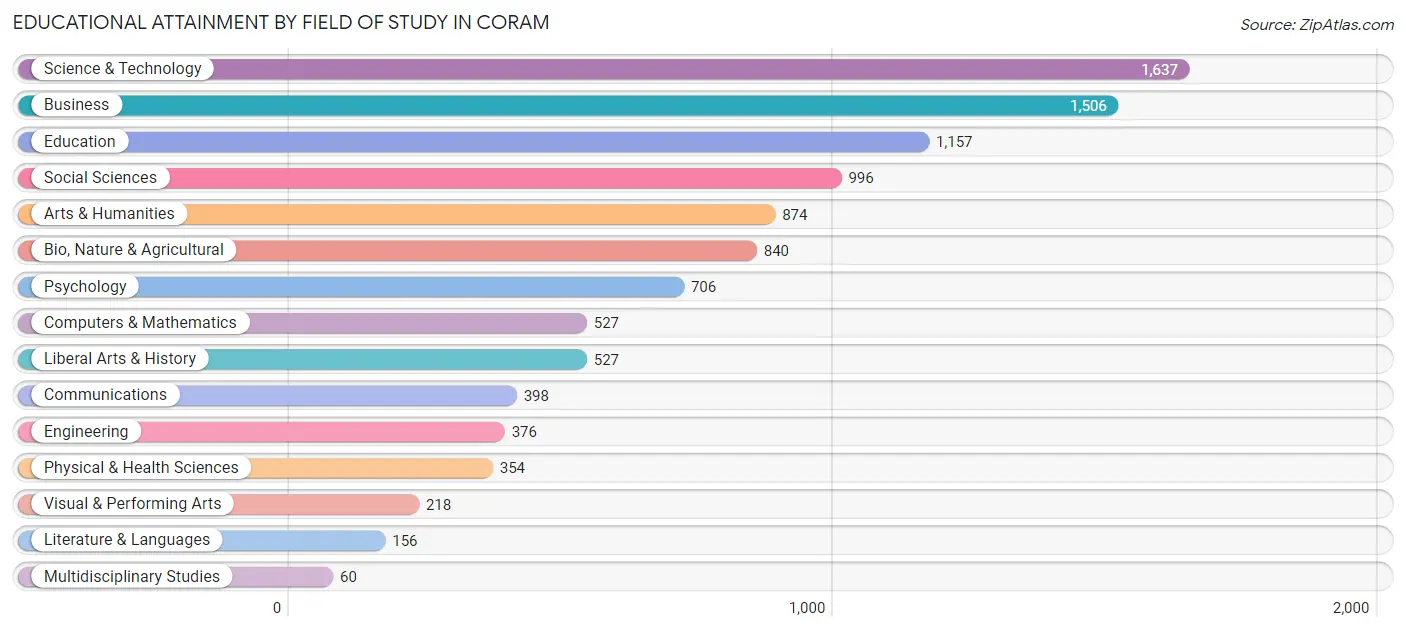
Educational Attainment by Field of Study in Coram
Science & technology (1,637 | 15.8%), business (1,506 | 14.6%), education (1,157 | 11.2%), social sciences (996 | 9.6%), and arts & humanities (874 | 8.5%) are the most common fields of study among 10,332 individuals in Coram who have obtained a bachelor's degree or higher.
| Field of Study | # Graduates | % Graduates |
| Computers & Mathematics | 527 | 5.1% |
| Bio, Nature & Agricultural | 840 | 8.1% |
| Physical & Health Sciences | 354 | 3.4% |
| Psychology | 706 | 6.8% |
| Social Sciences | 996 | 9.6% |
| Engineering | 376 | 3.6% |
| Multidisciplinary Studies | 60 | 0.6% |
| Science & Technology | 1,637 | 15.8% |
| Business | 1,506 | 14.6% |
| Education | 1,157 | 11.2% |
| Literature & Languages | 156 | 1.5% |
| Liberal Arts & History | 527 | 5.1% |
| Visual & Performing Arts | 218 | 2.1% |
| Communications | 398 | 3.8% |
| Arts & Humanities | 874 | 8.5% |
| Total | 10,332 | 100.0% |
Transportation & Commute in Coram
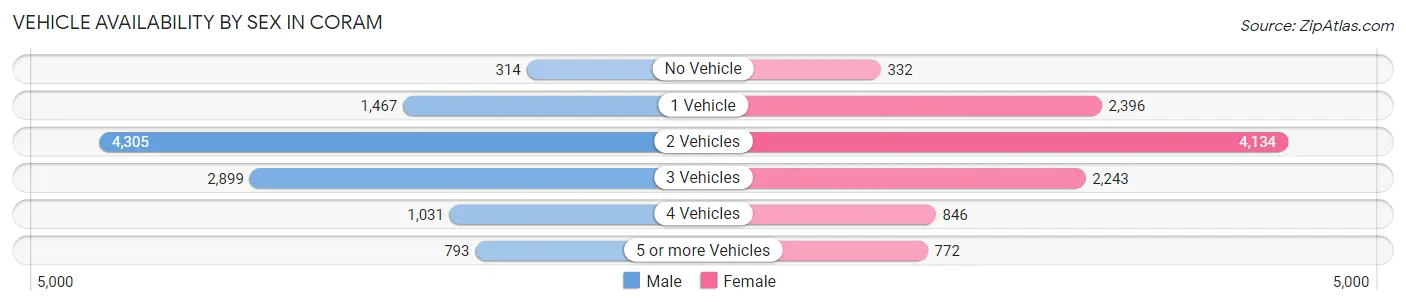
Vehicle Availability by Sex in Coram
The most prevalent vehicle ownership categories in Coram are males with 2 vehicles (4,305, accounting for 39.8%) and females with 2 vehicles (4,134, making up 40.2%).
| Vehicles Available | Male | Female |
| No Vehicle | 314 (2.9%) | 332 (3.1%) |
| 1 Vehicle | 1,467 (13.6%) | 2,396 (22.3%) |
| 2 Vehicles | 4,305 (39.8%) | 4,134 (38.6%) |
| 3 Vehicles | 2,899 (26.8%) | 2,243 (20.9%) |
| 4 Vehicles | 1,031 (9.5%) | 846 (7.9%) |
| 5 or more Vehicles | 793 (7.3%) | 772 (7.2%) |
| Total | 10,809 (100.0%) | 10,723 (100.0%) |
Commute Time in Coram
The most frequently occuring commute durations in Coram are 30 to 34 minutes (3,641 commuters, 18.0%), 20 to 24 minutes (3,225 commuters, 16.0%), and 10 to 14 minutes (2,115 commuters, 10.5%).
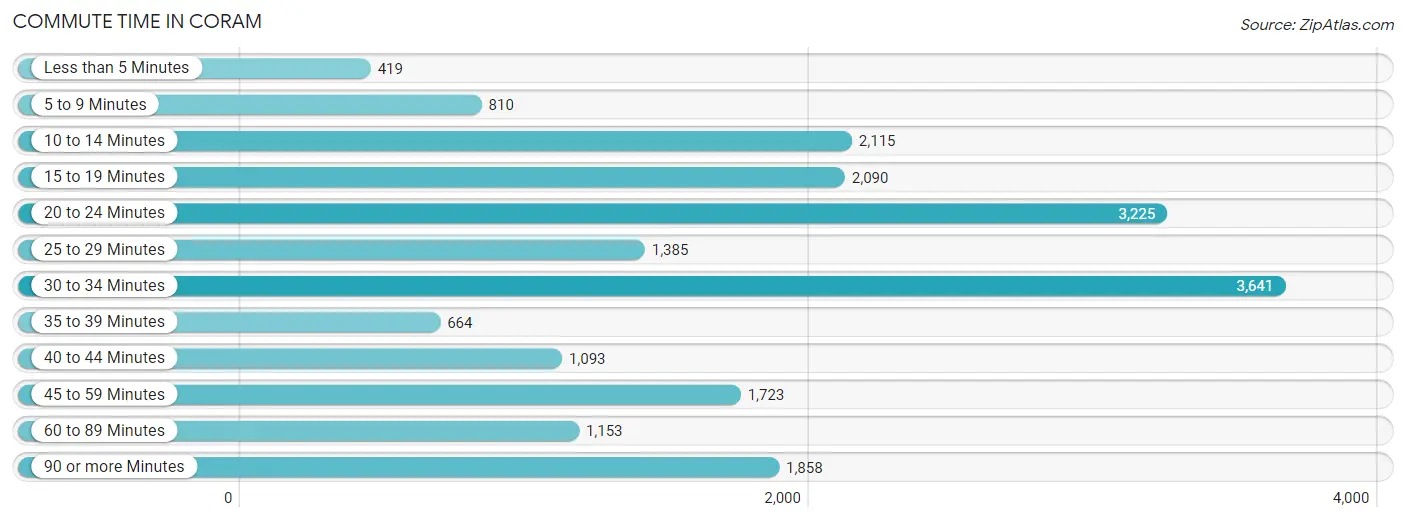
| Commute Time | # Commuters | % Commuters |
| Less than 5 Minutes | 419 | 2.1% |
| 5 to 9 Minutes | 810 | 4.0% |
| 10 to 14 Minutes | 2,115 | 10.5% |
| 15 to 19 Minutes | 2,090 | 10.4% |
| 20 to 24 Minutes | 3,225 | 16.0% |
| 25 to 29 Minutes | 1,385 | 6.9% |
| 30 to 34 Minutes | 3,641 | 18.0% |
| 35 to 39 Minutes | 664 | 3.3% |
| 40 to 44 Minutes | 1,093 | 5.4% |
| 45 to 59 Minutes | 1,723 | 8.5% |
| 60 to 89 Minutes | 1,153 | 5.7% |
| 90 or more Minutes | 1,858 | 9.2% |
Commute Time by Sex in Coram
The most common commute times in Coram are 30 to 34 minutes (1,755 commuters, 17.1%) for males and 30 to 34 minutes (1,886 commuters, 19.0%) for females.
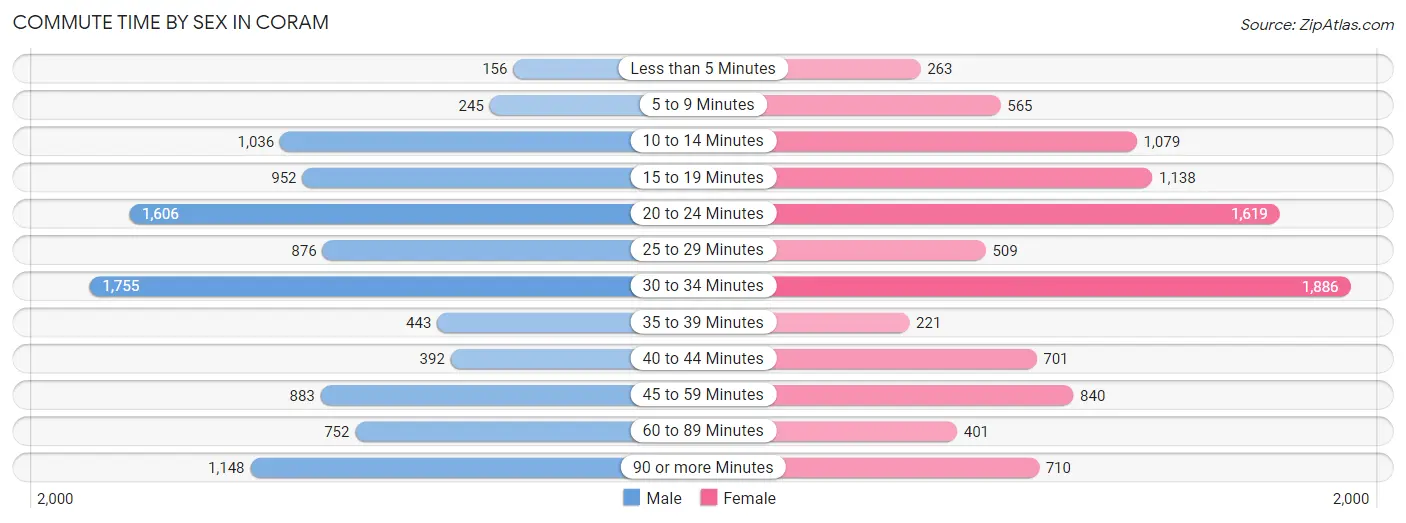
| Commute Time | Male | Female |
| Less than 5 Minutes | 156 (1.5%) | 263 (2.6%) |
| 5 to 9 Minutes | 245 (2.4%) | 565 (5.7%) |
| 10 to 14 Minutes | 1,036 (10.1%) | 1,079 (10.9%) |
| 15 to 19 Minutes | 952 (9.3%) | 1,138 (11.5%) |
| 20 to 24 Minutes | 1,606 (15.7%) | 1,619 (16.3%) |
| 25 to 29 Minutes | 876 (8.6%) | 509 (5.1%) |
| 30 to 34 Minutes | 1,755 (17.1%) | 1,886 (19.0%) |
| 35 to 39 Minutes | 443 (4.3%) | 221 (2.2%) |
| 40 to 44 Minutes | 392 (3.8%) | 701 (7.1%) |
| 45 to 59 Minutes | 883 (8.6%) | 840 (8.5%) |
| 60 to 89 Minutes | 752 (7.3%) | 401 (4.0%) |
| 90 or more Minutes | 1,148 (11.2%) | 710 (7.1%) |
Time of Departure to Work by Sex in Coram
The most frequent times of departure to work in Coram are 7:00 AM to 7:29 AM (1,500, 14.6%) for males and 8:00 AM to 8:29 AM (1,926, 19.4%) for females.
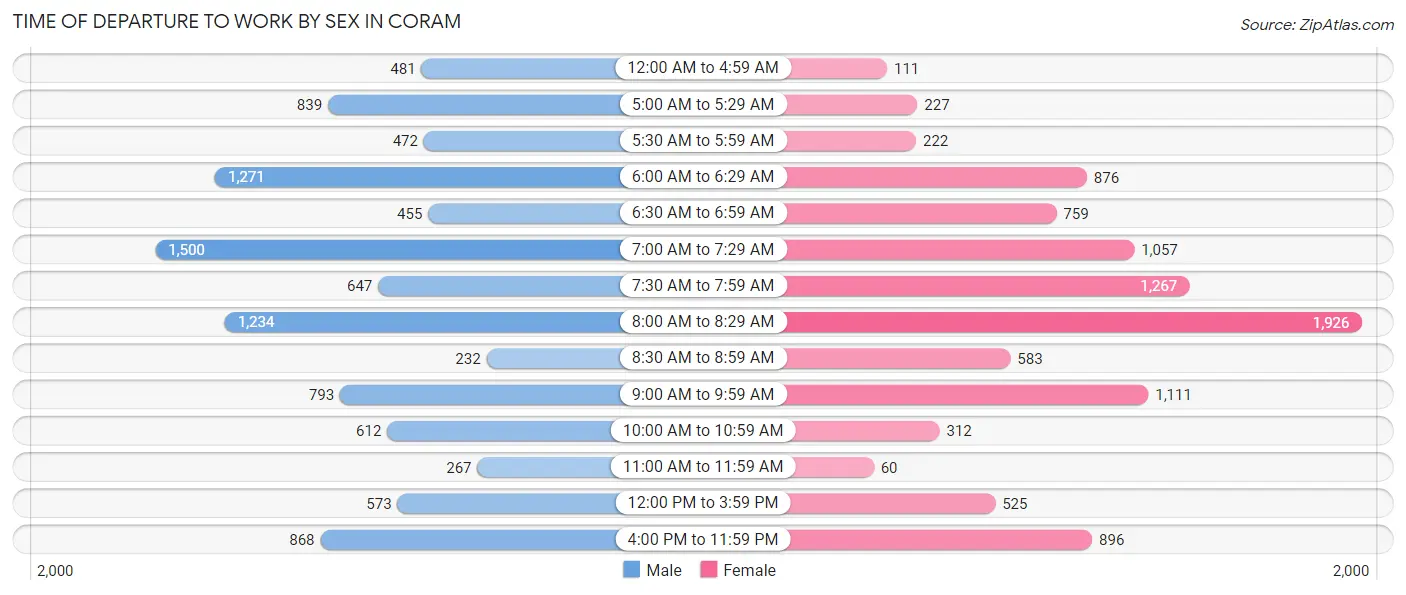
| Time of Departure | Male | Female |
| 12:00 AM to 4:59 AM | 481 (4.7%) | 111 (1.1%) |
| 5:00 AM to 5:29 AM | 839 (8.2%) | 227 (2.3%) |
| 5:30 AM to 5:59 AM | 472 (4.6%) | 222 (2.2%) |
| 6:00 AM to 6:29 AM | 1,271 (12.4%) | 876 (8.8%) |
| 6:30 AM to 6:59 AM | 455 (4.4%) | 759 (7.6%) |
| 7:00 AM to 7:29 AM | 1,500 (14.6%) | 1,057 (10.6%) |
| 7:30 AM to 7:59 AM | 647 (6.3%) | 1,267 (12.8%) |
| 8:00 AM to 8:29 AM | 1,234 (12.0%) | 1,926 (19.4%) |
| 8:30 AM to 8:59 AM | 232 (2.3%) | 583 (5.9%) |
| 9:00 AM to 9:59 AM | 793 (7.7%) | 1,111 (11.2%) |
| 10:00 AM to 10:59 AM | 612 (6.0%) | 312 (3.1%) |
| 11:00 AM to 11:59 AM | 267 (2.6%) | 60 (0.6%) |
| 12:00 PM to 3:59 PM | 573 (5.6%) | 525 (5.3%) |
| 4:00 PM to 11:59 PM | 868 (8.5%) | 896 (9.0%) |
| Total | 10,244 (100.0%) | 9,932 (100.0%) |
Housing Occupancy in Coram
Occupancy by Ownership in Coram
Of the total 15,496 dwellings in Coram, owner-occupied units account for 10,581 (68.3%), while renter-occupied units make up 4,915 (31.7%).
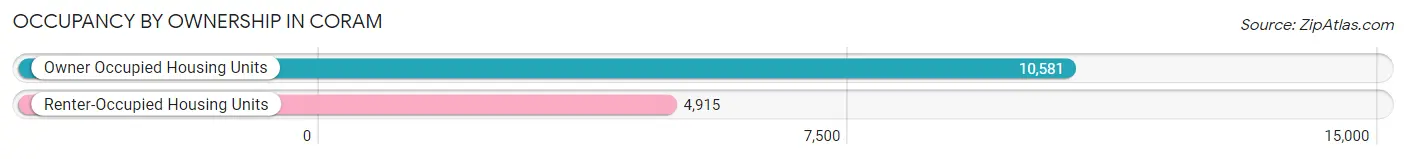
| Occupancy | # Housing Units | % Housing Units |
| Owner Occupied Housing Units | 10,581 | 68.3% |
| Renter-Occupied Housing Units | 4,915 | 31.7% |
| Total Occupied Housing Units | 15,496 | 100.0% |
Occupancy by Household Size in Coram
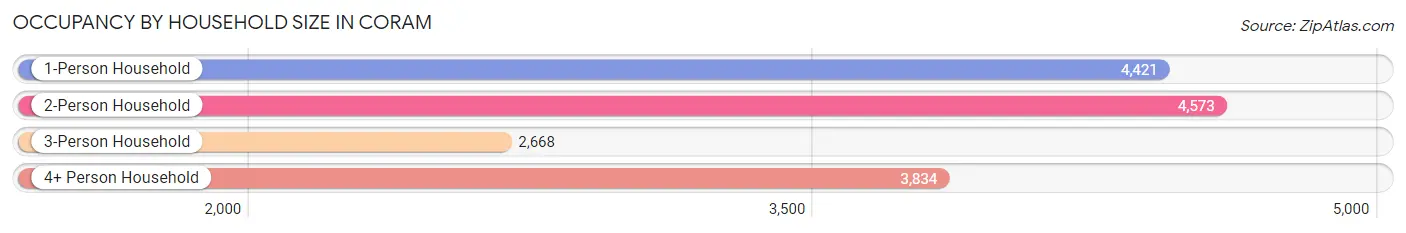
| Household Size | # Housing Units | % Housing Units |
| 1-Person Household | 4,421 | 28.5% |
| 2-Person Household | 4,573 | 29.5% |
| 3-Person Household | 2,668 | 17.2% |
| 4+ Person Household | 3,834 | 24.7% |
| Total Housing Units | 15,496 | 100.0% |
Occupancy by Ownership by Household Size in Coram
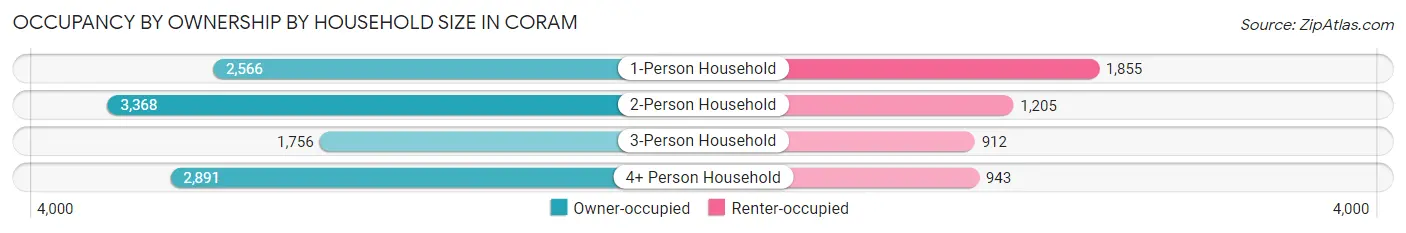
| Household Size | Owner-occupied | Renter-occupied |
| 1-Person Household | 2,566 (58.0%) | 1,855 (42.0%) |
| 2-Person Household | 3,368 (73.7%) | 1,205 (26.4%) |
| 3-Person Household | 1,756 (65.8%) | 912 (34.2%) |
| 4+ Person Household | 2,891 (75.4%) | 943 (24.6%) |
| Total Housing Units | 10,581 (68.3%) | 4,915 (31.7%) |
Occupancy by Educational Attainment in Coram
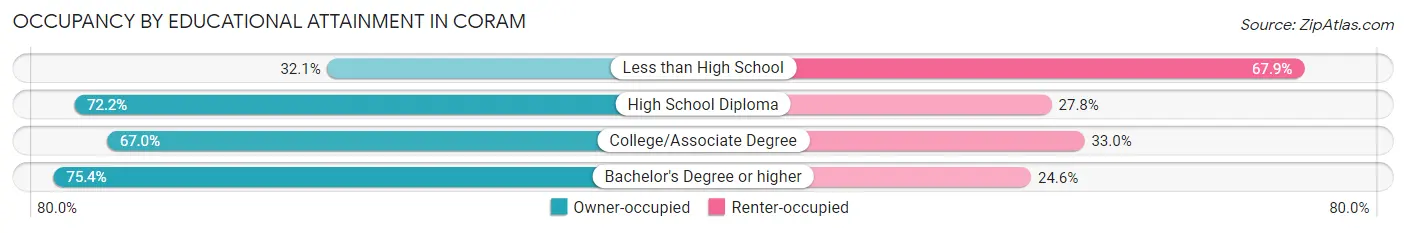
| Household Size | Owner-occupied | Renter-occupied |
| Less than High School | 424 (32.1%) | 896 (67.9%) |
| High School Diploma | 2,931 (72.2%) | 1,130 (27.8%) |
| College/Associate Degree | 3,192 (67.0%) | 1,575 (33.0%) |
| Bachelor's Degree or higher | 4,034 (75.4%) | 1,314 (24.6%) |
Occupancy by Age of Householder in Coram
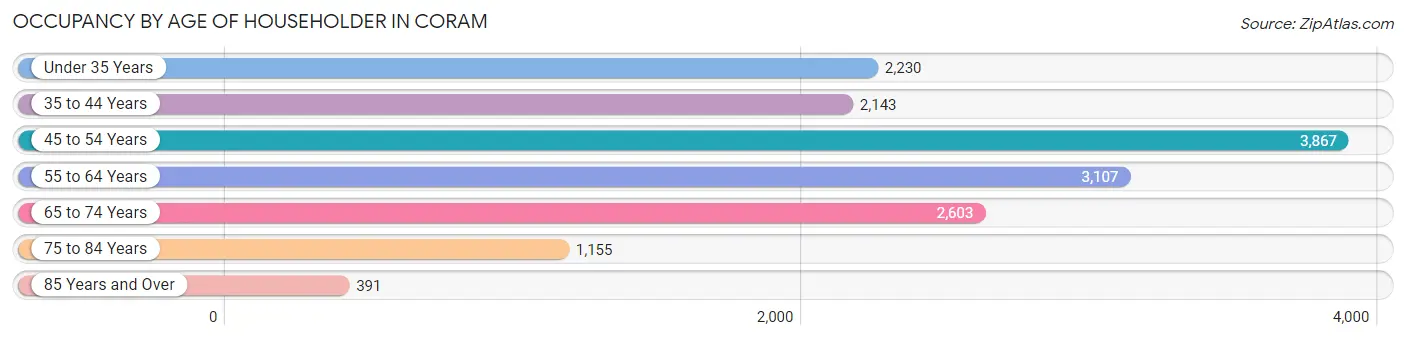
| Age Bracket | # Households | % Households |
| Under 35 Years | 2,230 | 14.4% |
| 35 to 44 Years | 2,143 | 13.8% |
| 45 to 54 Years | 3,867 | 24.9% |
| 55 to 64 Years | 3,107 | 20.1% |
| 65 to 74 Years | 2,603 | 16.8% |
| 75 to 84 Years | 1,155 | 7.4% |
| 85 Years and Over | 391 | 2.5% |
| Total | 15,496 | 100.0% |
Housing Finances in Coram
Median Income by Occupancy in Coram
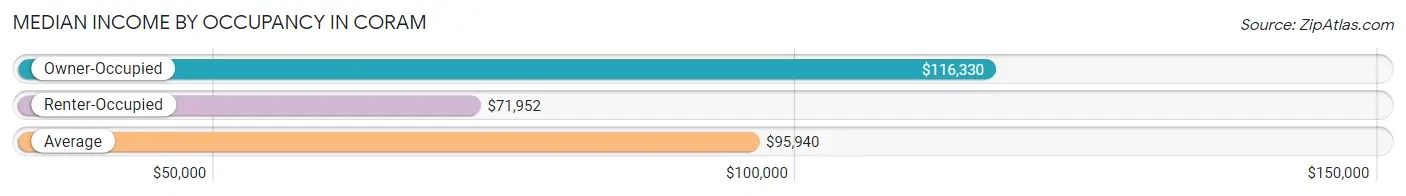
| Occupancy Type | # Households | Median Income |
| Owner-Occupied | 10,581 (68.3%) | $116,330 |
| Renter-Occupied | 4,915 (31.7%) | $71,952 |
| Average | 15,496 (100.0%) | $95,940 |
Occupancy by Householder Income Bracket in Coram
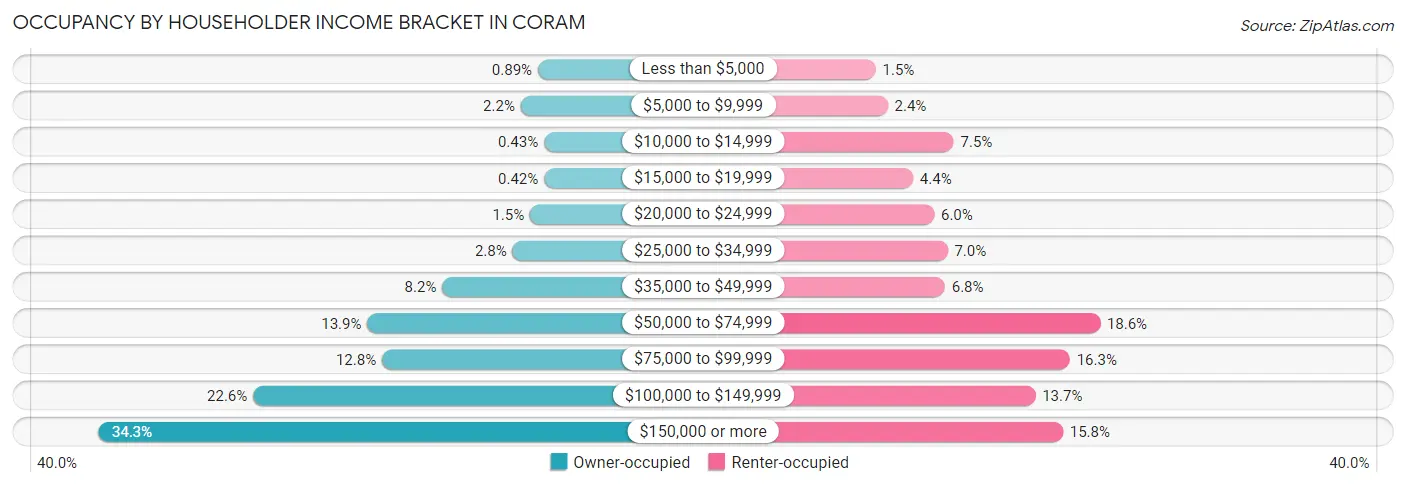
| Income Bracket | Owner-occupied | Renter-occupied |
| Less than $5,000 | 94 (0.9%) | 75 (1.5%) |
| $5,000 to $9,999 | 233 (2.2%) | 120 (2.4%) |
| $10,000 to $14,999 | 45 (0.4%) | 367 (7.5%) |
| $15,000 to $19,999 | 44 (0.4%) | 215 (4.4%) |
| $20,000 to $24,999 | 158 (1.5%) | 294 (6.0%) |
| $25,000 to $34,999 | 298 (2.8%) | 344 (7.0%) |
| $35,000 to $49,999 | 865 (8.2%) | 334 (6.8%) |
| $50,000 to $74,999 | 1,470 (13.9%) | 915 (18.6%) |
| $75,000 to $99,999 | 1,351 (12.8%) | 802 (16.3%) |
| $100,000 to $149,999 | 2,390 (22.6%) | 673 (13.7%) |
| $150,000 or more | 3,633 (34.3%) | 776 (15.8%) |
| Total | 10,581 (100.0%) | 4,915 (100.0%) |
Monthly Housing Cost Tiers in Coram
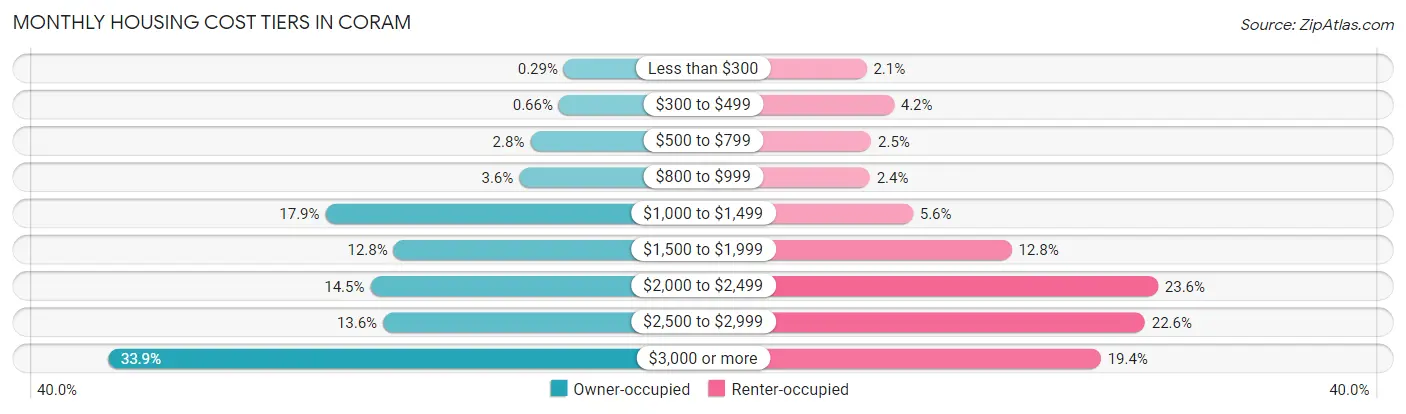
| Monthly Cost | Owner-occupied | Renter-occupied |
| Less than $300 | 31 (0.3%) | 105 (2.1%) |
| $300 to $499 | 70 (0.7%) | 204 (4.2%) |
| $500 to $799 | 292 (2.8%) | 122 (2.5%) |
| $800 to $999 | 379 (3.6%) | 117 (2.4%) |
| $1,000 to $1,499 | 1,889 (17.8%) | 273 (5.6%) |
| $1,500 to $1,999 | 1,358 (12.8%) | 630 (12.8%) |
| $2,000 to $2,499 | 1,538 (14.5%) | 1,160 (23.6%) |
| $2,500 to $2,999 | 1,440 (13.6%) | 1,113 (22.6%) |
| $3,000 or more | 3,584 (33.9%) | 953 (19.4%) |
| Total | 10,581 (100.0%) | 4,915 (100.0%) |
Physical Housing Characteristics in Coram
Housing Structures in Coram
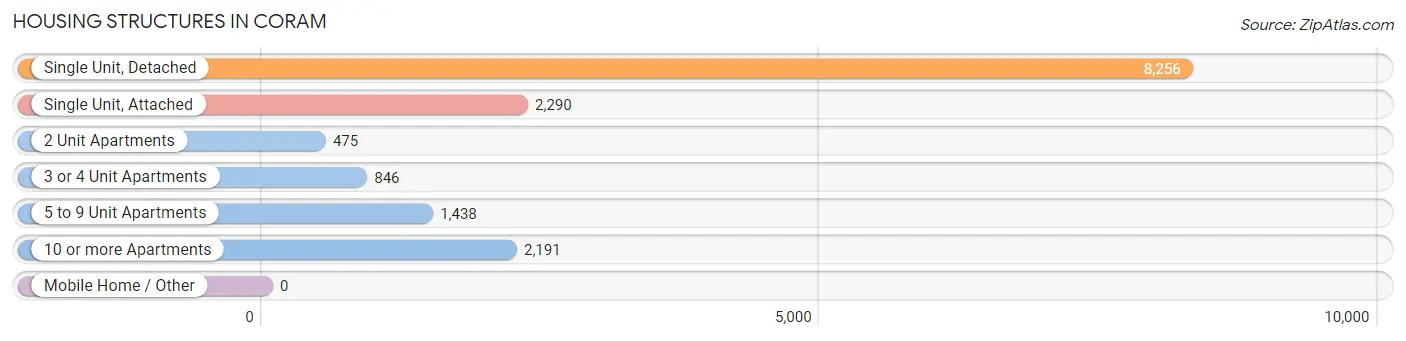
| Structure Type | # Housing Units | % Housing Units |
| Single Unit, Detached | 8,256 | 53.3% |
| Single Unit, Attached | 2,290 | 14.8% |
| 2 Unit Apartments | 475 | 3.1% |
| 3 or 4 Unit Apartments | 846 | 5.5% |
| 5 to 9 Unit Apartments | 1,438 | 9.3% |
| 10 or more Apartments | 2,191 | 14.1% |
| Mobile Home / Other | 0 | 0.0% |
| Total | 15,496 | 100.0% |
Housing Structures by Occupancy in Coram
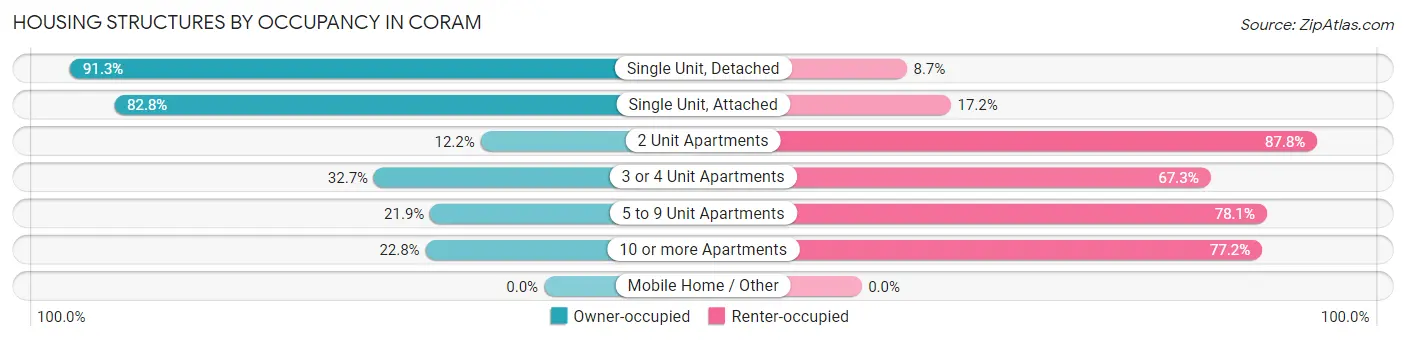
| Structure Type | Owner-occupied | Renter-occupied |
| Single Unit, Detached | 7,535 (91.3%) | 721 (8.7%) |
| Single Unit, Attached | 1,896 (82.8%) | 394 (17.2%) |
| 2 Unit Apartments | 58 (12.2%) | 417 (87.8%) |
| 3 or 4 Unit Apartments | 277 (32.7%) | 569 (67.3%) |
| 5 to 9 Unit Apartments | 315 (21.9%) | 1,123 (78.1%) |
| 10 or more Apartments | 500 (22.8%) | 1,691 (77.2%) |
| Mobile Home / Other | 0 (0.0%) | 0 (0.0%) |
| Total | 10,581 (68.3%) | 4,915 (31.7%) |
Housing Structures by Number of Rooms in Coram
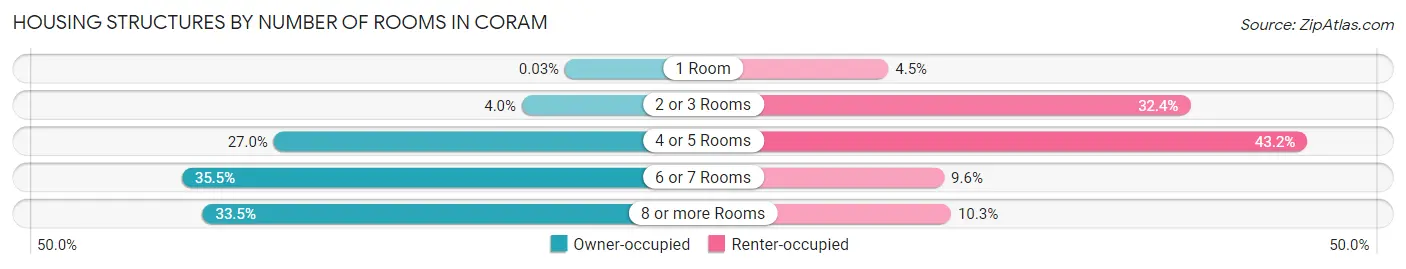
| Number of Rooms | Owner-occupied | Renter-occupied |
| 1 Room | 3 (0.0%) | 220 (4.5%) |
| 2 or 3 Rooms | 424 (4.0%) | 1,592 (32.4%) |
| 4 or 5 Rooms | 2,853 (27.0%) | 2,124 (43.2%) |
| 6 or 7 Rooms | 3,752 (35.5%) | 474 (9.6%) |
| 8 or more Rooms | 3,549 (33.5%) | 505 (10.3%) |
| Total | 10,581 (100.0%) | 4,915 (100.0%) |
Housing Structure by Heating Type in Coram
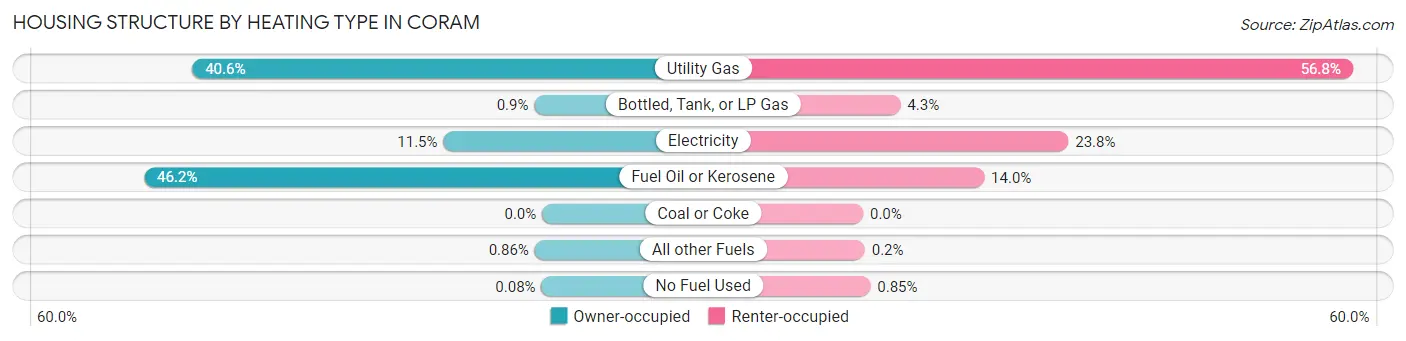
| Heating Type | Owner-occupied | Renter-occupied |
| Utility Gas | 4,292 (40.6%) | 2,790 (56.8%) |
| Bottled, Tank, or LP Gas | 95 (0.9%) | 213 (4.3%) |
| Electricity | 1,212 (11.5%) | 1,170 (23.8%) |
| Fuel Oil or Kerosene | 4,883 (46.2%) | 690 (14.0%) |
| Coal or Coke | 0 (0.0%) | 0 (0.0%) |
| All other Fuels | 91 (0.9%) | 10 (0.2%) |
| No Fuel Used | 8 (0.1%) | 42 (0.9%) |
| Total | 10,581 (100.0%) | 4,915 (100.0%) |
Household Vehicle Usage in Coram
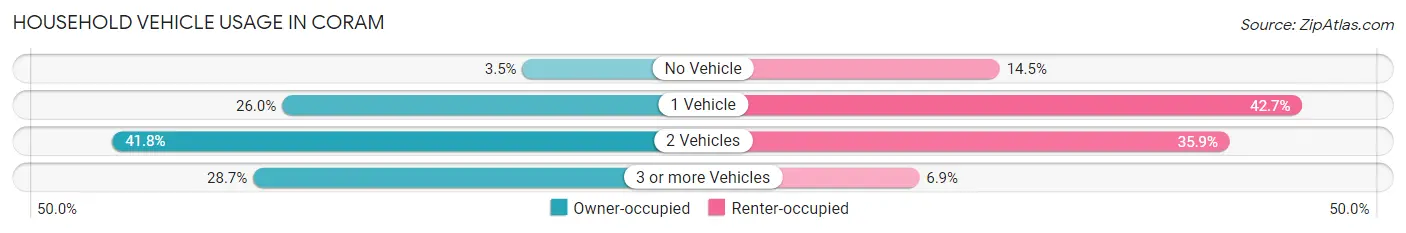
| Vehicles per Household | Owner-occupied | Renter-occupied |
| No Vehicle | 374 (3.5%) | 710 (14.4%) |
| 1 Vehicle | 2,748 (26.0%) | 2,098 (42.7%) |
| 2 Vehicles | 4,425 (41.8%) | 1,766 (35.9%) |
| 3 or more Vehicles | 3,034 (28.7%) | 341 (6.9%) |
| Total | 10,581 (100.0%) | 4,915 (100.0%) |
Real Estate & Mortgages in Coram
Real Estate and Mortgage Overview in Coram
| Characteristic | Without Mortgage | With Mortgage |
| Housing Units | 2,840 | 7,741 |
| Median Property Value | $371,600 | $383,600 |
| Median Household Income | $89,730 | $2,936 |
| Monthly Housing Costs | $1,309 | $3,584 |
| Real Estate Taxes | $9,465 | $231 |
Property Value by Mortgage Status in Coram
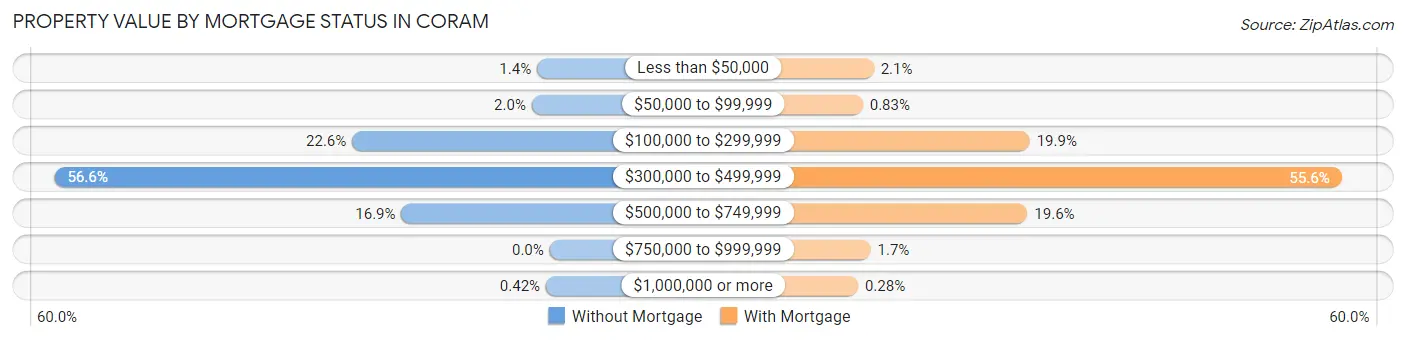
| Property Value | Without Mortgage | With Mortgage |
| Less than $50,000 | 41 (1.4%) | 161 (2.1%) |
| $50,000 to $99,999 | 58 (2.0%) | 64 (0.8%) |
| $100,000 to $299,999 | 641 (22.6%) | 1,541 (19.9%) |
| $300,000 to $499,999 | 1,607 (56.6%) | 4,300 (55.5%) |
| $500,000 to $749,999 | 481 (16.9%) | 1,520 (19.6%) |
| $750,000 to $999,999 | 0 (0.0%) | 133 (1.7%) |
| $1,000,000 or more | 12 (0.4%) | 22 (0.3%) |
| Total | 2,840 (100.0%) | 7,741 (100.0%) |
Household Income by Mortgage Status in Coram
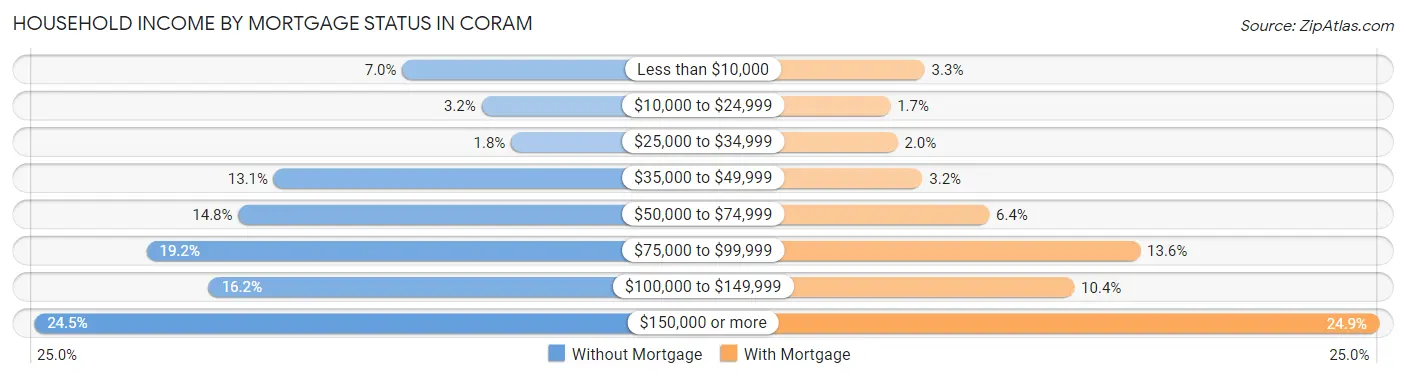
| Household Income | Without Mortgage | With Mortgage |
| Less than $10,000 | 199 (7.0%) | 255 (3.3%) |
| $10,000 to $24,999 | 92 (3.2%) | 128 (1.7%) |
| $25,000 to $34,999 | 52 (1.8%) | 155 (2.0%) |
| $35,000 to $49,999 | 373 (13.1%) | 246 (3.2%) |
| $50,000 to $74,999 | 421 (14.8%) | 492 (6.4%) |
| $75,000 to $99,999 | 545 (19.2%) | 1,049 (13.6%) |
| $100,000 to $149,999 | 461 (16.2%) | 806 (10.4%) |
| $150,000 or more | 697 (24.5%) | 1,929 (24.9%) |
| Total | 2,840 (100.0%) | 7,741 (100.0%) |
Property Value to Household Income Ratio in Coram
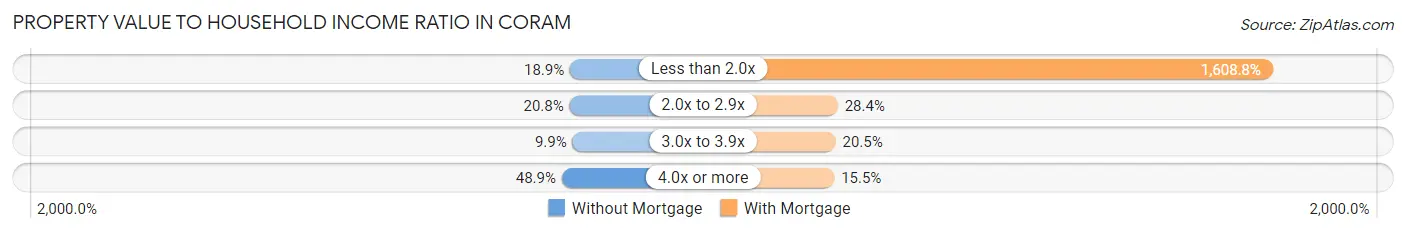
| Value-to-Income Ratio | Without Mortgage | With Mortgage |
| Less than 2.0x | 537 (18.9%) | 124,533 (1,608.7%) |
| 2.0x to 2.9x | 590 (20.8%) | 2,196 (28.4%) |
| 3.0x to 3.9x | 280 (9.9%) | 1,589 (20.5%) |
| 4.0x or more | 1,389 (48.9%) | 1,199 (15.5%) |
| Total | 2,840 (100.0%) | 7,741 (100.0%) |
Real Estate Taxes by Mortgage Status in Coram
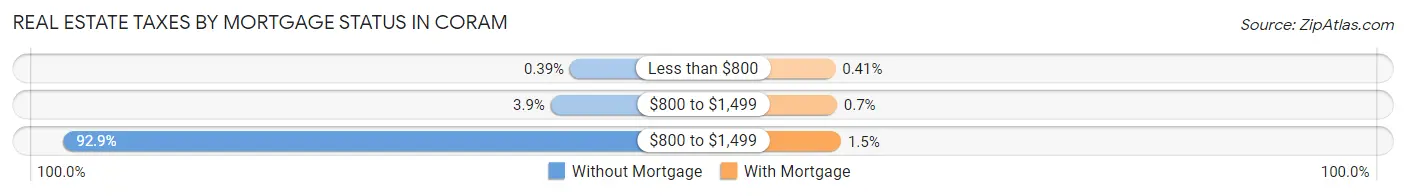
| Property Taxes | Without Mortgage | With Mortgage |
| Less than $800 | 11 (0.4%) | 32 (0.4%) |
| $800 to $1,499 | 111 (3.9%) | 54 (0.7%) |
| $800 to $1,499 | 2,639 (92.9%) | 112 (1.5%) |
| Total | 2,840 (100.0%) | 7,741 (100.0%) |
Health & Disability in Coram
Health Insurance Coverage by Age in Coram
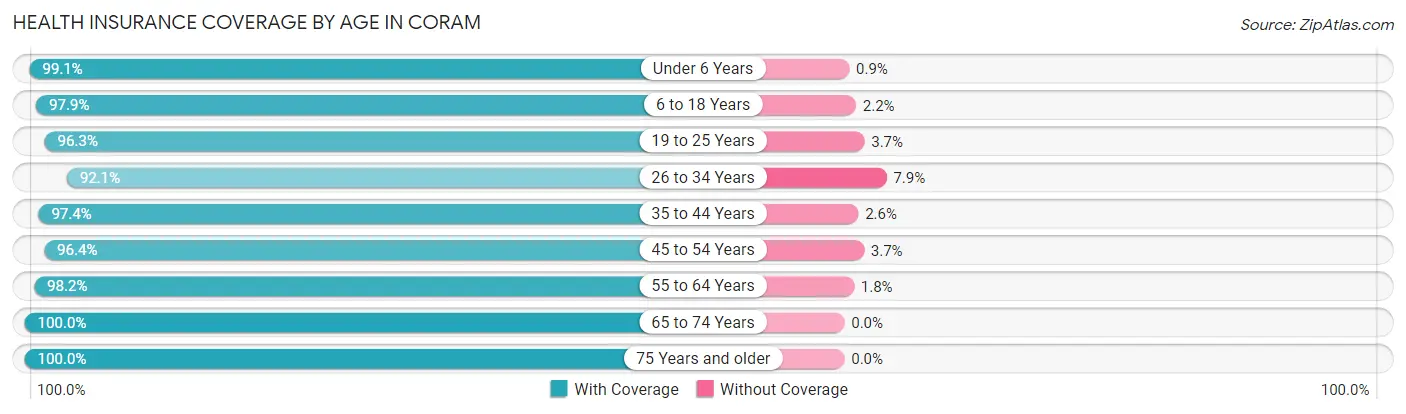
| Age Bracket | With Coverage | Without Coverage |
| Under 6 Years | 2,966 (99.1%) | 27 (0.9%) |
| 6 to 18 Years | 6,244 (97.9%) | 137 (2.1%) |
| 19 to 25 Years | 3,793 (96.3%) | 147 (3.7%) |
| 26 to 34 Years | 4,820 (92.1%) | 412 (7.9%) |
| 35 to 44 Years | 3,987 (97.4%) | 106 (2.6%) |
| 45 to 54 Years | 6,791 (96.4%) | 257 (3.6%) |
| 55 to 64 Years | 5,461 (98.2%) | 99 (1.8%) |
| 65 to 74 Years | 4,205 (100.0%) | 0 (0.0%) |
| 75 Years and older | 2,580 (100.0%) | 0 (0.0%) |
| Total | 40,847 (97.2%) | 1,185 (2.8%) |
Health Insurance Coverage by Citizenship Status in Coram
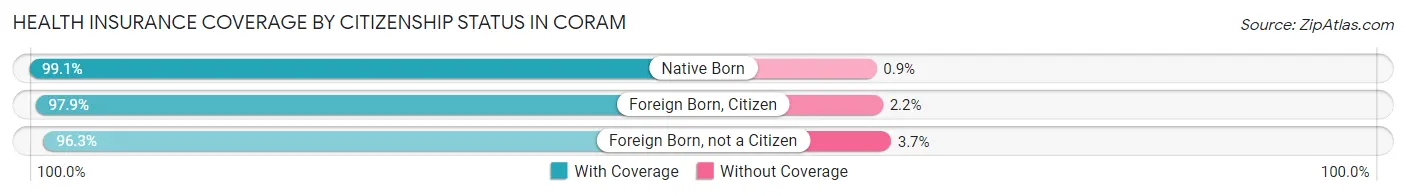
| Citizenship Status | With Coverage | Without Coverage |
| Native Born | 2,966 (99.1%) | 27 (0.9%) |
| Foreign Born, Citizen | 6,244 (97.9%) | 137 (2.1%) |
| Foreign Born, not a Citizen | 3,793 (96.3%) | 147 (3.7%) |
Health Insurance Coverage by Household Income in Coram
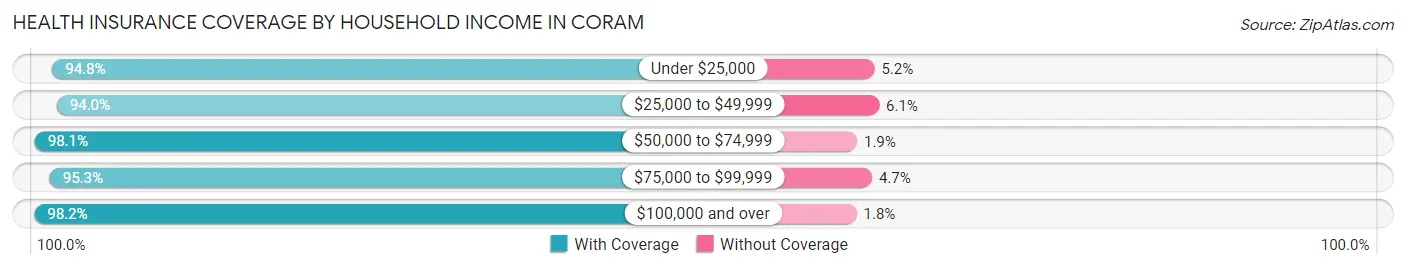
| Household Income | With Coverage | Without Coverage |
| Under $25,000 | 2,811 (94.8%) | 154 (5.2%) |
| $25,000 to $49,999 | 3,573 (94.0%) | 230 (6.0%) |
| $50,000 to $74,999 | 4,335 (98.1%) | 85 (1.9%) |
| $75,000 to $99,999 | 5,037 (95.3%) | 250 (4.7%) |
| $100,000 and over | 24,915 (98.2%) | 466 (1.8%) |
Public vs Private Health Insurance Coverage by Age in Coram
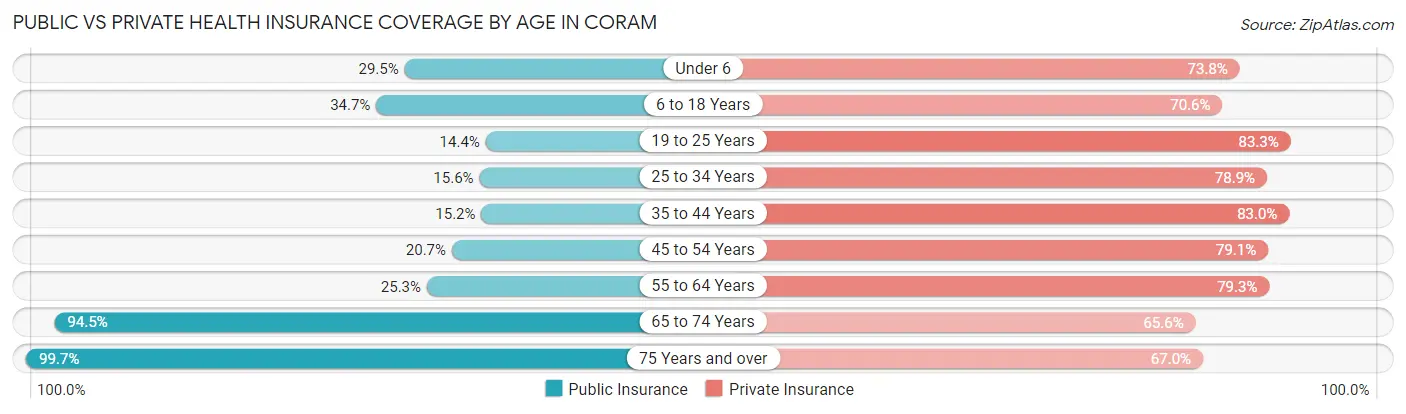
| Age Bracket | Public Insurance | Private Insurance |
| Under 6 | 882 (29.5%) | 2,210 (73.8%) |
| 6 to 18 Years | 2,217 (34.7%) | 4,507 (70.6%) |
| 19 to 25 Years | 568 (14.4%) | 3,282 (83.3%) |
| 25 to 34 Years | 815 (15.6%) | 4,128 (78.9%) |
| 35 to 44 Years | 623 (15.2%) | 3,399 (83.0%) |
| 45 to 54 Years | 1,459 (20.7%) | 5,576 (79.1%) |
| 55 to 64 Years | 1,409 (25.3%) | 4,411 (79.3%) |
| 65 to 74 Years | 3,972 (94.5%) | 2,760 (65.6%) |
| 75 Years and over | 2,573 (99.7%) | 1,729 (67.0%) |
| Total | 14,518 (34.5%) | 32,002 (76.1%) |
Disability Status by Sex by Age in Coram
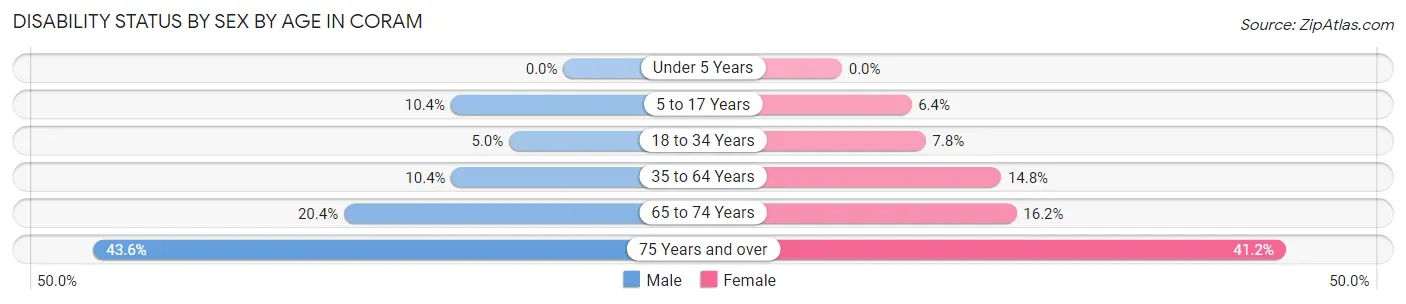
| Age Bracket | Male | Female |
| Under 5 Years | 0 (0.0%) | 0 (0.0%) |
| 5 to 17 Years | 294 (10.4%) | 214 (6.4%) |
| 18 to 34 Years | 231 (5.0%) | 404 (7.8%) |
| 35 to 64 Years | 844 (10.4%) | 1,267 (14.8%) |
| 65 to 74 Years | 401 (20.4%) | 362 (16.2%) |
| 75 Years and over | 437 (43.6%) | 650 (41.2%) |
Disability Class by Sex by Age in Coram
Disability Class: Hearing Difficulty
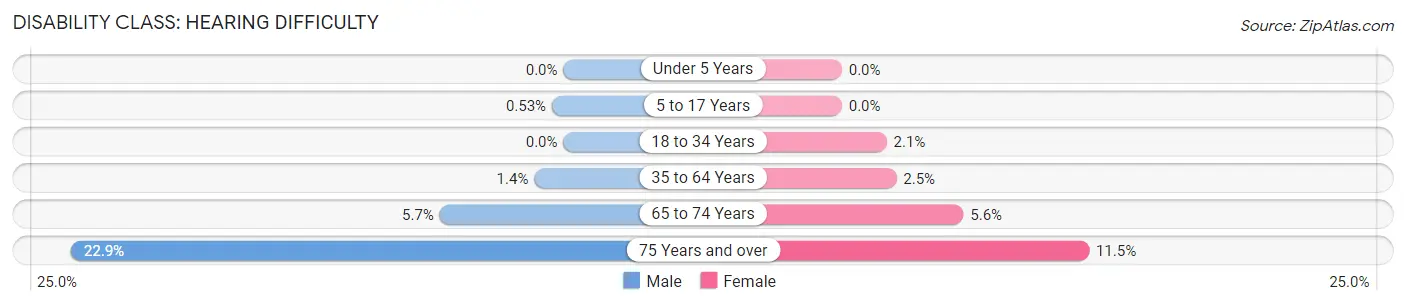
| Age Bracket | Male | Female |
| Under 5 Years | 0 (0.0%) | 0 (0.0%) |
| 5 to 17 Years | 15 (0.5%) | 0 (0.0%) |
| 18 to 34 Years | 0 (0.0%) | 108 (2.1%) |
| 35 to 64 Years | 110 (1.3%) | 217 (2.5%) |
| 65 to 74 Years | 113 (5.7%) | 126 (5.6%) |
| 75 Years and over | 229 (22.9%) | 181 (11.5%) |
Disability Class: Vision Difficulty
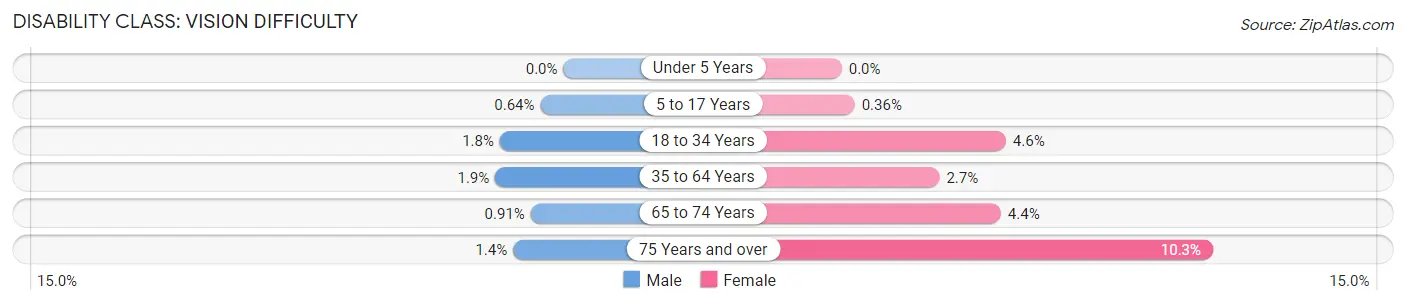
| Age Bracket | Male | Female |
| Under 5 Years | 0 (0.0%) | 0 (0.0%) |
| 5 to 17 Years | 18 (0.6%) | 12 (0.4%) |
| 18 to 34 Years | 81 (1.8%) | 238 (4.6%) |
| 35 to 64 Years | 154 (1.9%) | 233 (2.7%) |
| 65 to 74 Years | 18 (0.9%) | 99 (4.4%) |
| 75 Years and over | 14 (1.4%) | 163 (10.3%) |
Disability Class: Cognitive Difficulty
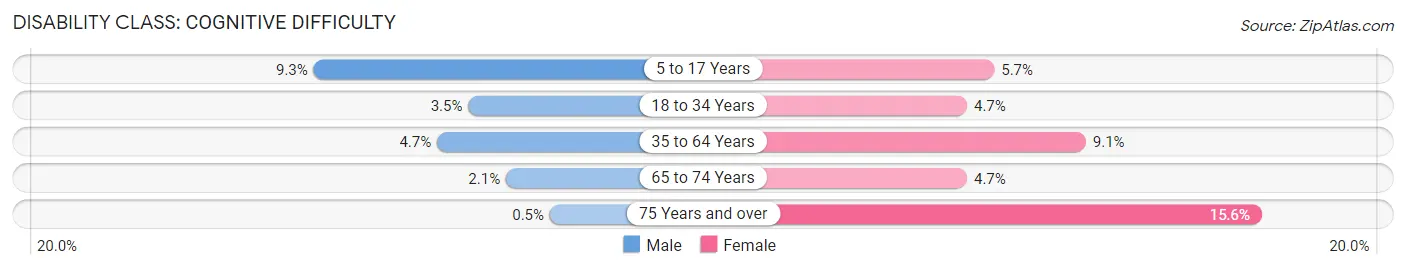
| Age Bracket | Male | Female |
| 5 to 17 Years | 261 (9.3%) | 188 (5.7%) |
| 18 to 34 Years | 162 (3.5%) | 242 (4.6%) |
| 35 to 64 Years | 381 (4.7%) | 777 (9.1%) |
| 65 to 74 Years | 42 (2.1%) | 104 (4.6%) |
| 75 Years and over | 5 (0.5%) | 246 (15.6%) |
Disability Class: Ambulatory Difficulty
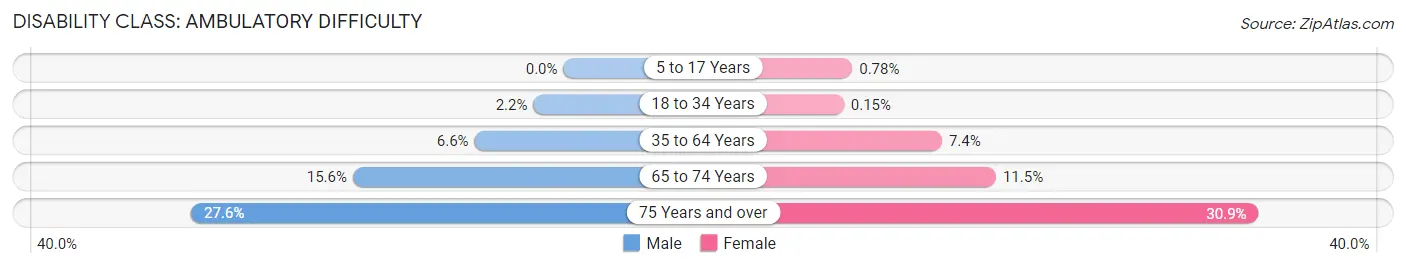
| Age Bracket | Male | Female |
| 5 to 17 Years | 0 (0.0%) | 26 (0.8%) |
| 18 to 34 Years | 102 (2.2%) | 8 (0.2%) |
| 35 to 64 Years | 536 (6.6%) | 638 (7.4%) |
| 65 to 74 Years | 308 (15.6%) | 256 (11.5%) |
| 75 Years and over | 277 (27.6%) | 488 (30.9%) |
Disability Class: Self-Care Difficulty
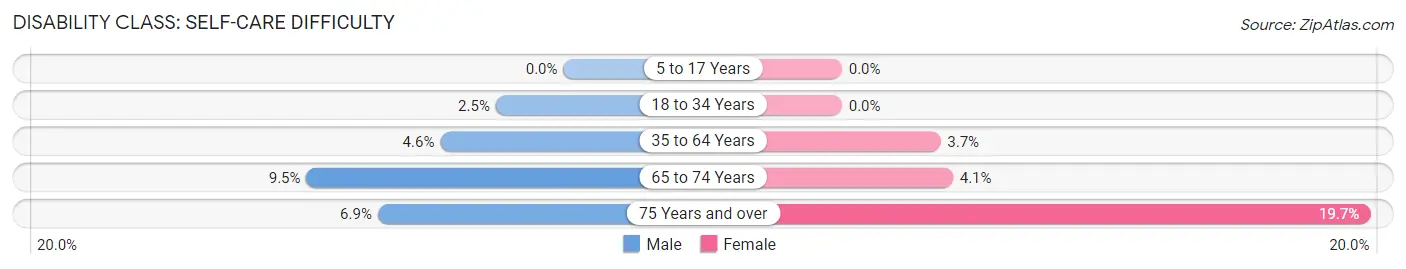
| Age Bracket | Male | Female |
| 5 to 17 Years | 0 (0.0%) | 0 (0.0%) |
| 18 to 34 Years | 115 (2.5%) | 0 (0.0%) |
| 35 to 64 Years | 371 (4.6%) | 314 (3.7%) |
| 65 to 74 Years | 188 (9.5%) | 92 (4.1%) |
| 75 Years and over | 69 (6.9%) | 310 (19.7%) |
Technology Access in Coram
Computing Device Access in Coram
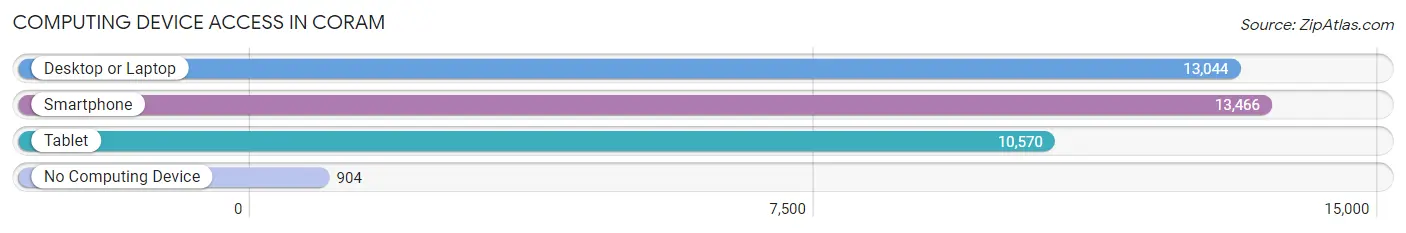
| Device Type | # Households | % Households |
| Desktop or Laptop | 13,044 | 84.2% |
| Smartphone | 13,466 | 86.9% |
| Tablet | 10,570 | 68.2% |
| No Computing Device | 904 | 5.8% |
| Total | 15,496 | 100.0% |
Internet Access in Coram
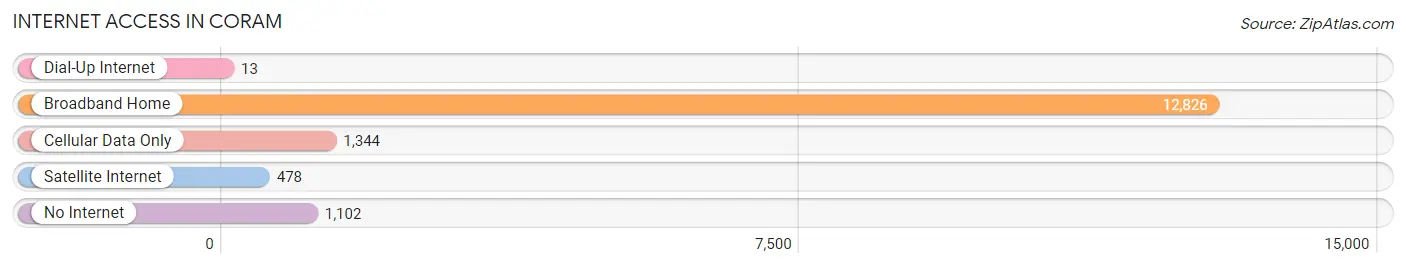
| Internet Type | # Households | % Households |
| Dial-Up Internet | 13 | 0.1% |
| Broadband Home | 12,826 | 82.8% |
| Cellular Data Only | 1,344 | 8.7% |
| Satellite Internet | 478 | 3.1% |
| No Internet | 1,102 | 7.1% |
| Total | 15,496 | 100.0% |
Coram Summary
Coram is a hamlet located in the Town of Brookhaven in Suffolk County, New York. It is located on the north shore of Long Island, approximately 60 miles east of New York City. The hamlet is bordered by Middle Island to the west, Yaphank to the east, and Port Jefferson Station to the south. As of the 2010 census, the population of Coram was estimated to be around 27,000.
History
The area that is now Coram was originally inhabited by the Setalcott Indians, a branch of the Algonquin tribe. The first European settlers arrived in the area in 1664, and the hamlet was officially established in 1709. The name Coram is derived from the name of an early settler, John Coram.
In the late 19th century, Coram was a popular summer resort destination for wealthy New Yorkers. The area was known for its beautiful beaches and lush forests. In the early 20th century, the hamlet began to develop into a residential community.
Geography
Coram is located in the Town of Brookhaven in Suffolk County, New York. It is located on the north shore of Long Island, approximately 60 miles east of New York City. The hamlet is bordered by Middle Island to the west, Yaphank to the east, and Port Jefferson Station to the south.
The terrain of Coram is mostly flat, with some rolling hills. The hamlet is located in the Pine Barrens, an area of dense pine forests and wetlands. The area is home to a variety of wildlife, including deer, foxes, and various species of birds.
Economy
The economy of Coram is largely based on the service industry. The hamlet is home to a variety of restaurants, retail stores, and other businesses. The area is also home to several industrial parks, which provide employment opportunities for local residents.
The hamlet is also home to several educational institutions, including Coram Elementary School, Coram Middle School, and Longwood High School. The area is also home to several medical facilities, including St. Charles Hospital and Coram Medical Center.
Demographics
As of the 2010 census, the population of Coram was estimated to be around 27,000. The racial makeup of the hamlet was 79.3% White, 11.2% African American, 4.2% Hispanic or Latino, and 5.3% other. The median household income was $68,945, and the median home value was $323,000.
The majority of Coram residents are of European descent, with a significant minority population of African Americans and Hispanics. The hamlet is also home to a small population of Asian Americans. The majority of Coram residents are Christian, with a small minority of Jewish and Muslim residents.
Common Questions
What is Per Capita Income in Coram?
Per Capita income in Coram is $46,480.
What is the Median Family Income in Coram?
Median Family Income in Coram is $119,410.
What is the Median Household income in Coram?
Median Household Income in Coram is $95,940.
What is Income or Wage Gap in Coram?
Income or Wage Gap in Coram is 23.4%.
Women in Coram earn 76.6 cents for every dollar earned by a man.
What is Inequality or Gini Index in Coram?
Inequality or Gini Index in Coram is 0.42.
What is the Total Population of Coram?
Total Population of Coram is 42,169.
What is the Total Male Population of Coram?
Total Male Population of Coram is 20,148.
What is the Total Female Population of Coram?
Total Female Population of Coram is 22,021.
What is the Ratio of Males per 100 Females in Coram?
There are 91.49 Males per 100 Females in Coram.
What is the Ratio of Females per 100 Males in Coram?
There are 109.30 Females per 100 Males in Coram.
What is the Median Population Age in Coram?
Median Population Age in Coram is 40.7 Years.
What is the Average Family Size in Coram
Average Family Size in Coram is 3.4 People.
What is the Average Household Size in Coram
Average Household Size in Coram is 2.7 People.
How Large is the Labor Force in Coram?
There are 22,872 People in the Labor Forcein in Coram.
What is the Percentage of People in the Labor Force in Coram?
66.8% of People are in the Labor Force in Coram.
What is the Unemployment Rate in Coram?
Unemployment Rate in Coram is 3.7%.