South Apopka, FL Map & Demographics
South Apopka Map
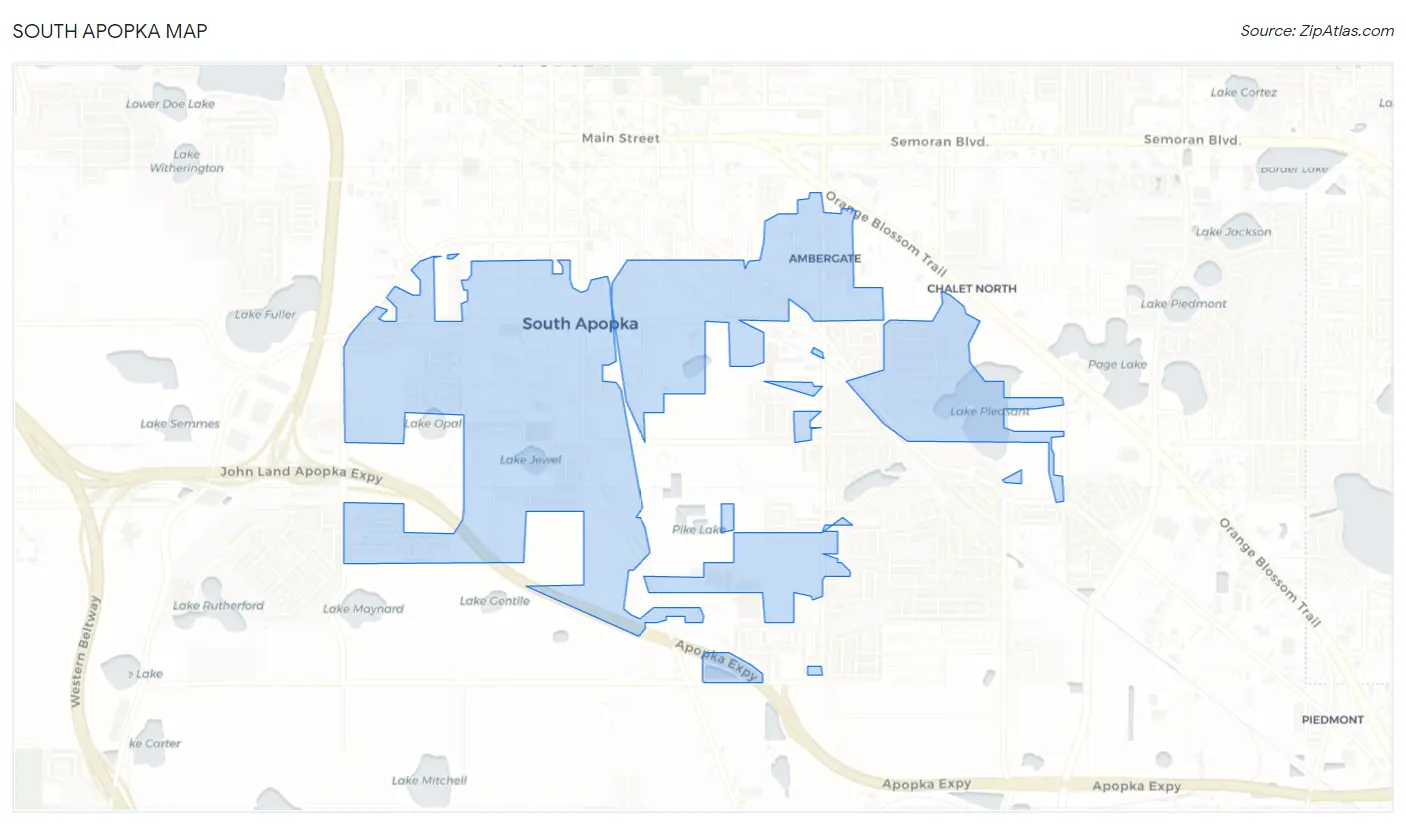
South Apopka Overview
$18,726
PER CAPITA INCOME
$63,482
AVG FAMILY INCOME
$44,056
AVG HOUSEHOLD INCOME
17.8%
WAGE / INCOME GAP [ % ]
82.2¢/ $1
WAGE / INCOME GAP [ $ ]
0.43
INEQUALITY / GINI INDEX
7,653
TOTAL POPULATION
3,866
MALE POPULATION
3,787
FEMALE POPULATION
102.09
MALES / 100 FEMALES
97.96
FEMALES / 100 MALES
33.8
MEDIAN AGE
3.8
AVG FAMILY SIZE
3.2
AVG HOUSEHOLD SIZE
3,104
LABOR FORCE [ PEOPLE ]
55.6%
PERCENT IN LABOR FORCE
5.4%
UNEMPLOYMENT RATE
Income in South Apopka
Income Overview in South Apopka
Per Capita Income in South Apopka is $18,726, while median incomes of families and households are $63,482 and $44,056 respectively.
| Characteristic | Number | Measure |
| Per Capita Income | 7,653 | $18,726 |
| Median Family Income | 1,695 | $63,482 |
| Mean Family Income | 1,695 | $62,201 |
| Median Household Income | 2,420 | $44,056 |
| Mean Household Income | 2,420 | $54,259 |
| Income Deficit | 1,695 | $0 |
| Wage / Income Gap (%) | 7,653 | 17.78% |
| Wage / Income Gap ($) | 7,653 | 82.22¢ per $1 |
| Gini / Inequality Index | 7,653 | 0.43 |
Earnings by Sex in South Apopka
Average Earnings in South Apopka are $26,536, $28,609 for men and $23,522 for women, a difference of 17.8%.
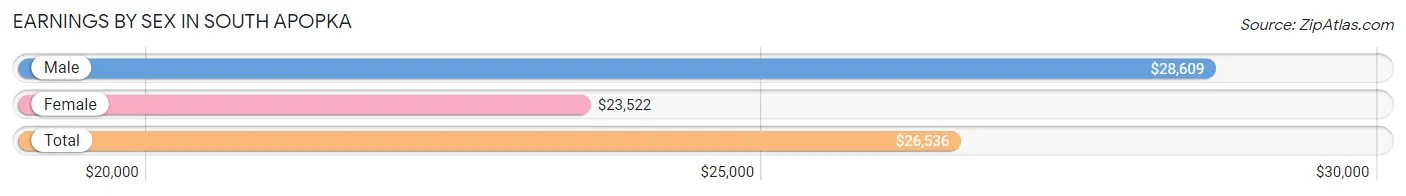
| Sex | Number | Average Earnings |
| Male | 1,492 (46.9%) | $28,609 |
| Female | 1,690 (53.1%) | $23,522 |
| Total | 3,182 (100.0%) | $26,536 |
Earnings by Sex by Income Bracket in South Apopka
The most common earnings brackets in South Apopka are $25,000 to $29,999 for men (239 | 16.0%) and $17,500 to $19,999 for women (263 | 15.6%).
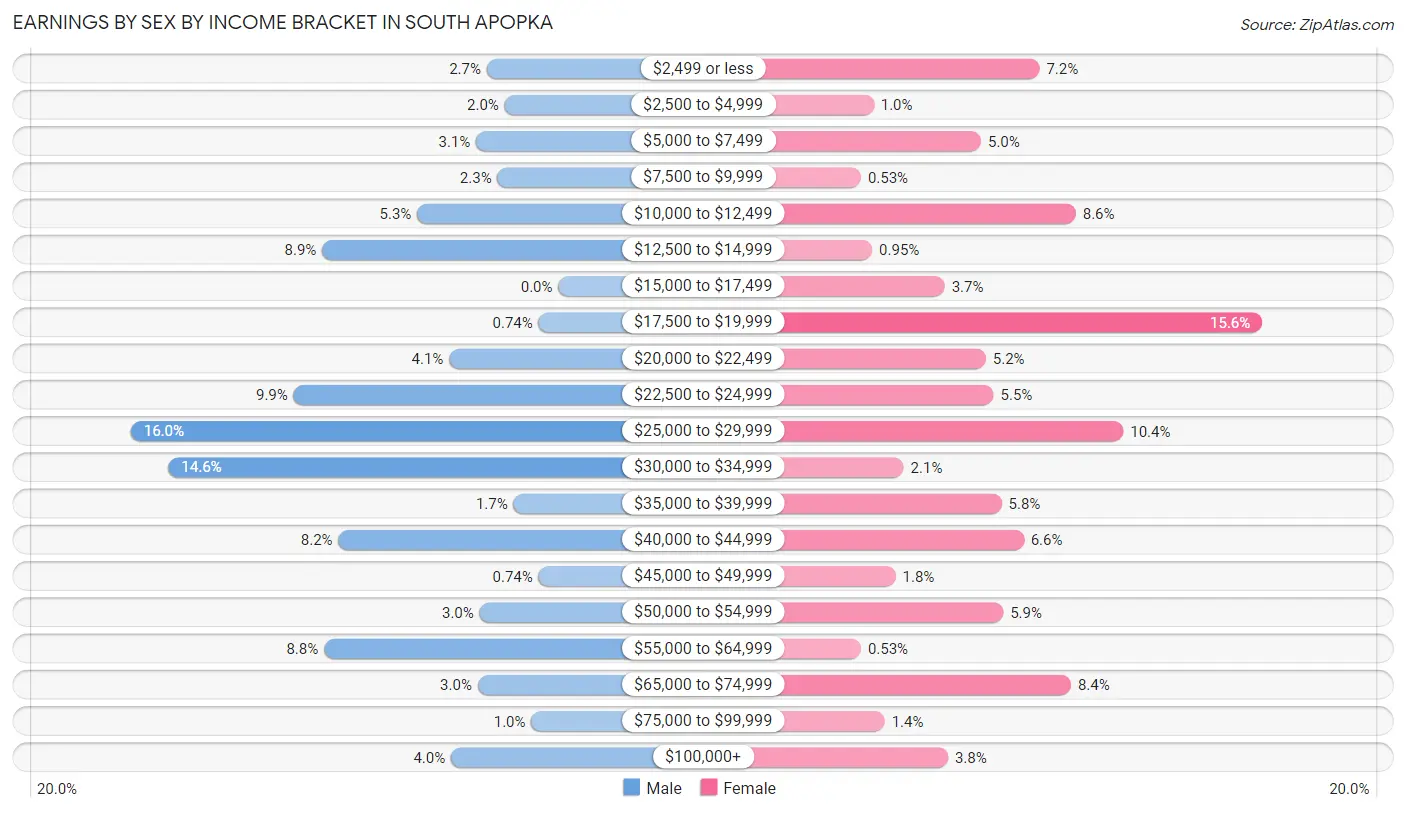
| Income | Male | Female |
| $2,499 or less | 40 (2.7%) | 122 (7.2%) |
| $2,500 to $4,999 | 30 (2.0%) | 17 (1.0%) |
| $5,000 to $7,499 | 46 (3.1%) | 85 (5.0%) |
| $7,500 to $9,999 | 34 (2.3%) | 9 (0.5%) |
| $10,000 to $12,499 | 79 (5.3%) | 145 (8.6%) |
| $12,500 to $14,999 | 132 (8.8%) | 16 (0.9%) |
| $15,000 to $17,499 | 0 (0.0%) | 62 (3.7%) |
| $17,500 to $19,999 | 11 (0.7%) | 263 (15.6%) |
| $20,000 to $22,499 | 61 (4.1%) | 88 (5.2%) |
| $22,500 to $24,999 | 148 (9.9%) | 93 (5.5%) |
| $25,000 to $29,999 | 239 (16.0%) | 175 (10.4%) |
| $30,000 to $34,999 | 218 (14.6%) | 36 (2.1%) |
| $35,000 to $39,999 | 25 (1.7%) | 98 (5.8%) |
| $40,000 to $44,999 | 123 (8.2%) | 112 (6.6%) |
| $45,000 to $49,999 | 11 (0.7%) | 31 (1.8%) |
| $50,000 to $54,999 | 44 (2.9%) | 99 (5.9%) |
| $55,000 to $64,999 | 131 (8.8%) | 9 (0.5%) |
| $65,000 to $74,999 | 45 (3.0%) | 142 (8.4%) |
| $75,000 to $99,999 | 15 (1.0%) | 24 (1.4%) |
| $100,000+ | 60 (4.0%) | 64 (3.8%) |
| Total | 1,492 (100.0%) | 1,690 (100.0%) |
Earnings by Sex by Educational Attainment in South Apopka
Average earnings in South Apopka are $29,605 for men and $24,651 for women, a difference of 16.7%. Men with an educational attainment of high school diploma enjoy the highest average annual earnings of $33,876, while those with bachelor's degree education earn the least with $25,556. Women with an educational attainment of college or associate's degree earn the most with the average annual earnings of $54,600, while those with less than high school education have the smallest earnings of $11,095.
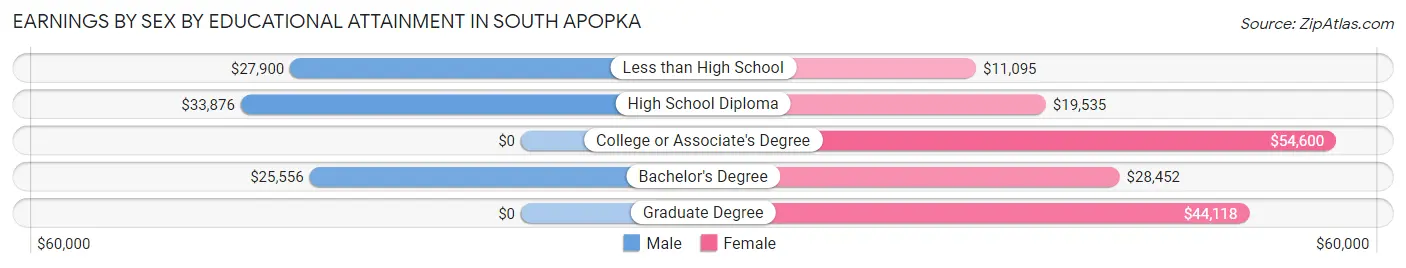
| Educational Attainment | Male Income | Female Income |
| Less than High School | $27,900 | $11,095 |
| High School Diploma | $33,876 | $19,535 |
| College or Associate's Degree | - | - |
| Bachelor's Degree | $25,556 | $28,452 |
| Graduate Degree | - | - |
| Total | $29,605 | $24,651 |
Family Income in South Apopka
Family Income Brackets in South Apopka
According to the South Apopka family income data, there are 398 families falling into the $50,000 to $74,999 income range, which is the most common income bracket and makes up 23.5% of all families.
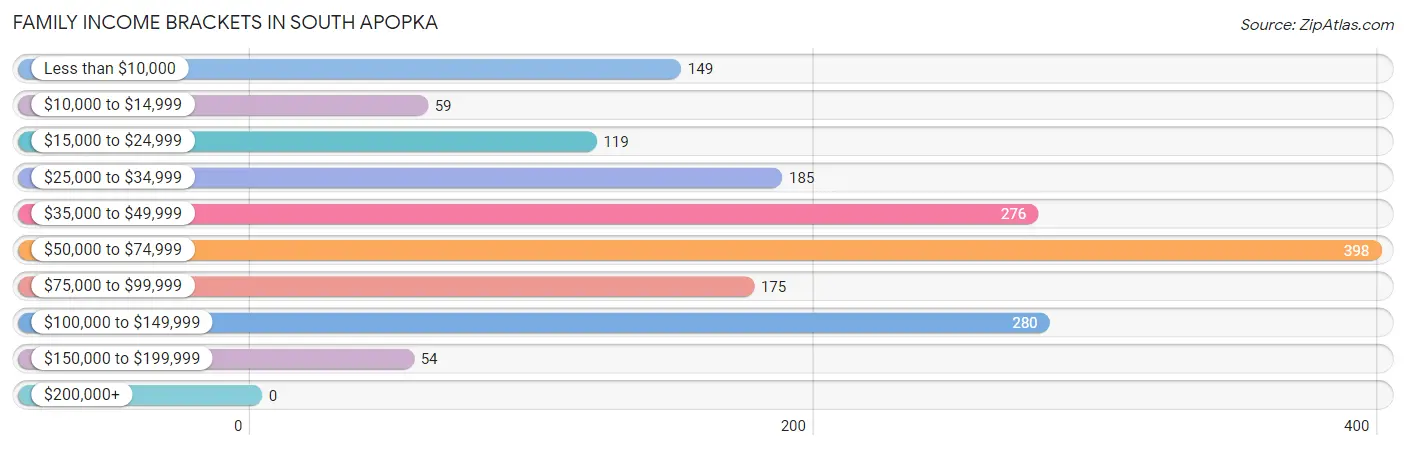
| Income Bracket | # Families | % Families |
| Less than $10,000 | 149 | 8.8% |
| $10,000 to $14,999 | 59 | 3.5% |
| $15,000 to $24,999 | 119 | 7.0% |
| $25,000 to $34,999 | 185 | 10.9% |
| $35,000 to $49,999 | 276 | 16.3% |
| $50,000 to $74,999 | 398 | 23.5% |
| $75,000 to $99,999 | 175 | 10.3% |
| $100,000 to $149,999 | 280 | 16.5% |
| $150,000 to $199,999 | 54 | 3.2% |
| $200,000+ | 0 | 0.0% |
Family Income by Famaliy Size in South Apopka
5-person families (203 | 12.0%) account for the highest median family income in South Apopka with $95,224 per family, while 2-person families (792 | 46.7%) have the highest median income of $32,951 per family member.
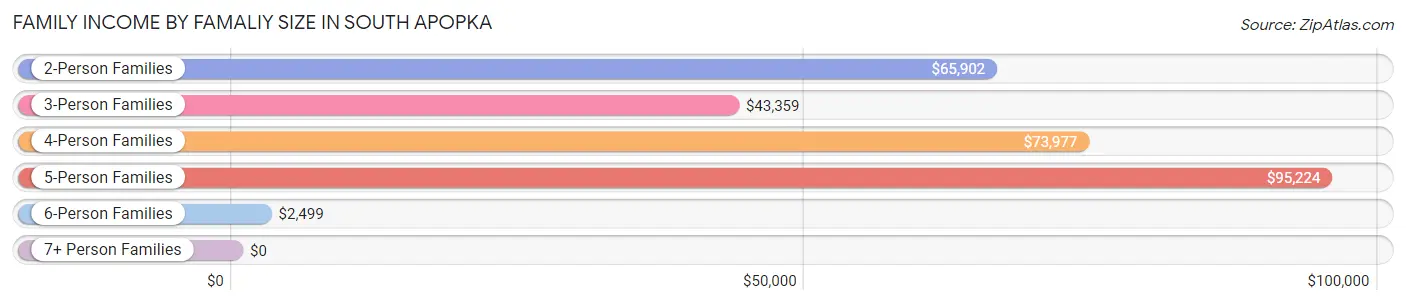
| Income Bracket | # Families | Median Income |
| 2-Person Families | 792 (46.7%) | $65,902 |
| 3-Person Families | 282 (16.6%) | $43,359 |
| 4-Person Families | 231 (13.6%) | $73,977 |
| 5-Person Families | 203 (12.0%) | $95,224 |
| 6-Person Families | 145 (8.6%) | $2,499 |
| 7+ Person Families | 42 (2.5%) | $0 |
| Total | 1,695 (100.0%) | $63,482 |
Family Income by Number of Earners in South Apopka
The median family income in South Apopka is $63,482, with families comprising 3+ earners (134) having the highest median family income of $96,859, while families with no earners (232) have the lowest median family income of $2,499, accounting for 7.9% and 13.7% of families, respectively.
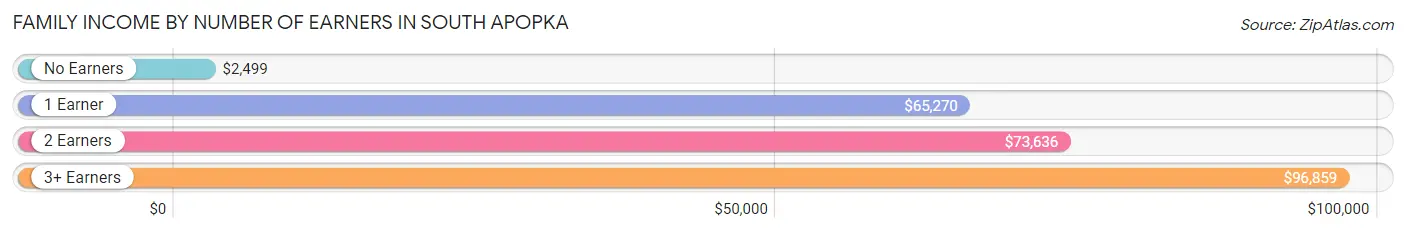
| Number of Earners | # Families | Median Income |
| No Earners | 232 (13.7%) | $2,499 |
| 1 Earner | 855 (50.4%) | $65,270 |
| 2 Earners | 474 (28.0%) | $73,636 |
| 3+ Earners | 134 (7.9%) | $96,859 |
| Total | 1,695 (100.0%) | $63,482 |
Household Income in South Apopka
Household Income Brackets in South Apopka
With 479 households falling in the category, the $50,000 to $74,999 income range is the most frequent in South Apopka, accounting for 19.8% of all households. In contrast, only 12 households (0.5%) fall into the $200,000+ income bracket, making it the least populous group.
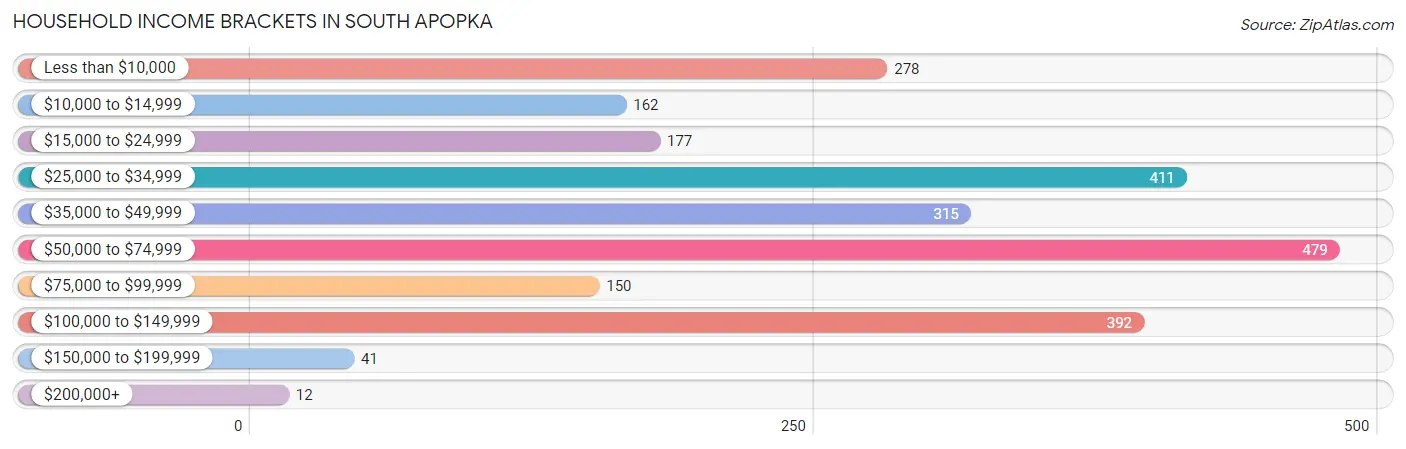
| Income Bracket | # Households | % Households |
| Less than $10,000 | 278 | 11.5% |
| $10,000 to $14,999 | 162 | 6.7% |
| $15,000 to $24,999 | 177 | 7.3% |
| $25,000 to $34,999 | 411 | 17.0% |
| $35,000 to $49,999 | 315 | 13.0% |
| $50,000 to $74,999 | 479 | 19.8% |
| $75,000 to $99,999 | 150 | 6.2% |
| $100,000 to $149,999 | 392 | 16.2% |
| $150,000 to $199,999 | 41 | 1.7% |
| $200,000+ | 12 | 0.5% |
Household Income by Householder Age in South Apopka
The median household income in South Apopka is $44,056, with the highest median household income of $65,015 found in the 65+ years age bracket for the primary householder. A total of 677 households (28.0%) fall into this category. Meanwhile, the 15 to 24 years age bracket for the primary householder has the lowest median household income of $2,499, with 104 households (4.3%) in this group.
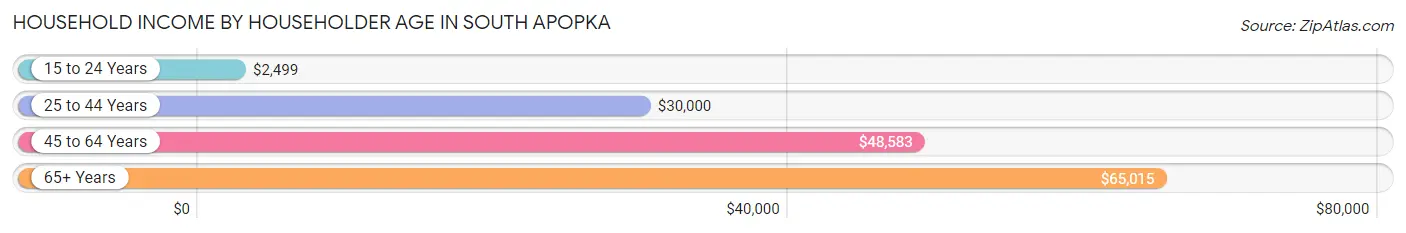
| Income Bracket | # Households | Median Income |
| 15 to 24 Years | 104 (4.3%) | $2,499 |
| 25 to 44 Years | 804 (33.2%) | $30,000 |
| 45 to 64 Years | 835 (34.5%) | $48,583 |
| 65+ Years | 677 (28.0%) | $65,015 |
| Total | 2,420 (100.0%) | $44,056 |
Poverty in South Apopka
Income Below Poverty by Sex and Age in South Apopka
With 31.5% poverty level for males and 37.4% for females among the residents of South Apopka, 6 to 11 year old males and 15 year old females are the most vulnerable to poverty, with 445 males (74.0%) and 49 females (74.2%) in their respective age groups living below the poverty level.
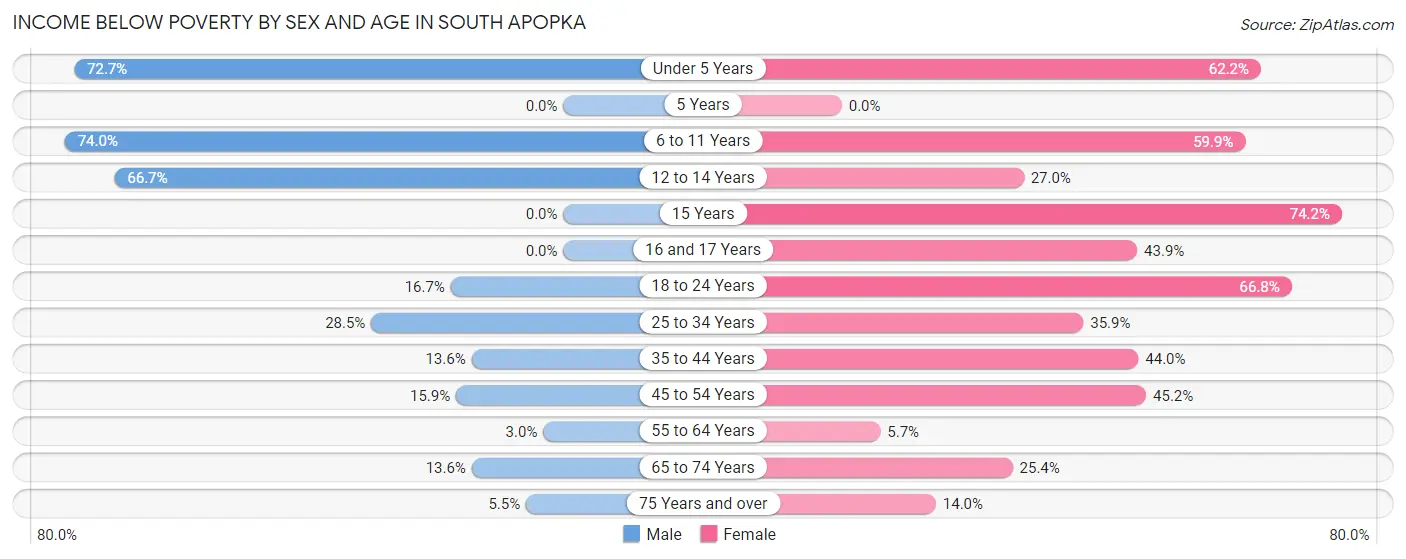
| Age Bracket | Male | Female |
| Under 5 Years | 335 (72.7%) | 196 (62.2%) |
| 5 Years | 0 (0.0%) | 0 (0.0%) |
| 6 to 11 Years | 445 (74.0%) | 233 (59.9%) |
| 12 to 14 Years | 22 (66.7%) | 47 (27.0%) |
| 15 Years | 0 (0.0%) | 49 (74.2%) |
| 16 and 17 Years | 0 (0.0%) | 25 (43.9%) |
| 18 to 24 Years | 43 (16.7%) | 175 (66.8%) |
| 25 to 34 Years | 198 (28.5%) | 199 (35.9%) |
| 35 to 44 Years | 42 (13.6%) | 170 (44.0%) |
| 45 to 54 Years | 61 (15.9%) | 108 (45.2%) |
| 55 to 64 Years | 11 (3.0%) | 31 (5.7%) |
| 65 to 74 Years | 40 (13.6%) | 158 (25.4%) |
| 75 Years and over | 22 (5.5%) | 25 (14.0%) |
| Total | 1,219 (31.5%) | 1,416 (37.4%) |
Income Above Poverty by Sex and Age in South Apopka
According to the poverty statistics in South Apopka, males aged 5 years and females aged 55 to 64 years are the age groups that are most secure financially, with 100.0% of males and 94.3% of females in these age groups living above the poverty line.
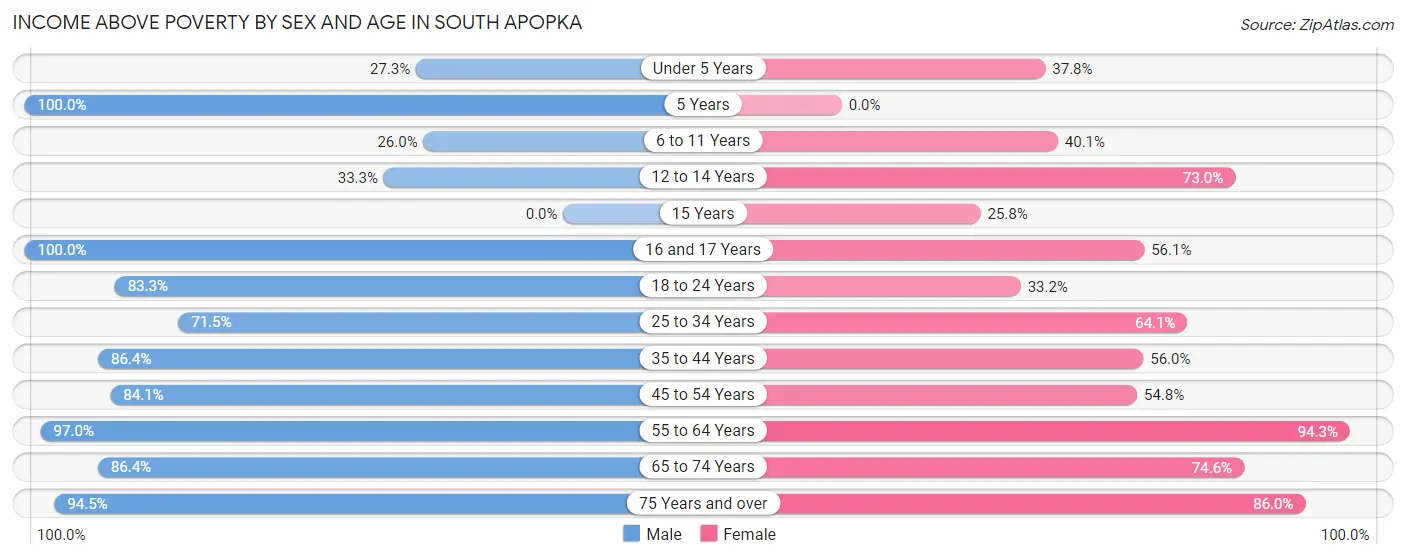
| Age Bracket | Male | Female |
| Under 5 Years | 126 (27.3%) | 119 (37.8%) |
| 5 Years | 32 (100.0%) | 0 (0.0%) |
| 6 to 11 Years | 156 (26.0%) | 156 (40.1%) |
| 12 to 14 Years | 11 (33.3%) | 127 (73.0%) |
| 15 Years | 0 (0.0%) | 17 (25.8%) |
| 16 and 17 Years | 38 (100.0%) | 32 (56.1%) |
| 18 to 24 Years | 214 (83.3%) | 87 (33.2%) |
| 25 to 34 Years | 496 (71.5%) | 356 (64.1%) |
| 35 to 44 Years | 266 (86.4%) | 216 (56.0%) |
| 45 to 54 Years | 322 (84.1%) | 131 (54.8%) |
| 55 to 64 Years | 357 (97.0%) | 511 (94.3%) |
| 65 to 74 Years | 254 (86.4%) | 465 (74.6%) |
| 75 Years and over | 375 (94.5%) | 154 (86.0%) |
| Total | 2,647 (68.5%) | 2,371 (62.6%) |
Income Below Poverty Among Married-Couple Families in South Apopka
The poverty statistics for married-couple families in South Apopka show that 7.9% or 71 of the total 904 families live below the poverty line. Families with 1 or 2 children have the highest poverty rate of 27.3%, comprising of 60 families. On the other hand, families with 3 or 4 children have the lowest poverty rate of 0.0%, which includes 0 families.
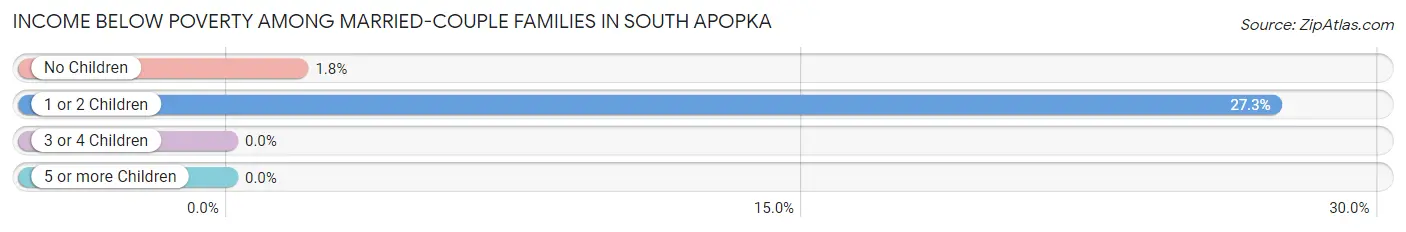
| Children | Above Poverty | Below Poverty |
| No Children | 587 (98.2%) | 11 (1.8%) |
| 1 or 2 Children | 160 (72.7%) | 60 (27.3%) |
| 3 or 4 Children | 86 (100.0%) | 0 (0.0%) |
| 5 or more Children | 0 (0.0%) | 0 (0.0%) |
| Total | 833 (92.1%) | 71 (7.9%) |
Income Below Poverty Among Single-Parent Households in South Apopka
According to the poverty data in South Apopka, 8.2% or 11 single-father households and 46.3% or 304 single-mother households are living below the poverty line. Among single-father households, those with 3 or 4 children have the highest poverty rate, with 11 households (100.0%) experiencing poverty. Likewise, among single-mother households, those with 3 or 4 children have the highest poverty rate, with 122 households (100.0%) falling below the poverty line.
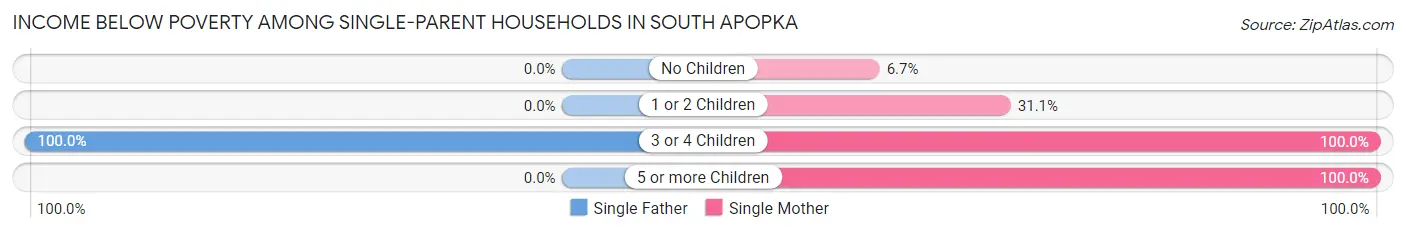
| Children | Single Father | Single Mother |
| No Children | 0 (0.0%) | 11 (6.7%) |
| 1 or 2 Children | 0 (0.0%) | 90 (31.1%) |
| 3 or 4 Children | 11 (100.0%) | 122 (100.0%) |
| 5 or more Children | 0 (0.0%) | 81 (100.0%) |
| Total | 11 (8.2%) | 304 (46.3%) |
Income Below Poverty Among Married-Couple vs Single-Parent Households in South Apopka
The poverty data for South Apopka shows that 71 of the married-couple family households (7.9%) and 315 of the single-parent households (39.8%) are living below the poverty level. Within the married-couple family households, those with 1 or 2 children have the highest poverty rate, with 60 households (27.3%) falling below the poverty line. Among the single-parent households, those with 3 or 4 children have the highest poverty rate, with 133 household (100.0%) living below poverty.
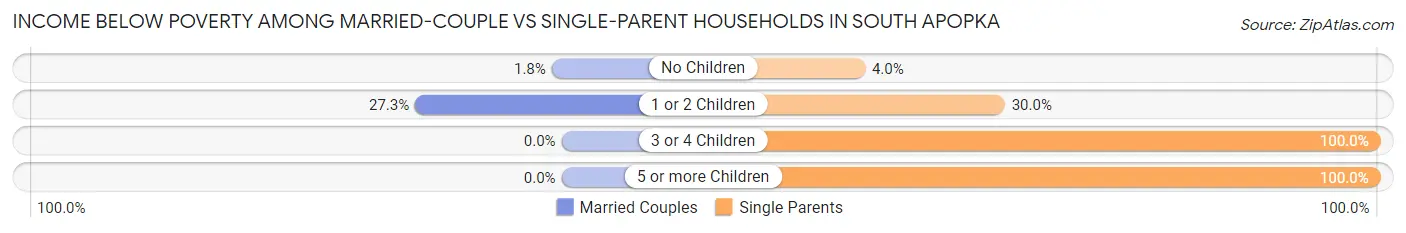
| Children | Married-Couple Families | Single-Parent Households |
| No Children | 11 (1.8%) | 11 (4.0%) |
| 1 or 2 Children | 60 (27.3%) | 90 (30.0%) |
| 3 or 4 Children | 0 (0.0%) | 133 (100.0%) |
| 5 or more Children | 0 (0.0%) | 81 (100.0%) |
| Total | 71 (7.9%) | 315 (39.8%) |
Race in South Apopka
The most populous races in South Apopka are Black / African American (4,576 | 59.8%), White / Caucasian (1,999 | 26.1%), and Hispanic or Latino (1,982 | 25.9%).
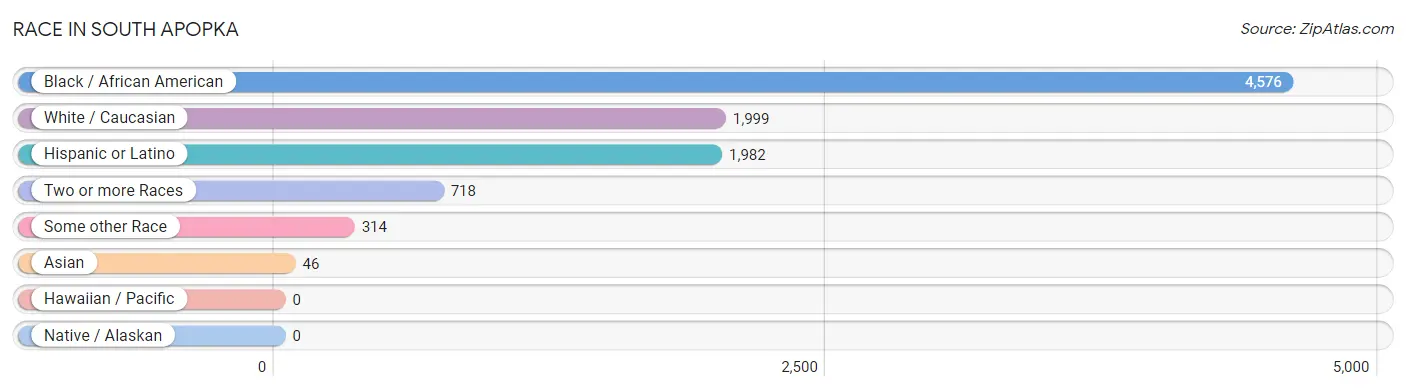
| Race | # Population | % Population |
| Asian | 46 | 0.6% |
| Black / African American | 4,576 | 59.8% |
| Hawaiian / Pacific | 0 | 0.0% |
| Hispanic or Latino | 1,982 | 25.9% |
| Native / Alaskan | 0 | 0.0% |
| White / Caucasian | 1,999 | 26.1% |
| Two or more Races | 718 | 9.4% |
| Some other Race | 314 | 4.1% |
| Total | 7,653 | 100.0% |
Ancestry in South Apopka
The most populous ancestries reported in South Apopka are American (2,334 | 30.5%), Subsaharan African (580 | 7.6%), Mexican (574 | 7.5%), African (547 | 7.1%), and Central American (431 | 5.6%), together accounting for 58.4% of all South Apopka residents.
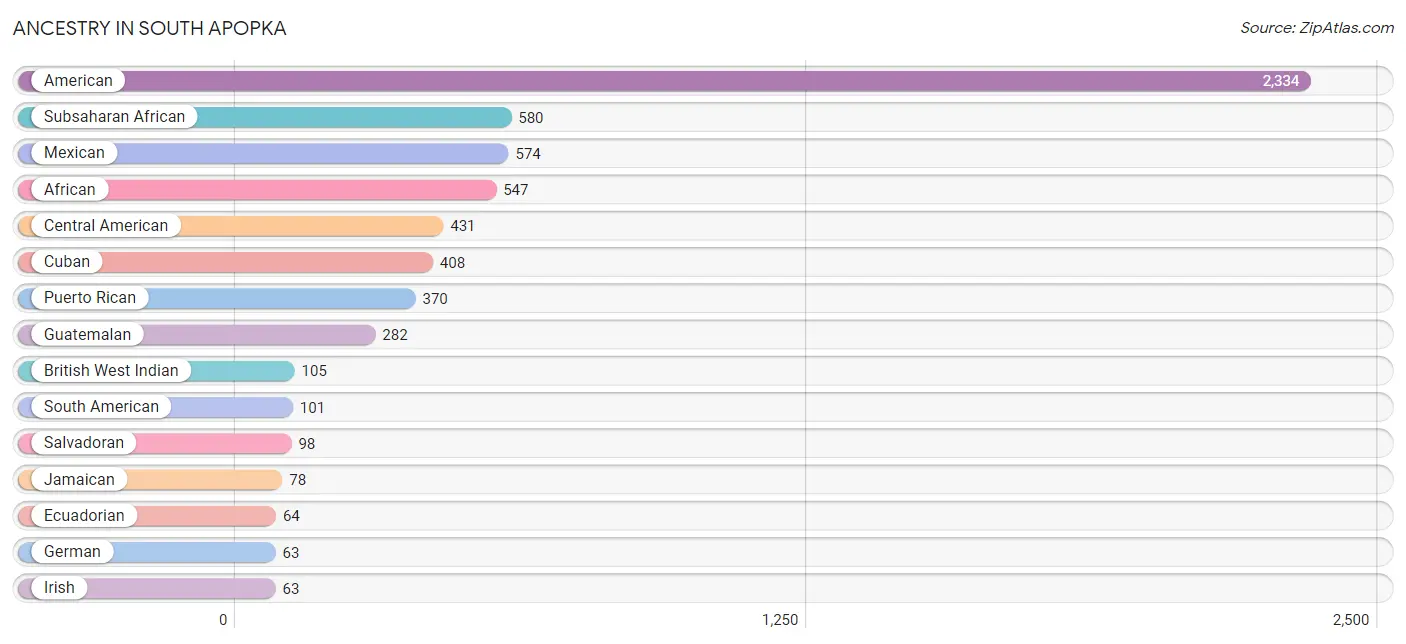
| Ancestry | # Population | % Population |
| African | 547 | 7.1% |
| American | 2,334 | 30.5% |
| Argentinean | 10 | 0.1% |
| Brazilian | 8 | 0.1% |
| British West Indian | 105 | 1.4% |
| Central American | 431 | 5.6% |
| Cherokee | 29 | 0.4% |
| Colombian | 13 | 0.2% |
| Cuban | 408 | 5.3% |
| Dominican | 21 | 0.3% |
| Ecuadorian | 64 | 0.8% |
| English | 19 | 0.3% |
| European | 57 | 0.7% |
| French | 43 | 0.6% |
| German | 63 | 0.8% |
| Guatemalan | 282 | 3.7% |
| Honduran | 51 | 0.7% |
| Indian (Asian) | 16 | 0.2% |
| Irish | 63 | 0.8% |
| Italian | 17 | 0.2% |
| Jamaican | 78 | 1.0% |
| Korean | 30 | 0.4% |
| Mexican | 574 | 7.5% |
| Peruvian | 14 | 0.2% |
| Portuguese | 13 | 0.2% |
| Puerto Rican | 370 | 4.8% |
| Salvadoran | 98 | 1.3% |
| South American | 101 | 1.3% |
| Subsaharan African | 580 | 7.6% |
| West Indian | 44 | 0.6% | View All 30 Rows |
Immigrants in South Apopka
The most numerous immigrant groups reported in South Apopka came from Latin America (1,198 | 15.7%), Central America (561 | 7.3%), Caribbean (495 | 6.5%), Mexico (400 | 5.2%), and Cuba (297 | 3.9%), together accounting for 38.6% of all South Apopka residents.
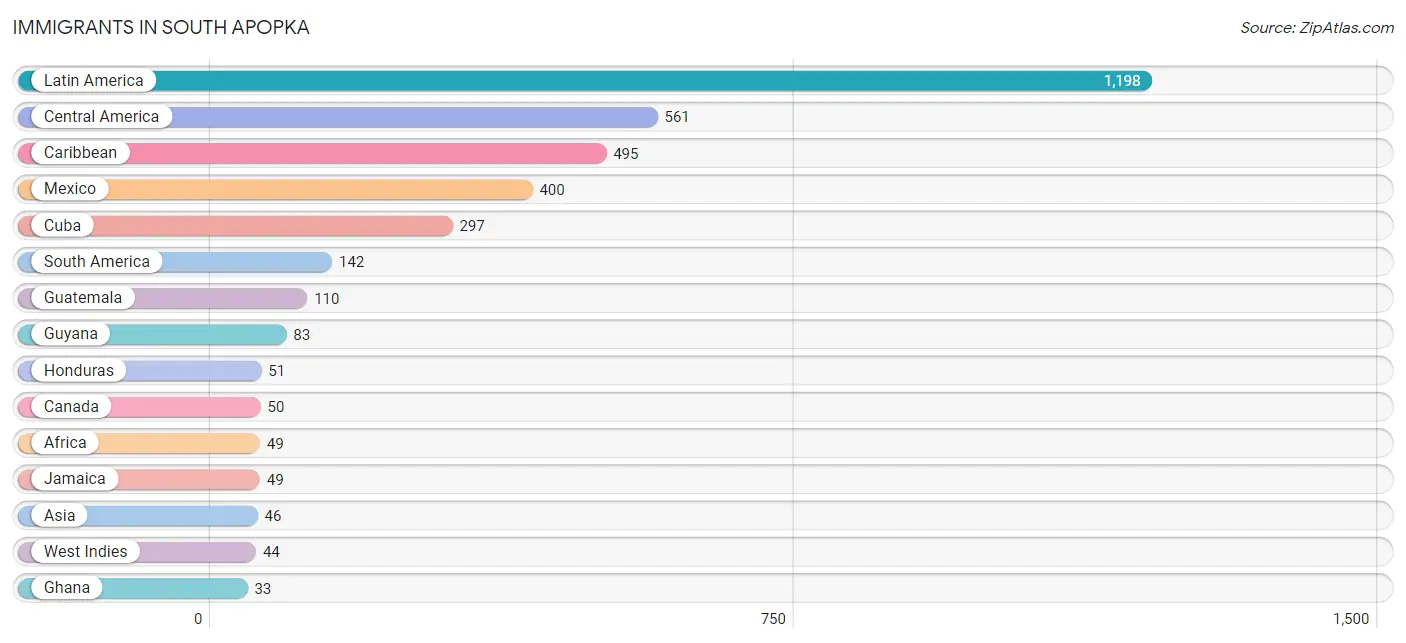
| Immigration Origin | # Population | % Population |
| Africa | 49 | 0.6% |
| Argentina | 10 | 0.1% |
| Asia | 46 | 0.6% |
| Canada | 50 | 0.6% |
| Caribbean | 495 | 6.5% |
| Central America | 561 | 7.3% |
| Colombia | 13 | 0.2% |
| Cuba | 297 | 3.9% |
| Eastern Africa | 16 | 0.2% |
| Ecuador | 22 | 0.3% |
| Europe | 13 | 0.2% |
| Germany | 13 | 0.2% |
| Ghana | 33 | 0.4% |
| Guatemala | 110 | 1.4% |
| Guyana | 83 | 1.1% |
| Honduras | 51 | 0.7% |
| India | 16 | 0.2% |
| Jamaica | 49 | 0.6% |
| Kenya | 16 | 0.2% |
| Latin America | 1,198 | 15.7% |
| Mexico | 400 | 5.2% |
| Peru | 14 | 0.2% |
| Philippines | 30 | 0.4% |
| South America | 142 | 1.9% |
| South Central Asia | 16 | 0.2% |
| South Eastern Asia | 30 | 0.4% |
| West Indies | 44 | 0.6% |
| Western Africa | 33 | 0.4% |
| Western Europe | 13 | 0.2% | View All 29 Rows |
Sex and Age in South Apopka
Sex and Age in South Apopka
The most populous age groups in South Apopka are 5 to 9 Years (538 | 13.9%) for men and 70 to 74 Years (397 | 10.5%) for women.
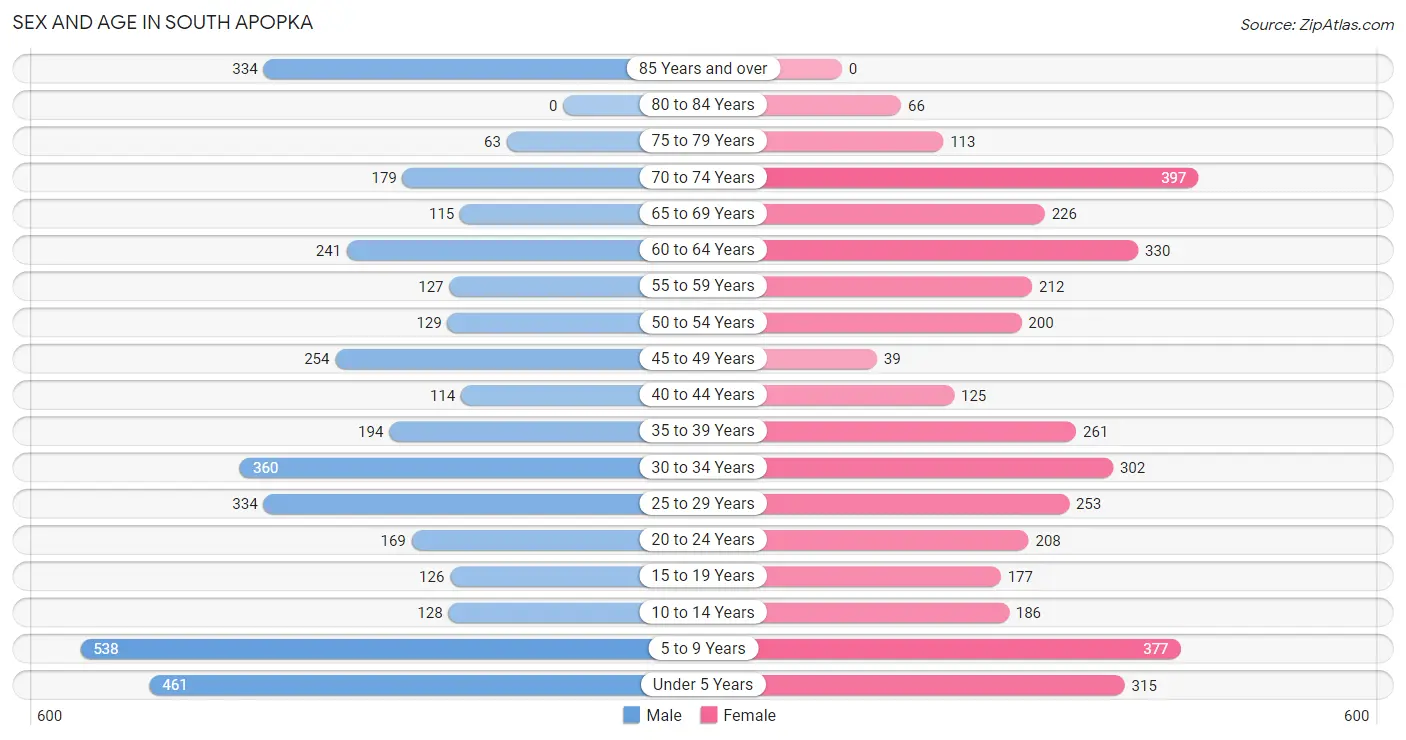
| Age Bracket | Male | Female |
| Under 5 Years | 461 (11.9%) | 315 (8.3%) |
| 5 to 9 Years | 538 (13.9%) | 377 (10.0%) |
| 10 to 14 Years | 128 (3.3%) | 186 (4.9%) |
| 15 to 19 Years | 126 (3.3%) | 177 (4.7%) |
| 20 to 24 Years | 169 (4.4%) | 208 (5.5%) |
| 25 to 29 Years | 334 (8.6%) | 253 (6.7%) |
| 30 to 34 Years | 360 (9.3%) | 302 (8.0%) |
| 35 to 39 Years | 194 (5.0%) | 261 (6.9%) |
| 40 to 44 Years | 114 (2.9%) | 125 (3.3%) |
| 45 to 49 Years | 254 (6.6%) | 39 (1.0%) |
| 50 to 54 Years | 129 (3.3%) | 200 (5.3%) |
| 55 to 59 Years | 127 (3.3%) | 212 (5.6%) |
| 60 to 64 Years | 241 (6.2%) | 330 (8.7%) |
| 65 to 69 Years | 115 (3.0%) | 226 (6.0%) |
| 70 to 74 Years | 179 (4.6%) | 397 (10.5%) |
| 75 to 79 Years | 63 (1.6%) | 113 (3.0%) |
| 80 to 84 Years | 0 (0.0%) | 66 (1.7%) |
| 85 Years and over | 334 (8.6%) | 0 (0.0%) |
| Total | 3,866 (100.0%) | 3,787 (100.0%) |
Families and Households in South Apopka
Median Family Size in South Apopka
The median family size in South Apopka is 3.83 persons per family, with single female/mother families (656 | 38.7%) accounting for the largest median family size of 4.66 persons per family. On the other hand, single male/father families (135 | 8.0%) represent the smallest median family size with 2.83 persons per family.
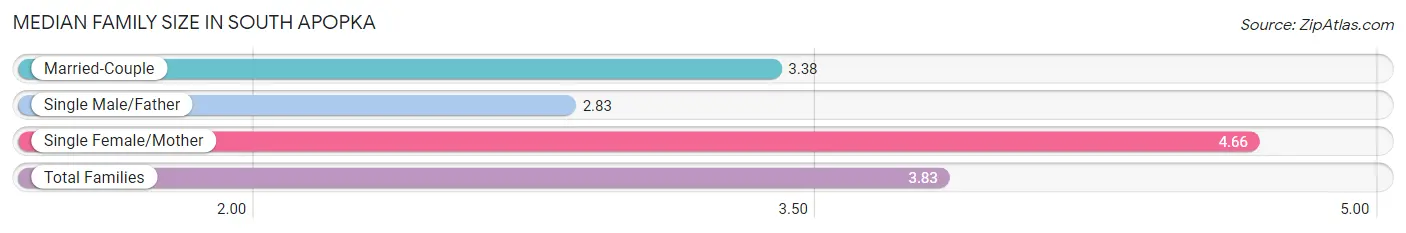
| Family Type | # Families | Family Size |
| Married-Couple | 904 (53.3%) | 3.38 |
| Single Male/Father | 135 (8.0%) | 2.83 |
| Single Female/Mother | 656 (38.7%) | 4.66 |
| Total Families | 1,695 (100.0%) | 3.83 |
Median Household Size in South Apopka
The median household size in South Apopka is 3.16 persons per household, with single female/mother households (656 | 27.1%) accounting for the largest median household size of 4.78 persons per household. non-family households (725 | 30.0%) represent the smallest median household size with 1.35 persons per household.
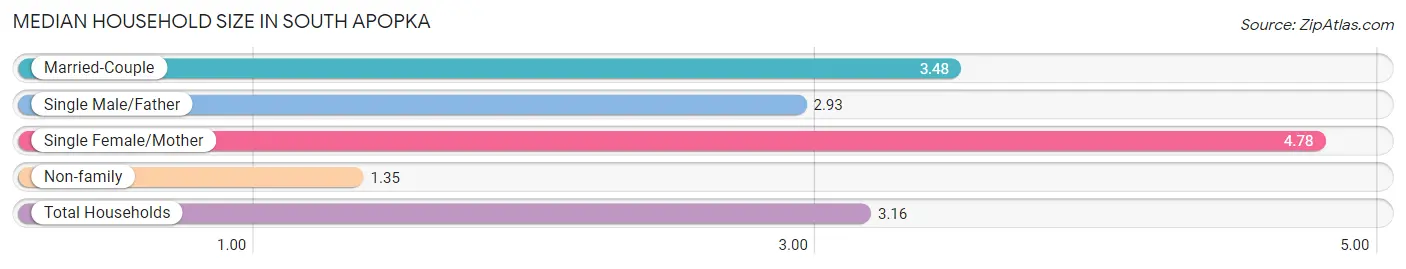
| Household Type | # Households | Household Size |
| Married-Couple | 904 (37.4%) | 3.48 |
| Single Male/Father | 135 (5.6%) | 2.93 |
| Single Female/Mother | 656 (27.1%) | 4.78 |
| Non-family | 725 (30.0%) | 1.35 |
| Total Households | 2,420 (100.0%) | 3.16 |
Household Size by Marriage Status in South Apopka
Out of a total of 2,420 households in South Apopka, 1,695 (70.0%) are family households, while 725 (30.0%) are nonfamily households. The most numerous type of family households are 2-person households, comprising 733, and the most common type of nonfamily households are 1-person households, comprising 527.
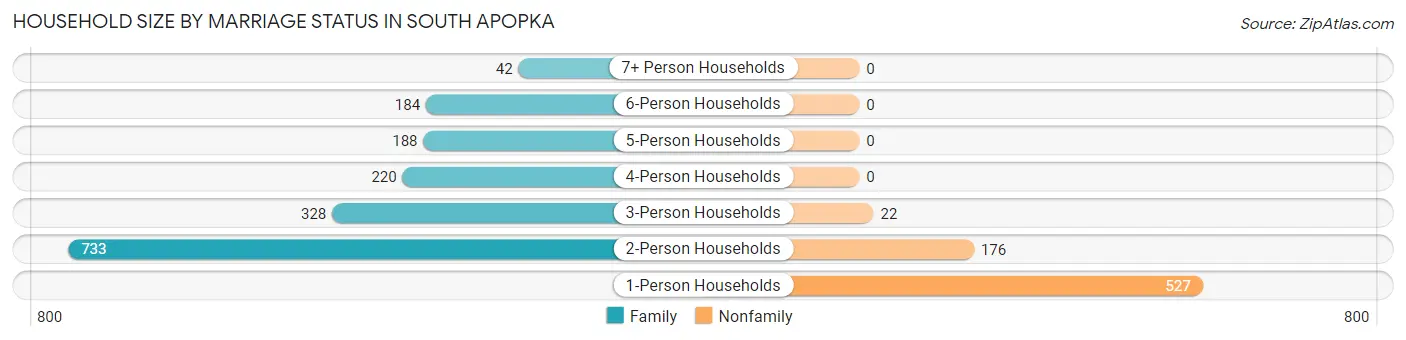
| Household Size | Family Households | Nonfamily Households |
| 1-Person Households | - | 527 (21.8%) |
| 2-Person Households | 733 (30.3%) | 176 (7.3%) |
| 3-Person Households | 328 (13.6%) | 22 (0.9%) |
| 4-Person Households | 220 (9.1%) | 0 (0.0%) |
| 5-Person Households | 188 (7.8%) | 0 (0.0%) |
| 6-Person Households | 184 (7.6%) | 0 (0.0%) |
| 7+ Person Households | 42 (1.7%) | 0 (0.0%) |
| Total | 1,695 (70.0%) | 725 (30.0%) |
Female Fertility in South Apopka
Fertility by Age in South Apopka
Average fertility rate in South Apopka is 43.0 births per 1,000 women. Women in the age bracket of 35 to 50 years have the highest fertility rate with 59.0 births per 1,000 women. Women in the age bracket of 20 to 34 years acount for 52.5% of all women with births.
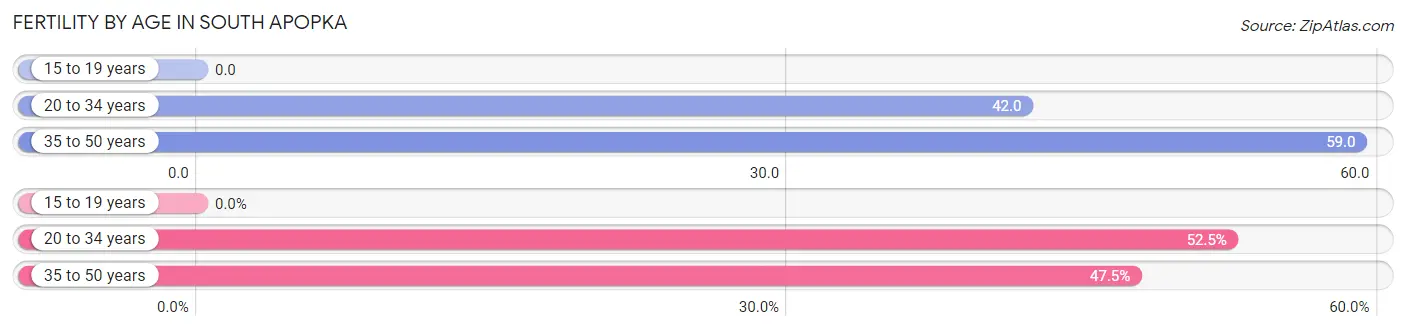
| Age Bracket | Women with Births | Births / 1,000 Women |
| 15 to 19 years | 0 (0.0%) | 0.0 |
| 20 to 34 years | 32 (52.5%) | 42.0 |
| 35 to 50 years | 29 (47.5%) | 59.0 |
| Total | 61 (100.0%) | 43.0 |
Fertility by Age by Marriage Status in South Apopka
47.5% of women with births (61) in South Apopka are married. The highest percentage of unmarried women with births falls into 20 to 34 years age bracket with 100.0% of them unmarried at the time of birth, while the lowest percentage of unmarried women with births belong to 35 to 50 years age bracket with 0.0% of them unmarried.
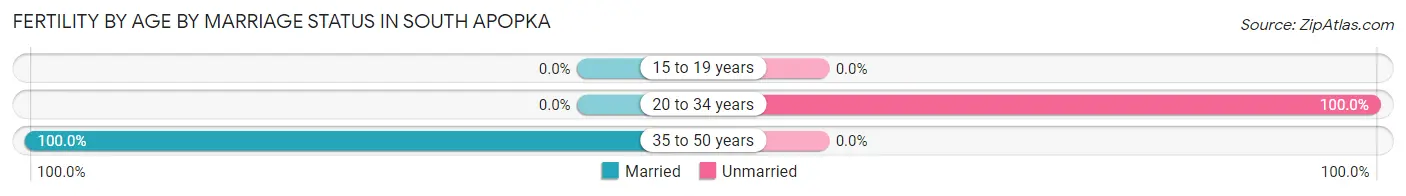
| Age Bracket | Married | Unmarried |
| 15 to 19 years | 0 (0.0%) | 0 (0.0%) |
| 20 to 34 years | 0 (0.0%) | 32 (100.0%) |
| 35 to 50 years | 29 (100.0%) | 0 (0.0%) |
| Total | 29 (47.5%) | 32 (52.5%) |
Fertility by Education in South Apopka
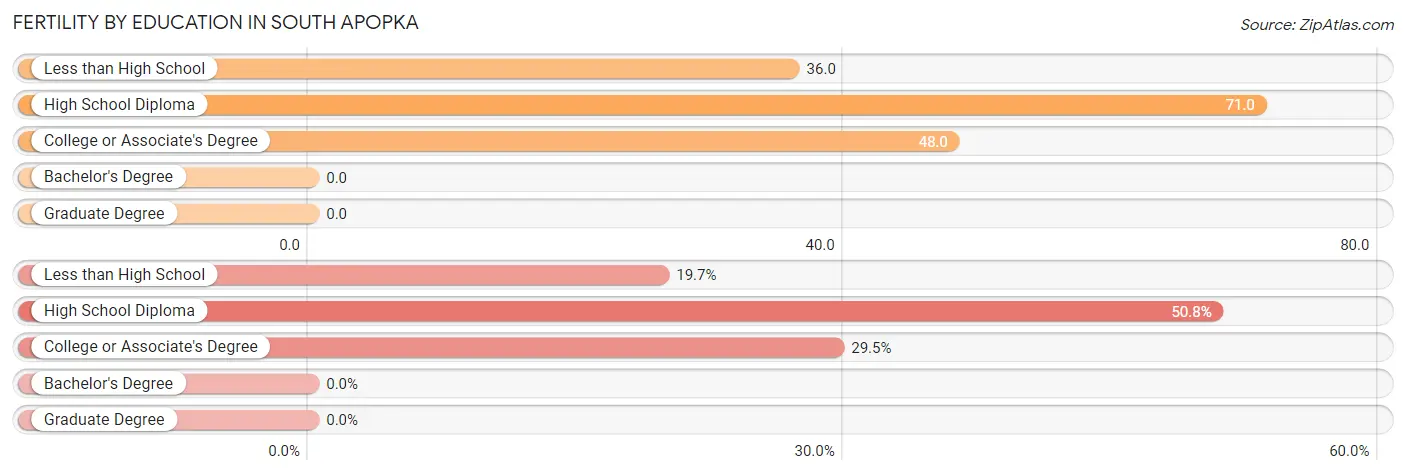
| Educational Attainment | Women with Births | Births / 1,000 Women |
| Less than High School | 12 (19.7%) | 36.0 |
| High School Diploma | 31 (50.8%) | 71.0 |
| College or Associate's Degree | 18 (29.5%) | 48.0 |
| Bachelor's Degree | 0 (0.0%) | 0.0 |
| Graduate Degree | 0 (0.0%) | 0.0 |
| Total | 61 (100.0%) | 43.0 |
Fertility by Education by Marriage Status in South Apopka
52.5% of women with births in South Apopka are unmarried. Women with the educational attainment of less than high school are most likely to be married with 100.0% of them married at childbirth, while women with the educational attainment of college or associate's degree are least likely to be married with 100.0% of them unmarried at childbirth.
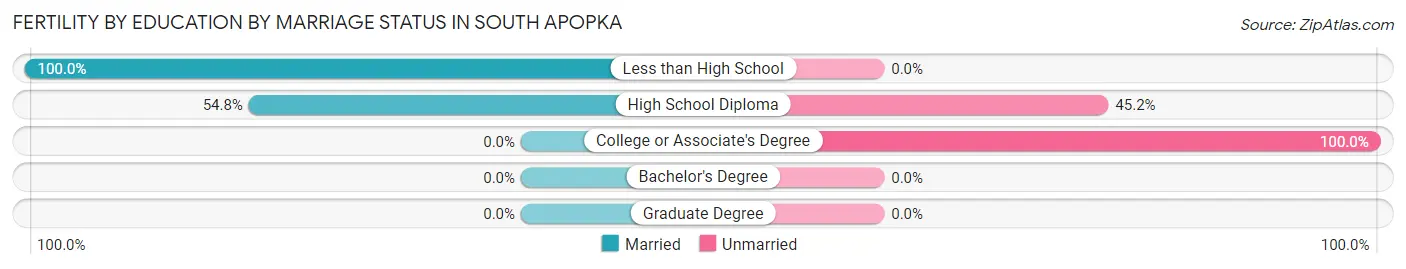
| Educational Attainment | Married | Unmarried |
| Less than High School | 12 (100.0%) | 0 (0.0%) |
| High School Diploma | 17 (54.8%) | 14 (45.2%) |
| College or Associate's Degree | 0 (0.0%) | 18 (100.0%) |
| Bachelor's Degree | 0 (0.0%) | 0 (0.0%) |
| Graduate Degree | 0 (0.0%) | 0 (0.0%) |
| Total | 29 (47.5%) | 32 (52.5%) |
Employment Characteristics in South Apopka
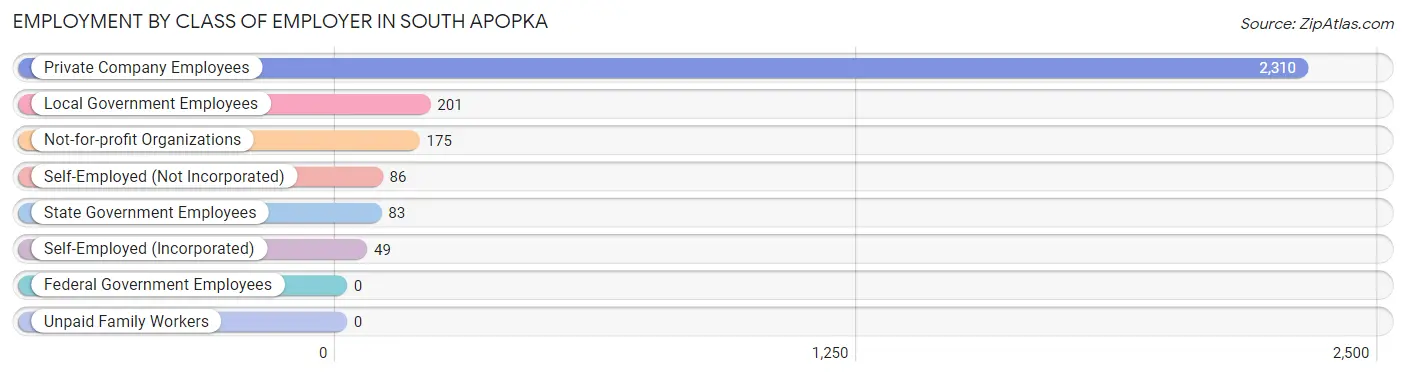
Employment by Class of Employer in South Apopka
Among the 2,904 employed individuals in South Apopka, private company employees (2,310 | 79.5%), local government employees (201 | 6.9%), and not-for-profit organizations (175 | 6.0%) make up the most common classes of employment.
| Employer Class | # Employees | % Employees |
| Private Company Employees | 2,310 | 79.5% |
| Self-Employed (Incorporated) | 49 | 1.7% |
| Self-Employed (Not Incorporated) | 86 | 3.0% |
| Not-for-profit Organizations | 175 | 6.0% |
| Local Government Employees | 201 | 6.9% |
| State Government Employees | 83 | 2.9% |
| Federal Government Employees | 0 | 0.0% |
| Unpaid Family Workers | 0 | 0.0% |
| Total | 2,904 | 100.0% |
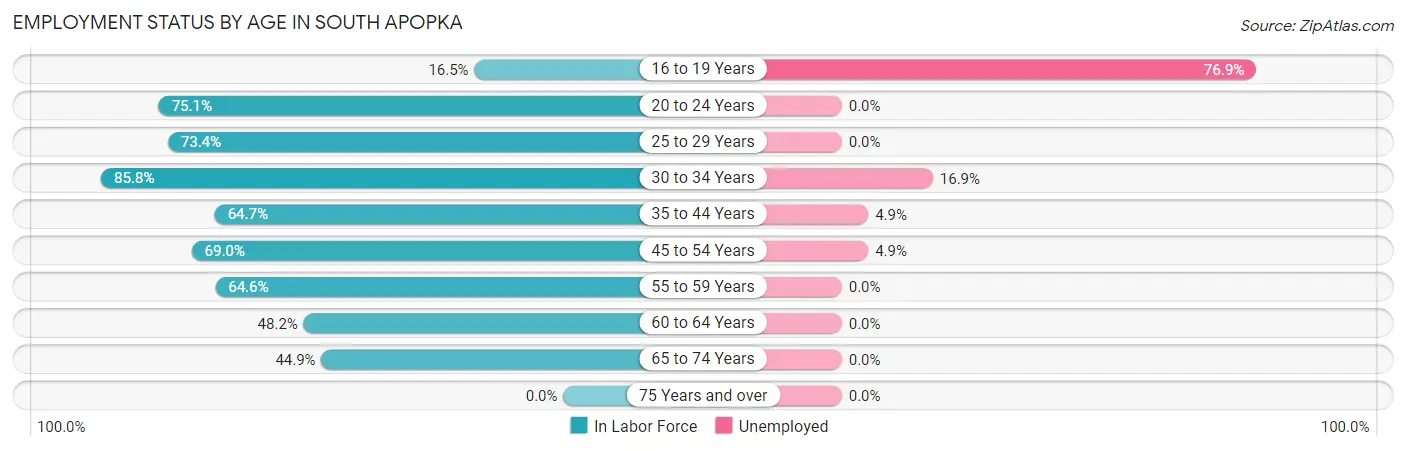
Employment Status by Age in South Apopka
According to the labor force statistics for South Apopka, out of the total population over 16 years of age (5,582), 55.6% or 3,104 individuals are in the labor force, with 5.4% or 168 of them unemployed. The age group with the highest labor force participation rate is 30 to 34 years, with 85.8% or 568 individuals in the labor force. Within the labor force, the 16 to 19 years age range has the highest percentage of unemployed individuals, with 76.9% or 30 of them being unemployed.
| Age Bracket | In Labor Force | Unemployed |
| 16 to 19 Years | 39 (16.5%) | 30 (76.9%) |
| 20 to 24 Years | 283 (75.1%) | 0 (0.0%) |
| 25 to 29 Years | 431 (73.4%) | 0 (0.0%) |
| 30 to 34 Years | 568 (85.8%) | 96 (16.9%) |
| 35 to 44 Years | 449 (64.7%) | 22 (4.9%) |
| 45 to 54 Years | 429 (69.0%) | 21 (4.9%) |
| 55 to 59 Years | 219 (64.6%) | 0 (0.0%) |
| 60 to 64 Years | 275 (48.2%) | 0 (0.0%) |
| 65 to 74 Years | 412 (44.9%) | 0 (0.0%) |
| 75 Years and over | 0 (0.0%) | 0 (0.0%) |
| Total | 3,104 (55.6%) | 168 (5.4%) |
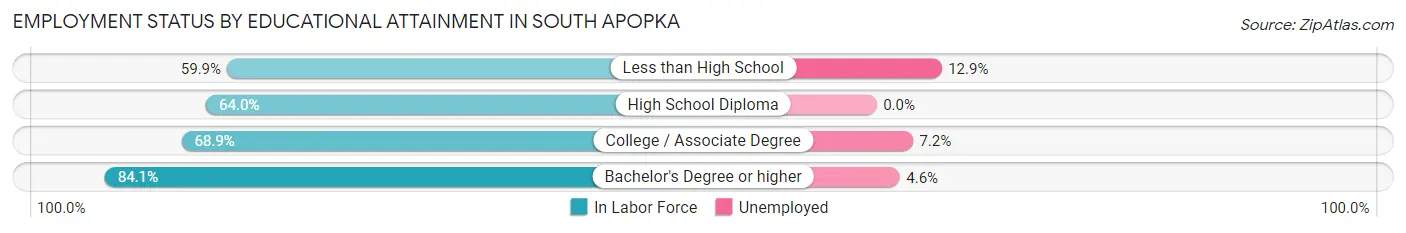
Employment Status by Educational Attainment in South Apopka
According to labor force statistics for South Apopka, 68.2% of individuals (2,370) out of the total population between 25 and 64 years of age (3,475) are in the labor force, with 5.9% or 140 of them being unemployed. The group with the highest labor force participation rate are those with the educational attainment of bachelor's degree or higher, with 84.1% or 588 individuals in the labor force. Within the labor force, individuals with less than high school education have the highest percentage of unemployment, with 12.9% or 69 of them being unemployed.
| Educational Attainment | In Labor Force | Unemployed |
| Less than High School | 534 (59.9%) | 115 (12.9%) |
| High School Diploma | 652 (64.0%) | 0 (0.0%) |
| College / Associate Degree | 597 (68.9%) | 62 (7.2%) |
| Bachelor's Degree or higher | 588 (84.1%) | 32 (4.6%) |
| Total | 2,370 (68.2%) | 205 (5.9%) |
Employment Occupations by Sex in South Apopka
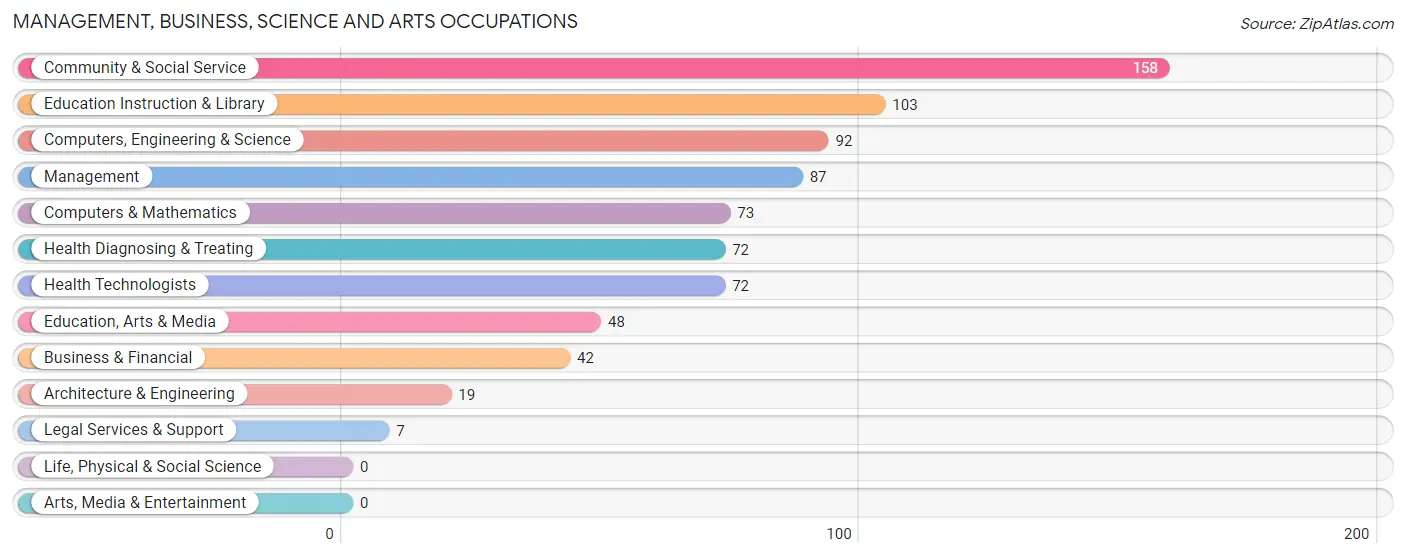
Management, Business, Science and Arts Occupations
The most common Management, Business, Science and Arts occupations in South Apopka are Community & Social Service (158 | 5.4%), Education Instruction & Library (103 | 3.5%), Computers, Engineering & Science (92 | 3.1%), Management (87 | 3.0%), and Computers & Mathematics (73 | 2.5%).
Management, Business, Science and Arts Occupations by Sex
Within the Management, Business, Science and Arts occupations in South Apopka, the most male-oriented occupations are Computers, Engineering & Science (100.0%), Computers & Mathematics (100.0%), and Architecture & Engineering (100.0%), while the most female-oriented occupations are Education, Arts & Media (100.0%), Legal Services & Support (100.0%), and Health Diagnosing & Treating (100.0%).
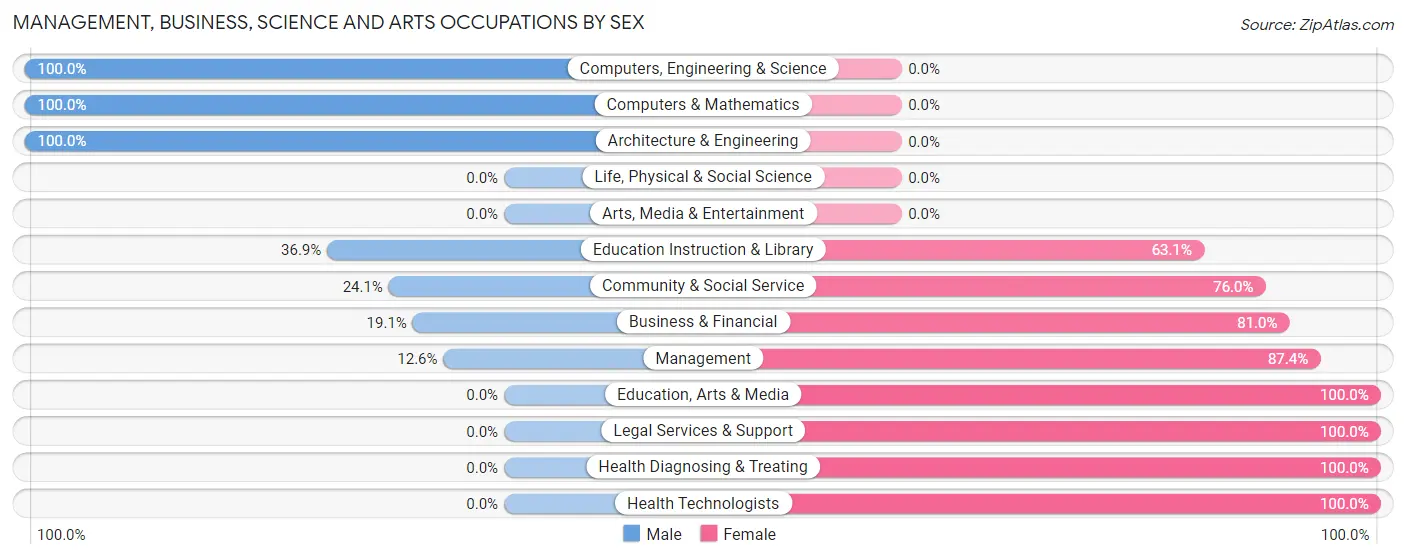
| Occupation | Male | Female |
| Management | 11 (12.6%) | 76 (87.4%) |
| Business & Financial | 8 (19.1%) | 34 (80.9%) |
| Computers, Engineering & Science | 92 (100.0%) | 0 (0.0%) |
| Computers & Mathematics | 73 (100.0%) | 0 (0.0%) |
| Architecture & Engineering | 19 (100.0%) | 0 (0.0%) |
| Life, Physical & Social Science | 0 (0.0%) | 0 (0.0%) |
| Community & Social Service | 38 (24.0%) | 120 (75.9%) |
| Education, Arts & Media | 0 (0.0%) | 48 (100.0%) |
| Legal Services & Support | 0 (0.0%) | 7 (100.0%) |
| Education Instruction & Library | 38 (36.9%) | 65 (63.1%) |
| Arts, Media & Entertainment | 0 (0.0%) | 0 (0.0%) |
| Health Diagnosing & Treating | 0 (0.0%) | 72 (100.0%) |
| Health Technologists | 0 (0.0%) | 72 (100.0%) |
| Total (Category) | 149 (33.0%) | 302 (67.0%) |
| Total (Overall) | 1,374 (46.8%) | 1,562 (53.2%) |
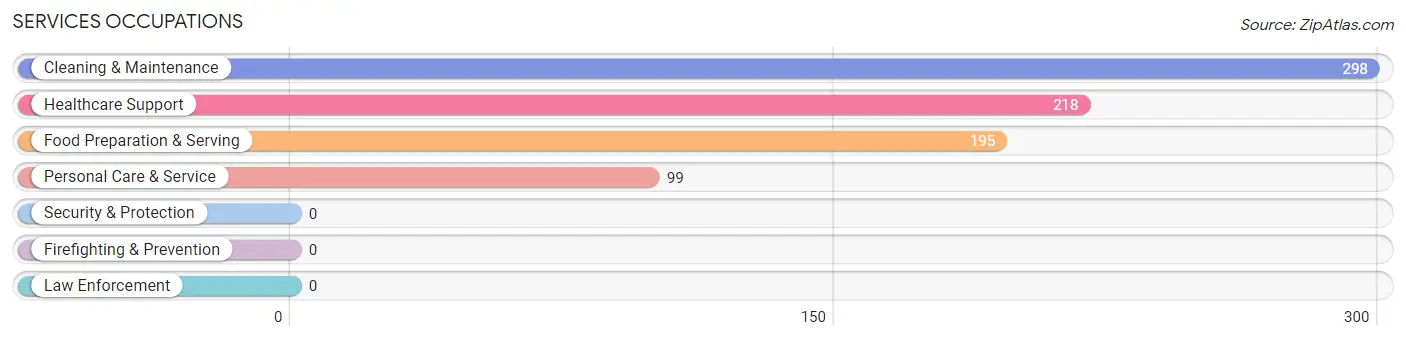
Services Occupations
The most common Services occupations in South Apopka are Cleaning & Maintenance (298 | 10.2%), Healthcare Support (218 | 7.4%), Food Preparation & Serving (195 | 6.6%), and Personal Care & Service (99 | 3.4%).
Services Occupations by Sex
Within the Services occupations in South Apopka, the most male-oriented occupations are Cleaning & Maintenance (93.3%), Personal Care & Service (83.8%), and Food Preparation & Serving (17.9%), while the most female-oriented occupations are Healthcare Support (100.0%), Food Preparation & Serving (82.1%), and Personal Care & Service (16.2%).
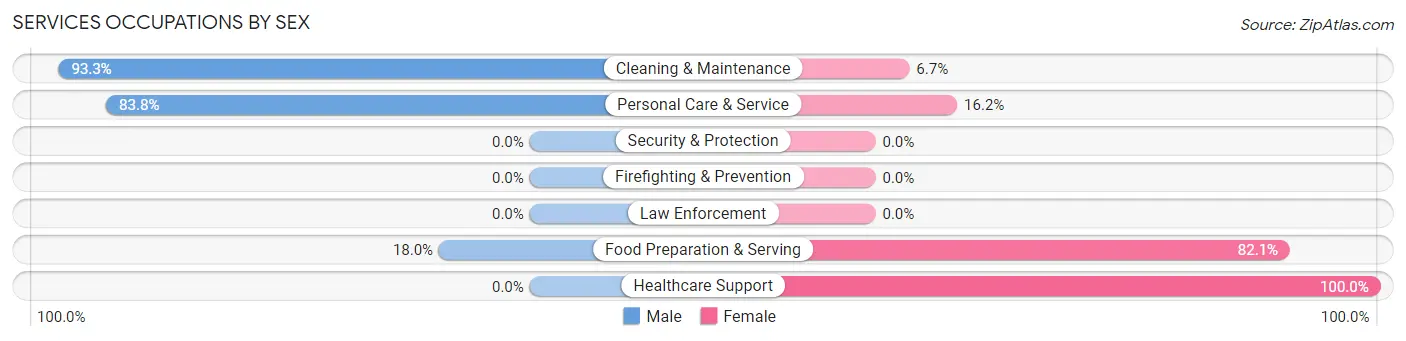
| Occupation | Male | Female |
| Healthcare Support | 0 (0.0%) | 218 (100.0%) |
| Security & Protection | 0 (0.0%) | 0 (0.0%) |
| Firefighting & Prevention | 0 (0.0%) | 0 (0.0%) |
| Law Enforcement | 0 (0.0%) | 0 (0.0%) |
| Food Preparation & Serving | 35 (17.9%) | 160 (82.1%) |
| Cleaning & Maintenance | 278 (93.3%) | 20 (6.7%) |
| Personal Care & Service | 83 (83.8%) | 16 (16.2%) |
| Total (Category) | 396 (48.9%) | 414 (51.1%) |
| Total (Overall) | 1,374 (46.8%) | 1,562 (53.2%) |
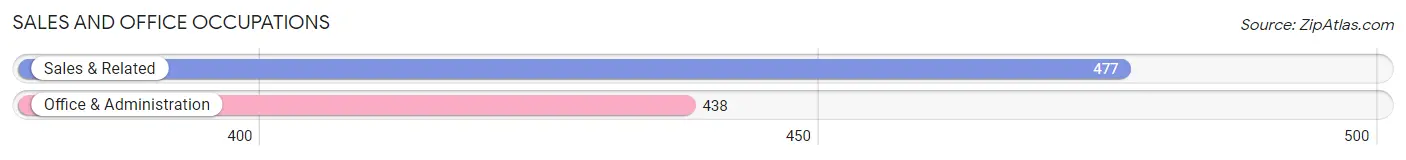
Sales and Office Occupations
The most common Sales and Office occupations in South Apopka are Sales & Related (477 | 16.3%), and Office & Administration (438 | 14.9%).
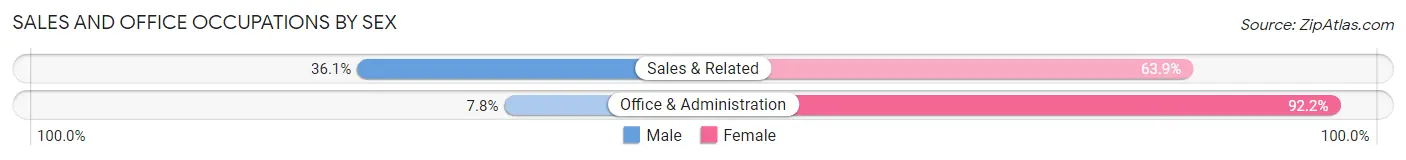
Sales and Office Occupations by Sex
| Occupation | Male | Female |
| Sales & Related | 172 (36.1%) | 305 (63.9%) |
| Office & Administration | 34 (7.8%) | 404 (92.2%) |
| Total (Category) | 206 (22.5%) | 709 (77.5%) |
| Total (Overall) | 1,374 (46.8%) | 1,562 (53.2%) |
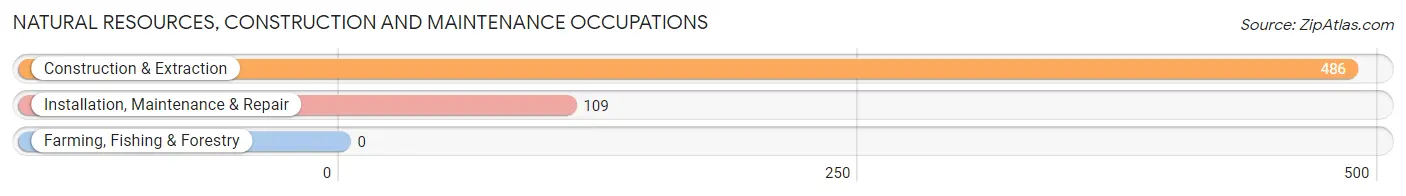
Natural Resources, Construction and Maintenance Occupations
The most common Natural Resources, Construction and Maintenance occupations in South Apopka are Construction & Extraction (486 | 16.6%), and Installation, Maintenance & Repair (109 | 3.7%).
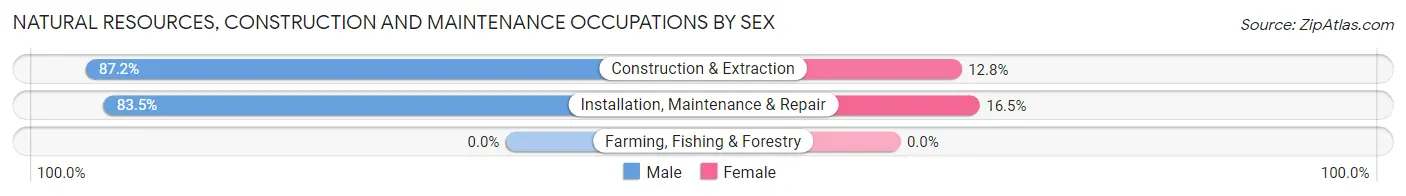
Natural Resources, Construction and Maintenance Occupations by Sex
| Occupation | Male | Female |
| Farming, Fishing & Forestry | 0 (0.0%) | 0 (0.0%) |
| Construction & Extraction | 424 (87.2%) | 62 (12.8%) |
| Installation, Maintenance & Repair | 91 (83.5%) | 18 (16.5%) |
| Total (Category) | 515 (86.6%) | 80 (13.5%) |
| Total (Overall) | 1,374 (46.8%) | 1,562 (53.2%) |
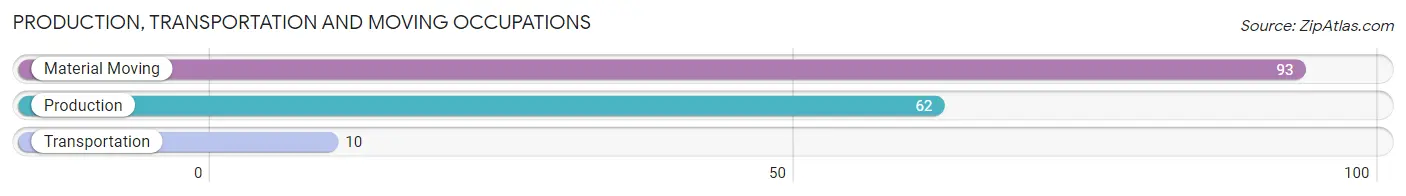
Production, Transportation and Moving Occupations
The most common Production, Transportation and Moving occupations in South Apopka are Material Moving (93 | 3.2%), Production (62 | 2.1%), and Transportation (10 | 0.3%).
Production, Transportation and Moving Occupations by Sex
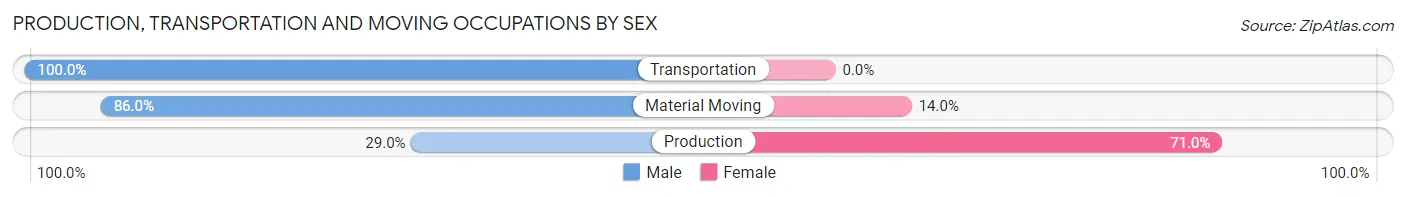
| Occupation | Male | Female |
| Production | 18 (29.0%) | 44 (71.0%) |
| Transportation | 10 (100.0%) | 0 (0.0%) |
| Material Moving | 80 (86.0%) | 13 (14.0%) |
| Total (Category) | 108 (65.4%) | 57 (34.5%) |
| Total (Overall) | 1,374 (46.8%) | 1,562 (53.2%) |
Employment Industries by Sex in South Apopka
Employment Industries in South Apopka
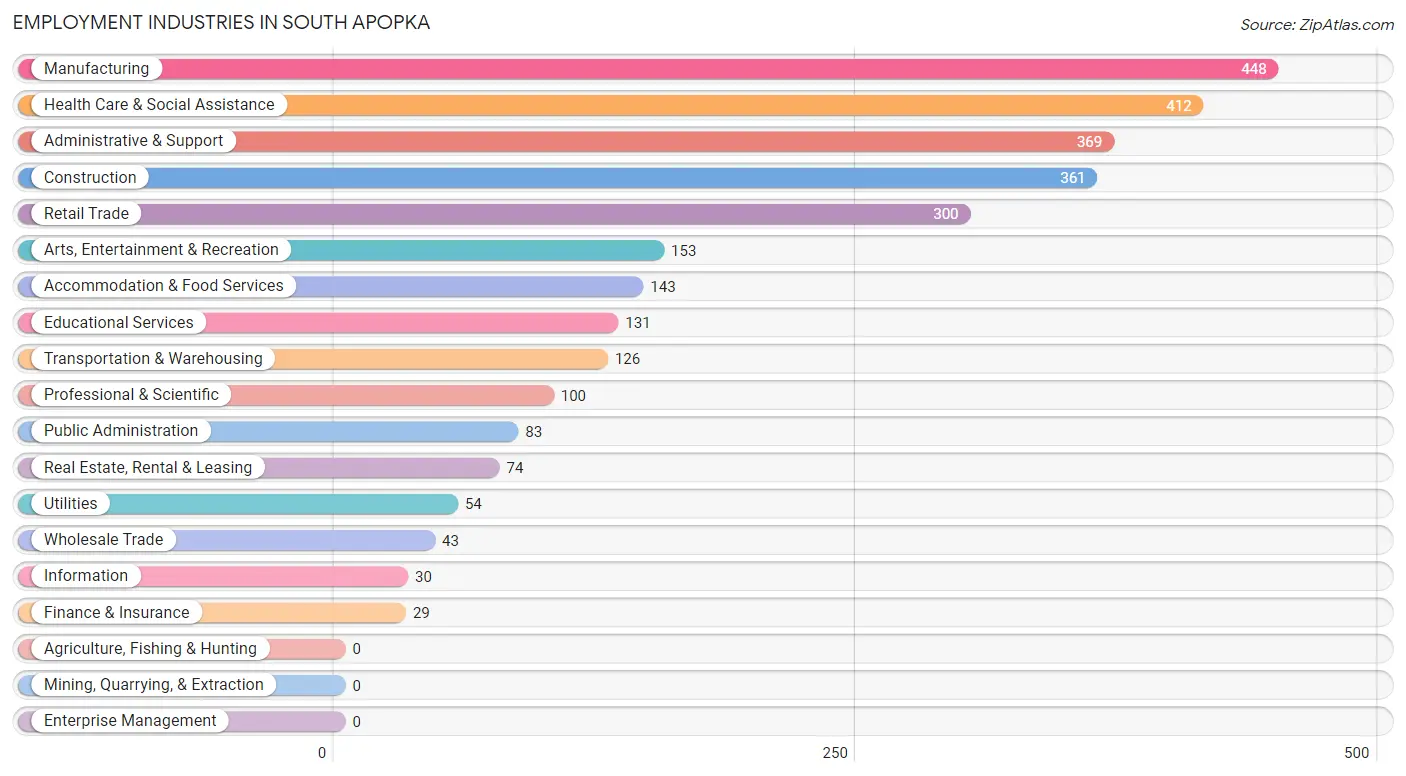
The major employment industries in South Apopka include Manufacturing (448 | 15.3%), Health Care & Social Assistance (412 | 14.0%), Administrative & Support (369 | 12.6%), Construction (361 | 12.3%), and Retail Trade (300 | 10.2%).
Employment Industries by Sex in South Apopka
The South Apopka industries that see more men than women are Utilities (100.0%), Real Estate, Rental & Leasing (100.0%), and Construction (82.8%), whereas the industries that tend to have a higher number of women are Information (100.0%), Finance & Insurance (100.0%), and Accommodation & Food Services (100.0%).
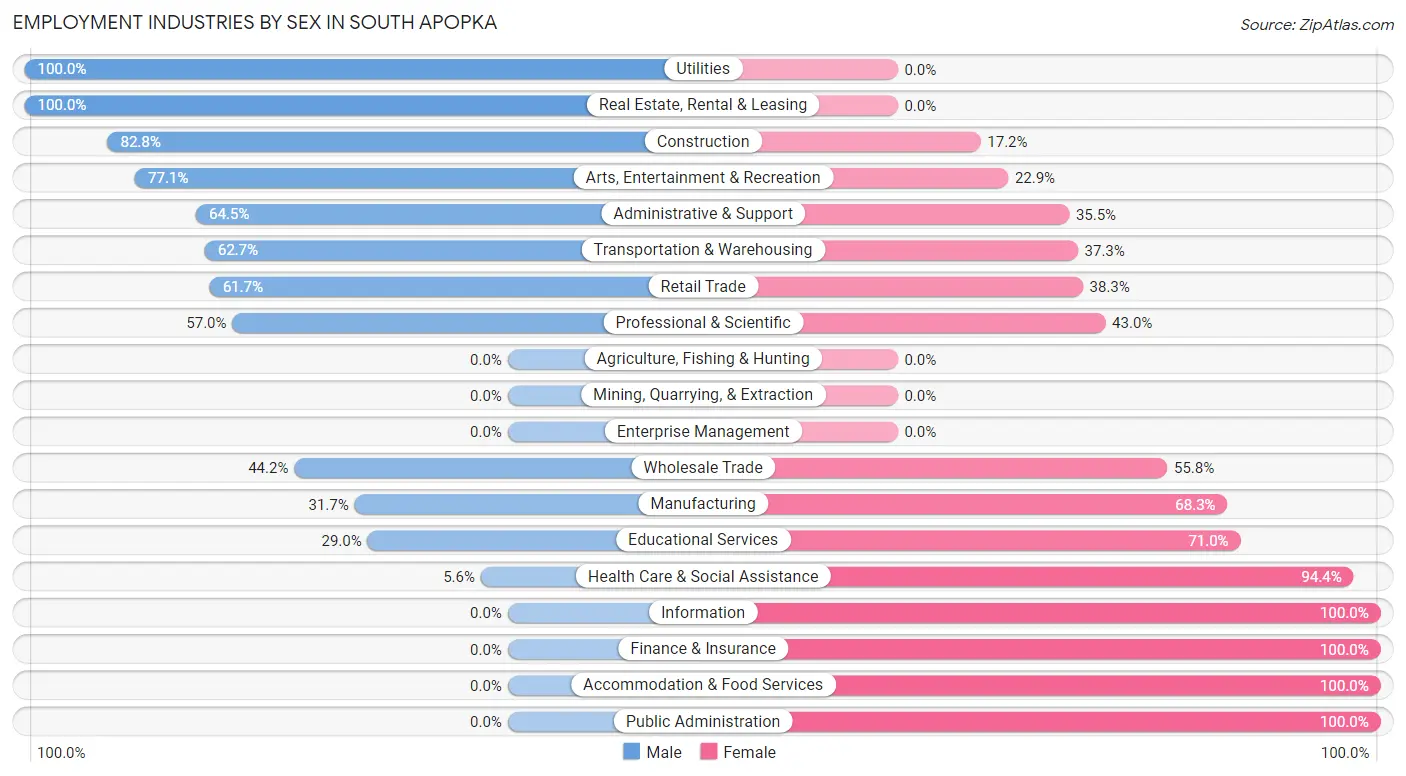
| Industry | Male | Female |
| Agriculture, Fishing & Hunting | 0 (0.0%) | 0 (0.0%) |
| Mining, Quarrying, & Extraction | 0 (0.0%) | 0 (0.0%) |
| Construction | 299 (82.8%) | 62 (17.2%) |
| Manufacturing | 142 (31.7%) | 306 (68.3%) |
| Wholesale Trade | 19 (44.2%) | 24 (55.8%) |
| Retail Trade | 185 (61.7%) | 115 (38.3%) |
| Transportation & Warehousing | 79 (62.7%) | 47 (37.3%) |
| Utilities | 54 (100.0%) | 0 (0.0%) |
| Information | 0 (0.0%) | 30 (100.0%) |
| Finance & Insurance | 0 (0.0%) | 29 (100.0%) |
| Real Estate, Rental & Leasing | 74 (100.0%) | 0 (0.0%) |
| Professional & Scientific | 57 (57.0%) | 43 (43.0%) |
| Enterprise Management | 0 (0.0%) | 0 (0.0%) |
| Administrative & Support | 238 (64.5%) | 131 (35.5%) |
| Educational Services | 38 (29.0%) | 93 (71.0%) |
| Health Care & Social Assistance | 23 (5.6%) | 389 (94.4%) |
| Arts, Entertainment & Recreation | 118 (77.1%) | 35 (22.9%) |
| Accommodation & Food Services | 0 (0.0%) | 143 (100.0%) |
| Public Administration | 0 (0.0%) | 83 (100.0%) |
| Total | 1,374 (46.8%) | 1,562 (53.2%) |
Education in South Apopka
School Enrollment in South Apopka
The most common levels of schooling among the 1,886 students in South Apopka are elementary school (808 | 42.8%), high school (349 | 18.5%), and college / undergraduate (317 | 16.8%).
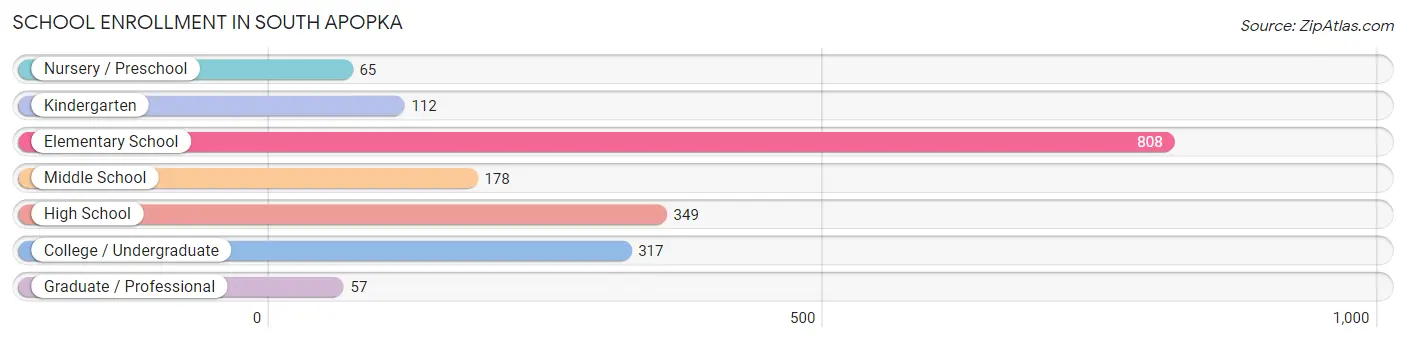
| School Level | # Students | % Students |
| Nursery / Preschool | 65 | 3.5% |
| Kindergarten | 112 | 5.9% |
| Elementary School | 808 | 42.8% |
| Middle School | 178 | 9.4% |
| High School | 349 | 18.5% |
| College / Undergraduate | 317 | 16.8% |
| Graduate / Professional | 57 | 3.0% |
| Total | 1,886 | 100.0% |
School Enrollment by Age by Funding Source in South Apopka
Out of a total of 1,886 students who are enrolled in schools in South Apopka, 349 (18.5%) attend a private institution, while the remaining 1,537 (81.5%) are enrolled in public schools. The age group of 35 years and over has the highest likelihood of being enrolled in private schools, with 62 (31.5% in the age bracket) enrolled. Conversely, the age group of 3 to 4 year olds has the lowest likelihood of being enrolled in a private school, with 65 (100.0% in the age bracket) attending a public institution.
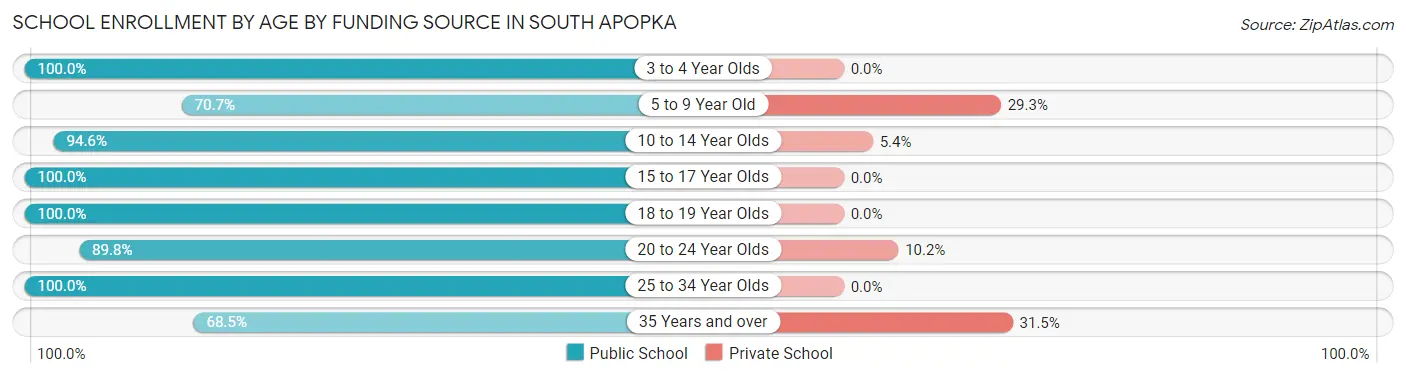
| Age Bracket | Public School | Private School |
| 3 to 4 Year Olds | 65 (100.0%) | 0 (0.0%) |
| 5 to 9 Year Old | 619 (70.7%) | 256 (29.3%) |
| 10 to 14 Year Olds | 297 (94.6%) | 17 (5.4%) |
| 15 to 17 Year Olds | 161 (100.0%) | 0 (0.0%) |
| 18 to 19 Year Olds | 127 (100.0%) | 0 (0.0%) |
| 20 to 24 Year Olds | 115 (89.8%) | 13 (10.2%) |
| 25 to 34 Year Olds | 19 (100.0%) | 0 (0.0%) |
| 35 Years and over | 135 (68.5%) | 62 (31.5%) |
| Total | 1,537 (81.5%) | 349 (18.5%) |
Educational Attainment by Field of Study in South Apopka
Business (298 | 34.1%), science & technology (185 | 21.2%), engineering (149 | 17.1%), education (107 | 12.3%), and bio, nature & agricultural (84 | 9.6%) are the most common fields of study among 873 individuals in South Apopka who have obtained a bachelor's degree or higher.
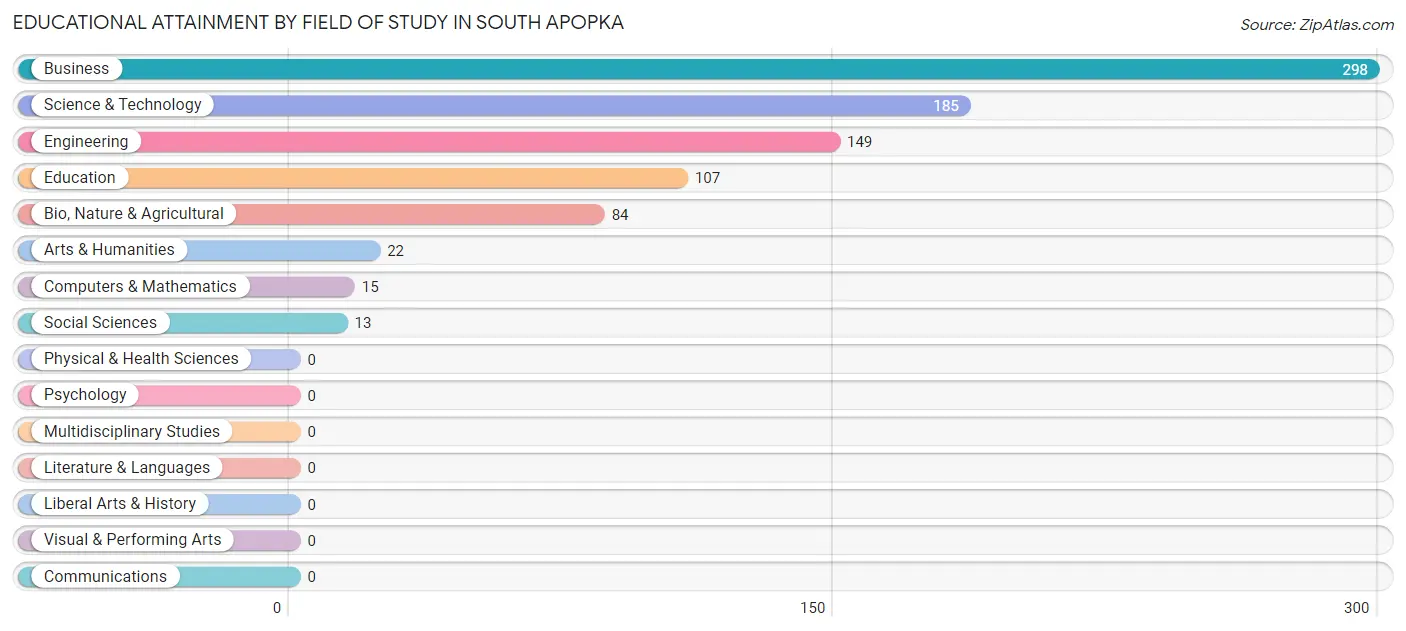
| Field of Study | # Graduates | % Graduates |
| Computers & Mathematics | 15 | 1.7% |
| Bio, Nature & Agricultural | 84 | 9.6% |
| Physical & Health Sciences | 0 | 0.0% |
| Psychology | 0 | 0.0% |
| Social Sciences | 13 | 1.5% |
| Engineering | 149 | 17.1% |
| Multidisciplinary Studies | 0 | 0.0% |
| Science & Technology | 185 | 21.2% |
| Business | 298 | 34.1% |
| Education | 107 | 12.3% |
| Literature & Languages | 0 | 0.0% |
| Liberal Arts & History | 0 | 0.0% |
| Visual & Performing Arts | 0 | 0.0% |
| Communications | 0 | 0.0% |
| Arts & Humanities | 22 | 2.5% |
| Total | 873 | 100.0% |
Transportation & Commute in South Apopka
Vehicle Availability by Sex in South Apopka
The most prevalent vehicle ownership categories in South Apopka are males with 2 vehicles (422, accounting for 30.7%) and females with 2 vehicles (406, making up 27.6%).
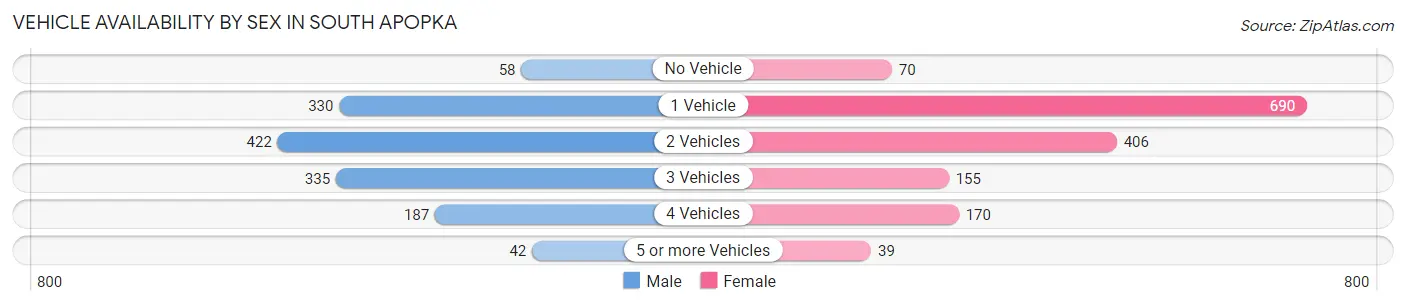
| Vehicles Available | Male | Female |
| No Vehicle | 58 (4.2%) | 70 (4.6%) |
| 1 Vehicle | 330 (24.0%) | 690 (45.1%) |
| 2 Vehicles | 422 (30.7%) | 406 (26.5%) |
| 3 Vehicles | 335 (24.4%) | 155 (10.1%) |
| 4 Vehicles | 187 (13.6%) | 170 (11.1%) |
| 5 or more Vehicles | 42 (3.1%) | 39 (2.5%) |
| Total | 1,374 (100.0%) | 1,530 (100.0%) |
Commute Time in South Apopka
The most frequently occuring commute durations in South Apopka are 45 to 59 minutes (493 commuters, 18.5%), 30 to 34 minutes (465 commuters, 17.4%), and 10 to 14 minutes (434 commuters, 16.3%).
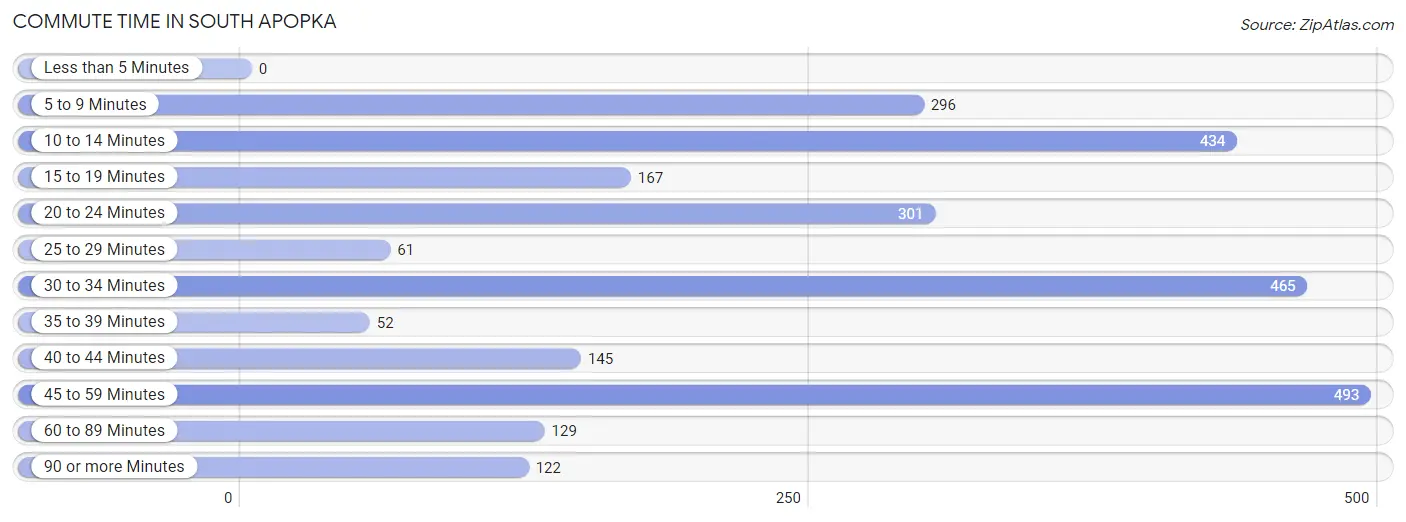
| Commute Time | # Commuters | % Commuters |
| Less than 5 Minutes | 0 | 0.0% |
| 5 to 9 Minutes | 296 | 11.1% |
| 10 to 14 Minutes | 434 | 16.3% |
| 15 to 19 Minutes | 167 | 6.3% |
| 20 to 24 Minutes | 301 | 11.3% |
| 25 to 29 Minutes | 61 | 2.3% |
| 30 to 34 Minutes | 465 | 17.4% |
| 35 to 39 Minutes | 52 | 1.9% |
| 40 to 44 Minutes | 145 | 5.4% |
| 45 to 59 Minutes | 493 | 18.5% |
| 60 to 89 Minutes | 129 | 4.8% |
| 90 or more Minutes | 122 | 4.6% |
Commute Time by Sex in South Apopka
The most common commute times in South Apopka are 10 to 14 minutes (286 commuters, 23.0%) for males and 45 to 59 minutes (493 commuters, 34.6%) for females.
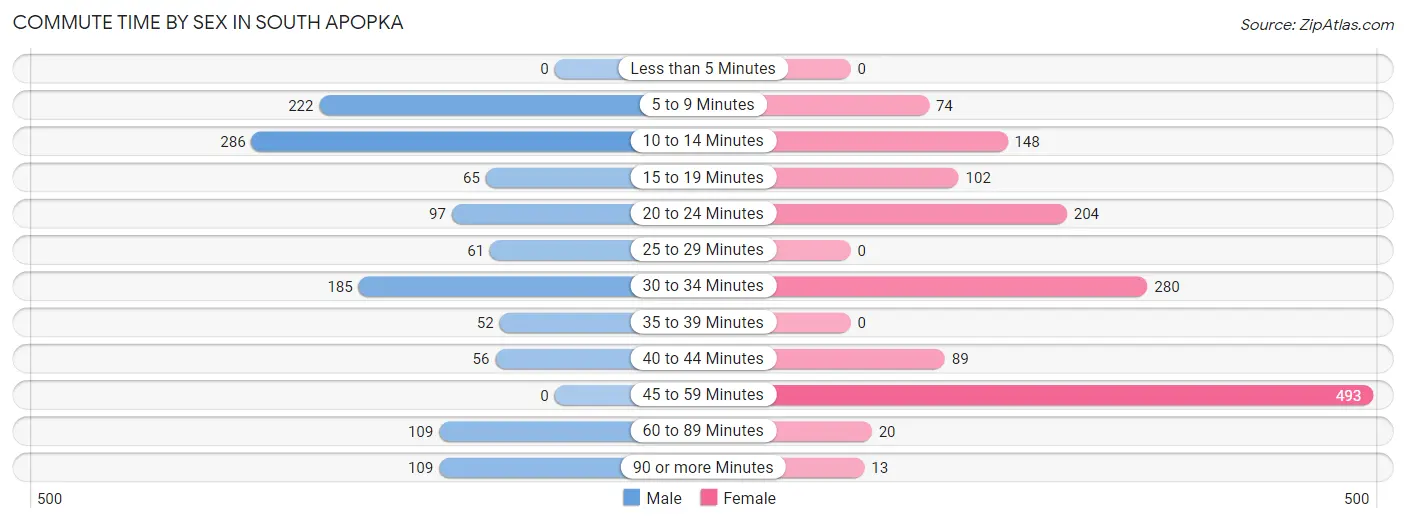
| Commute Time | Male | Female |
| Less than 5 Minutes | 0 (0.0%) | 0 (0.0%) |
| 5 to 9 Minutes | 222 (17.9%) | 74 (5.2%) |
| 10 to 14 Minutes | 286 (23.0%) | 148 (10.4%) |
| 15 to 19 Minutes | 65 (5.2%) | 102 (7.2%) |
| 20 to 24 Minutes | 97 (7.8%) | 204 (14.3%) |
| 25 to 29 Minutes | 61 (4.9%) | 0 (0.0%) |
| 30 to 34 Minutes | 185 (14.9%) | 280 (19.7%) |
| 35 to 39 Minutes | 52 (4.2%) | 0 (0.0%) |
| 40 to 44 Minutes | 56 (4.5%) | 89 (6.2%) |
| 45 to 59 Minutes | 0 (0.0%) | 493 (34.6%) |
| 60 to 89 Minutes | 109 (8.8%) | 20 (1.4%) |
| 90 or more Minutes | 109 (8.8%) | 13 (0.9%) |
Time of Departure to Work by Sex in South Apopka
The most frequent times of departure to work in South Apopka are 6:00 AM to 6:29 AM (248, 20.0%) for males and 9:00 AM to 9:59 AM (297, 20.9%) for females.
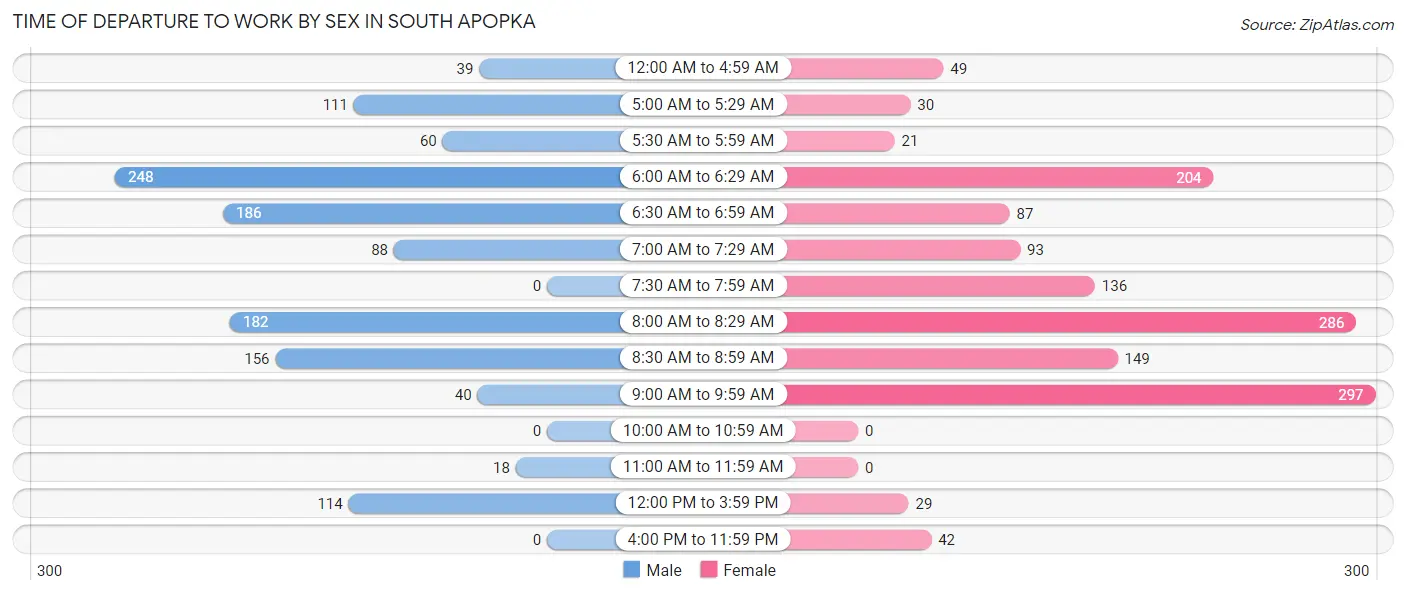
| Time of Departure | Male | Female |
| 12:00 AM to 4:59 AM | 39 (3.1%) | 49 (3.4%) |
| 5:00 AM to 5:29 AM | 111 (8.9%) | 30 (2.1%) |
| 5:30 AM to 5:59 AM | 60 (4.8%) | 21 (1.5%) |
| 6:00 AM to 6:29 AM | 248 (20.0%) | 204 (14.3%) |
| 6:30 AM to 6:59 AM | 186 (15.0%) | 87 (6.1%) |
| 7:00 AM to 7:29 AM | 88 (7.1%) | 93 (6.5%) |
| 7:30 AM to 7:59 AM | 0 (0.0%) | 136 (9.6%) |
| 8:00 AM to 8:29 AM | 182 (14.6%) | 286 (20.1%) |
| 8:30 AM to 8:59 AM | 156 (12.6%) | 149 (10.5%) |
| 9:00 AM to 9:59 AM | 40 (3.2%) | 297 (20.9%) |
| 10:00 AM to 10:59 AM | 0 (0.0%) | 0 (0.0%) |
| 11:00 AM to 11:59 AM | 18 (1.5%) | 0 (0.0%) |
| 12:00 PM to 3:59 PM | 114 (9.2%) | 29 (2.0%) |
| 4:00 PM to 11:59 PM | 0 (0.0%) | 42 (2.9%) |
| Total | 1,242 (100.0%) | 1,423 (100.0%) |
Housing Occupancy in South Apopka
Occupancy by Ownership in South Apopka
Of the total 2,420 dwellings in South Apopka, owner-occupied units account for 1,629 (67.3%), while renter-occupied units make up 791 (32.7%).
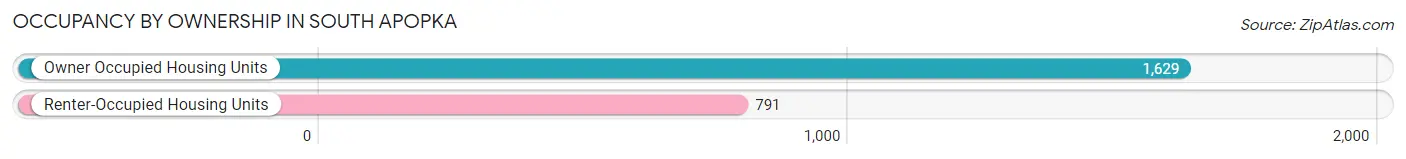
| Occupancy | # Housing Units | % Housing Units |
| Owner Occupied Housing Units | 1,629 | 67.3% |
| Renter-Occupied Housing Units | 791 | 32.7% |
| Total Occupied Housing Units | 2,420 | 100.0% |
Occupancy by Household Size in South Apopka
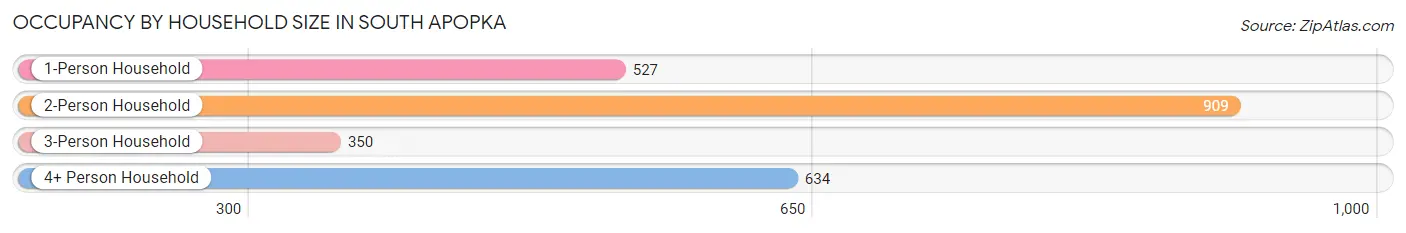
| Household Size | # Housing Units | % Housing Units |
| 1-Person Household | 527 | 21.8% |
| 2-Person Household | 909 | 37.6% |
| 3-Person Household | 350 | 14.5% |
| 4+ Person Household | 634 | 26.2% |
| Total Housing Units | 2,420 | 100.0% |
Occupancy by Ownership by Household Size in South Apopka
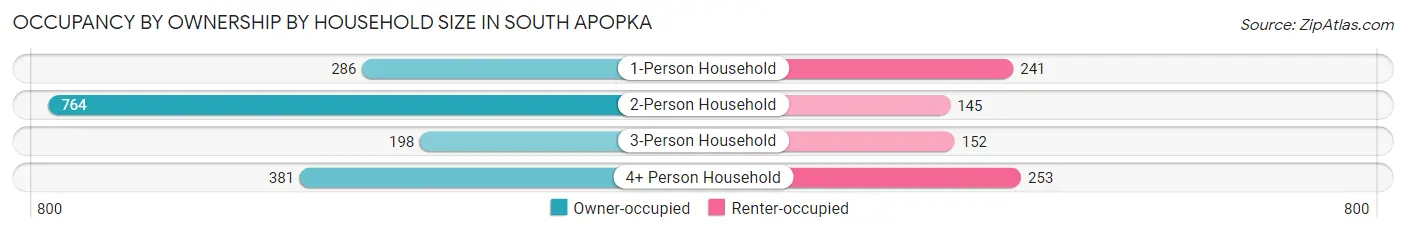
| Household Size | Owner-occupied | Renter-occupied |
| 1-Person Household | 286 (54.3%) | 241 (45.7%) |
| 2-Person Household | 764 (84.1%) | 145 (16.0%) |
| 3-Person Household | 198 (56.6%) | 152 (43.4%) |
| 4+ Person Household | 381 (60.1%) | 253 (39.9%) |
| Total Housing Units | 1,629 (67.3%) | 791 (32.7%) |
Occupancy by Educational Attainment in South Apopka
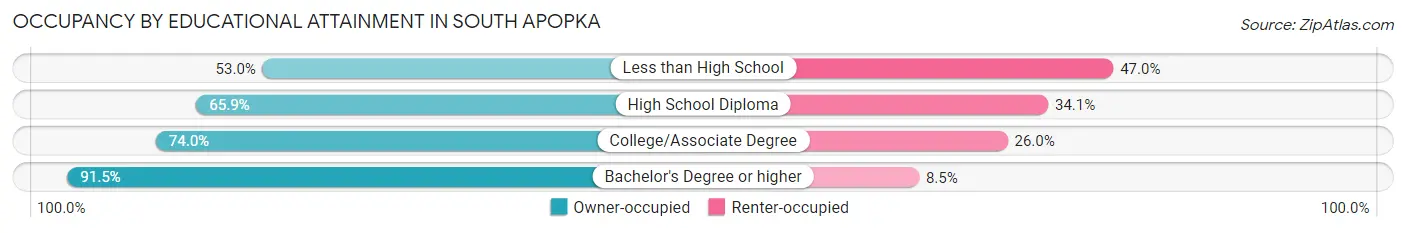
| Household Size | Owner-occupied | Renter-occupied |
| Less than High School | 353 (53.0%) | 313 (47.0%) |
| High School Diploma | 565 (65.9%) | 292 (34.1%) |
| College/Associate Degree | 463 (74.0%) | 163 (26.0%) |
| Bachelor's Degree or higher | 248 (91.5%) | 23 (8.5%) |
Occupancy by Age of Householder in South Apopka
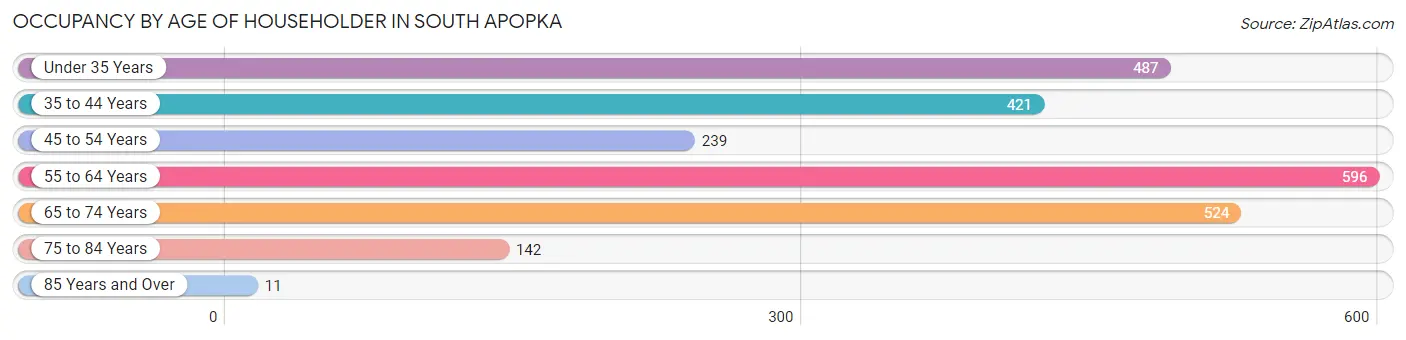
| Age Bracket | # Households | % Households |
| Under 35 Years | 487 | 20.1% |
| 35 to 44 Years | 421 | 17.4% |
| 45 to 54 Years | 239 | 9.9% |
| 55 to 64 Years | 596 | 24.6% |
| 65 to 74 Years | 524 | 21.6% |
| 75 to 84 Years | 142 | 5.9% |
| 85 Years and Over | 11 | 0.4% |
| Total | 2,420 | 100.0% |
Housing Finances in South Apopka
Median Income by Occupancy in South Apopka
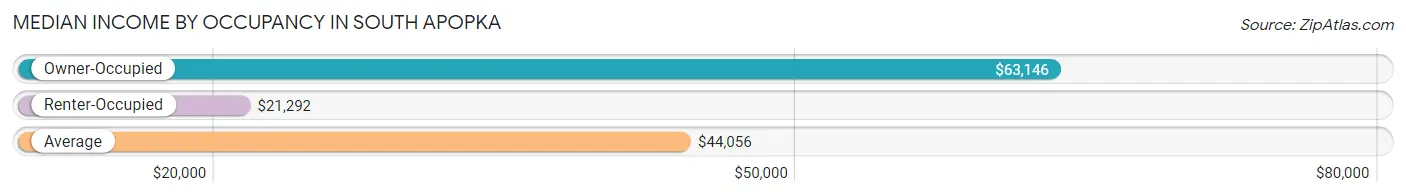
| Occupancy Type | # Households | Median Income |
| Owner-Occupied | 1,629 (67.3%) | $63,146 |
| Renter-Occupied | 791 (32.7%) | $21,292 |
| Average | 2,420 (100.0%) | $44,056 |
Occupancy by Householder Income Bracket in South Apopka
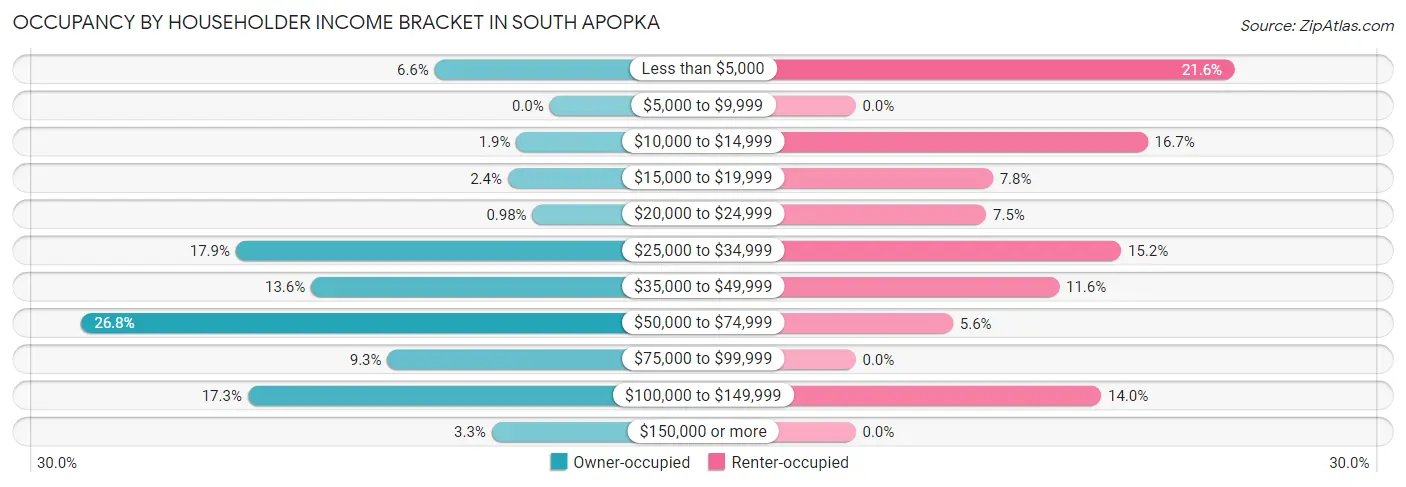
| Income Bracket | Owner-occupied | Renter-occupied |
| Less than $5,000 | 107 (6.6%) | 171 (21.6%) |
| $5,000 to $9,999 | 0 (0.0%) | 0 (0.0%) |
| $10,000 to $14,999 | 31 (1.9%) | 132 (16.7%) |
| $15,000 to $19,999 | 39 (2.4%) | 62 (7.8%) |
| $20,000 to $24,999 | 16 (1.0%) | 59 (7.5%) |
| $25,000 to $34,999 | 292 (17.9%) | 120 (15.2%) |
| $35,000 to $49,999 | 222 (13.6%) | 92 (11.6%) |
| $50,000 to $74,999 | 436 (26.8%) | 44 (5.6%) |
| $75,000 to $99,999 | 151 (9.3%) | 0 (0.0%) |
| $100,000 to $149,999 | 281 (17.2%) | 111 (14.0%) |
| $150,000 or more | 54 (3.3%) | 0 (0.0%) |
| Total | 1,629 (100.0%) | 791 (100.0%) |
Monthly Housing Cost Tiers in South Apopka
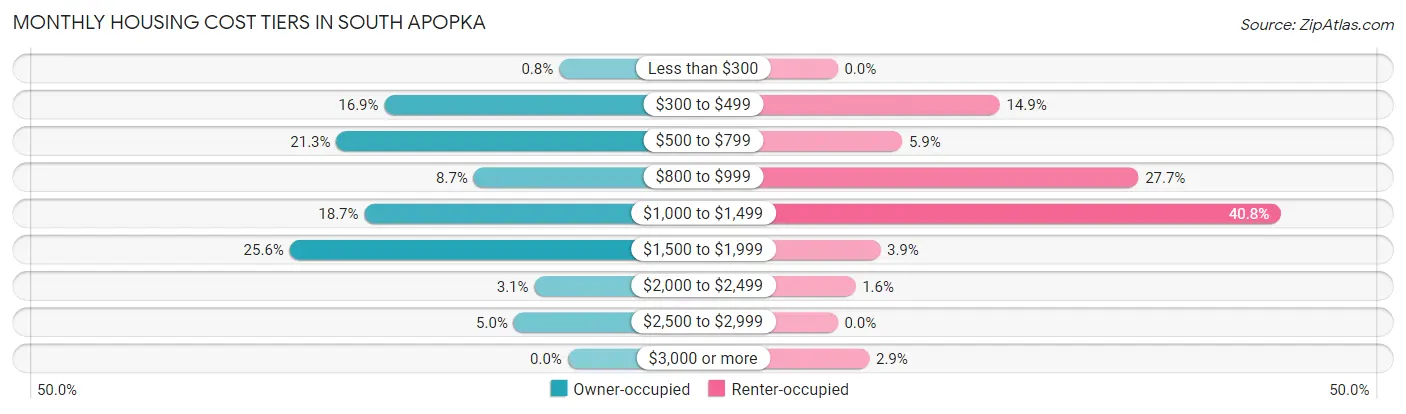
| Monthly Cost | Owner-occupied | Renter-occupied |
| Less than $300 | 13 (0.8%) | 0 (0.0%) |
| $300 to $499 | 275 (16.9%) | 118 (14.9%) |
| $500 to $799 | 347 (21.3%) | 47 (5.9%) |
| $800 to $999 | 141 (8.7%) | 219 (27.7%) |
| $1,000 to $1,499 | 305 (18.7%) | 323 (40.8%) |
| $1,500 to $1,999 | 417 (25.6%) | 31 (3.9%) |
| $2,000 to $2,499 | 50 (3.1%) | 13 (1.6%) |
| $2,500 to $2,999 | 81 (5.0%) | 0 (0.0%) |
| $3,000 or more | 0 (0.0%) | 23 (2.9%) |
| Total | 1,629 (100.0%) | 791 (100.0%) |
Physical Housing Characteristics in South Apopka
Housing Structures in South Apopka
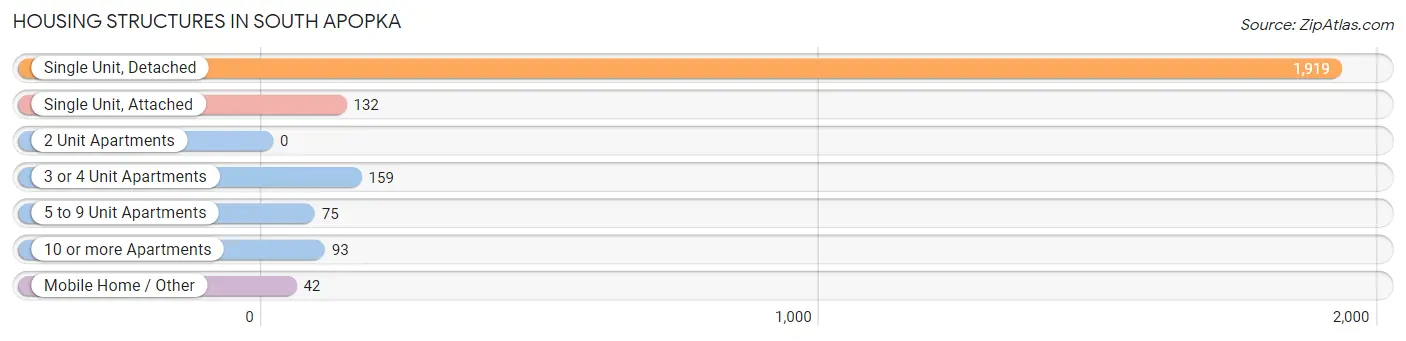
| Structure Type | # Housing Units | % Housing Units |
| Single Unit, Detached | 1,919 | 79.3% |
| Single Unit, Attached | 132 | 5.4% |
| 2 Unit Apartments | 0 | 0.0% |
| 3 or 4 Unit Apartments | 159 | 6.6% |
| 5 to 9 Unit Apartments | 75 | 3.1% |
| 10 or more Apartments | 93 | 3.8% |
| Mobile Home / Other | 42 | 1.7% |
| Total | 2,420 | 100.0% |
Housing Structures by Occupancy in South Apopka
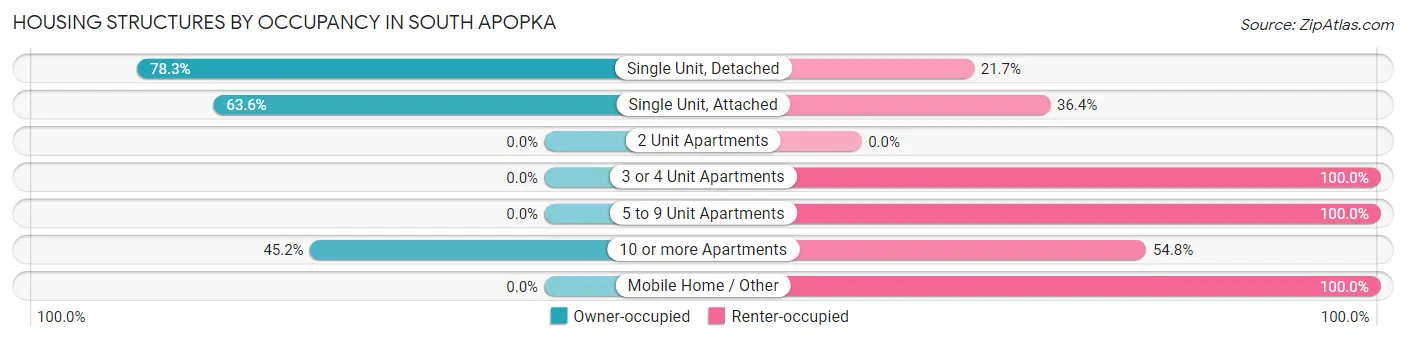
| Structure Type | Owner-occupied | Renter-occupied |
| Single Unit, Detached | 1,503 (78.3%) | 416 (21.7%) |
| Single Unit, Attached | 84 (63.6%) | 48 (36.4%) |
| 2 Unit Apartments | 0 (0.0%) | 0 (0.0%) |
| 3 or 4 Unit Apartments | 0 (0.0%) | 159 (100.0%) |
| 5 to 9 Unit Apartments | 0 (0.0%) | 75 (100.0%) |
| 10 or more Apartments | 42 (45.2%) | 51 (54.8%) |
| Mobile Home / Other | 0 (0.0%) | 42 (100.0%) |
| Total | 1,629 (67.3%) | 791 (32.7%) |
Housing Structures by Number of Rooms in South Apopka
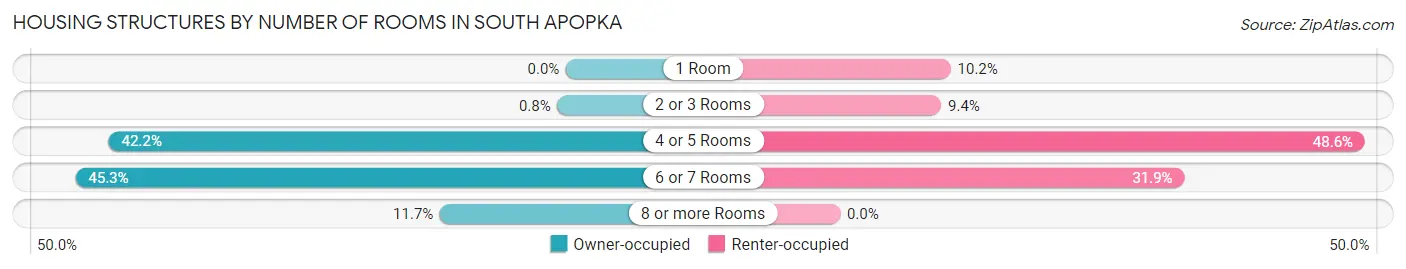
| Number of Rooms | Owner-occupied | Renter-occupied |
| 1 Room | 0 (0.0%) | 81 (10.2%) |
| 2 or 3 Rooms | 13 (0.8%) | 74 (9.4%) |
| 4 or 5 Rooms | 688 (42.2%) | 384 (48.5%) |
| 6 or 7 Rooms | 738 (45.3%) | 252 (31.9%) |
| 8 or more Rooms | 190 (11.7%) | 0 (0.0%) |
| Total | 1,629 (100.0%) | 791 (100.0%) |
Housing Structure by Heating Type in South Apopka
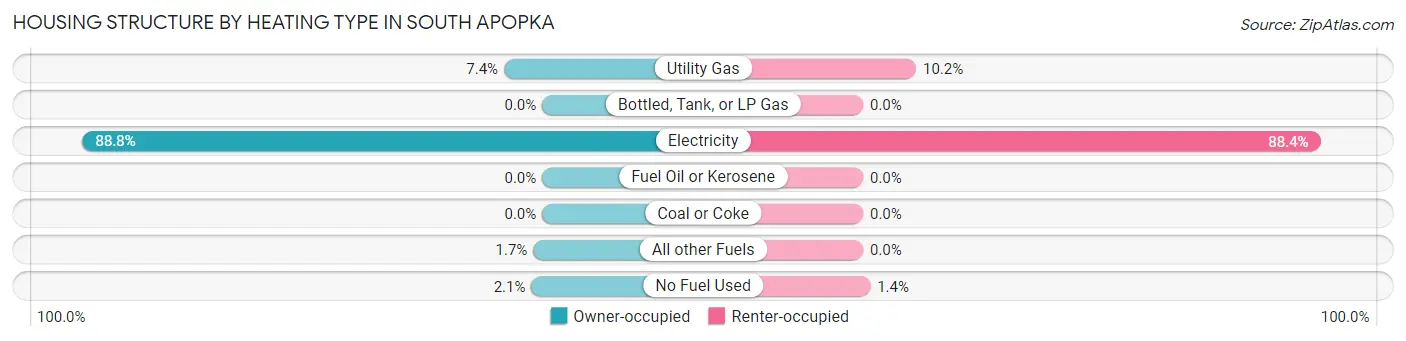
| Heating Type | Owner-occupied | Renter-occupied |
| Utility Gas | 120 (7.4%) | 81 (10.2%) |
| Bottled, Tank, or LP Gas | 0 (0.0%) | 0 (0.0%) |
| Electricity | 1,447 (88.8%) | 699 (88.4%) |
| Fuel Oil or Kerosene | 0 (0.0%) | 0 (0.0%) |
| Coal or Coke | 0 (0.0%) | 0 (0.0%) |
| All other Fuels | 28 (1.7%) | 0 (0.0%) |
| No Fuel Used | 34 (2.1%) | 11 (1.4%) |
| Total | 1,629 (100.0%) | 791 (100.0%) |
Household Vehicle Usage in South Apopka
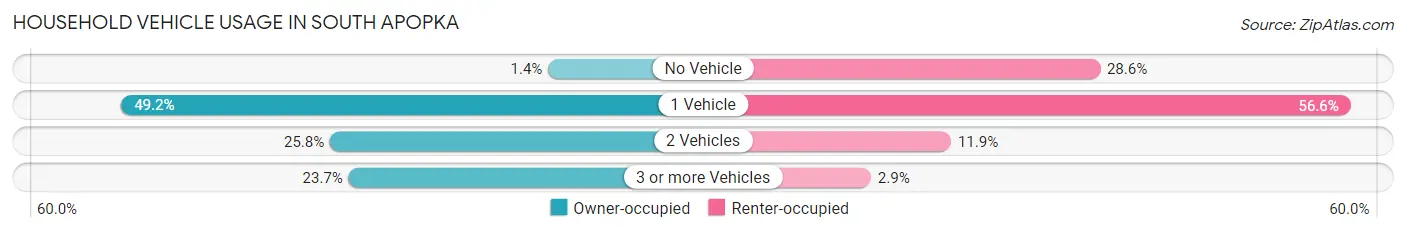
| Vehicles per Household | Owner-occupied | Renter-occupied |
| No Vehicle | 22 (1.3%) | 226 (28.6%) |
| 1 Vehicle | 801 (49.2%) | 448 (56.6%) |
| 2 Vehicles | 420 (25.8%) | 94 (11.9%) |
| 3 or more Vehicles | 386 (23.7%) | 23 (2.9%) |
| Total | 1,629 (100.0%) | 791 (100.0%) |
Real Estate & Mortgages in South Apopka
Real Estate and Mortgage Overview in South Apopka
| Characteristic | Without Mortgage | With Mortgage |
| Housing Units | 381 | 1,248 |
| Median Property Value | $212,100 | $231,500 |
| Median Household Income | $42,896 | $54 |
| Monthly Housing Costs | $412 | $0 |
| Real Estate Taxes | $1,224 | $102 |
Property Value by Mortgage Status in South Apopka
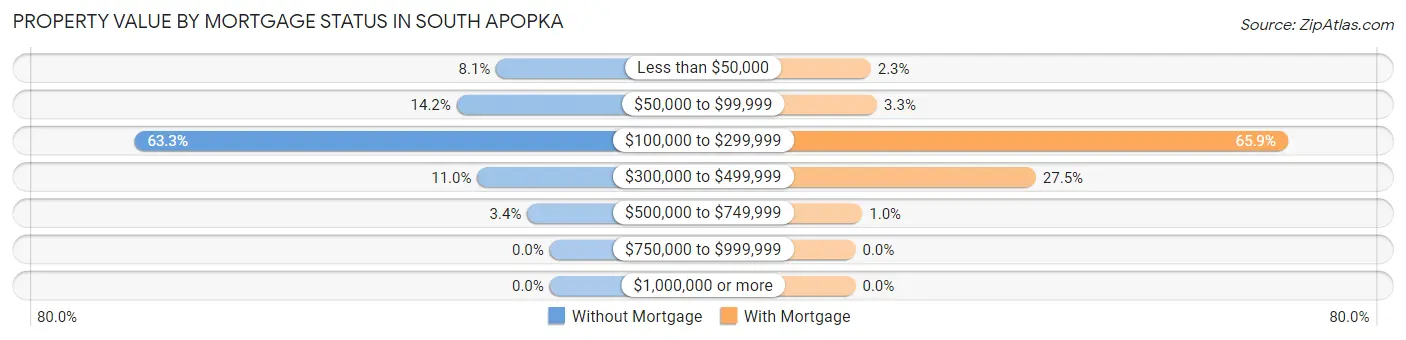
| Property Value | Without Mortgage | With Mortgage |
| Less than $50,000 | 31 (8.1%) | 29 (2.3%) |
| $50,000 to $99,999 | 54 (14.2%) | 41 (3.3%) |
| $100,000 to $299,999 | 241 (63.2%) | 822 (65.9%) |
| $300,000 to $499,999 | 42 (11.0%) | 343 (27.5%) |
| $500,000 to $749,999 | 13 (3.4%) | 13 (1.0%) |
| $750,000 to $999,999 | 0 (0.0%) | 0 (0.0%) |
| $1,000,000 or more | 0 (0.0%) | 0 (0.0%) |
| Total | 381 (100.0%) | 1,248 (100.0%) |
Household Income by Mortgage Status in South Apopka
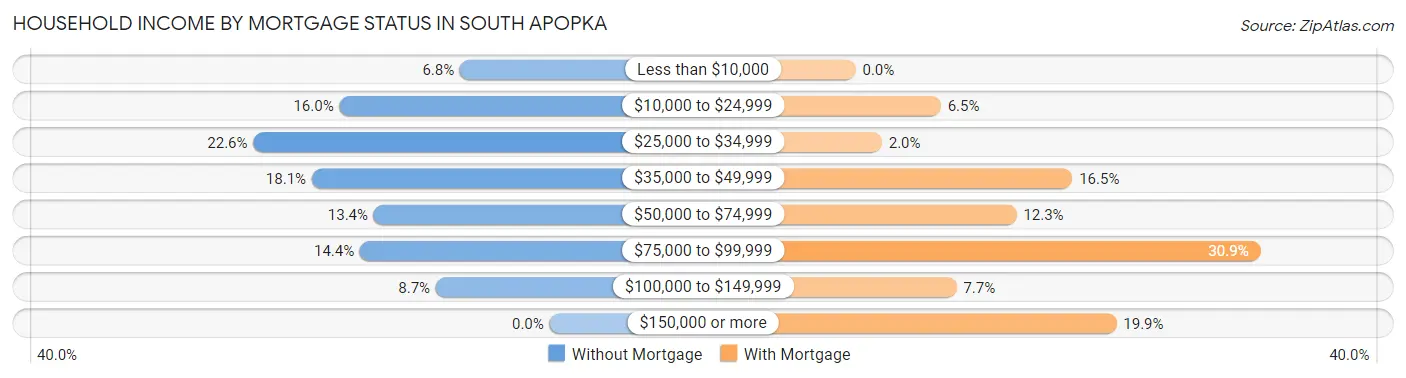
| Household Income | Without Mortgage | With Mortgage |
| Less than $10,000 | 26 (6.8%) | 0 (0.0%) |
| $10,000 to $24,999 | 61 (16.0%) | 81 (6.5%) |
| $25,000 to $34,999 | 86 (22.6%) | 25 (2.0%) |
| $35,000 to $49,999 | 69 (18.1%) | 206 (16.5%) |
| $50,000 to $74,999 | 51 (13.4%) | 153 (12.3%) |
| $75,000 to $99,999 | 55 (14.4%) | 385 (30.8%) |
| $100,000 to $149,999 | 33 (8.7%) | 96 (7.7%) |
| $150,000 or more | 0 (0.0%) | 248 (19.9%) |
| Total | 381 (100.0%) | 1,248 (100.0%) |
Property Value to Household Income Ratio in South Apopka
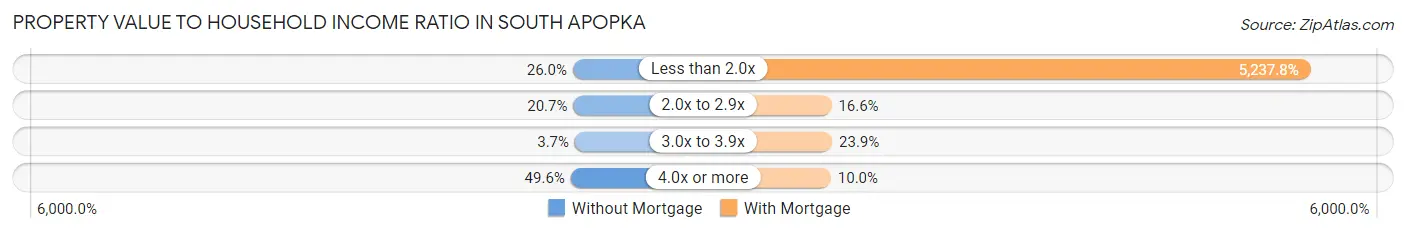
| Value-to-Income Ratio | Without Mortgage | With Mortgage |
| Less than 2.0x | 99 (26.0%) | 65,368 (5,237.8%) |
| 2.0x to 2.9x | 79 (20.7%) | 207 (16.6%) |
| 3.0x to 3.9x | 14 (3.7%) | 298 (23.9%) |
| 4.0x or more | 189 (49.6%) | 125 (10.0%) |
| Total | 381 (100.0%) | 1,248 (100.0%) |
Real Estate Taxes by Mortgage Status in South Apopka
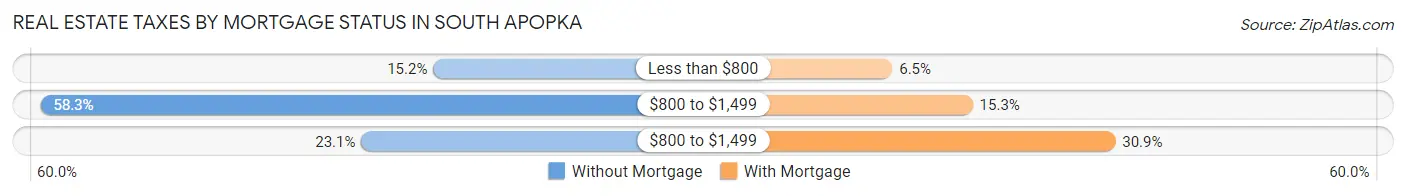
| Property Taxes | Without Mortgage | With Mortgage |
| Less than $800 | 58 (15.2%) | 81 (6.5%) |
| $800 to $1,499 | 222 (58.3%) | 191 (15.3%) |
| $800 to $1,499 | 88 (23.1%) | 386 (30.9%) |
| Total | 381 (100.0%) | 1,248 (100.0%) |
Health & Disability in South Apopka
Health Insurance Coverage by Age in South Apopka
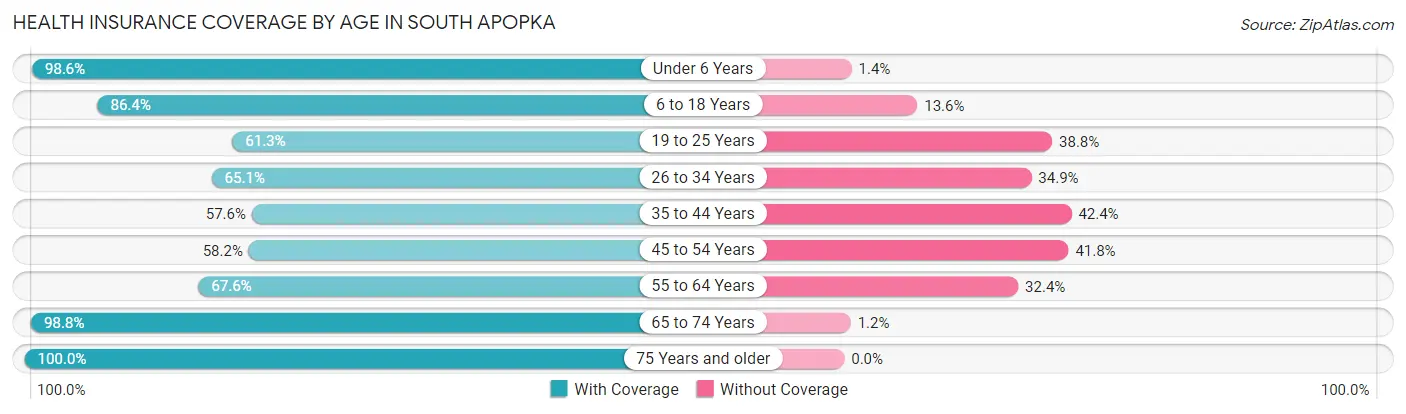
| Age Bracket | With Coverage | Without Coverage |
| Under 6 Years | 797 (98.6%) | 11 (1.4%) |
| 6 to 18 Years | 1,257 (86.4%) | 198 (13.6%) |
| 19 to 25 Years | 381 (61.3%) | 241 (38.8%) |
| 26 to 34 Years | 683 (65.1%) | 366 (34.9%) |
| 35 to 44 Years | 400 (57.6%) | 294 (42.4%) |
| 45 to 54 Years | 362 (58.2%) | 260 (41.8%) |
| 55 to 64 Years | 615 (67.6%) | 295 (32.4%) |
| 65 to 74 Years | 906 (98.8%) | 11 (1.2%) |
| 75 Years and older | 576 (100.0%) | 0 (0.0%) |
| Total | 5,977 (78.1%) | 1,676 (21.9%) |
Health Insurance Coverage by Citizenship Status in South Apopka
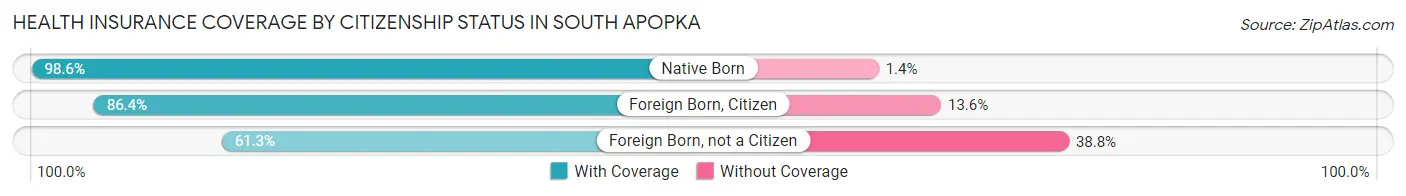
| Citizenship Status | With Coverage | Without Coverage |
| Native Born | 797 (98.6%) | 11 (1.4%) |
| Foreign Born, Citizen | 1,257 (86.4%) | 198 (13.6%) |
| Foreign Born, not a Citizen | 381 (61.3%) | 241 (38.8%) |
Health Insurance Coverage by Household Income in South Apopka
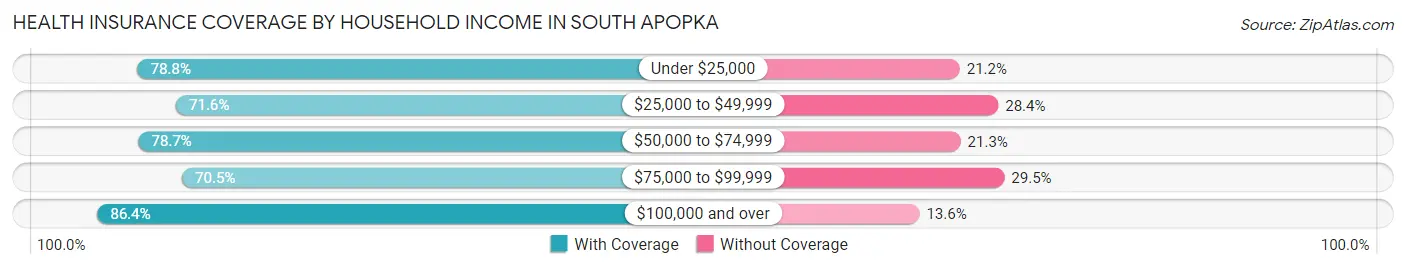
| Household Income | With Coverage | Without Coverage |
| Under $25,000 | 1,594 (78.8%) | 428 (21.2%) |
| $25,000 to $49,999 | 1,531 (71.6%) | 607 (28.4%) |
| $50,000 to $74,999 | 933 (78.7%) | 253 (21.3%) |
| $75,000 to $99,999 | 327 (70.5%) | 137 (29.5%) |
| $100,000 and over | 1,592 (86.4%) | 251 (13.6%) |
Public vs Private Health Insurance Coverage by Age in South Apopka
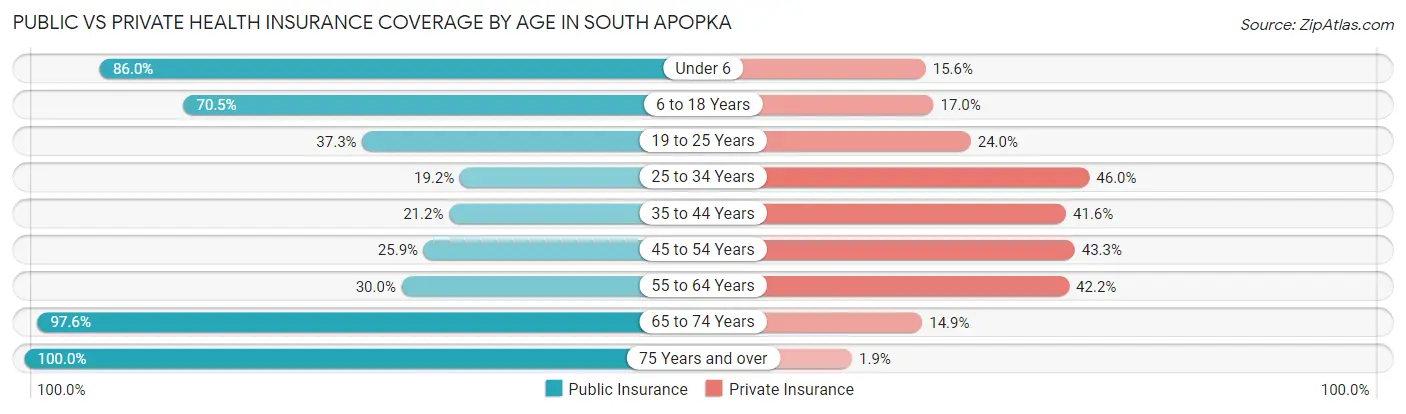
| Age Bracket | Public Insurance | Private Insurance |
| Under 6 | 695 (86.0%) | 126 (15.6%) |
| 6 to 18 Years | 1,026 (70.5%) | 248 (17.0%) |
| 19 to 25 Years | 232 (37.3%) | 149 (23.9%) |
| 25 to 34 Years | 201 (19.2%) | 482 (46.0%) |
| 35 to 44 Years | 147 (21.2%) | 289 (41.6%) |
| 45 to 54 Years | 161 (25.9%) | 269 (43.2%) |
| 55 to 64 Years | 273 (30.0%) | 384 (42.2%) |
| 65 to 74 Years | 895 (97.6%) | 137 (14.9%) |
| 75 Years and over | 576 (100.0%) | 11 (1.9%) |
| Total | 4,206 (55.0%) | 2,095 (27.4%) |
Disability Status by Sex by Age in South Apopka
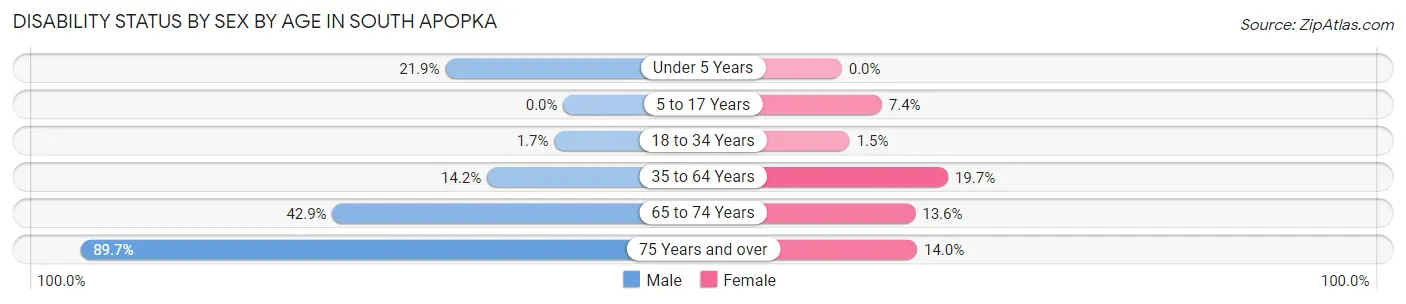
| Age Bracket | Male | Female |
| Under 5 Years | 101 (21.9%) | 0 (0.0%) |
| 5 to 17 Years | 0 (0.0%) | 51 (7.4%) |
| 18 to 34 Years | 16 (1.7%) | 12 (1.5%) |
| 35 to 64 Years | 150 (14.2%) | 230 (19.7%) |
| 65 to 74 Years | 126 (42.9%) | 85 (13.6%) |
| 75 Years and over | 356 (89.7%) | 25 (14.0%) |
Disability Class by Sex by Age in South Apopka
Disability Class: Hearing Difficulty
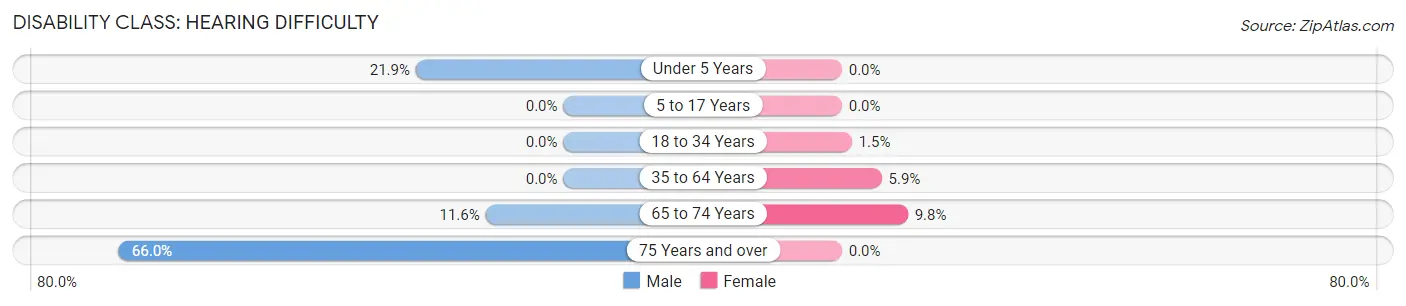
| Age Bracket | Male | Female |
| Under 5 Years | 101 (21.9%) | 0 (0.0%) |
| 5 to 17 Years | 0 (0.0%) | 0 (0.0%) |
| 18 to 34 Years | 0 (0.0%) | 12 (1.5%) |
| 35 to 64 Years | 0 (0.0%) | 69 (5.9%) |
| 65 to 74 Years | 34 (11.6%) | 61 (9.8%) |
| 75 Years and over | 262 (66.0%) | 0 (0.0%) |
Disability Class: Vision Difficulty
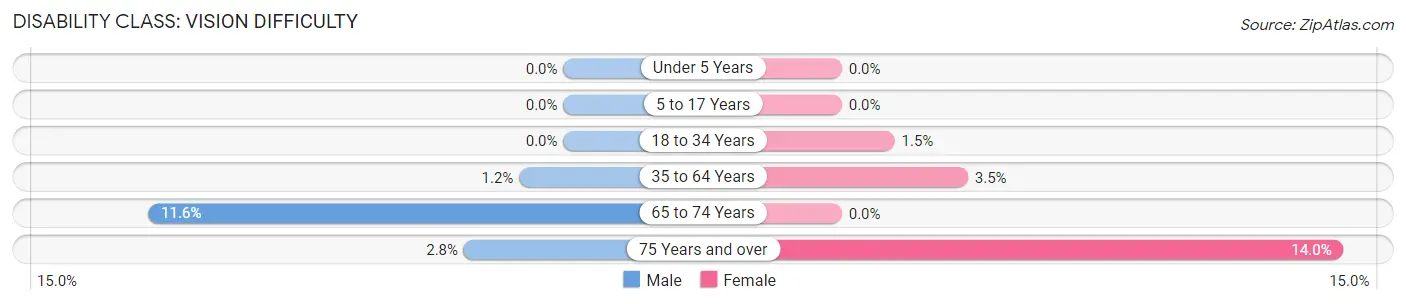
| Age Bracket | Male | Female |
| Under 5 Years | 0 (0.0%) | 0 (0.0%) |
| 5 to 17 Years | 0 (0.0%) | 0 (0.0%) |
| 18 to 34 Years | 0 (0.0%) | 12 (1.5%) |
| 35 to 64 Years | 13 (1.2%) | 41 (3.5%) |
| 65 to 74 Years | 34 (11.6%) | 0 (0.0%) |
| 75 Years and over | 11 (2.8%) | 25 (14.0%) |
Disability Class: Cognitive Difficulty
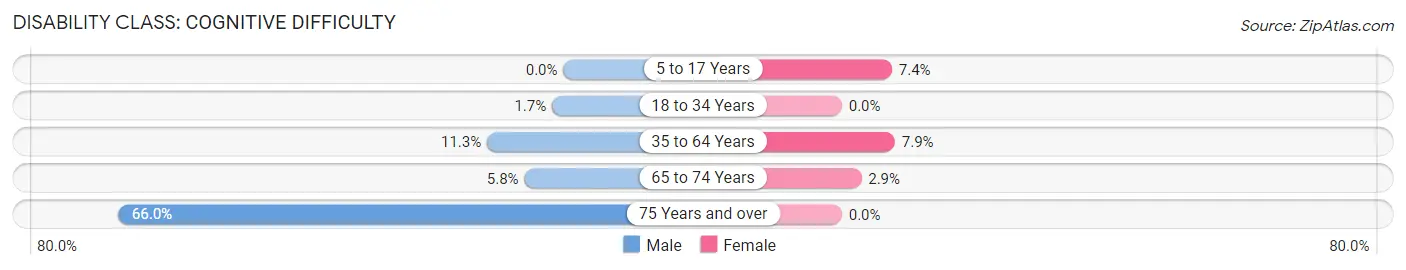
| Age Bracket | Male | Female |
| 5 to 17 Years | 0 (0.0%) | 51 (7.4%) |
| 18 to 34 Years | 16 (1.7%) | 0 (0.0%) |
| 35 to 64 Years | 120 (11.3%) | 92 (7.9%) |
| 65 to 74 Years | 17 (5.8%) | 18 (2.9%) |
| 75 Years and over | 262 (66.0%) | 0 (0.0%) |
Disability Class: Ambulatory Difficulty
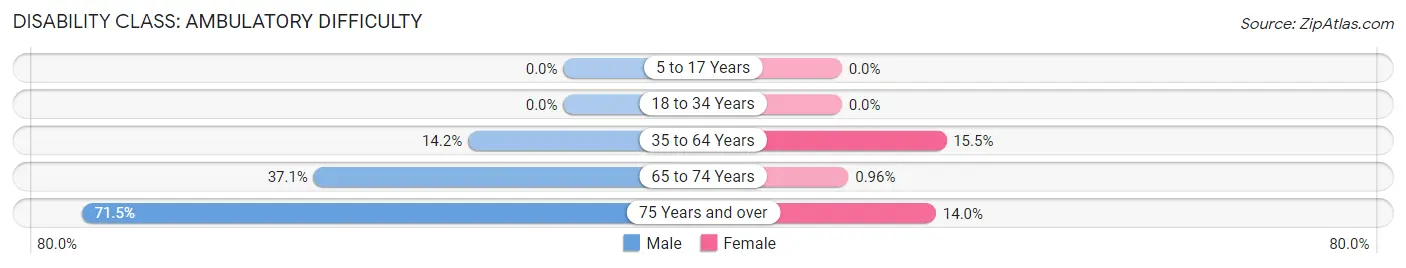
| Age Bracket | Male | Female |
| 5 to 17 Years | 0 (0.0%) | 0 (0.0%) |
| 18 to 34 Years | 0 (0.0%) | 0 (0.0%) |
| 35 to 64 Years | 150 (14.2%) | 181 (15.5%) |
| 65 to 74 Years | 109 (37.1%) | 6 (1.0%) |
| 75 Years and over | 284 (71.5%) | 25 (14.0%) |
Disability Class: Self-Care Difficulty
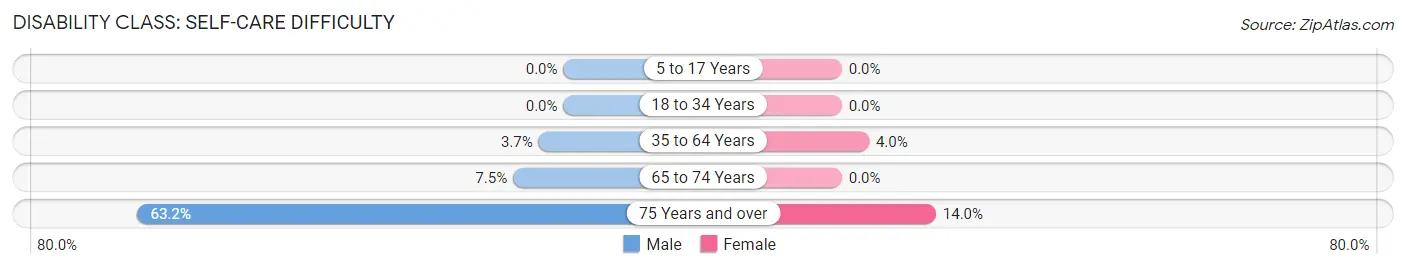
| Age Bracket | Male | Female |
| 5 to 17 Years | 0 (0.0%) | 0 (0.0%) |
| 18 to 34 Years | 0 (0.0%) | 0 (0.0%) |
| 35 to 64 Years | 39 (3.7%) | 47 (4.0%) |
| 65 to 74 Years | 22 (7.5%) | 0 (0.0%) |
| 75 Years and over | 251 (63.2%) | 25 (14.0%) |
Technology Access in South Apopka
Computing Device Access in South Apopka
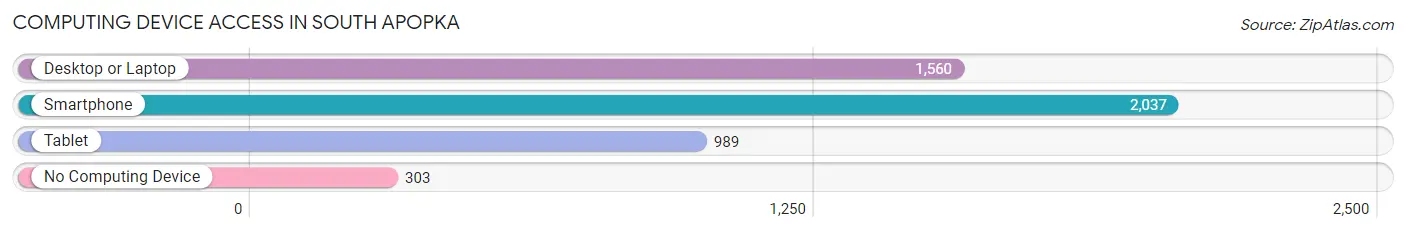
| Device Type | # Households | % Households |
| Desktop or Laptop | 1,560 | 64.5% |
| Smartphone | 2,037 | 84.2% |
| Tablet | 989 | 40.9% |
| No Computing Device | 303 | 12.5% |
| Total | 2,420 | 100.0% |
Internet Access in South Apopka
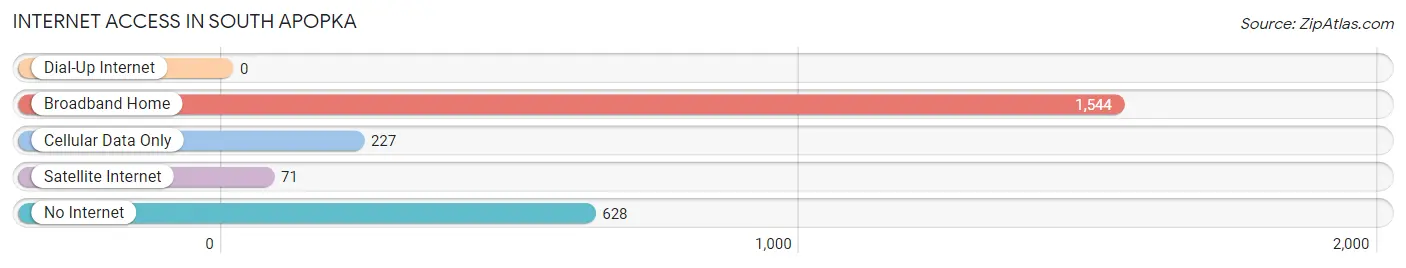
| Internet Type | # Households | % Households |
| Dial-Up Internet | 0 | 0.0% |
| Broadband Home | 1,544 | 63.8% |
| Cellular Data Only | 227 | 9.4% |
| Satellite Internet | 71 | 2.9% |
| No Internet | 628 | 26.0% |
| Total | 2,420 | 100.0% |
South Apopka Summary
Apopka, Florida is a city located in Orange County, Florida, United States. It is part of the Orlando-Kissimmee-Sanford Metropolitan Statistical Area. The city is located in the northern part of the county, just south of the city of Orlando. As of the 2010 census, the population of Apopka was 41,542, making it the second-largest city in Orange County.
History
The area that is now Apopka was originally inhabited by the Seminole Indians. The first European settlers arrived in the area in the 1830s, and the city was officially incorporated in 1882. The city was named after a Seminole Indian chief, Chief Apopka.
The city grew slowly until the 1950s, when the construction of the Florida Turnpike and the growth of nearby Orlando spurred rapid growth. By the 1970s, Apopka had become a bedroom community for Orlando, and the population had grown to over 20,000.
Geography
Apopka is located in northern Orange County, Florida, at 28°37′N 81°30′W. It is bordered to the north by the city of Orlando, to the east by the city of Ocoee, to the south by the city of Winter Garden, and to the west by the city of Maitland.
The city covers an area of approximately 25 square miles, and is located at an elevation of approximately 100 feet above sea level. The city is located in the Central Florida Highlands region, and is part of the Central Florida Ridge.
Economy
Apopka’s economy is largely based on agriculture and tourism. The city is home to several large agricultural operations, including citrus groves, nurseries, and farms. The city is also home to several tourist attractions, including the Central Florida Zoo and the Wekiwa Springs State Park.
The city is also home to several large employers, including the Florida Hospital Apopka, the Orange County Public Schools, and the Orange County Sheriff’s Office.
Demographics
As of the 2010 census, the population of Apopka was 41,542. The racial makeup of the city was 68.3% White, 17.3% African American, 0.4% Native American, 2.2% Asian, 0.1% Pacific Islander, 8.2% from other races, and 3.5% from two or more races. Hispanic or Latino of any race were 19.2% of the population.
The median household income in Apopka was $45,845, and the median family income was $51,919. The per capita income for the city was $21,945. About 11.3% of families and 14.2% of the population were below the poverty line, including 19.2% of those under age 18 and 8.2% of those age 65 or over.
Common Questions
What is Per Capita Income in South Apopka?
Per Capita income in South Apopka is $18,726.
What is the Median Family Income in South Apopka?
Median Family Income in South Apopka is $63,482.
What is the Median Household income in South Apopka?
Median Household Income in South Apopka is $44,056.
What is Income or Wage Gap in South Apopka?
Income or Wage Gap in South Apopka is 17.8%.
Women in South Apopka earn 82.2 cents for every dollar earned by a man.
What is Inequality or Gini Index in South Apopka?
Inequality or Gini Index in South Apopka is 0.43.
What is the Total Population of South Apopka?
Total Population of South Apopka is 7,653.
What is the Total Male Population of South Apopka?
Total Male Population of South Apopka is 3,866.
What is the Total Female Population of South Apopka?
Total Female Population of South Apopka is 3,787.
What is the Ratio of Males per 100 Females in South Apopka?
There are 102.09 Males per 100 Females in South Apopka.
What is the Ratio of Females per 100 Males in South Apopka?
There are 97.96 Females per 100 Males in South Apopka.
What is the Median Population Age in South Apopka?
Median Population Age in South Apopka is 33.8 Years.
What is the Average Family Size in South Apopka
Average Family Size in South Apopka is 3.8 People.
What is the Average Household Size in South Apopka
Average Household Size in South Apopka is 3.2 People.
How Large is the Labor Force in South Apopka?
There are 3,104 People in the Labor Forcein in South Apopka.
What is the Percentage of People in the Labor Force in South Apopka?
55.6% of People are in the Labor Force in South Apopka.
What is the Unemployment Rate in South Apopka?
Unemployment Rate in South Apopka is 5.4%.