North Tonawanda, NY Map & Demographics
North Tonawanda Map
North Tonawanda Overview
$36,570
PER CAPITA INCOME
$88,833
AVG FAMILY INCOME
$66,836
AVG HOUSEHOLD INCOME
26.5%
WAGE / INCOME GAP [ % ]
73.5¢/ $1
WAGE / INCOME GAP [ $ ]
$11,190
FAMILY INCOME DEFICIT
0.41
INEQUALITY / GINI INDEX
30,479
TOTAL POPULATION
15,105
MALE POPULATION
15,374
FEMALE POPULATION
98.25
MALES / 100 FEMALES
101.78
FEMALES / 100 MALES
43.4
MEDIAN AGE
2.8
AVG FAMILY SIZE
2.2
AVG HOUSEHOLD SIZE
16,642
LABOR FORCE [ PEOPLE ]
64.7%
PERCENT IN LABOR FORCE
5.6%
UNEMPLOYMENT RATE
North Tonawanda Zip Codes
North Tonawanda Area Codes
Income in North Tonawanda
Income Overview in North Tonawanda
Per Capita Income in North Tonawanda is $36,570, while median incomes of families and households are $88,833 and $66,836 respectively.
| Characteristic | Number | Measure |
| Per Capita Income | 30,479 | $36,570 |
| Median Family Income | 8,140 | $88,833 |
| Mean Family Income | 8,140 | $97,162 |
| Median Household Income | 13,643 | $66,836 |
| Mean Household Income | 13,643 | $80,824 |
| Income Deficit | 8,140 | $11,190 |
| Wage / Income Gap (%) | 30,479 | 26.52% |
| Wage / Income Gap ($) | 30,479 | 73.48¢ per $1 |
| Gini / Inequality Index | 30,479 | 0.41 |
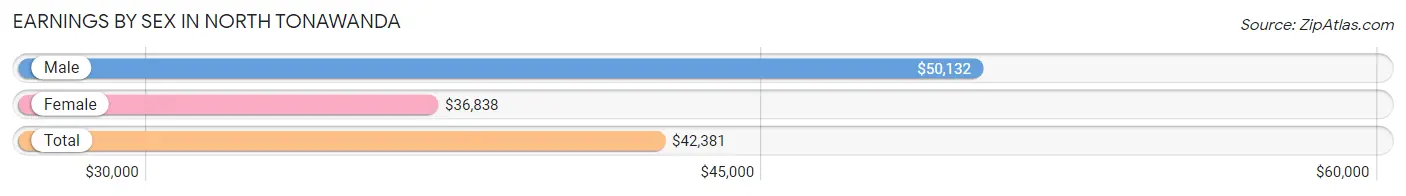
Earnings by Sex in North Tonawanda
Average Earnings in North Tonawanda are $42,381, $50,132 for men and $36,838 for women, a difference of 26.5%.
| Sex | Number | Average Earnings |
| Male | 9,182 (53.8%) | $50,132 |
| Female | 7,898 (46.2%) | $36,838 |
| Total | 17,080 (100.0%) | $42,381 |
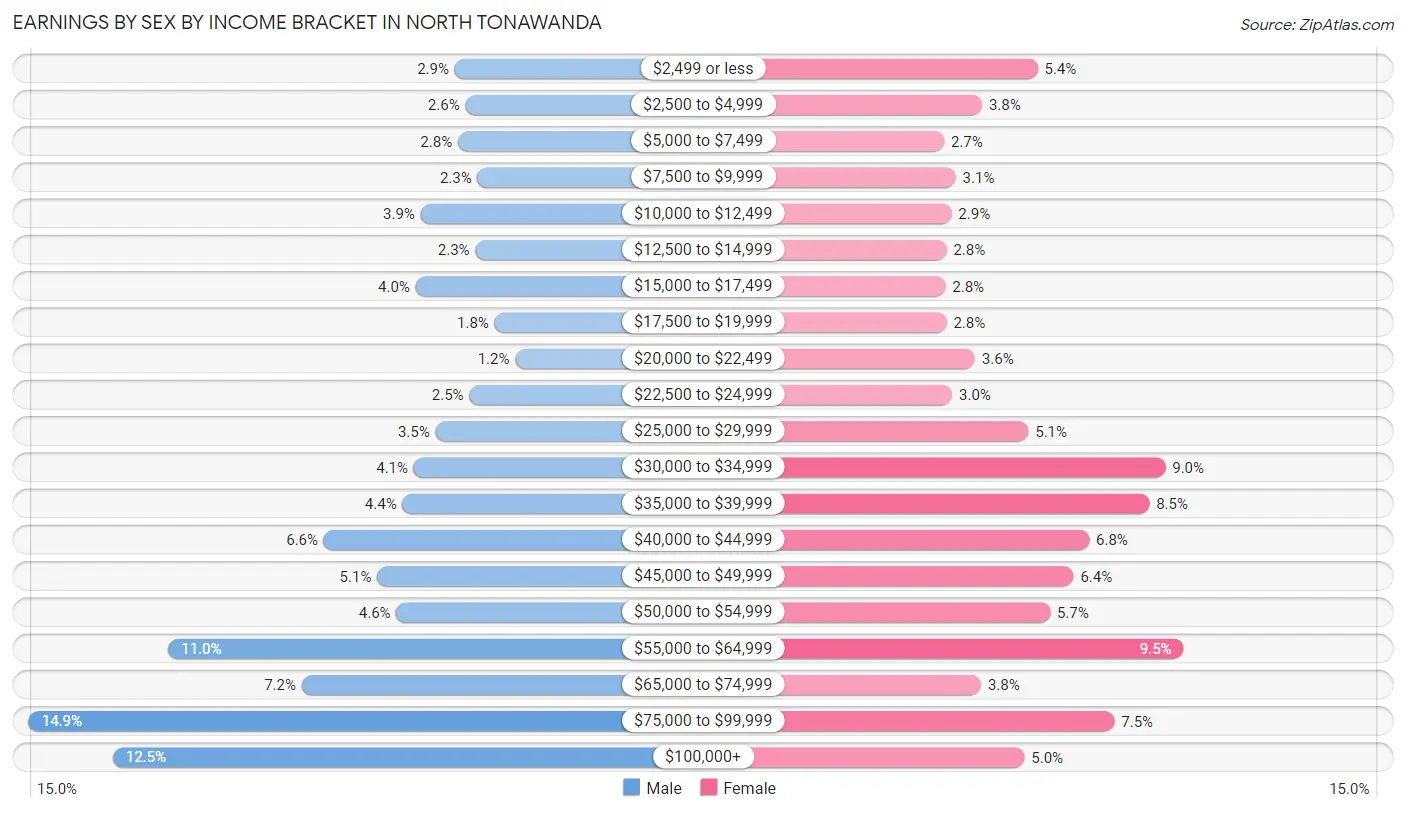
Earnings by Sex by Income Bracket in North Tonawanda
The most common earnings brackets in North Tonawanda are $75,000 to $99,999 for men (1,366 | 14.9%) and $55,000 to $64,999 for women (747 | 9.5%).
| Income | Male | Female |
| $2,499 or less | 267 (2.9%) | 423 (5.4%) |
| $2,500 to $4,999 | 240 (2.6%) | 300 (3.8%) |
| $5,000 to $7,499 | 259 (2.8%) | 216 (2.7%) |
| $7,500 to $9,999 | 208 (2.3%) | 242 (3.1%) |
| $10,000 to $12,499 | 355 (3.9%) | 232 (2.9%) |
| $12,500 to $14,999 | 214 (2.3%) | 221 (2.8%) |
| $15,000 to $17,499 | 368 (4.0%) | 219 (2.8%) |
| $17,500 to $19,999 | 164 (1.8%) | 221 (2.8%) |
| $20,000 to $22,499 | 111 (1.2%) | 284 (3.6%) |
| $22,500 to $24,999 | 230 (2.5%) | 234 (3.0%) |
| $25,000 to $29,999 | 317 (3.5%) | 403 (5.1%) |
| $30,000 to $34,999 | 373 (4.1%) | 707 (8.9%) |
| $35,000 to $39,999 | 402 (4.4%) | 671 (8.5%) |
| $40,000 to $44,999 | 605 (6.6%) | 538 (6.8%) |
| $45,000 to $49,999 | 467 (5.1%) | 503 (6.4%) |
| $50,000 to $54,999 | 418 (4.5%) | 451 (5.7%) |
| $55,000 to $64,999 | 1,006 (11.0%) | 747 (9.5%) |
| $65,000 to $74,999 | 662 (7.2%) | 298 (3.8%) |
| $75,000 to $99,999 | 1,366 (14.9%) | 594 (7.5%) |
| $100,000+ | 1,150 (12.5%) | 394 (5.0%) |
| Total | 9,182 (100.0%) | 7,898 (100.0%) |
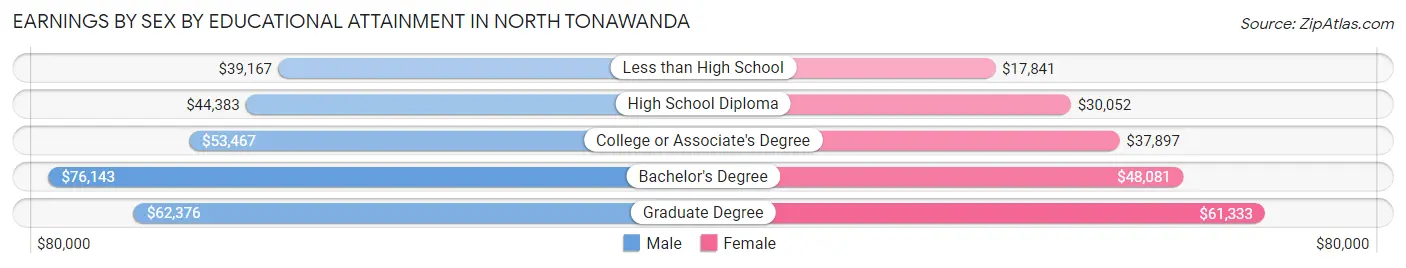
Earnings by Sex by Educational Attainment in North Tonawanda
Average earnings in North Tonawanda are $56,683 for men and $38,959 for women, a difference of 31.3%. Men with an educational attainment of bachelor's degree enjoy the highest average annual earnings of $76,143, while those with less than high school education earn the least with $39,167. Women with an educational attainment of graduate degree earn the most with the average annual earnings of $61,333, while those with less than high school education have the smallest earnings of $17,841.
| Educational Attainment | Male Income | Female Income |
| Less than High School | $39,167 | $17,841 |
| High School Diploma | $44,383 | $30,052 |
| College or Associate's Degree | $53,467 | $37,897 |
| Bachelor's Degree | $76,143 | $48,081 |
| Graduate Degree | $62,376 | $61,333 |
| Total | $56,683 | $38,959 |
Family Income in North Tonawanda
Family Income Brackets in North Tonawanda
According to the North Tonawanda family income data, there are 1,913 families falling into the $100,000 to $149,999 income range, which is the most common income bracket and makes up 23.5% of all families. Conversely, the $10,000 to $14,999 income bracket is the least frequent group with only 122 families (1.5%) belonging to this category.
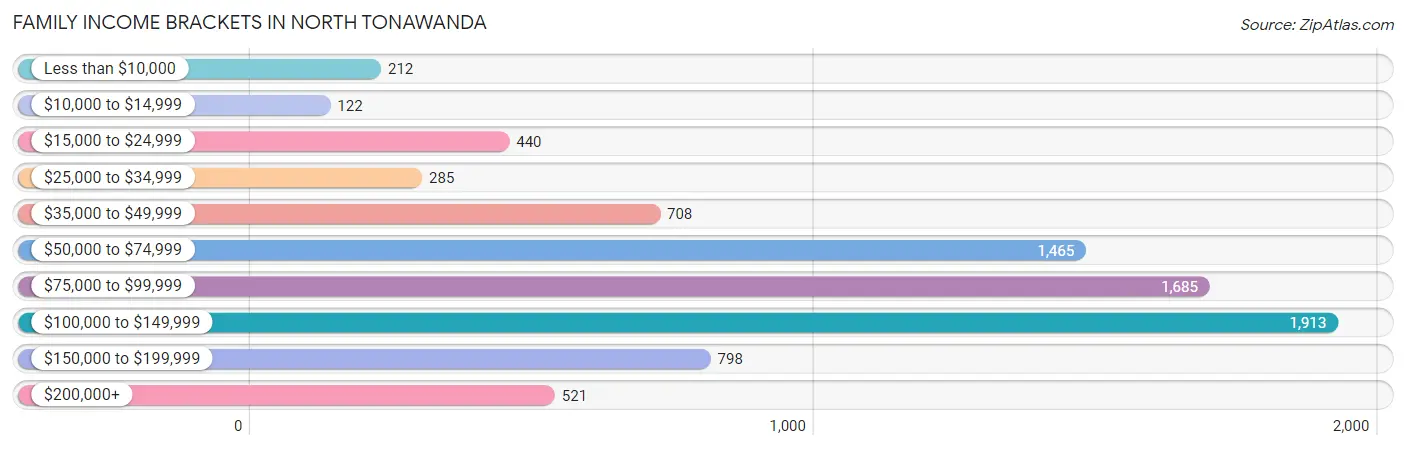
| Income Bracket | # Families | % Families |
| Less than $10,000 | 212 | 2.6% |
| $10,000 to $14,999 | 122 | 1.5% |
| $15,000 to $24,999 | 440 | 5.4% |
| $25,000 to $34,999 | 285 | 3.5% |
| $35,000 to $49,999 | 708 | 8.7% |
| $50,000 to $74,999 | 1,465 | 18.0% |
| $75,000 to $99,999 | 1,685 | 20.7% |
| $100,000 to $149,999 | 1,913 | 23.5% |
| $150,000 to $199,999 | 798 | 9.8% |
| $200,000+ | 521 | 6.4% |
Family Income by Famaliy Size in North Tonawanda
3-person families (1,795 | 22.1%) account for the highest median family income in North Tonawanda with $100,641 per family, while 2-person families (4,404 | 54.1%) have the highest median income of $38,800 per family member.
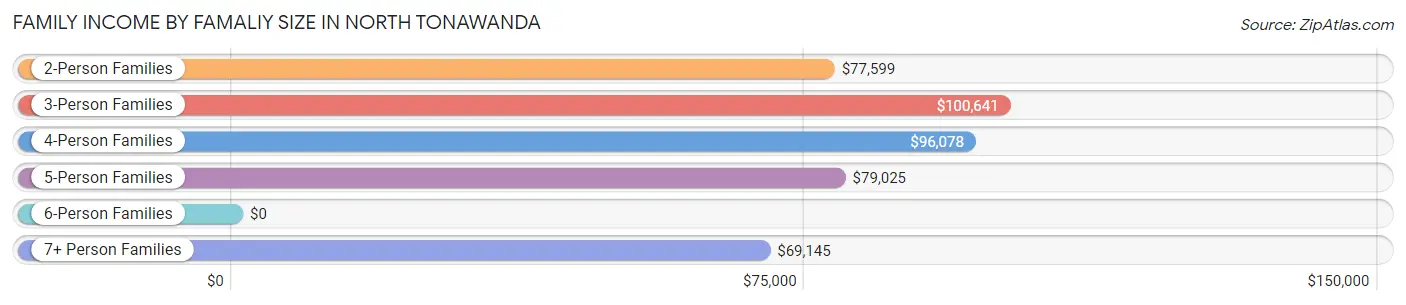
| Income Bracket | # Families | Median Income |
| 2-Person Families | 4,404 (54.1%) | $77,599 |
| 3-Person Families | 1,795 (22.1%) | $100,641 |
| 4-Person Families | 1,342 (16.5%) | $96,078 |
| 5-Person Families | 371 (4.6%) | $79,025 |
| 6-Person Families | 183 (2.2%) | $0 |
| 7+ Person Families | 45 (0.5%) | $69,145 |
| Total | 8,140 (100.0%) | $88,833 |
Family Income by Number of Earners in North Tonawanda
The median family income in North Tonawanda is $88,833, with families comprising 3+ earners (824) having the highest median family income of $148,824, while families with no earners (1,279) have the lowest median family income of $51,761, accounting for 10.1% and 15.7% of families, respectively.
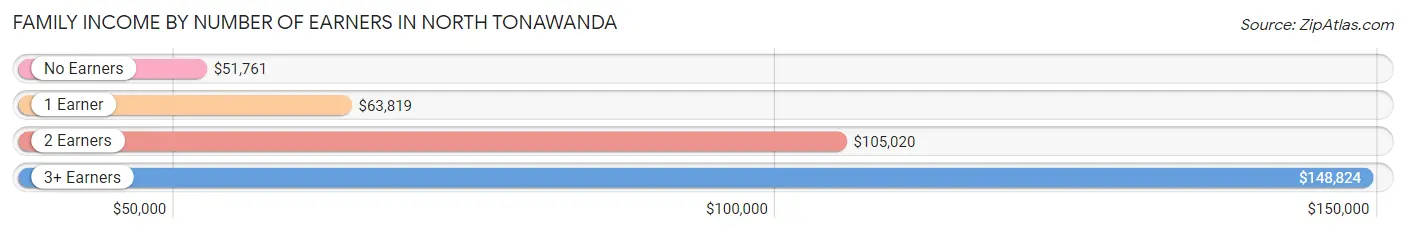
| Number of Earners | # Families | Median Income |
| No Earners | 1,279 (15.7%) | $51,761 |
| 1 Earner | 2,344 (28.8%) | $63,819 |
| 2 Earners | 3,693 (45.4%) | $105,020 |
| 3+ Earners | 824 (10.1%) | $148,824 |
| Total | 8,140 (100.0%) | $88,833 |
Household Income in North Tonawanda
Household Income Brackets in North Tonawanda
With 2,469 households falling in the category, the $100,000 to $149,999 income range is the most frequent in North Tonawanda, accounting for 18.1% of all households. In contrast, only 573 households (4.2%) fall into the $10,000 to $14,999 income bracket, making it the least populous group.
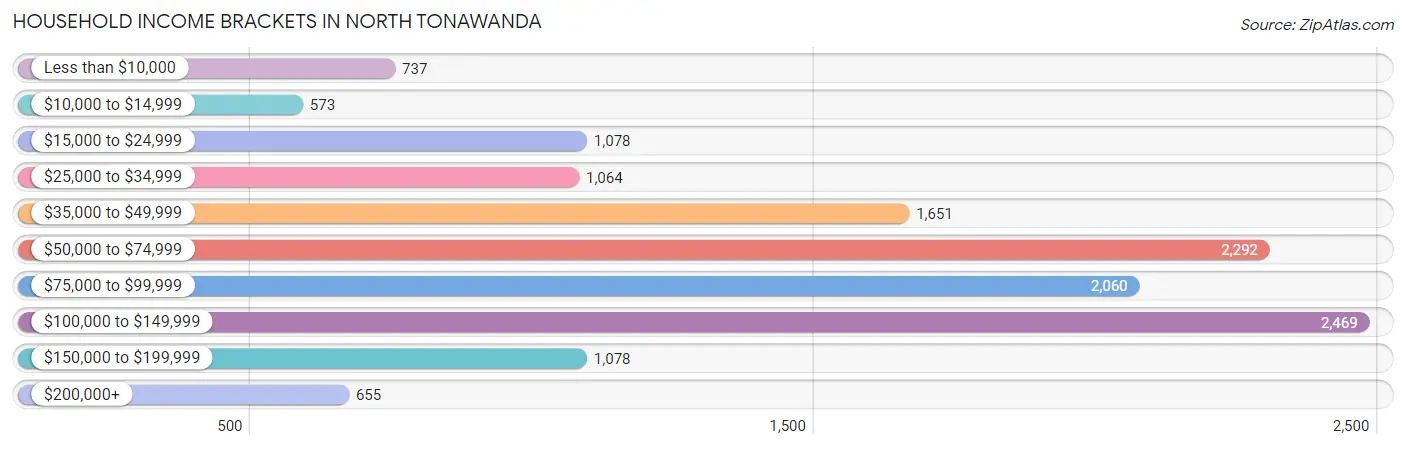
| Income Bracket | # Households | % Households |
| Less than $10,000 | 737 | 5.4% |
| $10,000 to $14,999 | 573 | 4.2% |
| $15,000 to $24,999 | 1,078 | 7.9% |
| $25,000 to $34,999 | 1,064 | 7.8% |
| $35,000 to $49,999 | 1,651 | 12.1% |
| $50,000 to $74,999 | 2,292 | 16.8% |
| $75,000 to $99,999 | 2,060 | 15.1% |
| $100,000 to $149,999 | 2,469 | 18.1% |
| $150,000 to $199,999 | 1,078 | 7.9% |
| $200,000+ | 655 | 4.8% |
Household Income by Householder Age in North Tonawanda
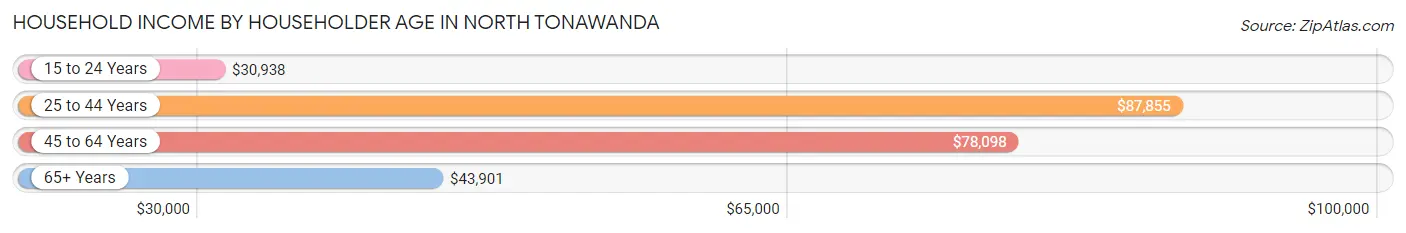
The median household income in North Tonawanda is $66,836, with the highest median household income of $87,855 found in the 25 to 44 years age bracket for the primary householder. A total of 3,971 households (29.1%) fall into this category. Meanwhile, the 15 to 24 years age bracket for the primary householder has the lowest median household income of $30,938, with 273 households (2.0%) in this group.
| Income Bracket | # Households | Median Income |
| 15 to 24 Years | 273 (2.0%) | $30,938 |
| 25 to 44 Years | 3,971 (29.1%) | $87,855 |
| 45 to 64 Years | 5,608 (41.1%) | $78,098 |
| 65+ Years | 3,791 (27.8%) | $43,901 |
| Total | 13,643 (100.0%) | $66,836 |
Poverty in North Tonawanda
Income Below Poverty by Sex and Age in North Tonawanda
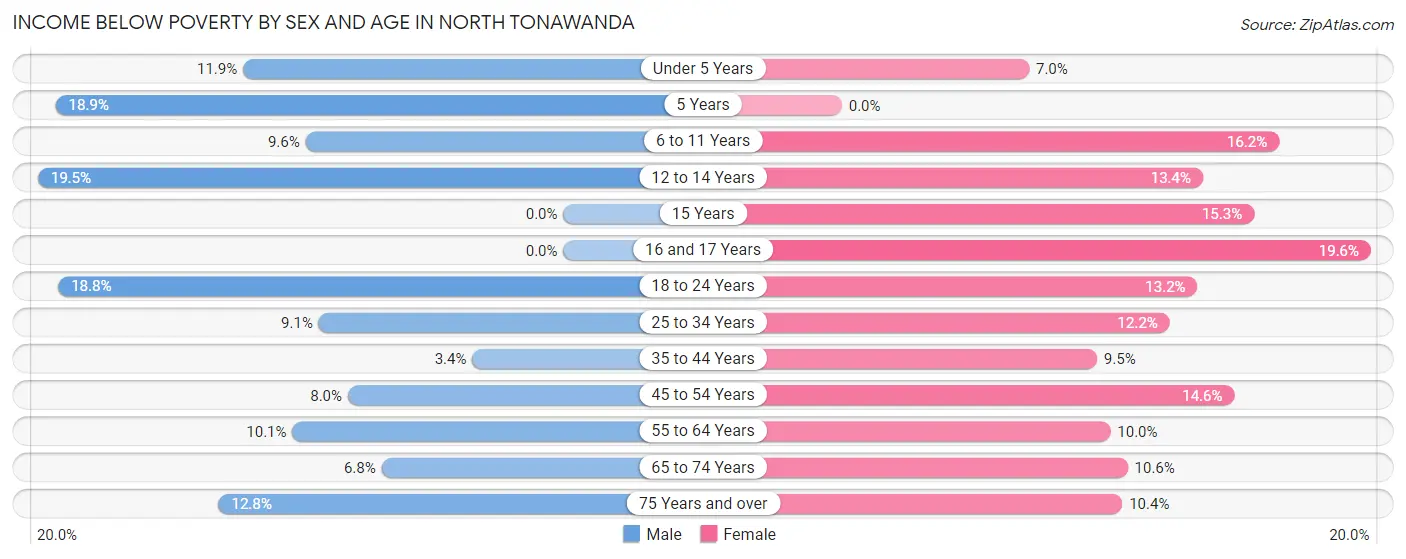
With 9.9% poverty level for males and 11.7% for females among the residents of North Tonawanda, 12 to 14 year old males and 16 and 17 year old females are the most vulnerable to poverty, with 104 males (19.5%) and 76 females (19.6%) in their respective age groups living below the poverty level.
| Age Bracket | Male | Female |
| Under 5 Years | 93 (11.9%) | 46 (7.0%) |
| 5 Years | 23 (18.9%) | 0 (0.0%) |
| 6 to 11 Years | 63 (9.6%) | 156 (16.2%) |
| 12 to 14 Years | 104 (19.5%) | 56 (13.4%) |
| 15 Years | 0 (0.0%) | 28 (15.3%) |
| 16 and 17 Years | 0 (0.0%) | 76 (19.6%) |
| 18 to 24 Years | 277 (18.8%) | 90 (13.2%) |
| 25 to 34 Years | 253 (9.1%) | 266 (12.2%) |
| 35 to 44 Years | 52 (3.4%) | 151 (9.5%) |
| 45 to 54 Years | 152 (8.0%) | 315 (14.6%) |
| 55 to 64 Years | 253 (10.1%) | 258 (10.0%) |
| 65 to 74 Years | 98 (6.8%) | 194 (10.6%) |
| 75 Years and over | 121 (12.8%) | 146 (10.4%) |
| Total | 1,489 (9.9%) | 1,782 (11.7%) |
Income Above Poverty by Sex and Age in North Tonawanda
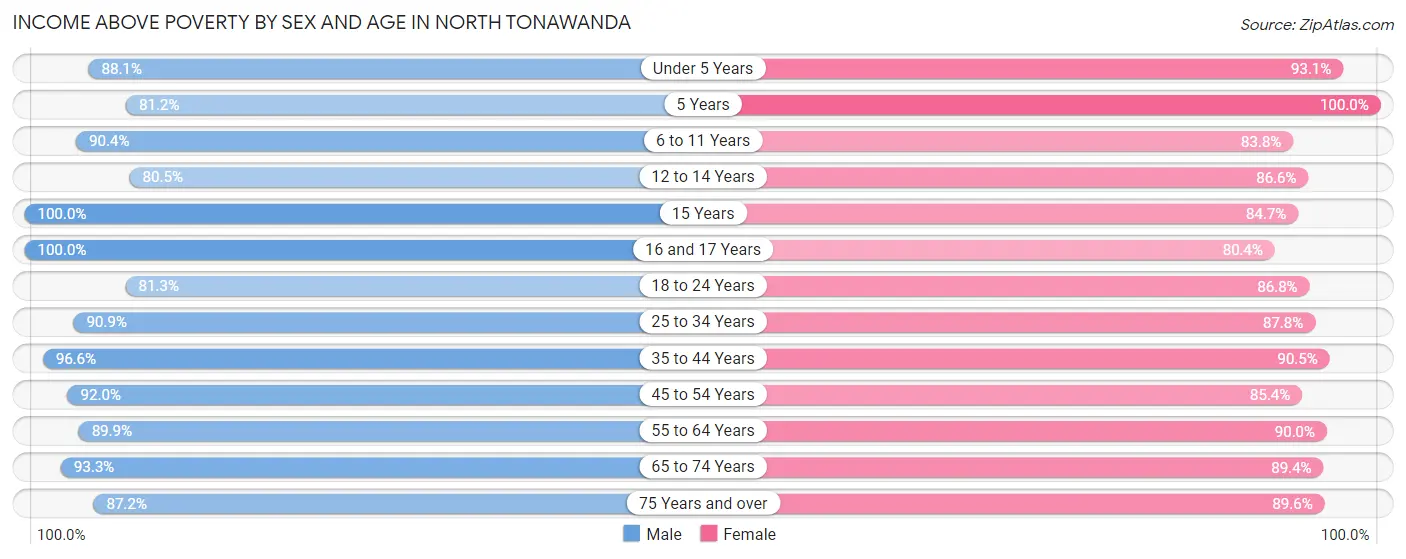
According to the poverty statistics in North Tonawanda, males aged 15 years and females aged 5 years are the age groups that are most secure financially, with 100.0% of males and 100.0% of females in these age groups living above the poverty line.
| Age Bracket | Male | Female |
| Under 5 Years | 689 (88.1%) | 616 (93.0%) |
| 5 Years | 99 (81.1%) | 175 (100.0%) |
| 6 to 11 Years | 595 (90.4%) | 805 (83.8%) |
| 12 to 14 Years | 429 (80.5%) | 362 (86.6%) |
| 15 Years | 109 (100.0%) | 155 (84.7%) |
| 16 and 17 Years | 208 (100.0%) | 311 (80.4%) |
| 18 to 24 Years | 1,200 (81.2%) | 592 (86.8%) |
| 25 to 34 Years | 2,533 (90.9%) | 1,920 (87.8%) |
| 35 to 44 Years | 1,488 (96.6%) | 1,444 (90.5%) |
| 45 to 54 Years | 1,747 (92.0%) | 1,847 (85.4%) |
| 55 to 64 Years | 2,261 (89.9%) | 2,330 (90.0%) |
| 65 to 74 Years | 1,354 (93.2%) | 1,635 (89.4%) |
| 75 Years and over | 824 (87.2%) | 1,257 (89.6%) |
| Total | 13,536 (90.1%) | 13,449 (88.3%) |
Income Below Poverty Among Married-Couple Families in North Tonawanda
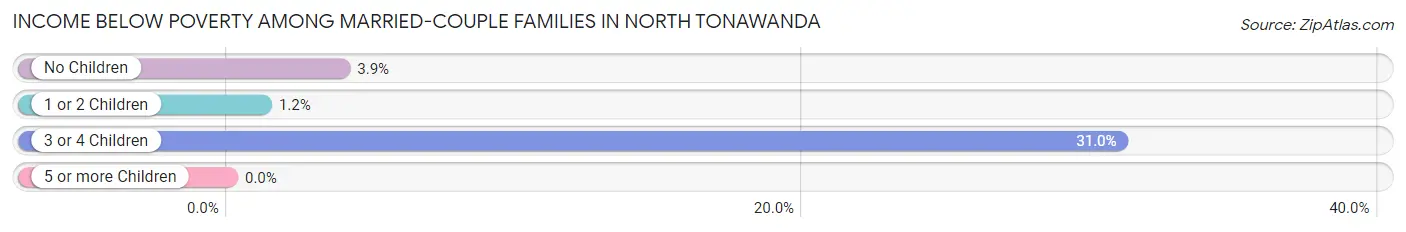
The poverty statistics for married-couple families in North Tonawanda show that 4.8% or 296 of the total 6,145 families live below the poverty line. Families with 3 or 4 children have the highest poverty rate of 31.0%, comprising of 115 families. On the other hand, families with 5 or more children have the lowest poverty rate of 0.0%, which includes 0 families.
| Children | Above Poverty | Below Poverty |
| No Children | 3,979 (96.1%) | 162 (3.9%) |
| 1 or 2 Children | 1,588 (98.8%) | 19 (1.2%) |
| 3 or 4 Children | 256 (69.0%) | 115 (31.0%) |
| 5 or more Children | 26 (100.0%) | 0 (0.0%) |
| Total | 5,849 (95.2%) | 296 (4.8%) |
Income Below Poverty Among Single-Parent Households in North Tonawanda
According to the poverty data in North Tonawanda, 12.0% or 66 single-father households and 16.0% or 231 single-mother households are living below the poverty line. Among single-father households, those with 3 or 4 children have the highest poverty rate, with 35 households (43.2%) experiencing poverty. Likewise, among single-mother households, those with 1 or 2 children have the highest poverty rate, with 154 households (23.1%) falling below the poverty line.
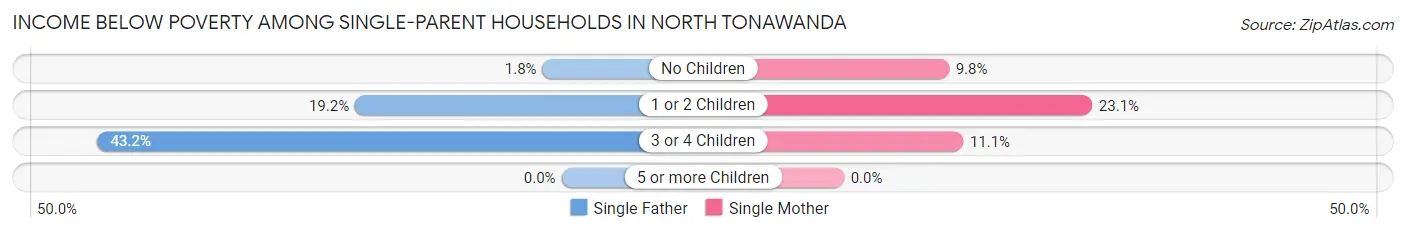
| Children | Single Father | Single Mother |
| No Children | 6 (1.8%) | 70 (9.8%) |
| 1 or 2 Children | 25 (19.2%) | 154 (23.1%) |
| 3 or 4 Children | 35 (43.2%) | 7 (11.1%) |
| 5 or more Children | 0 (0.0%) | 0 (0.0%) |
| Total | 66 (12.0%) | 231 (16.0%) |
Income Below Poverty Among Married-Couple vs Single-Parent Households in North Tonawanda
The poverty data for North Tonawanda shows that 296 of the married-couple family households (4.8%) and 297 of the single-parent households (14.9%) are living below the poverty level. Within the married-couple family households, those with 3 or 4 children have the highest poverty rate, with 115 households (31.0%) falling below the poverty line. Among the single-parent households, those with 3 or 4 children have the highest poverty rate, with 42 household (29.2%) living below poverty.
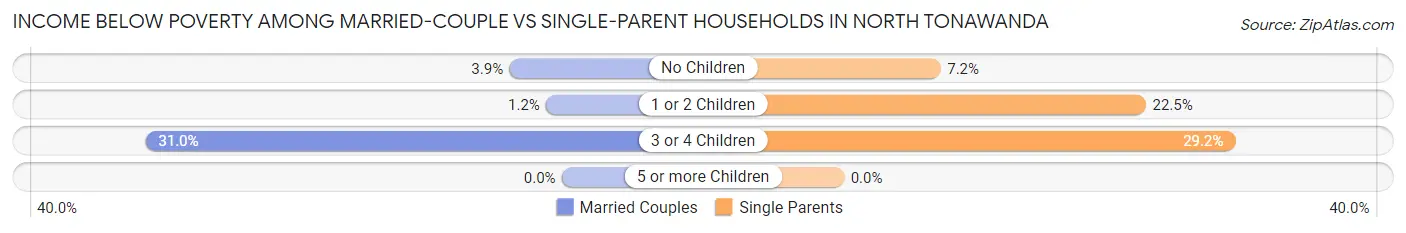
| Children | Married-Couple Families | Single-Parent Households |
| No Children | 162 (3.9%) | 76 (7.2%) |
| 1 or 2 Children | 19 (1.2%) | 179 (22.5%) |
| 3 or 4 Children | 115 (31.0%) | 42 (29.2%) |
| 5 or more Children | 0 (0.0%) | 0 (0.0%) |
| Total | 296 (4.8%) | 297 (14.9%) |
Race in North Tonawanda
The most populous races in North Tonawanda are White / Caucasian (28,311 | 92.9%), Two or more Races (1,056 | 3.5%), and Hispanic or Latino (660 | 2.2%).
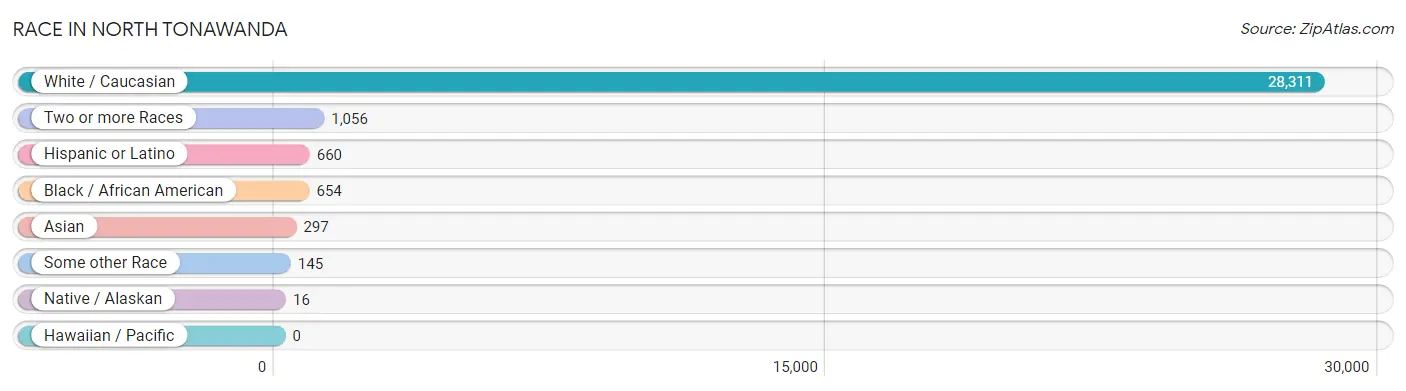
| Race | # Population | % Population |
| Asian | 297 | 1.0% |
| Black / African American | 654 | 2.1% |
| Hawaiian / Pacific | 0 | 0.0% |
| Hispanic or Latino | 660 | 2.2% |
| Native / Alaskan | 16 | 0.1% |
| White / Caucasian | 28,311 | 92.9% |
| Two or more Races | 1,056 | 3.5% |
| Some other Race | 145 | 0.5% |
| Total | 30,479 | 100.0% |
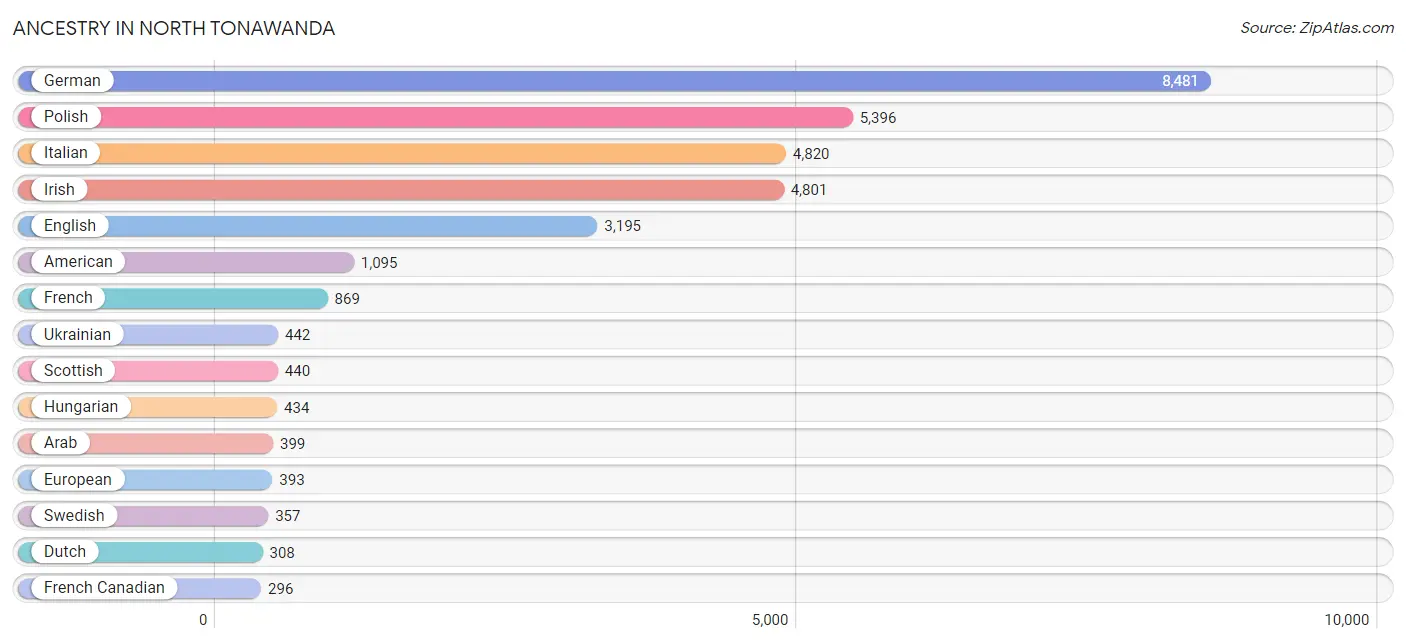
Ancestry in North Tonawanda
The most populous ancestries reported in North Tonawanda are German (8,481 | 27.8%), Polish (5,396 | 17.7%), Italian (4,820 | 15.8%), Irish (4,801 | 15.8%), and English (3,195 | 10.5%), together accounting for 87.6% of all North Tonawanda residents.
| Ancestry | # Population | % Population |
| Alaska Native | 47 | 0.2% |
| Alsatian | 24 | 0.1% |
| American | 1,095 | 3.6% |
| Arab | 399 | 1.3% |
| Austrian | 17 | 0.1% |
| Belgian | 25 | 0.1% |
| Bhutanese | 42 | 0.1% |
| Blackfeet | 34 | 0.1% |
| British | 124 | 0.4% |
| Bulgarian | 15 | 0.1% |
| Burmese | 78 | 0.3% |
| Canadian | 193 | 0.6% |
| Central American | 50 | 0.2% |
| Colombian | 20 | 0.1% |
| Croatian | 12 | 0.0% |
| Cuban | 168 | 0.5% |
| Czech | 71 | 0.2% |
| Czechoslovakian | 10 | 0.0% |
| Danish | 34 | 0.1% |
| Dutch | 308 | 1.0% |
| Eastern European | 106 | 0.4% |
| English | 3,195 | 10.5% |
| European | 393 | 1.3% |
| Filipino | 42 | 0.1% |
| Finnish | 10 | 0.0% |
| French | 869 | 2.9% |
| French Canadian | 296 | 1.0% |
| German | 8,481 | 27.8% |
| Greek | 121 | 0.4% |
| Guatemalan | 28 | 0.1% |
| Hungarian | 434 | 1.4% |
| Indian (Asian) | 80 | 0.3% |
| Irish | 4,801 | 15.8% |
| Iroquois | 201 | 0.7% |
| Italian | 4,820 | 15.8% |
| Jamaican | 149 | 0.5% |
| Korean | 45 | 0.2% |
| Lebanese | 45 | 0.2% |
| Lithuanian | 44 | 0.1% |
| Mexican | 99 | 0.3% |
| Northern European | 25 | 0.1% |
| Norwegian | 103 | 0.3% |
| Pakistani | 10 | 0.0% |
| Palestinian | 211 | 0.7% |
| Pennsylvania German | 58 | 0.2% |
| Polish | 5,396 | 17.7% |
| Portuguese | 12 | 0.0% |
| Puerto Rican | 239 | 0.8% |
| Romanian | 78 | 0.3% |
| Russian | 287 | 0.9% |
| Salvadoran | 22 | 0.1% |
| Scotch-Irish | 131 | 0.4% |
| Scottish | 440 | 1.4% |
| Serbian | 8 | 0.0% |
| Slavic | 21 | 0.1% |
| Slovak | 67 | 0.2% |
| Slovene | 20 | 0.1% |
| South American | 20 | 0.1% |
| Spaniard | 5 | 0.0% |
| Spanish | 42 | 0.1% |
| Swedish | 357 | 1.2% |
| Swiss | 88 | 0.3% |
| Syrian | 118 | 0.4% |
| Thai | 45 | 0.2% |
| Turkish | 24 | 0.1% |
| Ukrainian | 442 | 1.5% |
| Welsh | 206 | 0.7% | View All 67 Rows |
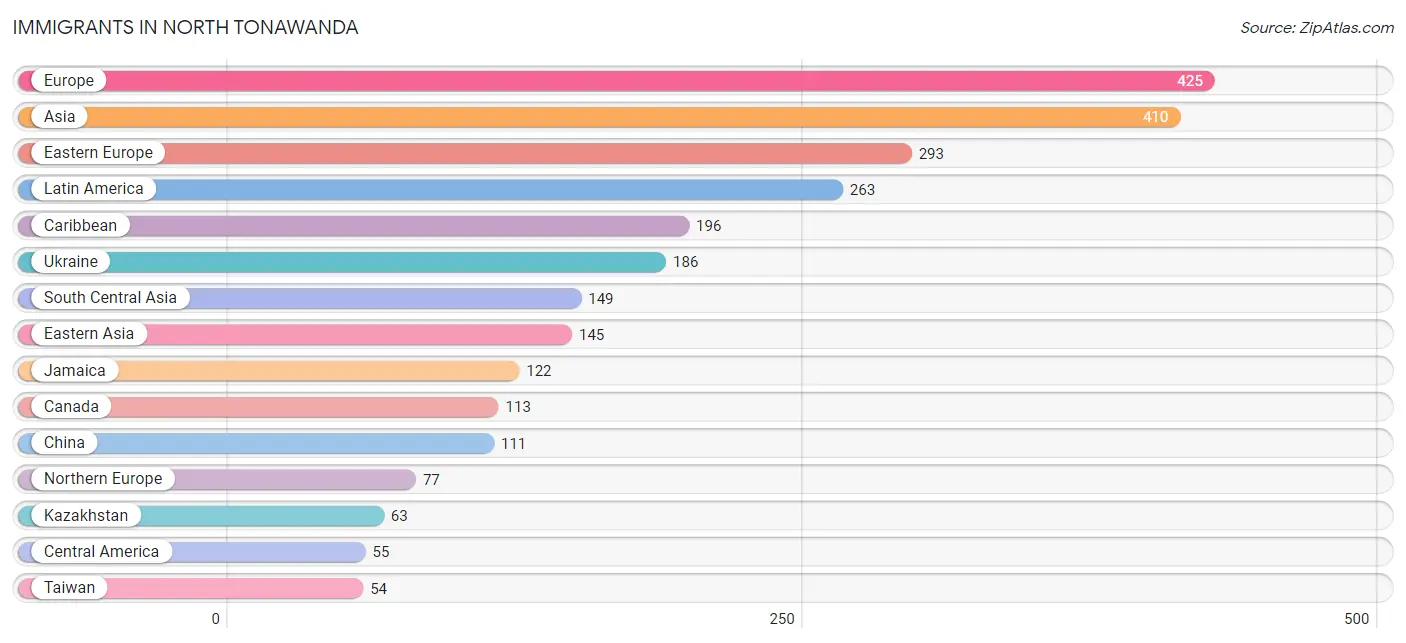
Immigrants in North Tonawanda
The most numerous immigrant groups reported in North Tonawanda came from Europe (425 | 1.4%), Asia (410 | 1.3%), Eastern Europe (293 | 1.0%), Latin America (263 | 0.9%), and Caribbean (196 | 0.6%), together accounting for 5.2% of all North Tonawanda residents.
| Immigration Origin | # Population | % Population |
| Asia | 410 | 1.3% |
| Barbados | 39 | 0.1% |
| Belarus | 26 | 0.1% |
| Brazil | 12 | 0.0% |
| Canada | 113 | 0.4% |
| Caribbean | 196 | 0.6% |
| Central America | 55 | 0.2% |
| China | 111 | 0.4% |
| Dominican Republic | 35 | 0.1% |
| Eastern Asia | 145 | 0.5% |
| Eastern Europe | 293 | 1.0% |
| El Salvador | 22 | 0.1% |
| England | 35 | 0.1% |
| Europe | 425 | 1.4% |
| Germany | 40 | 0.1% |
| Guatemala | 21 | 0.1% |
| India | 40 | 0.1% |
| Iran | 3 | 0.0% |
| Israel | 6 | 0.0% |
| Italy | 15 | 0.1% |
| Jamaica | 122 | 0.4% |
| Japan | 17 | 0.1% |
| Kazakhstan | 63 | 0.2% |
| Korea | 17 | 0.1% |
| Kuwait | 2 | 0.0% |
| Latin America | 263 | 0.9% |
| Mexico | 12 | 0.0% |
| Northern Europe | 77 | 0.3% |
| Philippines | 4 | 0.0% |
| Poland | 30 | 0.1% |
| Russia | 51 | 0.2% |
| Saudi Arabia | 44 | 0.1% |
| Scotland | 9 | 0.0% |
| South America | 12 | 0.0% |
| South Central Asia | 149 | 0.5% |
| South Eastern Asia | 4 | 0.0% |
| Southern Europe | 15 | 0.1% |
| Taiwan | 54 | 0.2% |
| Ukraine | 186 | 0.6% |
| Uzbekistan | 9 | 0.0% |
| Western Asia | 52 | 0.2% |
| Western Europe | 40 | 0.1% | View All 42 Rows |
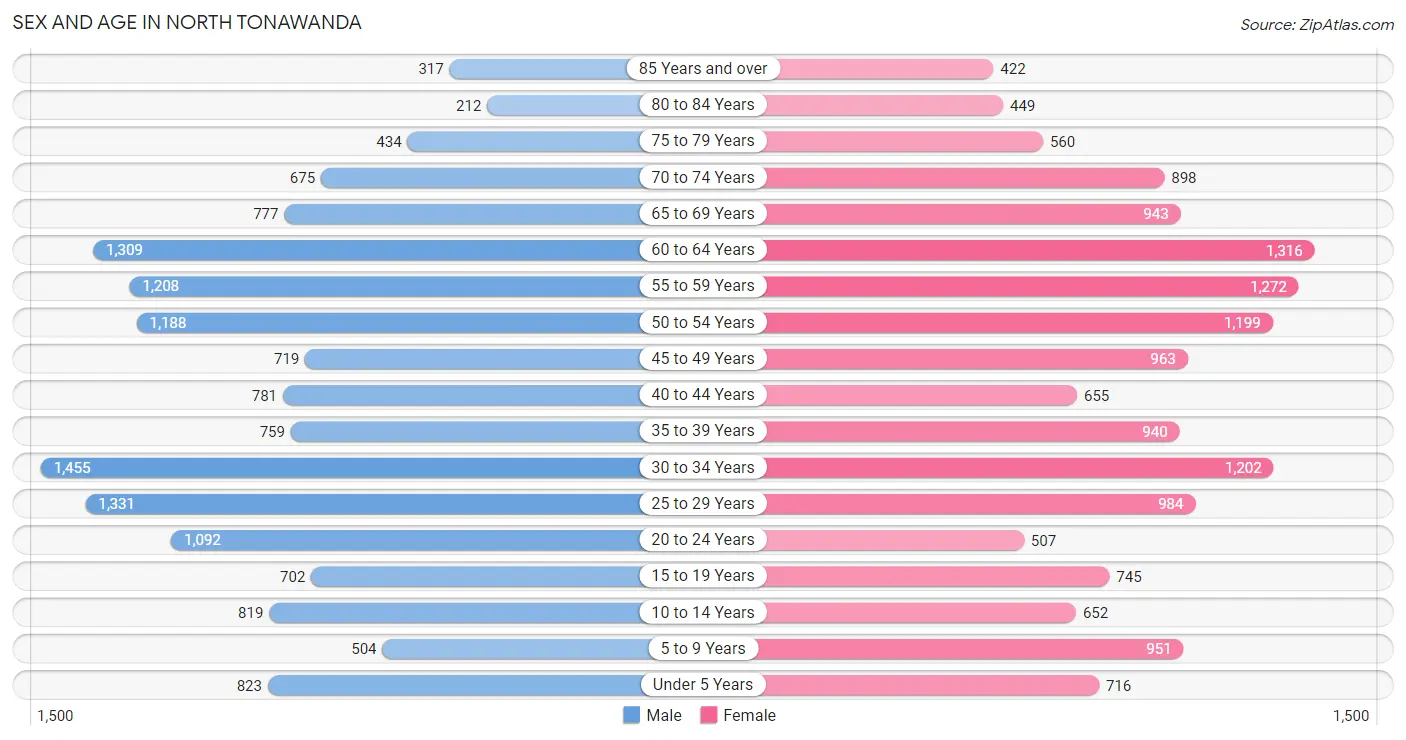
Sex and Age in North Tonawanda
Sex and Age in North Tonawanda
The most populous age groups in North Tonawanda are 30 to 34 Years (1,455 | 9.6%) for men and 60 to 64 Years (1,316 | 8.6%) for women.
| Age Bracket | Male | Female |
| Under 5 Years | 823 (5.4%) | 716 (4.7%) |
| 5 to 9 Years | 504 (3.3%) | 951 (6.2%) |
| 10 to 14 Years | 819 (5.4%) | 652 (4.2%) |
| 15 to 19 Years | 702 (4.6%) | 745 (4.9%) |
| 20 to 24 Years | 1,092 (7.2%) | 507 (3.3%) |
| 25 to 29 Years | 1,331 (8.8%) | 984 (6.4%) |
| 30 to 34 Years | 1,455 (9.6%) | 1,202 (7.8%) |
| 35 to 39 Years | 759 (5.0%) | 940 (6.1%) |
| 40 to 44 Years | 781 (5.2%) | 655 (4.3%) |
| 45 to 49 Years | 719 (4.8%) | 963 (6.3%) |
| 50 to 54 Years | 1,188 (7.9%) | 1,199 (7.8%) |
| 55 to 59 Years | 1,208 (8.0%) | 1,272 (8.3%) |
| 60 to 64 Years | 1,309 (8.7%) | 1,316 (8.6%) |
| 65 to 69 Years | 777 (5.1%) | 943 (6.1%) |
| 70 to 74 Years | 675 (4.5%) | 898 (5.8%) |
| 75 to 79 Years | 434 (2.9%) | 560 (3.6%) |
| 80 to 84 Years | 212 (1.4%) | 449 (2.9%) |
| 85 Years and over | 317 (2.1%) | 422 (2.7%) |
| Total | 15,105 (100.0%) | 15,374 (100.0%) |
Families and Households in North Tonawanda
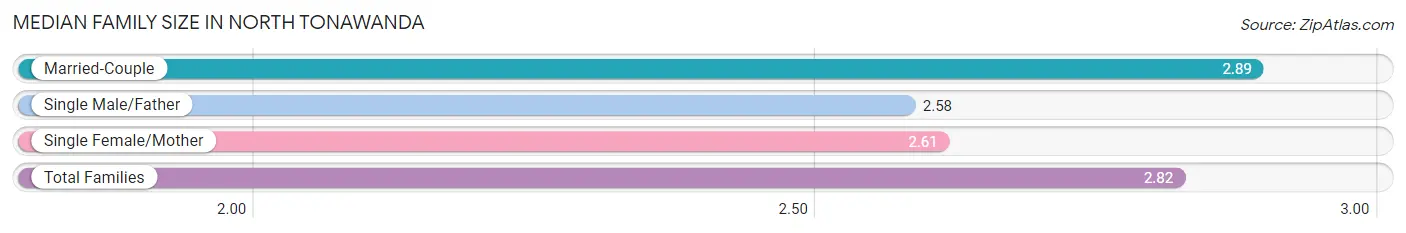
Median Family Size in North Tonawanda
The median family size in North Tonawanda is 2.82 persons per family, with married-couple families (6,145 | 75.5%) accounting for the largest median family size of 2.89 persons per family. On the other hand, single male/father families (550 | 6.8%) represent the smallest median family size with 2.58 persons per family.
| Family Type | # Families | Family Size |
| Married-Couple | 6,145 (75.5%) | 2.89 |
| Single Male/Father | 550 (6.8%) | 2.58 |
| Single Female/Mother | 1,445 (17.7%) | 2.61 |
| Total Families | 8,140 (100.0%) | 2.82 |
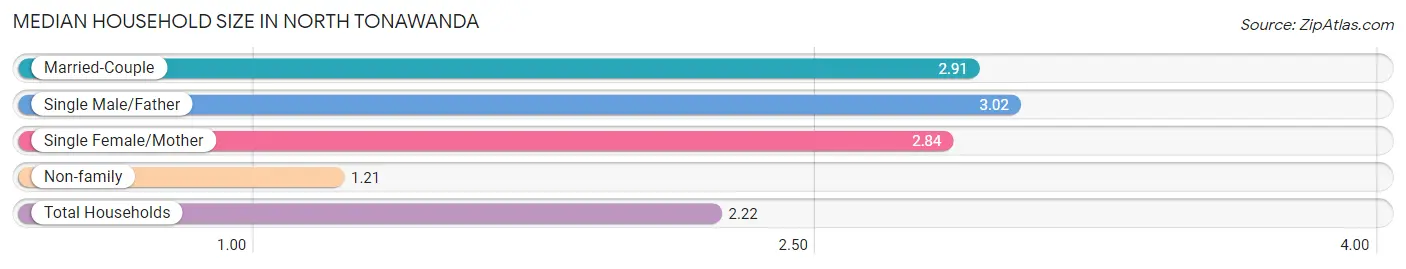
Median Household Size in North Tonawanda
The median household size in North Tonawanda is 2.22 persons per household, with single male/father households (550 | 4.0%) accounting for the largest median household size of 3.02 persons per household. non-family households (5,503 | 40.3%) represent the smallest median household size with 1.21 persons per household.
| Household Type | # Households | Household Size |
| Married-Couple | 6,145 (45.0%) | 2.91 |
| Single Male/Father | 550 (4.0%) | 3.02 |
| Single Female/Mother | 1,445 (10.6%) | 2.84 |
| Non-family | 5,503 (40.3%) | 1.21 |
| Total Households | 13,643 (100.0%) | 2.22 |
Household Size by Marriage Status in North Tonawanda
Out of a total of 13,643 households in North Tonawanda, 8,140 (59.7%) are family households, while 5,503 (40.3%) are nonfamily households. The most numerous type of family households are 2-person households, comprising 4,159, and the most common type of nonfamily households are 1-person households, comprising 4,526.
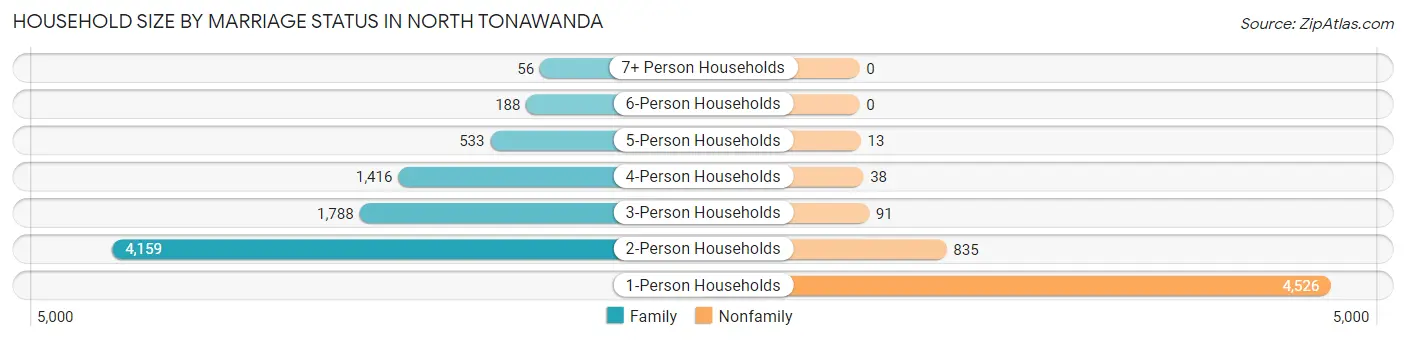
| Household Size | Family Households | Nonfamily Households |
| 1-Person Households | - | 4,526 (33.2%) |
| 2-Person Households | 4,159 (30.5%) | 835 (6.1%) |
| 3-Person Households | 1,788 (13.1%) | 91 (0.7%) |
| 4-Person Households | 1,416 (10.4%) | 38 (0.3%) |
| 5-Person Households | 533 (3.9%) | 13 (0.1%) |
| 6-Person Households | 188 (1.4%) | 0 (0.0%) |
| 7+ Person Households | 56 (0.4%) | 0 (0.0%) |
| Total | 8,140 (59.7%) | 5,503 (40.3%) |
Female Fertility in North Tonawanda
Fertility by Age in North Tonawanda
Average fertility rate in North Tonawanda is 54.0 births per 1,000 women. Women in the age bracket of 20 to 34 years have the highest fertility rate with 63.0 births per 1,000 women. Women in the age bracket of 20 to 34 years acount for 52.0% of all women with births.
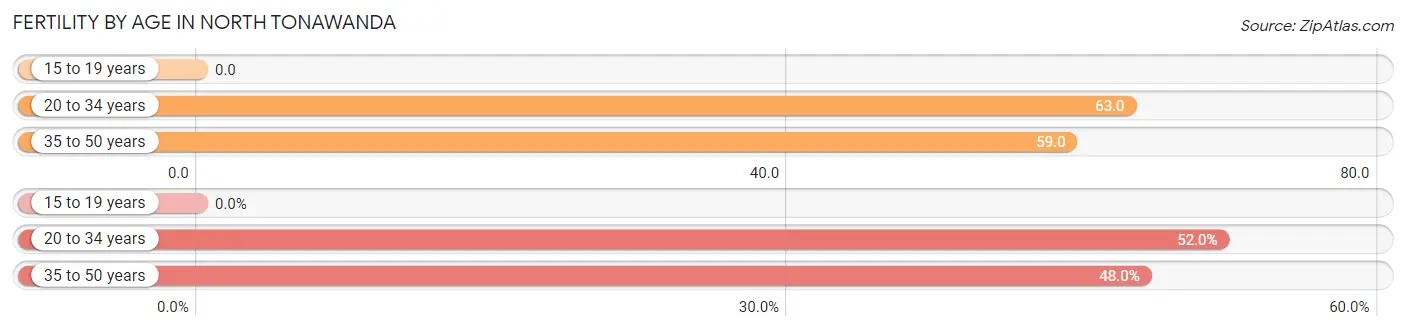
| Age Bracket | Women with Births | Births / 1,000 Women |
| 15 to 19 years | 0 (0.0%) | 0.0 |
| 20 to 34 years | 171 (52.0%) | 63.0 |
| 35 to 50 years | 158 (48.0%) | 59.0 |
| Total | 329 (100.0%) | 54.0 |
Fertility by Age by Marriage Status in North Tonawanda
83.3% of women with births (329) in North Tonawanda are married. The highest percentage of unmarried women with births falls into 20 to 34 years age bracket with 32.2% of them unmarried at the time of birth, while the lowest percentage of unmarried women with births belong to 35 to 50 years age bracket with 0.0% of them unmarried.
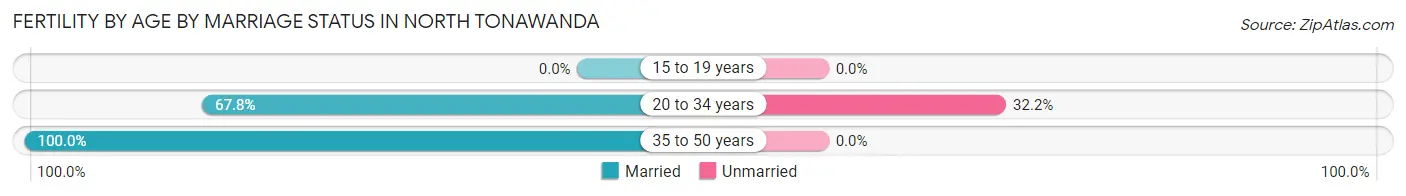
| Age Bracket | Married | Unmarried |
| 15 to 19 years | 0 (0.0%) | 0 (0.0%) |
| 20 to 34 years | 116 (67.8%) | 55 (32.2%) |
| 35 to 50 years | 158 (100.0%) | 0 (0.0%) |
| Total | 274 (83.3%) | 55 (16.7%) |
Fertility by Education in North Tonawanda
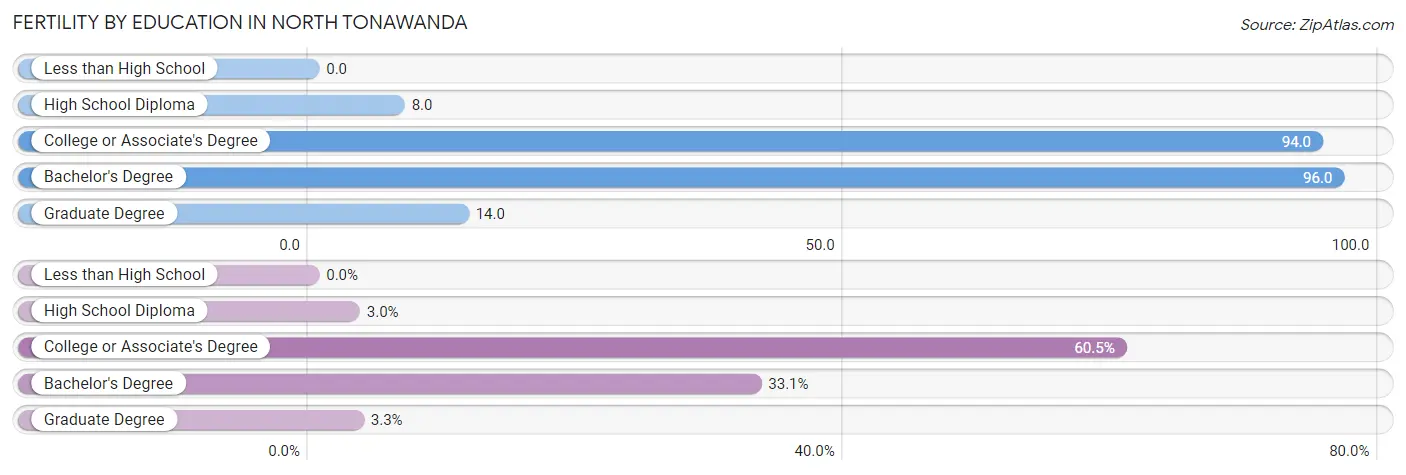
| Educational Attainment | Women with Births | Births / 1,000 Women |
| Less than High School | 0 (0.0%) | 0.0 |
| High School Diploma | 10 (3.0%) | 8.0 |
| College or Associate's Degree | 199 (60.5%) | 94.0 |
| Bachelor's Degree | 109 (33.1%) | 96.0 |
| Graduate Degree | 11 (3.3%) | 14.0 |
| Total | 329 (100.0%) | 54.0 |
Fertility by Education by Marriage Status in North Tonawanda
16.7% of women with births in North Tonawanda are unmarried. Women with the educational attainment of bachelor's degree are most likely to be married with 100.0% of them married at childbirth, while women with the educational attainment of high school diploma are least likely to be married with 100.0% of them unmarried at childbirth.
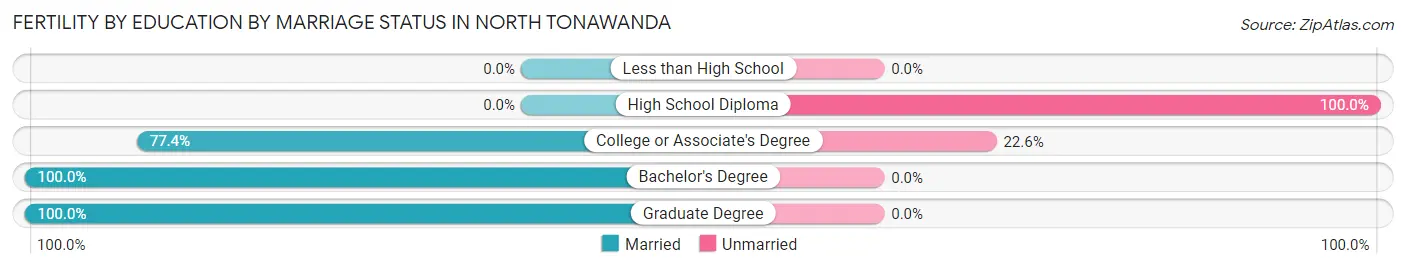
| Educational Attainment | Married | Unmarried |
| Less than High School | 0 (0.0%) | 0 (0.0%) |
| High School Diploma | 0 (0.0%) | 10 (100.0%) |
| College or Associate's Degree | 154 (77.4%) | 45 (22.6%) |
| Bachelor's Degree | 109 (100.0%) | 0 (0.0%) |
| Graduate Degree | 11 (100.0%) | 0 (0.0%) |
| Total | 274 (83.3%) | 55 (16.7%) |
Employment Characteristics in North Tonawanda
Employment by Class of Employer in North Tonawanda
Among the 15,388 employed individuals in North Tonawanda, private company employees (11,251 | 73.1%), not-for-profit organizations (1,460 | 9.5%), and local government employees (1,024 | 6.7%) make up the most common classes of employment.
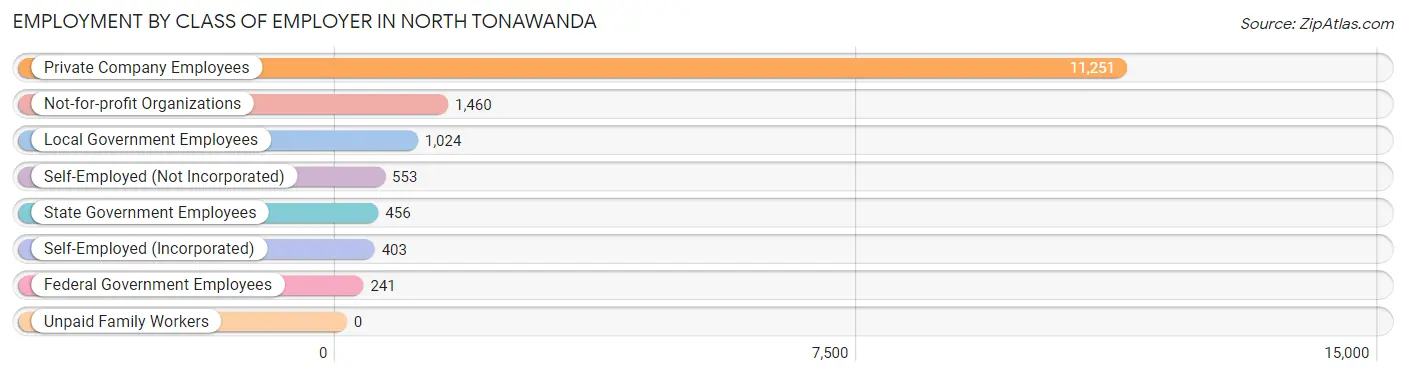
| Employer Class | # Employees | % Employees |
| Private Company Employees | 11,251 | 73.1% |
| Self-Employed (Incorporated) | 403 | 2.6% |
| Self-Employed (Not Incorporated) | 553 | 3.6% |
| Not-for-profit Organizations | 1,460 | 9.5% |
| Local Government Employees | 1,024 | 6.7% |
| State Government Employees | 456 | 3.0% |
| Federal Government Employees | 241 | 1.6% |
| Unpaid Family Workers | 0 | 0.0% |
| Total | 15,388 | 100.0% |
Employment Status by Age in North Tonawanda
According to the labor force statistics for North Tonawanda, out of the total population over 16 years of age (25,722), 64.7% or 16,642 individuals are in the labor force, with 5.6% or 932 of them unemployed. The age group with the highest labor force participation rate is 30 to 34 years, with 91.6% or 2,434 individuals in the labor force. Within the labor force, the 16 to 19 years age range has the highest percentage of unemployed individuals, with 27.1% or 179 of them being unemployed.
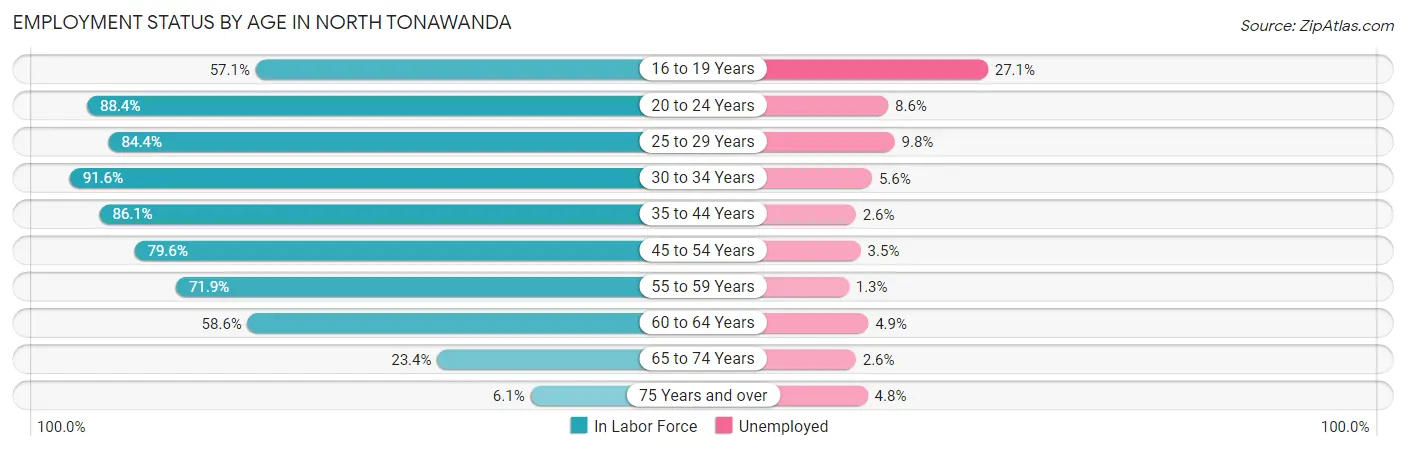
| Age Bracket | In Labor Force | Unemployed |
| 16 to 19 Years | 660 (57.1%) | 179 (27.1%) |
| 20 to 24 Years | 1,414 (88.4%) | 122 (8.6%) |
| 25 to 29 Years | 1,954 (84.4%) | 191 (9.8%) |
| 30 to 34 Years | 2,434 (91.6%) | 136 (5.6%) |
| 35 to 44 Years | 2,699 (86.1%) | 70 (2.6%) |
| 45 to 54 Years | 3,239 (79.6%) | 113 (3.5%) |
| 55 to 59 Years | 1,783 (71.9%) | 23 (1.3%) |
| 60 to 64 Years | 1,538 (58.6%) | 75 (4.9%) |
| 65 to 74 Years | 771 (23.4%) | 20 (2.6%) |
| 75 Years and over | 146 (6.1%) | 7 (4.8%) |
| Total | 16,642 (64.7%) | 932 (5.6%) |
Employment Status by Educational Attainment in North Tonawanda
According to labor force statistics for North Tonawanda, 79.0% of individuals (13,652) out of the total population between 25 and 64 years of age (17,281) are in the labor force, with 4.5% or 614 of them being unemployed. The group with the highest labor force participation rate are those with the educational attainment of bachelor's degree or higher, with 89.9% or 4,717 individuals in the labor force. Within the labor force, individuals with less than high school education have the highest percentage of unemployment, with 15.9% or 99 of them being unemployed.
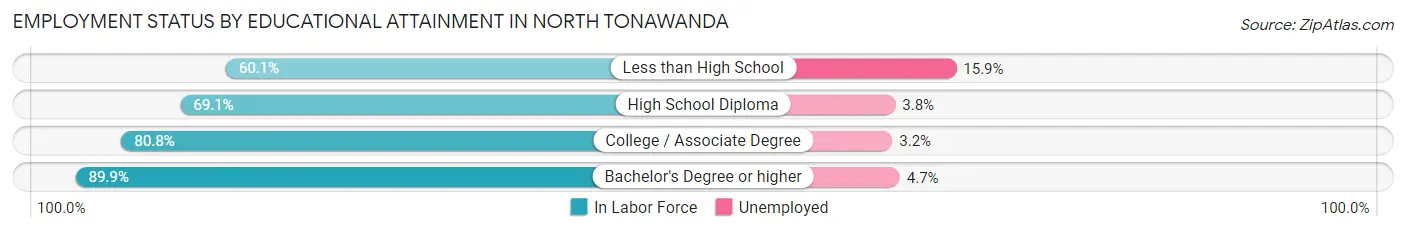
| Educational Attainment | In Labor Force | Unemployed |
| Less than High School | 624 (60.1%) | 165 (15.9%) |
| High School Diploma | 3,418 (69.1%) | 188 (3.8%) |
| College / Associate Degree | 4,887 (80.8%) | 194 (3.2%) |
| Bachelor's Degree or higher | 4,717 (89.9%) | 247 (4.7%) |
| Total | 13,652 (79.0%) | 778 (4.5%) |
Employment Occupations by Sex in North Tonawanda
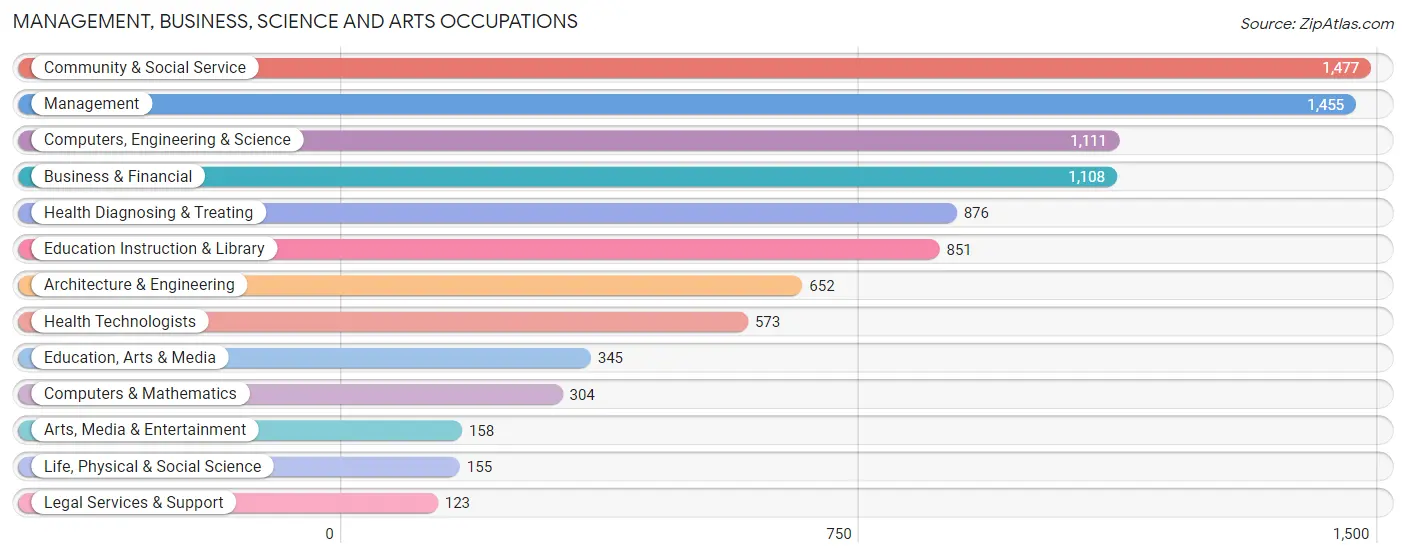
Management, Business, Science and Arts Occupations
The most common Management, Business, Science and Arts occupations in North Tonawanda are Community & Social Service (1,477 | 9.4%), Management (1,455 | 9.3%), Computers, Engineering & Science (1,111 | 7.1%), Business & Financial (1,108 | 7.1%), and Health Diagnosing & Treating (876 | 5.6%).
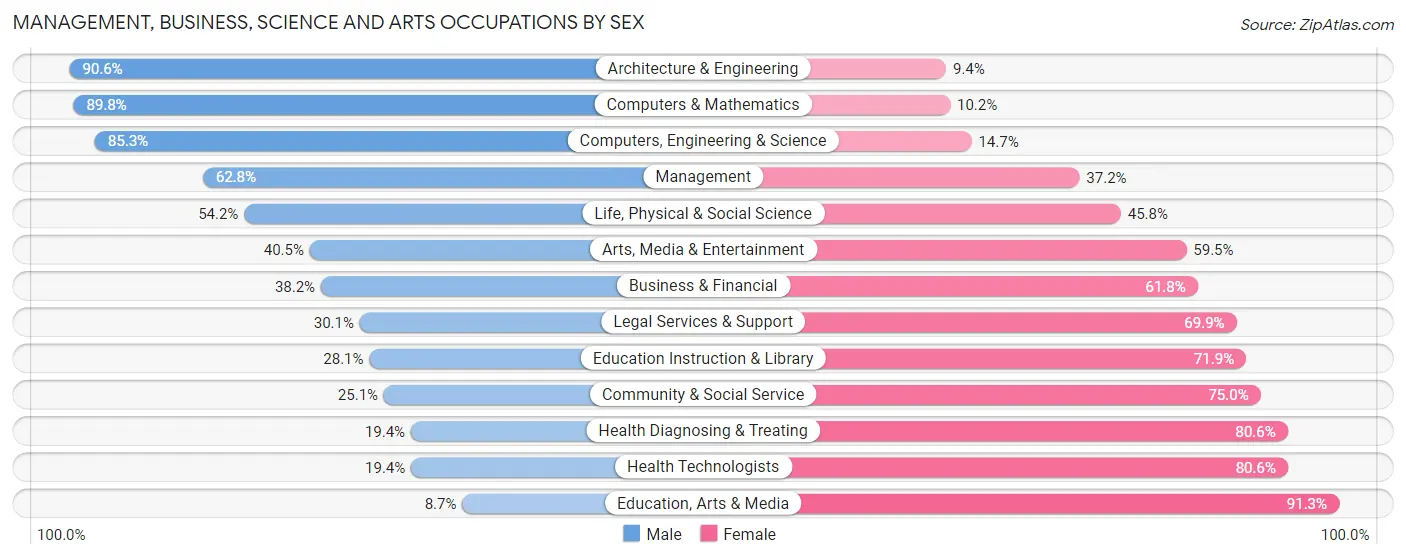
Management, Business, Science and Arts Occupations by Sex
Within the Management, Business, Science and Arts occupations in North Tonawanda, the most male-oriented occupations are Architecture & Engineering (90.6%), Computers & Mathematics (89.8%), and Computers, Engineering & Science (85.3%), while the most female-oriented occupations are Education, Arts & Media (91.3%), Health Technologists (80.6%), and Health Diagnosing & Treating (80.6%).
| Occupation | Male | Female |
| Management | 914 (62.8%) | 541 (37.2%) |
| Business & Financial | 423 (38.2%) | 685 (61.8%) |
| Computers, Engineering & Science | 948 (85.3%) | 163 (14.7%) |
| Computers & Mathematics | 273 (89.8%) | 31 (10.2%) |
| Architecture & Engineering | 591 (90.6%) | 61 (9.4%) |
| Life, Physical & Social Science | 84 (54.2%) | 71 (45.8%) |
| Community & Social Service | 370 (25.1%) | 1,107 (75.0%) |
| Education, Arts & Media | 30 (8.7%) | 315 (91.3%) |
| Legal Services & Support | 37 (30.1%) | 86 (69.9%) |
| Education Instruction & Library | 239 (28.1%) | 612 (71.9%) |
| Arts, Media & Entertainment | 64 (40.5%) | 94 (59.5%) |
| Health Diagnosing & Treating | 170 (19.4%) | 706 (80.6%) |
| Health Technologists | 111 (19.4%) | 462 (80.6%) |
| Total (Category) | 2,825 (46.9%) | 3,202 (53.1%) |
| Total (Overall) | 8,390 (53.5%) | 7,294 (46.5%) |
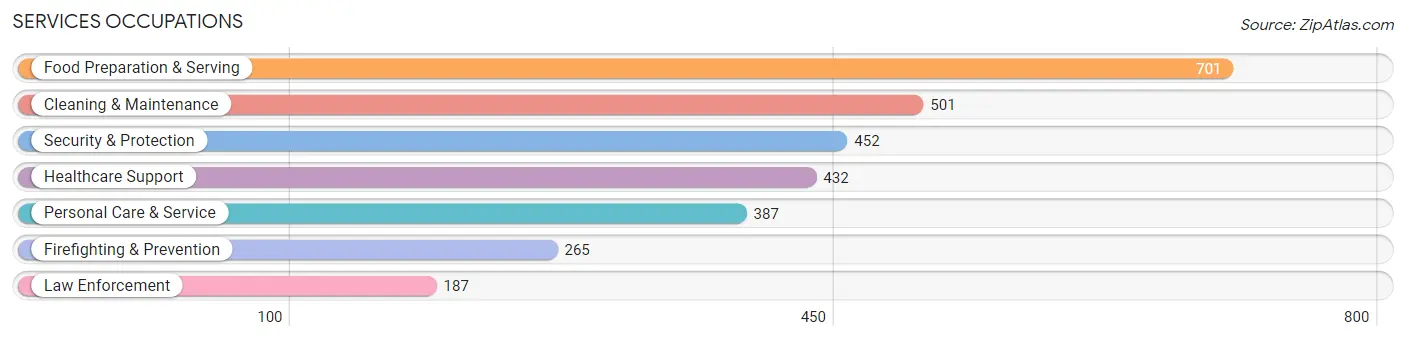
Services Occupations
The most common Services occupations in North Tonawanda are Food Preparation & Serving (701 | 4.5%), Cleaning & Maintenance (501 | 3.2%), Security & Protection (452 | 2.9%), Healthcare Support (432 | 2.8%), and Personal Care & Service (387 | 2.5%).
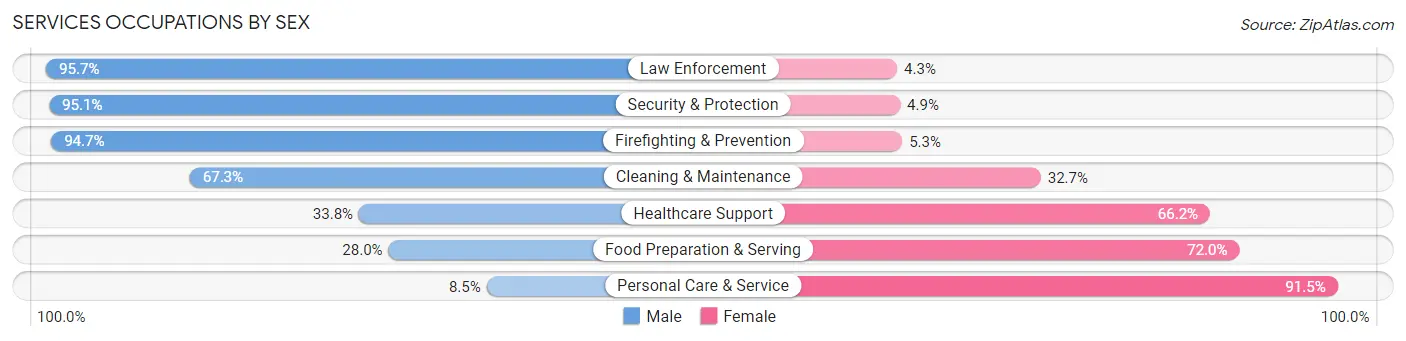
Services Occupations by Sex
Within the Services occupations in North Tonawanda, the most male-oriented occupations are Law Enforcement (95.7%), Security & Protection (95.1%), and Firefighting & Prevention (94.7%), while the most female-oriented occupations are Personal Care & Service (91.5%), Food Preparation & Serving (72.0%), and Healthcare Support (66.2%).
| Occupation | Male | Female |
| Healthcare Support | 146 (33.8%) | 286 (66.2%) |
| Security & Protection | 430 (95.1%) | 22 (4.9%) |
| Firefighting & Prevention | 251 (94.7%) | 14 (5.3%) |
| Law Enforcement | 179 (95.7%) | 8 (4.3%) |
| Food Preparation & Serving | 196 (28.0%) | 505 (72.0%) |
| Cleaning & Maintenance | 337 (67.3%) | 164 (32.7%) |
| Personal Care & Service | 33 (8.5%) | 354 (91.5%) |
| Total (Category) | 1,142 (46.2%) | 1,331 (53.8%) |
| Total (Overall) | 8,390 (53.5%) | 7,294 (46.5%) |
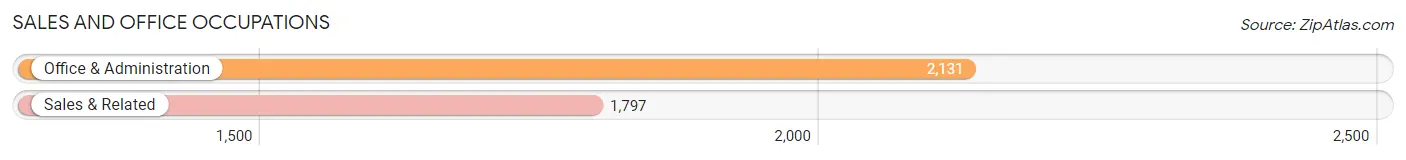
Sales and Office Occupations
The most common Sales and Office occupations in North Tonawanda are Office & Administration (2,131 | 13.6%), and Sales & Related (1,797 | 11.5%).
Sales and Office Occupations by Sex
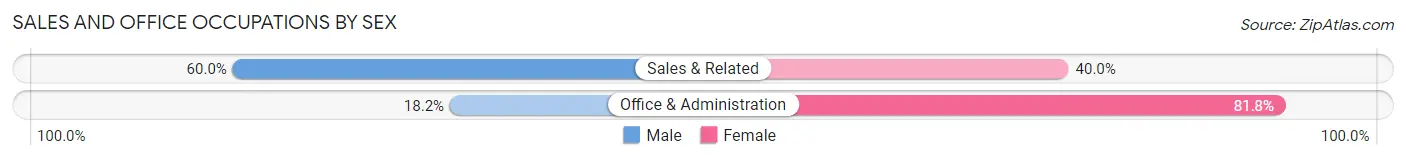
| Occupation | Male | Female |
| Sales & Related | 1,078 (60.0%) | 719 (40.0%) |
| Office & Administration | 388 (18.2%) | 1,743 (81.8%) |
| Total (Category) | 1,466 (37.3%) | 2,462 (62.7%) |
| Total (Overall) | 8,390 (53.5%) | 7,294 (46.5%) |
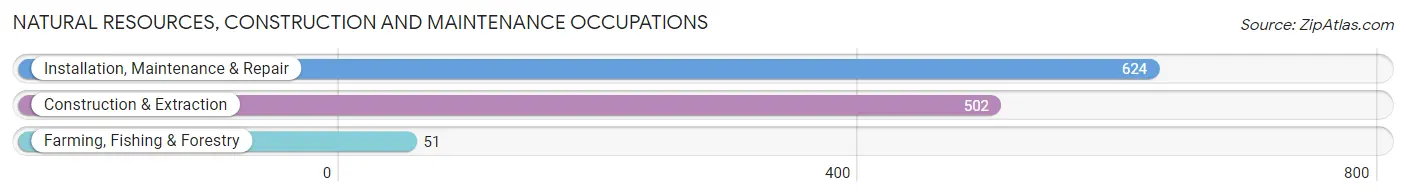
Natural Resources, Construction and Maintenance Occupations
The most common Natural Resources, Construction and Maintenance occupations in North Tonawanda are Installation, Maintenance & Repair (624 | 4.0%), Construction & Extraction (502 | 3.2%), and Farming, Fishing & Forestry (51 | 0.3%).
Natural Resources, Construction and Maintenance Occupations by Sex
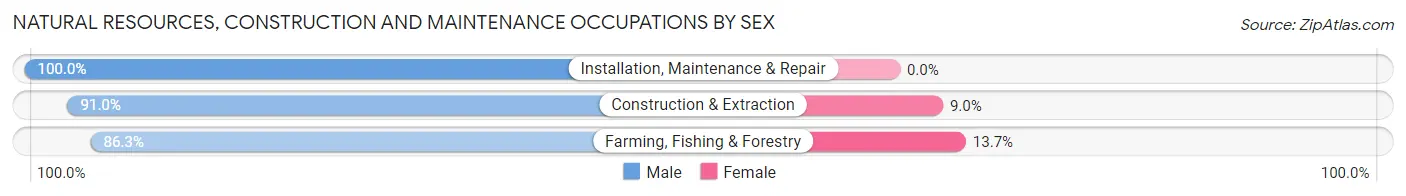
| Occupation | Male | Female |
| Farming, Fishing & Forestry | 44 (86.3%) | 7 (13.7%) |
| Construction & Extraction | 457 (91.0%) | 45 (9.0%) |
| Installation, Maintenance & Repair | 624 (100.0%) | 0 (0.0%) |
| Total (Category) | 1,125 (95.6%) | 52 (4.4%) |
| Total (Overall) | 8,390 (53.5%) | 7,294 (46.5%) |
Production, Transportation and Moving Occupations
The most common Production, Transportation and Moving occupations in North Tonawanda are Production (1,076 | 6.9%), Transportation (564 | 3.6%), and Material Moving (439 | 2.8%).
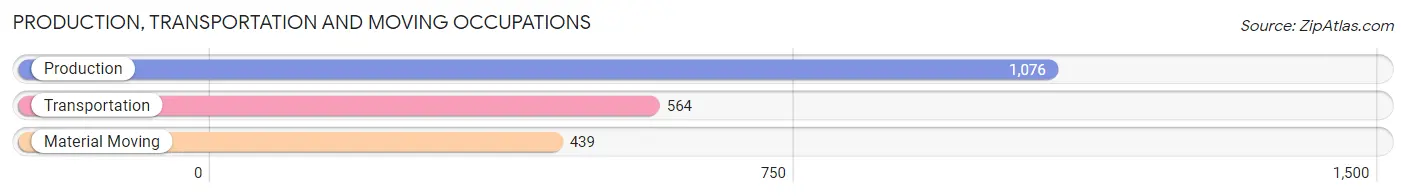
Production, Transportation and Moving Occupations by Sex
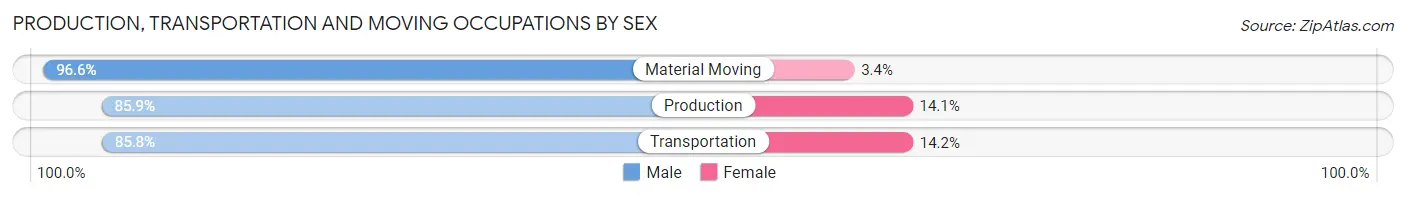
| Occupation | Male | Female |
| Production | 924 (85.9%) | 152 (14.1%) |
| Transportation | 484 (85.8%) | 80 (14.2%) |
| Material Moving | 424 (96.6%) | 15 (3.4%) |
| Total (Category) | 1,832 (88.1%) | 247 (11.9%) |
| Total (Overall) | 8,390 (53.5%) | 7,294 (46.5%) |
Employment Industries by Sex in North Tonawanda
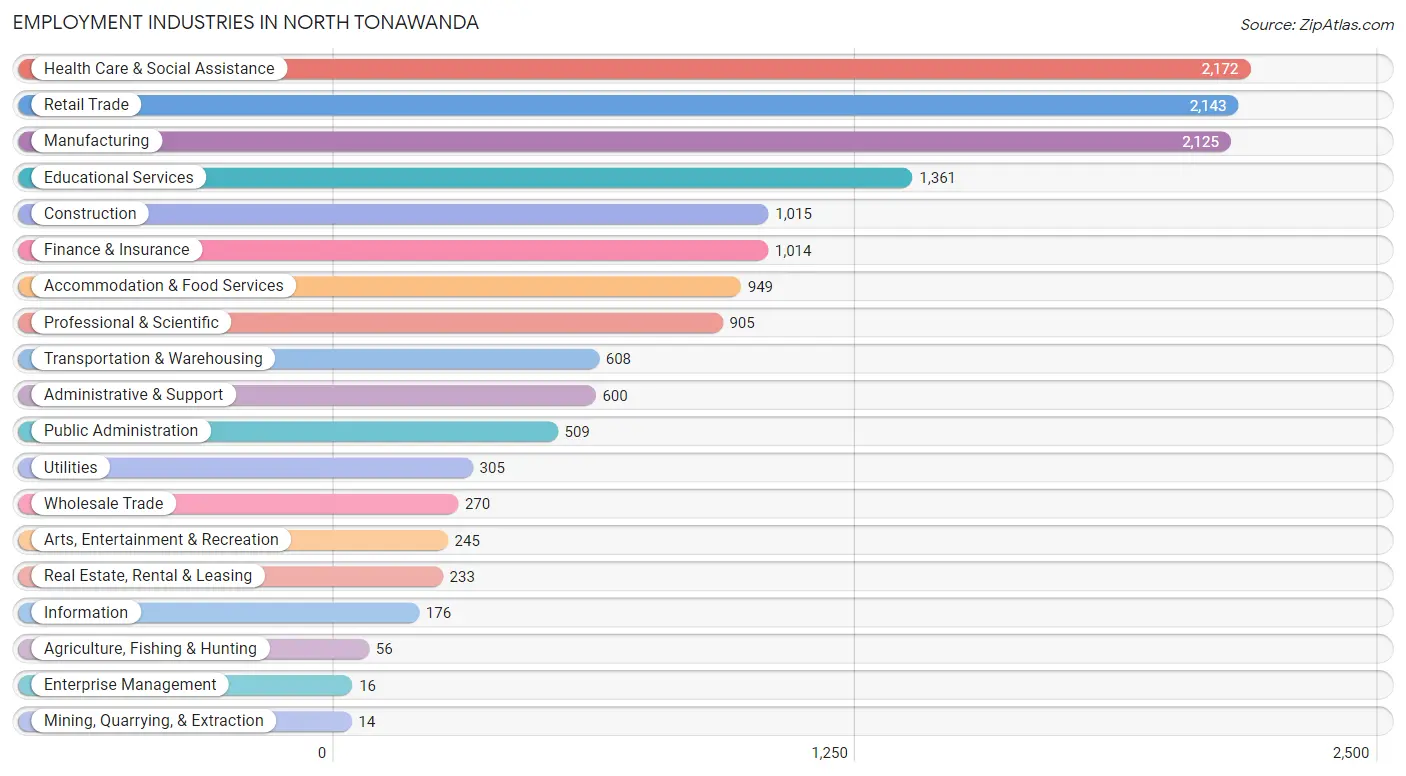
Employment Industries in North Tonawanda
The major employment industries in North Tonawanda include Health Care & Social Assistance (2,172 | 13.9%), Retail Trade (2,143 | 13.7%), Manufacturing (2,125 | 13.6%), Educational Services (1,361 | 8.7%), and Construction (1,015 | 6.5%).
Employment Industries by Sex in North Tonawanda
The North Tonawanda industries that see more men than women are Mining, Quarrying, & Extraction (100.0%), Utilities (92.8%), and Agriculture, Fishing & Hunting (87.5%), whereas the industries that tend to have a higher number of women are Enterprise Management (100.0%), Health Care & Social Assistance (77.4%), and Educational Services (71.3%).
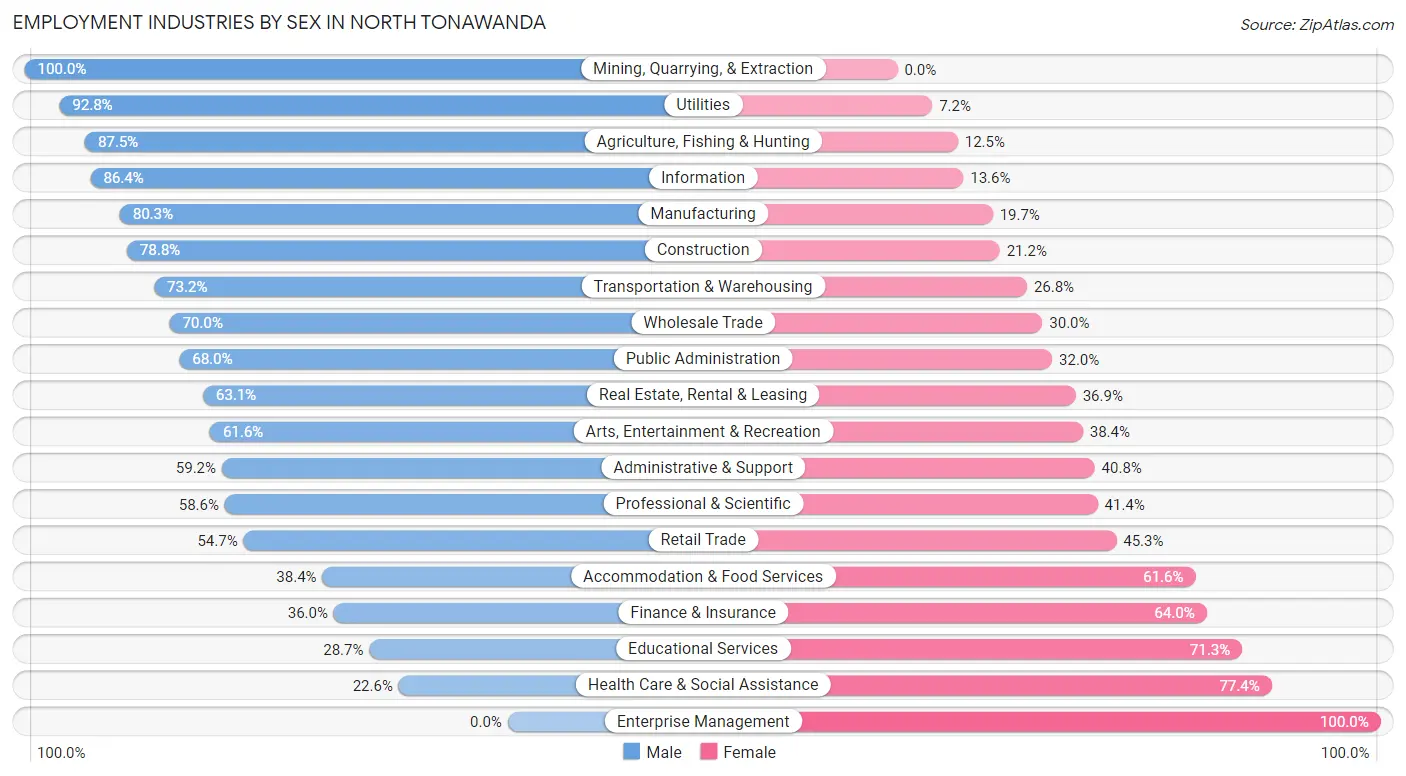
| Industry | Male | Female |
| Agriculture, Fishing & Hunting | 49 (87.5%) | 7 (12.5%) |
| Mining, Quarrying, & Extraction | 14 (100.0%) | 0 (0.0%) |
| Construction | 800 (78.8%) | 215 (21.2%) |
| Manufacturing | 1,706 (80.3%) | 419 (19.7%) |
| Wholesale Trade | 189 (70.0%) | 81 (30.0%) |
| Retail Trade | 1,172 (54.7%) | 971 (45.3%) |
| Transportation & Warehousing | 445 (73.2%) | 163 (26.8%) |
| Utilities | 283 (92.8%) | 22 (7.2%) |
| Information | 152 (86.4%) | 24 (13.6%) |
| Finance & Insurance | 365 (36.0%) | 649 (64.0%) |
| Real Estate, Rental & Leasing | 147 (63.1%) | 86 (36.9%) |
| Professional & Scientific | 530 (58.6%) | 375 (41.4%) |
| Enterprise Management | 0 (0.0%) | 16 (100.0%) |
| Administrative & Support | 355 (59.2%) | 245 (40.8%) |
| Educational Services | 390 (28.7%) | 971 (71.3%) |
| Health Care & Social Assistance | 490 (22.6%) | 1,682 (77.4%) |
| Arts, Entertainment & Recreation | 151 (61.6%) | 94 (38.4%) |
| Accommodation & Food Services | 364 (38.4%) | 585 (61.6%) |
| Public Administration | 346 (68.0%) | 163 (32.0%) |
| Total | 8,390 (53.5%) | 7,294 (46.5%) |
Education in North Tonawanda
School Enrollment in North Tonawanda
The most common levels of schooling among the 5,419 students in North Tonawanda are college / undergraduate (1,255 | 23.2%), high school (1,166 | 21.5%), and middle school (1,056 | 19.5%).
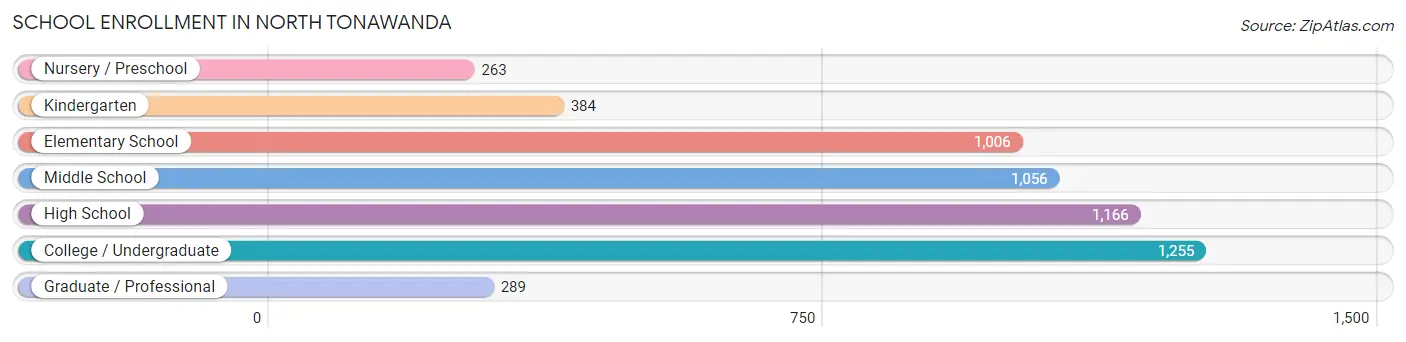
| School Level | # Students | % Students |
| Nursery / Preschool | 263 | 4.9% |
| Kindergarten | 384 | 7.1% |
| Elementary School | 1,006 | 18.6% |
| Middle School | 1,056 | 19.5% |
| High School | 1,166 | 21.5% |
| College / Undergraduate | 1,255 | 23.2% |
| Graduate / Professional | 289 | 5.3% |
| Total | 5,419 | 100.0% |
School Enrollment by Age by Funding Source in North Tonawanda
Out of a total of 5,419 students who are enrolled in schools in North Tonawanda, 916 (16.9%) attend a private institution, while the remaining 4,503 (83.1%) are enrolled in public schools. The age group of 3 to 4 year olds has the highest likelihood of being enrolled in private schools, with 128 (54.7% in the age bracket) enrolled. Conversely, the age group of 15 to 17 year olds has the lowest likelihood of being enrolled in a private school, with 829 (94.0% in the age bracket) attending a public institution.
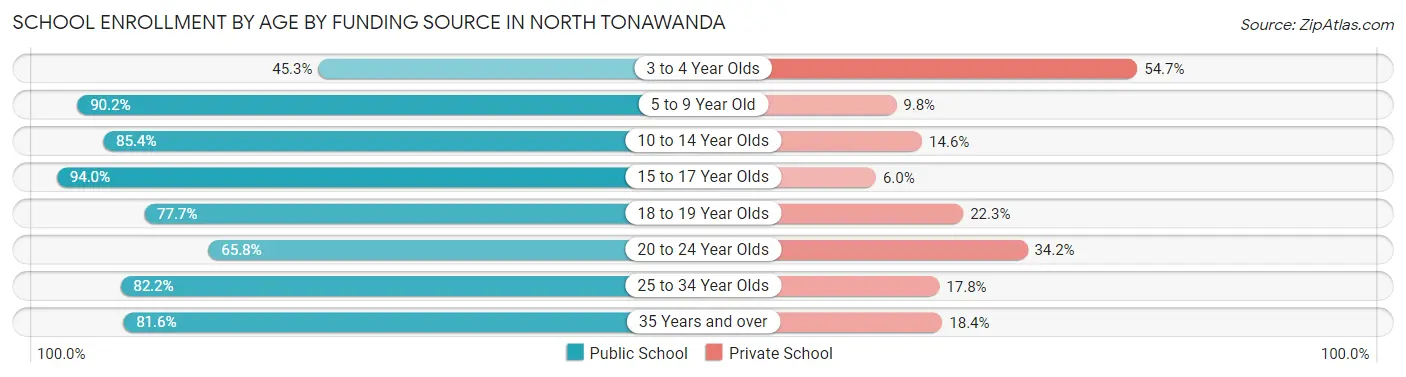
| Age Bracket | Public School | Private School |
| 3 to 4 Year Olds | 106 (45.3%) | 128 (54.7%) |
| 5 to 9 Year Old | 1,214 (90.2%) | 132 (9.8%) |
| 10 to 14 Year Olds | 1,191 (85.4%) | 204 (14.6%) |
| 15 to 17 Year Olds | 829 (94.0%) | 53 (6.0%) |
| 18 to 19 Year Olds | 192 (77.7%) | 55 (22.3%) |
| 20 to 24 Year Olds | 438 (65.8%) | 228 (34.2%) |
| 25 to 34 Year Olds | 341 (82.2%) | 74 (17.8%) |
| 35 Years and over | 191 (81.6%) | 43 (18.4%) |
| Total | 4,503 (83.1%) | 916 (16.9%) |
Educational Attainment by Field of Study in North Tonawanda
Business (1,126 | 16.2%), education (874 | 12.6%), science & technology (775 | 11.2%), engineering (600 | 8.6%), and social sciences (560 | 8.1%) are the most common fields of study among 6,944 individuals in North Tonawanda who have obtained a bachelor's degree or higher.
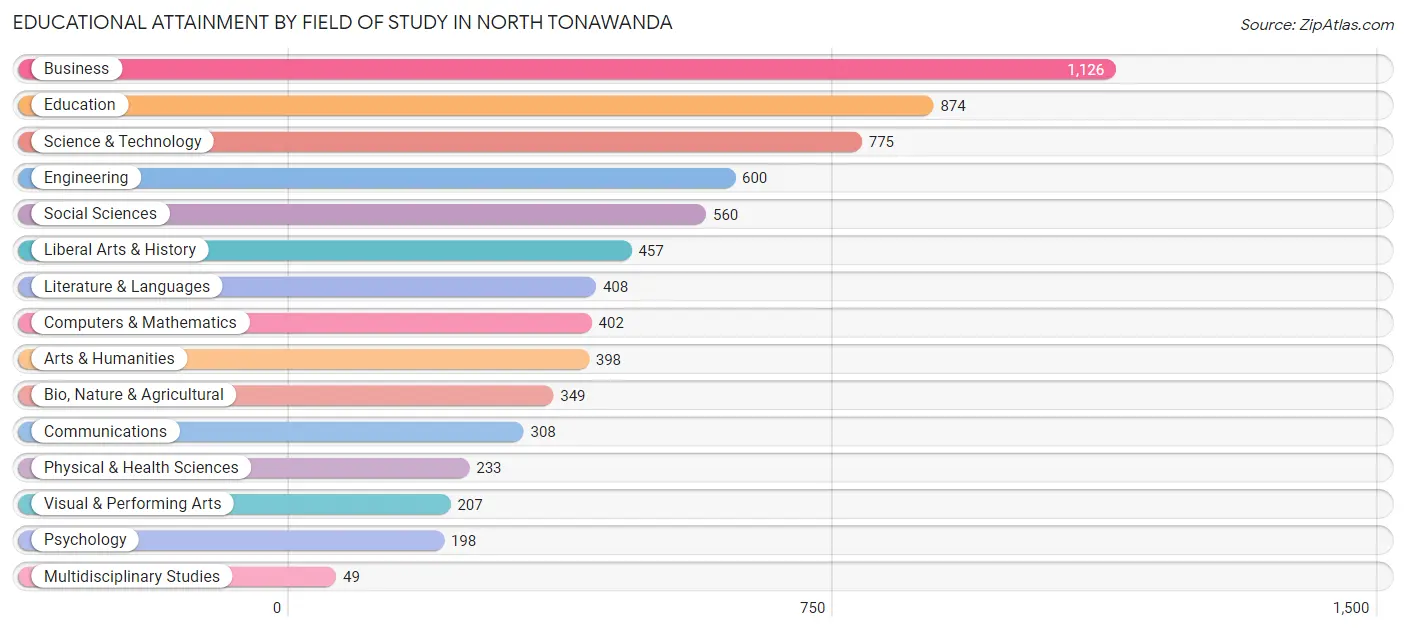
| Field of Study | # Graduates | % Graduates |
| Computers & Mathematics | 402 | 5.8% |
| Bio, Nature & Agricultural | 349 | 5.0% |
| Physical & Health Sciences | 233 | 3.4% |
| Psychology | 198 | 2.9% |
| Social Sciences | 560 | 8.1% |
| Engineering | 600 | 8.6% |
| Multidisciplinary Studies | 49 | 0.7% |
| Science & Technology | 775 | 11.2% |
| Business | 1,126 | 16.2% |
| Education | 874 | 12.6% |
| Literature & Languages | 408 | 5.9% |
| Liberal Arts & History | 457 | 6.6% |
| Visual & Performing Arts | 207 | 3.0% |
| Communications | 308 | 4.4% |
| Arts & Humanities | 398 | 5.7% |
| Total | 6,944 | 100.0% |
Transportation & Commute in North Tonawanda
Vehicle Availability by Sex in North Tonawanda
The most prevalent vehicle ownership categories in North Tonawanda are males with 2 vehicles (4,308, accounting for 51.8%) and females with 2 vehicles (3,753, making up 61.0%).
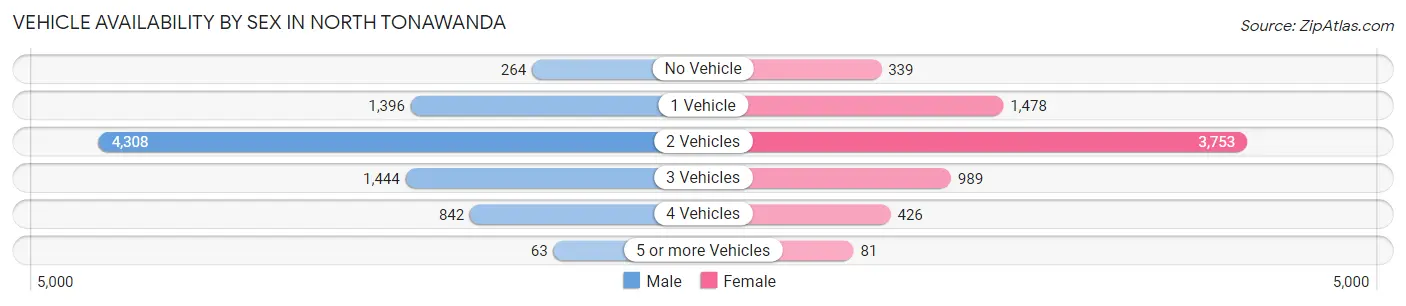
| Vehicles Available | Male | Female |
| No Vehicle | 264 (3.2%) | 339 (4.8%) |
| 1 Vehicle | 1,396 (16.8%) | 1,478 (20.9%) |
| 2 Vehicles | 4,308 (51.8%) | 3,753 (53.1%) |
| 3 Vehicles | 1,444 (17.4%) | 989 (14.0%) |
| 4 Vehicles | 842 (10.1%) | 426 (6.0%) |
| 5 or more Vehicles | 63 (0.8%) | 81 (1.1%) |
| Total | 8,317 (100.0%) | 7,066 (100.0%) |
Commute Time in North Tonawanda
The most frequently occuring commute durations in North Tonawanda are 20 to 24 minutes (2,421 commuters, 17.5%), 15 to 19 minutes (2,389 commuters, 17.2%), and 30 to 34 minutes (1,847 commuters, 13.3%).
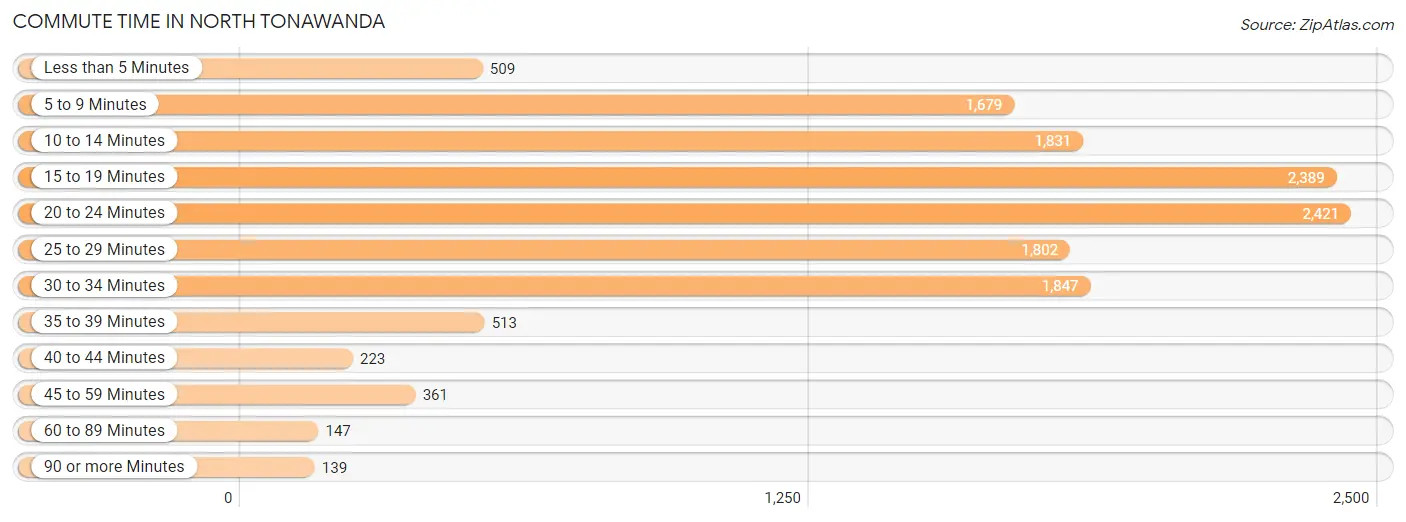
| Commute Time | # Commuters | % Commuters |
| Less than 5 Minutes | 509 | 3.7% |
| 5 to 9 Minutes | 1,679 | 12.1% |
| 10 to 14 Minutes | 1,831 | 13.2% |
| 15 to 19 Minutes | 2,389 | 17.2% |
| 20 to 24 Minutes | 2,421 | 17.5% |
| 25 to 29 Minutes | 1,802 | 13.0% |
| 30 to 34 Minutes | 1,847 | 13.3% |
| 35 to 39 Minutes | 513 | 3.7% |
| 40 to 44 Minutes | 223 | 1.6% |
| 45 to 59 Minutes | 361 | 2.6% |
| 60 to 89 Minutes | 147 | 1.1% |
| 90 or more Minutes | 139 | 1.0% |
Commute Time by Sex in North Tonawanda
The most common commute times in North Tonawanda are 20 to 24 minutes (1,277 commuters, 16.8%) for males and 15 to 19 minutes (1,149 commuters, 18.4%) for females.
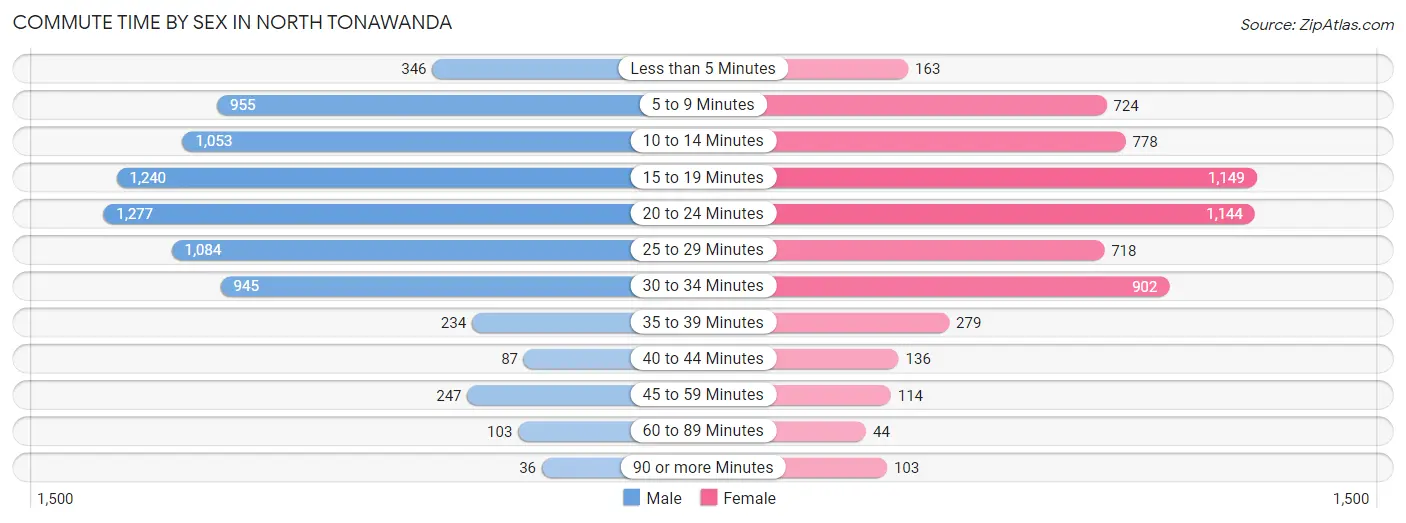
| Commute Time | Male | Female |
| Less than 5 Minutes | 346 (4.5%) | 163 (2.6%) |
| 5 to 9 Minutes | 955 (12.6%) | 724 (11.6%) |
| 10 to 14 Minutes | 1,053 (13.8%) | 778 (12.4%) |
| 15 to 19 Minutes | 1,240 (16.3%) | 1,149 (18.4%) |
| 20 to 24 Minutes | 1,277 (16.8%) | 1,144 (18.3%) |
| 25 to 29 Minutes | 1,084 (14.2%) | 718 (11.5%) |
| 30 to 34 Minutes | 945 (12.4%) | 902 (14.4%) |
| 35 to 39 Minutes | 234 (3.1%) | 279 (4.5%) |
| 40 to 44 Minutes | 87 (1.1%) | 136 (2.2%) |
| 45 to 59 Minutes | 247 (3.3%) | 114 (1.8%) |
| 60 to 89 Minutes | 103 (1.3%) | 44 (0.7%) |
| 90 or more Minutes | 36 (0.5%) | 103 (1.7%) |
Time of Departure to Work by Sex in North Tonawanda
The most frequent times of departure to work in North Tonawanda are 6:30 AM to 6:59 AM (1,016, 13.4%) for males and 7:00 AM to 7:29 AM (1,047, 16.7%) for females.
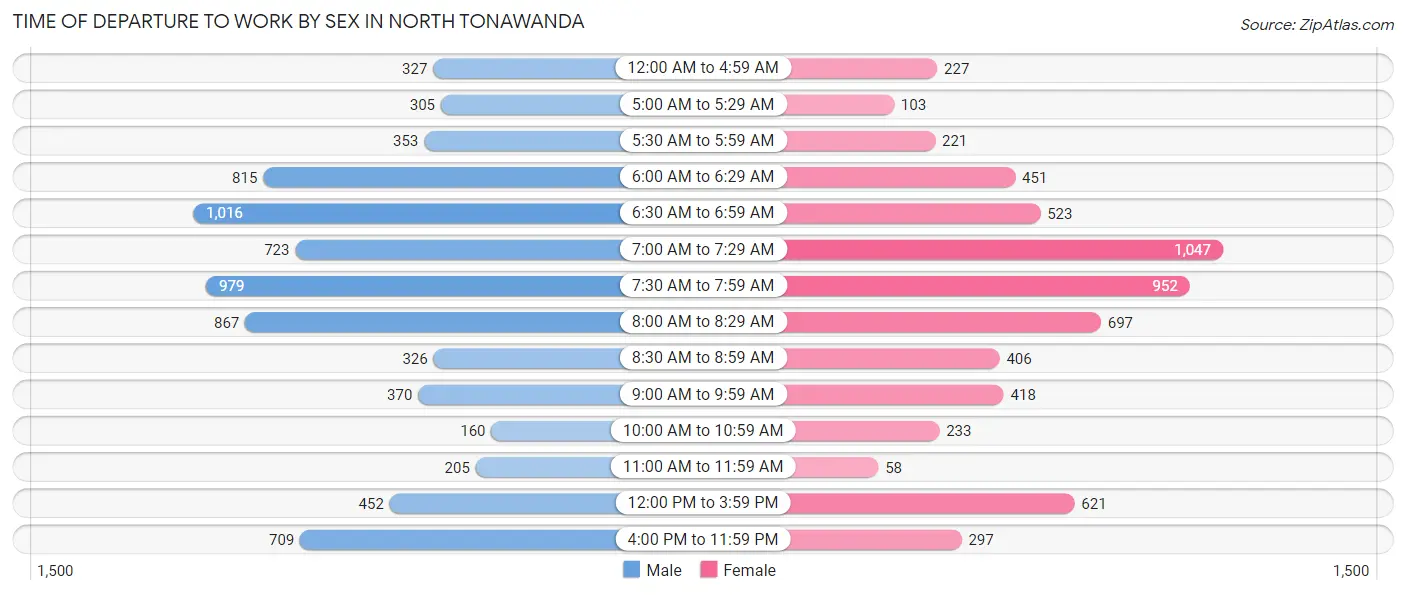
| Time of Departure | Male | Female |
| 12:00 AM to 4:59 AM | 327 (4.3%) | 227 (3.6%) |
| 5:00 AM to 5:29 AM | 305 (4.0%) | 103 (1.7%) |
| 5:30 AM to 5:59 AM | 353 (4.6%) | 221 (3.5%) |
| 6:00 AM to 6:29 AM | 815 (10.7%) | 451 (7.2%) |
| 6:30 AM to 6:59 AM | 1,016 (13.4%) | 523 (8.4%) |
| 7:00 AM to 7:29 AM | 723 (9.5%) | 1,047 (16.7%) |
| 7:30 AM to 7:59 AM | 979 (12.9%) | 952 (15.2%) |
| 8:00 AM to 8:29 AM | 867 (11.4%) | 697 (11.1%) |
| 8:30 AM to 8:59 AM | 326 (4.3%) | 406 (6.5%) |
| 9:00 AM to 9:59 AM | 370 (4.9%) | 418 (6.7%) |
| 10:00 AM to 10:59 AM | 160 (2.1%) | 233 (3.7%) |
| 11:00 AM to 11:59 AM | 205 (2.7%) | 58 (0.9%) |
| 12:00 PM to 3:59 PM | 452 (5.9%) | 621 (9.9%) |
| 4:00 PM to 11:59 PM | 709 (9.3%) | 297 (4.8%) |
| Total | 7,607 (100.0%) | 6,254 (100.0%) |
Housing Occupancy in North Tonawanda
Occupancy by Ownership in North Tonawanda
Of the total 13,643 dwellings in North Tonawanda, owner-occupied units account for 9,567 (70.1%), while renter-occupied units make up 4,076 (29.9%).
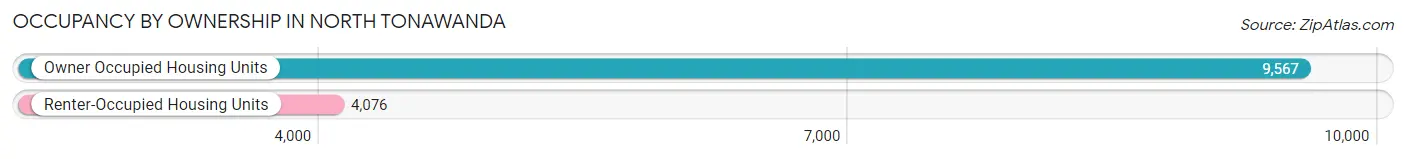
| Occupancy | # Housing Units | % Housing Units |
| Owner Occupied Housing Units | 9,567 | 70.1% |
| Renter-Occupied Housing Units | 4,076 | 29.9% |
| Total Occupied Housing Units | 13,643 | 100.0% |
Occupancy by Household Size in North Tonawanda
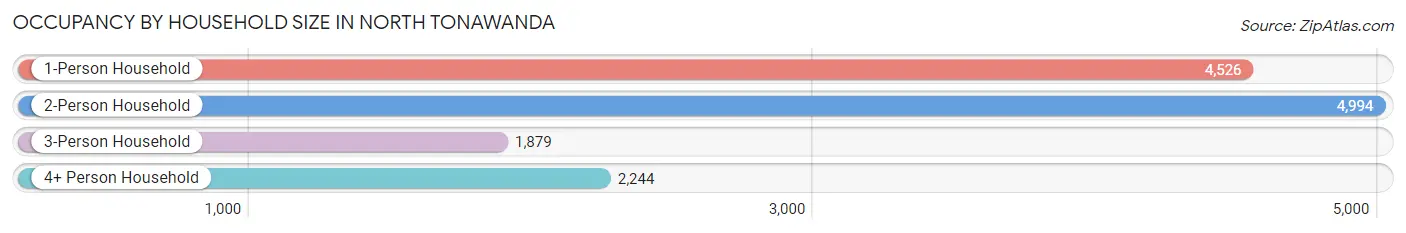
| Household Size | # Housing Units | % Housing Units |
| 1-Person Household | 4,526 | 33.2% |
| 2-Person Household | 4,994 | 36.6% |
| 3-Person Household | 1,879 | 13.8% |
| 4+ Person Household | 2,244 | 16.5% |
| Total Housing Units | 13,643 | 100.0% |
Occupancy by Ownership by Household Size in North Tonawanda
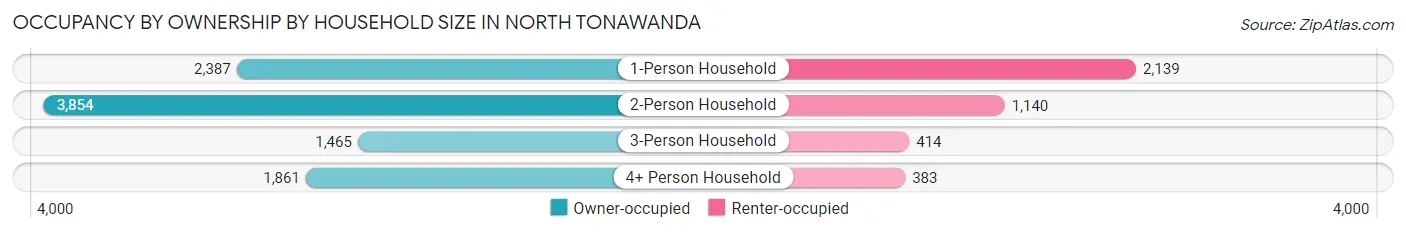
| Household Size | Owner-occupied | Renter-occupied |
| 1-Person Household | 2,387 (52.7%) | 2,139 (47.3%) |
| 2-Person Household | 3,854 (77.2%) | 1,140 (22.8%) |
| 3-Person Household | 1,465 (78.0%) | 414 (22.0%) |
| 4+ Person Household | 1,861 (82.9%) | 383 (17.1%) |
| Total Housing Units | 9,567 (70.1%) | 4,076 (29.9%) |
Occupancy by Educational Attainment in North Tonawanda
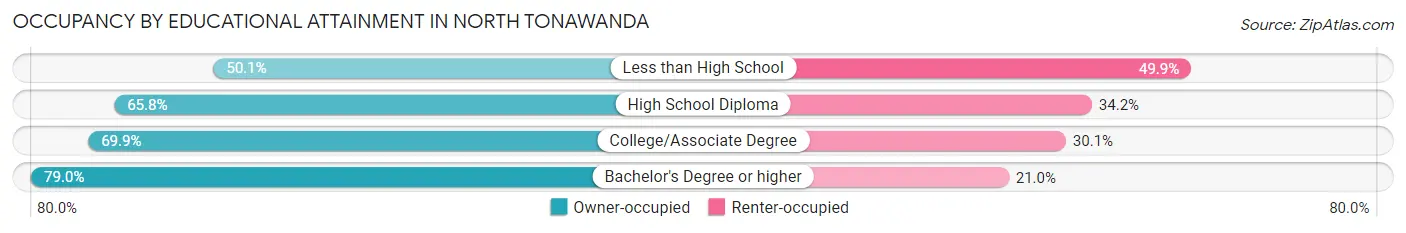
| Household Size | Owner-occupied | Renter-occupied |
| Less than High School | 386 (50.1%) | 385 (49.9%) |
| High School Diploma | 2,831 (65.8%) | 1,473 (34.2%) |
| College/Associate Degree | 3,208 (69.9%) | 1,381 (30.1%) |
| Bachelor's Degree or higher | 3,142 (79.0%) | 837 (21.0%) |
Occupancy by Age of Householder in North Tonawanda
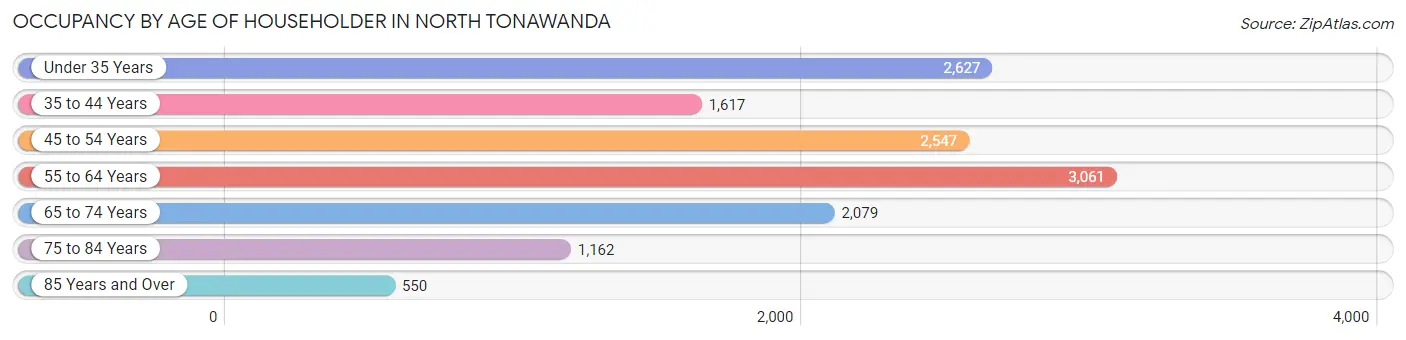
| Age Bracket | # Households | % Households |
| Under 35 Years | 2,627 | 19.3% |
| 35 to 44 Years | 1,617 | 11.8% |
| 45 to 54 Years | 2,547 | 18.7% |
| 55 to 64 Years | 3,061 | 22.4% |
| 65 to 74 Years | 2,079 | 15.2% |
| 75 to 84 Years | 1,162 | 8.5% |
| 85 Years and Over | 550 | 4.0% |
| Total | 13,643 | 100.0% |
Housing Finances in North Tonawanda
Median Income by Occupancy in North Tonawanda
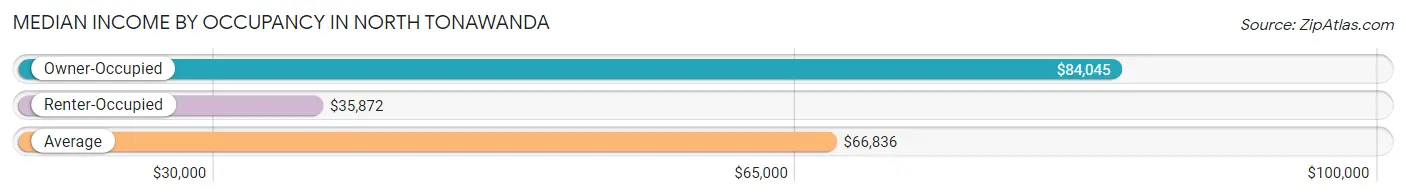
| Occupancy Type | # Households | Median Income |
| Owner-Occupied | 9,567 (70.1%) | $84,045 |
| Renter-Occupied | 4,076 (29.9%) | $35,872 |
| Average | 13,643 (100.0%) | $66,836 |
Occupancy by Householder Income Bracket in North Tonawanda
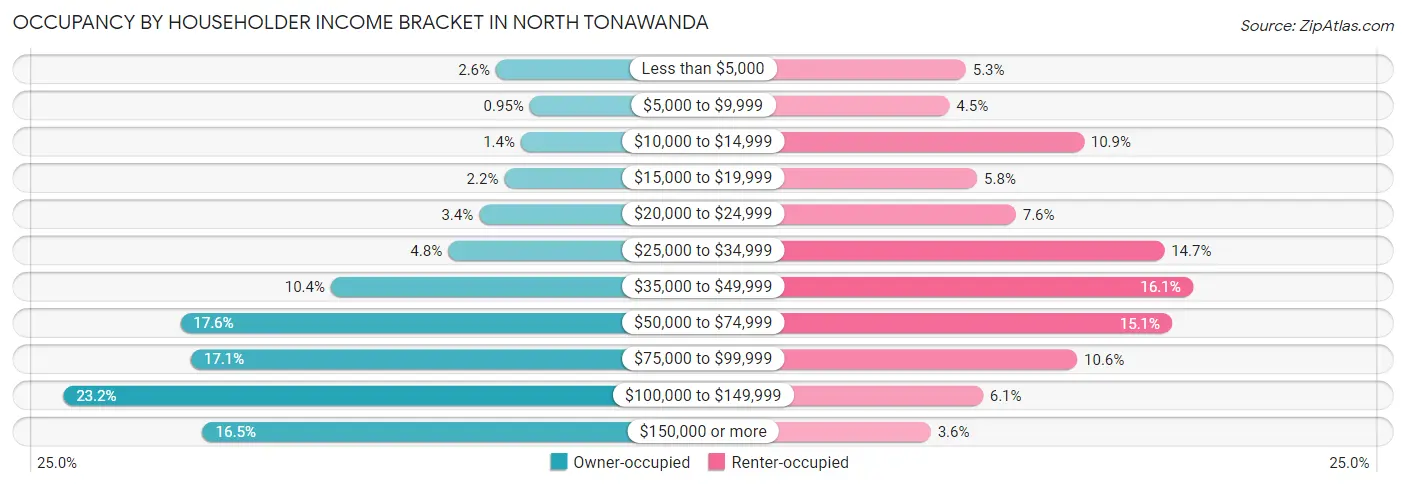
| Income Bracket | Owner-occupied | Renter-occupied |
| Less than $5,000 | 245 (2.6%) | 214 (5.2%) |
| $5,000 to $9,999 | 91 (0.9%) | 182 (4.5%) |
| $10,000 to $14,999 | 131 (1.4%) | 443 (10.9%) |
| $15,000 to $19,999 | 207 (2.2%) | 236 (5.8%) |
| $20,000 to $24,999 | 321 (3.4%) | 311 (7.6%) |
| $25,000 to $34,999 | 463 (4.8%) | 599 (14.7%) |
| $35,000 to $49,999 | 997 (10.4%) | 654 (16.1%) |
| $50,000 to $74,999 | 1,682 (17.6%) | 614 (15.1%) |
| $75,000 to $99,999 | 1,634 (17.1%) | 430 (10.5%) |
| $100,000 to $149,999 | 2,216 (23.2%) | 247 (6.1%) |
| $150,000 or more | 1,580 (16.5%) | 146 (3.6%) |
| Total | 9,567 (100.0%) | 4,076 (100.0%) |
Monthly Housing Cost Tiers in North Tonawanda
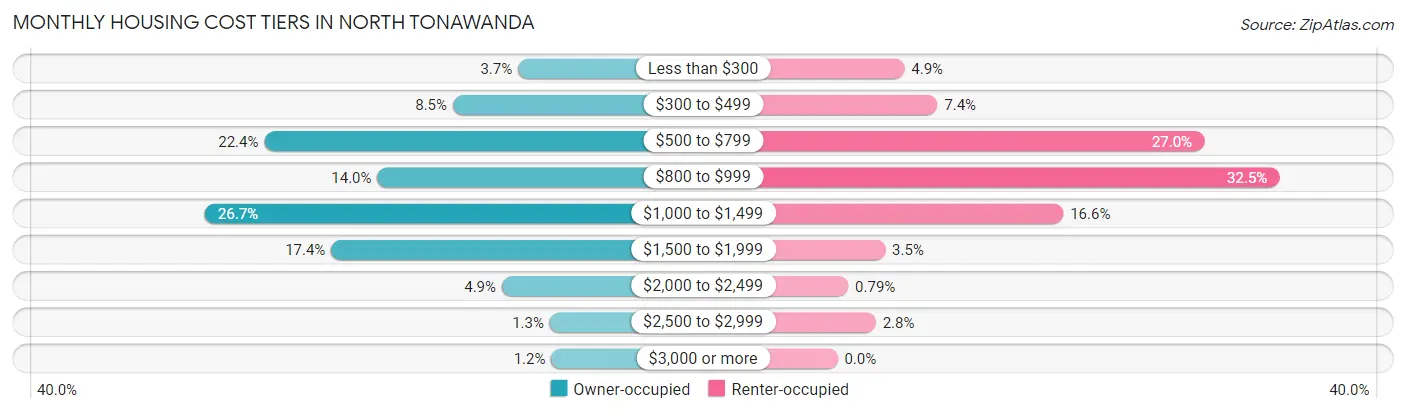
| Monthly Cost | Owner-occupied | Renter-occupied |
| Less than $300 | 350 (3.7%) | 201 (4.9%) |
| $300 to $499 | 809 (8.5%) | 300 (7.4%) |
| $500 to $799 | 2,138 (22.4%) | 1,100 (27.0%) |
| $800 to $999 | 1,341 (14.0%) | 1,326 (32.5%) |
| $1,000 to $1,499 | 2,556 (26.7%) | 678 (16.6%) |
| $1,500 to $1,999 | 1,667 (17.4%) | 143 (3.5%) |
| $2,000 to $2,499 | 464 (4.9%) | 32 (0.8%) |
| $2,500 to $2,999 | 126 (1.3%) | 115 (2.8%) |
| $3,000 or more | 116 (1.2%) | 0 (0.0%) |
| Total | 9,567 (100.0%) | 4,076 (100.0%) |
Physical Housing Characteristics in North Tonawanda
Housing Structures in North Tonawanda
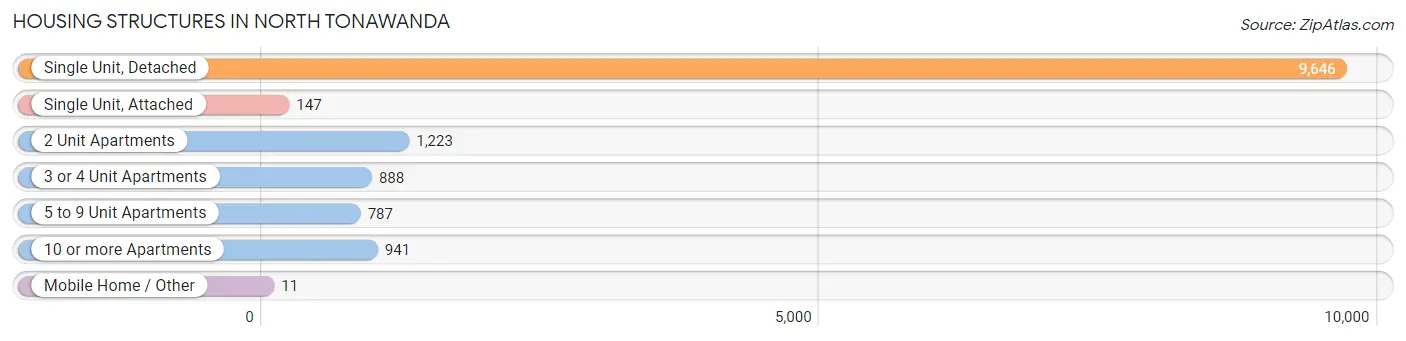
| Structure Type | # Housing Units | % Housing Units |
| Single Unit, Detached | 9,646 | 70.7% |
| Single Unit, Attached | 147 | 1.1% |
| 2 Unit Apartments | 1,223 | 9.0% |
| 3 or 4 Unit Apartments | 888 | 6.5% |
| 5 to 9 Unit Apartments | 787 | 5.8% |
| 10 or more Apartments | 941 | 6.9% |
| Mobile Home / Other | 11 | 0.1% |
| Total | 13,643 | 100.0% |
Housing Structures by Occupancy in North Tonawanda
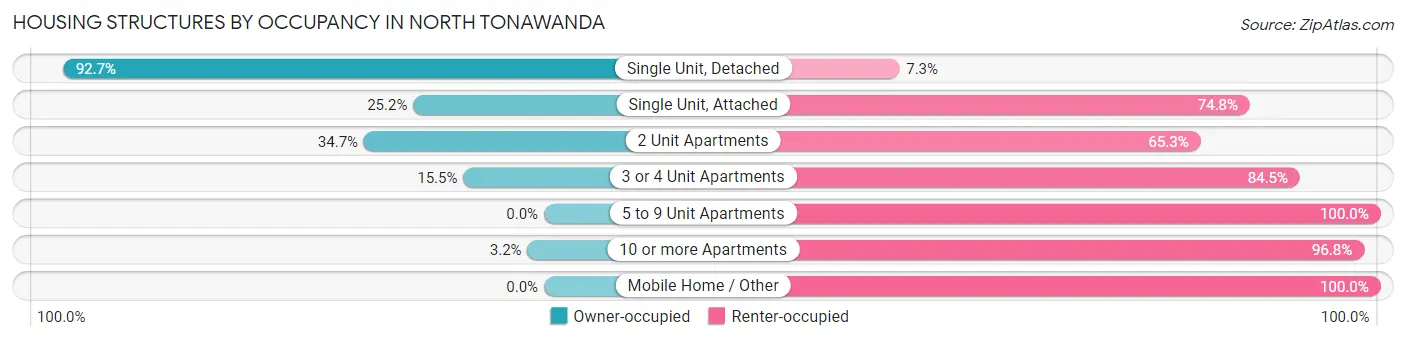
| Structure Type | Owner-occupied | Renter-occupied |
| Single Unit, Detached | 8,938 (92.7%) | 708 (7.3%) |
| Single Unit, Attached | 37 (25.2%) | 110 (74.8%) |
| 2 Unit Apartments | 424 (34.7%) | 799 (65.3%) |
| 3 or 4 Unit Apartments | 138 (15.5%) | 750 (84.5%) |
| 5 to 9 Unit Apartments | 0 (0.0%) | 787 (100.0%) |
| 10 or more Apartments | 30 (3.2%) | 911 (96.8%) |
| Mobile Home / Other | 0 (0.0%) | 11 (100.0%) |
| Total | 9,567 (70.1%) | 4,076 (29.9%) |
Housing Structures by Number of Rooms in North Tonawanda
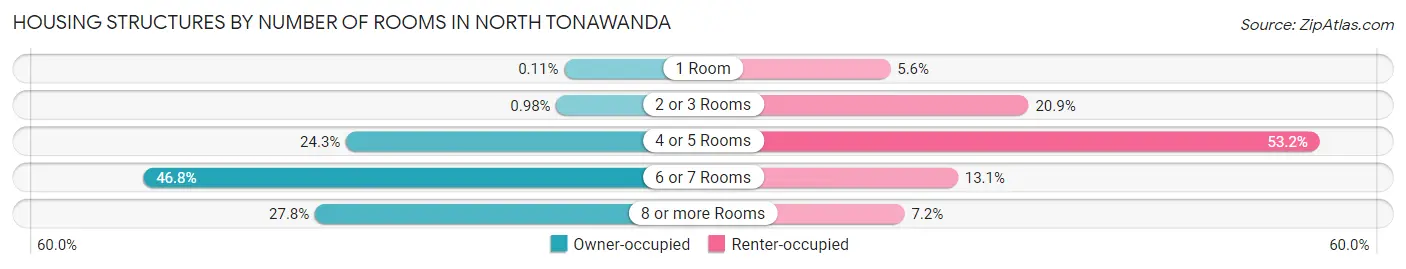
| Number of Rooms | Owner-occupied | Renter-occupied |
| 1 Room | 11 (0.1%) | 228 (5.6%) |
| 2 or 3 Rooms | 94 (1.0%) | 853 (20.9%) |
| 4 or 5 Rooms | 2,326 (24.3%) | 2,170 (53.2%) |
| 6 or 7 Rooms | 4,480 (46.8%) | 533 (13.1%) |
| 8 or more Rooms | 2,656 (27.8%) | 292 (7.2%) |
| Total | 9,567 (100.0%) | 4,076 (100.0%) |
Housing Structure by Heating Type in North Tonawanda
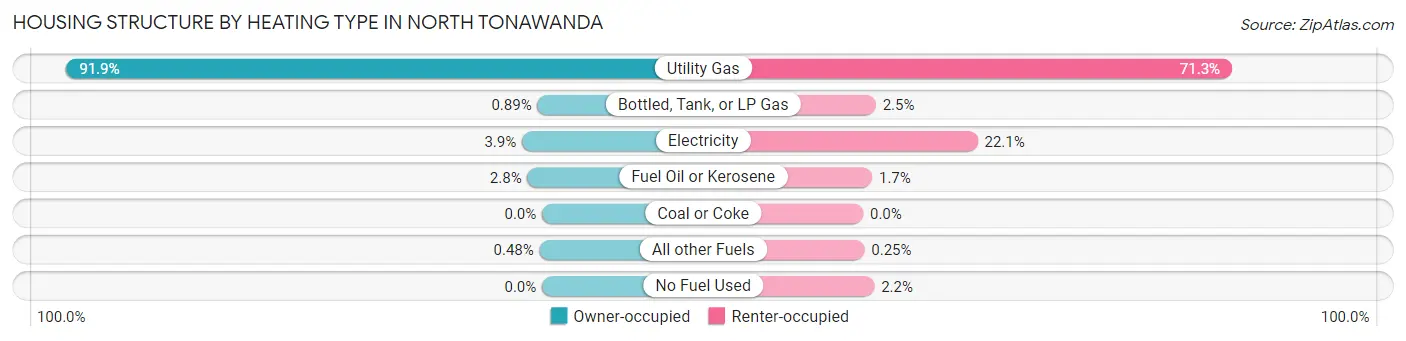
| Heating Type | Owner-occupied | Renter-occupied |
| Utility Gas | 8,795 (91.9%) | 2,905 (71.3%) |
| Bottled, Tank, or LP Gas | 85 (0.9%) | 100 (2.5%) |
| Electricity | 371 (3.9%) | 902 (22.1%) |
| Fuel Oil or Kerosene | 270 (2.8%) | 71 (1.7%) |
| Coal or Coke | 0 (0.0%) | 0 (0.0%) |
| All other Fuels | 46 (0.5%) | 10 (0.3%) |
| No Fuel Used | 0 (0.0%) | 88 (2.2%) |
| Total | 9,567 (100.0%) | 4,076 (100.0%) |
Household Vehicle Usage in North Tonawanda
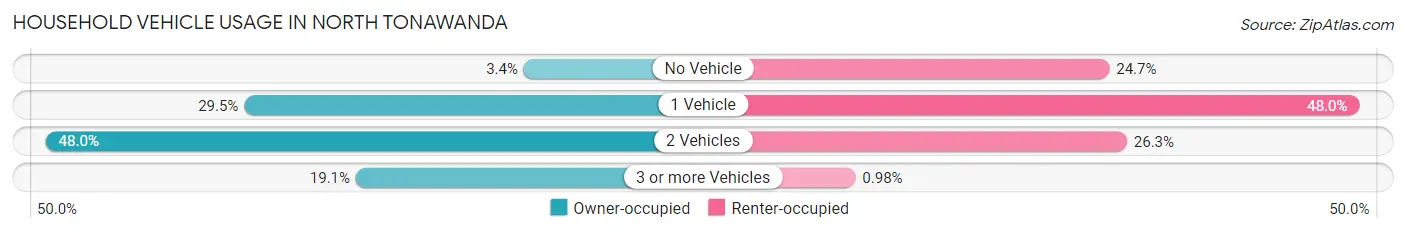
| Vehicles per Household | Owner-occupied | Renter-occupied |
| No Vehicle | 325 (3.4%) | 1,006 (24.7%) |
| 1 Vehicle | 2,822 (29.5%) | 1,957 (48.0%) |
| 2 Vehicles | 4,595 (48.0%) | 1,073 (26.3%) |
| 3 or more Vehicles | 1,825 (19.1%) | 40 (1.0%) |
| Total | 9,567 (100.0%) | 4,076 (100.0%) |
Real Estate & Mortgages in North Tonawanda
Real Estate and Mortgage Overview in North Tonawanda
| Characteristic | Without Mortgage | With Mortgage |
| Housing Units | 4,021 | 5,546 |
| Median Property Value | $163,500 | $168,700 |
| Median Household Income | $64,019 | $1,060 |
| Monthly Housing Costs | $636 | $107 |
| Real Estate Taxes | $4,189 | $146 |
Property Value by Mortgage Status in North Tonawanda
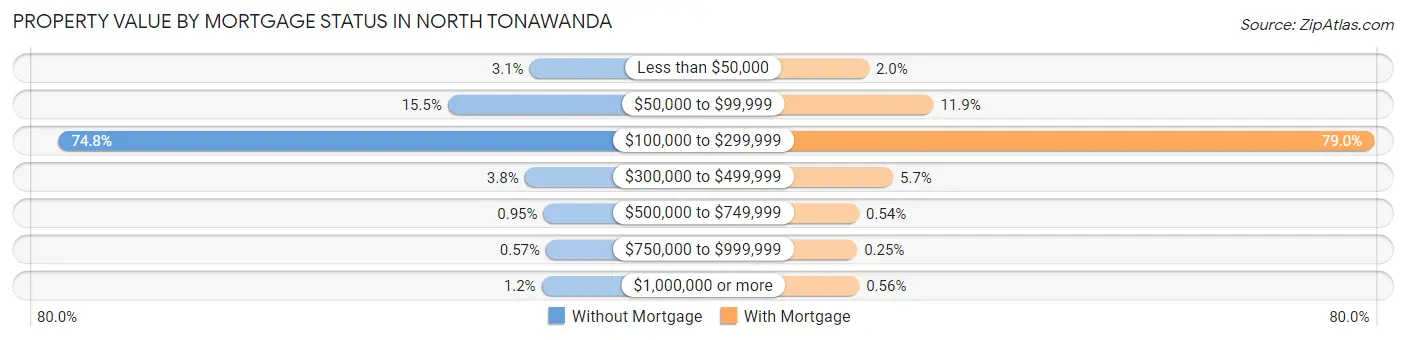
| Property Value | Without Mortgage | With Mortgage |
| Less than $50,000 | 124 (3.1%) | 113 (2.0%) |
| $50,000 to $99,999 | 624 (15.5%) | 659 (11.9%) |
| $100,000 to $299,999 | 3,008 (74.8%) | 4,382 (79.0%) |
| $300,000 to $499,999 | 154 (3.8%) | 317 (5.7%) |
| $500,000 to $749,999 | 38 (0.9%) | 30 (0.5%) |
| $750,000 to $999,999 | 23 (0.6%) | 14 (0.3%) |
| $1,000,000 or more | 50 (1.2%) | 31 (0.6%) |
| Total | 4,021 (100.0%) | 5,546 (100.0%) |
Household Income by Mortgage Status in North Tonawanda
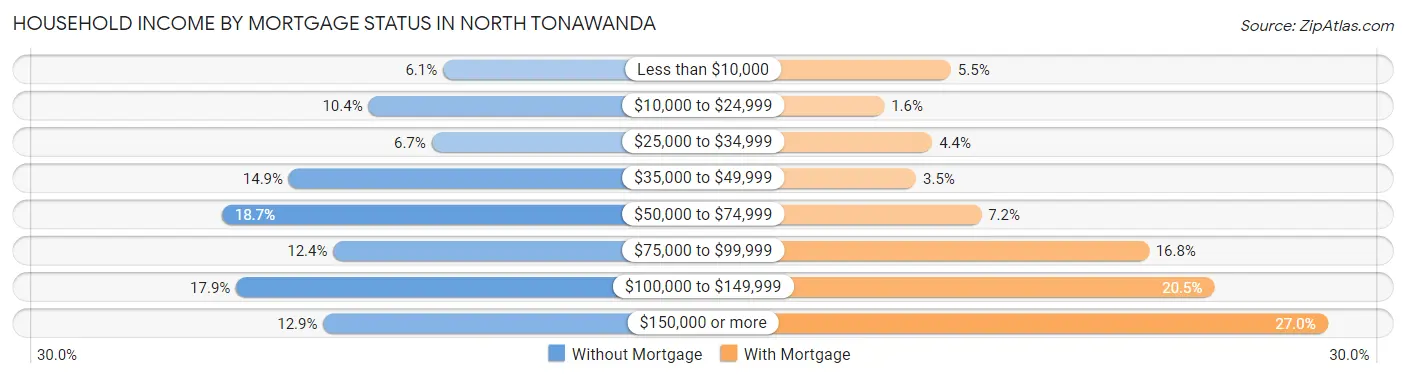
| Household Income | Without Mortgage | With Mortgage |
| Less than $10,000 | 245 (6.1%) | 302 (5.4%) |
| $10,000 to $24,999 | 416 (10.3%) | 91 (1.6%) |
| $25,000 to $34,999 | 271 (6.7%) | 243 (4.4%) |
| $35,000 to $49,999 | 599 (14.9%) | 192 (3.5%) |
| $50,000 to $74,999 | 753 (18.7%) | 398 (7.2%) |
| $75,000 to $99,999 | 497 (12.4%) | 929 (16.8%) |
| $100,000 to $149,999 | 720 (17.9%) | 1,137 (20.5%) |
| $150,000 or more | 520 (12.9%) | 1,496 (27.0%) |
| Total | 4,021 (100.0%) | 5,546 (100.0%) |
Property Value to Household Income Ratio in North Tonawanda
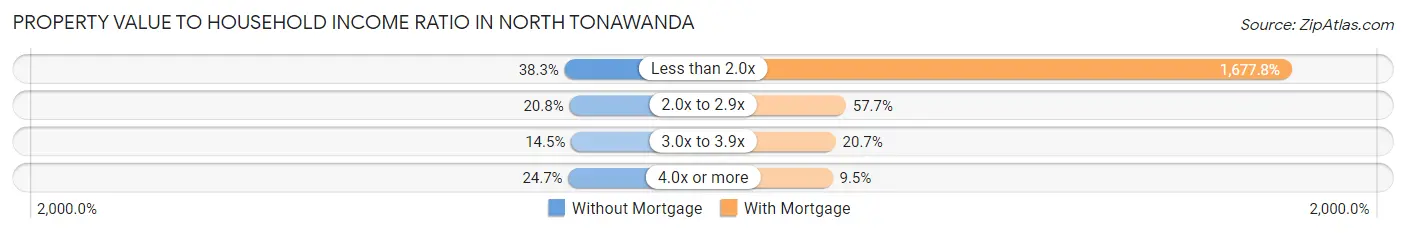
| Value-to-Income Ratio | Without Mortgage | With Mortgage |
| Less than 2.0x | 1,538 (38.3%) | 93,052 (1,677.8%) |
| 2.0x to 2.9x | 838 (20.8%) | 3,201 (57.7%) |
| 3.0x to 3.9x | 584 (14.5%) | 1,148 (20.7%) |
| 4.0x or more | 991 (24.6%) | 524 (9.5%) |
| Total | 4,021 (100.0%) | 5,546 (100.0%) |
Real Estate Taxes by Mortgage Status in North Tonawanda
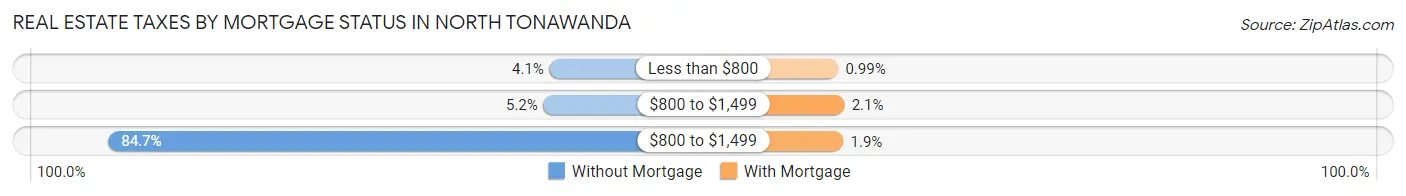
| Property Taxes | Without Mortgage | With Mortgage |
| Less than $800 | 165 (4.1%) | 55 (1.0%) |
| $800 to $1,499 | 209 (5.2%) | 118 (2.1%) |
| $800 to $1,499 | 3,406 (84.7%) | 107 (1.9%) |
| Total | 4,021 (100.0%) | 5,546 (100.0%) |
Health & Disability in North Tonawanda
Health Insurance Coverage by Age in North Tonawanda
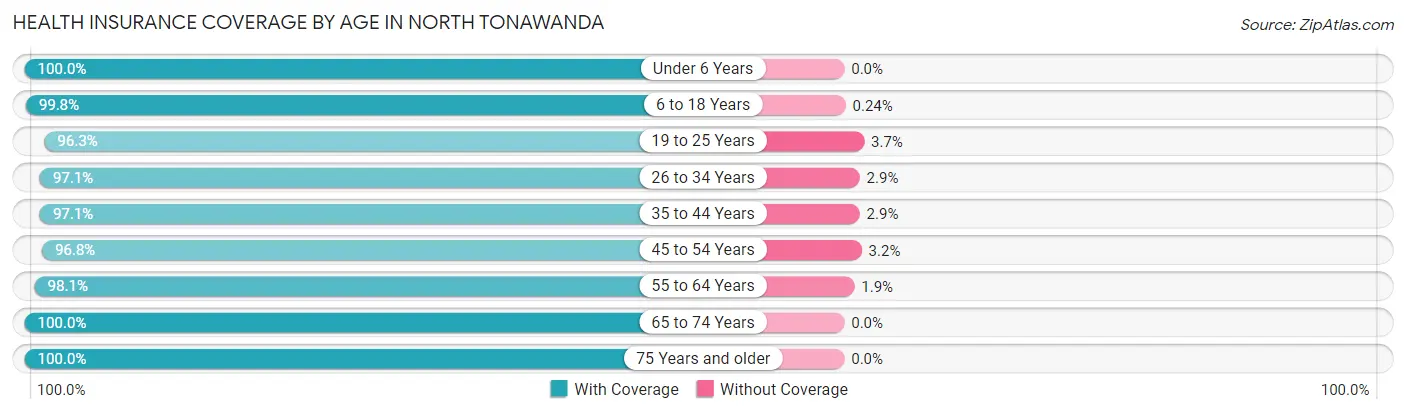
| Age Bracket | With Coverage | Without Coverage |
| Under 6 Years | 1,845 (100.0%) | 0 (0.0%) |
| 6 to 18 Years | 3,668 (99.8%) | 9 (0.2%) |
| 19 to 25 Years | 2,420 (96.3%) | 93 (3.7%) |
| 26 to 34 Years | 4,321 (97.1%) | 127 (2.9%) |
| 35 to 44 Years | 3,045 (97.1%) | 90 (2.9%) |
| 45 to 54 Years | 3,916 (96.8%) | 131 (3.2%) |
| 55 to 64 Years | 5,006 (98.1%) | 96 (1.9%) |
| 65 to 74 Years | 3,281 (100.0%) | 0 (0.0%) |
| 75 Years and older | 2,348 (100.0%) | 0 (0.0%) |
| Total | 29,850 (98.2%) | 546 (1.8%) |
Health Insurance Coverage by Citizenship Status in North Tonawanda
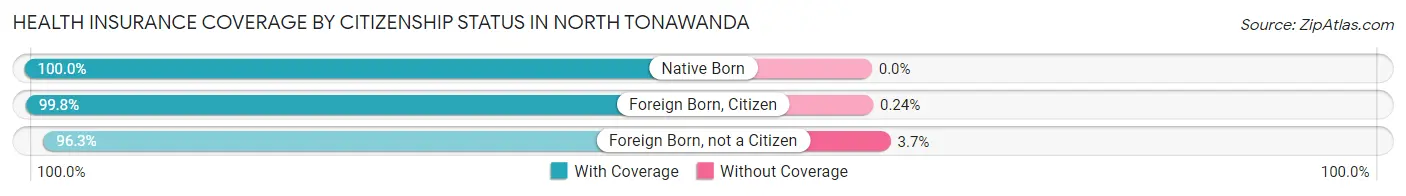
| Citizenship Status | With Coverage | Without Coverage |
| Native Born | 1,845 (100.0%) | 0 (0.0%) |
| Foreign Born, Citizen | 3,668 (99.8%) | 9 (0.2%) |
| Foreign Born, not a Citizen | 2,420 (96.3%) | 93 (3.7%) |
Health Insurance Coverage by Household Income in North Tonawanda
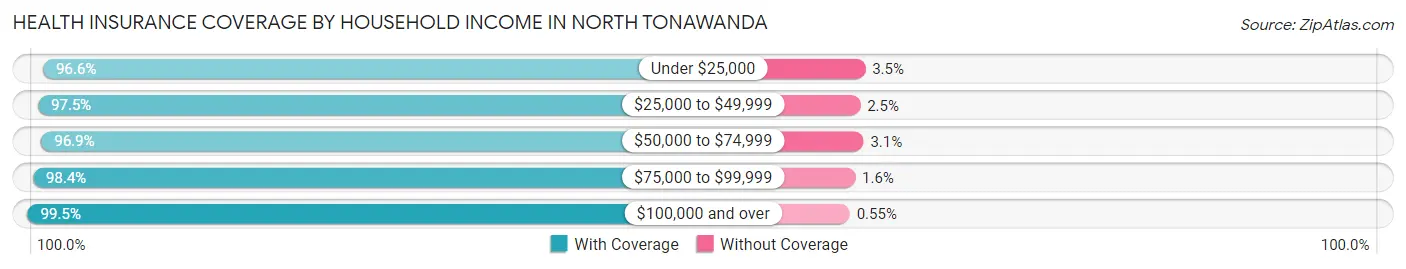
| Household Income | With Coverage | Without Coverage |
| Under $25,000 | 3,388 (96.6%) | 121 (3.5%) |
| $25,000 to $49,999 | 4,311 (97.5%) | 111 (2.5%) |
| $50,000 to $74,999 | 5,144 (96.9%) | 166 (3.1%) |
| $75,000 to $99,999 | 5,294 (98.4%) | 84 (1.6%) |
| $100,000 and over | 11,608 (99.5%) | 64 (0.5%) |
Public vs Private Health Insurance Coverage by Age in North Tonawanda
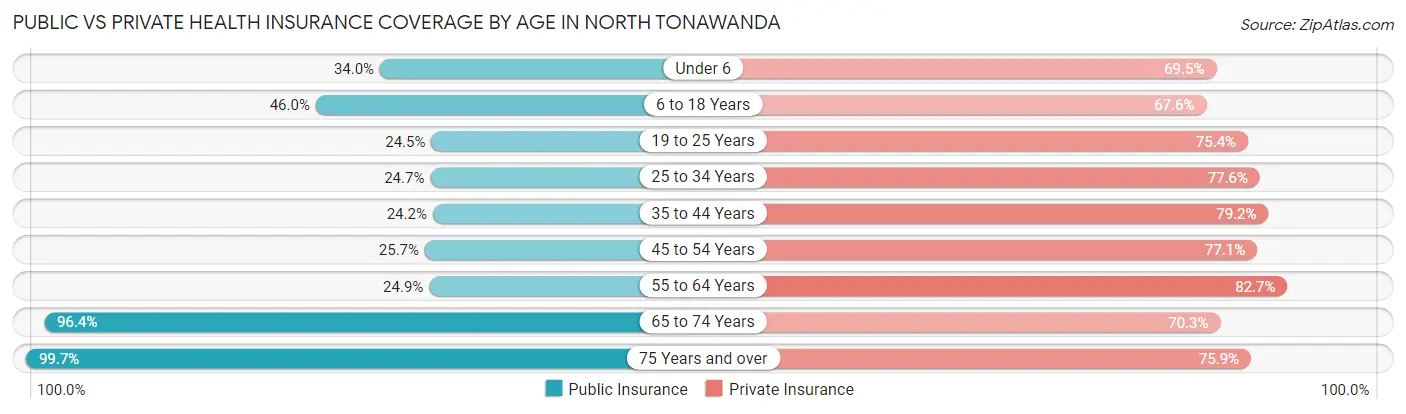
| Age Bracket | Public Insurance | Private Insurance |
| Under 6 | 628 (34.0%) | 1,282 (69.5%) |
| 6 to 18 Years | 1,690 (46.0%) | 2,487 (67.6%) |
| 19 to 25 Years | 616 (24.5%) | 1,894 (75.4%) |
| 25 to 34 Years | 1,099 (24.7%) | 3,451 (77.6%) |
| 35 to 44 Years | 760 (24.2%) | 2,482 (79.2%) |
| 45 to 54 Years | 1,040 (25.7%) | 3,119 (77.1%) |
| 55 to 64 Years | 1,271 (24.9%) | 4,219 (82.7%) |
| 65 to 74 Years | 3,163 (96.4%) | 2,305 (70.3%) |
| 75 Years and over | 2,342 (99.7%) | 1,783 (75.9%) |
| Total | 12,609 (41.5%) | 23,022 (75.7%) |
Disability Status by Sex by Age in North Tonawanda
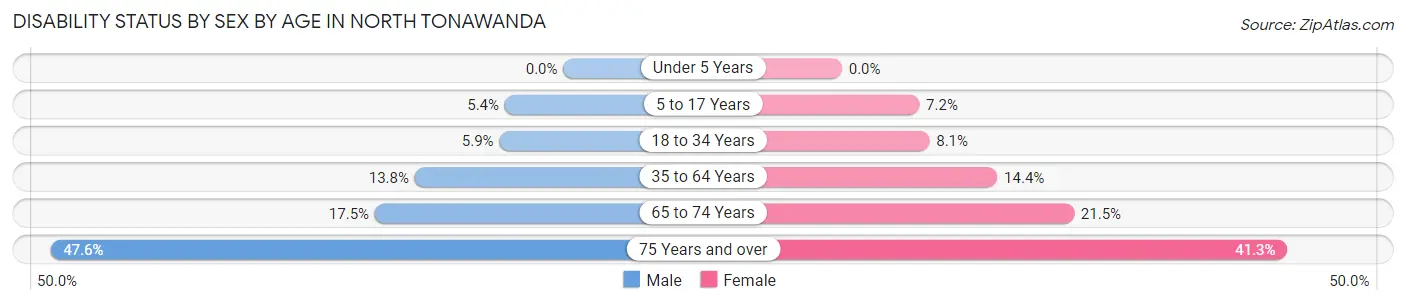
| Age Bracket | Male | Female |
| Under 5 Years | 0 (0.0%) | 0 (0.0%) |
| 5 to 17 Years | 89 (5.4%) | 156 (7.2%) |
| 18 to 34 Years | 253 (5.9%) | 233 (8.1%) |
| 35 to 64 Years | 819 (13.8%) | 915 (14.4%) |
| 65 to 74 Years | 254 (17.5%) | 394 (21.5%) |
| 75 Years and over | 450 (47.6%) | 580 (41.3%) |
Disability Class by Sex by Age in North Tonawanda
Disability Class: Hearing Difficulty
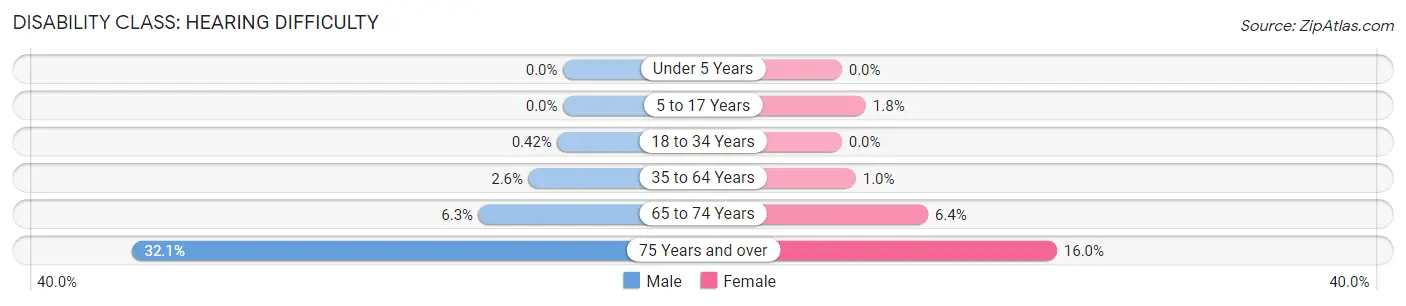
| Age Bracket | Male | Female |
| Under 5 Years | 0 (0.0%) | 0 (0.0%) |
| 5 to 17 Years | 0 (0.0%) | 39 (1.8%) |
| 18 to 34 Years | 18 (0.4%) | 0 (0.0%) |
| 35 to 64 Years | 152 (2.6%) | 66 (1.0%) |
| 65 to 74 Years | 91 (6.3%) | 117 (6.4%) |
| 75 Years and over | 303 (32.1%) | 224 (16.0%) |
Disability Class: Vision Difficulty
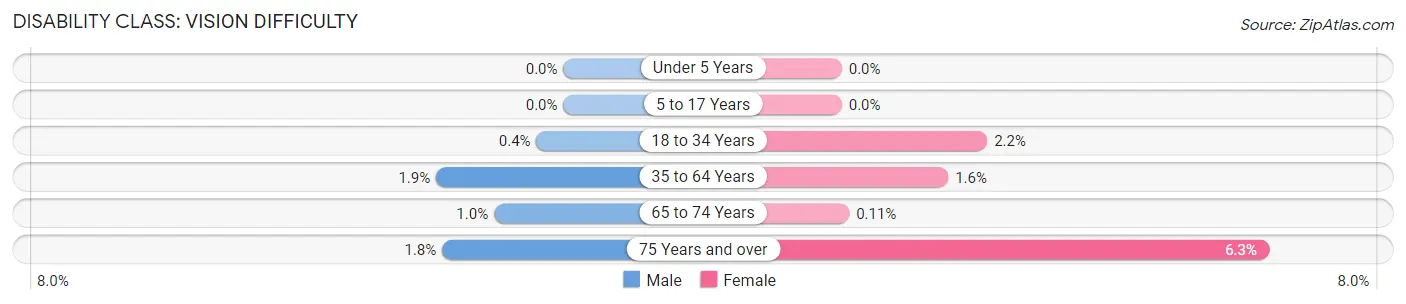
| Age Bracket | Male | Female |
| Under 5 Years | 0 (0.0%) | 0 (0.0%) |
| 5 to 17 Years | 0 (0.0%) | 0 (0.0%) |
| 18 to 34 Years | 17 (0.4%) | 62 (2.2%) |
| 35 to 64 Years | 112 (1.9%) | 100 (1.6%) |
| 65 to 74 Years | 15 (1.0%) | 2 (0.1%) |
| 75 Years and over | 17 (1.8%) | 89 (6.3%) |
Disability Class: Cognitive Difficulty
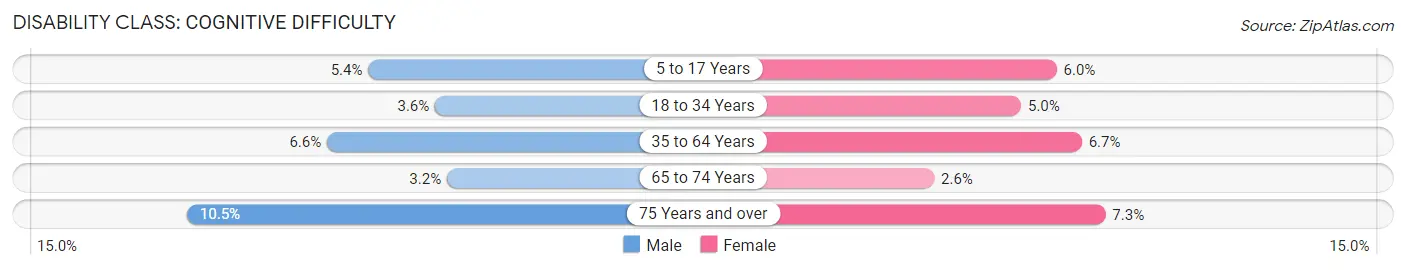
| Age Bracket | Male | Female |
| 5 to 17 Years | 89 (5.4%) | 130 (6.0%) |
| 18 to 34 Years | 152 (3.6%) | 143 (5.0%) |
| 35 to 64 Years | 391 (6.6%) | 424 (6.7%) |
| 65 to 74 Years | 47 (3.2%) | 47 (2.6%) |
| 75 Years and over | 99 (10.5%) | 103 (7.3%) |
Disability Class: Ambulatory Difficulty
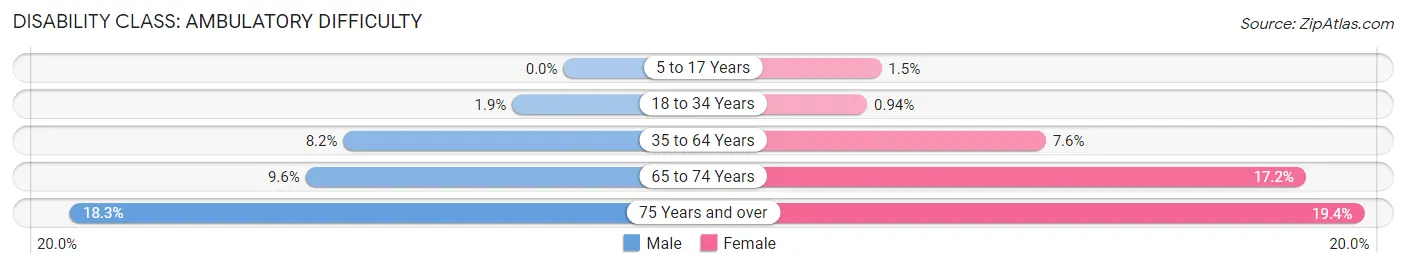
| Age Bracket | Male | Female |
| 5 to 17 Years | 0 (0.0%) | 32 (1.5%) |
| 18 to 34 Years | 81 (1.9%) | 27 (0.9%) |
| 35 to 64 Years | 485 (8.2%) | 480 (7.6%) |
| 65 to 74 Years | 139 (9.6%) | 315 (17.2%) |
| 75 Years and over | 173 (18.3%) | 272 (19.4%) |
Disability Class: Self-Care Difficulty
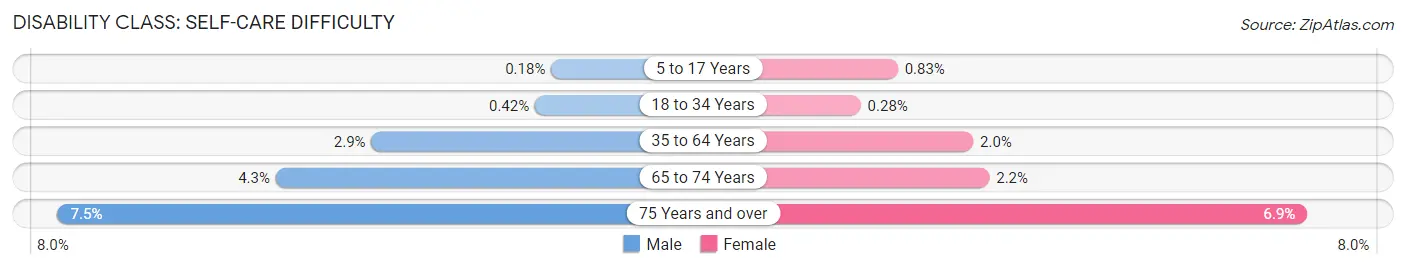
| Age Bracket | Male | Female |
| 5 to 17 Years | 3 (0.2%) | 18 (0.8%) |
| 18 to 34 Years | 18 (0.4%) | 8 (0.3%) |
| 35 to 64 Years | 169 (2.9%) | 124 (1.9%) |
| 65 to 74 Years | 62 (4.3%) | 40 (2.2%) |
| 75 Years and over | 71 (7.5%) | 97 (6.9%) |
Technology Access in North Tonawanda
Computing Device Access in North Tonawanda
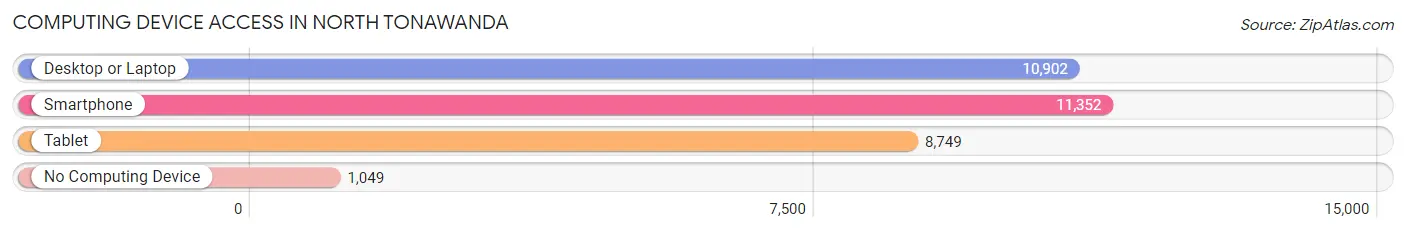
| Device Type | # Households | % Households |
| Desktop or Laptop | 10,902 | 79.9% |
| Smartphone | 11,352 | 83.2% |
| Tablet | 8,749 | 64.1% |
| No Computing Device | 1,049 | 7.7% |
| Total | 13,643 | 100.0% |
Internet Access in North Tonawanda
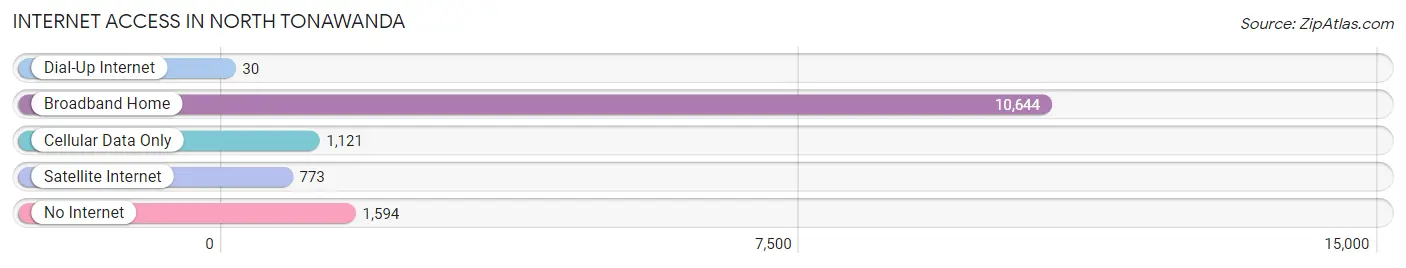
| Internet Type | # Households | % Households |
| Dial-Up Internet | 30 | 0.2% |
| Broadband Home | 10,644 | 78.0% |
| Cellular Data Only | 1,121 | 8.2% |
| Satellite Internet | 773 | 5.7% |
| No Internet | 1,594 | 11.7% |
| Total | 13,643 | 100.0% |
North Tonawanda Summary
History
North Tonawanda is a city located in Niagara County, New York, United States. It is part of the Buffalo-Niagara Falls metropolitan area. The city is located on the Niagara River, just across from the city of Tonawanda. The city was first settled in 1809 and was incorporated in 1897.
The city was originally known as Manchester, but was renamed North Tonawanda in 1836. The name was chosen to distinguish it from the nearby city of Tonawanda, which was located on the south side of the Niagara River.
The city was an important industrial center in the late 19th and early 20th centuries. It was home to several large factories, including the American Car and Foundry Company, which produced railroad cars and other equipment. The city was also home to several paper mills, which produced paper products for the region.
The city was also home to several large amusement parks, including the Crystal Beach Amusement Park, which operated from 1888 to 1989. The park was a popular destination for tourists and locals alike.
Geography
North Tonawanda is located in Niagara County, New York, United States. It is part of the Buffalo-Niagara Falls metropolitan area. The city is located on the Niagara River, just across from the city of Tonawanda.
The city has a total area of 8.2 square miles, of which 7.9 square miles is land and 0.3 square miles is water. The city is located at an elevation of 590 feet above sea level.
The city is located in a humid continental climate zone, with cold winters and hot, humid summers. The average annual temperature is 48.2 degrees Fahrenheit. The average annual precipitation is 37.2 inches.
Economy
North Tonawanda is an important industrial center in the Buffalo-Niagara Falls metropolitan area. The city is home to several large factories, including the American Car and Foundry Company, which produces railroad cars and other equipment. The city is also home to several paper mills, which produce paper products for the region.
The city is also home to several large retail stores, including Walmart, Target, and Home Depot. The city is also home to several restaurants, bars, and other businesses.
Demographics
As of the 2010 census, the city had a population of 31,568. The racial makeup of the city was 92.3% White, 3.3% African American, 0.3% Native American, 1.2% Asian, 0.1% Pacific Islander, 1.2% from other races, and 1.7% from two or more races. Hispanic or Latino of any race were 4.2% of the population.
The median income for a household in the city was $41,945, and the median income for a family was $50,945. The per capita income for the city was $20,945. About 11.3% of families and 14.2% of the population were below the poverty line, including 20.2% of those under age 18 and 8.2% of those age 65 or over.
Common Questions
What is Per Capita Income in North Tonawanda?
Per Capita income in North Tonawanda is $36,570.
What is the Median Family Income in North Tonawanda?
Median Family Income in North Tonawanda is $88,833.
What is the Median Household income in North Tonawanda?
Median Household Income in North Tonawanda is $66,836.
What is Income or Wage Gap in North Tonawanda?
Income or Wage Gap in North Tonawanda is 26.5%.
Women in North Tonawanda earn 73.5 cents for every dollar earned by a man.
What is Family Income Deficit in North Tonawanda?
Family Income Deficit in North Tonawanda is $11,190.
Families that are below poverty line in North Tonawanda earn $11,190 less on average than the poverty threshold level.
What is Inequality or Gini Index in North Tonawanda?
Inequality or Gini Index in North Tonawanda is 0.41.
What is the Total Population of North Tonawanda?
Total Population of North Tonawanda is 30,479.
What is the Total Male Population of North Tonawanda?
Total Male Population of North Tonawanda is 15,105.
What is the Total Female Population of North Tonawanda?
Total Female Population of North Tonawanda is 15,374.
What is the Ratio of Males per 100 Females in North Tonawanda?
There are 98.25 Males per 100 Females in North Tonawanda.
What is the Ratio of Females per 100 Males in North Tonawanda?
There are 101.78 Females per 100 Males in North Tonawanda.
What is the Median Population Age in North Tonawanda?
Median Population Age in North Tonawanda is 43.4 Years.
What is the Average Family Size in North Tonawanda
Average Family Size in North Tonawanda is 2.8 People.
What is the Average Household Size in North Tonawanda
Average Household Size in North Tonawanda is 2.2 People.
How Large is the Labor Force in North Tonawanda?
There are 16,642 People in the Labor Forcein in North Tonawanda.
What is the Percentage of People in the Labor Force in North Tonawanda?
64.7% of People are in the Labor Force in North Tonawanda.
What is the Unemployment Rate in North Tonawanda?
Unemployment Rate in North Tonawanda is 5.6%.