Corvallis, OR Map & Demographics
Corvallis Map
Corvallis Overview
$36,172
PER CAPITA INCOME
$101,333
AVG FAMILY INCOME
$61,610
AVG HOUSEHOLD INCOME
27.8%
WAGE / INCOME GAP [ % ]
72.2¢/ $1
WAGE / INCOME GAP [ $ ]
$12,849
FAMILY INCOME DEFICIT
0.50
INEQUALITY / GINI INDEX
60,050
TOTAL POPULATION
30,677
MALE POPULATION
29,373
FEMALE POPULATION
104.44
MALES / 100 FEMALES
95.75
FEMALES / 100 MALES
26.9
MEDIAN AGE
2.8
AVG FAMILY SIZE
2.2
AVG HOUSEHOLD SIZE
32,308
LABOR FORCE [ PEOPLE ]
60.7%
PERCENT IN LABOR FORCE
8.0%
UNEMPLOYMENT RATE
Corvallis Area Codes
Income in Corvallis
Income Overview in Corvallis
Per Capita Income in Corvallis is $36,172, while median incomes of families and households are $101,333 and $61,610 respectively.
| Characteristic | Number | Measure |
| Per Capita Income | 60,050 | $36,172 |
| Median Family Income | 10,873 | $101,333 |
| Mean Family Income | 10,873 | $125,845 |
| Median Household Income | 24,125 | $61,610 |
| Mean Household Income | 24,125 | $86,174 |
| Income Deficit | 10,873 | $12,849 |
| Wage / Income Gap (%) | 60,050 | 27.77% |
| Wage / Income Gap ($) | 60,050 | 72.23¢ per $1 |
| Gini / Inequality Index | 60,050 | 0.50 |
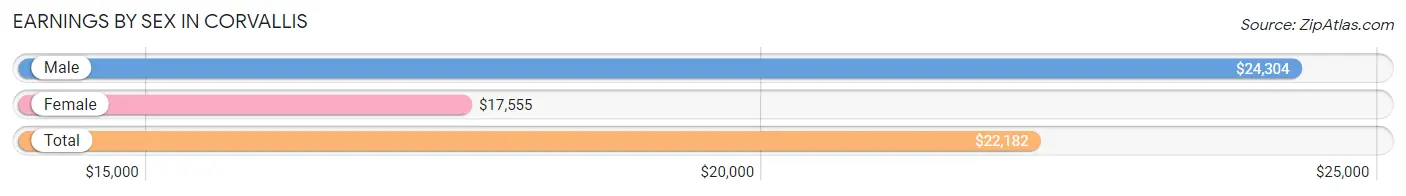
Earnings by Sex in Corvallis
Average Earnings in Corvallis are $22,182, $24,304 for men and $17,555 for women, a difference of 27.8%.
| Sex | Number | Average Earnings |
| Male | 19,899 (52.8%) | $24,304 |
| Female | 17,759 (47.2%) | $17,555 |
| Total | 37,658 (100.0%) | $22,182 |
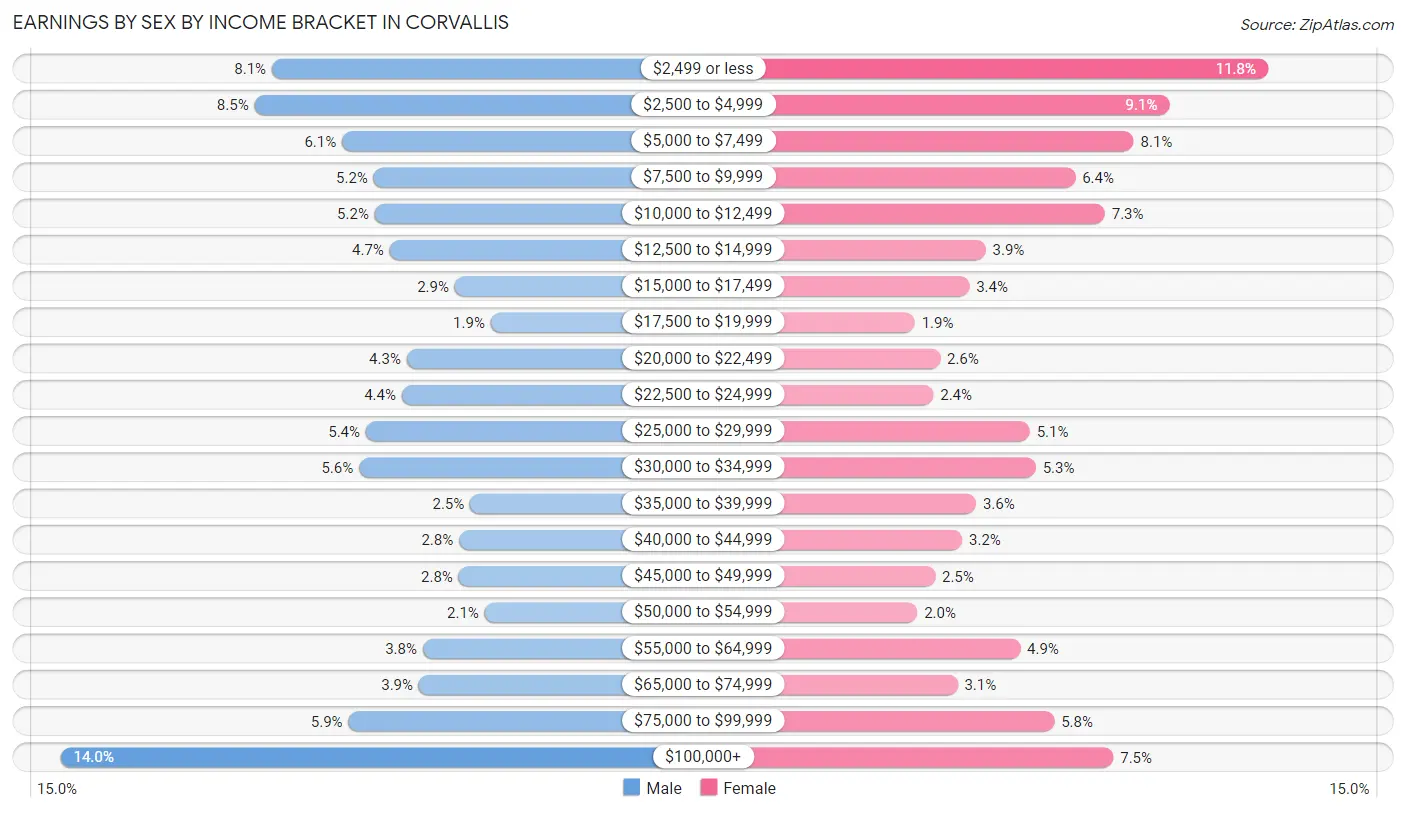
Earnings by Sex by Income Bracket in Corvallis
The most common earnings brackets in Corvallis are $100,000+ for men (2,783 | 14.0%) and $2,499 or less for women (2,101 | 11.8%).
| Income | Male | Female |
| $2,499 or less | 1,601 (8.1%) | 2,101 (11.8%) |
| $2,500 to $4,999 | 1,700 (8.5%) | 1,609 (9.1%) |
| $5,000 to $7,499 | 1,210 (6.1%) | 1,431 (8.1%) |
| $7,500 to $9,999 | 1,033 (5.2%) | 1,140 (6.4%) |
| $10,000 to $12,499 | 1,026 (5.2%) | 1,287 (7.2%) |
| $12,500 to $14,999 | 944 (4.7%) | 693 (3.9%) |
| $15,000 to $17,499 | 579 (2.9%) | 611 (3.4%) |
| $17,500 to $19,999 | 378 (1.9%) | 340 (1.9%) |
| $20,000 to $22,499 | 847 (4.3%) | 466 (2.6%) |
| $22,500 to $24,999 | 875 (4.4%) | 431 (2.4%) |
| $25,000 to $29,999 | 1,076 (5.4%) | 912 (5.1%) |
| $30,000 to $34,999 | 1,114 (5.6%) | 943 (5.3%) |
| $35,000 to $39,999 | 493 (2.5%) | 644 (3.6%) |
| $40,000 to $44,999 | 556 (2.8%) | 575 (3.2%) |
| $45,000 to $49,999 | 557 (2.8%) | 440 (2.5%) |
| $50,000 to $54,999 | 412 (2.1%) | 352 (2.0%) |
| $55,000 to $64,999 | 759 (3.8%) | 864 (4.9%) |
| $65,000 to $74,999 | 781 (3.9%) | 553 (3.1%) |
| $75,000 to $99,999 | 1,175 (5.9%) | 1,036 (5.8%) |
| $100,000+ | 2,783 (14.0%) | 1,331 (7.5%) |
| Total | 19,899 (100.0%) | 17,759 (100.0%) |
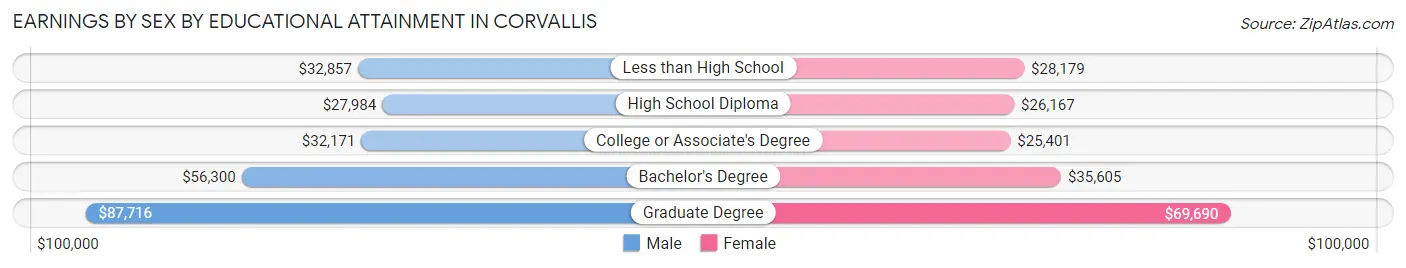
Earnings by Sex by Educational Attainment in Corvallis
Average earnings in Corvallis are $50,226 for men and $37,364 for women, a difference of 25.6%. Men with an educational attainment of graduate degree enjoy the highest average annual earnings of $87,716, while those with high school diploma education earn the least with $27,984. Women with an educational attainment of graduate degree earn the most with the average annual earnings of $69,690, while those with college or associate's degree education have the smallest earnings of $25,401.
| Educational Attainment | Male Income | Female Income |
| Less than High School | $32,857 | $28,179 |
| High School Diploma | $27,984 | $26,167 |
| College or Associate's Degree | $32,171 | $25,401 |
| Bachelor's Degree | $56,300 | $35,605 |
| Graduate Degree | $87,716 | $69,690 |
| Total | $50,226 | $37,364 |
Family Income in Corvallis
Family Income Brackets in Corvallis
According to the Corvallis family income data, there are 2,533 families falling into the $100,000 to $149,999 income range, which is the most common income bracket and makes up 23.3% of all families. Conversely, the $10,000 to $14,999 income bracket is the least frequent group with only 185 families (1.7%) belonging to this category.
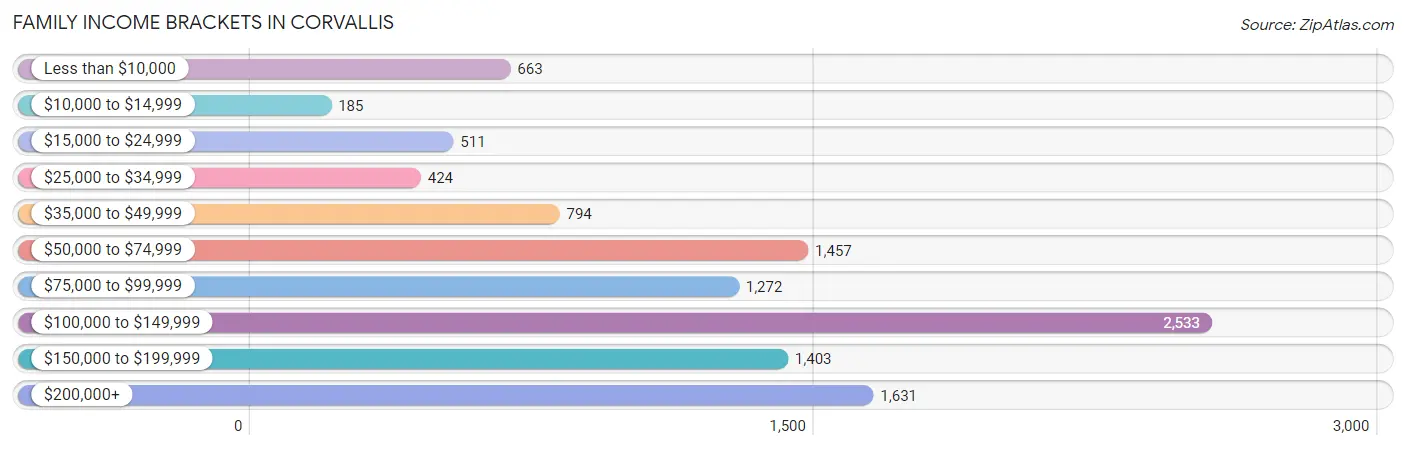
| Income Bracket | # Families | % Families |
| Less than $10,000 | 663 | 6.1% |
| $10,000 to $14,999 | 185 | 1.7% |
| $15,000 to $24,999 | 511 | 4.7% |
| $25,000 to $34,999 | 424 | 3.9% |
| $35,000 to $49,999 | 794 | 7.3% |
| $50,000 to $74,999 | 1,457 | 13.4% |
| $75,000 to $99,999 | 1,272 | 11.7% |
| $100,000 to $149,999 | 2,533 | 23.3% |
| $150,000 to $199,999 | 1,403 | 12.9% |
| $200,000+ | 1,631 | 15.0% |
Family Income by Famaliy Size in Corvallis
4-person families (1,503 | 13.8%) account for the highest median family income in Corvallis with $121,215 per family, while 2-person families (6,028 | 55.4%) have the highest median income of $45,135 per family member.
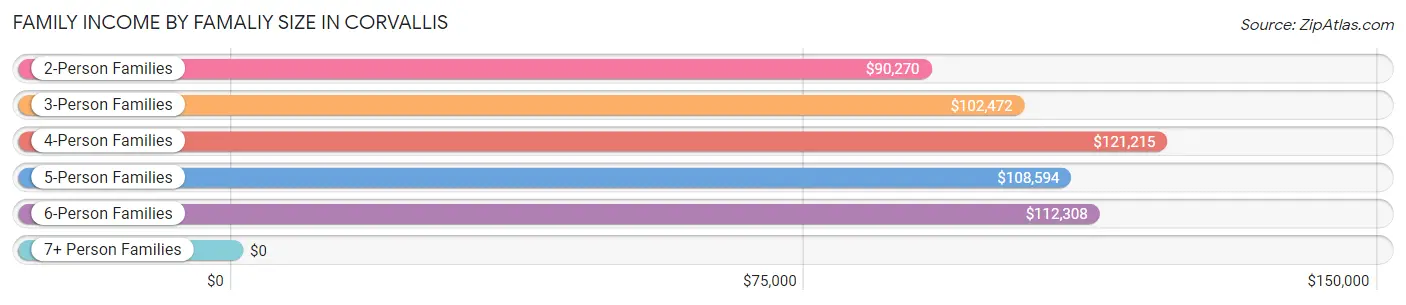
| Income Bracket | # Families | Median Income |
| 2-Person Families | 6,028 (55.4%) | $90,270 |
| 3-Person Families | 2,382 (21.9%) | $102,472 |
| 4-Person Families | 1,503 (13.8%) | $121,215 |
| 5-Person Families | 770 (7.1%) | $108,594 |
| 6-Person Families | 150 (1.4%) | $112,308 |
| 7+ Person Families | 40 (0.4%) | $0 |
| Total | 10,873 (100.0%) | $101,333 |
Family Income by Number of Earners in Corvallis
The median family income in Corvallis is $101,333, with families comprising 3+ earners (929) having the highest median family income of $127,444, while families with no earners (1,952) have the lowest median family income of $75,071, accounting for 8.5% and 17.9% of families, respectively.
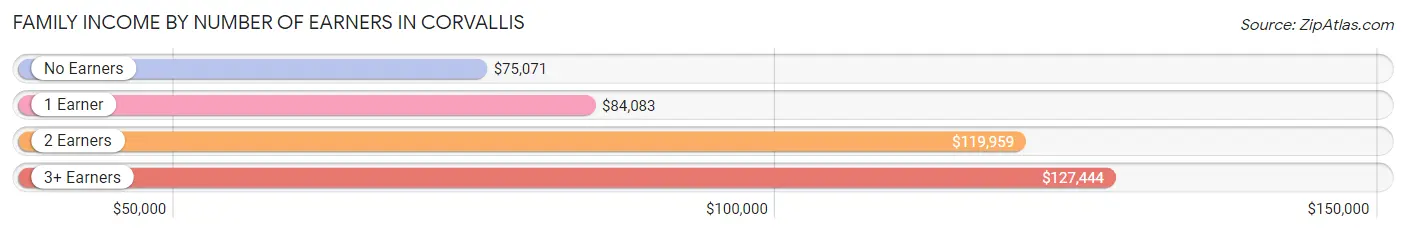
| Number of Earners | # Families | Median Income |
| No Earners | 1,952 (17.9%) | $75,071 |
| 1 Earner | 3,665 (33.7%) | $84,083 |
| 2 Earners | 4,327 (39.8%) | $119,959 |
| 3+ Earners | 929 (8.5%) | $127,444 |
| Total | 10,873 (100.0%) | $101,333 |
Household Income in Corvallis
Household Income Brackets in Corvallis
With 4,174 households falling in the category, the $50,000 to $74,999 income range is the most frequent in Corvallis, accounting for 17.3% of all households. In contrast, only 1,279 households (5.3%) fall into the $10,000 to $14,999 income bracket, making it the least populous group.
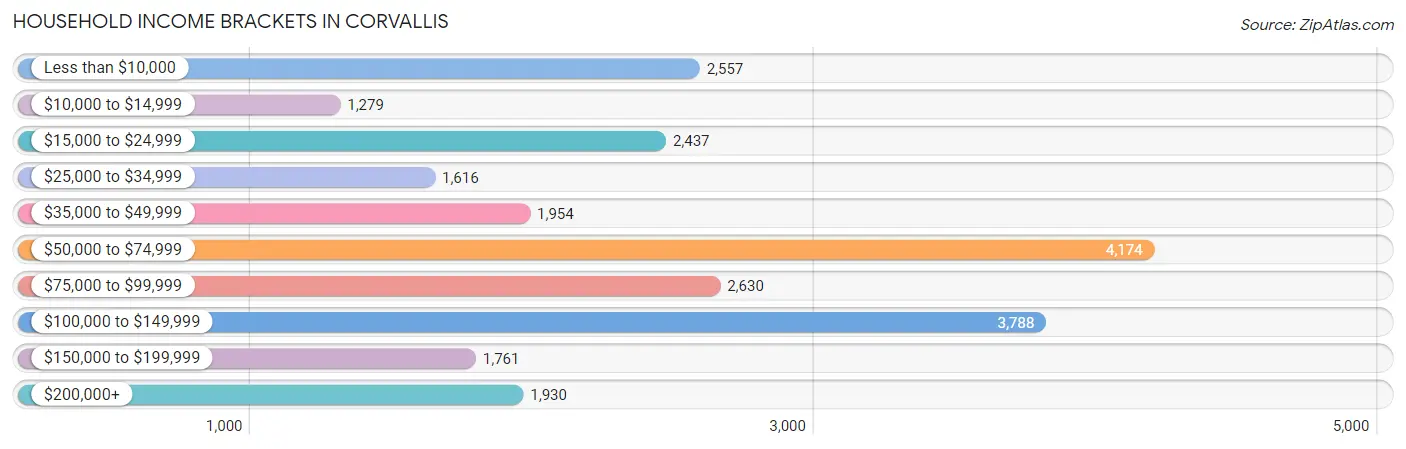
| Income Bracket | # Households | % Households |
| Less than $10,000 | 2,557 | 10.6% |
| $10,000 to $14,999 | 1,279 | 5.3% |
| $15,000 to $24,999 | 2,437 | 10.1% |
| $25,000 to $34,999 | 1,616 | 6.7% |
| $35,000 to $49,999 | 1,954 | 8.1% |
| $50,000 to $74,999 | 4,174 | 17.3% |
| $75,000 to $99,999 | 2,630 | 10.9% |
| $100,000 to $149,999 | 3,788 | 15.7% |
| $150,000 to $199,999 | 1,761 | 7.3% |
| $200,000+ | 1,930 | 8.0% |
Household Income by Householder Age in Corvallis
The median household income in Corvallis is $61,610, with the highest median household income of $98,750 found in the 45 to 64 years age bracket for the primary householder. A total of 5,821 households (24.1%) fall into this category. Meanwhile, the 15 to 24 years age bracket for the primary householder has the lowest median household income of $23,647, with 5,517 households (22.9%) in this group.
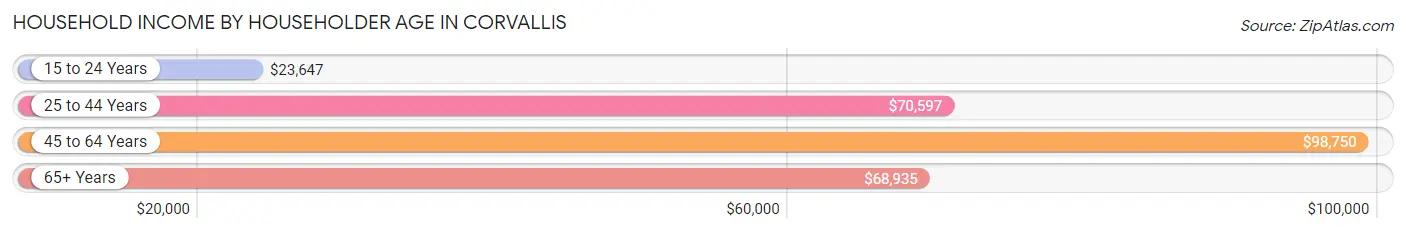
| Income Bracket | # Households | Median Income |
| 15 to 24 Years | 5,517 (22.9%) | $23,647 |
| 25 to 44 Years | 7,654 (31.7%) | $70,597 |
| 45 to 64 Years | 5,821 (24.1%) | $98,750 |
| 65+ Years | 5,133 (21.3%) | $68,935 |
| Total | 24,125 (100.0%) | $61,610 |
Poverty in Corvallis
Income Below Poverty by Sex and Age in Corvallis
With 26.2% poverty level for males and 26.7% for females among the residents of Corvallis, 18 to 24 year old males and 18 to 24 year old females are the most vulnerable to poverty, with 4,237 males (55.3%) and 4,269 females (61.8%) in their respective age groups living below the poverty level.
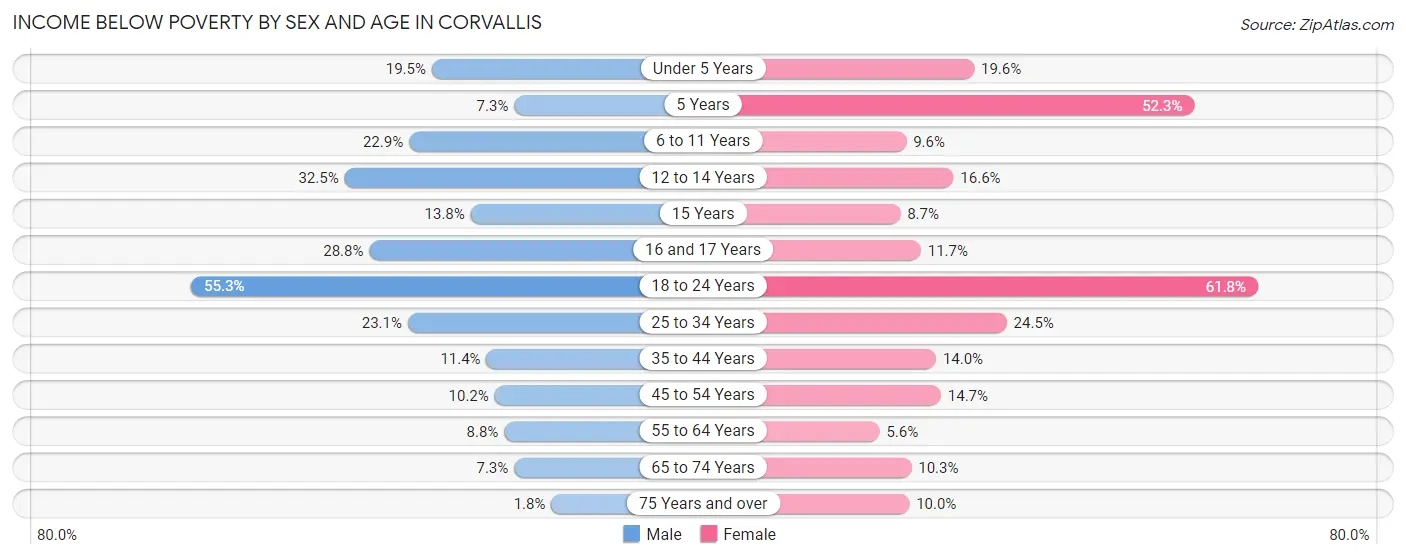
| Age Bracket | Male | Female |
| Under 5 Years | 206 (19.5%) | 162 (19.6%) |
| 5 Years | 21 (7.3%) | 45 (52.3%) |
| 6 to 11 Years | 327 (22.9%) | 125 (9.6%) |
| 12 to 14 Years | 209 (32.5%) | 114 (16.6%) |
| 15 Years | 19 (13.8%) | 17 (8.7%) |
| 16 and 17 Years | 132 (28.8%) | 57 (11.7%) |
| 18 to 24 Years | 4,237 (55.3%) | 4,269 (61.8%) |
| 25 to 34 Years | 1,061 (23.1%) | 1,024 (24.5%) |
| 35 to 44 Years | 345 (11.4%) | 360 (14.0%) |
| 45 to 54 Years | 232 (10.2%) | 366 (14.7%) |
| 55 to 64 Years | 201 (8.8%) | 144 (5.6%) |
| 65 to 74 Years | 181 (7.3%) | 241 (10.3%) |
| 75 Years and over | 21 (1.8%) | 207 (10.0%) |
| Total | 7,192 (26.2%) | 7,131 (26.7%) |
Income Above Poverty by Sex and Age in Corvallis
According to the poverty statistics in Corvallis, males aged 75 years and over and females aged 55 to 64 years are the age groups that are most secure financially, with 98.2% of males and 94.4% of females in these age groups living above the poverty line.
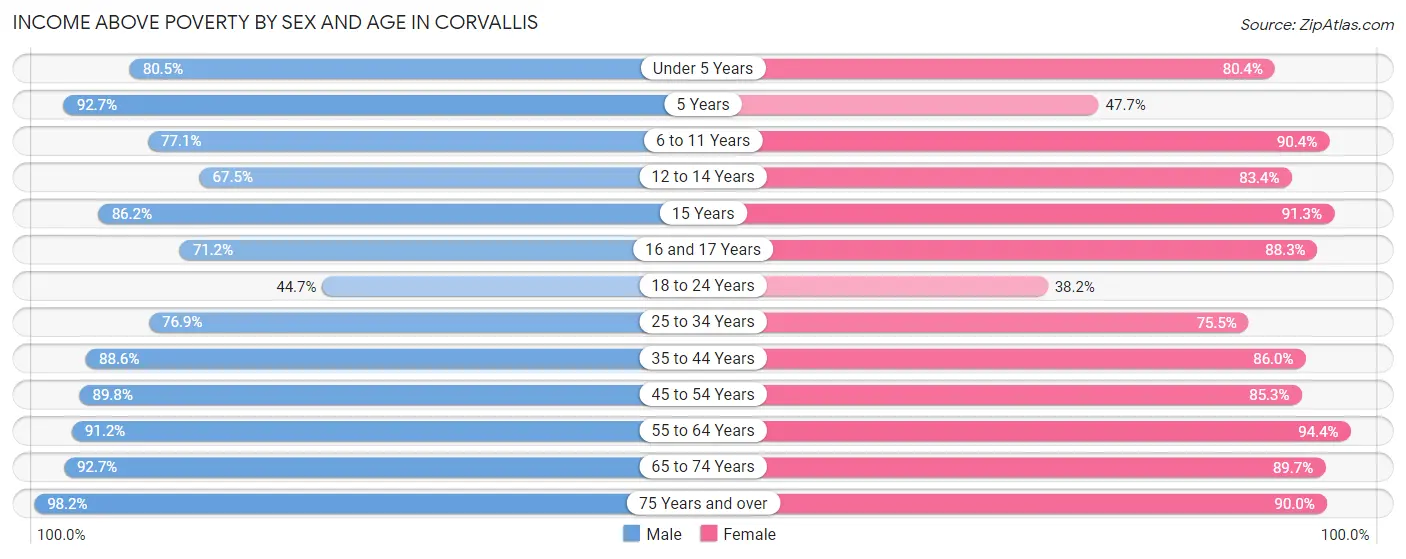
| Age Bracket | Male | Female |
| Under 5 Years | 848 (80.5%) | 663 (80.4%) |
| 5 Years | 267 (92.7%) | 41 (47.7%) |
| 6 to 11 Years | 1,100 (77.1%) | 1,183 (90.4%) |
| 12 to 14 Years | 434 (67.5%) | 574 (83.4%) |
| 15 Years | 119 (86.2%) | 179 (91.3%) |
| 16 and 17 Years | 326 (71.2%) | 429 (88.3%) |
| 18 to 24 Years | 3,431 (44.7%) | 2,641 (38.2%) |
| 25 to 34 Years | 3,533 (76.9%) | 3,159 (75.5%) |
| 35 to 44 Years | 2,677 (88.6%) | 2,216 (86.0%) |
| 45 to 54 Years | 2,040 (89.8%) | 2,122 (85.3%) |
| 55 to 64 Years | 2,086 (91.2%) | 2,428 (94.4%) |
| 65 to 74 Years | 2,295 (92.7%) | 2,094 (89.7%) |
| 75 Years and over | 1,152 (98.2%) | 1,861 (90.0%) |
| Total | 20,308 (73.9%) | 19,590 (73.3%) |
Income Below Poverty Among Married-Couple Families in Corvallis
The poverty statistics for married-couple families in Corvallis show that 4.5% or 361 of the total 7,990 families live below the poverty line. Families with 1 or 2 children have the highest poverty rate of 8.3%, comprising of 201 families. On the other hand, families with 5 or more children have the lowest poverty rate of 0.0%, which includes 0 families.
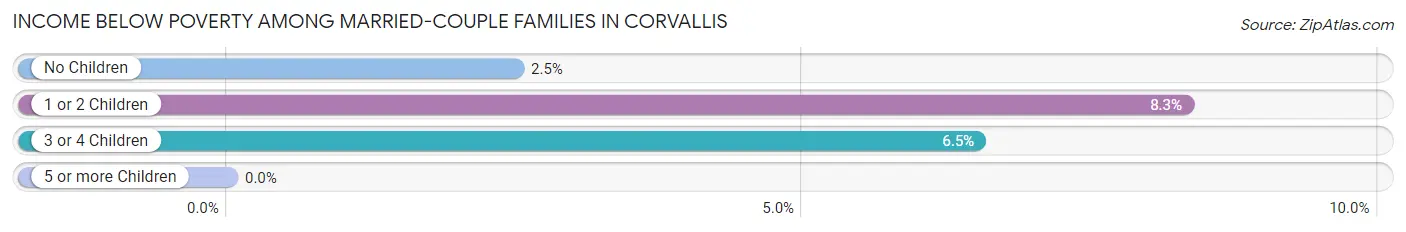
| Children | Above Poverty | Below Poverty |
| No Children | 4,900 (97.5%) | 125 (2.5%) |
| 1 or 2 Children | 2,215 (91.7%) | 201 (8.3%) |
| 3 or 4 Children | 503 (93.5%) | 35 (6.5%) |
| 5 or more Children | 11 (100.0%) | 0 (0.0%) |
| Total | 7,629 (95.5%) | 361 (4.5%) |
Income Below Poverty Among Single-Parent Households in Corvallis
According to the poverty data in Corvallis, 21.8% or 224 single-father households and 31.2% or 578 single-mother households are living below the poverty line. Among single-father households, those with 1 or 2 children have the highest poverty rate, with 134 households (28.2%) experiencing poverty. Likewise, among single-mother households, those with 3 or 4 children have the highest poverty rate, with 111 households (100.0%) falling below the poverty line.
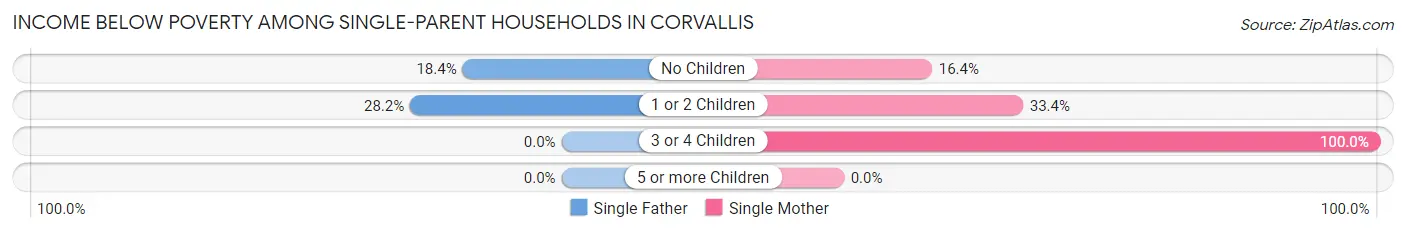
| Children | Single Father | Single Mother |
| No Children | 90 (18.4%) | 111 (16.4%) |
| 1 or 2 Children | 134 (28.2%) | 356 (33.4%) |
| 3 or 4 Children | 0 (0.0%) | 111 (100.0%) |
| 5 or more Children | 0 (0.0%) | 0 (0.0%) |
| Total | 224 (21.8%) | 578 (31.2%) |
Income Below Poverty Among Married-Couple vs Single-Parent Households in Corvallis
The poverty data for Corvallis shows that 361 of the married-couple family households (4.5%) and 802 of the single-parent households (27.8%) are living below the poverty level. Within the married-couple family households, those with 1 or 2 children have the highest poverty rate, with 201 households (8.3%) falling below the poverty line. Among the single-parent households, those with 3 or 4 children have the highest poverty rate, with 111 household (62.7%) living below poverty.
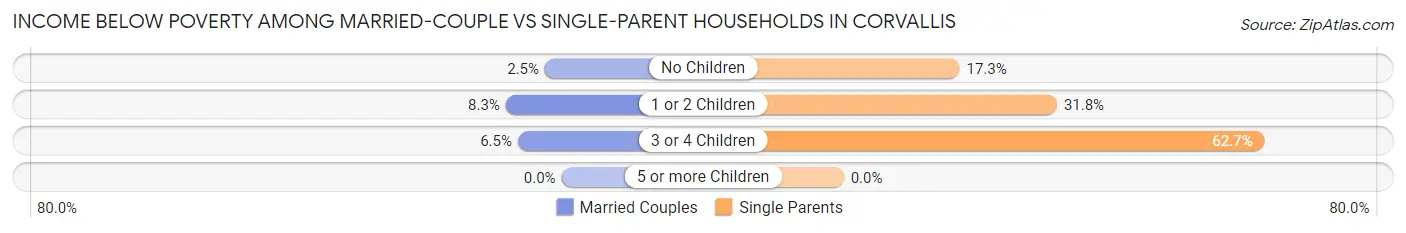
| Children | Married-Couple Families | Single-Parent Households |
| No Children | 125 (2.5%) | 201 (17.3%) |
| 1 or 2 Children | 201 (8.3%) | 490 (31.8%) |
| 3 or 4 Children | 35 (6.5%) | 111 (62.7%) |
| 5 or more Children | 0 (0.0%) | 0 (0.0%) |
| Total | 361 (4.5%) | 802 (27.8%) |
Race in Corvallis
The most populous races in Corvallis are White / Caucasian (46,875 | 78.1%), Asian (5,887 | 9.8%), and Hispanic or Latino (5,219 | 8.7%).
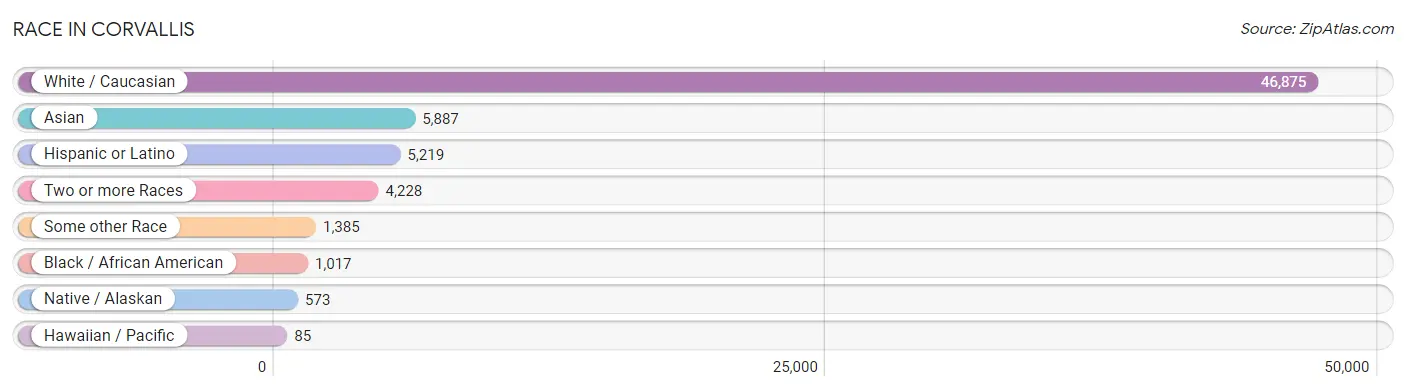
| Race | # Population | % Population |
| Asian | 5,887 | 9.8% |
| Black / African American | 1,017 | 1.7% |
| Hawaiian / Pacific | 85 | 0.1% |
| Hispanic or Latino | 5,219 | 8.7% |
| Native / Alaskan | 573 | 0.9% |
| White / Caucasian | 46,875 | 78.1% |
| Two or more Races | 4,228 | 7.0% |
| Some other Race | 1,385 | 2.3% |
| Total | 60,050 | 100.0% |
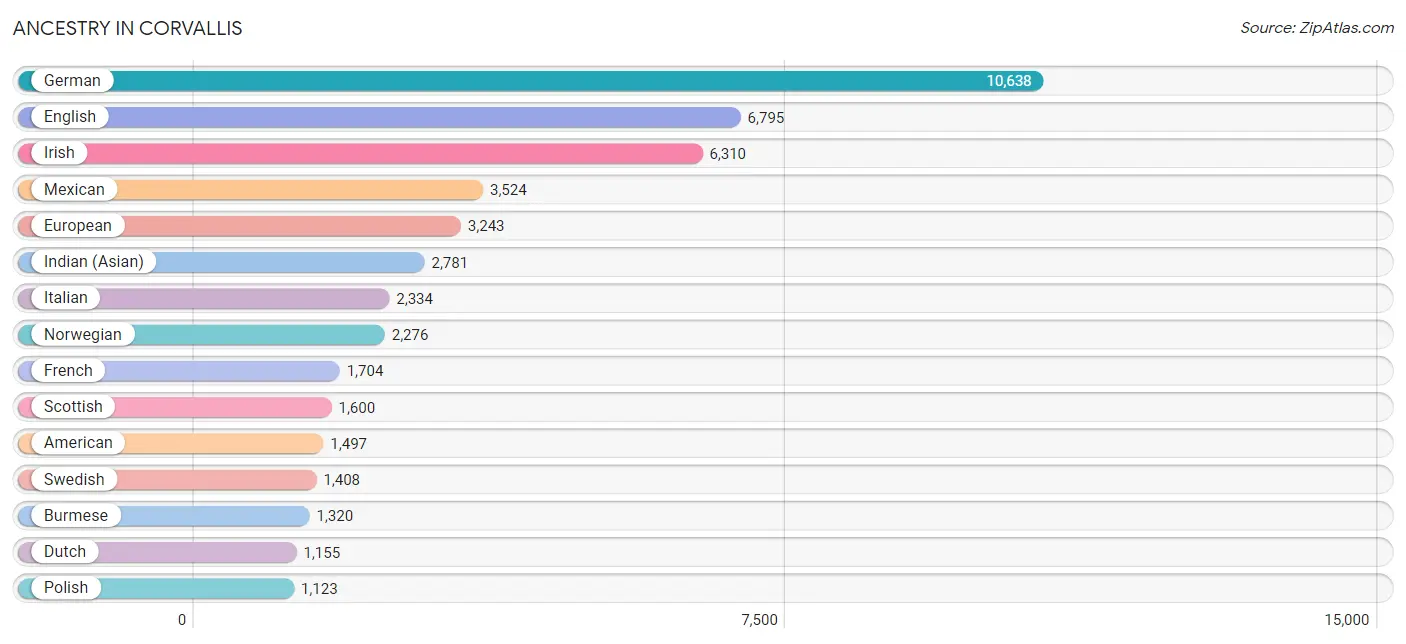
Ancestry in Corvallis
The most populous ancestries reported in Corvallis are German (10,638 | 17.7%), English (6,795 | 11.3%), Irish (6,310 | 10.5%), Mexican (3,524 | 5.9%), and European (3,243 | 5.4%), together accounting for 50.8% of all Corvallis residents.
| Ancestry | # Population | % Population |
| African | 321 | 0.5% |
| Alaskan Athabascan | 38 | 0.1% |
| Albanian | 9 | 0.0% |
| American | 1,497 | 2.5% |
| Apache | 5 | 0.0% |
| Arab | 514 | 0.9% |
| Argentinean | 181 | 0.3% |
| Armenian | 156 | 0.3% |
| Australian | 79 | 0.1% |
| Austrian | 127 | 0.2% |
| Bangladeshi | 20 | 0.0% |
| Basque | 54 | 0.1% |
| Belgian | 215 | 0.4% |
| Bhutanese | 736 | 1.2% |
| Blackfeet | 11 | 0.0% |
| Brazilian | 117 | 0.2% |
| British | 873 | 1.5% |
| Bulgarian | 13 | 0.0% |
| Burmese | 1,320 | 2.2% |
| Canadian | 189 | 0.3% |
| Central American | 223 | 0.4% |
| Central American Indian | 97 | 0.2% |
| Cherokee | 60 | 0.1% |
| Chickasaw | 3 | 0.0% |
| Chilean | 28 | 0.1% |
| Chippewa | 30 | 0.1% |
| Choctaw | 100 | 0.2% |
| Colombian | 74 | 0.1% |
| Colville | 24 | 0.0% |
| Creek | 9 | 0.0% |
| Croatian | 88 | 0.2% |
| Cuban | 101 | 0.2% |
| Czech | 177 | 0.3% |
| Czechoslovakian | 91 | 0.2% |
| Danish | 531 | 0.9% |
| Dominican | 23 | 0.0% |
| Dutch | 1,155 | 1.9% |
| Eastern European | 254 | 0.4% |
| Ecuadorian | 44 | 0.1% |
| Egyptian | 42 | 0.1% |
| English | 6,795 | 11.3% |
| Estonian | 35 | 0.1% |
| Ethiopian | 9 | 0.0% |
| European | 3,243 | 5.4% |
| Fijian | 28 | 0.1% |
| Filipino | 28 | 0.1% |
| Finnish | 261 | 0.4% |
| French | 1,704 | 2.8% |
| French Canadian | 508 | 0.9% |
| German | 10,638 | 17.7% |
| Greek | 287 | 0.5% |
| Guamanian / Chamorro | 131 | 0.2% |
| Guatemalan | 141 | 0.2% |
| Honduran | 5 | 0.0% |
| Hungarian | 133 | 0.2% |
| Indian (Asian) | 2,781 | 4.6% |
| Indonesian | 18 | 0.0% |
| Inupiat | 40 | 0.1% |
| Iranian | 78 | 0.1% |
| Irish | 6,310 | 10.5% |
| Iroquois | 42 | 0.1% |
| Israeli | 62 | 0.1% |
| Italian | 2,334 | 3.9% |
| Jamaican | 8 | 0.0% |
| Japanese | 38 | 0.1% |
| Jordanian | 38 | 0.1% |
| Korean | 712 | 1.2% |
| Laotian | 121 | 0.2% |
| Latvian | 34 | 0.1% |
| Lebanese | 90 | 0.2% |
| Lithuanian | 255 | 0.4% |
| Luxembourger | 44 | 0.1% |
| Maltese | 15 | 0.0% |
| Mexican | 3,524 | 5.9% |
| Mexican American Indian | 435 | 0.7% |
| Native Hawaiian | 166 | 0.3% |
| Navajo | 16 | 0.0% |
| New Zealander | 18 | 0.0% |
| Nicaraguan | 3 | 0.0% |
| Northern European | 492 | 0.8% |
| Norwegian | 2,276 | 3.8% |
| Okinawan | 13 | 0.0% |
| Osage | 34 | 0.1% |
| Pakistani | 215 | 0.4% |
| Palestinian | 38 | 0.1% |
| Panamanian | 34 | 0.1% |
| Pennsylvania German | 30 | 0.1% |
| Peruvian | 190 | 0.3% |
| Polish | 1,123 | 1.9% |
| Portuguese | 174 | 0.3% |
| Puerto Rican | 304 | 0.5% |
| Romanian | 88 | 0.2% |
| Russian | 530 | 0.9% |
| Salvadoran | 40 | 0.1% |
| Samoan | 85 | 0.1% |
| Scandinavian | 502 | 0.8% |
| Scotch-Irish | 637 | 1.1% |
| Scottish | 1,600 | 2.7% |
| Shoshone | 8 | 0.0% |
| Slavic | 61 | 0.1% |
| Slovak | 87 | 0.1% |
| South American | 529 | 0.9% |
| Spaniard | 295 | 0.5% |
| Spanish | 52 | 0.1% |
| Sri Lankan | 574 | 1.0% |
| Subsaharan African | 342 | 0.6% |
| Swedish | 1,408 | 2.3% |
| Swiss | 736 | 1.2% |
| Syrian | 27 | 0.0% |
| Thai | 784 | 1.3% |
| Tlingit-Haida | 17 | 0.0% |
| Turkish | 40 | 0.1% |
| Ukrainian | 279 | 0.5% |
| Uruguayan | 3 | 0.0% |
| Welsh | 795 | 1.3% |
| West Indian | 16 | 0.0% |
| Yaqui | 15 | 0.0% |
| Yugoslavian | 16 | 0.0% | View All 118 Rows |
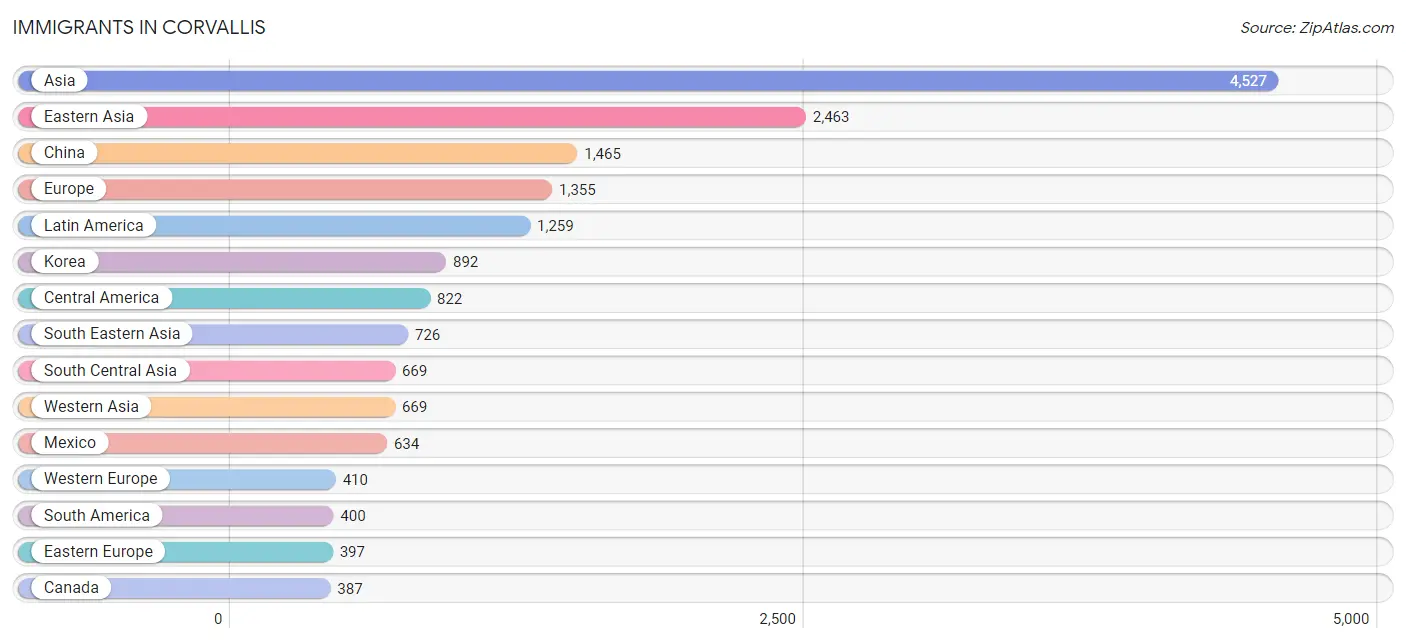
Immigrants in Corvallis
The most numerous immigrant groups reported in Corvallis came from Asia (4,527 | 7.5%), Eastern Asia (2,463 | 4.1%), China (1,465 | 2.4%), Europe (1,355 | 2.3%), and Latin America (1,259 | 2.1%), together accounting for 18.4% of all Corvallis residents.
| Immigration Origin | # Population | % Population |
| Africa | 220 | 0.4% |
| Albania | 9 | 0.0% |
| Argentina | 77 | 0.1% |
| Asia | 4,527 | 7.5% |
| Australia | 50 | 0.1% |
| Belarus | 14 | 0.0% |
| Belize | 100 | 0.2% |
| Bosnia and Herzegovina | 17 | 0.0% |
| Brazil | 32 | 0.1% |
| Cambodia | 17 | 0.0% |
| Canada | 387 | 0.6% |
| Caribbean | 37 | 0.1% |
| Central America | 822 | 1.4% |
| China | 1,465 | 2.4% |
| Colombia | 31 | 0.1% |
| Cuba | 27 | 0.0% |
| Czechoslovakia | 20 | 0.0% |
| Denmark | 10 | 0.0% |
| Dominican Republic | 10 | 0.0% |
| Eastern Africa | 108 | 0.2% |
| Eastern Asia | 2,463 | 4.1% |
| Eastern Europe | 397 | 0.7% |
| Ecuador | 40 | 0.1% |
| Egypt | 28 | 0.1% |
| England | 72 | 0.1% |
| Ethiopia | 96 | 0.2% |
| Europe | 1,355 | 2.3% |
| France | 151 | 0.3% |
| Germany | 92 | 0.2% |
| Guatemala | 55 | 0.1% |
| Hong Kong | 15 | 0.0% |
| India | 350 | 0.6% |
| Indonesia | 48 | 0.1% |
| Iran | 71 | 0.1% |
| Iraq | 77 | 0.1% |
| Ireland | 10 | 0.0% |
| Israel | 75 | 0.1% |
| Italy | 229 | 0.4% |
| Japan | 106 | 0.2% |
| Jordan | 38 | 0.1% |
| Kazakhstan | 170 | 0.3% |
| Korea | 892 | 1.5% |
| Kuwait | 160 | 0.3% |
| Latin America | 1,259 | 2.1% |
| Latvia | 17 | 0.0% |
| Lebanon | 11 | 0.0% |
| Malaysia | 53 | 0.1% |
| Mexico | 634 | 1.1% |
| Nepal | 17 | 0.0% |
| Netherlands | 24 | 0.0% |
| Nigeria | 14 | 0.0% |
| Northern Africa | 53 | 0.1% |
| Northern Europe | 235 | 0.4% |
| Oceania | 90 | 0.2% |
| Panama | 33 | 0.1% |
| Peru | 220 | 0.4% |
| Philippines | 169 | 0.3% |
| Poland | 131 | 0.2% |
| Romania | 12 | 0.0% |
| Russia | 159 | 0.3% |
| Saudi Arabia | 117 | 0.2% |
| Scotland | 59 | 0.1% |
| Senegal | 14 | 0.0% |
| Singapore | 131 | 0.2% |
| South Africa | 31 | 0.1% |
| South America | 400 | 0.7% |
| South Central Asia | 669 | 1.1% |
| South Eastern Asia | 726 | 1.2% |
| Southern Europe | 313 | 0.5% |
| Spain | 84 | 0.1% |
| Sri Lanka | 14 | 0.0% |
| Sudan | 25 | 0.0% |
| Sweden | 32 | 0.1% |
| Switzerland | 143 | 0.2% |
| Taiwan | 248 | 0.4% |
| Thailand | 220 | 0.4% |
| Turkey | 35 | 0.1% |
| Ukraine | 7 | 0.0% |
| Uzbekistan | 47 | 0.1% |
| Vietnam | 88 | 0.2% |
| Western Africa | 28 | 0.1% |
| Western Asia | 669 | 1.1% |
| Western Europe | 410 | 0.7% | View All 83 Rows |
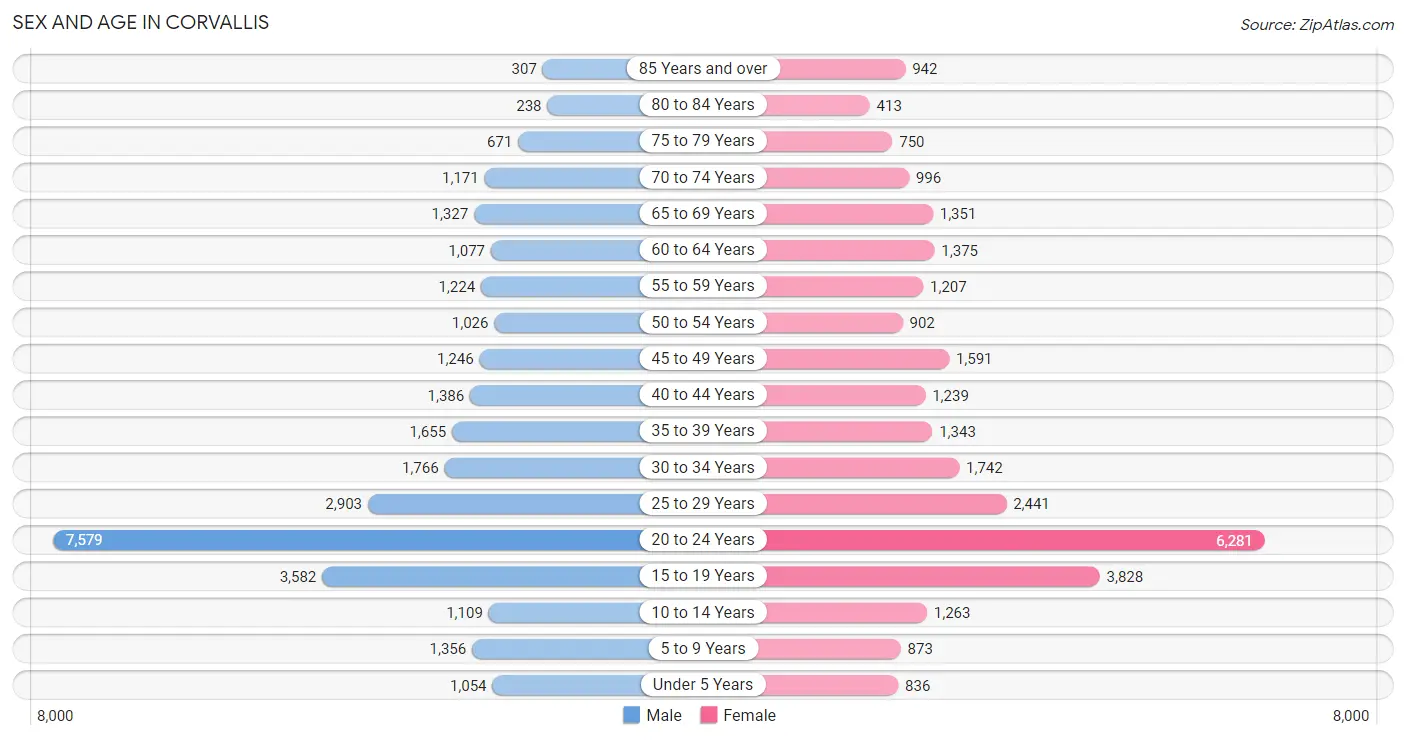
Sex and Age in Corvallis
Sex and Age in Corvallis
The most populous age groups in Corvallis are 20 to 24 Years (7,579 | 24.7%) for men and 20 to 24 Years (6,281 | 21.4%) for women.
| Age Bracket | Male | Female |
| Under 5 Years | 1,054 (3.4%) | 836 (2.9%) |
| 5 to 9 Years | 1,356 (4.4%) | 873 (3.0%) |
| 10 to 14 Years | 1,109 (3.6%) | 1,263 (4.3%) |
| 15 to 19 Years | 3,582 (11.7%) | 3,828 (13.0%) |
| 20 to 24 Years | 7,579 (24.7%) | 6,281 (21.4%) |
| 25 to 29 Years | 2,903 (9.5%) | 2,441 (8.3%) |
| 30 to 34 Years | 1,766 (5.8%) | 1,742 (5.9%) |
| 35 to 39 Years | 1,655 (5.4%) | 1,343 (4.6%) |
| 40 to 44 Years | 1,386 (4.5%) | 1,239 (4.2%) |
| 45 to 49 Years | 1,246 (4.1%) | 1,591 (5.4%) |
| 50 to 54 Years | 1,026 (3.3%) | 902 (3.1%) |
| 55 to 59 Years | 1,224 (4.0%) | 1,207 (4.1%) |
| 60 to 64 Years | 1,077 (3.5%) | 1,375 (4.7%) |
| 65 to 69 Years | 1,327 (4.3%) | 1,351 (4.6%) |
| 70 to 74 Years | 1,171 (3.8%) | 996 (3.4%) |
| 75 to 79 Years | 671 (2.2%) | 750 (2.5%) |
| 80 to 84 Years | 238 (0.8%) | 413 (1.4%) |
| 85 Years and over | 307 (1.0%) | 942 (3.2%) |
| Total | 30,677 (100.0%) | 29,373 (100.0%) |
Families and Households in Corvallis
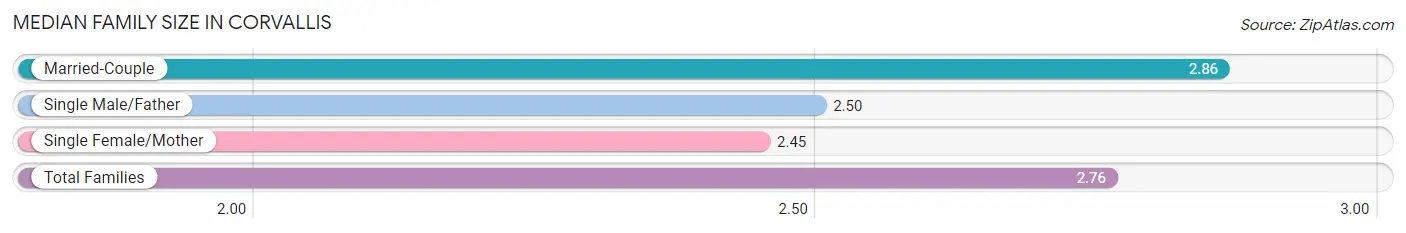
Median Family Size in Corvallis
The median family size in Corvallis is 2.76 persons per family, with married-couple families (7,990 | 73.5%) accounting for the largest median family size of 2.86 persons per family. On the other hand, single female/mother families (1,854 | 17.1%) represent the smallest median family size with 2.45 persons per family.
| Family Type | # Families | Family Size |
| Married-Couple | 7,990 (73.5%) | 2.86 |
| Single Male/Father | 1,029 (9.5%) | 2.50 |
| Single Female/Mother | 1,854 (17.1%) | 2.45 |
| Total Families | 10,873 (100.0%) | 2.76 |
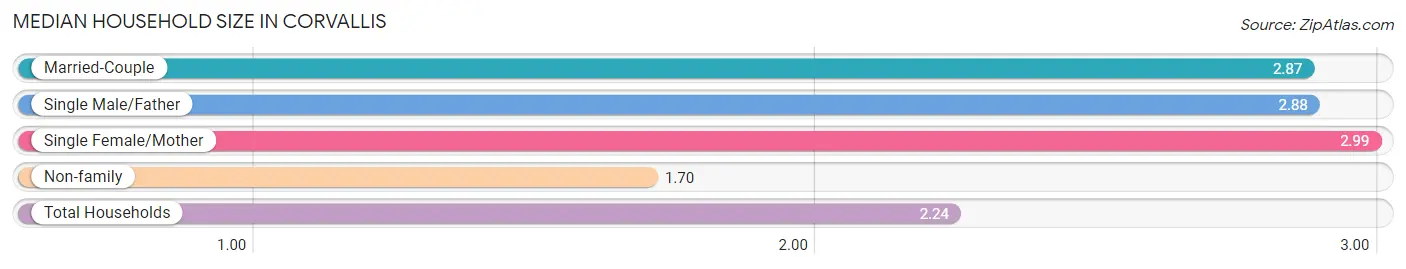
Median Household Size in Corvallis
The median household size in Corvallis is 2.24 persons per household, with single female/mother households (1,854 | 7.7%) accounting for the largest median household size of 2.99 persons per household. non-family households (13,252 | 54.9%) represent the smallest median household size with 1.70 persons per household.
| Household Type | # Households | Household Size |
| Married-Couple | 7,990 (33.1%) | 2.87 |
| Single Male/Father | 1,029 (4.3%) | 2.88 |
| Single Female/Mother | 1,854 (7.7%) | 2.99 |
| Non-family | 13,252 (54.9%) | 1.70 |
| Total Households | 24,125 (100.0%) | 2.24 |
Household Size by Marriage Status in Corvallis
Out of a total of 24,125 households in Corvallis, 10,873 (45.1%) are family households, while 13,252 (54.9%) are nonfamily households. The most numerous type of family households are 2-person households, comprising 5,301, and the most common type of nonfamily households are 1-person households, comprising 7,847.
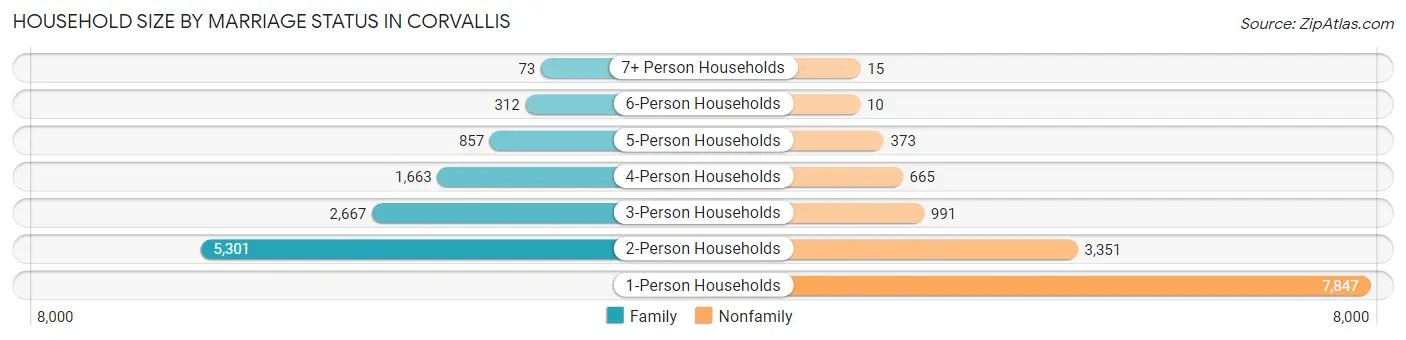
| Household Size | Family Households | Nonfamily Households |
| 1-Person Households | - | 7,847 (32.5%) |
| 2-Person Households | 5,301 (22.0%) | 3,351 (13.9%) |
| 3-Person Households | 2,667 (11.1%) | 991 (4.1%) |
| 4-Person Households | 1,663 (6.9%) | 665 (2.8%) |
| 5-Person Households | 857 (3.5%) | 373 (1.5%) |
| 6-Person Households | 312 (1.3%) | 10 (0.0%) |
| 7+ Person Households | 73 (0.3%) | 15 (0.1%) |
| Total | 10,873 (45.1%) | 13,252 (54.9%) |
Female Fertility in Corvallis
Fertility by Age in Corvallis
Average fertility rate in Corvallis is 20.0 births per 1,000 women. Women in the age bracket of 20 to 34 years have the highest fertility rate with 28.0 births per 1,000 women. Women in the age bracket of 20 to 34 years acount for 80.7% of all women with births.
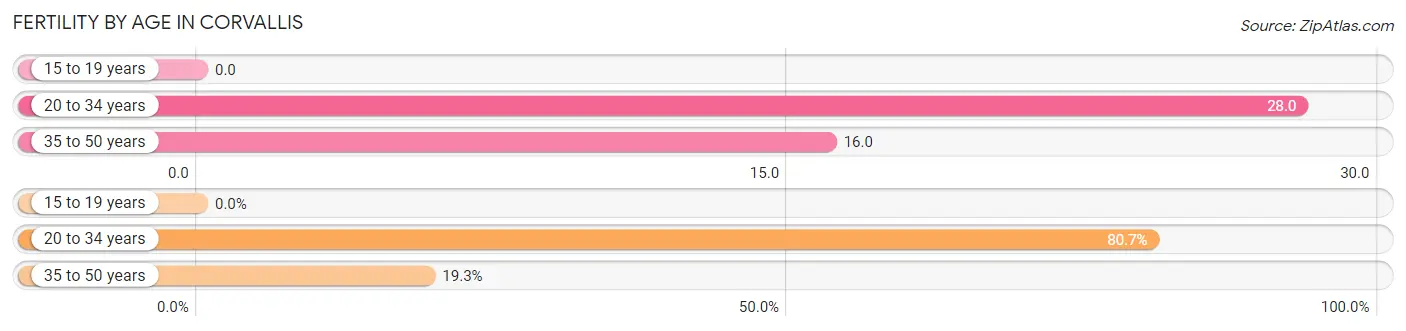
| Age Bracket | Women with Births | Births / 1,000 Women |
| 15 to 19 years | 0 (0.0%) | 0.0 |
| 20 to 34 years | 297 (80.7%) | 28.0 |
| 35 to 50 years | 71 (19.3%) | 16.0 |
| Total | 368 (100.0%) | 20.0 |
Fertility by Age by Marriage Status in Corvallis
71.2% of women with births (368) in Corvallis are married. The highest percentage of unmarried women with births falls into 20 to 34 years age bracket with 35.7% of them unmarried at the time of birth, while the lowest percentage of unmarried women with births belong to 35 to 50 years age bracket with 0.0% of them unmarried.
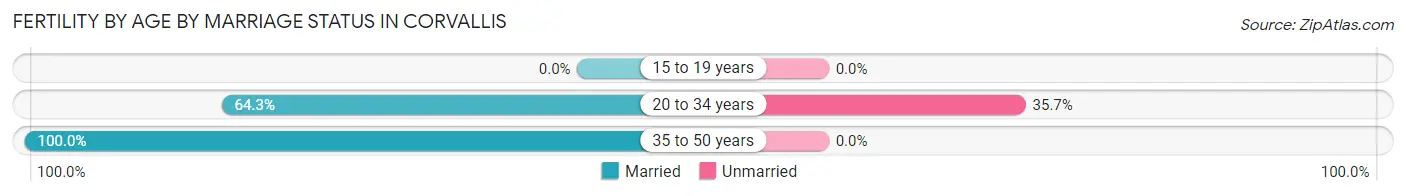
| Age Bracket | Married | Unmarried |
| 15 to 19 years | 0 (0.0%) | 0 (0.0%) |
| 20 to 34 years | 191 (64.3%) | 106 (35.7%) |
| 35 to 50 years | 71 (100.0%) | 0 (0.0%) |
| Total | 262 (71.2%) | 106 (28.8%) |
Fertility by Education in Corvallis
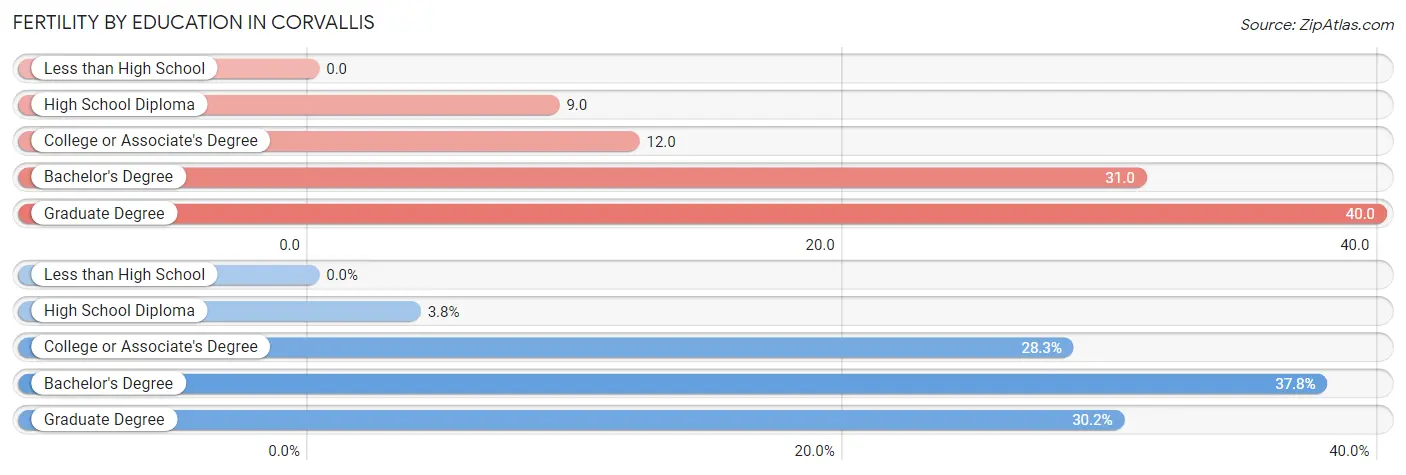
| Educational Attainment | Women with Births | Births / 1,000 Women |
| Less than High School | 0 (0.0%) | 0.0 |
| High School Diploma | 14 (3.8%) | 9.0 |
| College or Associate's Degree | 104 (28.3%) | 12.0 |
| Bachelor's Degree | 139 (37.8%) | 31.0 |
| Graduate Degree | 111 (30.2%) | 40.0 |
| Total | 368 (100.0%) | 20.0 |
Fertility by Education by Marriage Status in Corvallis
28.8% of women with births in Corvallis are unmarried. Women with the educational attainment of graduate degree are most likely to be married with 100.0% of them married at childbirth, while women with the educational attainment of high school diploma are least likely to be married with 100.0% of them unmarried at childbirth.
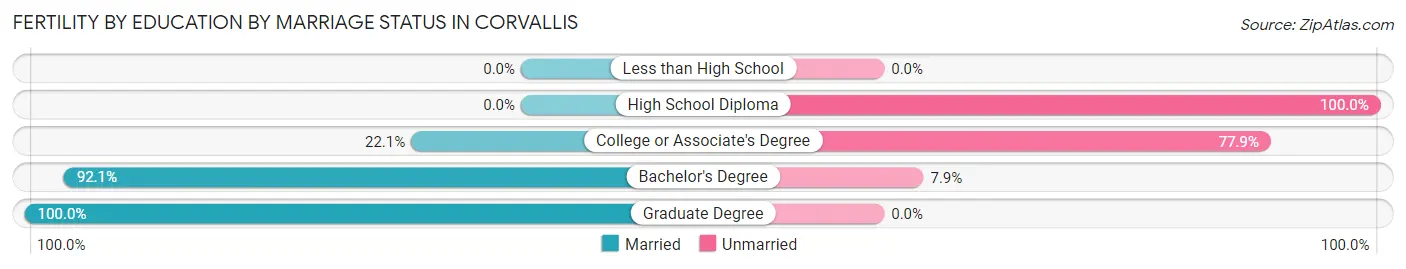
| Educational Attainment | Married | Unmarried |
| Less than High School | 0 (0.0%) | 0 (0.0%) |
| High School Diploma | 0 (0.0%) | 14 (100.0%) |
| College or Associate's Degree | 23 (22.1%) | 81 (77.9%) |
| Bachelor's Degree | 128 (92.1%) | 11 (7.9%) |
| Graduate Degree | 111 (100.0%) | 0 (0.0%) |
| Total | 262 (71.2%) | 106 (28.8%) |
Employment Characteristics in Corvallis
Employment by Class of Employer in Corvallis
Among the 29,330 employed individuals in Corvallis, private company employees (15,499 | 52.8%), state government employees (6,424 | 21.9%), and not-for-profit organizations (3,269 | 11.2%) make up the most common classes of employment.
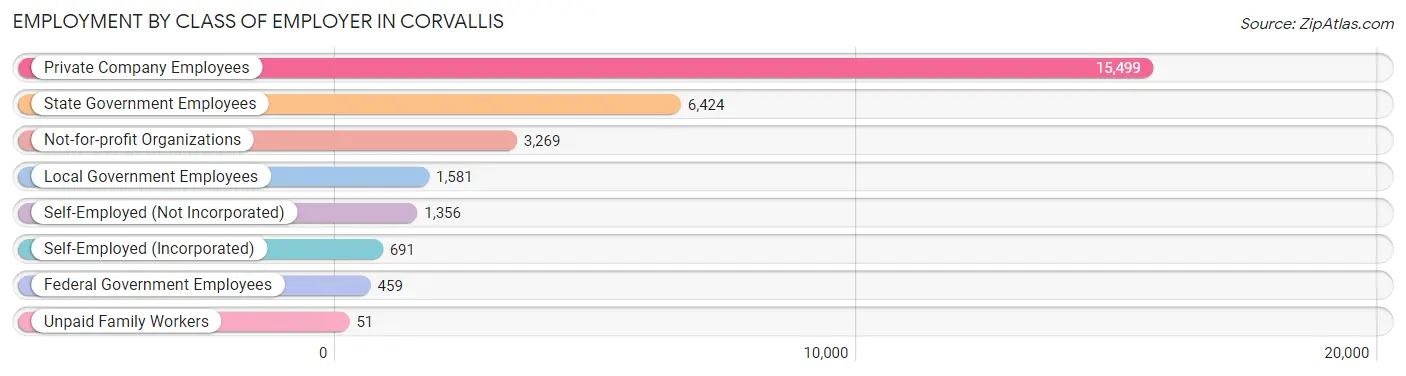
| Employer Class | # Employees | % Employees |
| Private Company Employees | 15,499 | 52.8% |
| Self-Employed (Incorporated) | 691 | 2.4% |
| Self-Employed (Not Incorporated) | 1,356 | 4.6% |
| Not-for-profit Organizations | 3,269 | 11.2% |
| Local Government Employees | 1,581 | 5.4% |
| State Government Employees | 6,424 | 21.9% |
| Federal Government Employees | 459 | 1.6% |
| Unpaid Family Workers | 51 | 0.2% |
| Total | 29,330 | 100.0% |
Employment Status by Age in Corvallis
According to the labor force statistics for Corvallis, out of the total population over 16 years of age (53,225), 60.7% or 32,308 individuals are in the labor force, with 8.0% or 2,585 of them unemployed. The age group with the highest labor force participation rate is 35 to 44 years, with 84.0% or 4,723 individuals in the labor force. Within the labor force, the 16 to 19 years age range has the highest percentage of unemployed individuals, with 28.3% or 687 of them being unemployed.
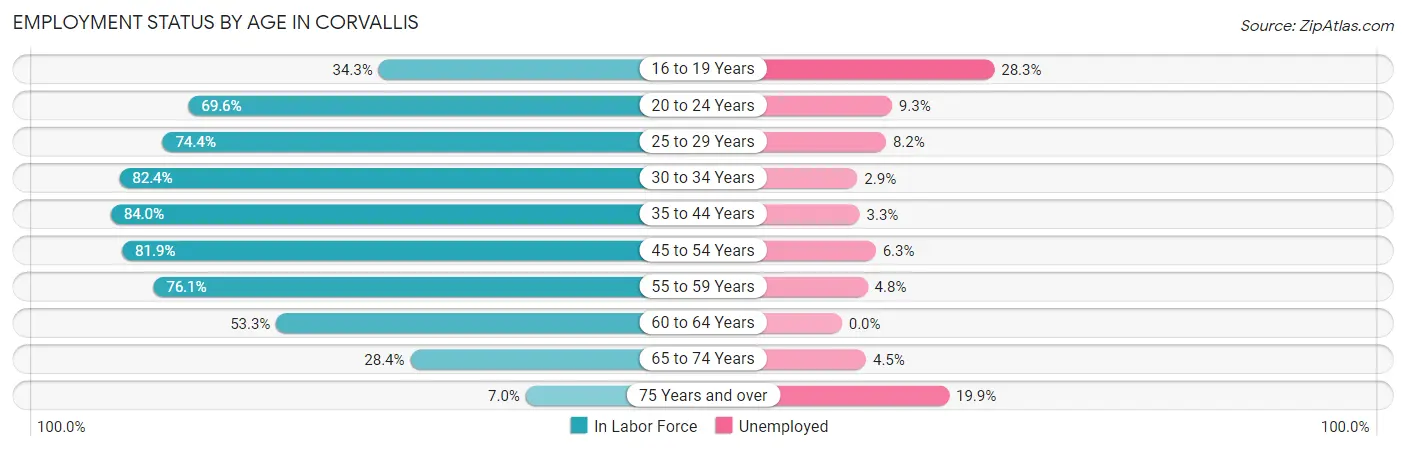
| Age Bracket | In Labor Force | Unemployed |
| 16 to 19 Years | 2,427 (34.3%) | 687 (28.3%) |
| 20 to 24 Years | 9,647 (69.6%) | 897 (9.3%) |
| 25 to 29 Years | 3,976 (74.4%) | 326 (8.2%) |
| 30 to 34 Years | 2,891 (82.4%) | 84 (2.9%) |
| 35 to 44 Years | 4,723 (84.0%) | 156 (3.3%) |
| 45 to 54 Years | 3,903 (81.9%) | 246 (6.3%) |
| 55 to 59 Years | 1,850 (76.1%) | 89 (4.8%) |
| 60 to 64 Years | 1,307 (53.3%) | 0 (0.0%) |
| 65 to 74 Years | 1,376 (28.4%) | 62 (4.5%) |
| 75 Years and over | 232 (7.0%) | 46 (19.9%) |
| Total | 32,308 (60.7%) | 2,585 (8.0%) |
Employment Status by Educational Attainment in Corvallis
According to labor force statistics for Corvallis, 77.3% of individuals (18,647) out of the total population between 25 and 64 years of age (24,123) are in the labor force, with 4.8% or 895 of them being unemployed. The group with the highest labor force participation rate are those with the educational attainment of bachelor's degree or higher, with 81.3% or 11,724 individuals in the labor force. Within the labor force, individuals with high school diploma education have the highest percentage of unemployment, with 9.0% or 151 of them being unemployed.
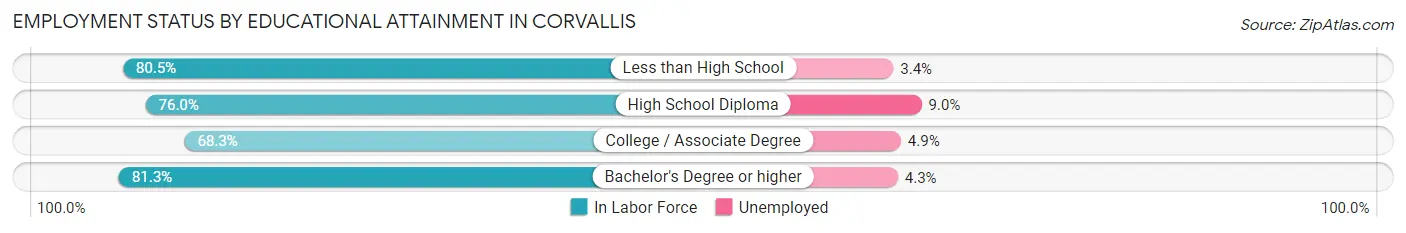
| Educational Attainment | In Labor Force | Unemployed |
| Less than High School | 833 (80.5%) | 35 (3.4%) |
| High School Diploma | 1,680 (76.0%) | 199 (9.0%) |
| College / Associate Degree | 4,410 (68.3%) | 316 (4.9%) |
| Bachelor's Degree or higher | 11,724 (81.3%) | 620 (4.3%) |
| Total | 18,647 (77.3%) | 1,158 (4.8%) |
Employment Occupations by Sex in Corvallis
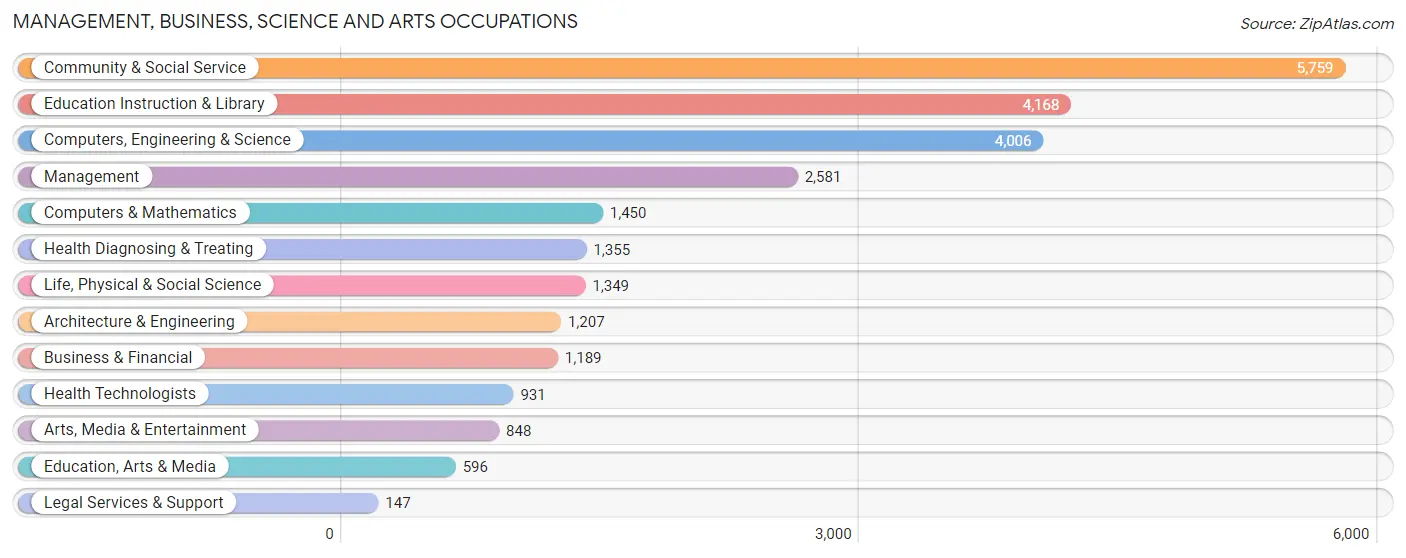
Management, Business, Science and Arts Occupations
The most common Management, Business, Science and Arts occupations in Corvallis are Community & Social Service (5,759 | 19.4%), Education Instruction & Library (4,168 | 14.0%), Computers, Engineering & Science (4,006 | 13.5%), Management (2,581 | 8.7%), and Computers & Mathematics (1,450 | 4.9%).
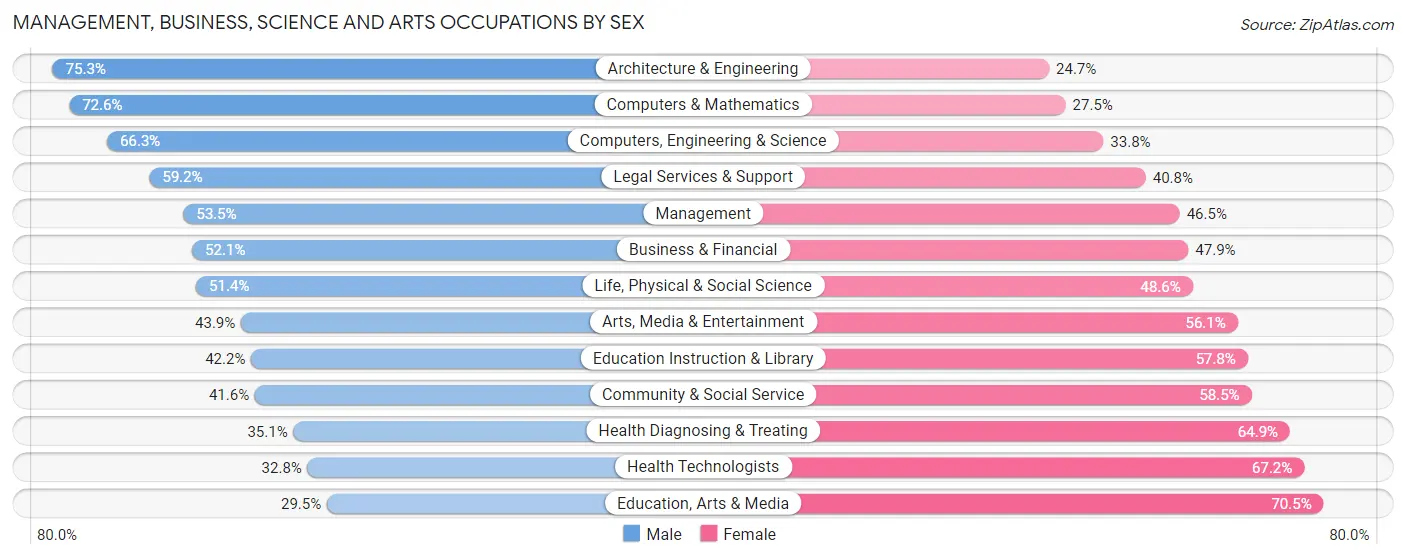
Management, Business, Science and Arts Occupations by Sex
Within the Management, Business, Science and Arts occupations in Corvallis, the most male-oriented occupations are Architecture & Engineering (75.3%), Computers & Mathematics (72.6%), and Computers, Engineering & Science (66.2%), while the most female-oriented occupations are Education, Arts & Media (70.5%), Health Technologists (67.2%), and Health Diagnosing & Treating (64.9%).
| Occupation | Male | Female |
| Management | 1,381 (53.5%) | 1,200 (46.5%) |
| Business & Financial | 619 (52.1%) | 570 (47.9%) |
| Computers, Engineering & Science | 2,654 (66.2%) | 1,352 (33.8%) |
| Computers & Mathematics | 1,052 (72.6%) | 398 (27.5%) |
| Architecture & Engineering | 909 (75.3%) | 298 (24.7%) |
| Life, Physical & Social Science | 693 (51.4%) | 656 (48.6%) |
| Community & Social Service | 2,393 (41.5%) | 3,366 (58.5%) |
| Education, Arts & Media | 176 (29.5%) | 420 (70.5%) |
| Legal Services & Support | 87 (59.2%) | 60 (40.8%) |
| Education Instruction & Library | 1,758 (42.2%) | 2,410 (57.8%) |
| Arts, Media & Entertainment | 372 (43.9%) | 476 (56.1%) |
| Health Diagnosing & Treating | 476 (35.1%) | 879 (64.9%) |
| Health Technologists | 305 (32.8%) | 626 (67.2%) |
| Total (Category) | 7,523 (50.5%) | 7,367 (49.5%) |
| Total (Overall) | 15,507 (52.2%) | 14,213 (47.8%) |
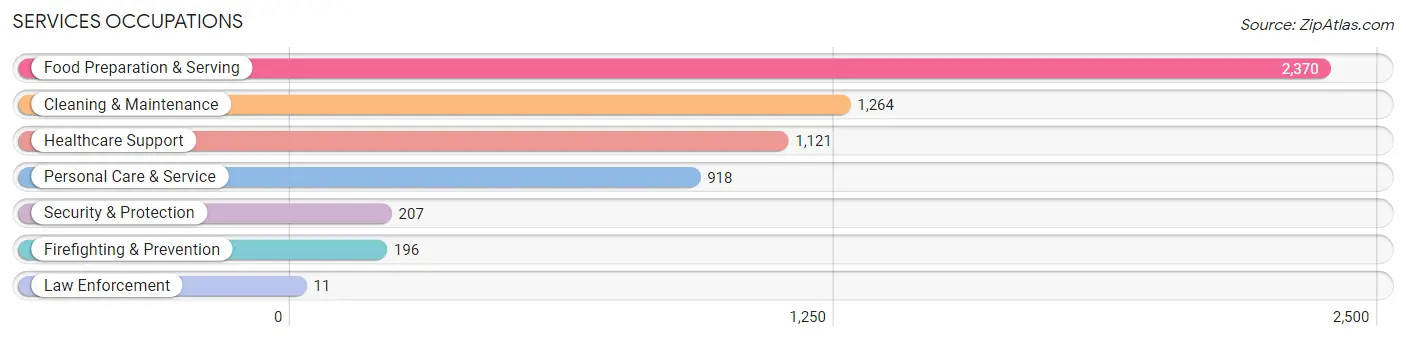
Services Occupations
The most common Services occupations in Corvallis are Food Preparation & Serving (2,370 | 8.0%), Cleaning & Maintenance (1,264 | 4.3%), Healthcare Support (1,121 | 3.8%), Personal Care & Service (918 | 3.1%), and Security & Protection (207 | 0.7%).
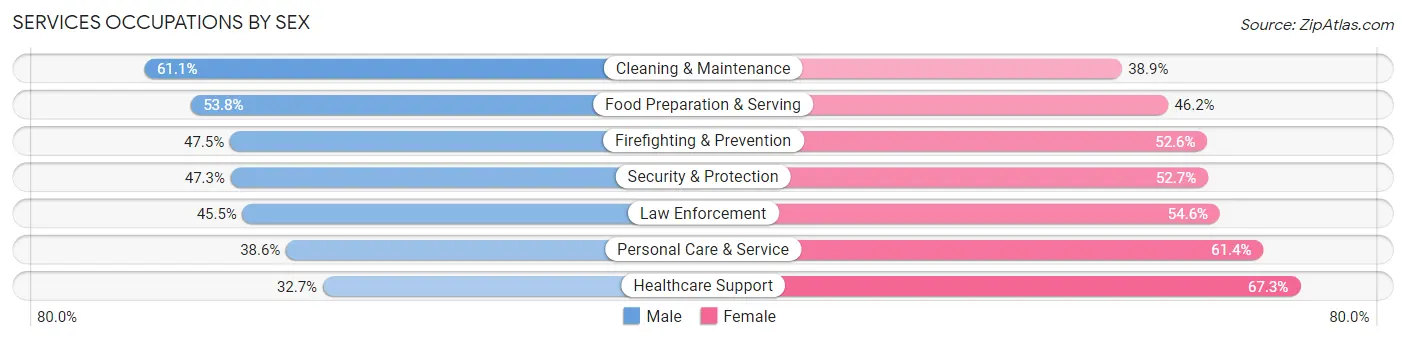
Services Occupations by Sex
Within the Services occupations in Corvallis, the most male-oriented occupations are Cleaning & Maintenance (61.1%), Food Preparation & Serving (53.8%), and Firefighting & Prevention (47.4%), while the most female-oriented occupations are Healthcare Support (67.3%), Personal Care & Service (61.4%), and Law Enforcement (54.5%).
| Occupation | Male | Female |
| Healthcare Support | 367 (32.7%) | 754 (67.3%) |
| Security & Protection | 98 (47.3%) | 109 (52.7%) |
| Firefighting & Prevention | 93 (47.4%) | 103 (52.5%) |
| Law Enforcement | 5 (45.5%) | 6 (54.5%) |
| Food Preparation & Serving | 1,274 (53.8%) | 1,096 (46.2%) |
| Cleaning & Maintenance | 772 (61.1%) | 492 (38.9%) |
| Personal Care & Service | 354 (38.6%) | 564 (61.4%) |
| Total (Category) | 2,865 (48.7%) | 3,015 (51.3%) |
| Total (Overall) | 15,507 (52.2%) | 14,213 (47.8%) |
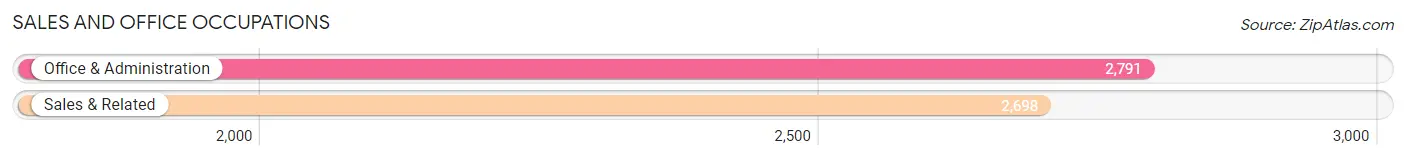
Sales and Office Occupations
The most common Sales and Office occupations in Corvallis are Office & Administration (2,791 | 9.4%), and Sales & Related (2,698 | 9.1%).
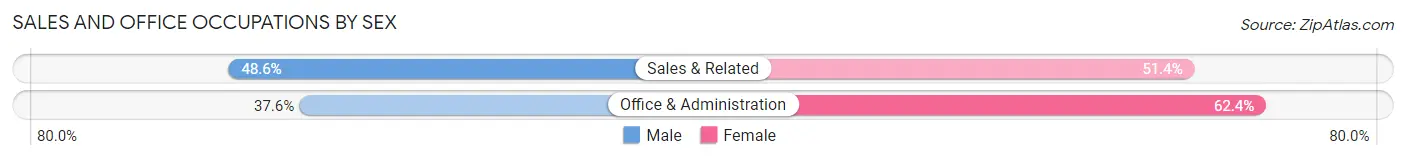
Sales and Office Occupations by Sex
| Occupation | Male | Female |
| Sales & Related | 1,312 (48.6%) | 1,386 (51.4%) |
| Office & Administration | 1,050 (37.6%) | 1,741 (62.4%) |
| Total (Category) | 2,362 (43.0%) | 3,127 (57.0%) |
| Total (Overall) | 15,507 (52.2%) | 14,213 (47.8%) |
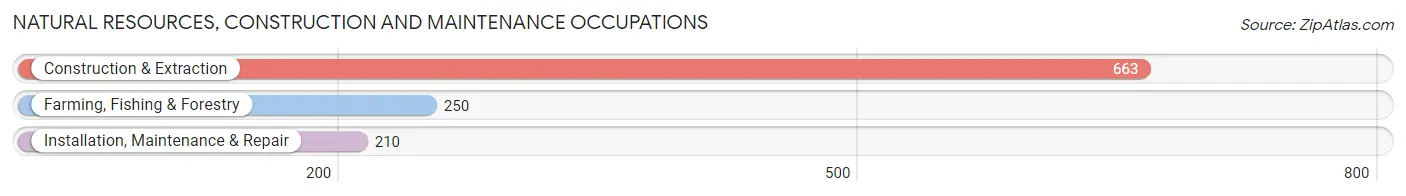
Natural Resources, Construction and Maintenance Occupations
The most common Natural Resources, Construction and Maintenance occupations in Corvallis are Construction & Extraction (663 | 2.2%), Farming, Fishing & Forestry (250 | 0.8%), and Installation, Maintenance & Repair (210 | 0.7%).
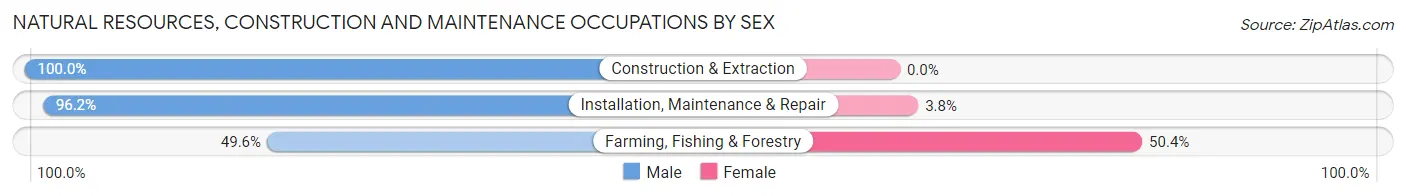
Natural Resources, Construction and Maintenance Occupations by Sex
| Occupation | Male | Female |
| Farming, Fishing & Forestry | 124 (49.6%) | 126 (50.4%) |
| Construction & Extraction | 663 (100.0%) | 0 (0.0%) |
| Installation, Maintenance & Repair | 202 (96.2%) | 8 (3.8%) |
| Total (Category) | 989 (88.1%) | 134 (11.9%) |
| Total (Overall) | 15,507 (52.2%) | 14,213 (47.8%) |
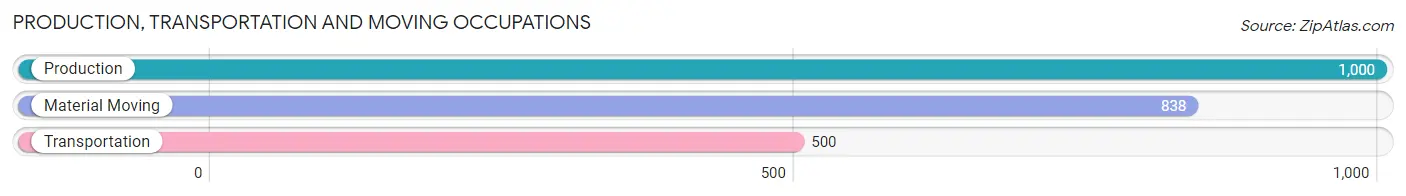
Production, Transportation and Moving Occupations
The most common Production, Transportation and Moving occupations in Corvallis are Production (1,000 | 3.4%), Material Moving (838 | 2.8%), and Transportation (500 | 1.7%).
Production, Transportation and Moving Occupations by Sex
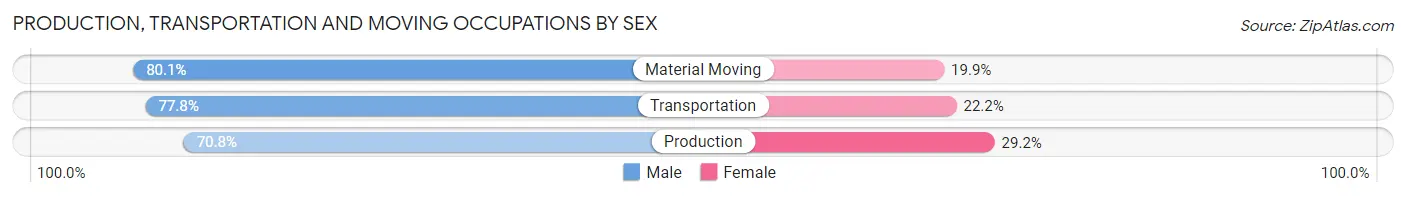
| Occupation | Male | Female |
| Production | 708 (70.8%) | 292 (29.2%) |
| Transportation | 389 (77.8%) | 111 (22.2%) |
| Material Moving | 671 (80.1%) | 167 (19.9%) |
| Total (Category) | 1,768 (75.6%) | 570 (24.4%) |
| Total (Overall) | 15,507 (52.2%) | 14,213 (47.8%) |
Employment Industries by Sex in Corvallis
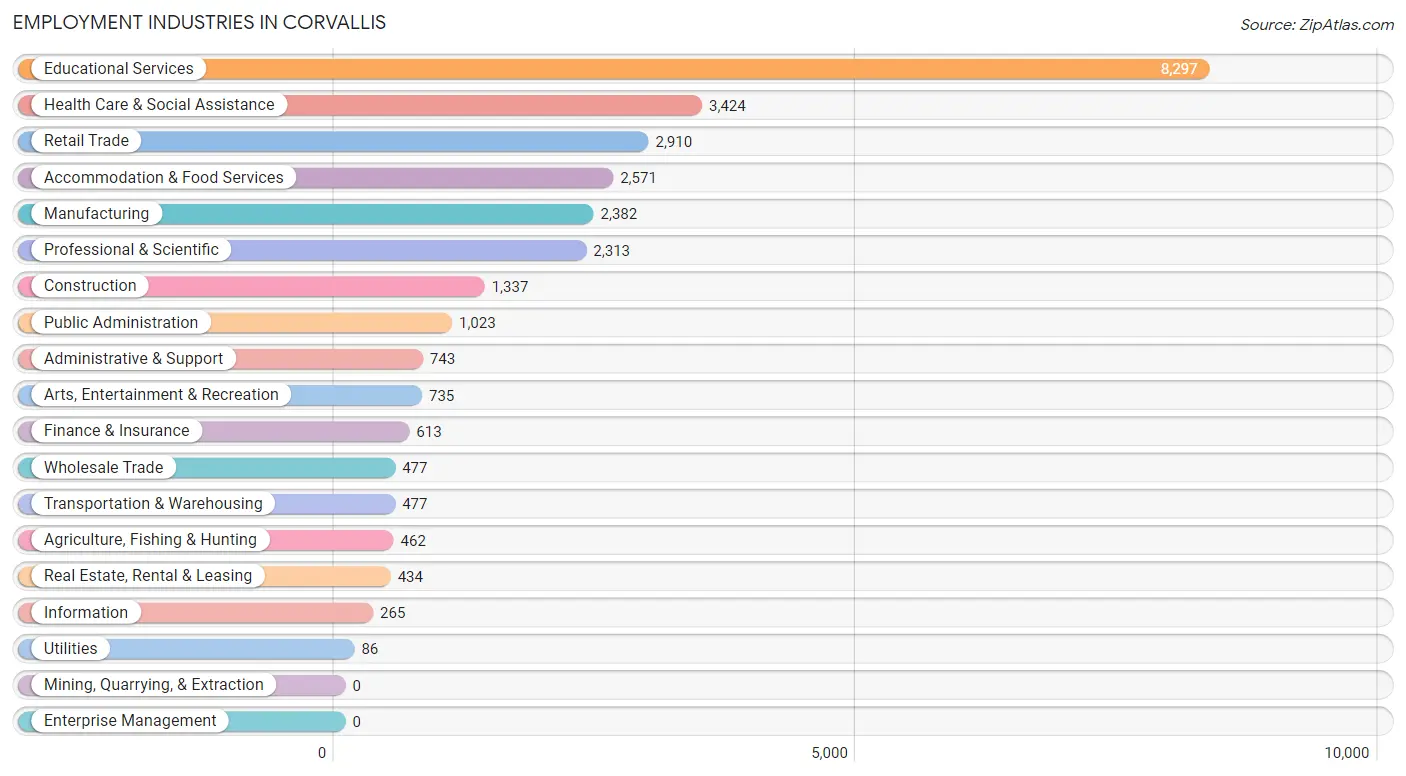
Employment Industries in Corvallis
The major employment industries in Corvallis include Educational Services (8,297 | 27.9%), Health Care & Social Assistance (3,424 | 11.5%), Retail Trade (2,910 | 9.8%), Accommodation & Food Services (2,571 | 8.6%), and Manufacturing (2,382 | 8.0%).
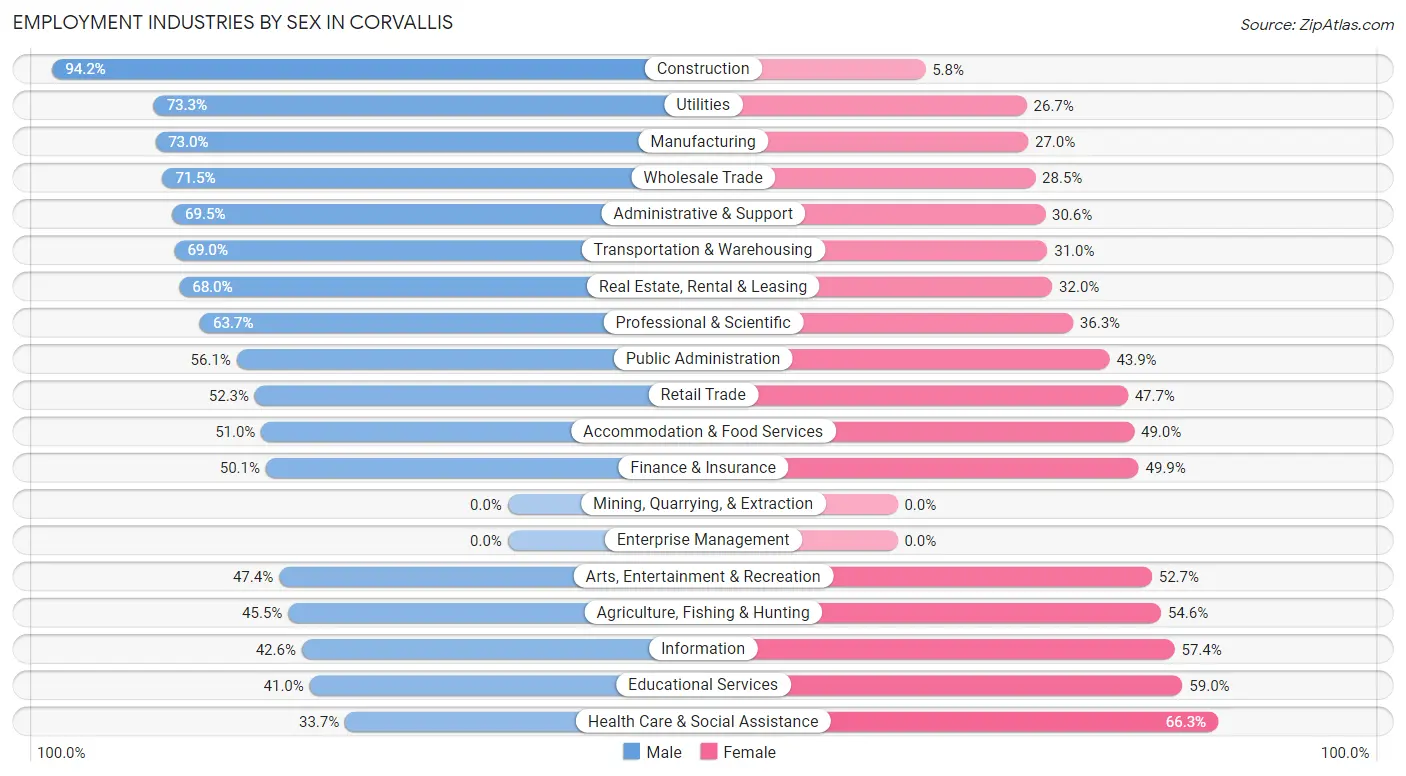
Employment Industries by Sex in Corvallis
The Corvallis industries that see more men than women are Construction (94.2%), Utilities (73.3%), and Manufacturing (73.0%), whereas the industries that tend to have a higher number of women are Health Care & Social Assistance (66.3%), Educational Services (59.0%), and Information (57.4%).
| Industry | Male | Female |
| Agriculture, Fishing & Hunting | 210 (45.5%) | 252 (54.5%) |
| Mining, Quarrying, & Extraction | 0 (0.0%) | 0 (0.0%) |
| Construction | 1,260 (94.2%) | 77 (5.8%) |
| Manufacturing | 1,738 (73.0%) | 644 (27.0%) |
| Wholesale Trade | 341 (71.5%) | 136 (28.5%) |
| Retail Trade | 1,523 (52.3%) | 1,387 (47.7%) |
| Transportation & Warehousing | 329 (69.0%) | 148 (31.0%) |
| Utilities | 63 (73.3%) | 23 (26.7%) |
| Information | 113 (42.6%) | 152 (57.4%) |
| Finance & Insurance | 307 (50.1%) | 306 (49.9%) |
| Real Estate, Rental & Leasing | 295 (68.0%) | 139 (32.0%) |
| Professional & Scientific | 1,473 (63.7%) | 840 (36.3%) |
| Enterprise Management | 0 (0.0%) | 0 (0.0%) |
| Administrative & Support | 516 (69.5%) | 227 (30.5%) |
| Educational Services | 3,403 (41.0%) | 4,894 (59.0%) |
| Health Care & Social Assistance | 1,153 (33.7%) | 2,271 (66.3%) |
| Arts, Entertainment & Recreation | 348 (47.3%) | 387 (52.6%) |
| Accommodation & Food Services | 1,312 (51.0%) | 1,259 (49.0%) |
| Public Administration | 574 (56.1%) | 449 (43.9%) |
| Total | 15,507 (52.2%) | 14,213 (47.8%) |
Education in Corvallis
School Enrollment in Corvallis
The most common levels of schooling among the 26,099 students in Corvallis are college / undergraduate (16,623 | 63.7%), graduate / professional (3,274 | 12.5%), and middle school (1,843 | 7.1%).
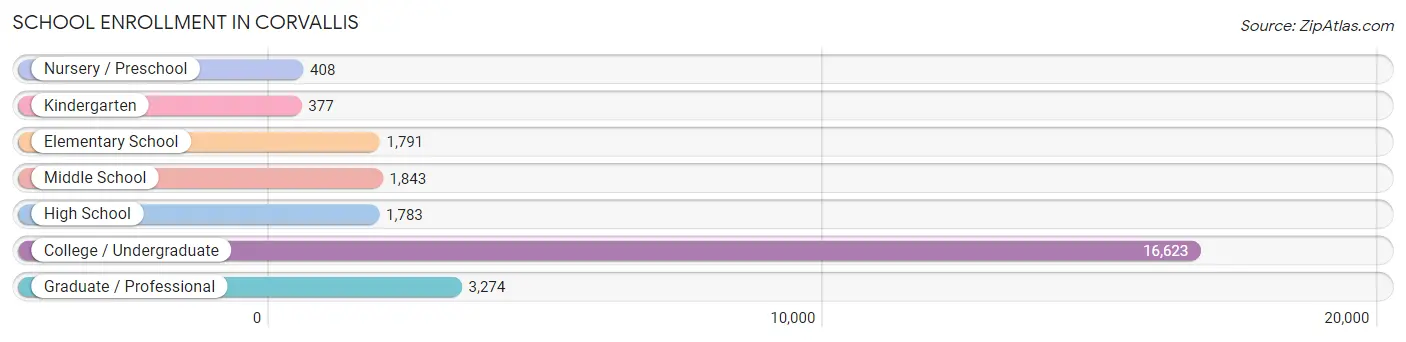
| School Level | # Students | % Students |
| Nursery / Preschool | 408 | 1.6% |
| Kindergarten | 377 | 1.4% |
| Elementary School | 1,791 | 6.9% |
| Middle School | 1,843 | 7.1% |
| High School | 1,783 | 6.8% |
| College / Undergraduate | 16,623 | 63.7% |
| Graduate / Professional | 3,274 | 12.5% |
| Total | 26,099 | 100.0% |
School Enrollment by Age by Funding Source in Corvallis
Out of a total of 26,099 students who are enrolled in schools in Corvallis, 1,775 (6.8%) attend a private institution, while the remaining 24,324 (93.2%) are enrolled in public schools. The age group of 3 to 4 year olds has the highest likelihood of being enrolled in private schools, with 193 (70.7% in the age bracket) enrolled. Conversely, the age group of 25 to 34 year olds has the lowest likelihood of being enrolled in a private school, with 3,096 (97.3% in the age bracket) attending a public institution.
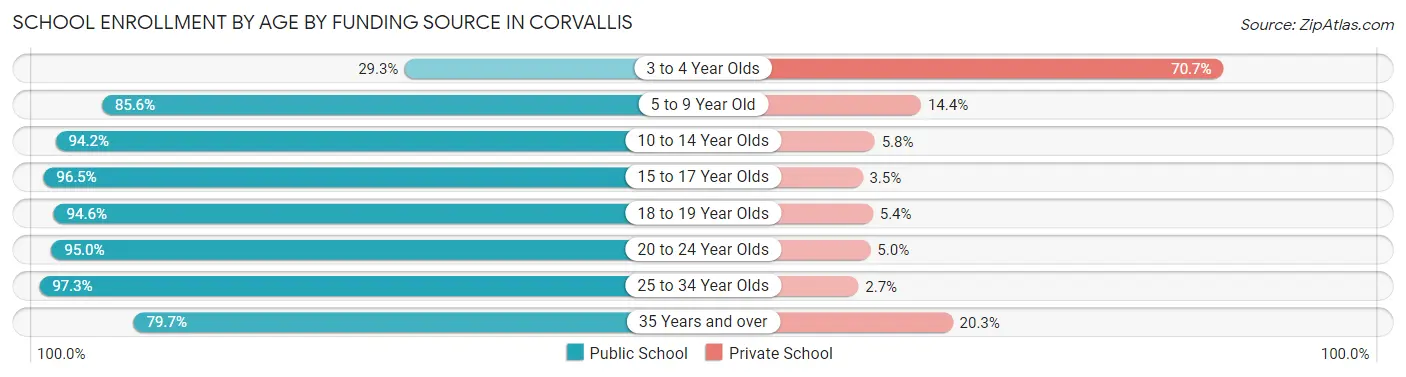
| Age Bracket | Public School | Private School |
| 3 to 4 Year Olds | 80 (29.3%) | 193 (70.7%) |
| 5 to 9 Year Old | 1,753 (85.6%) | 295 (14.4%) |
| 10 to 14 Year Olds | 2,179 (94.2%) | 134 (5.8%) |
| 15 to 17 Year Olds | 1,269 (96.5%) | 46 (3.5%) |
| 18 to 19 Year Olds | 5,479 (94.6%) | 314 (5.4%) |
| 20 to 24 Year Olds | 9,760 (95.0%) | 512 (5.0%) |
| 25 to 34 Year Olds | 3,096 (97.3%) | 87 (2.7%) |
| 35 Years and over | 719 (79.7%) | 183 (20.3%) |
| Total | 24,324 (93.2%) | 1,775 (6.8%) |
Educational Attainment by Field of Study in Corvallis
Bio, nature & agricultural (3,635 | 16.8%), engineering (2,327 | 10.7%), social sciences (1,752 | 8.1%), physical & health sciences (1,600 | 7.4%), and business (1,535 | 7.1%) are the most common fields of study among 21,688 individuals in Corvallis who have obtained a bachelor's degree or higher.
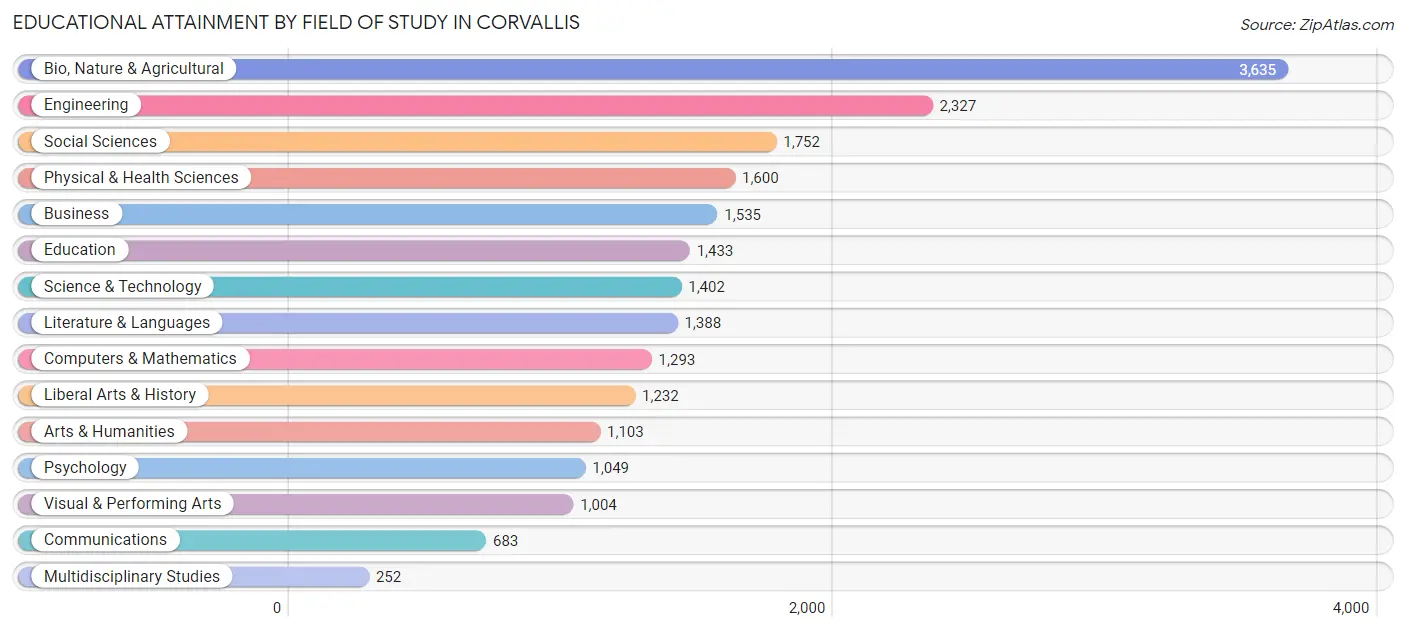
| Field of Study | # Graduates | % Graduates |
| Computers & Mathematics | 1,293 | 6.0% |
| Bio, Nature & Agricultural | 3,635 | 16.8% |
| Physical & Health Sciences | 1,600 | 7.4% |
| Psychology | 1,049 | 4.8% |
| Social Sciences | 1,752 | 8.1% |
| Engineering | 2,327 | 10.7% |
| Multidisciplinary Studies | 252 | 1.2% |
| Science & Technology | 1,402 | 6.5% |
| Business | 1,535 | 7.1% |
| Education | 1,433 | 6.6% |
| Literature & Languages | 1,388 | 6.4% |
| Liberal Arts & History | 1,232 | 5.7% |
| Visual & Performing Arts | 1,004 | 4.6% |
| Communications | 683 | 3.2% |
| Arts & Humanities | 1,103 | 5.1% |
| Total | 21,688 | 100.0% |
Transportation & Commute in Corvallis
Vehicle Availability by Sex in Corvallis
The most prevalent vehicle ownership categories in Corvallis are males with 2 vehicles (6,336, accounting for 42.5%) and females with 2 vehicles (4,843, making up 48.3%).
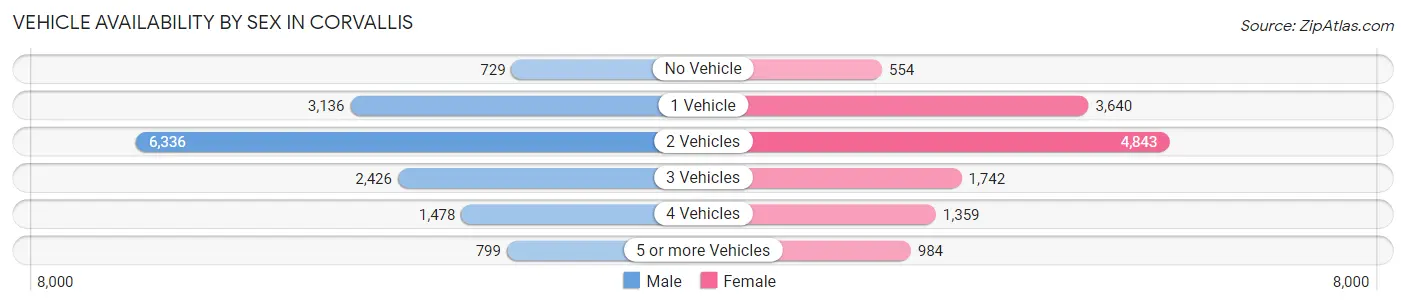
| Vehicles Available | Male | Female |
| No Vehicle | 729 (4.9%) | 554 (4.2%) |
| 1 Vehicle | 3,136 (21.0%) | 3,640 (27.7%) |
| 2 Vehicles | 6,336 (42.5%) | 4,843 (36.9%) |
| 3 Vehicles | 2,426 (16.3%) | 1,742 (13.3%) |
| 4 Vehicles | 1,478 (9.9%) | 1,359 (10.4%) |
| 5 or more Vehicles | 799 (5.4%) | 984 (7.5%) |
| Total | 14,904 (100.0%) | 13,122 (100.0%) |
Commute Time in Corvallis
The most frequently occuring commute durations in Corvallis are 10 to 14 minutes (7,201 commuters, 28.2%), 5 to 9 minutes (4,997 commuters, 19.6%), and 15 to 19 minutes (4,618 commuters, 18.1%).
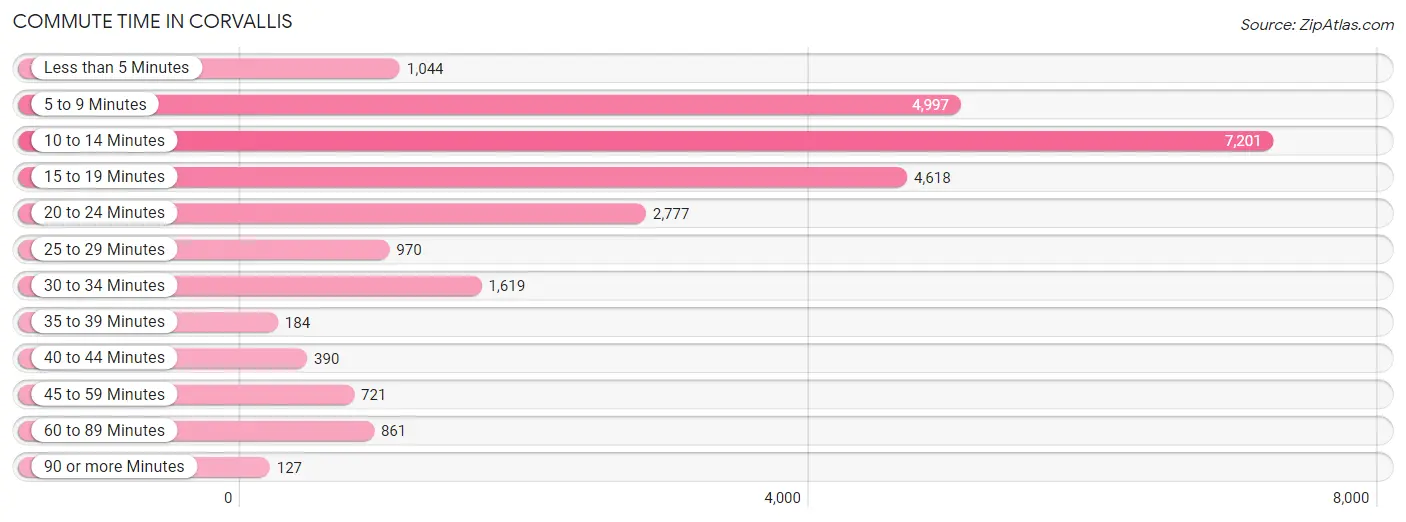
| Commute Time | # Commuters | % Commuters |
| Less than 5 Minutes | 1,044 | 4.1% |
| 5 to 9 Minutes | 4,997 | 19.6% |
| 10 to 14 Minutes | 7,201 | 28.2% |
| 15 to 19 Minutes | 4,618 | 18.1% |
| 20 to 24 Minutes | 2,777 | 10.9% |
| 25 to 29 Minutes | 970 | 3.8% |
| 30 to 34 Minutes | 1,619 | 6.4% |
| 35 to 39 Minutes | 184 | 0.7% |
| 40 to 44 Minutes | 390 | 1.5% |
| 45 to 59 Minutes | 721 | 2.8% |
| 60 to 89 Minutes | 861 | 3.4% |
| 90 or more Minutes | 127 | 0.5% |
Commute Time by Sex in Corvallis
The most common commute times in Corvallis are 10 to 14 minutes (3,634 commuters, 27.5%) for males and 10 to 14 minutes (3,567 commuters, 29.0%) for females.
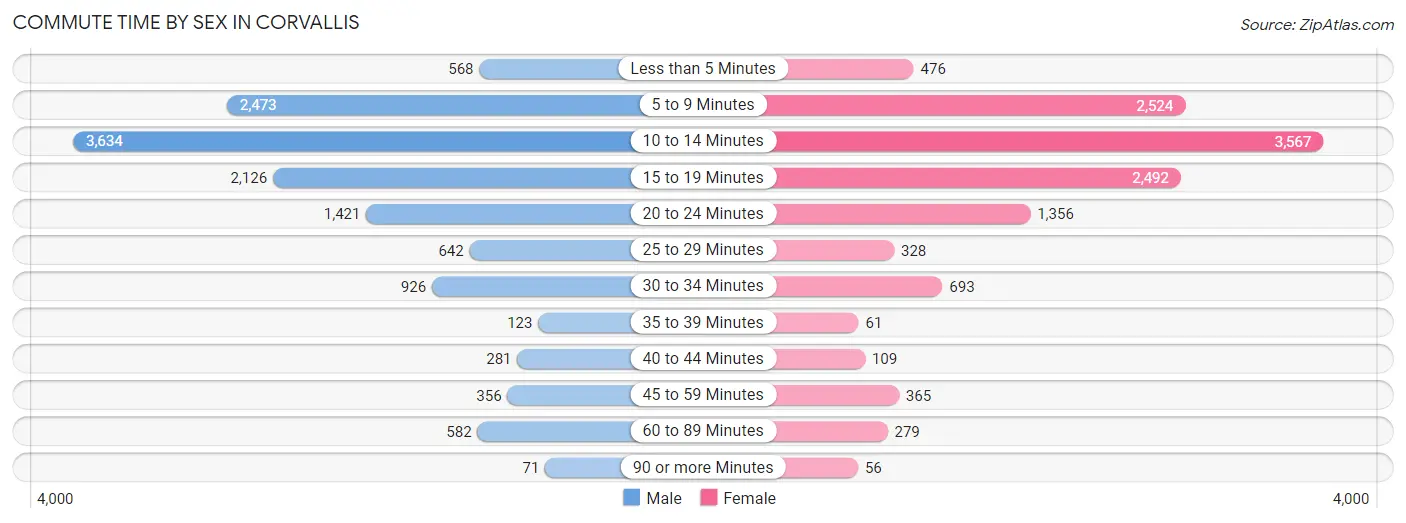
| Commute Time | Male | Female |
| Less than 5 Minutes | 568 (4.3%) | 476 (3.9%) |
| 5 to 9 Minutes | 2,473 (18.7%) | 2,524 (20.5%) |
| 10 to 14 Minutes | 3,634 (27.5%) | 3,567 (29.0%) |
| 15 to 19 Minutes | 2,126 (16.1%) | 2,492 (20.3%) |
| 20 to 24 Minutes | 1,421 (10.8%) | 1,356 (11.0%) |
| 25 to 29 Minutes | 642 (4.9%) | 328 (2.7%) |
| 30 to 34 Minutes | 926 (7.0%) | 693 (5.6%) |
| 35 to 39 Minutes | 123 (0.9%) | 61 (0.5%) |
| 40 to 44 Minutes | 281 (2.1%) | 109 (0.9%) |
| 45 to 59 Minutes | 356 (2.7%) | 365 (3.0%) |
| 60 to 89 Minutes | 582 (4.4%) | 279 (2.3%) |
| 90 or more Minutes | 71 (0.5%) | 56 (0.5%) |
Time of Departure to Work by Sex in Corvallis
The most frequent times of departure to work in Corvallis are 8:00 AM to 8:29 AM (1,889, 14.3%) for males and 8:00 AM to 8:29 AM (1,909, 15.5%) for females.
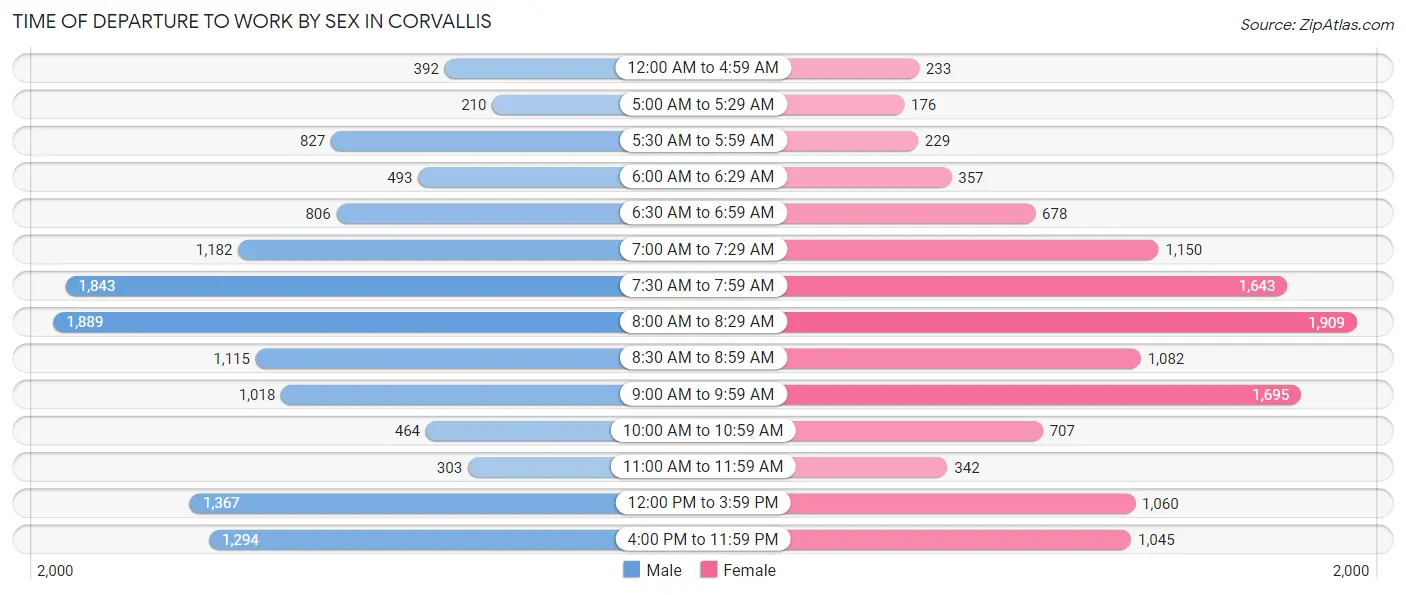
| Time of Departure | Male | Female |
| 12:00 AM to 4:59 AM | 392 (3.0%) | 233 (1.9%) |
| 5:00 AM to 5:29 AM | 210 (1.6%) | 176 (1.4%) |
| 5:30 AM to 5:59 AM | 827 (6.3%) | 229 (1.9%) |
| 6:00 AM to 6:29 AM | 493 (3.7%) | 357 (2.9%) |
| 6:30 AM to 6:59 AM | 806 (6.1%) | 678 (5.5%) |
| 7:00 AM to 7:29 AM | 1,182 (8.9%) | 1,150 (9.3%) |
| 7:30 AM to 7:59 AM | 1,843 (14.0%) | 1,643 (13.4%) |
| 8:00 AM to 8:29 AM | 1,889 (14.3%) | 1,909 (15.5%) |
| 8:30 AM to 8:59 AM | 1,115 (8.5%) | 1,082 (8.8%) |
| 9:00 AM to 9:59 AM | 1,018 (7.7%) | 1,695 (13.8%) |
| 10:00 AM to 10:59 AM | 464 (3.5%) | 707 (5.8%) |
| 11:00 AM to 11:59 AM | 303 (2.3%) | 342 (2.8%) |
| 12:00 PM to 3:59 PM | 1,367 (10.3%) | 1,060 (8.6%) |
| 4:00 PM to 11:59 PM | 1,294 (9.8%) | 1,045 (8.5%) |
| Total | 13,203 (100.0%) | 12,306 (100.0%) |
Housing Occupancy in Corvallis
Occupancy by Ownership in Corvallis
Of the total 24,125 dwellings in Corvallis, owner-occupied units account for 9,903 (41.0%), while renter-occupied units make up 14,222 (59.0%).
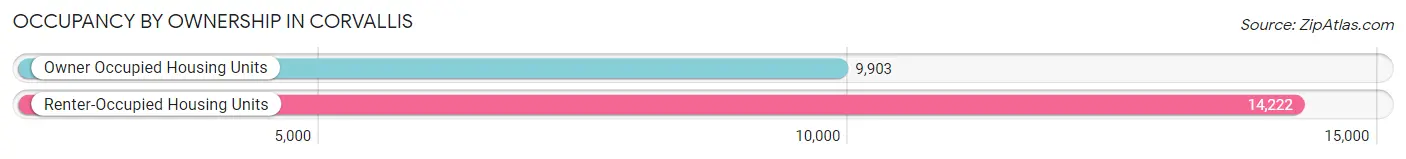
| Occupancy | # Housing Units | % Housing Units |
| Owner Occupied Housing Units | 9,903 | 41.0% |
| Renter-Occupied Housing Units | 14,222 | 59.0% |
| Total Occupied Housing Units | 24,125 | 100.0% |
Occupancy by Household Size in Corvallis
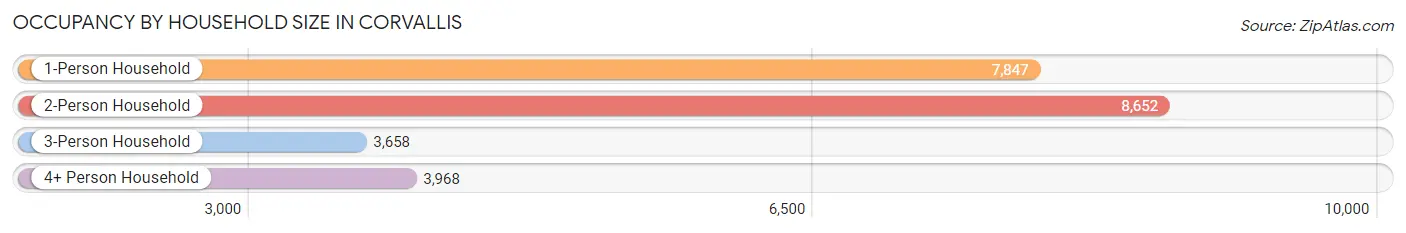
| Household Size | # Housing Units | % Housing Units |
| 1-Person Household | 7,847 | 32.5% |
| 2-Person Household | 8,652 | 35.9% |
| 3-Person Household | 3,658 | 15.2% |
| 4+ Person Household | 3,968 | 16.5% |
| Total Housing Units | 24,125 | 100.0% |
Occupancy by Ownership by Household Size in Corvallis
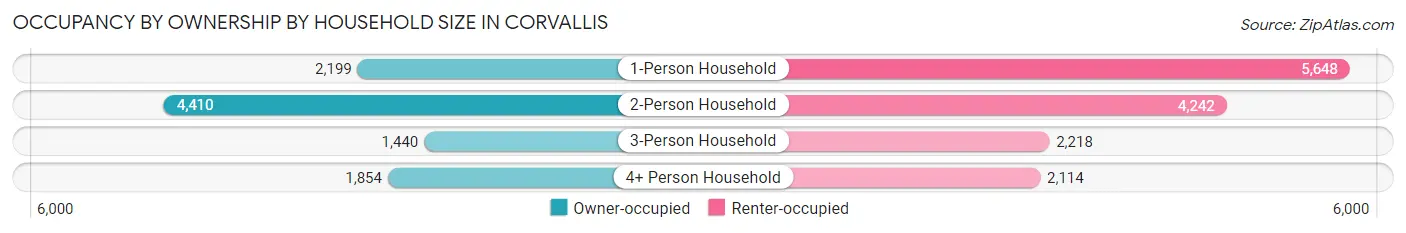
| Household Size | Owner-occupied | Renter-occupied |
| 1-Person Household | 2,199 (28.0%) | 5,648 (72.0%) |
| 2-Person Household | 4,410 (51.0%) | 4,242 (49.0%) |
| 3-Person Household | 1,440 (39.4%) | 2,218 (60.6%) |
| 4+ Person Household | 1,854 (46.7%) | 2,114 (53.3%) |
| Total Housing Units | 9,903 (41.0%) | 14,222 (59.0%) |
Occupancy by Educational Attainment in Corvallis
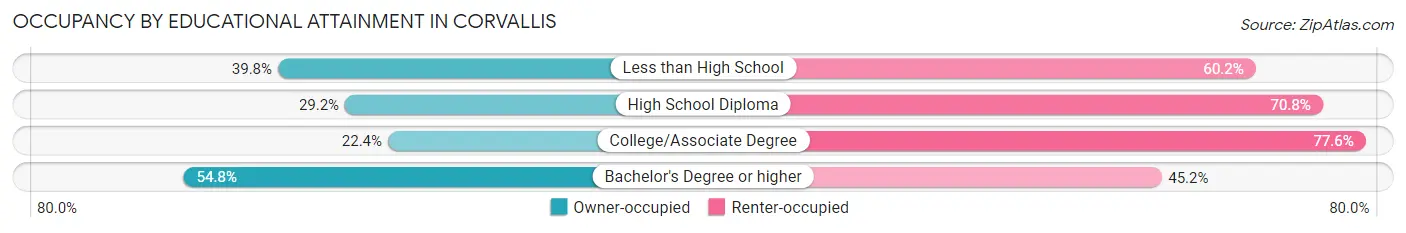
| Household Size | Owner-occupied | Renter-occupied |
| Less than High School | 274 (39.8%) | 414 (60.2%) |
| High School Diploma | 556 (29.2%) | 1,349 (70.8%) |
| College/Associate Degree | 1,881 (22.4%) | 6,522 (77.6%) |
| Bachelor's Degree or higher | 7,192 (54.8%) | 5,937 (45.2%) |
Occupancy by Age of Householder in Corvallis
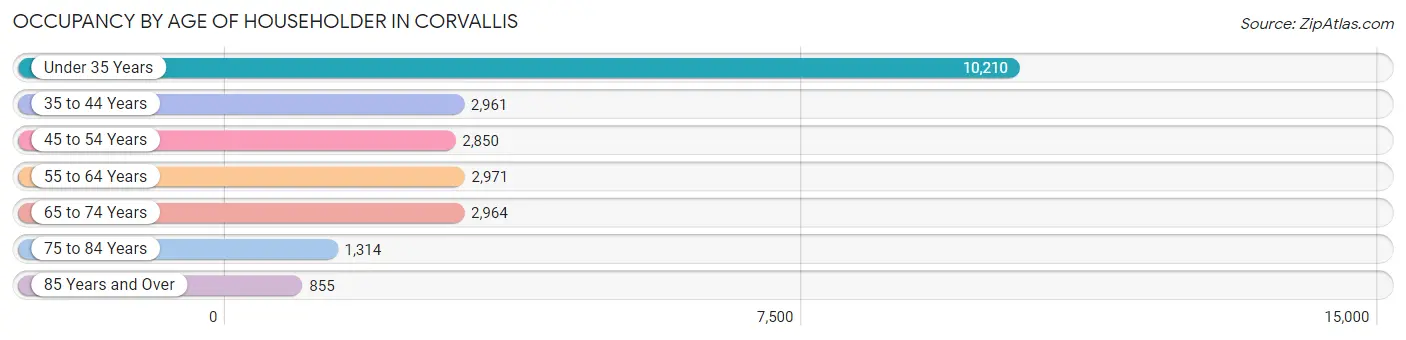
| Age Bracket | # Households | % Households |
| Under 35 Years | 10,210 | 42.3% |
| 35 to 44 Years | 2,961 | 12.3% |
| 45 to 54 Years | 2,850 | 11.8% |
| 55 to 64 Years | 2,971 | 12.3% |
| 65 to 74 Years | 2,964 | 12.3% |
| 75 to 84 Years | 1,314 | 5.4% |
| 85 Years and Over | 855 | 3.5% |
| Total | 24,125 | 100.0% |
Housing Finances in Corvallis
Median Income by Occupancy in Corvallis
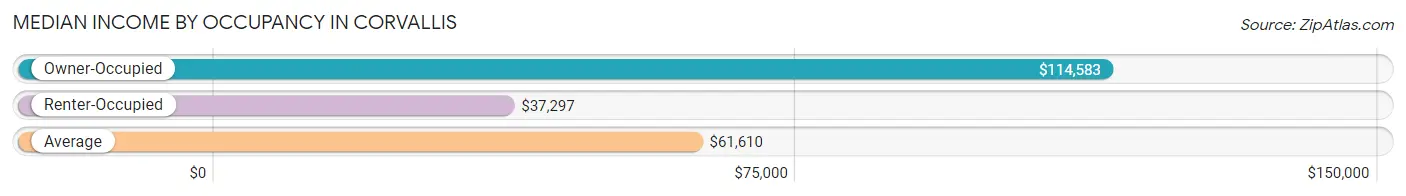
| Occupancy Type | # Households | Median Income |
| Owner-Occupied | 9,903 (41.0%) | $114,583 |
| Renter-Occupied | 14,222 (59.0%) | $37,297 |
| Average | 24,125 (100.0%) | $61,610 |
Occupancy by Householder Income Bracket in Corvallis
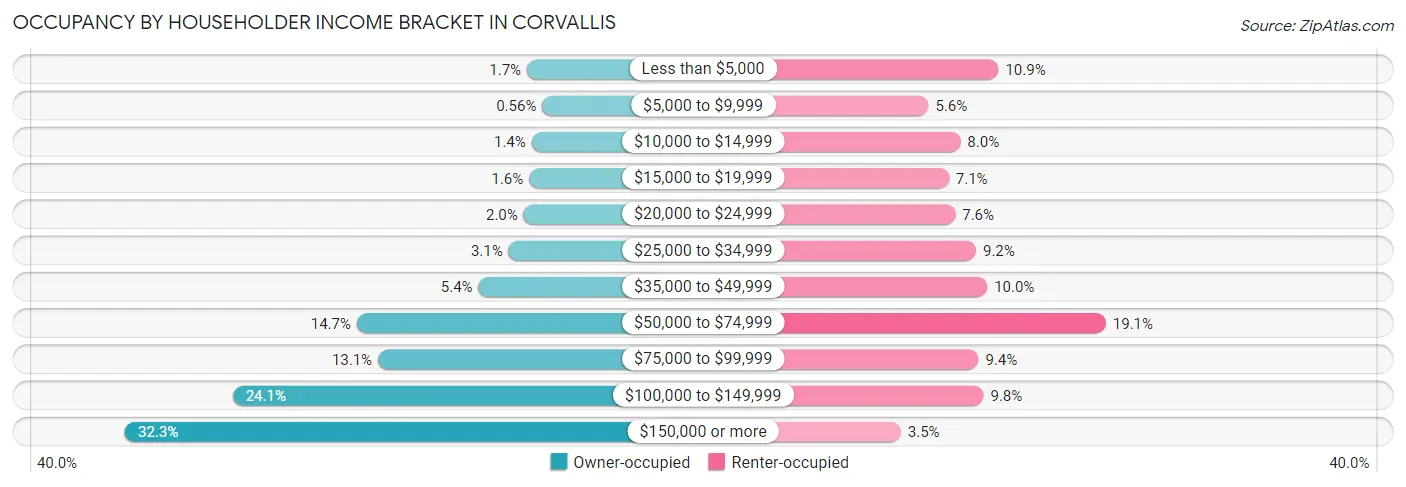
| Income Bracket | Owner-occupied | Renter-occupied |
| Less than $5,000 | 171 (1.7%) | 1,549 (10.9%) |
| $5,000 to $9,999 | 55 (0.6%) | 791 (5.6%) |
| $10,000 to $14,999 | 136 (1.4%) | 1,136 (8.0%) |
| $15,000 to $19,999 | 154 (1.6%) | 1,011 (7.1%) |
| $20,000 to $24,999 | 196 (2.0%) | 1,081 (7.6%) |
| $25,000 to $34,999 | 310 (3.1%) | 1,305 (9.2%) |
| $35,000 to $49,999 | 537 (5.4%) | 1,427 (10.0%) |
| $50,000 to $74,999 | 1,455 (14.7%) | 2,712 (19.1%) |
| $75,000 to $99,999 | 1,295 (13.1%) | 1,332 (9.4%) |
| $100,000 to $149,999 | 2,391 (24.1%) | 1,387 (9.8%) |
| $150,000 or more | 3,203 (32.3%) | 491 (3.5%) |
| Total | 9,903 (100.0%) | 14,222 (100.0%) |
Monthly Housing Cost Tiers in Corvallis
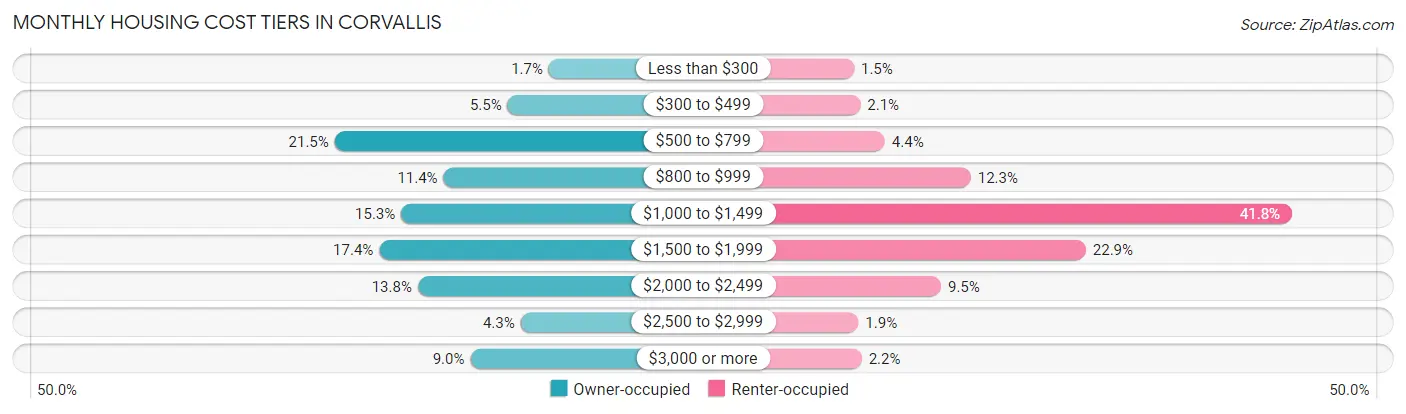
| Monthly Cost | Owner-occupied | Renter-occupied |
| Less than $300 | 172 (1.7%) | 218 (1.5%) |
| $300 to $499 | 549 (5.5%) | 300 (2.1%) |
| $500 to $799 | 2,125 (21.5%) | 621 (4.4%) |
| $800 to $999 | 1,133 (11.4%) | 1,746 (12.3%) |
| $1,000 to $1,499 | 1,519 (15.3%) | 5,950 (41.8%) |
| $1,500 to $1,999 | 1,719 (17.4%) | 3,252 (22.9%) |
| $2,000 to $2,499 | 1,368 (13.8%) | 1,357 (9.5%) |
| $2,500 to $2,999 | 430 (4.3%) | 274 (1.9%) |
| $3,000 or more | 888 (9.0%) | 318 (2.2%) |
| Total | 9,903 (100.0%) | 14,222 (100.0%) |
Physical Housing Characteristics in Corvallis
Housing Structures in Corvallis
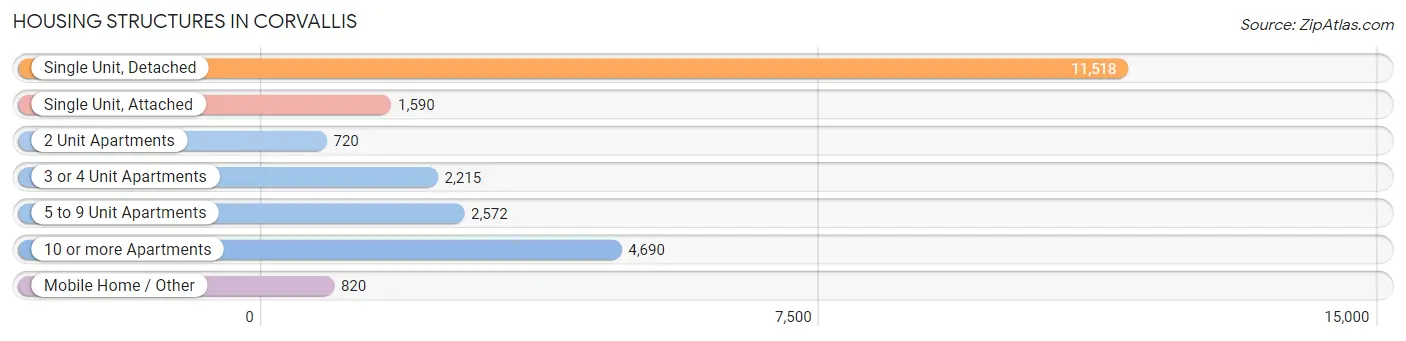
| Structure Type | # Housing Units | % Housing Units |
| Single Unit, Detached | 11,518 | 47.7% |
| Single Unit, Attached | 1,590 | 6.6% |
| 2 Unit Apartments | 720 | 3.0% |
| 3 or 4 Unit Apartments | 2,215 | 9.2% |
| 5 to 9 Unit Apartments | 2,572 | 10.7% |
| 10 or more Apartments | 4,690 | 19.4% |
| Mobile Home / Other | 820 | 3.4% |
| Total | 24,125 | 100.0% |
Housing Structures by Occupancy in Corvallis
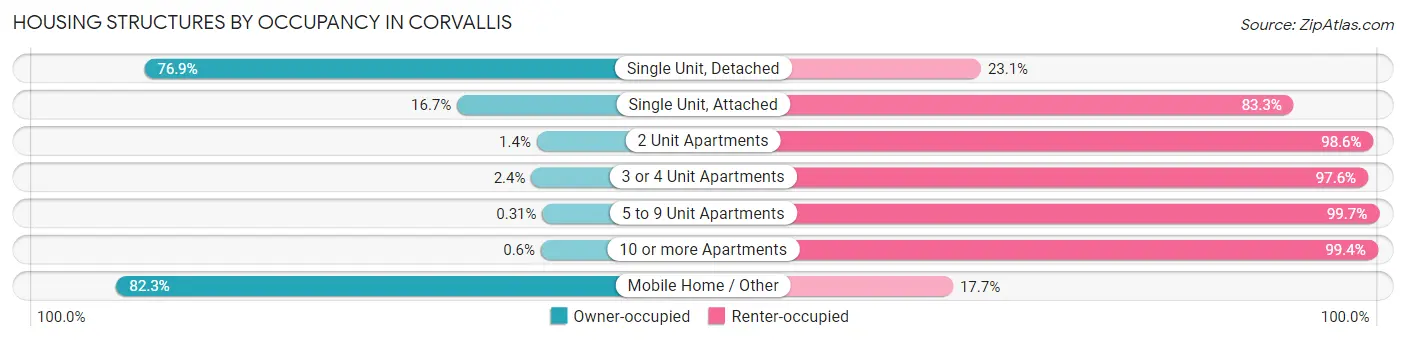
| Structure Type | Owner-occupied | Renter-occupied |
| Single Unit, Detached | 8,862 (76.9%) | 2,656 (23.1%) |
| Single Unit, Attached | 266 (16.7%) | 1,324 (83.3%) |
| 2 Unit Apartments | 10 (1.4%) | 710 (98.6%) |
| 3 or 4 Unit Apartments | 54 (2.4%) | 2,161 (97.6%) |
| 5 to 9 Unit Apartments | 8 (0.3%) | 2,564 (99.7%) |
| 10 or more Apartments | 28 (0.6%) | 4,662 (99.4%) |
| Mobile Home / Other | 675 (82.3%) | 145 (17.7%) |
| Total | 9,903 (41.0%) | 14,222 (59.0%) |
Housing Structures by Number of Rooms in Corvallis
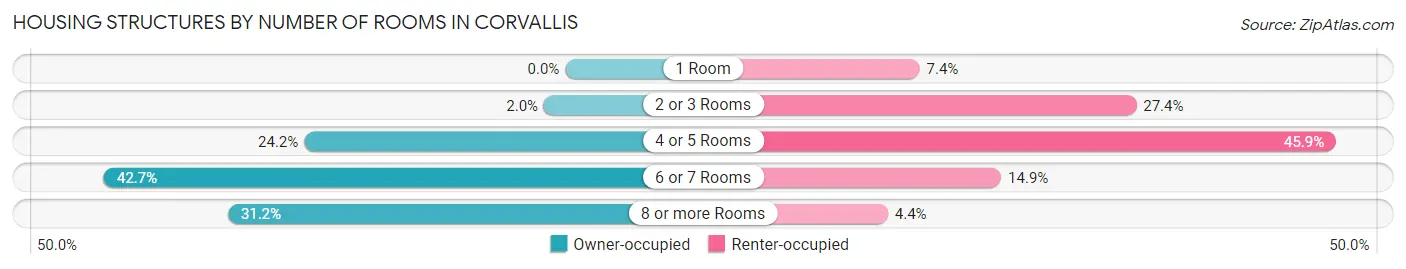
| Number of Rooms | Owner-occupied | Renter-occupied |
| 1 Room | 0 (0.0%) | 1,048 (7.4%) |
| 2 or 3 Rooms | 195 (2.0%) | 3,898 (27.4%) |
| 4 or 5 Rooms | 2,392 (24.1%) | 6,525 (45.9%) |
| 6 or 7 Rooms | 4,226 (42.7%) | 2,121 (14.9%) |
| 8 or more Rooms | 3,090 (31.2%) | 630 (4.4%) |
| Total | 9,903 (100.0%) | 14,222 (100.0%) |
Housing Structure by Heating Type in Corvallis
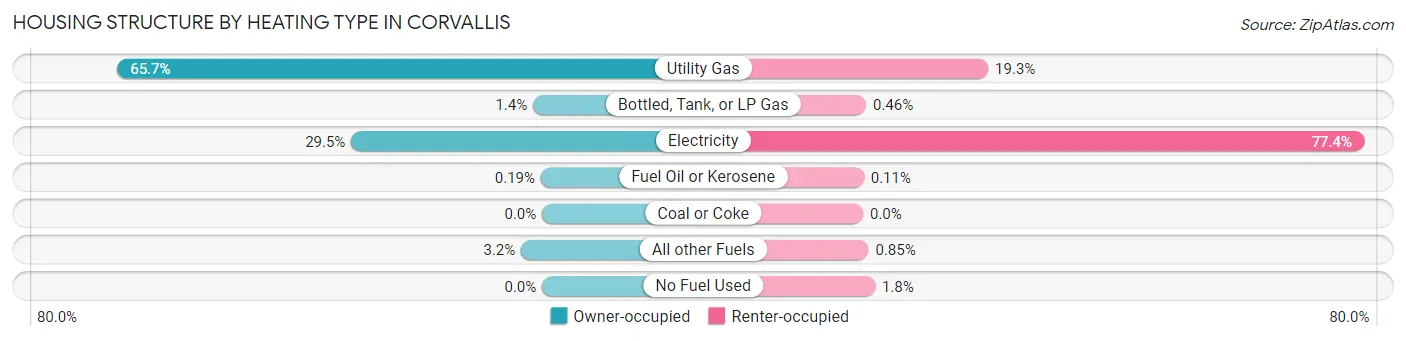
| Heating Type | Owner-occupied | Renter-occupied |
| Utility Gas | 6,502 (65.7%) | 2,751 (19.3%) |
| Bottled, Tank, or LP Gas | 139 (1.4%) | 66 (0.5%) |
| Electricity | 2,922 (29.5%) | 11,008 (77.4%) |
| Fuel Oil or Kerosene | 19 (0.2%) | 15 (0.1%) |
| Coal or Coke | 0 (0.0%) | 0 (0.0%) |
| All other Fuels | 321 (3.2%) | 121 (0.9%) |
| No Fuel Used | 0 (0.0%) | 261 (1.8%) |
| Total | 9,903 (100.0%) | 14,222 (100.0%) |
Household Vehicle Usage in Corvallis
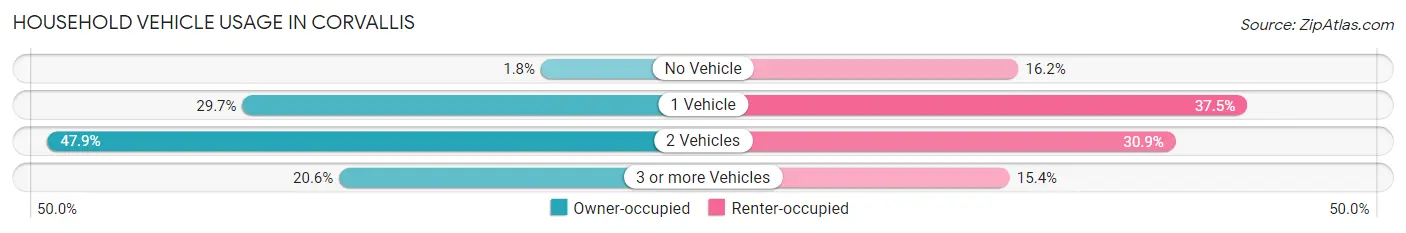
| Vehicles per Household | Owner-occupied | Renter-occupied |
| No Vehicle | 179 (1.8%) | 2,305 (16.2%) |
| 1 Vehicle | 2,938 (29.7%) | 5,337 (37.5%) |
| 2 Vehicles | 4,742 (47.9%) | 4,390 (30.9%) |
| 3 or more Vehicles | 2,044 (20.6%) | 2,190 (15.4%) |
| Total | 9,903 (100.0%) | 14,222 (100.0%) |
Real Estate & Mortgages in Corvallis
Real Estate and Mortgage Overview in Corvallis
| Characteristic | Without Mortgage | With Mortgage |
| Housing Units | 4,655 | 5,248 |
| Median Property Value | $412,400 | $449,600 |
| Median Household Income | $101,353 | $1,902 |
| Monthly Housing Costs | $731 | $888 |
| Real Estate Taxes | $4,776 | $42 |
Property Value by Mortgage Status in Corvallis
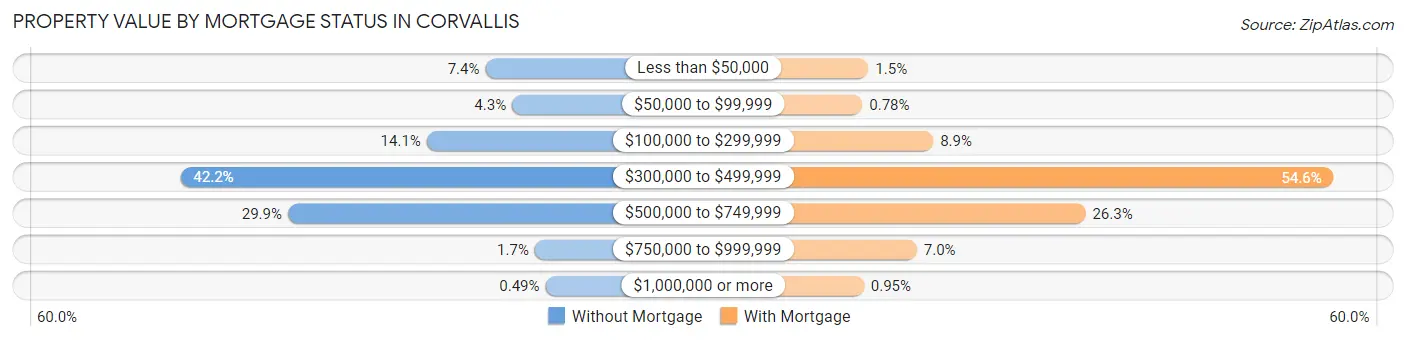
| Property Value | Without Mortgage | With Mortgage |
| Less than $50,000 | 342 (7.3%) | 77 (1.5%) |
| $50,000 to $99,999 | 200 (4.3%) | 41 (0.8%) |
| $100,000 to $299,999 | 654 (14.1%) | 466 (8.9%) |
| $300,000 to $499,999 | 1,964 (42.2%) | 2,867 (54.6%) |
| $500,000 to $749,999 | 1,393 (29.9%) | 1,379 (26.3%) |
| $750,000 to $999,999 | 79 (1.7%) | 368 (7.0%) |
| $1,000,000 or more | 23 (0.5%) | 50 (0.9%) |
| Total | 4,655 (100.0%) | 5,248 (100.0%) |
Household Income by Mortgage Status in Corvallis
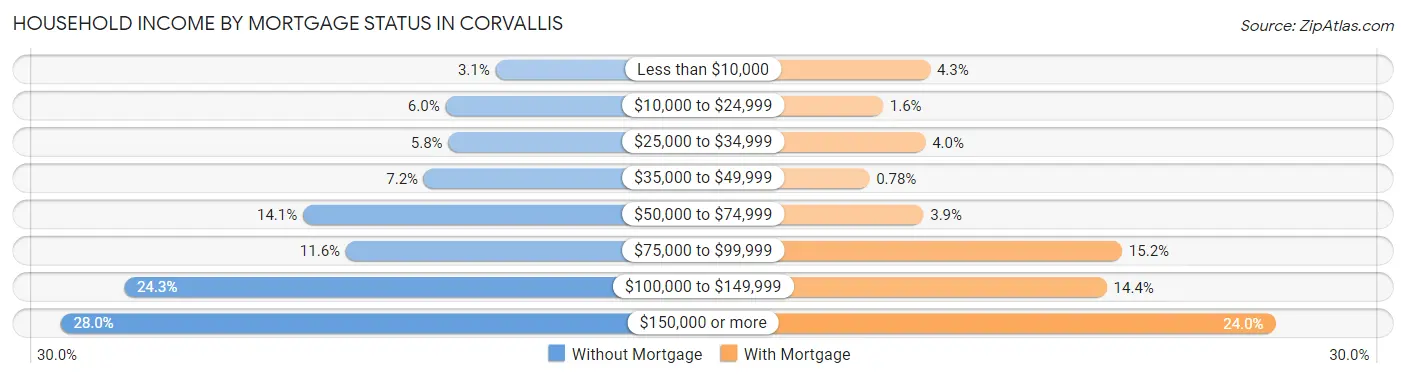
| Household Income | Without Mortgage | With Mortgage |
| Less than $10,000 | 144 (3.1%) | 223 (4.3%) |
| $10,000 to $24,999 | 277 (5.9%) | 82 (1.6%) |
| $25,000 to $34,999 | 269 (5.8%) | 209 (4.0%) |
| $35,000 to $49,999 | 334 (7.2%) | 41 (0.8%) |
| $50,000 to $74,999 | 656 (14.1%) | 203 (3.9%) |
| $75,000 to $99,999 | 542 (11.6%) | 799 (15.2%) |
| $100,000 to $149,999 | 1,132 (24.3%) | 753 (14.3%) |
| $150,000 or more | 1,301 (28.0%) | 1,259 (24.0%) |
| Total | 4,655 (100.0%) | 5,248 (100.0%) |
Property Value to Household Income Ratio in Corvallis
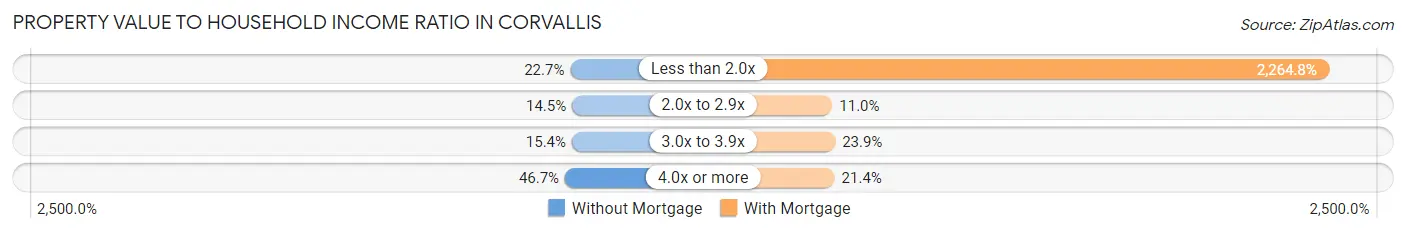
| Value-to-Income Ratio | Without Mortgage | With Mortgage |
| Less than 2.0x | 1,058 (22.7%) | 118,858 (2,264.8%) |
| 2.0x to 2.9x | 674 (14.5%) | 578 (11.0%) |
| 3.0x to 3.9x | 716 (15.4%) | 1,252 (23.9%) |
| 4.0x or more | 2,175 (46.7%) | 1,123 (21.4%) |
| Total | 4,655 (100.0%) | 5,248 (100.0%) |
Real Estate Taxes by Mortgage Status in Corvallis
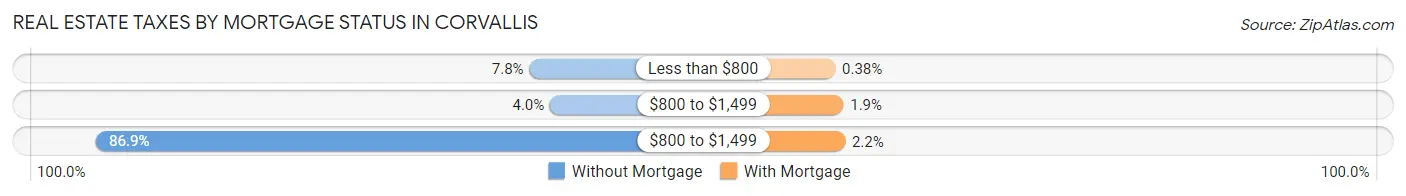
| Property Taxes | Without Mortgage | With Mortgage |
| Less than $800 | 363 (7.8%) | 20 (0.4%) |
| $800 to $1,499 | 187 (4.0%) | 98 (1.9%) |
| $800 to $1,499 | 4,046 (86.9%) | 114 (2.2%) |
| Total | 4,655 (100.0%) | 5,248 (100.0%) |
Health & Disability in Corvallis
Health Insurance Coverage by Age in Corvallis
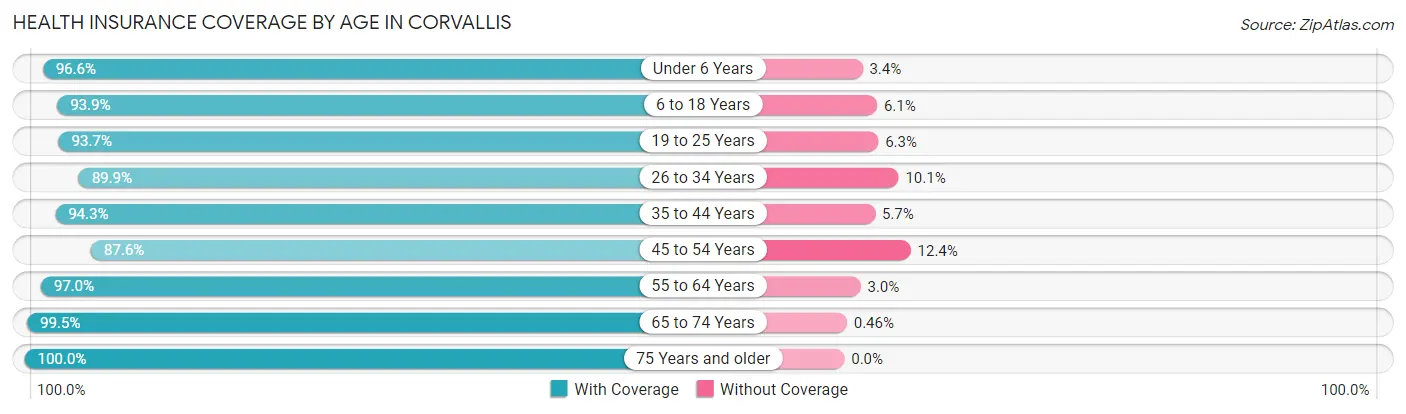
| Age Bracket | With Coverage | Without Coverage |
| Under 6 Years | 2,203 (96.6%) | 77 (3.4%) |
| 6 to 18 Years | 7,983 (93.9%) | 518 (6.1%) |
| 19 to 25 Years | 17,203 (93.7%) | 1,162 (6.3%) |
| 26 to 34 Years | 6,668 (89.9%) | 749 (10.1%) |
| 35 to 44 Years | 5,286 (94.3%) | 321 (5.7%) |
| 45 to 54 Years | 4,171 (87.6%) | 589 (12.4%) |
| 55 to 64 Years | 4,712 (97.0%) | 147 (3.0%) |
| 65 to 74 Years | 4,789 (99.5%) | 22 (0.5%) |
| 75 Years and older | 3,241 (100.0%) | 0 (0.0%) |
| Total | 56,256 (94.0%) | 3,585 (6.0%) |
Health Insurance Coverage by Citizenship Status in Corvallis
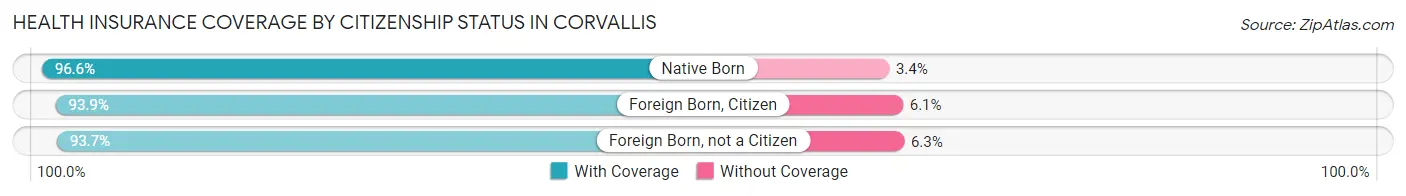
| Citizenship Status | With Coverage | Without Coverage |
| Native Born | 2,203 (96.6%) | 77 (3.4%) |
| Foreign Born, Citizen | 7,983 (93.9%) | 518 (6.1%) |
| Foreign Born, not a Citizen | 17,203 (93.7%) | 1,162 (6.3%) |
Health Insurance Coverage by Household Income in Corvallis
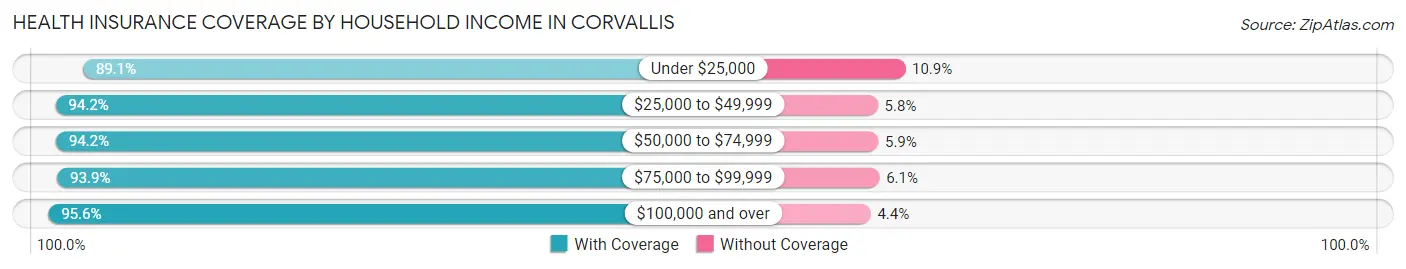
| Household Income | With Coverage | Without Coverage |
| Under $25,000 | 9,403 (89.1%) | 1,151 (10.9%) |
| $25,000 to $49,999 | 7,179 (94.2%) | 440 (5.8%) |
| $50,000 to $74,999 | 8,349 (94.2%) | 519 (5.9%) |
| $75,000 to $99,999 | 6,302 (93.9%) | 408 (6.1%) |
| $100,000 and over | 19,349 (95.6%) | 897 (4.4%) |
Public vs Private Health Insurance Coverage by Age in Corvallis
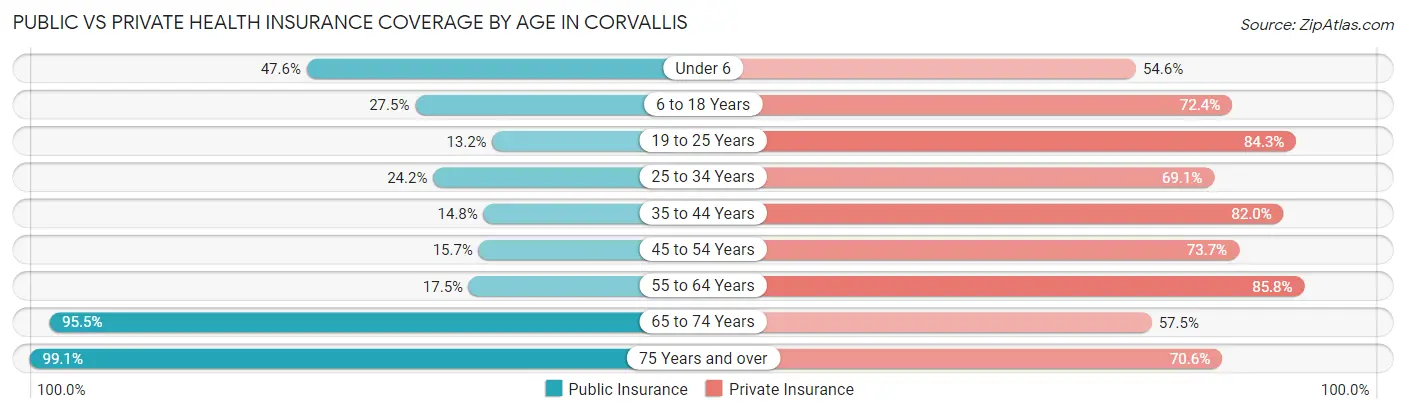
| Age Bracket | Public Insurance | Private Insurance |
| Under 6 | 1,086 (47.6%) | 1,245 (54.6%) |
| 6 to 18 Years | 2,337 (27.5%) | 6,158 (72.4%) |
| 19 to 25 Years | 2,416 (13.2%) | 15,488 (84.3%) |
| 25 to 34 Years | 1,791 (24.1%) | 5,124 (69.1%) |
| 35 to 44 Years | 830 (14.8%) | 4,598 (82.0%) |
| 45 to 54 Years | 748 (15.7%) | 3,508 (73.7%) |
| 55 to 64 Years | 852 (17.5%) | 4,171 (85.8%) |
| 65 to 74 Years | 4,592 (95.5%) | 2,768 (57.5%) |
| 75 Years and over | 3,211 (99.1%) | 2,287 (70.6%) |
| Total | 17,863 (29.8%) | 45,347 (75.8%) |
Disability Status by Sex by Age in Corvallis
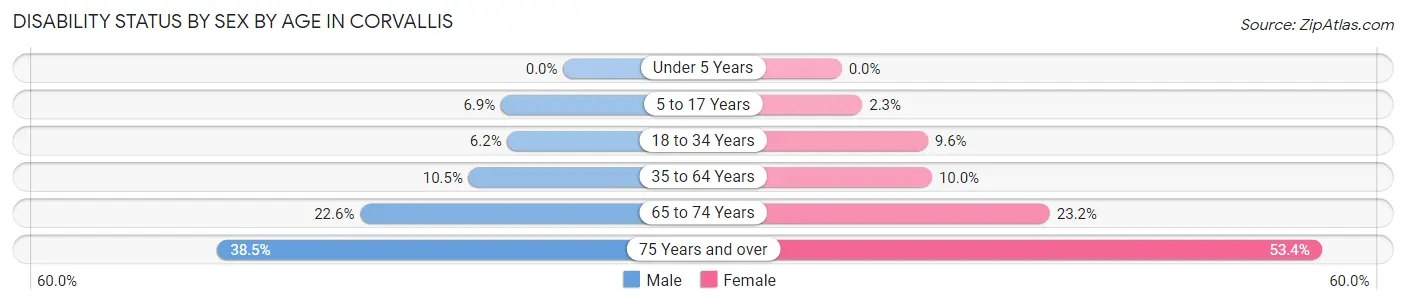
| Age Bracket | Male | Female |
| Under 5 Years | 0 (0.0%) | 0 (0.0%) |
| 5 to 17 Years | 213 (6.9%) | 65 (2.3%) |
| 18 to 34 Years | 944 (6.2%) | 1,300 (9.6%) |
| 35 to 64 Years | 799 (10.5%) | 767 (10.0%) |
| 65 to 74 Years | 560 (22.6%) | 541 (23.2%) |
| 75 Years and over | 452 (38.5%) | 1,105 (53.4%) |
Disability Class by Sex by Age in Corvallis
Disability Class: Hearing Difficulty
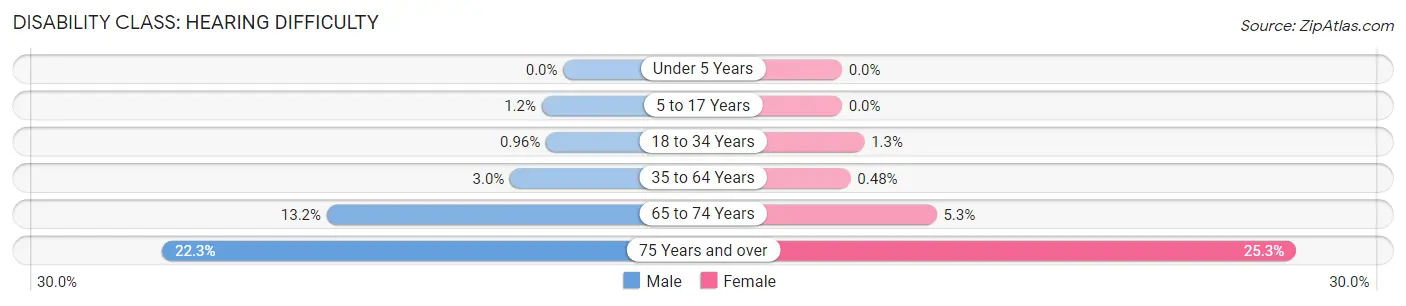
| Age Bracket | Male | Female |
| Under 5 Years | 0 (0.0%) | 0 (0.0%) |
| 5 to 17 Years | 37 (1.2%) | 0 (0.0%) |
| 18 to 34 Years | 146 (1.0%) | 170 (1.3%) |
| 35 to 64 Years | 225 (3.0%) | 37 (0.5%) |
| 65 to 74 Years | 326 (13.2%) | 123 (5.3%) |
| 75 Years and over | 262 (22.3%) | 523 (25.3%) |
Disability Class: Vision Difficulty
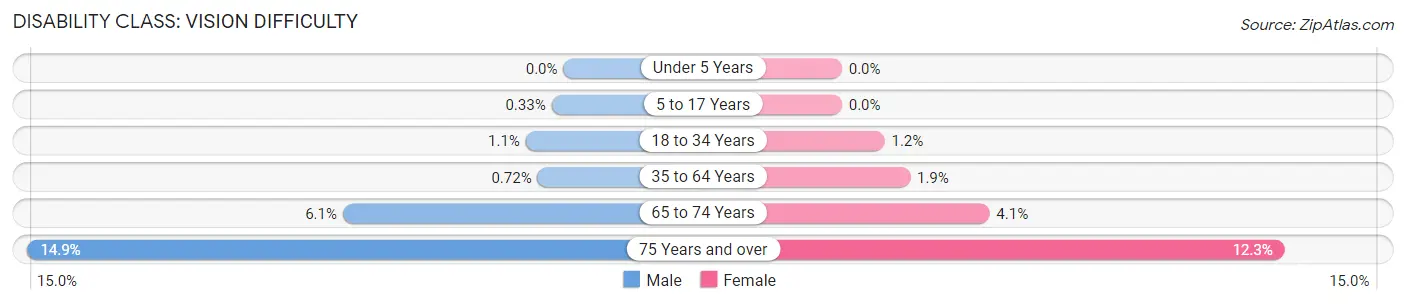
| Age Bracket | Male | Female |
| Under 5 Years | 0 (0.0%) | 0 (0.0%) |
| 5 to 17 Years | 10 (0.3%) | 0 (0.0%) |
| 18 to 34 Years | 160 (1.1%) | 162 (1.2%) |
| 35 to 64 Years | 55 (0.7%) | 145 (1.9%) |
| 65 to 74 Years | 152 (6.1%) | 96 (4.1%) |
| 75 Years and over | 175 (14.9%) | 255 (12.3%) |
Disability Class: Cognitive Difficulty
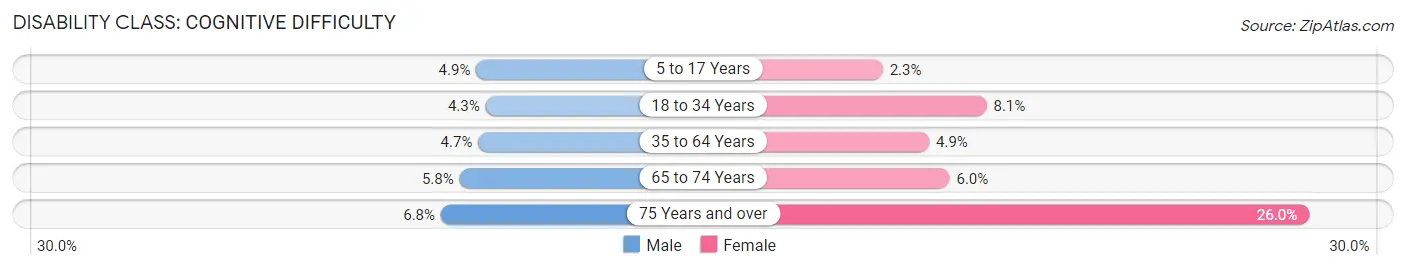
| Age Bracket | Male | Female |
| 5 to 17 Years | 149 (4.9%) | 65 (2.3%) |
| 18 to 34 Years | 657 (4.3%) | 1,094 (8.1%) |
| 35 to 64 Years | 360 (4.7%) | 371 (4.9%) |
| 65 to 74 Years | 143 (5.8%) | 140 (6.0%) |
| 75 Years and over | 80 (6.8%) | 538 (26.0%) |
Disability Class: Ambulatory Difficulty

| Age Bracket | Male | Female |
| 5 to 17 Years | 39 (1.3%) | 0 (0.0%) |
| 18 to 34 Years | 146 (1.0%) | 230 (1.7%) |
| 35 to 64 Years | 315 (4.2%) | 373 (4.9%) |
| 65 to 74 Years | 254 (10.3%) | 365 (15.6%) |
| 75 Years and over | 291 (24.8%) | 865 (41.8%) |
Disability Class: Self-Care Difficulty
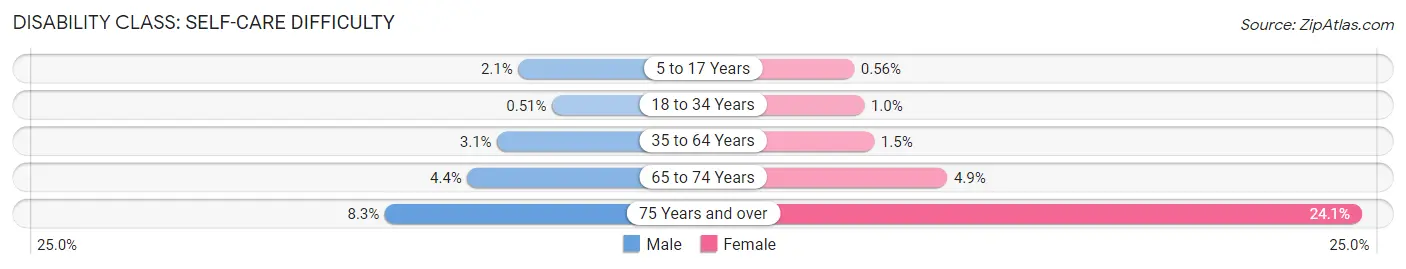
| Age Bracket | Male | Female |
| 5 to 17 Years | 64 (2.1%) | 16 (0.6%) |
| 18 to 34 Years | 77 (0.5%) | 140 (1.0%) |
| 35 to 64 Years | 232 (3.1%) | 114 (1.5%) |
| 65 to 74 Years | 110 (4.4%) | 114 (4.9%) |
| 75 Years and over | 97 (8.3%) | 499 (24.1%) |
Technology Access in Corvallis
Computing Device Access in Corvallis
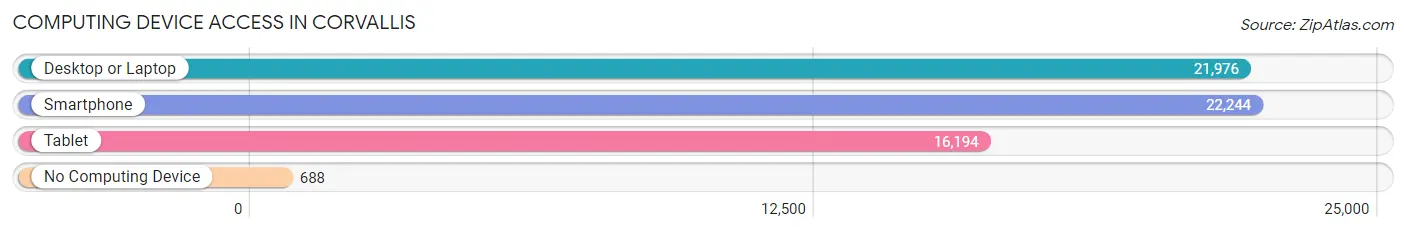
| Device Type | # Households | % Households |
| Desktop or Laptop | 21,976 | 91.1% |
| Smartphone | 22,244 | 92.2% |
| Tablet | 16,194 | 67.1% |
| No Computing Device | 688 | 2.9% |
| Total | 24,125 | 100.0% |
Internet Access in Corvallis
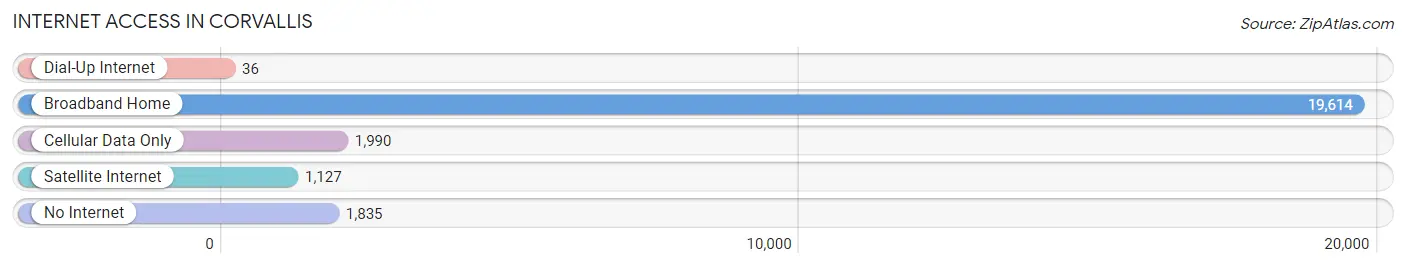
| Internet Type | # Households | % Households |
| Dial-Up Internet | 36 | 0.2% |
| Broadband Home | 19,614 | 81.3% |
| Cellular Data Only | 1,990 | 8.3% |
| Satellite Internet | 1,127 | 4.7% |
| No Internet | 1,835 | 7.6% |
| Total | 24,125 | 100.0% |
Corvallis Summary
Corvallis, Oregon is a city located in the Willamette Valley of the Pacific Northwest. It is the county seat of Benton County and is home to Oregon State University. The city has a population of 54,462 as of the 2010 census, making it the 11th largest city in the state.
Geography
Corvallis is located in the Willamette Valley, a fertile agricultural region in the Pacific Northwest. The city is situated on the eastern edge of the valley, between the Cascade Mountains to the east and the Coast Range to the west. The Willamette River runs through the city, and the Marys River, a tributary of the Willamette, runs through the city as well. The city is located at an elevation of 150 feet above sea level.
The city has a total area of 11.2 square miles, of which 11.1 square miles is land and 0.1 square miles is water. The climate in Corvallis is mild and temperate, with warm summers and cool winters. The average annual temperature is 52.2°F, and the average annual precipitation is 37.2 inches.
History
Corvallis was founded in 1845 by Joseph C. Avery, a settler from Kentucky. Avery named the city after his hometown of Corvallis, Kentucky. The city was incorporated in 1857 and became the county seat of Benton County in 1868.
In the late 19th century, Corvallis was a major center for the timber industry, and the city was home to several sawmills and lumber companies. In 1887, the Oregon Agricultural College (now Oregon State University) was established in Corvallis, and the city quickly became a center for education and research.
Economy
Corvallis is a major economic center in the Willamette Valley. The city is home to several large employers, including Oregon State University, Hewlett-Packard, Samaritan Health Services, and the Corvallis Clinic. The city is also home to several technology companies, including Intel, Hewlett-Packard, and IBM.
The city's economy is also supported by agriculture, with the surrounding area producing a variety of crops, including grass seed, hazelnuts, and hops. The city is also home to several wineries and breweries, and is a popular destination for wine and beer tourism.
Demographics
As of the 2010 census, Corvallis had a population of 54,462. The racial makeup of the city was 87.2% White, 4.2% Asian, 2.7% Hispanic or Latino, 1.7% African American, 0.7% Native American, 0.2% Pacific Islander, and 2.5% from two or more races.
The median household income in Corvallis was $45,945 in 2017, and the median family income was $60,945. The per capita income in the city was $27,837. The city's poverty rate was 13.2%, and the unemployment rate was 4.2%.
Conclusion
Corvallis, Oregon is a city located in the Willamette Valley of the Pacific Northwest. It is the county seat of Benton County and is home to Oregon State University. The city has a population of 54,462 as of the 2010 census, making it the 11th largest city in the state. Corvallis is a major economic center in the Willamette Valley, with a diverse economy supported by agriculture, technology, and education. The city has a diverse population, with a median household income of $45,945 and a poverty rate of 13.2%. Corvallis is a vibrant city with a rich history and a bright future.
Common Questions
What is Per Capita Income in Corvallis?
Per Capita income in Corvallis is $36,172.
What is the Median Family Income in Corvallis?
Median Family Income in Corvallis is $101,333.
What is the Median Household income in Corvallis?
Median Household Income in Corvallis is $61,610.
What is Income or Wage Gap in Corvallis?
Income or Wage Gap in Corvallis is 27.8%.
Women in Corvallis earn 72.2 cents for every dollar earned by a man.
What is Family Income Deficit in Corvallis?
Family Income Deficit in Corvallis is $12,849.
Families that are below poverty line in Corvallis earn $12,849 less on average than the poverty threshold level.
What is Inequality or Gini Index in Corvallis?
Inequality or Gini Index in Corvallis is 0.50.
What is the Total Population of Corvallis?
Total Population of Corvallis is 60,050.
What is the Total Male Population of Corvallis?
Total Male Population of Corvallis is 30,677.
What is the Total Female Population of Corvallis?
Total Female Population of Corvallis is 29,373.
What is the Ratio of Males per 100 Females in Corvallis?
There are 104.44 Males per 100 Females in Corvallis.
What is the Ratio of Females per 100 Males in Corvallis?
There are 95.75 Females per 100 Males in Corvallis.
What is the Median Population Age in Corvallis?
Median Population Age in Corvallis is 26.9 Years.
What is the Average Family Size in Corvallis
Average Family Size in Corvallis is 2.8 People.
What is the Average Household Size in Corvallis
Average Household Size in Corvallis is 2.2 People.
How Large is the Labor Force in Corvallis?
There are 32,308 People in the Labor Forcein in Corvallis.
What is the Percentage of People in the Labor Force in Corvallis?
60.7% of People are in the Labor Force in Corvallis.
What is the Unemployment Rate in Corvallis?
Unemployment Rate in Corvallis is 8.0%.