Rolesville, NC Map & Demographics
Rolesville Map
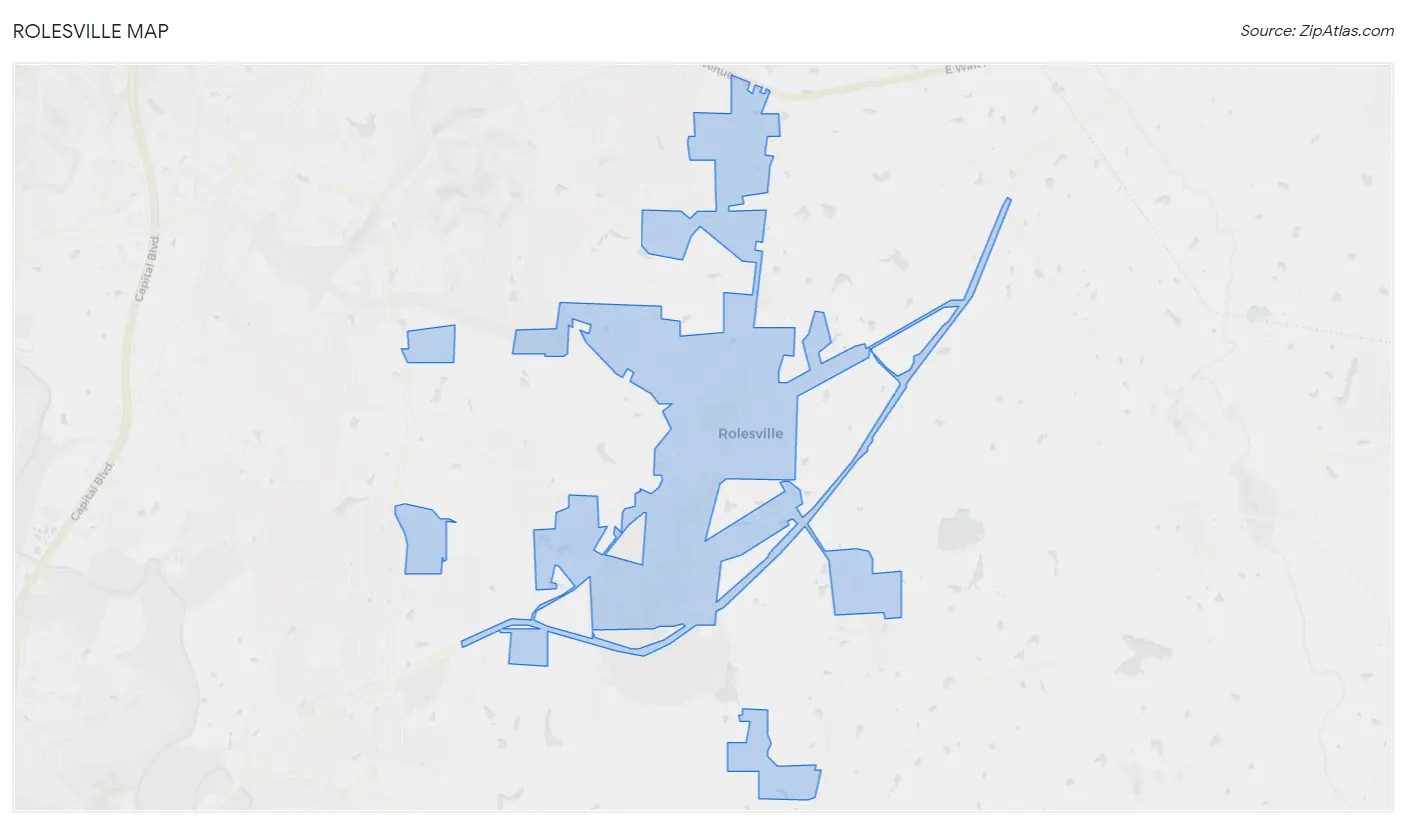
Rolesville Overview
$48,881
PER CAPITA INCOME
$161,463
AVG FAMILY INCOME
$145,166
AVG HOUSEHOLD INCOME
42.0%
WAGE / INCOME GAP [ % ]
58.0¢/ $1
WAGE / INCOME GAP [ $ ]
0.34
INEQUALITY / GINI INDEX
9,696
TOTAL POPULATION
4,958
MALE POPULATION
4,738
FEMALE POPULATION
104.64
MALES / 100 FEMALES
95.56
FEMALES / 100 MALES
39.9
MEDIAN AGE
3.5
AVG FAMILY SIZE
3.2
AVG HOUSEHOLD SIZE
4,564
LABOR FORCE [ PEOPLE ]
67.7%
PERCENT IN LABOR FORCE
3.7%
UNEMPLOYMENT RATE
Rolesville Zip Codes
Rolesville Area Codes
Income in Rolesville
Income Overview in Rolesville
Per Capita Income in Rolesville is $48,881, while median incomes of families and households are $161,463 and $145,166 respectively.
| Characteristic | Number | Measure |
| Per Capita Income | 9,696 | $48,881 |
| Median Family Income | 2,621 | $161,463 |
| Mean Family Income | 2,621 | $165,758 |
| Median Household Income | 3,047 | $145,166 |
| Mean Household Income | 3,047 | $150,465 |
| Income Deficit | 2,621 | $0 |
| Wage / Income Gap (%) | 9,696 | 41.97% |
| Wage / Income Gap ($) | 9,696 | 58.03¢ per $1 |
| Gini / Inequality Index | 9,696 | 0.34 |
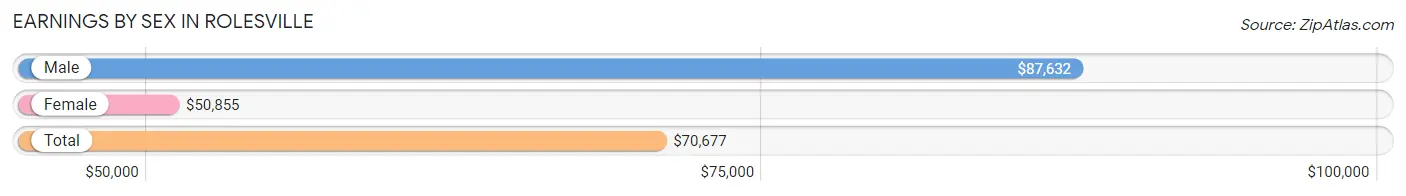
Earnings by Sex in Rolesville
Average Earnings in Rolesville are $70,677, $87,632 for men and $50,855 for women, a difference of 42.0%.
| Sex | Number | Average Earnings |
| Male | 2,626 (53.8%) | $87,632 |
| Female | 2,258 (46.2%) | $50,855 |
| Total | 4,884 (100.0%) | $70,677 |
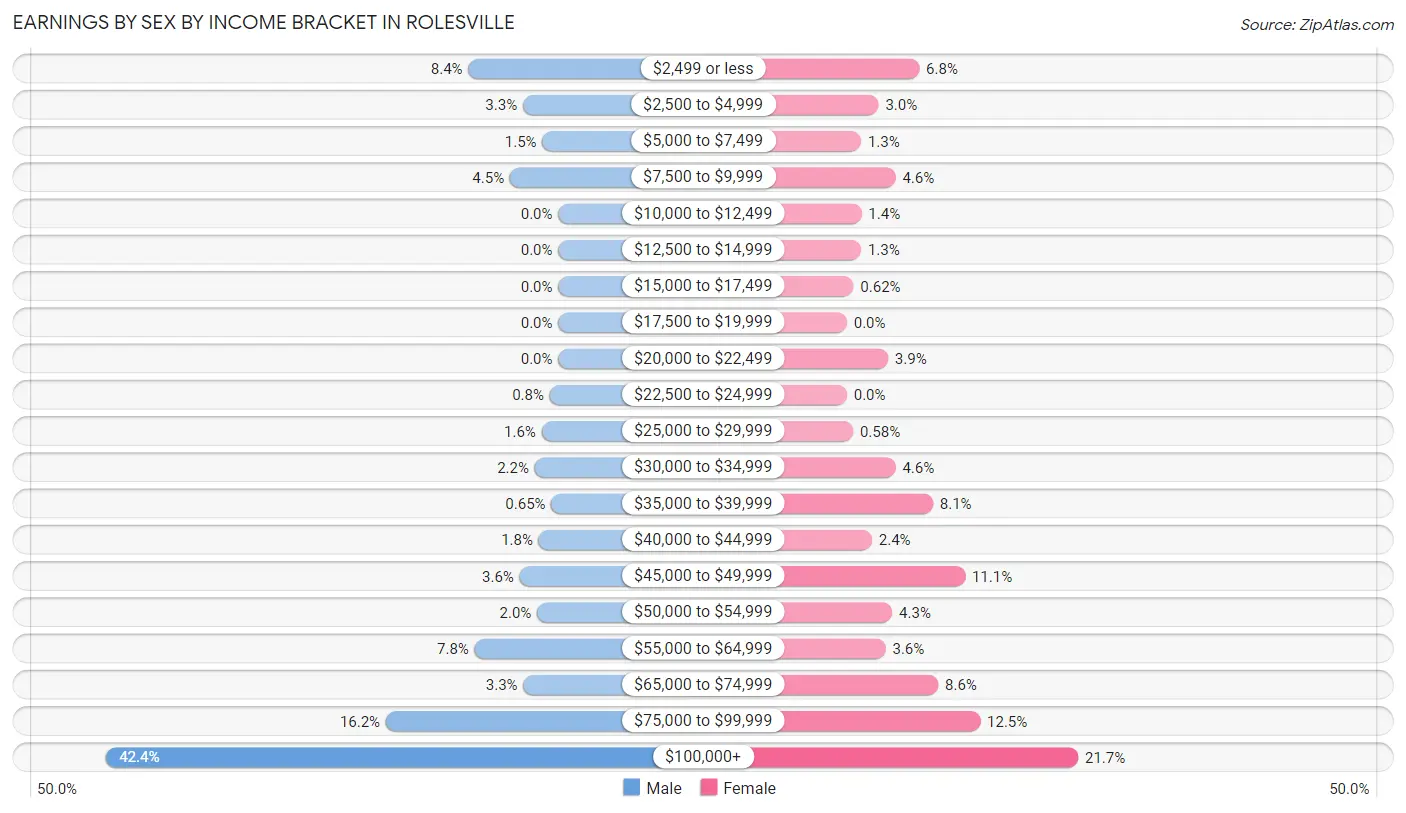
Earnings by Sex by Income Bracket in Rolesville
The most common earnings brackets in Rolesville are $100,000+ for men (1,112 | 42.3%) and $100,000+ for women (489 | 21.7%).
| Income | Male | Female |
| $2,499 or less | 221 (8.4%) | 153 (6.8%) |
| $2,500 to $4,999 | 87 (3.3%) | 67 (3.0%) |
| $5,000 to $7,499 | 39 (1.5%) | 30 (1.3%) |
| $7,500 to $9,999 | 119 (4.5%) | 103 (4.6%) |
| $10,000 to $12,499 | 0 (0.0%) | 31 (1.4%) |
| $12,500 to $14,999 | 0 (0.0%) | 30 (1.3%) |
| $15,000 to $17,499 | 0 (0.0%) | 14 (0.6%) |
| $17,500 to $19,999 | 0 (0.0%) | 0 (0.0%) |
| $20,000 to $22,499 | 0 (0.0%) | 87 (3.8%) |
| $22,500 to $24,999 | 21 (0.8%) | 0 (0.0%) |
| $25,000 to $29,999 | 41 (1.6%) | 13 (0.6%) |
| $30,000 to $34,999 | 58 (2.2%) | 103 (4.6%) |
| $35,000 to $39,999 | 17 (0.6%) | 182 (8.1%) |
| $40,000 to $44,999 | 48 (1.8%) | 53 (2.4%) |
| $45,000 to $49,999 | 95 (3.6%) | 250 (11.1%) |
| $50,000 to $54,999 | 52 (2.0%) | 96 (4.3%) |
| $55,000 to $64,999 | 206 (7.8%) | 82 (3.6%) |
| $65,000 to $74,999 | 86 (3.3%) | 193 (8.6%) |
| $75,000 to $99,999 | 424 (16.2%) | 282 (12.5%) |
| $100,000+ | 1,112 (42.3%) | 489 (21.7%) |
| Total | 2,626 (100.0%) | 2,258 (100.0%) |
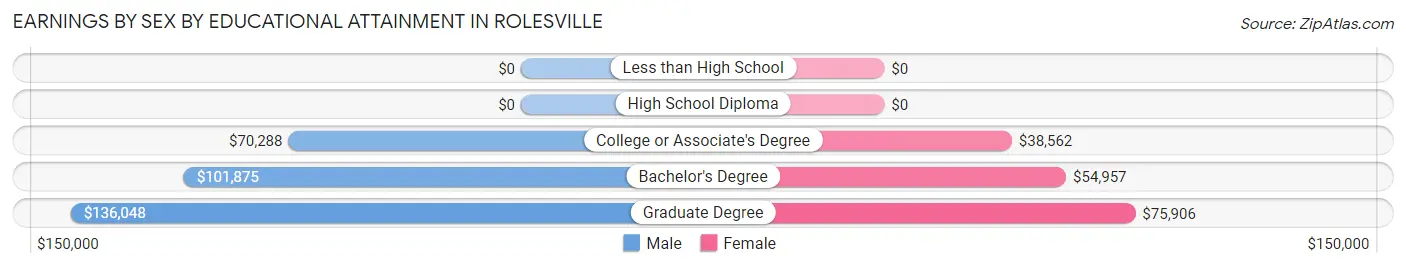
Earnings by Sex by Educational Attainment in Rolesville
Average earnings in Rolesville are $96,301 for men and $54,203 for women, a difference of 43.7%. Men with an educational attainment of graduate degree enjoy the highest average annual earnings of $136,048, while those with college or associate's degree education earn the least with $70,288. Women with an educational attainment of graduate degree earn the most with the average annual earnings of $75,906, while those with college or associate's degree education have the smallest earnings of $38,562.
| Educational Attainment | Male Income | Female Income |
| Less than High School | - | - |
| High School Diploma | - | - |
| College or Associate's Degree | $70,288 | $38,562 |
| Bachelor's Degree | $101,875 | $54,957 |
| Graduate Degree | $136,048 | $75,906 |
| Total | $96,301 | $54,203 |
Family Income in Rolesville
Family Income Brackets in Rolesville
According to the Rolesville family income data, there are 799 families falling into the $200,000+ income range, which is the most common income bracket and makes up 30.5% of all families.
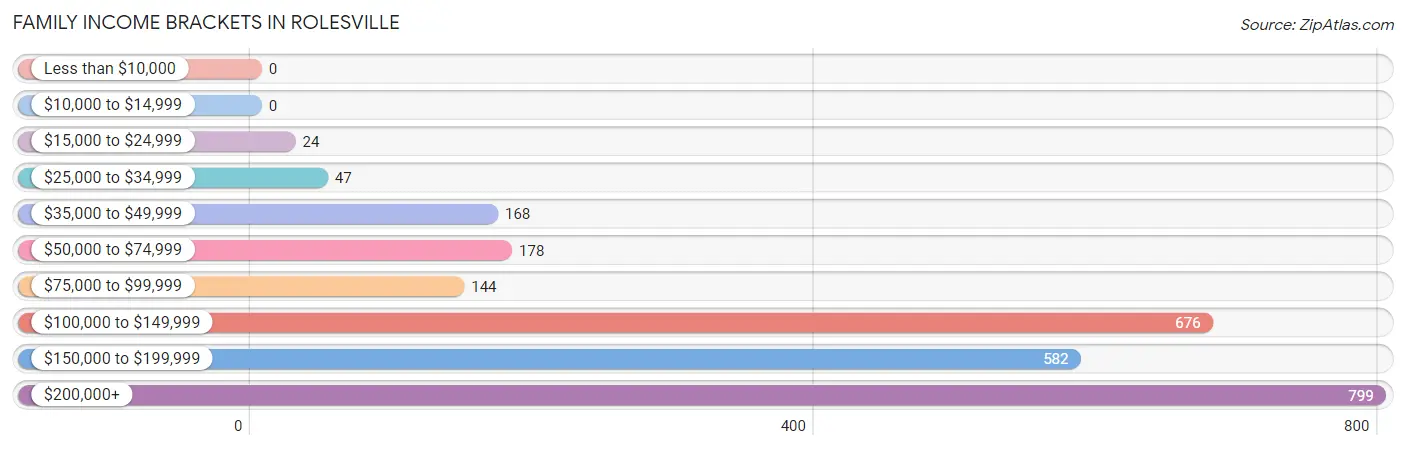
| Income Bracket | # Families | % Families |
| Less than $10,000 | 0 | 0.0% |
| $10,000 to $14,999 | 0 | 0.0% |
| $15,000 to $24,999 | 24 | 0.9% |
| $25,000 to $34,999 | 47 | 1.8% |
| $35,000 to $49,999 | 168 | 6.4% |
| $50,000 to $74,999 | 178 | 6.8% |
| $75,000 to $99,999 | 144 | 5.5% |
| $100,000 to $149,999 | 676 | 25.8% |
| $150,000 to $199,999 | 582 | 22.2% |
| $200,000+ | 799 | 30.5% |
Family Income by Famaliy Size in Rolesville
4-person families (876 | 33.4%) account for the highest median family income in Rolesville with $212,823 per family, while 4-person families (876 | 33.4%) have the highest median income of $53,206 per family member.
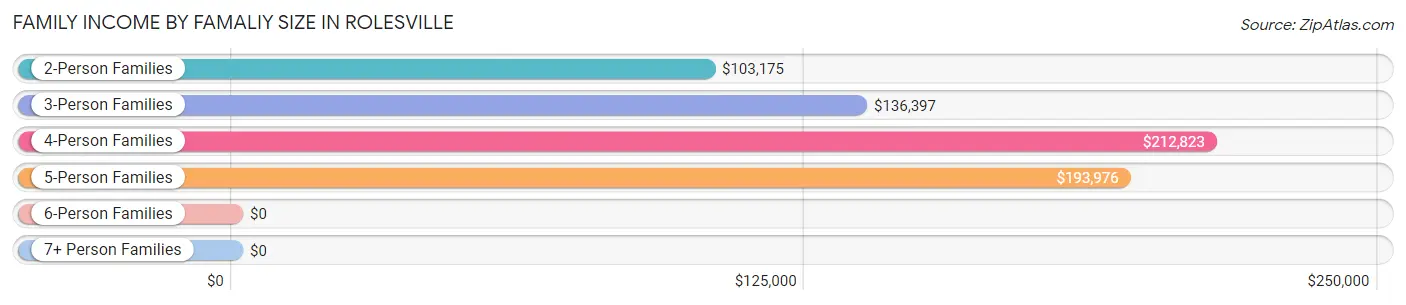
| Income Bracket | # Families | Median Income |
| 2-Person Families | 801 (30.6%) | $103,175 |
| 3-Person Families | 463 (17.7%) | $136,397 |
| 4-Person Families | 876 (33.4%) | $212,823 |
| 5-Person Families | 373 (14.2%) | $193,976 |
| 6-Person Families | 108 (4.1%) | $0 |
| 7+ Person Families | 0 (0.0%) | $0 |
| Total | 2,621 (100.0%) | $161,463 |
Family Income by Number of Earners in Rolesville
The median family income in Rolesville is $161,463, with families comprising 2 earners (1,446) having the highest median family income of $191,528, while families with no earners (187) have the lowest median family income of $91,587, accounting for 55.2% and 7.1% of families, respectively.
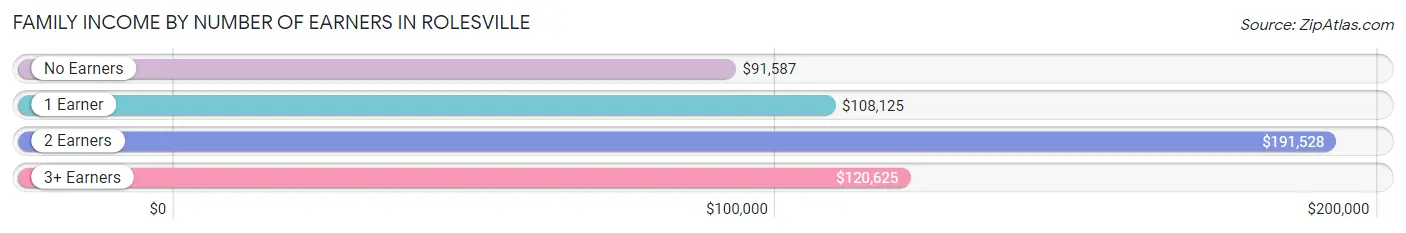
| Number of Earners | # Families | Median Income |
| No Earners | 187 (7.1%) | $91,587 |
| 1 Earner | 728 (27.8%) | $108,125 |
| 2 Earners | 1,446 (55.2%) | $191,528 |
| 3+ Earners | 260 (9.9%) | $120,625 |
| Total | 2,621 (100.0%) | $161,463 |
Household Income in Rolesville
Household Income Brackets in Rolesville
With 798 households falling in the category, the $200,000+ income range is the most frequent in Rolesville, accounting for 26.2% of all households.
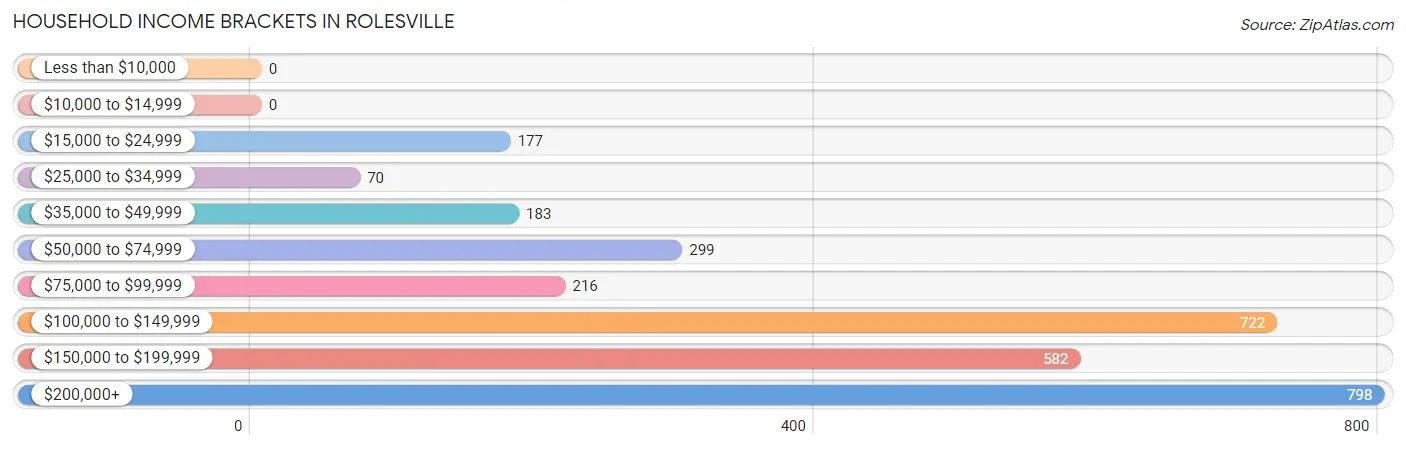
| Income Bracket | # Households | % Households |
| Less than $10,000 | 0 | 0.0% |
| $10,000 to $14,999 | 0 | 0.0% |
| $15,000 to $24,999 | 177 | 5.8% |
| $25,000 to $34,999 | 70 | 2.3% |
| $35,000 to $49,999 | 183 | 6.0% |
| $50,000 to $74,999 | 299 | 9.8% |
| $75,000 to $99,999 | 216 | 7.1% |
| $100,000 to $149,999 | 722 | 23.7% |
| $150,000 to $199,999 | 582 | 19.1% |
| $200,000+ | 798 | 26.2% |
Household Income by Householder Age in Rolesville
The median household income in Rolesville is $145,166, with the highest median household income of $166,092 found in the 25 to 44 years age bracket for the primary householder. A total of 1,164 households (38.2%) fall into this category.
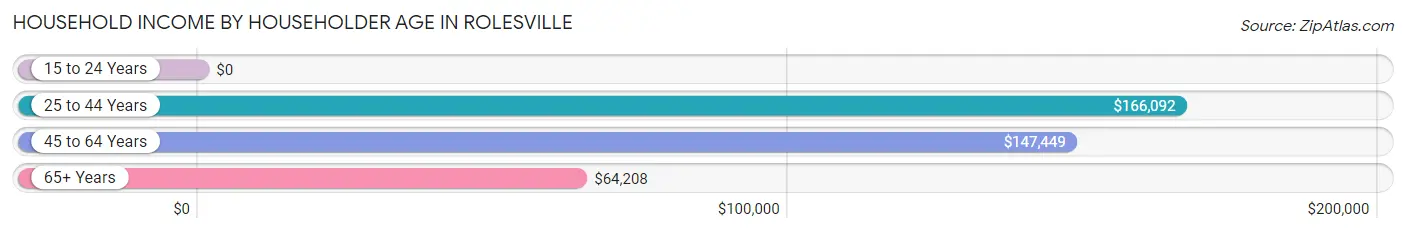
| Income Bracket | # Households | Median Income |
| 15 to 24 Years | 0 (0.0%) | $0 |
| 25 to 44 Years | 1,164 (38.2%) | $166,092 |
| 45 to 64 Years | 1,262 (41.4%) | $147,449 |
| 65+ Years | 621 (20.4%) | $64,208 |
| Total | 3,047 (100.0%) | $145,166 |
Poverty in Rolesville
Income Below Poverty by Sex and Age in Rolesville
With 1.7% poverty level for males and 1.6% for females among the residents of Rolesville, 15 year old males and 18 to 24 year old females are the most vulnerable to poverty, with 21 males (10.3%) and 24 females (10.2%) in their respective age groups living below the poverty level.
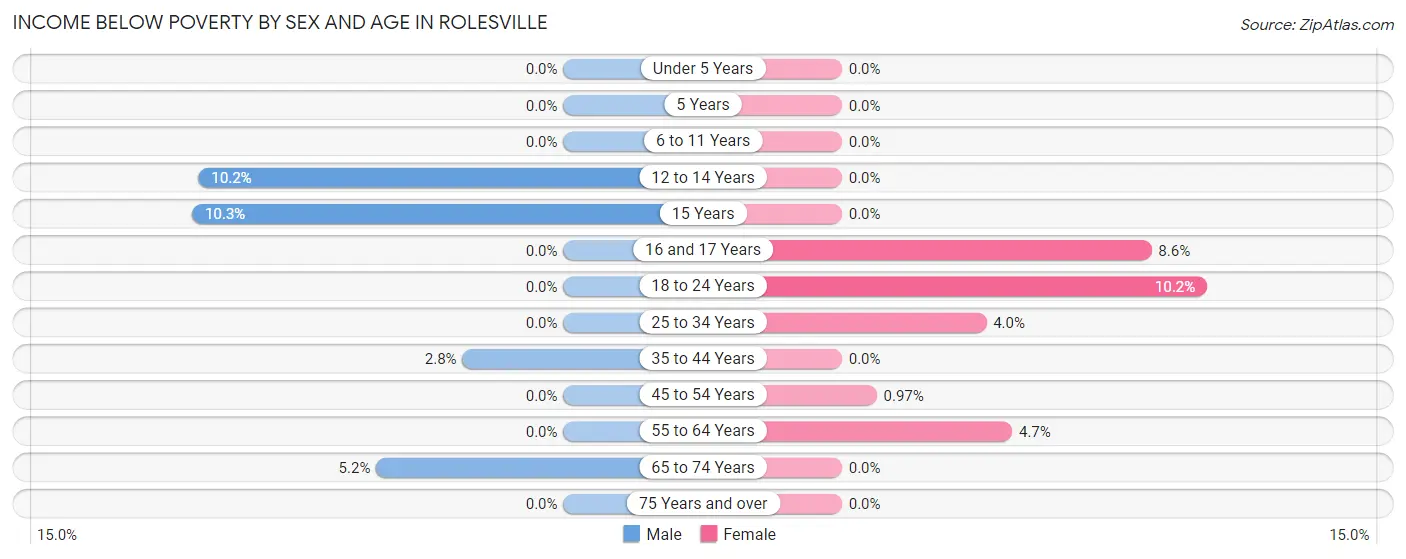
| Age Bracket | Male | Female |
| Under 5 Years | 0 (0.0%) | 0 (0.0%) |
| 5 Years | 0 (0.0%) | 0 (0.0%) |
| 6 to 11 Years | 0 (0.0%) | 0 (0.0%) |
| 12 to 14 Years | 25 (10.2%) | 0 (0.0%) |
| 15 Years | 21 (10.3%) | 0 (0.0%) |
| 16 and 17 Years | 0 (0.0%) | 10 (8.6%) |
| 18 to 24 Years | 0 (0.0%) | 24 (10.2%) |
| 25 to 34 Years | 0 (0.0%) | 16 (4.0%) |
| 35 to 44 Years | 25 (2.8%) | 0 (0.0%) |
| 45 to 54 Years | 0 (0.0%) | 8 (1.0%) |
| 55 to 64 Years | 0 (0.0%) | 19 (4.7%) |
| 65 to 74 Years | 15 (5.2%) | 0 (0.0%) |
| 75 Years and over | 0 (0.0%) | 0 (0.0%) |
| Total | 86 (1.7%) | 77 (1.6%) |
Income Above Poverty by Sex and Age in Rolesville
According to the poverty statistics in Rolesville, males aged under 5 years and females aged under 5 years are the age groups that are most secure financially, with 100.0% of males and 100.0% of females in these age groups living above the poverty line.
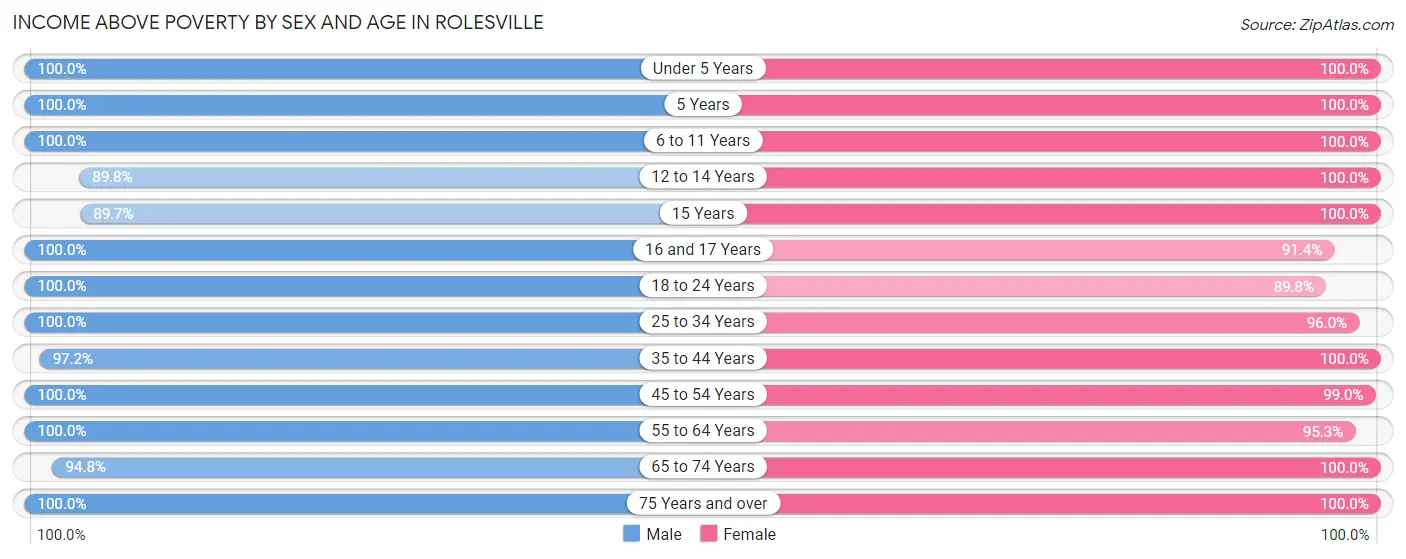
| Age Bracket | Male | Female |
| Under 5 Years | 539 (100.0%) | 330 (100.0%) |
| 5 Years | 53 (100.0%) | 82 (100.0%) |
| 6 to 11 Years | 735 (100.0%) | 508 (100.0%) |
| 12 to 14 Years | 221 (89.8%) | 232 (100.0%) |
| 15 Years | 182 (89.7%) | 26 (100.0%) |
| 16 and 17 Years | 123 (100.0%) | 106 (91.4%) |
| 18 to 24 Years | 229 (100.0%) | 212 (89.8%) |
| 25 to 34 Years | 250 (100.0%) | 382 (96.0%) |
| 35 to 44 Years | 864 (97.2%) | 944 (100.0%) |
| 45 to 54 Years | 878 (100.0%) | 820 (99.0%) |
| 55 to 64 Years | 335 (100.0%) | 382 (95.3%) |
| 65 to 74 Years | 273 (94.8%) | 512 (100.0%) |
| 75 Years and over | 190 (100.0%) | 125 (100.0%) |
| Total | 4,872 (98.3%) | 4,661 (98.4%) |
Income Below Poverty Among Married-Couple Families in Rolesville
The poverty statistics for married-couple families in Rolesville show that 1.0% or 23 of the total 2,357 families live below the poverty line. Families with no children have the highest poverty rate of 1.9%, comprising of 15 families. On the other hand, families with 3 or 4 children have the lowest poverty rate of 0.0%, which includes 0 families.
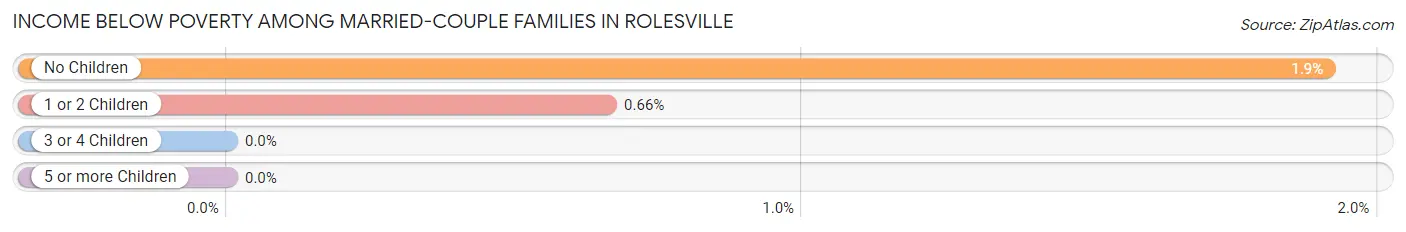
| Children | Above Poverty | Below Poverty |
| No Children | 771 (98.1%) | 15 (1.9%) |
| 1 or 2 Children | 1,208 (99.3%) | 8 (0.7%) |
| 3 or 4 Children | 355 (100.0%) | 0 (0.0%) |
| 5 or more Children | 0 (0.0%) | 0 (0.0%) |
| Total | 2,334 (99.0%) | 23 (1.0%) |
Income Below Poverty Among Single-Parent Households in Rolesville
| Children | Single Father | Single Mother |
| No Children | 0 (0.0%) | 0 (0.0%) |
| 1 or 2 Children | 0 (0.0%) | 0 (0.0%) |
| 3 or 4 Children | 0 (0.0%) | 0 (0.0%) |
| 5 or more Children | 0 (0.0%) | 0 (0.0%) |
| Total | 0 (0.0%) | 0 (0.0%) |
Income Below Poverty Among Married-Couple vs Single-Parent Households in Rolesville
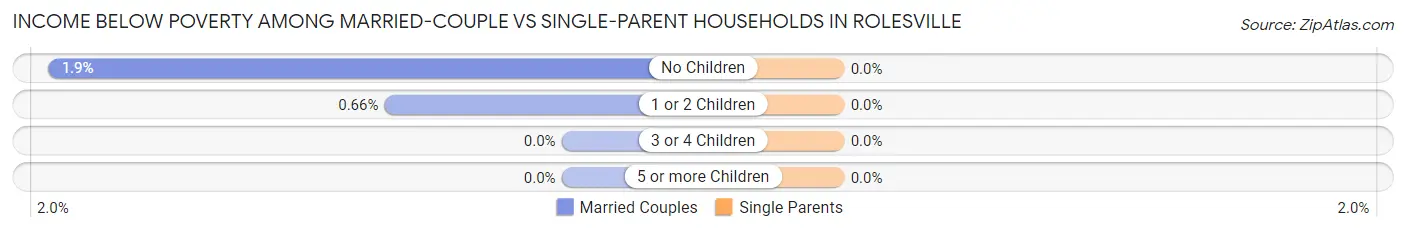
| Children | Married-Couple Families | Single-Parent Households |
| No Children | 15 (1.9%) | 0 (0.0%) |
| 1 or 2 Children | 8 (0.7%) | 0 (0.0%) |
| 3 or 4 Children | 0 (0.0%) | 0 (0.0%) |
| 5 or more Children | 0 (0.0%) | 0 (0.0%) |
| Total | 23 (1.0%) | 0 (0.0%) |
Race in Rolesville
The most populous races in Rolesville are White / Caucasian (6,141 | 63.3%), Black / African American (2,448 | 25.3%), and Two or more Races (811 | 8.4%).
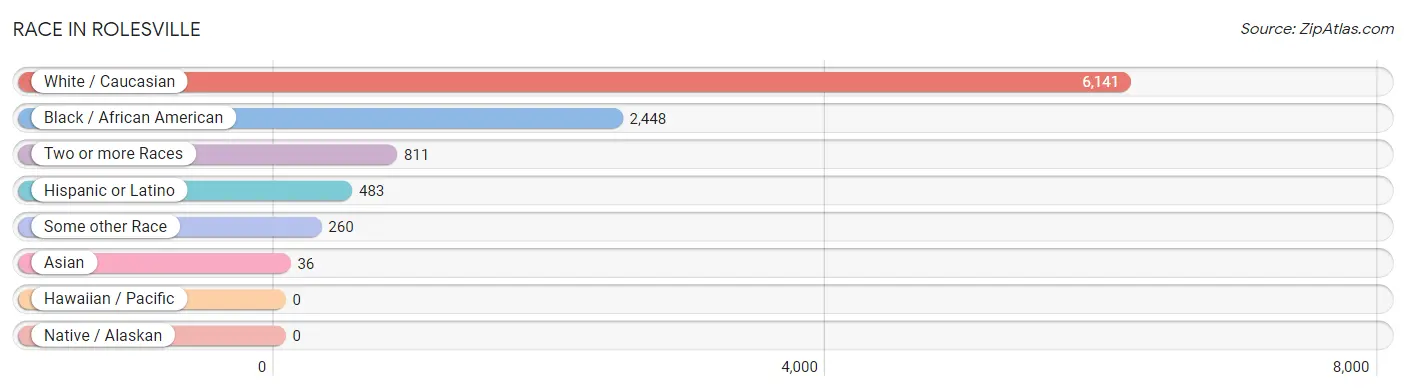
| Race | # Population | % Population |
| Asian | 36 | 0.4% |
| Black / African American | 2,448 | 25.3% |
| Hawaiian / Pacific | 0 | 0.0% |
| Hispanic or Latino | 483 | 5.0% |
| Native / Alaskan | 0 | 0.0% |
| White / Caucasian | 6,141 | 63.3% |
| Two or more Races | 811 | 8.4% |
| Some other Race | 260 | 2.7% |
| Total | 9,696 | 100.0% |
Ancestry in Rolesville
The most populous ancestries reported in Rolesville are German (1,190 | 12.3%), English (1,084 | 11.2%), Subsaharan African (769 | 7.9%), Irish (754 | 7.8%), and African (698 | 7.2%), together accounting for 46.4% of all Rolesville residents.
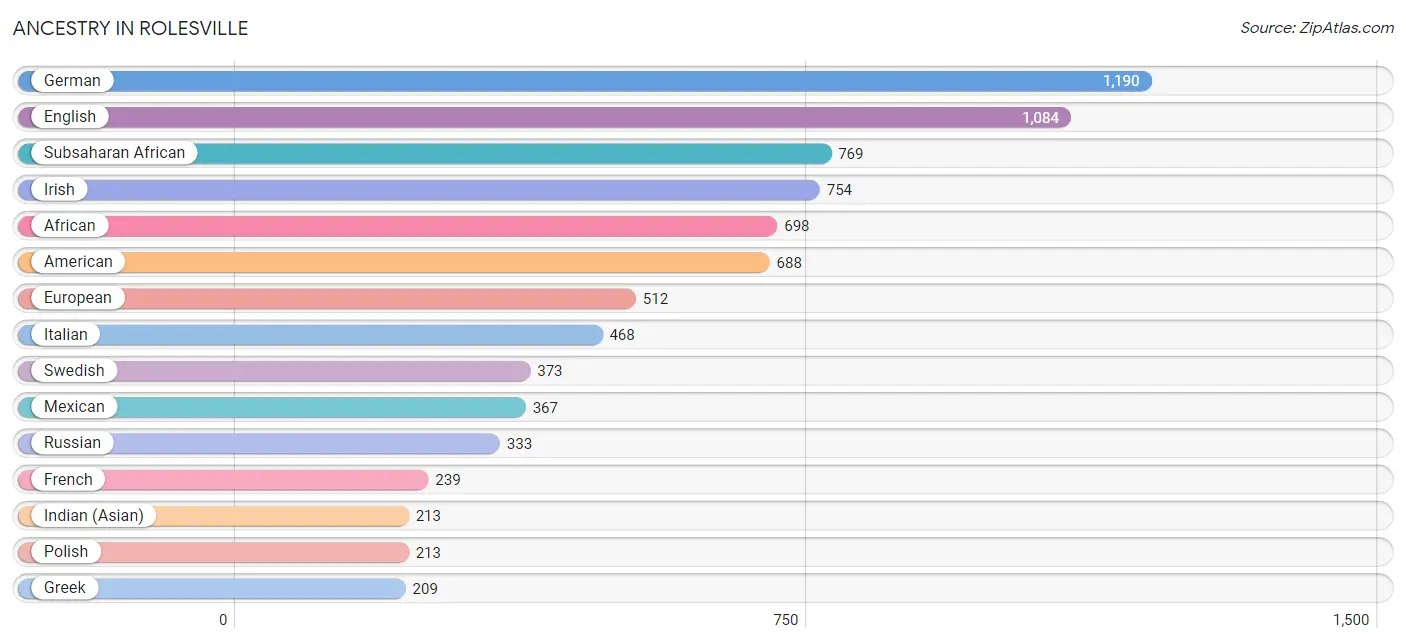
| Ancestry | # Population | % Population |
| African | 698 | 7.2% |
| American | 688 | 7.1% |
| Bhutanese | 42 | 0.4% |
| Canadian | 111 | 1.1% |
| Central American | 32 | 0.3% |
| Central American Indian | 32 | 0.3% |
| Cherokee | 79 | 0.8% |
| Chinese | 39 | 0.4% |
| Croatian | 39 | 0.4% |
| Czech | 129 | 1.3% |
| Dutch | 180 | 1.9% |
| English | 1,084 | 11.2% |
| European | 512 | 5.3% |
| French | 239 | 2.5% |
| German | 1,190 | 12.3% |
| Ghanaian | 71 | 0.7% |
| Greek | 209 | 2.2% |
| Guatemalan | 32 | 0.3% |
| Hungarian | 50 | 0.5% |
| Indian (Asian) | 213 | 2.2% |
| Irish | 754 | 7.8% |
| Italian | 468 | 4.8% |
| Jamaican | 19 | 0.2% |
| Latvian | 8 | 0.1% |
| Mexican | 367 | 3.8% |
| Norwegian | 70 | 0.7% |
| Peruvian | 18 | 0.2% |
| Polish | 213 | 2.2% |
| Portuguese | 85 | 0.9% |
| Puerto Rican | 21 | 0.2% |
| Russian | 333 | 3.4% |
| Scandinavian | 29 | 0.3% |
| Scotch-Irish | 104 | 1.1% |
| Scottish | 112 | 1.2% |
| Slovak | 43 | 0.4% |
| South American | 34 | 0.4% |
| Spaniard | 15 | 0.2% |
| Subsaharan African | 769 | 7.9% |
| Swedish | 373 | 3.8% |
| Thai | 12 | 0.1% |
| Ukrainian | 45 | 0.5% |
| Venezuelan | 16 | 0.2% |
| West Indian | 9 | 0.1% | View All 43 Rows |
Immigrants in Rolesville
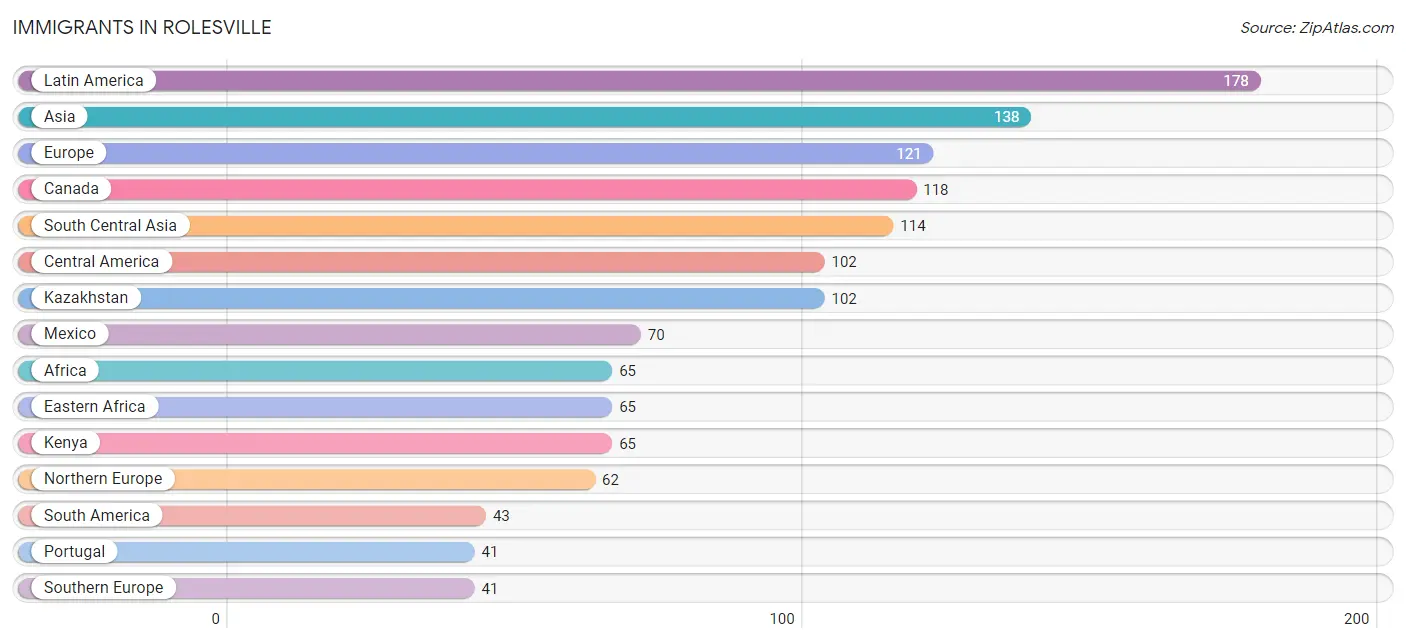
The most numerous immigrant groups reported in Rolesville came from Latin America (178 | 1.8%), Asia (138 | 1.4%), Europe (121 | 1.3%), Canada (118 | 1.2%), and South Central Asia (114 | 1.2%), together accounting for 6.9% of all Rolesville residents.
| Immigration Origin | # Population | % Population |
| Africa | 65 | 0.7% |
| Asia | 138 | 1.4% |
| Canada | 118 | 1.2% |
| Caribbean | 33 | 0.3% |
| Central America | 102 | 1.1% |
| China | 10 | 0.1% |
| Dominican Republic | 14 | 0.1% |
| Eastern Africa | 65 | 0.7% |
| Eastern Asia | 24 | 0.3% |
| Eastern Europe | 16 | 0.2% |
| England | 30 | 0.3% |
| Europe | 121 | 1.3% |
| Germany | 2 | 0.0% |
| Guatemala | 32 | 0.3% |
| Guyana | 9 | 0.1% |
| India | 12 | 0.1% |
| Jamaica | 19 | 0.2% |
| Japan | 14 | 0.1% |
| Kazakhstan | 102 | 1.1% |
| Kenya | 65 | 0.7% |
| Latin America | 178 | 1.8% |
| Mexico | 70 | 0.7% |
| Northern Europe | 62 | 0.6% |
| Peru | 18 | 0.2% |
| Portugal | 41 | 0.4% |
| Russia | 16 | 0.2% |
| South America | 43 | 0.4% |
| South Central Asia | 114 | 1.2% |
| Southern Europe | 41 | 0.4% |
| Sweden | 17 | 0.2% |
| Venezuela | 16 | 0.2% |
| Western Europe | 2 | 0.0% | View All 32 Rows |
Sex and Age in Rolesville
Sex and Age in Rolesville
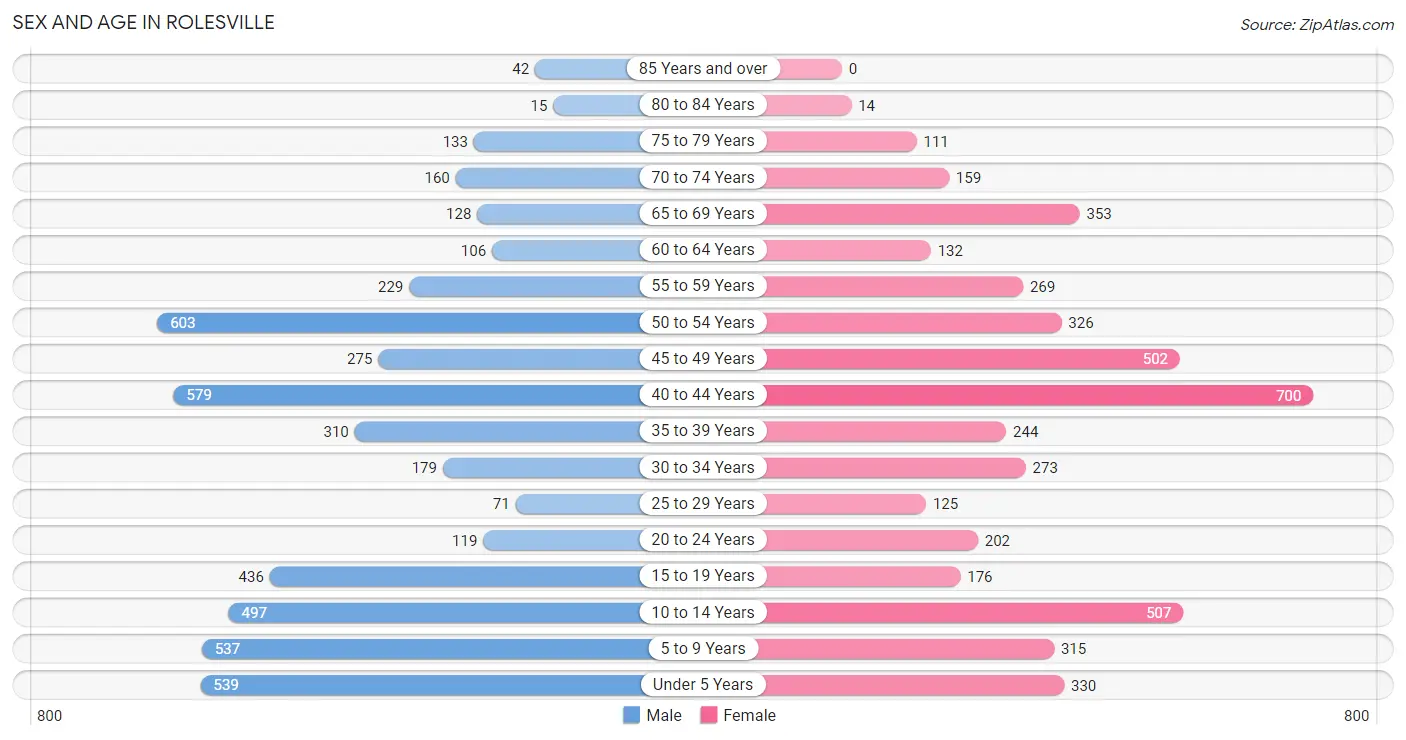
The most populous age groups in Rolesville are 50 to 54 Years (603 | 12.2%) for men and 40 to 44 Years (700 | 14.8%) for women.
| Age Bracket | Male | Female |
| Under 5 Years | 539 (10.9%) | 330 (7.0%) |
| 5 to 9 Years | 537 (10.8%) | 315 (6.7%) |
| 10 to 14 Years | 497 (10.0%) | 507 (10.7%) |
| 15 to 19 Years | 436 (8.8%) | 176 (3.7%) |
| 20 to 24 Years | 119 (2.4%) | 202 (4.3%) |
| 25 to 29 Years | 71 (1.4%) | 125 (2.6%) |
| 30 to 34 Years | 179 (3.6%) | 273 (5.8%) |
| 35 to 39 Years | 310 (6.2%) | 244 (5.1%) |
| 40 to 44 Years | 579 (11.7%) | 700 (14.8%) |
| 45 to 49 Years | 275 (5.6%) | 502 (10.6%) |
| 50 to 54 Years | 603 (12.2%) | 326 (6.9%) |
| 55 to 59 Years | 229 (4.6%) | 269 (5.7%) |
| 60 to 64 Years | 106 (2.1%) | 132 (2.8%) |
| 65 to 69 Years | 128 (2.6%) | 353 (7.4%) |
| 70 to 74 Years | 160 (3.2%) | 159 (3.4%) |
| 75 to 79 Years | 133 (2.7%) | 111 (2.3%) |
| 80 to 84 Years | 15 (0.3%) | 14 (0.3%) |
| 85 Years and over | 42 (0.9%) | 0 (0.0%) |
| Total | 4,958 (100.0%) | 4,738 (100.0%) |
Families and Households in Rolesville
Median Family Size in Rolesville
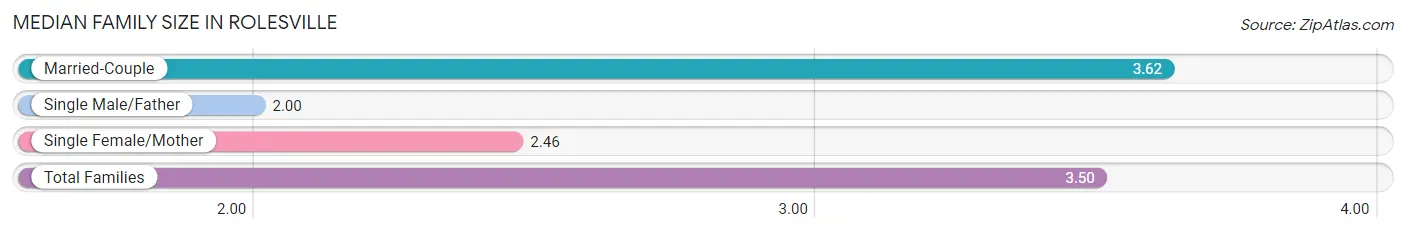
The median family size in Rolesville is 3.50 persons per family, with married-couple families (2,357 | 89.9%) accounting for the largest median family size of 3.62 persons per family. On the other hand, single male/father families (7 | 0.3%) represent the smallest median family size with 2.00 persons per family.
| Family Type | # Families | Family Size |
| Married-Couple | 2,357 (89.9%) | 3.62 |
| Single Male/Father | 7 (0.3%) | 2.00 |
| Single Female/Mother | 257 (9.8%) | 2.46 |
| Total Families | 2,621 (100.0%) | 3.50 |
Median Household Size in Rolesville
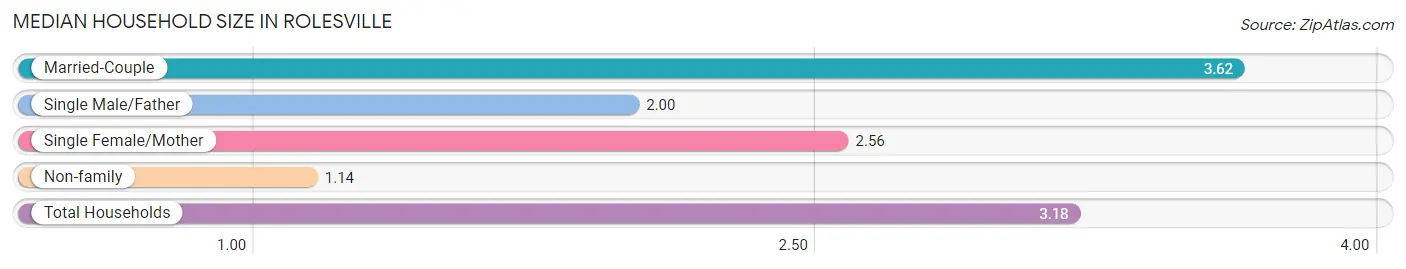
The median household size in Rolesville is 3.18 persons per household, with married-couple households (2,357 | 77.3%) accounting for the largest median household size of 3.62 persons per household. non-family households (426 | 14.0%) represent the smallest median household size with 1.14 persons per household.
| Household Type | # Households | Household Size |
| Married-Couple | 2,357 (77.3%) | 3.62 |
| Single Male/Father | 7 (0.2%) | 2.00 |
| Single Female/Mother | 257 (8.4%) | 2.56 |
| Non-family | 426 (14.0%) | 1.14 |
| Total Households | 3,047 (100.0%) | 3.18 |
Household Size by Marriage Status in Rolesville
Out of a total of 3,047 households in Rolesville, 2,621 (86.0%) are family households, while 426 (14.0%) are nonfamily households. The most numerous type of family households are 4-person households, comprising 876, and the most common type of nonfamily households are 1-person households, comprising 362.
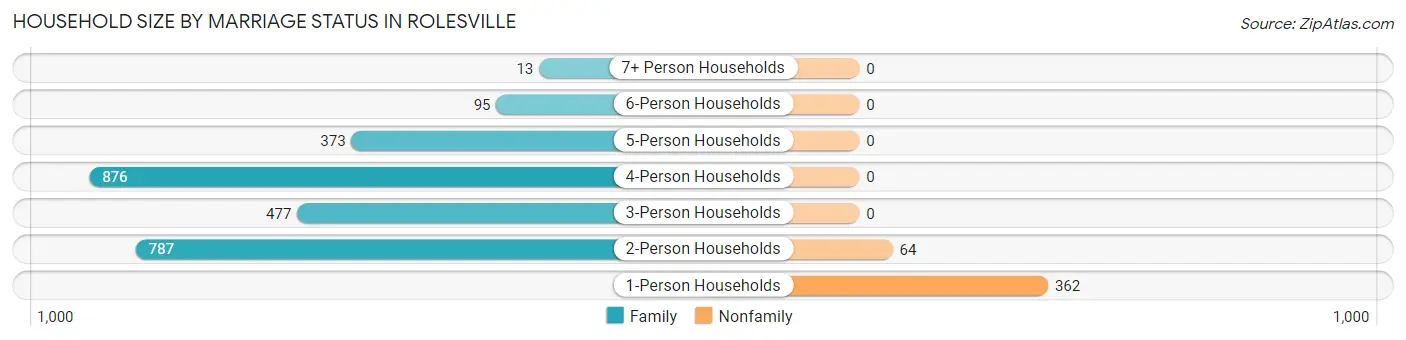
| Household Size | Family Households | Nonfamily Households |
| 1-Person Households | - | 362 (11.9%) |
| 2-Person Households | 787 (25.8%) | 64 (2.1%) |
| 3-Person Households | 477 (15.7%) | 0 (0.0%) |
| 4-Person Households | 876 (28.7%) | 0 (0.0%) |
| 5-Person Households | 373 (12.2%) | 0 (0.0%) |
| 6-Person Households | 95 (3.1%) | 0 (0.0%) |
| 7+ Person Households | 13 (0.4%) | 0 (0.0%) |
| Total | 2,621 (86.0%) | 426 (14.0%) |
Female Fertility in Rolesville
Fertility by Age in Rolesville
Average fertility rate in Rolesville is 32.0 births per 1,000 women. Women in the age bracket of 20 to 34 years have the highest fertility rate with 77.0 births per 1,000 women. Women in the age bracket of 20 to 34 years acount for 63.9% of all women with births.
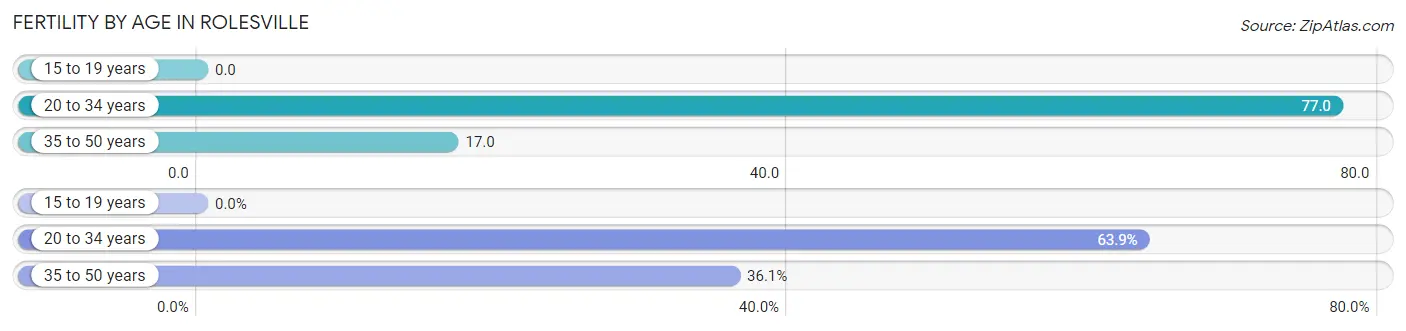
| Age Bracket | Women with Births | Births / 1,000 Women |
| 15 to 19 years | 0 (0.0%) | 0.0 |
| 20 to 34 years | 46 (63.9%) | 77.0 |
| 35 to 50 years | 26 (36.1%) | 17.0 |
| Total | 72 (100.0%) | 32.0 |
Fertility by Age by Marriage Status in Rolesville
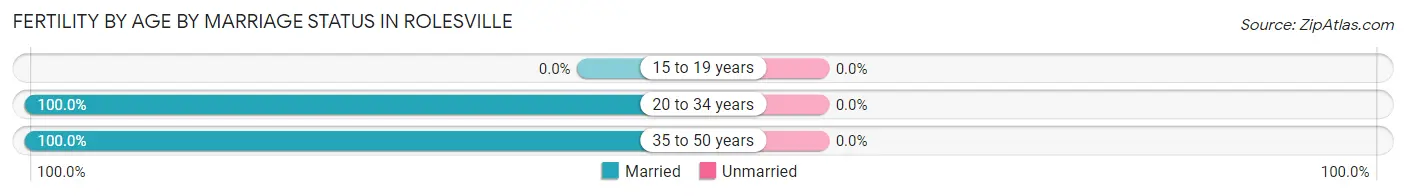
| Age Bracket | Married | Unmarried |
| 15 to 19 years | 0 (0.0%) | 0 (0.0%) |
| 20 to 34 years | 46 (100.0%) | 0 (0.0%) |
| 35 to 50 years | 26 (100.0%) | 0 (0.0%) |
| Total | 72 (100.0%) | 0 (0.0%) |
Fertility by Education in Rolesville
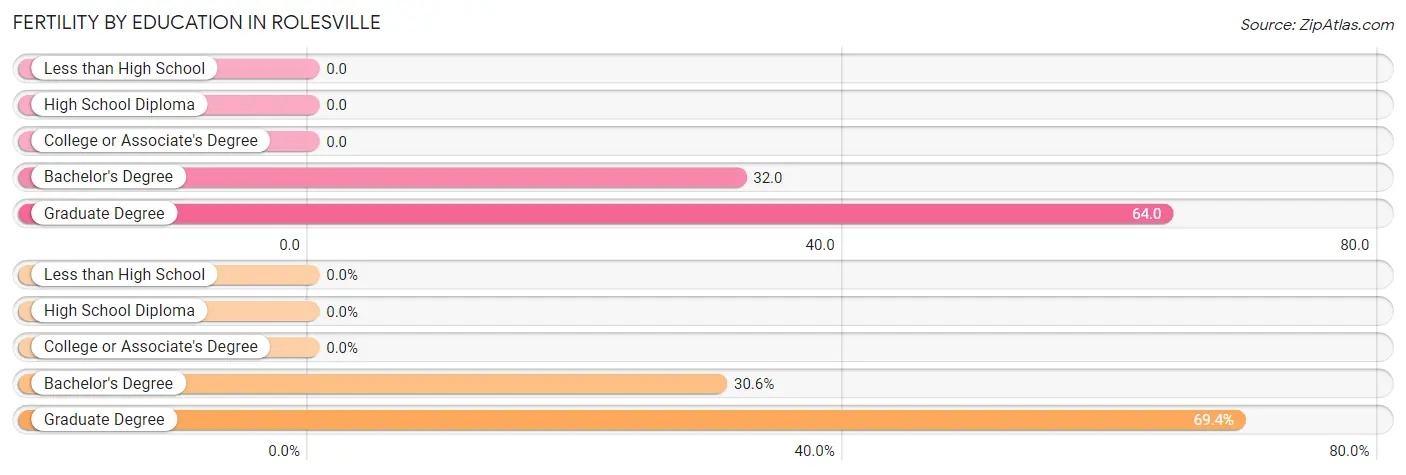
| Educational Attainment | Women with Births | Births / 1,000 Women |
| Less than High School | 0 (0.0%) | 0.0 |
| High School Diploma | 0 (0.0%) | 0.0 |
| College or Associate's Degree | 0 (0.0%) | 0.0 |
| Bachelor's Degree | 22 (30.6%) | 32.0 |
| Graduate Degree | 50 (69.4%) | 64.0 |
| Total | 72 (100.0%) | 32.0 |
Fertility by Education by Marriage Status in Rolesville
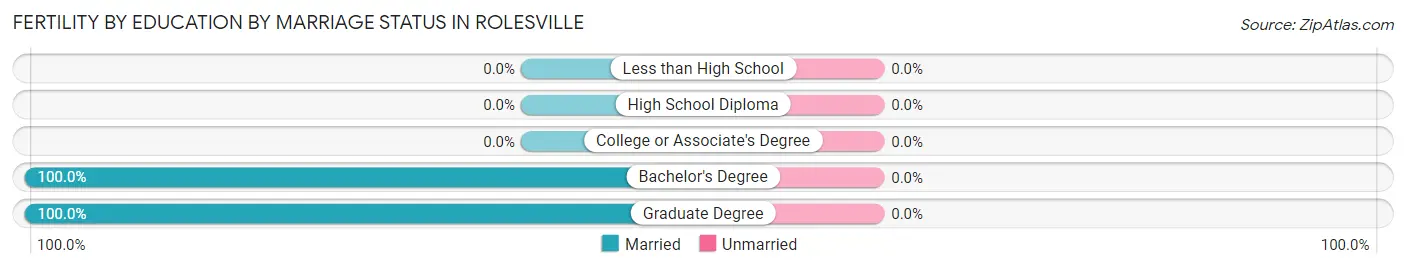
| Educational Attainment | Married | Unmarried |
| Less than High School | 0 (0.0%) | 0 (0.0%) |
| High School Diploma | 0 (0.0%) | 0 (0.0%) |
| College or Associate's Degree | 0 (0.0%) | 0 (0.0%) |
| Bachelor's Degree | 22 (100.0%) | 0 (0.0%) |
| Graduate Degree | 50 (100.0%) | 0 (0.0%) |
| Total | 72 (100.0%) | 0 (0.0%) |
Employment Characteristics in Rolesville
Employment by Class of Employer in Rolesville
Among the 4,337 employed individuals in Rolesville, private company employees (3,077 | 71.0%), not-for-profit organizations (421 | 9.7%), and state government employees (391 | 9.0%) make up the most common classes of employment.

| Employer Class | # Employees | % Employees |
| Private Company Employees | 3,077 | 71.0% |
| Self-Employed (Incorporated) | 112 | 2.6% |
| Self-Employed (Not Incorporated) | 190 | 4.4% |
| Not-for-profit Organizations | 421 | 9.7% |
| Local Government Employees | 82 | 1.9% |
| State Government Employees | 391 | 9.0% |
| Federal Government Employees | 64 | 1.5% |
| Unpaid Family Workers | 0 | 0.0% |
| Total | 4,337 | 100.0% |
Employment Status by Age in Rolesville
According to the labor force statistics for Rolesville, out of the total population over 16 years of age (6,742), 67.7% or 4,564 individuals are in the labor force, with 3.7% or 169 of them unemployed. The age group with the highest labor force participation rate is 30 to 34 years, with 94.7% or 428 individuals in the labor force. Within the labor force, the 65 to 74 years age range has the highest percentage of unemployed individuals, with 21.9% or 42 of them being unemployed.
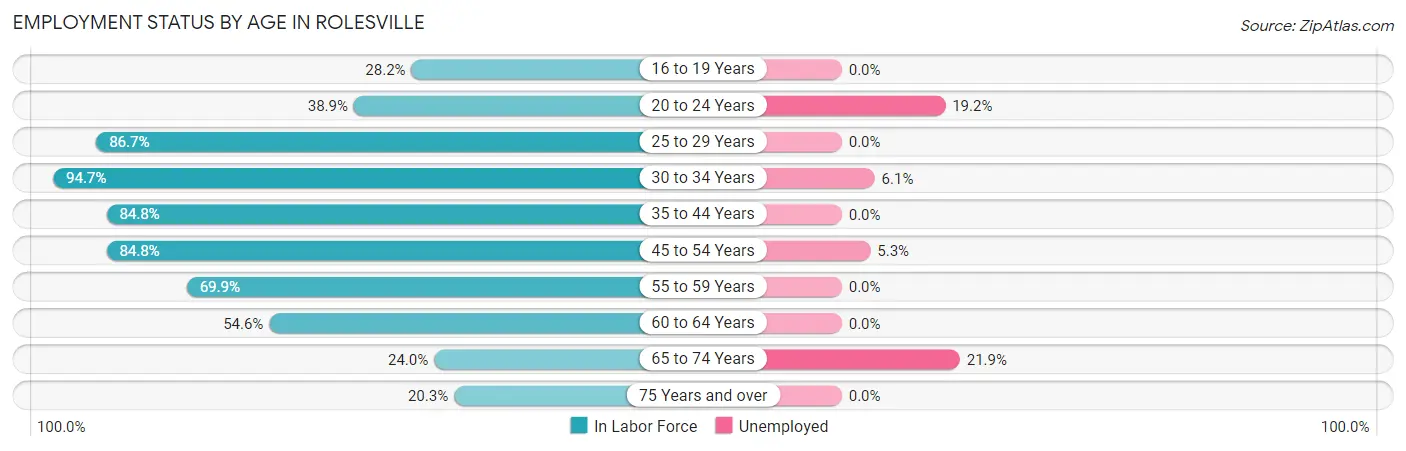
| Age Bracket | In Labor Force | Unemployed |
| 16 to 19 Years | 108 (28.2%) | 0 (0.0%) |
| 20 to 24 Years | 125 (38.9%) | 24 (19.2%) |
| 25 to 29 Years | 170 (86.7%) | 0 (0.0%) |
| 30 to 34 Years | 428 (94.7%) | 26 (6.1%) |
| 35 to 44 Years | 1,554 (84.8%) | 0 (0.0%) |
| 45 to 54 Years | 1,447 (84.8%) | 77 (5.3%) |
| 55 to 59 Years | 348 (69.9%) | 0 (0.0%) |
| 60 to 64 Years | 130 (54.6%) | 0 (0.0%) |
| 65 to 74 Years | 192 (24.0%) | 42 (21.9%) |
| 75 Years and over | 64 (20.3%) | 0 (0.0%) |
| Total | 4,564 (67.7%) | 169 (3.7%) |
Employment Status by Educational Attainment in Rolesville
According to labor force statistics for Rolesville, 82.8% of individuals (4,076) out of the total population between 25 and 64 years of age (4,923) are in the labor force, with 2.5% or 102 of them being unemployed. The group with the highest labor force participation rate are those with the educational attainment of bachelor's degree or higher, with 87.4% or 3,155 individuals in the labor force. Within the labor force, individuals with college / associate degree education have the highest percentage of unemployment, with 3.6% or 26 of them being unemployed.
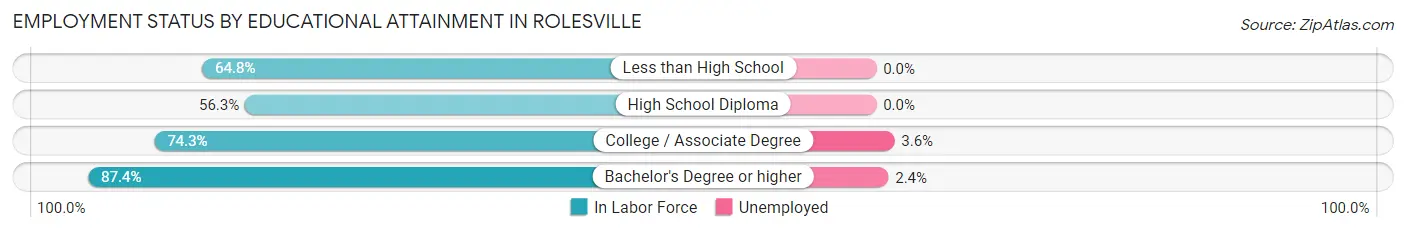
| Educational Attainment | In Labor Force | Unemployed |
| Less than High School | 35 (64.8%) | 0 (0.0%) |
| High School Diploma | 156 (56.3%) | 0 (0.0%) |
| College / Associate Degree | 730 (74.3%) | 35 (3.6%) |
| Bachelor's Degree or higher | 3,155 (87.4%) | 87 (2.4%) |
| Total | 4,076 (82.8%) | 123 (2.5%) |
Employment Occupations by Sex in Rolesville
Management, Business, Science and Arts Occupations
The most common Management, Business, Science and Arts occupations in Rolesville are Management (838 | 19.1%), Computers, Engineering & Science (806 | 18.3%), Community & Social Service (540 | 12.3%), Computers & Mathematics (431 | 9.8%), and Business & Financial (367 | 8.3%).
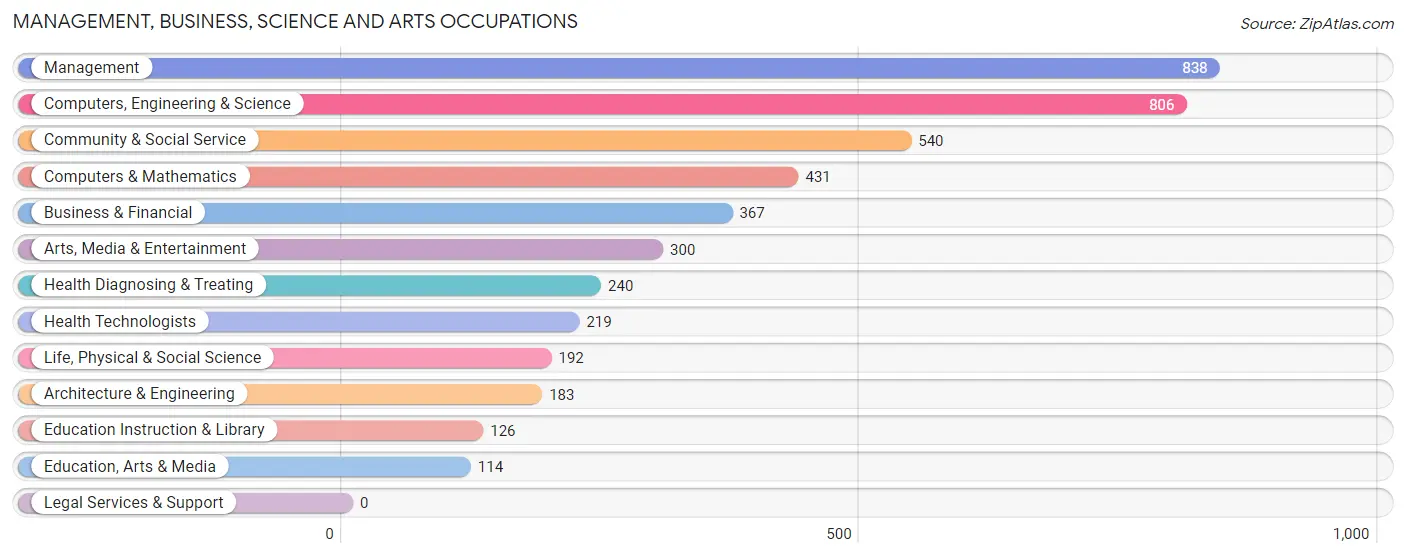
Management, Business, Science and Arts Occupations by Sex
Within the Management, Business, Science and Arts occupations in Rolesville, the most male-oriented occupations are Computers & Mathematics (86.8%), Computers, Engineering & Science (68.9%), and Life, Physical & Social Science (59.4%), while the most female-oriented occupations are Education Instruction & Library (74.6%), Business & Financial (74.1%), and Health Technologists (68.0%).
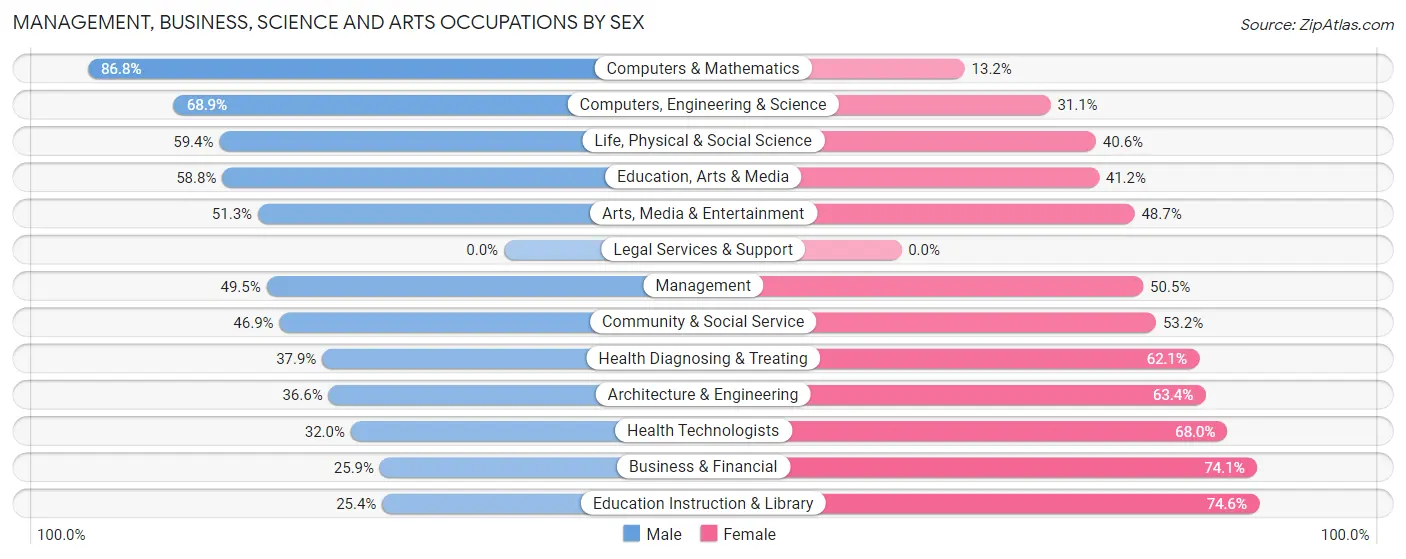
| Occupation | Male | Female |
| Management | 415 (49.5%) | 423 (50.5%) |
| Business & Financial | 95 (25.9%) | 272 (74.1%) |
| Computers, Engineering & Science | 555 (68.9%) | 251 (31.1%) |
| Computers & Mathematics | 374 (86.8%) | 57 (13.2%) |
| Architecture & Engineering | 67 (36.6%) | 116 (63.4%) |
| Life, Physical & Social Science | 114 (59.4%) | 78 (40.6%) |
| Community & Social Service | 253 (46.9%) | 287 (53.1%) |
| Education, Arts & Media | 67 (58.8%) | 47 (41.2%) |
| Legal Services & Support | 0 (0.0%) | 0 (0.0%) |
| Education Instruction & Library | 32 (25.4%) | 94 (74.6%) |
| Arts, Media & Entertainment | 154 (51.3%) | 146 (48.7%) |
| Health Diagnosing & Treating | 91 (37.9%) | 149 (62.1%) |
| Health Technologists | 70 (32.0%) | 149 (68.0%) |
| Total (Category) | 1,409 (50.5%) | 1,382 (49.5%) |
| Total (Overall) | 2,416 (54.9%) | 1,982 (45.1%) |
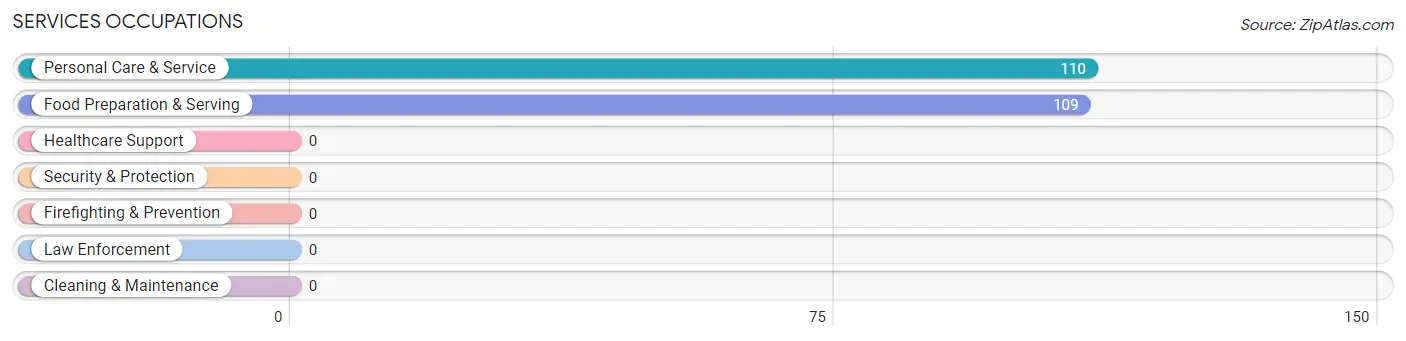
Services Occupations
The most common Services occupations in Rolesville are Personal Care & Service (110 | 2.5%), and Food Preparation & Serving (109 | 2.5%).
Services Occupations by Sex
Within the Services occupations in Rolesville, the most male-oriented occupations are Food Preparation & Serving (83.5%), and Personal Care & Service (60.9%), while the most female-oriented occupations are Personal Care & Service (39.1%), and Food Preparation & Serving (16.5%).
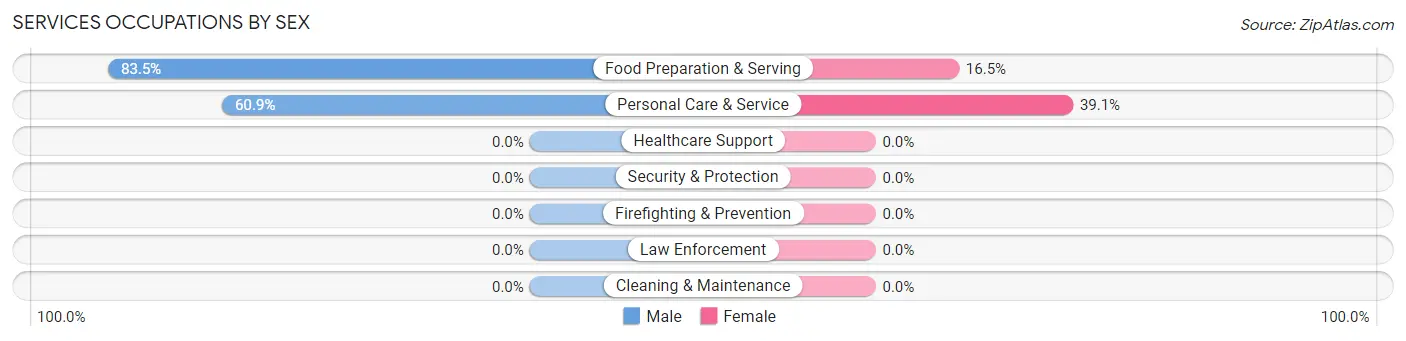
| Occupation | Male | Female |
| Healthcare Support | 0 (0.0%) | 0 (0.0%) |
| Security & Protection | 0 (0.0%) | 0 (0.0%) |
| Firefighting & Prevention | 0 (0.0%) | 0 (0.0%) |
| Law Enforcement | 0 (0.0%) | 0 (0.0%) |
| Food Preparation & Serving | 91 (83.5%) | 18 (16.5%) |
| Cleaning & Maintenance | 0 (0.0%) | 0 (0.0%) |
| Personal Care & Service | 67 (60.9%) | 43 (39.1%) |
| Total (Category) | 158 (72.2%) | 61 (27.9%) |
| Total (Overall) | 2,416 (54.9%) | 1,982 (45.1%) |
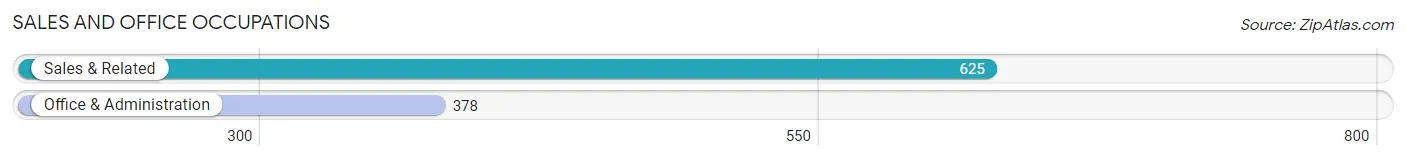
Sales and Office Occupations
The most common Sales and Office occupations in Rolesville are Sales & Related (625 | 14.2%), and Office & Administration (378 | 8.6%).
Sales and Office Occupations by Sex
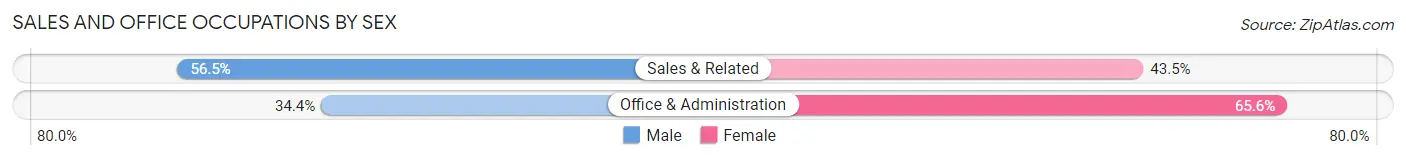
| Occupation | Male | Female |
| Sales & Related | 353 (56.5%) | 272 (43.5%) |
| Office & Administration | 130 (34.4%) | 248 (65.6%) |
| Total (Category) | 483 (48.2%) | 520 (51.8%) |
| Total (Overall) | 2,416 (54.9%) | 1,982 (45.1%) |
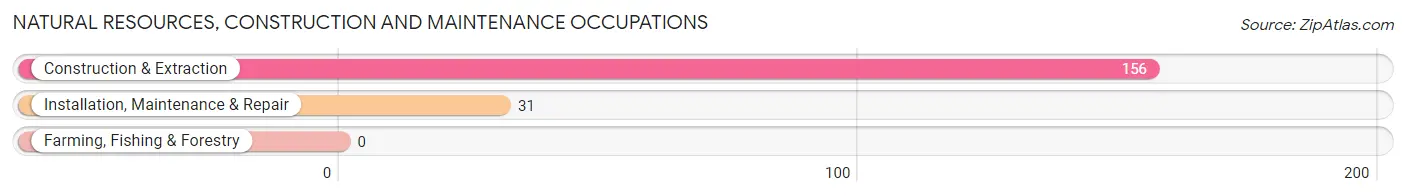
Natural Resources, Construction and Maintenance Occupations
The most common Natural Resources, Construction and Maintenance occupations in Rolesville are Construction & Extraction (156 | 3.5%), and Installation, Maintenance & Repair (31 | 0.7%).
Natural Resources, Construction and Maintenance Occupations by Sex
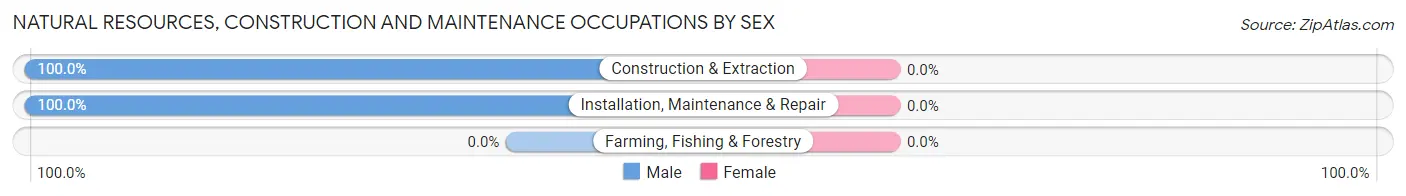
| Occupation | Male | Female |
| Farming, Fishing & Forestry | 0 (0.0%) | 0 (0.0%) |
| Construction & Extraction | 156 (100.0%) | 0 (0.0%) |
| Installation, Maintenance & Repair | 31 (100.0%) | 0 (0.0%) |
| Total (Category) | 187 (100.0%) | 0 (0.0%) |
| Total (Overall) | 2,416 (54.9%) | 1,982 (45.1%) |
Production, Transportation and Moving Occupations
The most common Production, Transportation and Moving occupations in Rolesville are Transportation (91 | 2.1%), Production (90 | 2.1%), and Material Moving (17 | 0.4%).
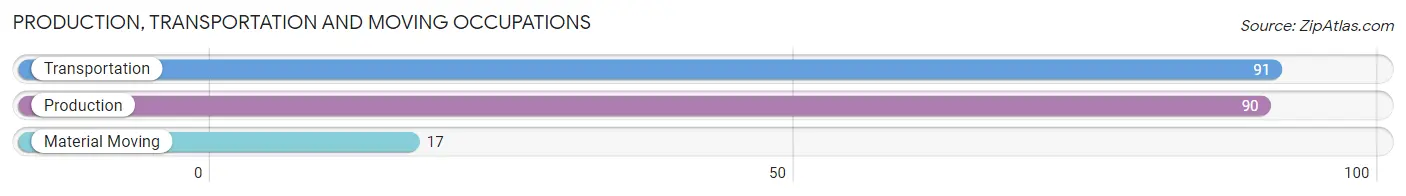
Production, Transportation and Moving Occupations by Sex
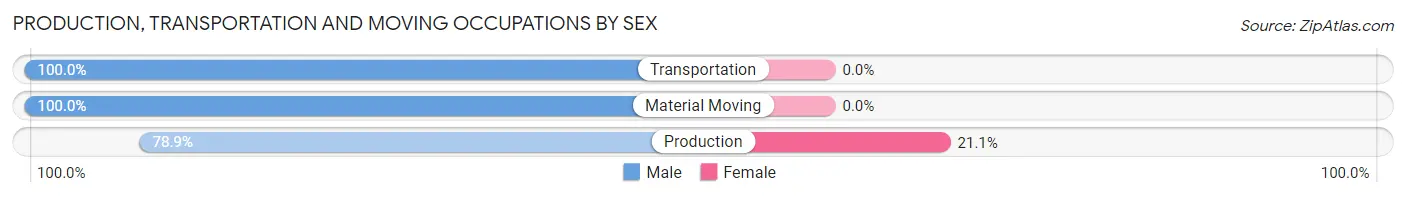
| Occupation | Male | Female |
| Production | 71 (78.9%) | 19 (21.1%) |
| Transportation | 91 (100.0%) | 0 (0.0%) |
| Material Moving | 17 (100.0%) | 0 (0.0%) |
| Total (Category) | 179 (90.4%) | 19 (9.6%) |
| Total (Overall) | 2,416 (54.9%) | 1,982 (45.1%) |
Employment Industries by Sex in Rolesville
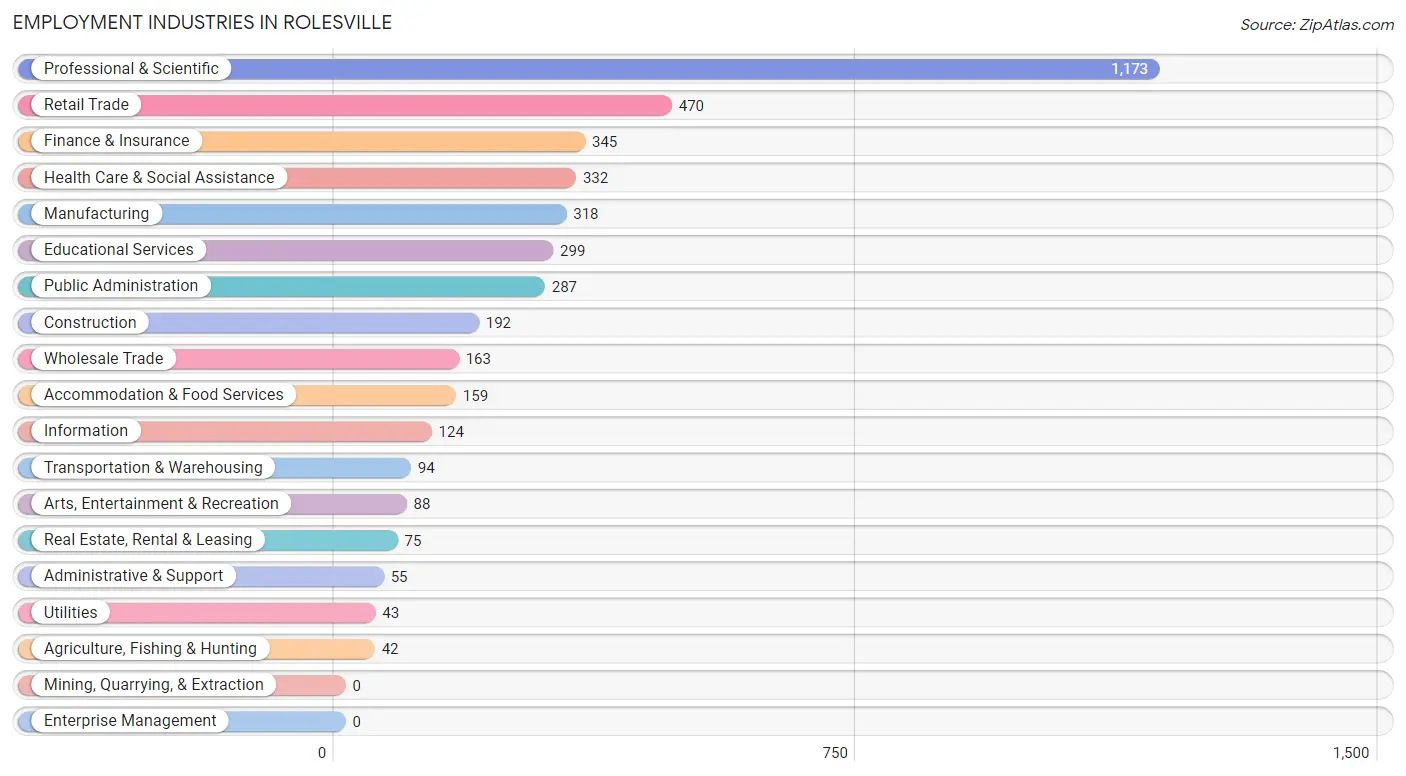
Employment Industries in Rolesville
The major employment industries in Rolesville include Professional & Scientific (1,173 | 26.7%), Retail Trade (470 | 10.7%), Finance & Insurance (345 | 7.8%), Health Care & Social Assistance (332 | 7.5%), and Manufacturing (318 | 7.2%).
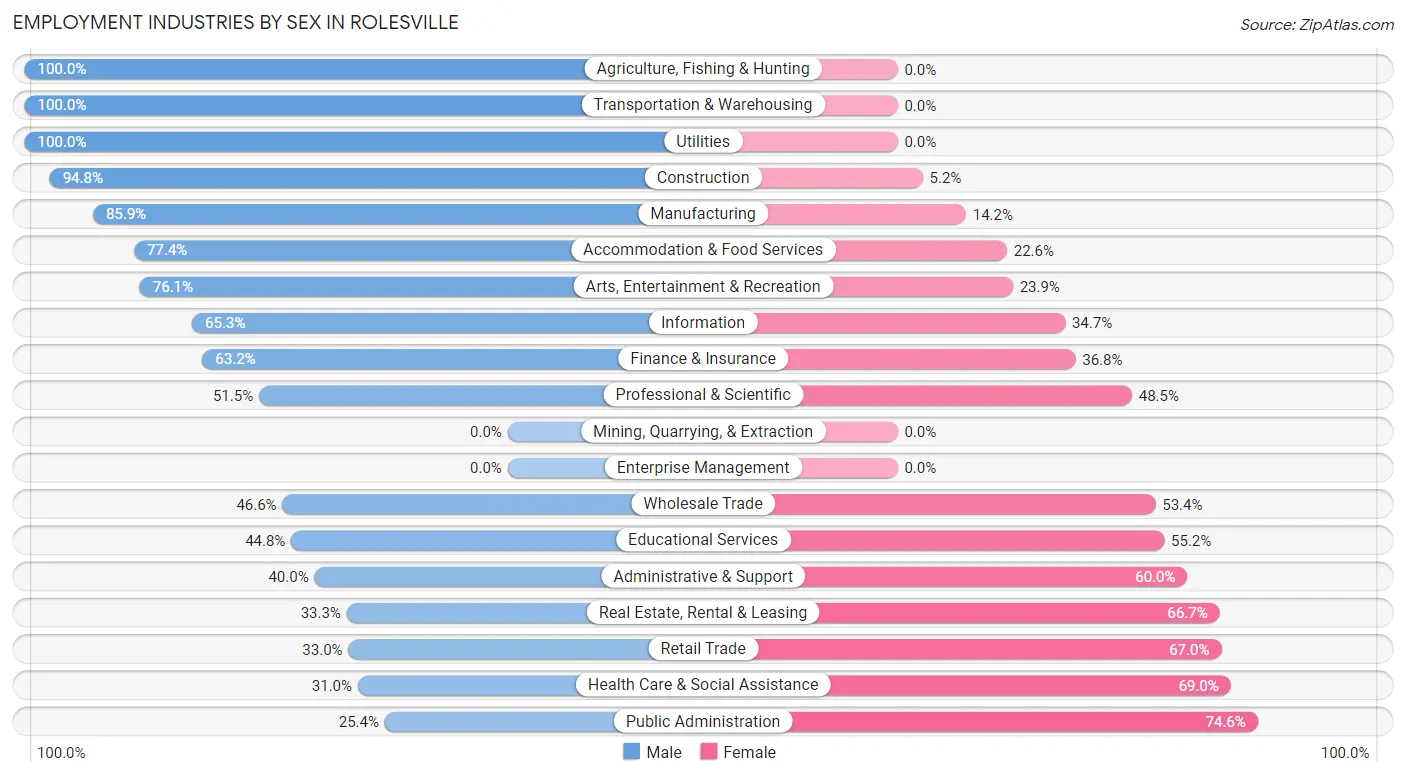
Employment Industries by Sex in Rolesville
The Rolesville industries that see more men than women are Agriculture, Fishing & Hunting (100.0%), Transportation & Warehousing (100.0%), and Utilities (100.0%), whereas the industries that tend to have a higher number of women are Public Administration (74.6%), Health Care & Social Assistance (69.0%), and Retail Trade (67.0%).
| Industry | Male | Female |
| Agriculture, Fishing & Hunting | 42 (100.0%) | 0 (0.0%) |
| Mining, Quarrying, & Extraction | 0 (0.0%) | 0 (0.0%) |
| Construction | 182 (94.8%) | 10 (5.2%) |
| Manufacturing | 273 (85.9%) | 45 (14.1%) |
| Wholesale Trade | 76 (46.6%) | 87 (53.4%) |
| Retail Trade | 155 (33.0%) | 315 (67.0%) |
| Transportation & Warehousing | 94 (100.0%) | 0 (0.0%) |
| Utilities | 43 (100.0%) | 0 (0.0%) |
| Information | 81 (65.3%) | 43 (34.7%) |
| Finance & Insurance | 218 (63.2%) | 127 (36.8%) |
| Real Estate, Rental & Leasing | 25 (33.3%) | 50 (66.7%) |
| Professional & Scientific | 604 (51.5%) | 569 (48.5%) |
| Enterprise Management | 0 (0.0%) | 0 (0.0%) |
| Administrative & Support | 22 (40.0%) | 33 (60.0%) |
| Educational Services | 134 (44.8%) | 165 (55.2%) |
| Health Care & Social Assistance | 103 (31.0%) | 229 (69.0%) |
| Arts, Entertainment & Recreation | 67 (76.1%) | 21 (23.9%) |
| Accommodation & Food Services | 123 (77.4%) | 36 (22.6%) |
| Public Administration | 73 (25.4%) | 214 (74.6%) |
| Total | 2,416 (54.9%) | 1,982 (45.1%) |
Education in Rolesville
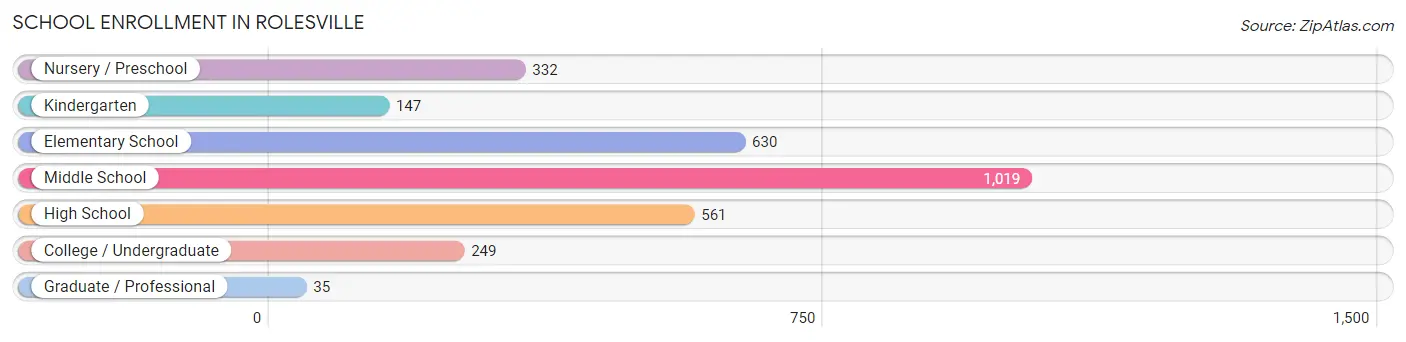
School Enrollment in Rolesville
The most common levels of schooling among the 2,973 students in Rolesville are middle school (1,019 | 34.3%), elementary school (630 | 21.2%), and high school (561 | 18.9%).
| School Level | # Students | % Students |
| Nursery / Preschool | 332 | 11.2% |
| Kindergarten | 147 | 4.9% |
| Elementary School | 630 | 21.2% |
| Middle School | 1,019 | 34.3% |
| High School | 561 | 18.9% |
| College / Undergraduate | 249 | 8.4% |
| Graduate / Professional | 35 | 1.2% |
| Total | 2,973 | 100.0% |
School Enrollment by Age by Funding Source in Rolesville
Out of a total of 2,973 students who are enrolled in schools in Rolesville, 993 (33.4%) attend a private institution, while the remaining 1,980 (66.6%) are enrolled in public schools. The age group of 3 to 4 year olds has the highest likelihood of being enrolled in private schools, with 281 (91.8% in the age bracket) enrolled. Conversely, the age group of 18 to 19 year olds has the lowest likelihood of being enrolled in a private school, with 144 (100.0% in the age bracket) attending a public institution.
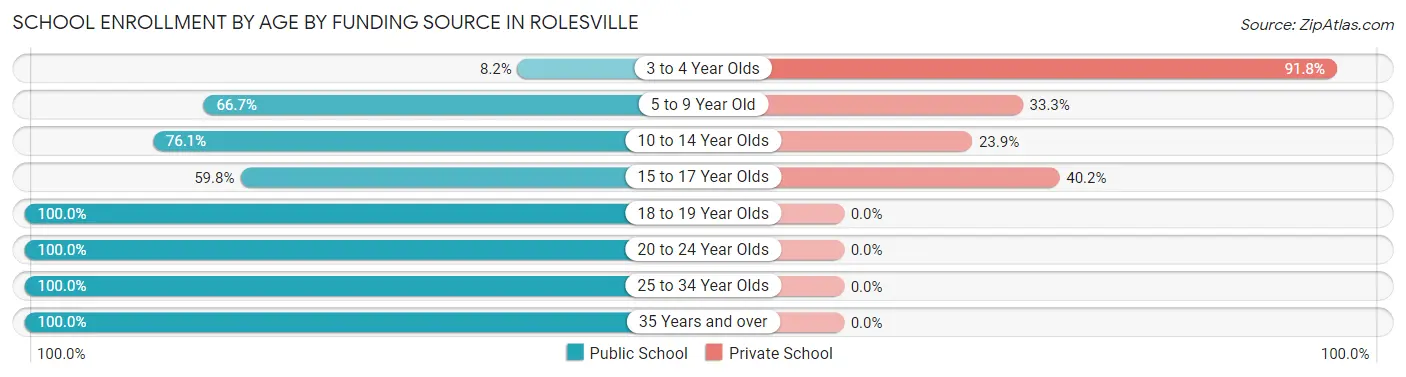
| Age Bracket | Public School | Private School |
| 3 to 4 Year Olds | 25 (8.2%) | 281 (91.8%) |
| 5 to 9 Year Old | 568 (66.7%) | 284 (33.3%) |
| 10 to 14 Year Olds | 764 (76.1%) | 240 (23.9%) |
| 15 to 17 Year Olds | 280 (59.8%) | 188 (40.2%) |
| 18 to 19 Year Olds | 144 (100.0%) | 0 (0.0%) |
| 20 to 24 Year Olds | 159 (100.0%) | 0 (0.0%) |
| 25 to 34 Year Olds | 19 (100.0%) | 0 (0.0%) |
| 35 Years and over | 21 (100.0%) | 0 (0.0%) |
| Total | 1,980 (66.6%) | 993 (33.4%) |
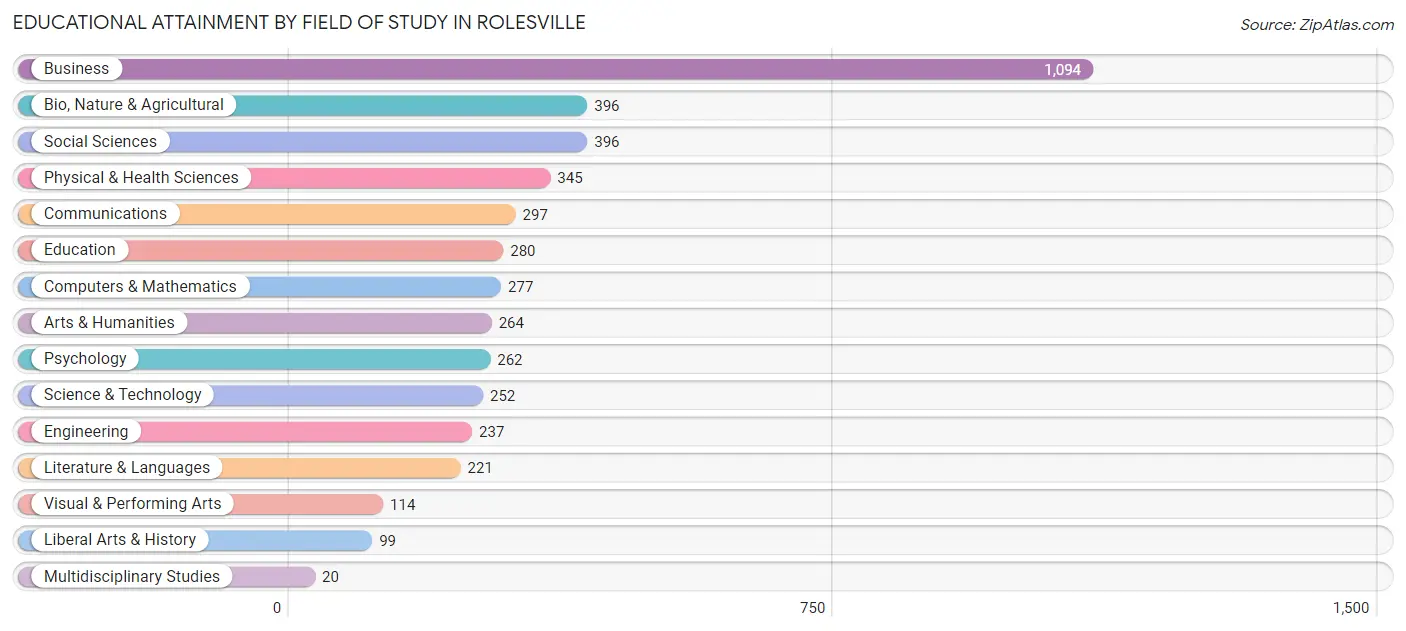
Educational Attainment by Field of Study in Rolesville
Business (1,094 | 24.0%), bio, nature & agricultural (396 | 8.7%), social sciences (396 | 8.7%), physical & health sciences (345 | 7.6%), and communications (297 | 6.5%) are the most common fields of study among 4,554 individuals in Rolesville who have obtained a bachelor's degree or higher.
| Field of Study | # Graduates | % Graduates |
| Computers & Mathematics | 277 | 6.1% |
| Bio, Nature & Agricultural | 396 | 8.7% |
| Physical & Health Sciences | 345 | 7.6% |
| Psychology | 262 | 5.8% |
| Social Sciences | 396 | 8.7% |
| Engineering | 237 | 5.2% |
| Multidisciplinary Studies | 20 | 0.4% |
| Science & Technology | 252 | 5.5% |
| Business | 1,094 | 24.0% |
| Education | 280 | 6.1% |
| Literature & Languages | 221 | 4.9% |
| Liberal Arts & History | 99 | 2.2% |
| Visual & Performing Arts | 114 | 2.5% |
| Communications | 297 | 6.5% |
| Arts & Humanities | 264 | 5.8% |
| Total | 4,554 | 100.0% |
Transportation & Commute in Rolesville
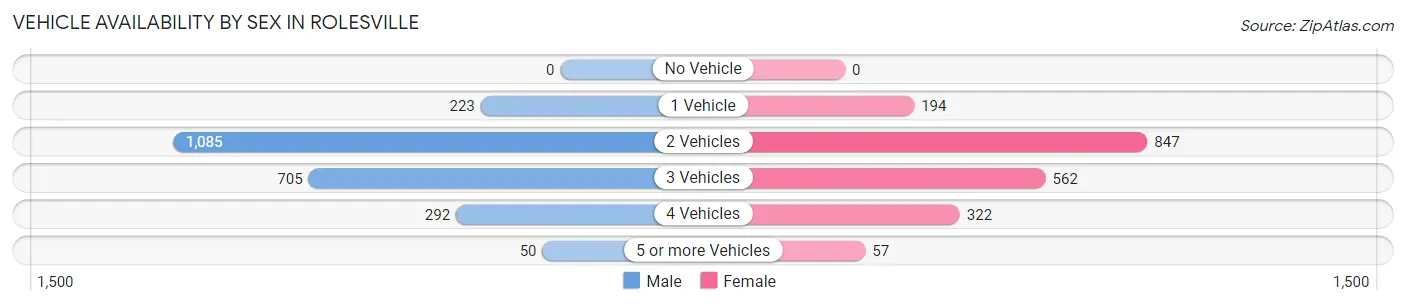
Vehicle Availability by Sex in Rolesville
The most prevalent vehicle ownership categories in Rolesville are males with 2 vehicles (1,085, accounting for 46.1%) and females with 2 vehicles (847, making up 54.7%).
| Vehicles Available | Male | Female |
| No Vehicle | 0 (0.0%) | 0 (0.0%) |
| 1 Vehicle | 223 (9.5%) | 194 (9.8%) |
| 2 Vehicles | 1,085 (46.1%) | 847 (42.7%) |
| 3 Vehicles | 705 (29.9%) | 562 (28.4%) |
| 4 Vehicles | 292 (12.4%) | 322 (16.3%) |
| 5 or more Vehicles | 50 (2.1%) | 57 (2.9%) |
| Total | 2,355 (100.0%) | 1,982 (100.0%) |
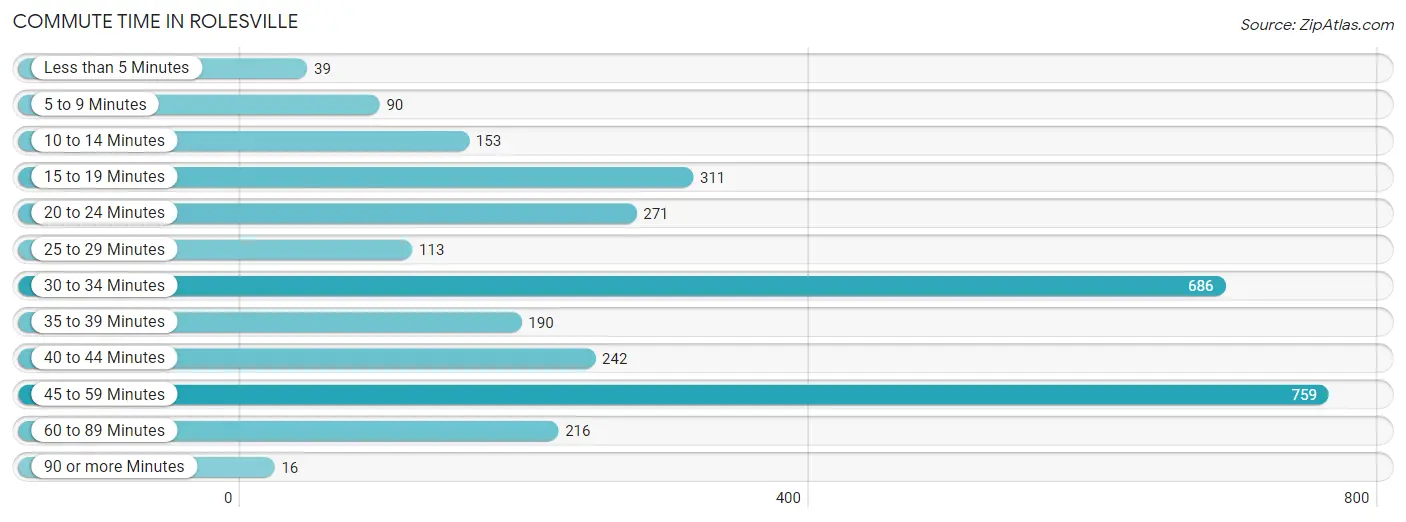
Commute Time in Rolesville
The most frequently occuring commute durations in Rolesville are 45 to 59 minutes (759 commuters, 24.6%), 30 to 34 minutes (686 commuters, 22.2%), and 15 to 19 minutes (311 commuters, 10.1%).
| Commute Time | # Commuters | % Commuters |
| Less than 5 Minutes | 39 | 1.3% |
| 5 to 9 Minutes | 90 | 2.9% |
| 10 to 14 Minutes | 153 | 5.0% |
| 15 to 19 Minutes | 311 | 10.1% |
| 20 to 24 Minutes | 271 | 8.8% |
| 25 to 29 Minutes | 113 | 3.7% |
| 30 to 34 Minutes | 686 | 22.2% |
| 35 to 39 Minutes | 190 | 6.2% |
| 40 to 44 Minutes | 242 | 7.8% |
| 45 to 59 Minutes | 759 | 24.6% |
| 60 to 89 Minutes | 216 | 7.0% |
| 90 or more Minutes | 16 | 0.5% |
Commute Time by Sex in Rolesville
The most common commute times in Rolesville are 45 to 59 minutes (446 commuters, 26.6%) for males and 30 to 34 minutes (353 commuters, 25.0%) for females.
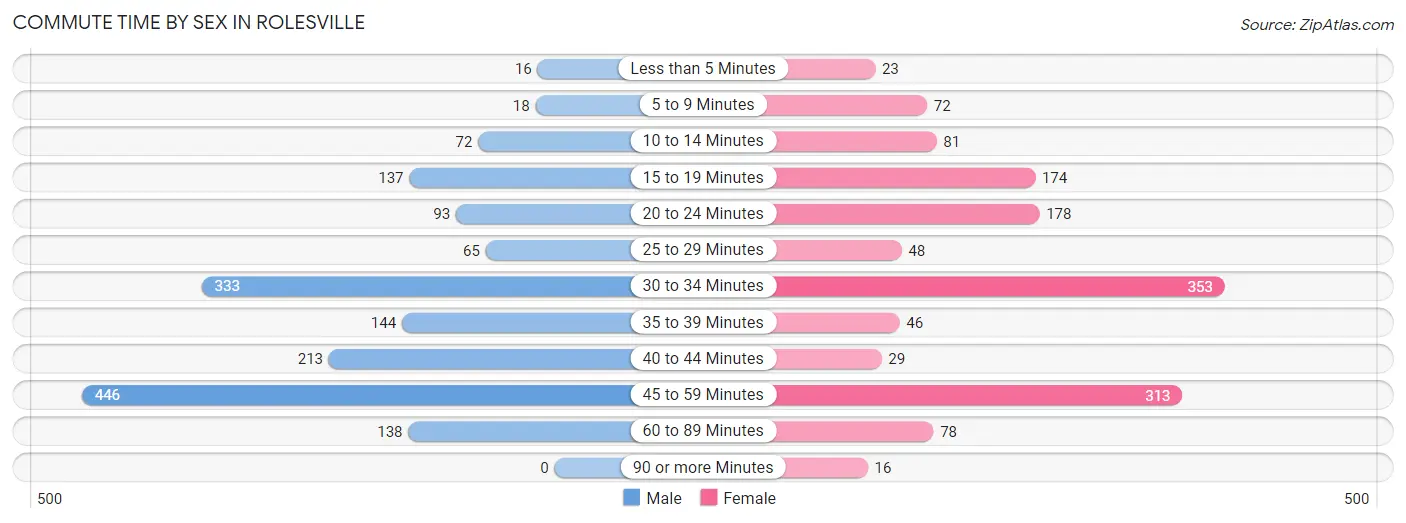
| Commute Time | Male | Female |
| Less than 5 Minutes | 16 (1.0%) | 23 (1.6%) |
| 5 to 9 Minutes | 18 (1.1%) | 72 (5.1%) |
| 10 to 14 Minutes | 72 (4.3%) | 81 (5.7%) |
| 15 to 19 Minutes | 137 (8.2%) | 174 (12.3%) |
| 20 to 24 Minutes | 93 (5.6%) | 178 (12.6%) |
| 25 to 29 Minutes | 65 (3.9%) | 48 (3.4%) |
| 30 to 34 Minutes | 333 (19.9%) | 353 (25.0%) |
| 35 to 39 Minutes | 144 (8.6%) | 46 (3.3%) |
| 40 to 44 Minutes | 213 (12.7%) | 29 (2.1%) |
| 45 to 59 Minutes | 446 (26.6%) | 313 (22.2%) |
| 60 to 89 Minutes | 138 (8.2%) | 78 (5.5%) |
| 90 or more Minutes | 0 (0.0%) | 16 (1.1%) |
Time of Departure to Work by Sex in Rolesville
The most frequent times of departure to work in Rolesville are 7:00 AM to 7:29 AM (398, 23.8%) for males and 7:30 AM to 7:59 AM (312, 22.1%) for females.
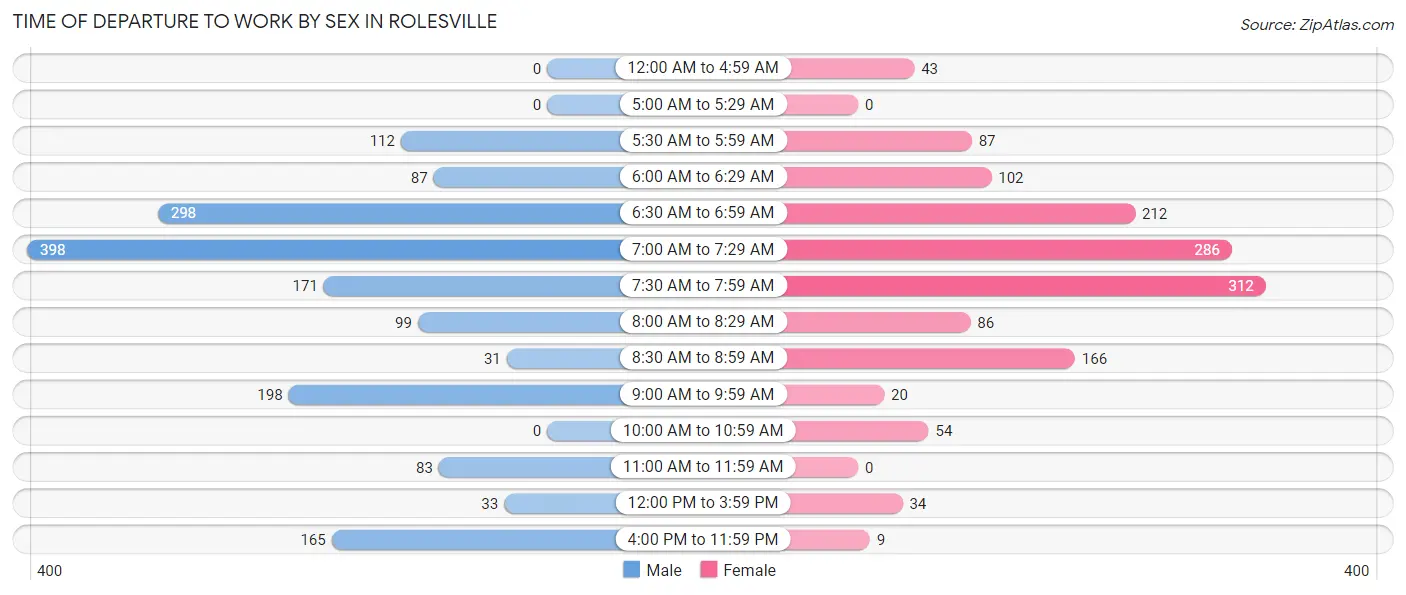
| Time of Departure | Male | Female |
| 12:00 AM to 4:59 AM | 0 (0.0%) | 43 (3.0%) |
| 5:00 AM to 5:29 AM | 0 (0.0%) | 0 (0.0%) |
| 5:30 AM to 5:59 AM | 112 (6.7%) | 87 (6.2%) |
| 6:00 AM to 6:29 AM | 87 (5.2%) | 102 (7.2%) |
| 6:30 AM to 6:59 AM | 298 (17.8%) | 212 (15.0%) |
| 7:00 AM to 7:29 AM | 398 (23.8%) | 286 (20.3%) |
| 7:30 AM to 7:59 AM | 171 (10.2%) | 312 (22.1%) |
| 8:00 AM to 8:29 AM | 99 (5.9%) | 86 (6.1%) |
| 8:30 AM to 8:59 AM | 31 (1.8%) | 166 (11.8%) |
| 9:00 AM to 9:59 AM | 198 (11.8%) | 20 (1.4%) |
| 10:00 AM to 10:59 AM | 0 (0.0%) | 54 (3.8%) |
| 11:00 AM to 11:59 AM | 83 (5.0%) | 0 (0.0%) |
| 12:00 PM to 3:59 PM | 33 (2.0%) | 34 (2.4%) |
| 4:00 PM to 11:59 PM | 165 (9.9%) | 9 (0.6%) |
| Total | 1,675 (100.0%) | 1,411 (100.0%) |
Housing Occupancy in Rolesville
Occupancy by Ownership in Rolesville
Of the total 3,047 dwellings in Rolesville, owner-occupied units account for 2,777 (91.1%), while renter-occupied units make up 270 (8.9%).
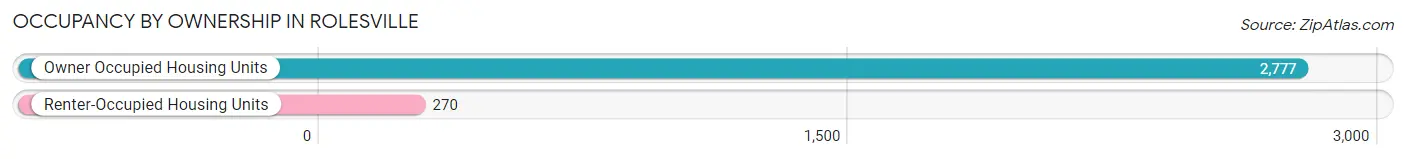
| Occupancy | # Housing Units | % Housing Units |
| Owner Occupied Housing Units | 2,777 | 91.1% |
| Renter-Occupied Housing Units | 270 | 8.9% |
| Total Occupied Housing Units | 3,047 | 100.0% |
Occupancy by Household Size in Rolesville
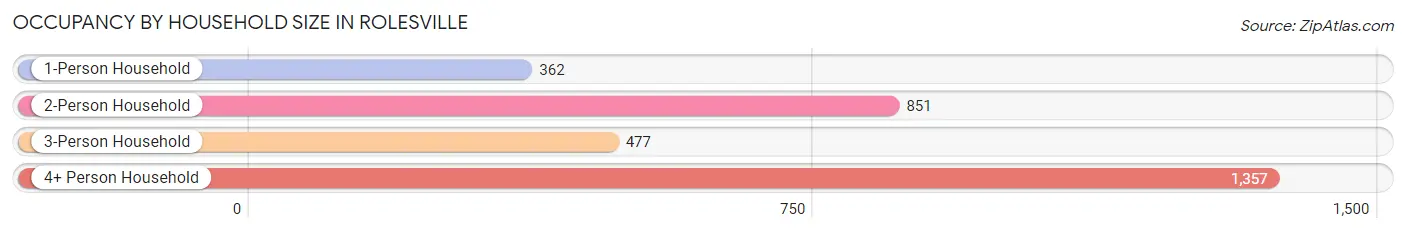
| Household Size | # Housing Units | % Housing Units |
| 1-Person Household | 362 | 11.9% |
| 2-Person Household | 851 | 27.9% |
| 3-Person Household | 477 | 15.7% |
| 4+ Person Household | 1,357 | 44.5% |
| Total Housing Units | 3,047 | 100.0% |
Occupancy by Ownership by Household Size in Rolesville
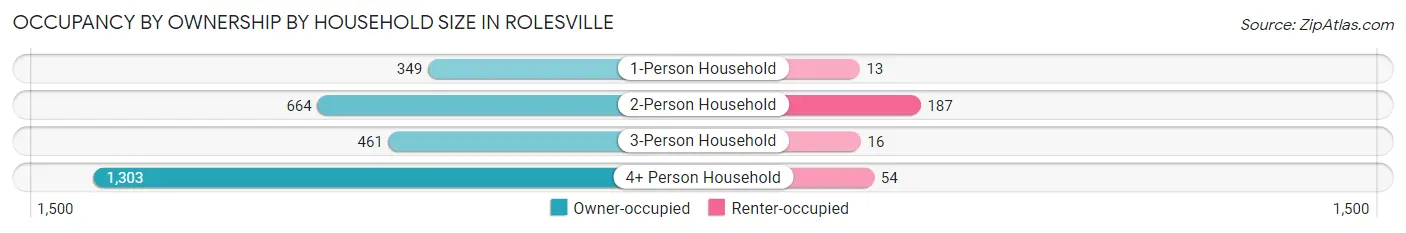
| Household Size | Owner-occupied | Renter-occupied |
| 1-Person Household | 349 (96.4%) | 13 (3.6%) |
| 2-Person Household | 664 (78.0%) | 187 (22.0%) |
| 3-Person Household | 461 (96.7%) | 16 (3.4%) |
| 4+ Person Household | 1,303 (96.0%) | 54 (4.0%) |
| Total Housing Units | 2,777 (91.1%) | 270 (8.9%) |
Occupancy by Educational Attainment in Rolesville
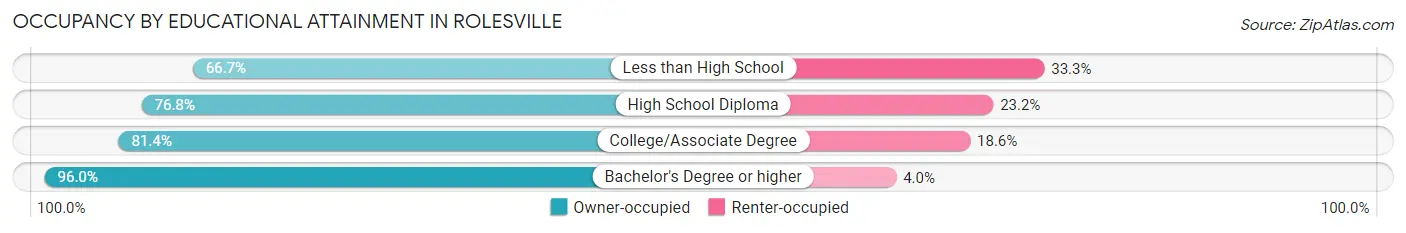
| Household Size | Owner-occupied | Renter-occupied |
| Less than High School | 26 (66.7%) | 13 (33.3%) |
| High School Diploma | 235 (76.8%) | 71 (23.2%) |
| College/Associate Degree | 437 (81.4%) | 100 (18.6%) |
| Bachelor's Degree or higher | 2,079 (96.0%) | 86 (4.0%) |
Occupancy by Age of Householder in Rolesville
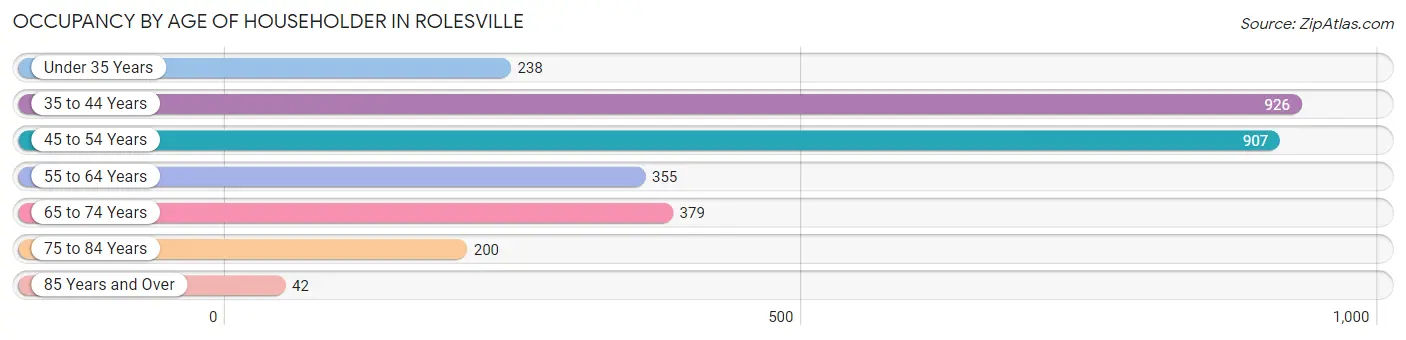
| Age Bracket | # Households | % Households |
| Under 35 Years | 238 | 7.8% |
| 35 to 44 Years | 926 | 30.4% |
| 45 to 54 Years | 907 | 29.8% |
| 55 to 64 Years | 355 | 11.7% |
| 65 to 74 Years | 379 | 12.4% |
| 75 to 84 Years | 200 | 6.6% |
| 85 Years and Over | 42 | 1.4% |
| Total | 3,047 | 100.0% |
Housing Finances in Rolesville
Median Income by Occupancy in Rolesville
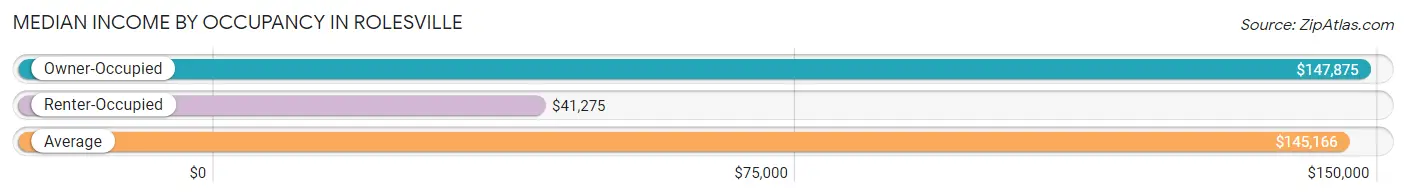
| Occupancy Type | # Households | Median Income |
| Owner-Occupied | 2,777 (91.1%) | $147,875 |
| Renter-Occupied | 270 (8.9%) | $41,275 |
| Average | 3,047 (100.0%) | $145,166 |
Occupancy by Householder Income Bracket in Rolesville
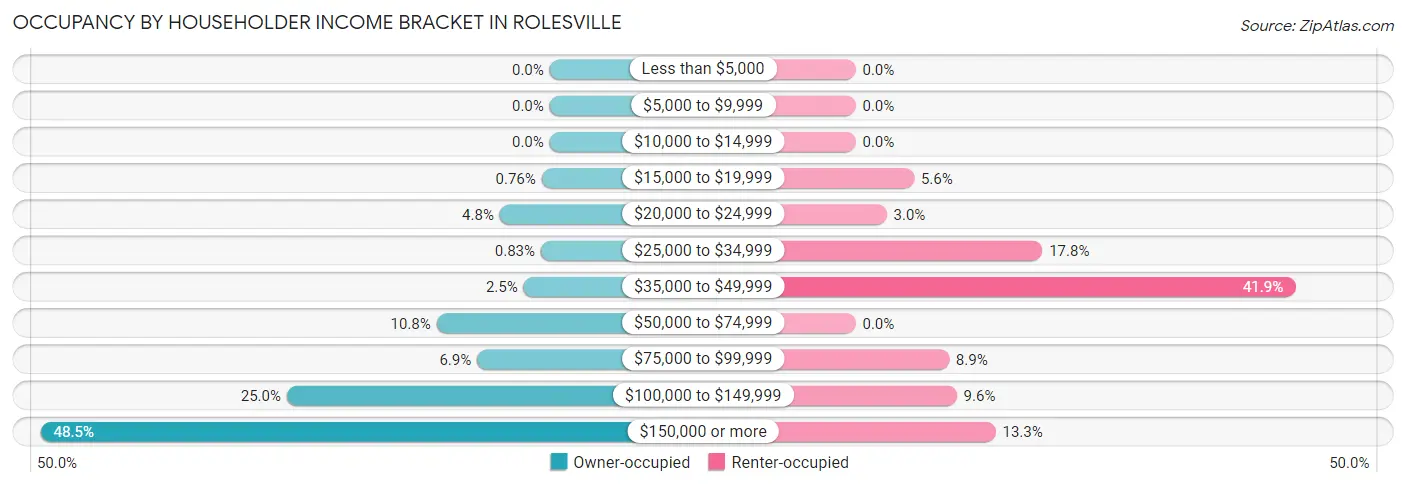
| Income Bracket | Owner-occupied | Renter-occupied |
| Less than $5,000 | 0 (0.0%) | 0 (0.0%) |
| $5,000 to $9,999 | 0 (0.0%) | 0 (0.0%) |
| $10,000 to $14,999 | 0 (0.0%) | 0 (0.0%) |
| $15,000 to $19,999 | 21 (0.8%) | 15 (5.6%) |
| $20,000 to $24,999 | 132 (4.8%) | 8 (3.0%) |
| $25,000 to $34,999 | 23 (0.8%) | 48 (17.8%) |
| $35,000 to $49,999 | 69 (2.5%) | 113 (41.8%) |
| $50,000 to $74,999 | 299 (10.8%) | 0 (0.0%) |
| $75,000 to $99,999 | 192 (6.9%) | 24 (8.9%) |
| $100,000 to $149,999 | 695 (25.0%) | 26 (9.6%) |
| $150,000 or more | 1,346 (48.5%) | 36 (13.3%) |
| Total | 2,777 (100.0%) | 270 (100.0%) |
Monthly Housing Cost Tiers in Rolesville
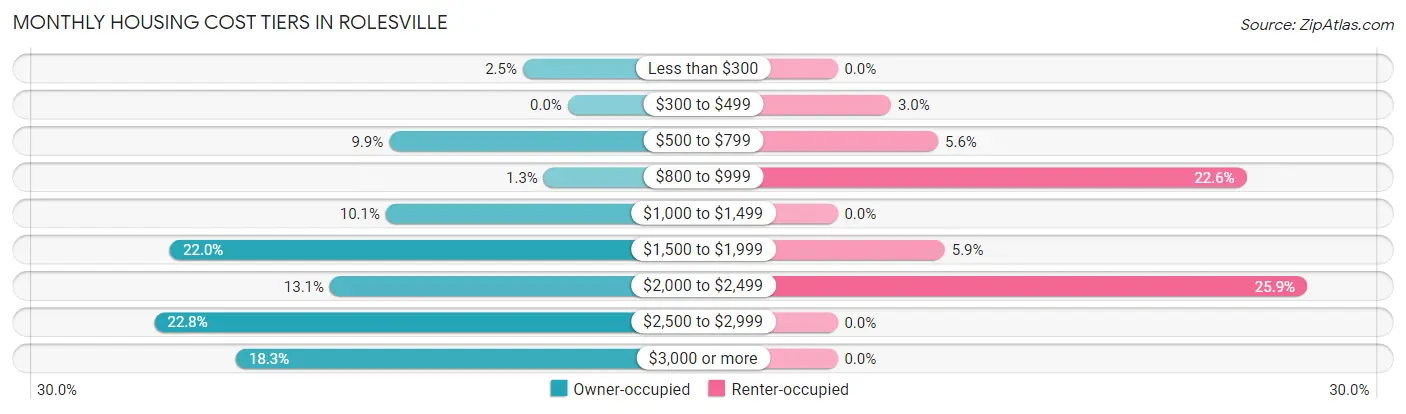
| Monthly Cost | Owner-occupied | Renter-occupied |
| Less than $300 | 69 (2.5%) | 0 (0.0%) |
| $300 to $499 | 0 (0.0%) | 8 (3.0%) |
| $500 to $799 | 274 (9.9%) | 15 (5.6%) |
| $800 to $999 | 37 (1.3%) | 61 (22.6%) |
| $1,000 to $1,499 | 279 (10.1%) | 0 (0.0%) |
| $1,500 to $1,999 | 610 (22.0%) | 16 (5.9%) |
| $2,000 to $2,499 | 365 (13.1%) | 70 (25.9%) |
| $2,500 to $2,999 | 634 (22.8%) | 0 (0.0%) |
| $3,000 or more | 509 (18.3%) | 0 (0.0%) |
| Total | 2,777 (100.0%) | 270 (100.0%) |
Physical Housing Characteristics in Rolesville
Housing Structures in Rolesville
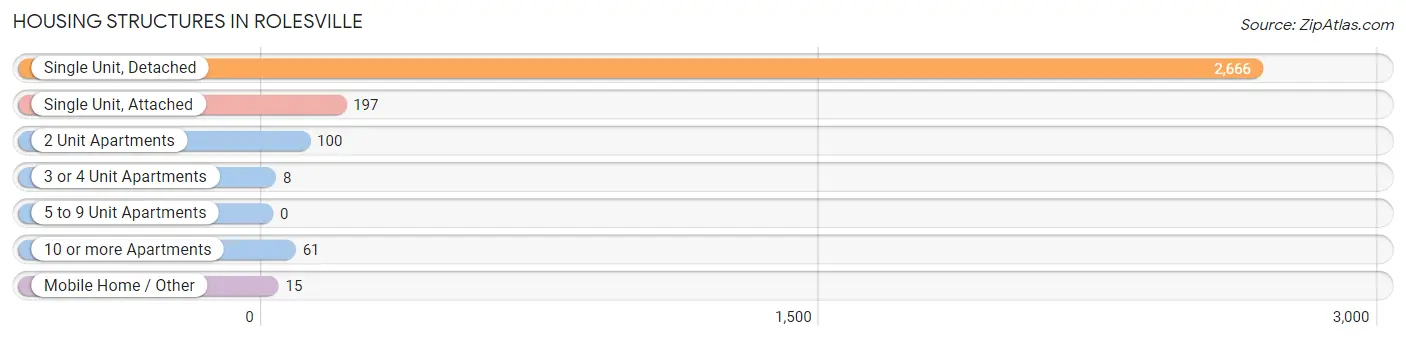
| Structure Type | # Housing Units | % Housing Units |
| Single Unit, Detached | 2,666 | 87.5% |
| Single Unit, Attached | 197 | 6.5% |
| 2 Unit Apartments | 100 | 3.3% |
| 3 or 4 Unit Apartments | 8 | 0.3% |
| 5 to 9 Unit Apartments | 0 | 0.0% |
| 10 or more Apartments | 61 | 2.0% |
| Mobile Home / Other | 15 | 0.5% |
| Total | 3,047 | 100.0% |
Housing Structures by Occupancy in Rolesville
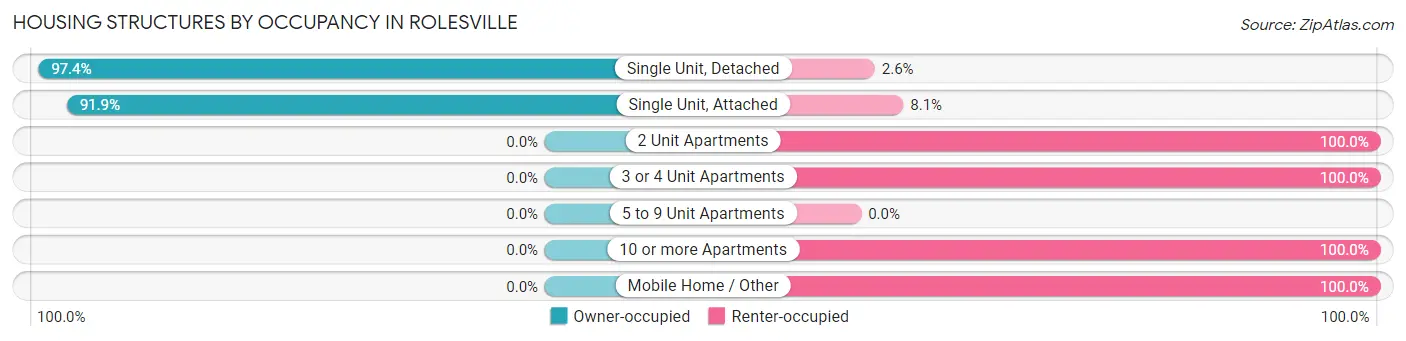
| Structure Type | Owner-occupied | Renter-occupied |
| Single Unit, Detached | 2,596 (97.4%) | 70 (2.6%) |
| Single Unit, Attached | 181 (91.9%) | 16 (8.1%) |
| 2 Unit Apartments | 0 (0.0%) | 100 (100.0%) |
| 3 or 4 Unit Apartments | 0 (0.0%) | 8 (100.0%) |
| 5 to 9 Unit Apartments | 0 (0.0%) | 0 (0.0%) |
| 10 or more Apartments | 0 (0.0%) | 61 (100.0%) |
| Mobile Home / Other | 0 (0.0%) | 15 (100.0%) |
| Total | 2,777 (91.1%) | 270 (8.9%) |
Housing Structures by Number of Rooms in Rolesville
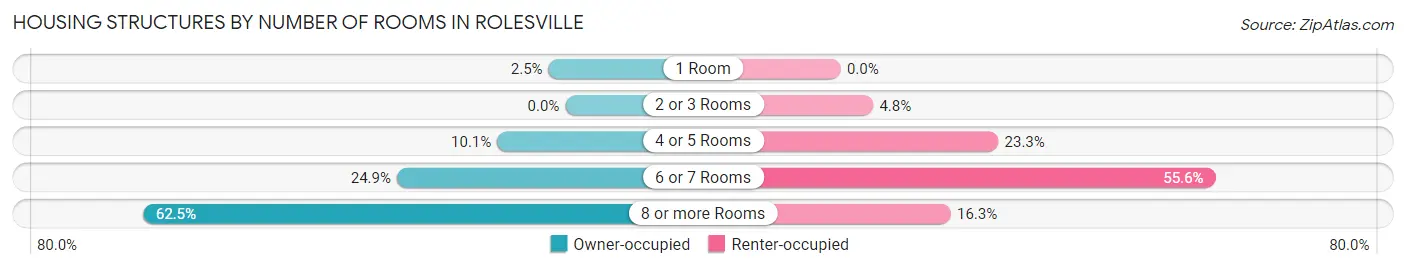
| Number of Rooms | Owner-occupied | Renter-occupied |
| 1 Room | 69 (2.5%) | 0 (0.0%) |
| 2 or 3 Rooms | 0 (0.0%) | 13 (4.8%) |
| 4 or 5 Rooms | 280 (10.1%) | 63 (23.3%) |
| 6 or 7 Rooms | 692 (24.9%) | 150 (55.6%) |
| 8 or more Rooms | 1,736 (62.5%) | 44 (16.3%) |
| Total | 2,777 (100.0%) | 270 (100.0%) |
Housing Structure by Heating Type in Rolesville
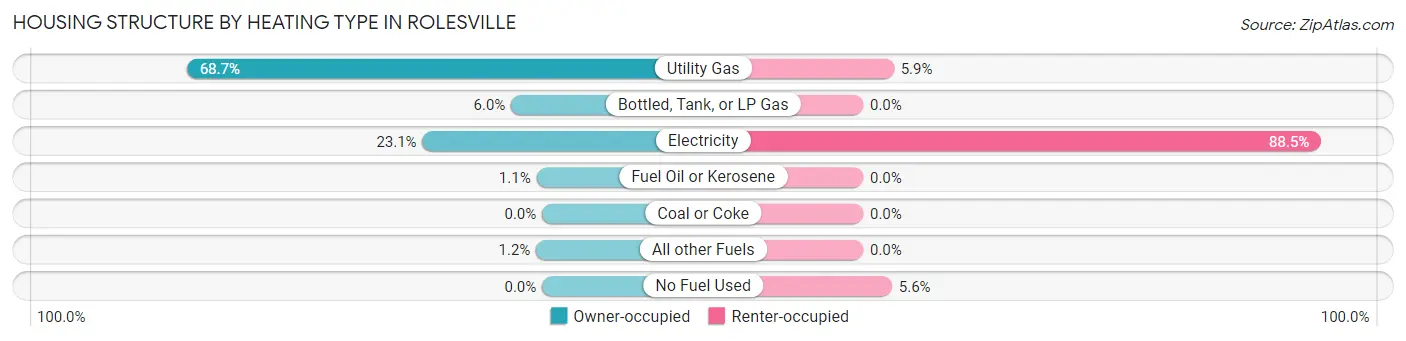
| Heating Type | Owner-occupied | Renter-occupied |
| Utility Gas | 1,907 (68.7%) | 16 (5.9%) |
| Bottled, Tank, or LP Gas | 166 (6.0%) | 0 (0.0%) |
| Electricity | 642 (23.1%) | 239 (88.5%) |
| Fuel Oil or Kerosene | 30 (1.1%) | 0 (0.0%) |
| Coal or Coke | 0 (0.0%) | 0 (0.0%) |
| All other Fuels | 32 (1.1%) | 0 (0.0%) |
| No Fuel Used | 0 (0.0%) | 15 (5.6%) |
| Total | 2,777 (100.0%) | 270 (100.0%) |
Household Vehicle Usage in Rolesville
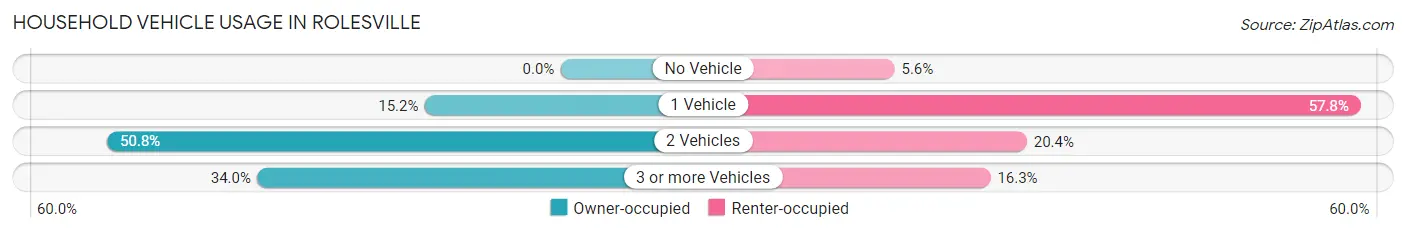
| Vehicles per Household | Owner-occupied | Renter-occupied |
| No Vehicle | 0 (0.0%) | 15 (5.6%) |
| 1 Vehicle | 423 (15.2%) | 156 (57.8%) |
| 2 Vehicles | 1,410 (50.8%) | 55 (20.4%) |
| 3 or more Vehicles | 944 (34.0%) | 44 (16.3%) |
| Total | 2,777 (100.0%) | 270 (100.0%) |
Real Estate & Mortgages in Rolesville
Real Estate and Mortgage Overview in Rolesville
| Characteristic | Without Mortgage | With Mortgage |
| Housing Units | 312 | 2,465 |
| Median Property Value | $330,800 | $441,300 |
| Median Household Income | $156,552 | $1,172 |
| Monthly Housing Costs | $631 | $509 |
| Real Estate Taxes | $3,627 | $18 |
Property Value by Mortgage Status in Rolesville
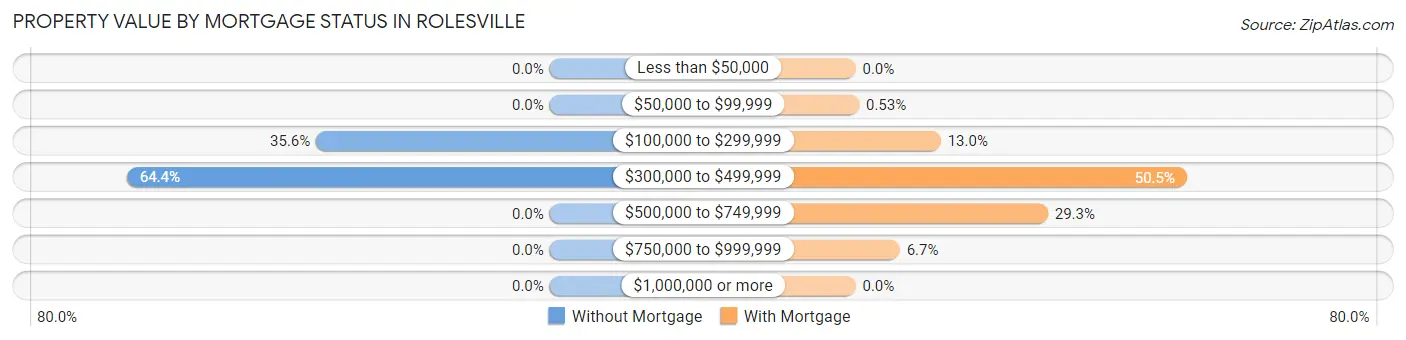
| Property Value | Without Mortgage | With Mortgage |
| Less than $50,000 | 0 (0.0%) | 0 (0.0%) |
| $50,000 to $99,999 | 0 (0.0%) | 13 (0.5%) |
| $100,000 to $299,999 | 111 (35.6%) | 320 (13.0%) |
| $300,000 to $499,999 | 201 (64.4%) | 1,244 (50.5%) |
| $500,000 to $749,999 | 0 (0.0%) | 722 (29.3%) |
| $750,000 to $999,999 | 0 (0.0%) | 166 (6.7%) |
| $1,000,000 or more | 0 (0.0%) | 0 (0.0%) |
| Total | 312 (100.0%) | 2,465 (100.0%) |
Household Income by Mortgage Status in Rolesville
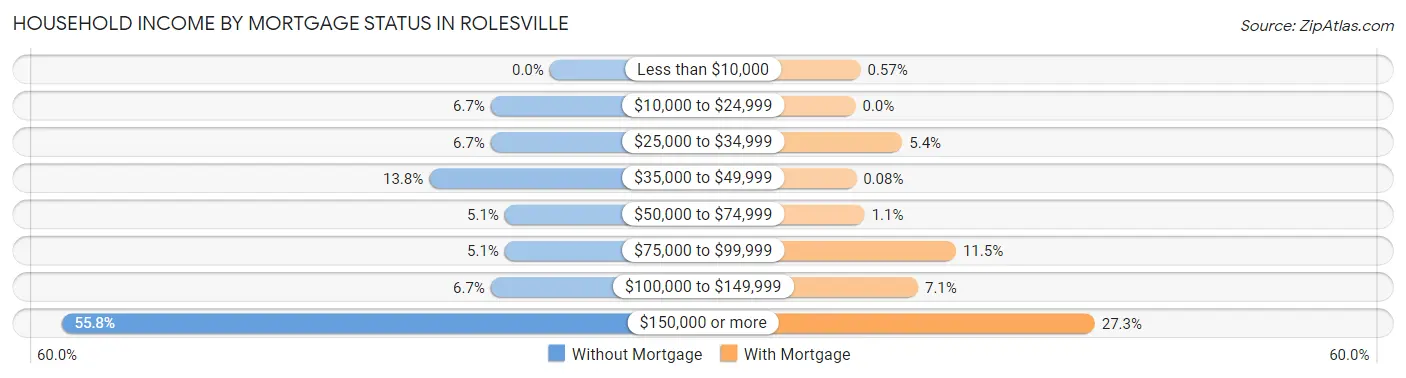
| Household Income | Without Mortgage | With Mortgage |
| Less than $10,000 | 0 (0.0%) | 14 (0.6%) |
| $10,000 to $24,999 | 21 (6.7%) | 0 (0.0%) |
| $25,000 to $34,999 | 21 (6.7%) | 132 (5.3%) |
| $35,000 to $49,999 | 43 (13.8%) | 2 (0.1%) |
| $50,000 to $74,999 | 16 (5.1%) | 26 (1.1%) |
| $75,000 to $99,999 | 16 (5.1%) | 283 (11.5%) |
| $100,000 to $149,999 | 21 (6.7%) | 176 (7.1%) |
| $150,000 or more | 174 (55.8%) | 674 (27.3%) |
| Total | 312 (100.0%) | 2,465 (100.0%) |
Property Value to Household Income Ratio in Rolesville
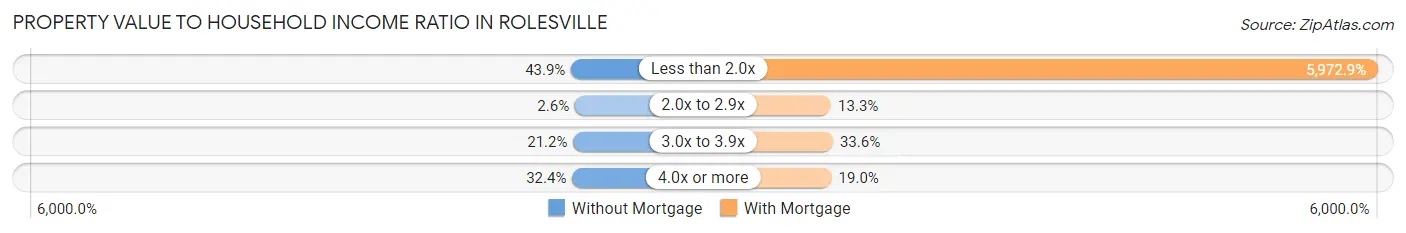
| Value-to-Income Ratio | Without Mortgage | With Mortgage |
| Less than 2.0x | 137 (43.9%) | 147,232 (5,972.9%) |
| 2.0x to 2.9x | 8 (2.6%) | 328 (13.3%) |
| 3.0x to 3.9x | 66 (21.1%) | 827 (33.6%) |
| 4.0x or more | 101 (32.4%) | 469 (19.0%) |
| Total | 312 (100.0%) | 2,465 (100.0%) |
Real Estate Taxes by Mortgage Status in Rolesville
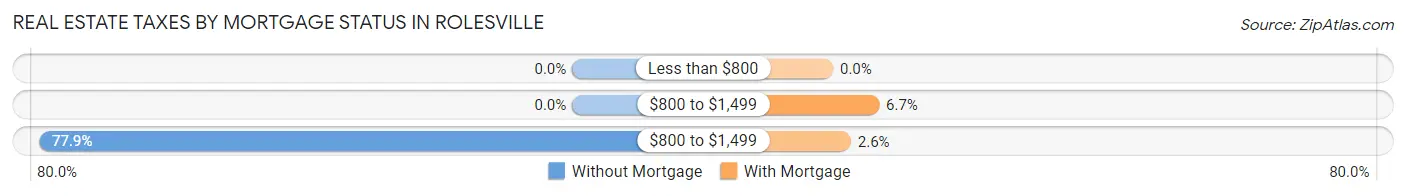
| Property Taxes | Without Mortgage | With Mortgage |
| Less than $800 | 0 (0.0%) | 0 (0.0%) |
| $800 to $1,499 | 0 (0.0%) | 166 (6.7%) |
| $800 to $1,499 | 243 (77.9%) | 64 (2.6%) |
| Total | 312 (100.0%) | 2,465 (100.0%) |
Health & Disability in Rolesville
Health Insurance Coverage by Age in Rolesville
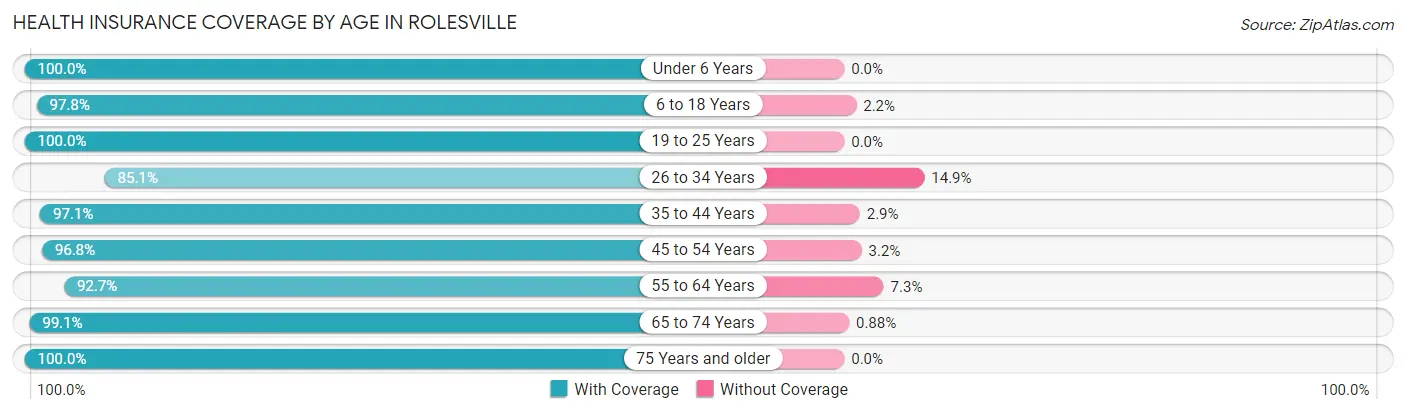
| Age Bracket | With Coverage | Without Coverage |
| Under 6 Years | 1,004 (100.0%) | 0 (0.0%) |
| 6 to 18 Years | 2,281 (97.8%) | 52 (2.2%) |
| 19 to 25 Years | 366 (100.0%) | 0 (0.0%) |
| 26 to 34 Years | 513 (85.1%) | 90 (14.9%) |
| 35 to 44 Years | 1,780 (97.1%) | 53 (2.9%) |
| 45 to 54 Years | 1,651 (96.8%) | 55 (3.2%) |
| 55 to 64 Years | 682 (92.7%) | 54 (7.3%) |
| 65 to 74 Years | 793 (99.1%) | 7 (0.9%) |
| 75 Years and older | 315 (100.0%) | 0 (0.0%) |
| Total | 9,385 (96.8%) | 311 (3.2%) |
Health Insurance Coverage by Citizenship Status in Rolesville
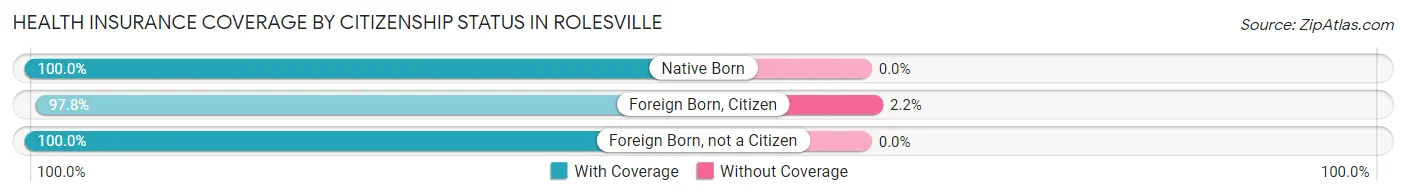
| Citizenship Status | With Coverage | Without Coverage |
| Native Born | 1,004 (100.0%) | 0 (0.0%) |
| Foreign Born, Citizen | 2,281 (97.8%) | 52 (2.2%) |
| Foreign Born, not a Citizen | 366 (100.0%) | 0 (0.0%) |
Health Insurance Coverage by Household Income in Rolesville
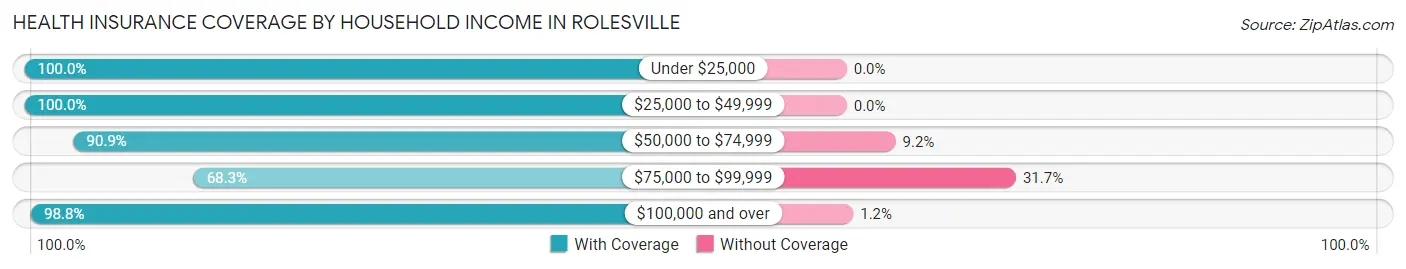
| Household Income | With Coverage | Without Coverage |
| Under $25,000 | 266 (100.0%) | 0 (0.0%) |
| $25,000 to $49,999 | 630 (100.0%) | 0 (0.0%) |
| $50,000 to $74,999 | 546 (90.8%) | 55 (9.1%) |
| $75,000 to $99,999 | 349 (68.3%) | 162 (31.7%) |
| $100,000 and over | 7,591 (98.8%) | 94 (1.2%) |
Public vs Private Health Insurance Coverage by Age in Rolesville
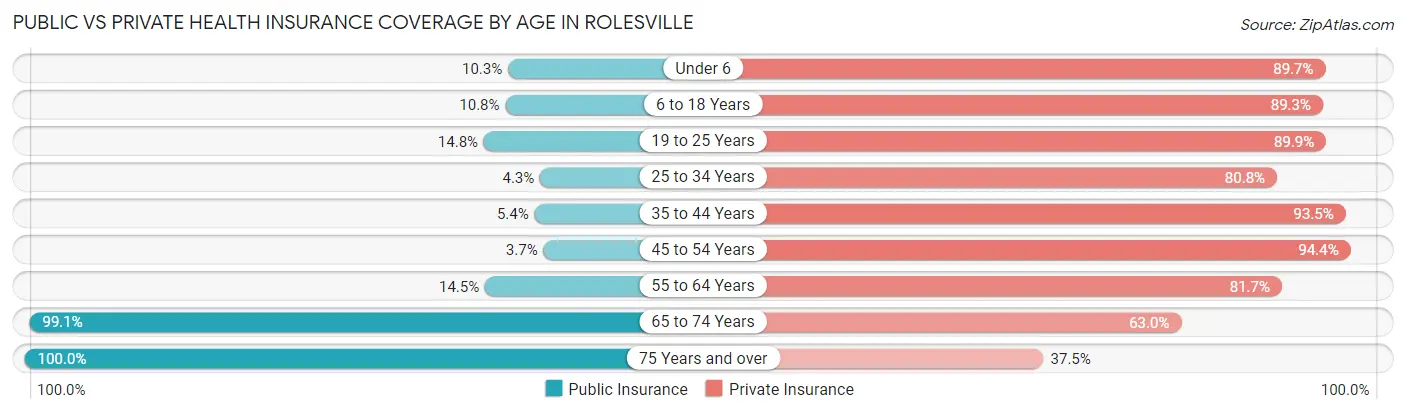
| Age Bracket | Public Insurance | Private Insurance |
| Under 6 | 103 (10.3%) | 901 (89.7%) |
| 6 to 18 Years | 251 (10.8%) | 2,083 (89.3%) |
| 19 to 25 Years | 54 (14.7%) | 329 (89.9%) |
| 25 to 34 Years | 26 (4.3%) | 487 (80.8%) |
| 35 to 44 Years | 98 (5.3%) | 1,714 (93.5%) |
| 45 to 54 Years | 63 (3.7%) | 1,611 (94.4%) |
| 55 to 64 Years | 107 (14.5%) | 601 (81.7%) |
| 65 to 74 Years | 793 (99.1%) | 504 (63.0%) |
| 75 Years and over | 315 (100.0%) | 118 (37.5%) |
| Total | 1,810 (18.7%) | 8,348 (86.1%) |
Disability Status by Sex by Age in Rolesville
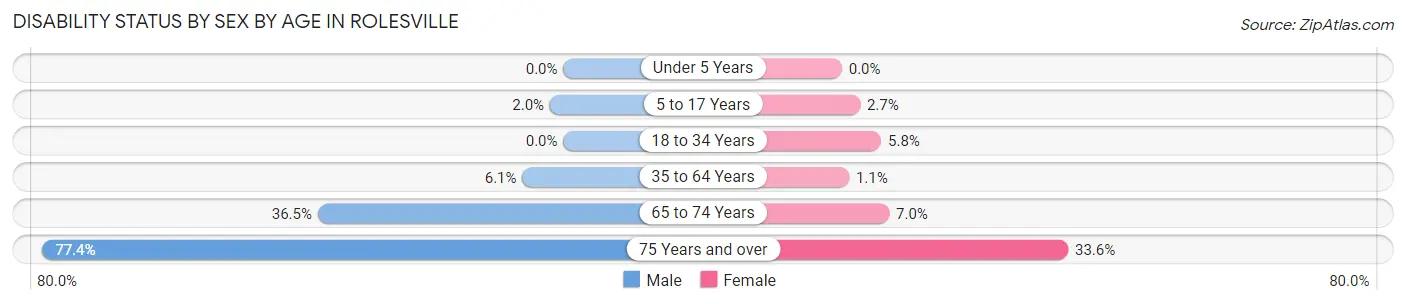
| Age Bracket | Male | Female |
| Under 5 Years | 0 (0.0%) | 0 (0.0%) |
| 5 to 17 Years | 27 (2.0%) | 26 (2.7%) |
| 18 to 34 Years | 0 (0.0%) | 37 (5.8%) |
| 35 to 64 Years | 128 (6.1%) | 23 (1.1%) |
| 65 to 74 Years | 105 (36.5%) | 36 (7.0%) |
| 75 Years and over | 147 (77.4%) | 42 (33.6%) |
Disability Class by Sex by Age in Rolesville
Disability Class: Hearing Difficulty
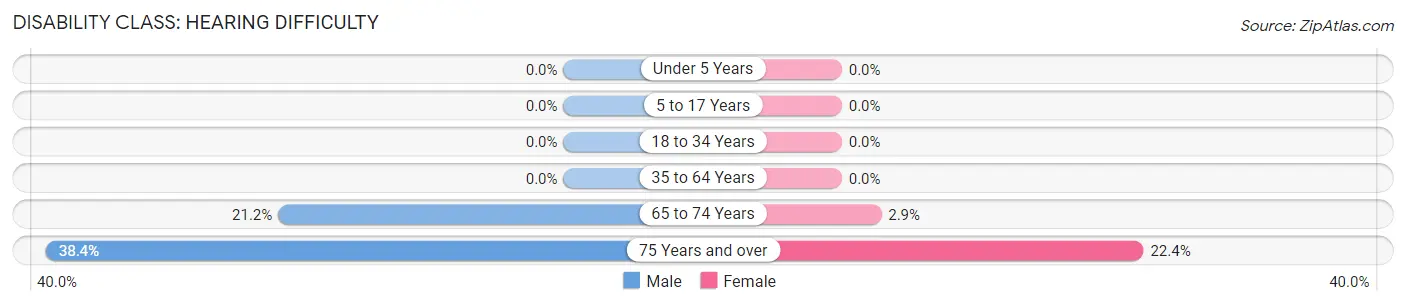
| Age Bracket | Male | Female |
| Under 5 Years | 0 (0.0%) | 0 (0.0%) |
| 5 to 17 Years | 0 (0.0%) | 0 (0.0%) |
| 18 to 34 Years | 0 (0.0%) | 0 (0.0%) |
| 35 to 64 Years | 0 (0.0%) | 0 (0.0%) |
| 65 to 74 Years | 61 (21.2%) | 15 (2.9%) |
| 75 Years and over | 73 (38.4%) | 28 (22.4%) |
Disability Class: Vision Difficulty
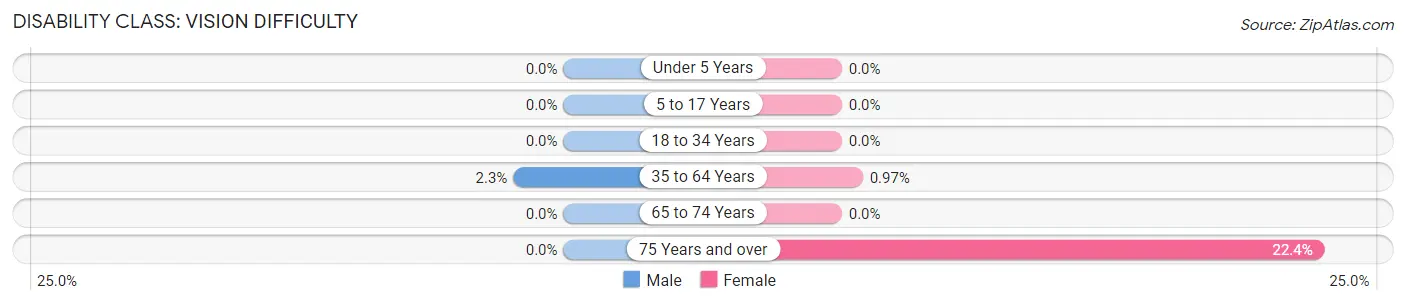
| Age Bracket | Male | Female |
| Under 5 Years | 0 (0.0%) | 0 (0.0%) |
| 5 to 17 Years | 0 (0.0%) | 0 (0.0%) |
| 18 to 34 Years | 0 (0.0%) | 0 (0.0%) |
| 35 to 64 Years | 49 (2.3%) | 21 (1.0%) |
| 65 to 74 Years | 0 (0.0%) | 0 (0.0%) |
| 75 Years and over | 0 (0.0%) | 28 (22.4%) |
Disability Class: Cognitive Difficulty
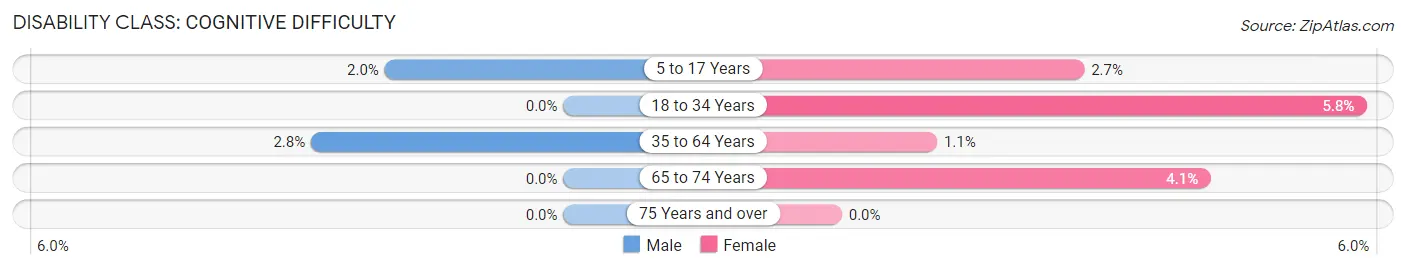
| Age Bracket | Male | Female |
| 5 to 17 Years | 27 (2.0%) | 26 (2.7%) |
| 18 to 34 Years | 0 (0.0%) | 37 (5.8%) |
| 35 to 64 Years | 59 (2.8%) | 23 (1.1%) |
| 65 to 74 Years | 0 (0.0%) | 21 (4.1%) |
| 75 Years and over | 0 (0.0%) | 0 (0.0%) |
Disability Class: Ambulatory Difficulty
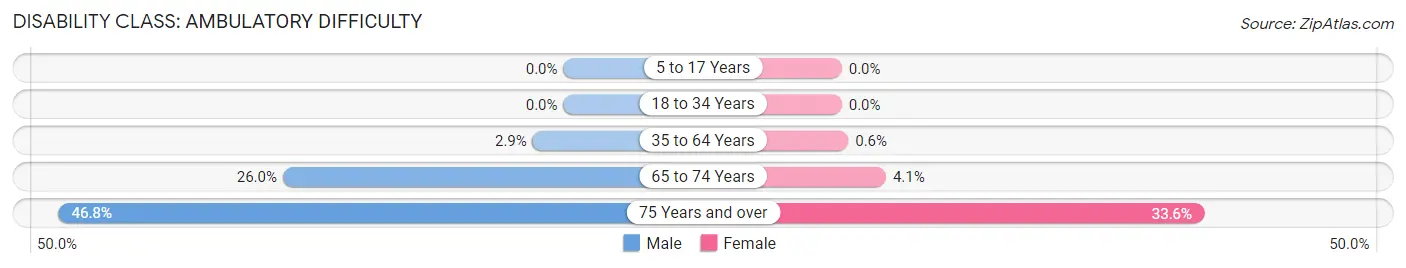
| Age Bracket | Male | Female |
| 5 to 17 Years | 0 (0.0%) | 0 (0.0%) |
| 18 to 34 Years | 0 (0.0%) | 0 (0.0%) |
| 35 to 64 Years | 60 (2.9%) | 13 (0.6%) |
| 65 to 74 Years | 75 (26.0%) | 21 (4.1%) |
| 75 Years and over | 89 (46.8%) | 42 (33.6%) |
Disability Class: Self-Care Difficulty
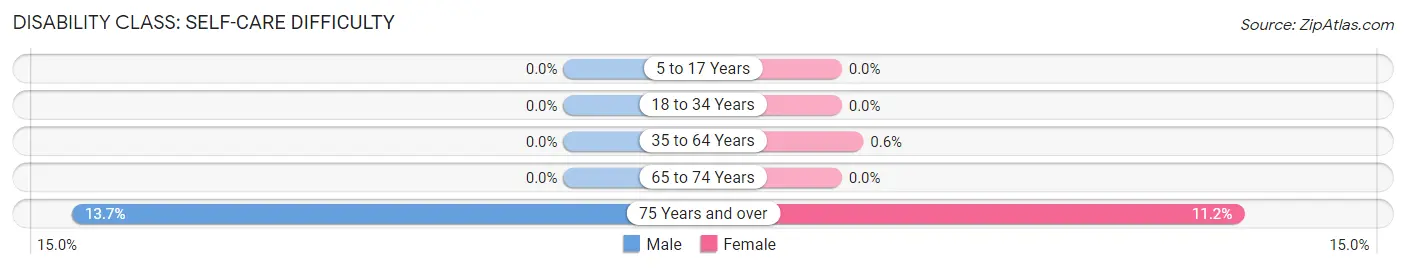
| Age Bracket | Male | Female |
| 5 to 17 Years | 0 (0.0%) | 0 (0.0%) |
| 18 to 34 Years | 0 (0.0%) | 0 (0.0%) |
| 35 to 64 Years | 0 (0.0%) | 13 (0.6%) |
| 65 to 74 Years | 0 (0.0%) | 0 (0.0%) |
| 75 Years and over | 26 (13.7%) | 14 (11.2%) |
Technology Access in Rolesville
Computing Device Access in Rolesville
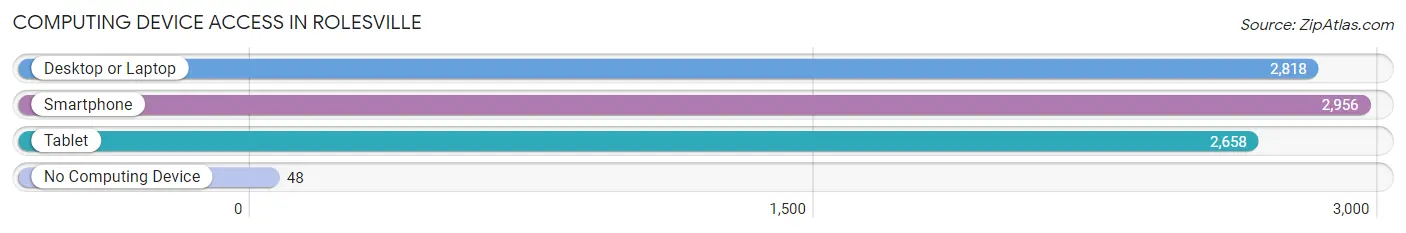
| Device Type | # Households | % Households |
| Desktop or Laptop | 2,818 | 92.5% |
| Smartphone | 2,956 | 97.0% |
| Tablet | 2,658 | 87.2% |
| No Computing Device | 48 | 1.6% |
| Total | 3,047 | 100.0% |
Internet Access in Rolesville
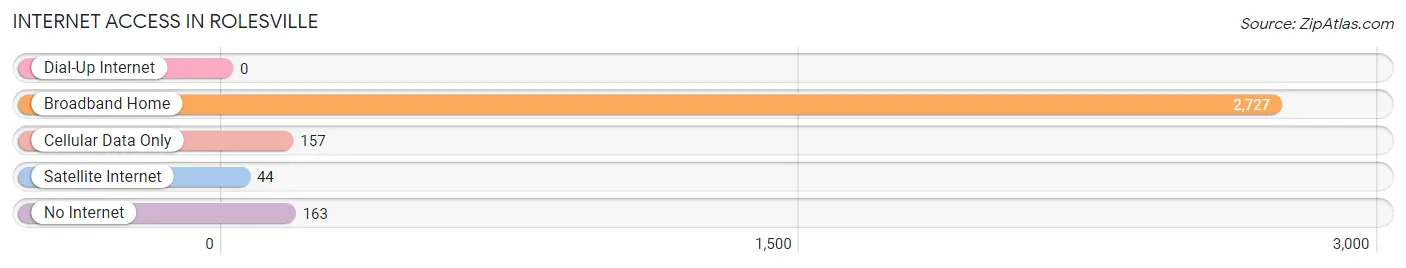
| Internet Type | # Households | % Households |
| Dial-Up Internet | 0 | 0.0% |
| Broadband Home | 2,727 | 89.5% |
| Cellular Data Only | 157 | 5.1% |
| Satellite Internet | 44 | 1.4% |
| No Internet | 163 | 5.3% |
| Total | 3,047 | 100.0% |
Rolesville Summary
Rolesville, North Carolina is a small town located in Wake County, just north of Raleigh. It is a part of the Research Triangle region, which is home to some of the most prestigious universities and research centers in the United States. The town has a population of approximately 5,000 people and is known for its small-town charm and friendly atmosphere.
History
Rolesville was founded in 1837 by William Roles, a local farmer and businessman. He purchased the land from the local Native American tribes and named the town after himself. The town was incorporated in 1891 and has remained a small, rural community ever since.
The town was originally a farming community, but in the late 19th century, the railroad came through and the town began to grow. The railroad brought new businesses and industries to the area, and the town began to thrive.
Geography
Rolesville is located in the Piedmont region of North Carolina, just north of Raleigh. The town is situated on the banks of the Neuse River, which provides a beautiful backdrop for the town. The town is surrounded by rolling hills and lush forests, making it a great place to live and work.
The town is located in Wake County, which is home to some of the most prestigious universities and research centers in the United States. The Research Triangle Park is located just a few miles away, and the town is also close to the Raleigh-Durham International Airport.
Economy
Rolesville is a small, rural community, and the economy is largely based on agriculture and small businesses. The town is home to several small businesses, including restaurants, retail stores, and professional services. The town also has a few larger employers, such as WakeMed Health & Hospitals and the Wake County Public School System.
The town is also home to several large farms, which produce a variety of crops, including corn, soybeans, and tobacco. The town is also home to several wineries, which produce some of the finest wines in the region.
Demographics
Rolesville is a small, rural community, and the population is largely white. According to the 2010 census, the town had a population of 5,000 people, with a median age of 37. The town is also home to a large Hispanic population, which makes up about 10% of the population.
The town is also home to a large number of families, with the median household income being around $50,000. The town is also home to a large number of retirees, with the median age of the population being around 65.
Conclusion
Rolesville, North Carolina is a small, rural town located in Wake County, just north of Raleigh. The town has a population of approximately 5,000 people and is known for its small-town charm and friendly atmosphere. The town is largely based on agriculture and small businesses, and is home to several wineries and farms. The town is also home to a large Hispanic population, and the median household income is around $50,000. Rolesville is a great place to live and work, and is a great example of a small, rural town in North Carolina.
Common Questions
What is Per Capita Income in Rolesville?
Per Capita income in Rolesville is $48,881.
What is the Median Family Income in Rolesville?
Median Family Income in Rolesville is $161,463.
What is the Median Household income in Rolesville?
Median Household Income in Rolesville is $145,166.
What is Income or Wage Gap in Rolesville?
Income or Wage Gap in Rolesville is 42.0%.
Women in Rolesville earn 58.0 cents for every dollar earned by a man.
What is Inequality or Gini Index in Rolesville?
Inequality or Gini Index in Rolesville is 0.34.
What is the Total Population of Rolesville?
Total Population of Rolesville is 9,696.
What is the Total Male Population of Rolesville?
Total Male Population of Rolesville is 4,958.
What is the Total Female Population of Rolesville?
Total Female Population of Rolesville is 4,738.
What is the Ratio of Males per 100 Females in Rolesville?
There are 104.64 Males per 100 Females in Rolesville.
What is the Ratio of Females per 100 Males in Rolesville?
There are 95.56 Females per 100 Males in Rolesville.
What is the Median Population Age in Rolesville?
Median Population Age in Rolesville is 39.9 Years.
What is the Average Family Size in Rolesville
Average Family Size in Rolesville is 3.5 People.
What is the Average Household Size in Rolesville
Average Household Size in Rolesville is 3.2 People.
How Large is the Labor Force in Rolesville?
There are 4,564 People in the Labor Forcein in Rolesville.
What is the Percentage of People in the Labor Force in Rolesville?
67.7% of People are in the Labor Force in Rolesville.
What is the Unemployment Rate in Rolesville?
Unemployment Rate in Rolesville is 3.7%.