Park Forest Village, PA Map & Demographics
Park Forest Village Map
Park Forest Village Overview
$44,910
PER CAPITA INCOME
$114,948
AVG FAMILY INCOME
$70,822
AVG HOUSEHOLD INCOME
5.3%
WAGE / INCOME GAP [ % ]
94.7¢/ $1
WAGE / INCOME GAP [ $ ]
0.50
INEQUALITY / GINI INDEX
8,962
TOTAL POPULATION
4,382
MALE POPULATION
4,580
FEMALE POPULATION
95.68
MALES / 100 FEMALES
104.52
FEMALES / 100 MALES
35.9
MEDIAN AGE
2.9
AVG FAMILY SIZE
2.3
AVG HOUSEHOLD SIZE
4,637
LABOR FORCE [ PEOPLE ]
60.5%
PERCENT IN LABOR FORCE
4.7%
UNEMPLOYMENT RATE
Income in Park Forest Village
Income Overview in Park Forest Village
Per Capita Income in Park Forest Village is $44,910, while median incomes of families and households are $114,948 and $70,822 respectively.
| Characteristic | Number | Measure |
| Per Capita Income | 8,962 | $44,910 |
| Median Family Income | 2,056 | $114,948 |
| Mean Family Income | 2,056 | $147,799 |
| Median Household Income | 3,871 | $70,822 |
| Mean Household Income | 3,871 | $101,743 |
| Income Deficit | 2,056 | $0 |
| Wage / Income Gap (%) | 8,962 | 5.25% |
| Wage / Income Gap ($) | 8,962 | 94.75¢ per $1 |
| Gini / Inequality Index | 8,962 | 0.50 |
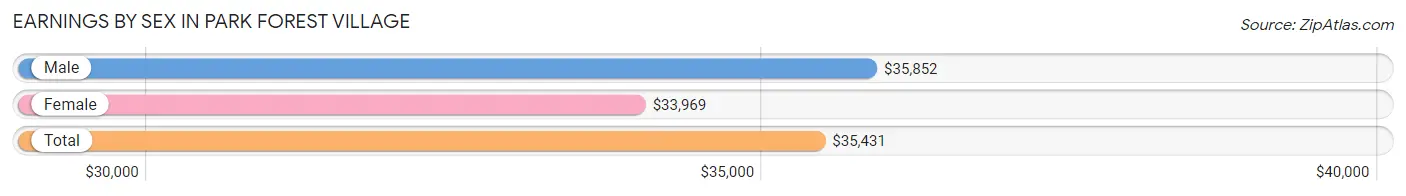
Earnings by Sex in Park Forest Village
Average Earnings in Park Forest Village are $35,431, $35,852 for men and $33,969 for women, a difference of 5.2%.
| Sex | Number | Average Earnings |
| Male | 2,761 (52.9%) | $35,852 |
| Female | 2,461 (47.1%) | $33,969 |
| Total | 5,222 (100.0%) | $35,431 |
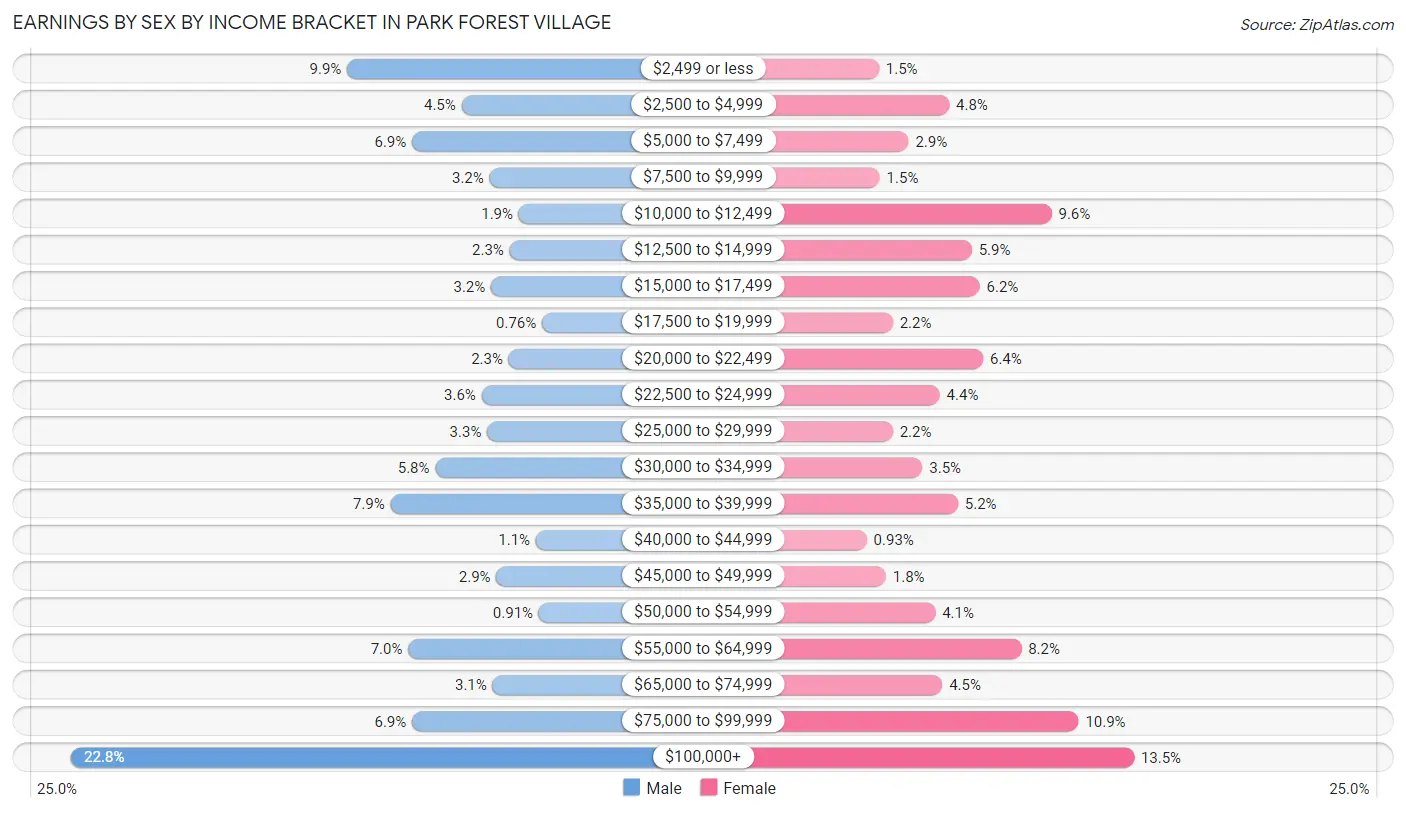
Earnings by Sex by Income Bracket in Park Forest Village
The most common earnings brackets in Park Forest Village are $100,000+ for men (630 | 22.8%) and $100,000+ for women (331 | 13.5%).
| Income | Male | Female |
| $2,499 or less | 273 (9.9%) | 37 (1.5%) |
| $2,500 to $4,999 | 125 (4.5%) | 118 (4.8%) |
| $5,000 to $7,499 | 189 (6.9%) | 71 (2.9%) |
| $7,500 to $9,999 | 89 (3.2%) | 38 (1.5%) |
| $10,000 to $12,499 | 51 (1.8%) | 236 (9.6%) |
| $12,500 to $14,999 | 63 (2.3%) | 144 (5.9%) |
| $15,000 to $17,499 | 87 (3.2%) | 153 (6.2%) |
| $17,500 to $19,999 | 21 (0.8%) | 53 (2.1%) |
| $20,000 to $22,499 | 64 (2.3%) | 157 (6.4%) |
| $22,500 to $24,999 | 99 (3.6%) | 107 (4.3%) |
| $25,000 to $29,999 | 92 (3.3%) | 53 (2.1%) |
| $30,000 to $34,999 | 159 (5.8%) | 87 (3.5%) |
| $35,000 to $39,999 | 217 (7.9%) | 128 (5.2%) |
| $40,000 to $44,999 | 29 (1.1%) | 23 (0.9%) |
| $45,000 to $49,999 | 80 (2.9%) | 45 (1.8%) |
| $50,000 to $54,999 | 25 (0.9%) | 102 (4.1%) |
| $55,000 to $64,999 | 194 (7.0%) | 201 (8.2%) |
| $65,000 to $74,999 | 85 (3.1%) | 110 (4.5%) |
| $75,000 to $99,999 | 189 (6.9%) | 267 (10.8%) |
| $100,000+ | 630 (22.8%) | 331 (13.5%) |
| Total | 2,761 (100.0%) | 2,461 (100.0%) |
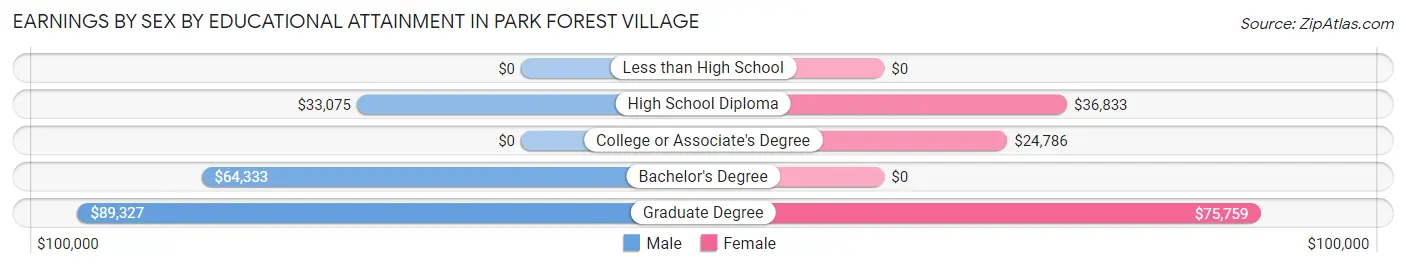
Earnings by Sex by Educational Attainment in Park Forest Village
Average earnings in Park Forest Village are $56,318 for men and $55,737 for women, a difference of 1.0%. Men with an educational attainment of graduate degree enjoy the highest average annual earnings of $89,327, while those with high school diploma education earn the least with $33,075. Women with an educational attainment of graduate degree earn the most with the average annual earnings of $75,759, while those with college or associate's degree education have the smallest earnings of $24,786.
| Educational Attainment | Male Income | Female Income |
| Less than High School | - | - |
| High School Diploma | $33,075 | $36,833 |
| College or Associate's Degree | - | - |
| Bachelor's Degree | $64,333 | $0 |
| Graduate Degree | $89,327 | $75,759 |
| Total | $56,318 | $55,737 |
Family Income in Park Forest Village
Family Income Brackets in Park Forest Village
According to the Park Forest Village family income data, there are 510 families falling into the $100,000 to $149,999 income range, which is the most common income bracket and makes up 24.8% of all families.
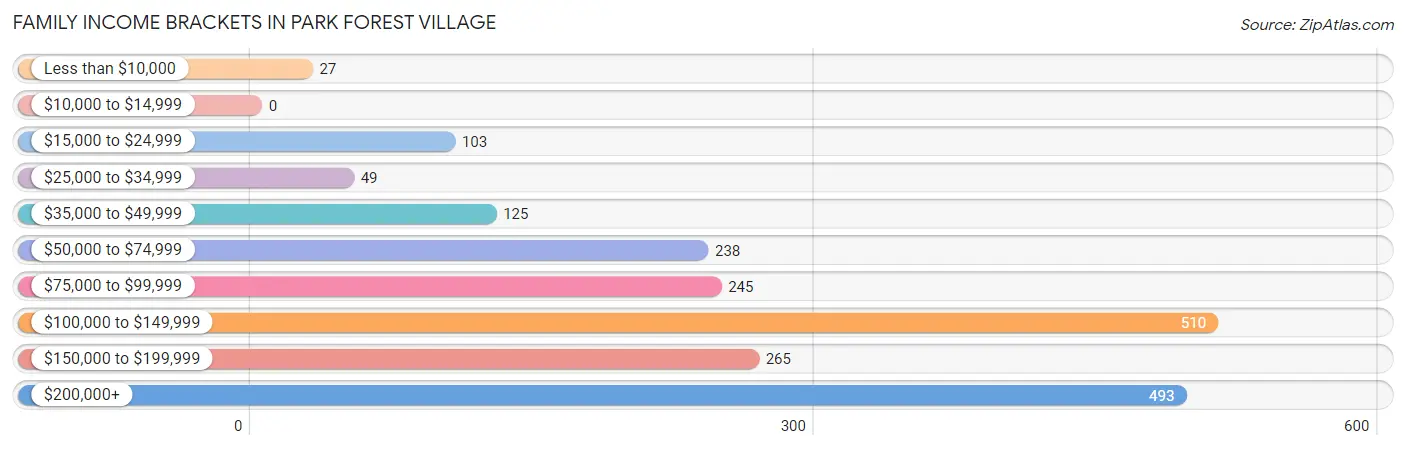
| Income Bracket | # Families | % Families |
| Less than $10,000 | 27 | 1.3% |
| $10,000 to $14,999 | 0 | 0.0% |
| $15,000 to $24,999 | 103 | 5.0% |
| $25,000 to $34,999 | 49 | 2.4% |
| $35,000 to $49,999 | 125 | 6.1% |
| $50,000 to $74,999 | 238 | 11.6% |
| $75,000 to $99,999 | 245 | 11.9% |
| $100,000 to $149,999 | 510 | 24.8% |
| $150,000 to $199,999 | 265 | 12.9% |
| $200,000+ | 493 | 24.0% |
Family Income by Famaliy Size in Park Forest Village
5-person families (89 | 4.3%) account for the highest median family income in Park Forest Village with $250,001 per family, while 2-person families (961 | 46.7%) have the highest median income of $61,648 per family member.
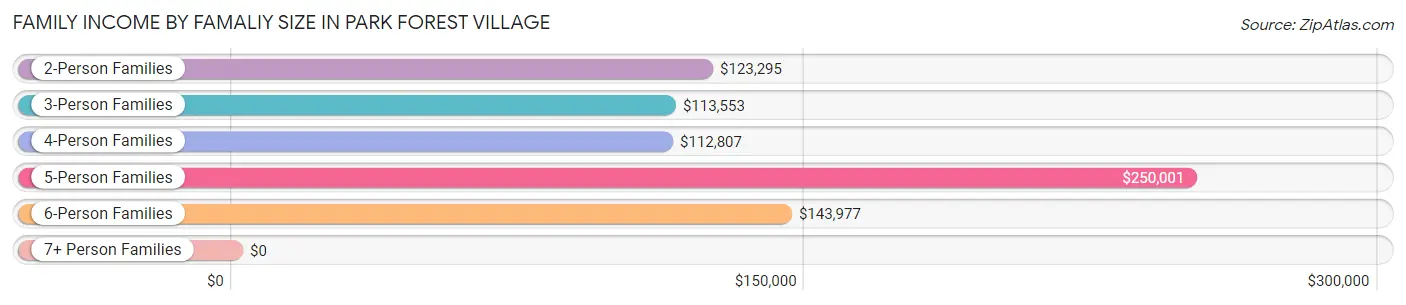
| Income Bracket | # Families | Median Income |
| 2-Person Families | 961 (46.7%) | $123,295 |
| 3-Person Families | 364 (17.7%) | $113,553 |
| 4-Person Families | 579 (28.2%) | $112,807 |
| 5-Person Families | 89 (4.3%) | $250,001 |
| 6-Person Families | 63 (3.1%) | $143,977 |
| 7+ Person Families | 0 (0.0%) | $0 |
| Total | 2,056 (100.0%) | $114,948 |
Family Income by Number of Earners in Park Forest Village
The median family income in Park Forest Village is $114,948, with families comprising 3+ earners (167) having the highest median family income of $178,875, while families with no earners (401) have the lowest median family income of $78,073, accounting for 8.1% and 19.5% of families, respectively.
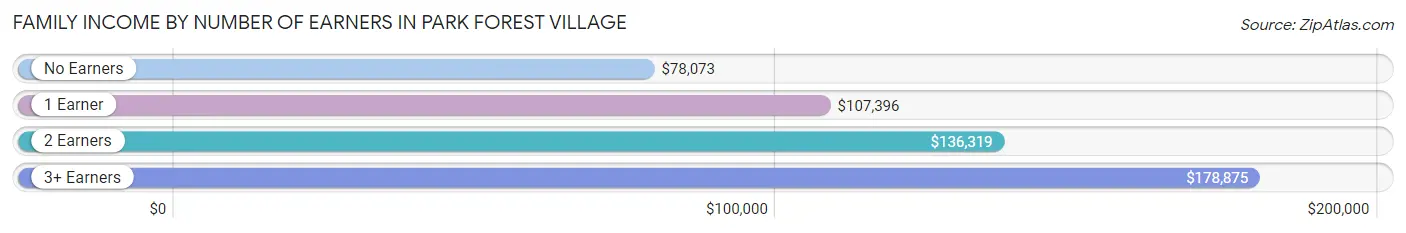
| Number of Earners | # Families | Median Income |
| No Earners | 401 (19.5%) | $78,073 |
| 1 Earner | 432 (21.0%) | $107,396 |
| 2 Earners | 1,056 (51.4%) | $136,319 |
| 3+ Earners | 167 (8.1%) | $178,875 |
| Total | 2,056 (100.0%) | $114,948 |
Household Income in Park Forest Village
Household Income Brackets in Park Forest Village
With 658 households falling in the category, the $100,000 to $149,999 income range is the most frequent in Park Forest Village, accounting for 17.0% of all households. In contrast, only 159 households (4.1%) fall into the $10,000 to $14,999 income bracket, making it the least populous group.
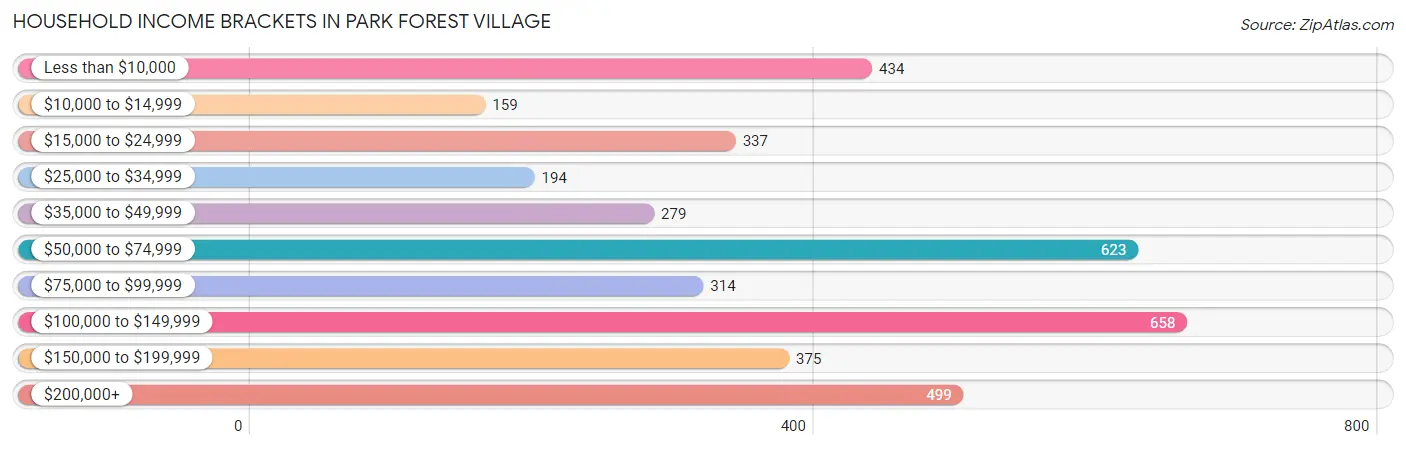
| Income Bracket | # Households | % Households |
| Less than $10,000 | 434 | 11.2% |
| $10,000 to $14,999 | 159 | 4.1% |
| $15,000 to $24,999 | 337 | 8.7% |
| $25,000 to $34,999 | 194 | 5.0% |
| $35,000 to $49,999 | 279 | 7.2% |
| $50,000 to $74,999 | 623 | 16.1% |
| $75,000 to $99,999 | 314 | 8.1% |
| $100,000 to $149,999 | 658 | 17.0% |
| $150,000 to $199,999 | 375 | 9.7% |
| $200,000+ | 499 | 12.9% |
Household Income by Householder Age in Park Forest Village
The median household income in Park Forest Village is $70,822, with the highest median household income of $128,854 found in the 45 to 64 years age bracket for the primary householder. A total of 1,091 households (28.2%) fall into this category. Meanwhile, the 15 to 24 years age bracket for the primary householder has the lowest median household income of $21,541, with 461 households (11.9%) in this group.
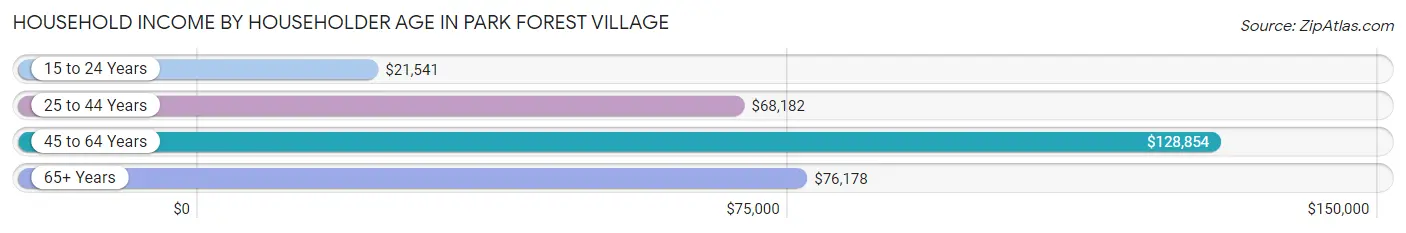
| Income Bracket | # Households | Median Income |
| 15 to 24 Years | 461 (11.9%) | $21,541 |
| 25 to 44 Years | 1,424 (36.8%) | $68,182 |
| 45 to 64 Years | 1,091 (28.2%) | $128,854 |
| 65+ Years | 895 (23.1%) | $76,178 |
| Total | 3,871 (100.0%) | $70,822 |
Poverty in Park Forest Village
Income Below Poverty by Sex and Age in Park Forest Village
With 19.5% poverty level for males and 19.1% for females among the residents of Park Forest Village, 18 to 24 year old males and 18 to 24 year old females are the most vulnerable to poverty, with 515 males (66.8%) and 480 females (54.6%) in their respective age groups living below the poverty level.
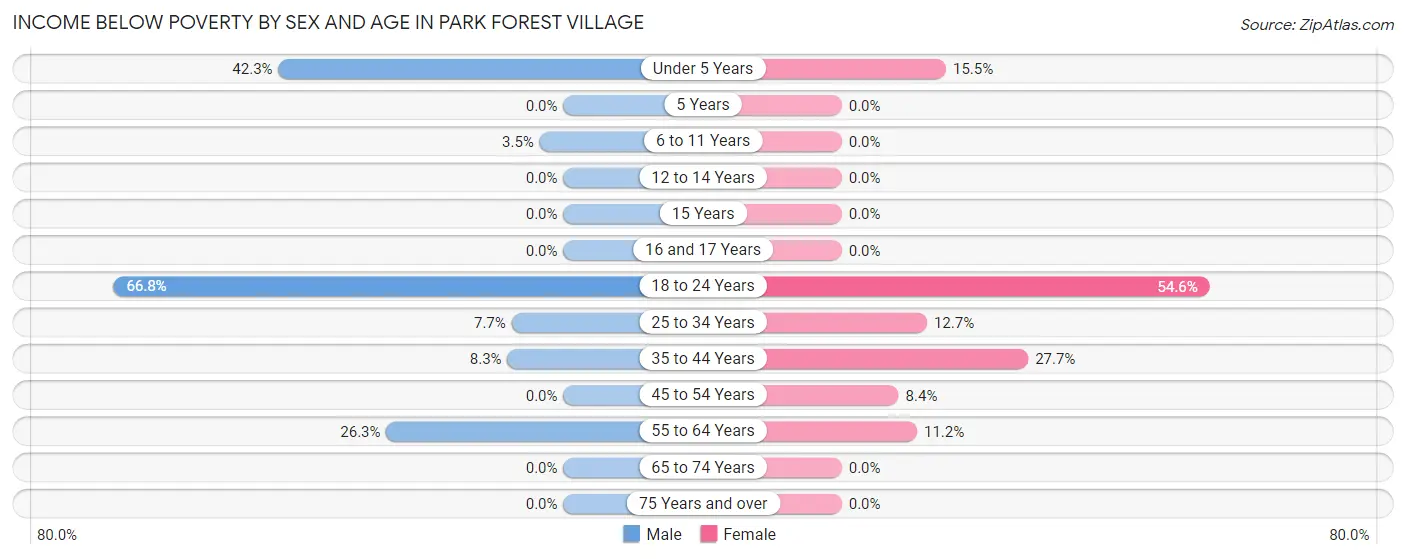
| Age Bracket | Male | Female |
| Under 5 Years | 77 (42.3%) | 26 (15.5%) |
| 5 Years | 0 (0.0%) | 0 (0.0%) |
| 6 to 11 Years | 8 (3.5%) | 0 (0.0%) |
| 12 to 14 Years | 0 (0.0%) | 0 (0.0%) |
| 15 Years | 0 (0.0%) | 0 (0.0%) |
| 16 and 17 Years | 0 (0.0%) | 0 (0.0%) |
| 18 to 24 Years | 515 (66.8%) | 480 (54.6%) |
| 25 to 34 Years | 51 (7.7%) | 72 (12.7%) |
| 35 to 44 Years | 60 (8.3%) | 186 (27.7%) |
| 45 to 54 Years | 0 (0.0%) | 41 (8.4%) |
| 55 to 64 Years | 139 (26.3%) | 66 (11.2%) |
| 65 to 74 Years | 0 (0.0%) | 0 (0.0%) |
| 75 Years and over | 0 (0.0%) | 0 (0.0%) |
| Total | 850 (19.5%) | 871 (19.1%) |
Income Above Poverty by Sex and Age in Park Forest Village
According to the poverty statistics in Park Forest Village, males aged 5 years and females aged 6 to 11 years are the age groups that are most secure financially, with 100.0% of males and 100.0% of females in these age groups living above the poverty line.
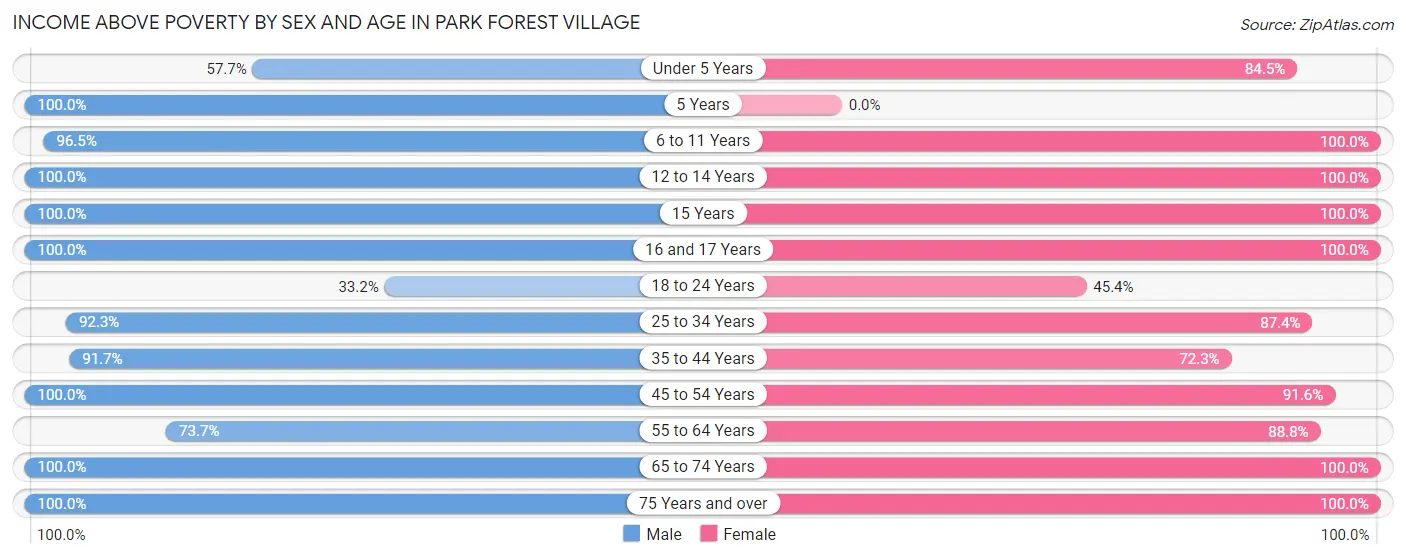
| Age Bracket | Male | Female |
| Under 5 Years | 105 (57.7%) | 142 (84.5%) |
| 5 Years | 38 (100.0%) | 0 (0.0%) |
| 6 to 11 Years | 220 (96.5%) | 283 (100.0%) |
| 12 to 14 Years | 166 (100.0%) | 110 (100.0%) |
| 15 Years | 18 (100.0%) | 102 (100.0%) |
| 16 and 17 Years | 123 (100.0%) | 14 (100.0%) |
| 18 to 24 Years | 256 (33.2%) | 399 (45.4%) |
| 25 to 34 Years | 613 (92.3%) | 497 (87.4%) |
| 35 to 44 Years | 663 (91.7%) | 486 (72.3%) |
| 45 to 54 Years | 319 (100.0%) | 445 (91.6%) |
| 55 to 64 Years | 390 (73.7%) | 525 (88.8%) |
| 65 to 74 Years | 431 (100.0%) | 379 (100.0%) |
| 75 Years and over | 164 (100.0%) | 313 (100.0%) |
| Total | 3,506 (80.5%) | 3,695 (80.9%) |
Income Below Poverty Among Married-Couple Families in Park Forest Village
The poverty statistics for married-couple families in Park Forest Village show that 5.1% or 93 of the total 1,808 families live below the poverty line. Families with 1 or 2 children have the highest poverty rate of 9.8%, comprising of 63 families. On the other hand, families with 3 or 4 children have the lowest poverty rate of 0.0%, which includes 0 families.
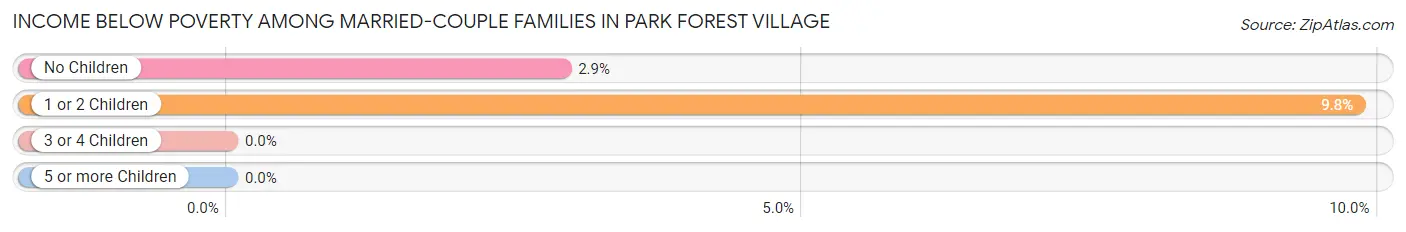
| Children | Above Poverty | Below Poverty |
| No Children | 1,005 (97.1%) | 30 (2.9%) |
| 1 or 2 Children | 579 (90.2%) | 63 (9.8%) |
| 3 or 4 Children | 131 (100.0%) | 0 (0.0%) |
| 5 or more Children | 0 (0.0%) | 0 (0.0%) |
| Total | 1,715 (94.9%) | 93 (5.1%) |
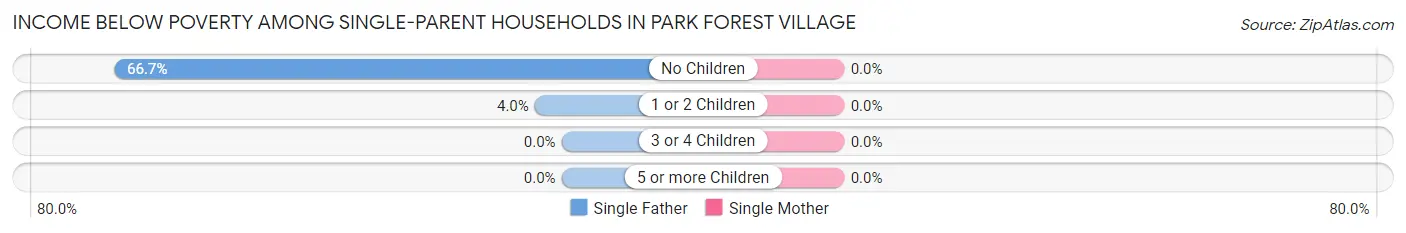
Income Below Poverty Among Single-Parent Households in Park Forest Village
| Children | Single Father | Single Mother |
| No Children | 22 (66.7%) | 0 (0.0%) |
| 1 or 2 Children | 1 (4.0%) | 0 (0.0%) |
| 3 or 4 Children | 0 (0.0%) | 0 (0.0%) |
| 5 or more Children | 0 (0.0%) | 0 (0.0%) |
| Total | 23 (39.7%) | 0 (0.0%) |
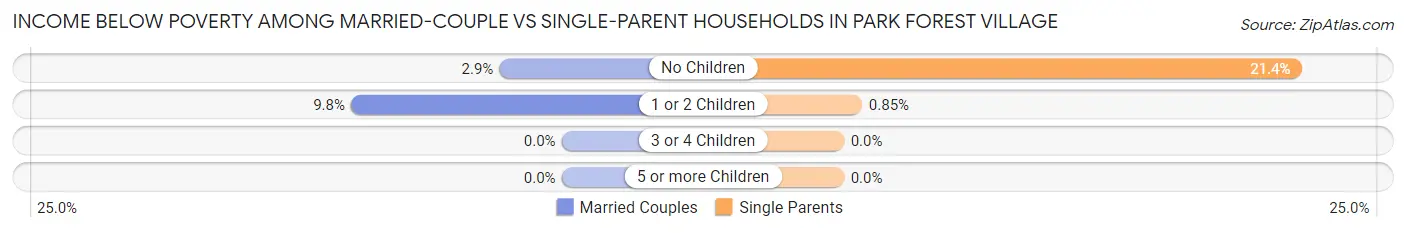
Income Below Poverty Among Married-Couple vs Single-Parent Households in Park Forest Village
The poverty data for Park Forest Village shows that 93 of the married-couple family households (5.1%) and 23 of the single-parent households (9.3%) are living below the poverty level. Within the married-couple family households, those with 1 or 2 children have the highest poverty rate, with 63 households (9.8%) falling below the poverty line. Among the single-parent households, those with no children have the highest poverty rate, with 22 household (21.4%) living below poverty.
| Children | Married-Couple Families | Single-Parent Households |
| No Children | 30 (2.9%) | 22 (21.4%) |
| 1 or 2 Children | 63 (9.8%) | 1 (0.9%) |
| 3 or 4 Children | 0 (0.0%) | 0 (0.0%) |
| 5 or more Children | 0 (0.0%) | 0 (0.0%) |
| Total | 93 (5.1%) | 23 (9.3%) |
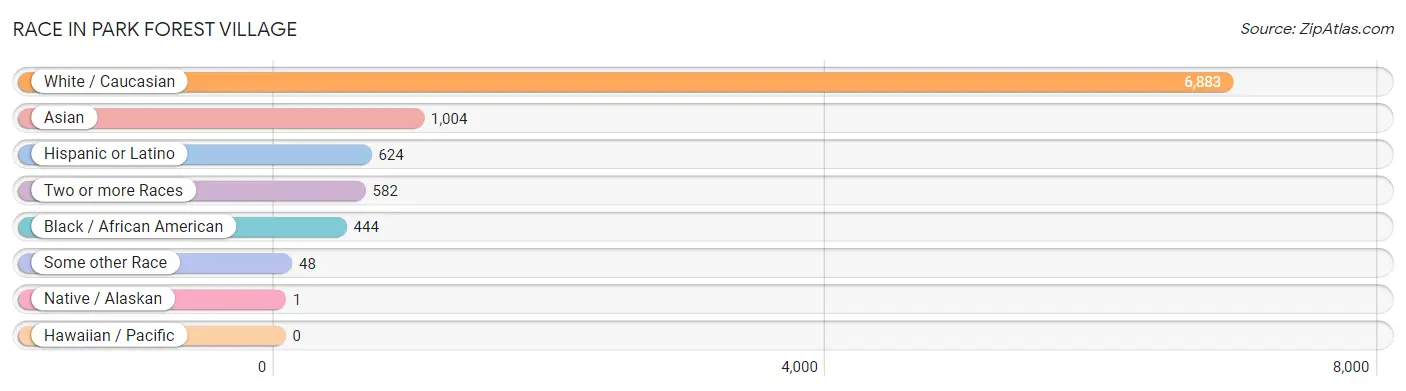
Race in Park Forest Village
The most populous races in Park Forest Village are White / Caucasian (6,883 | 76.8%), Asian (1,004 | 11.2%), and Hispanic or Latino (624 | 7.0%).
| Race | # Population | % Population |
| Asian | 1,004 | 11.2% |
| Black / African American | 444 | 5.0% |
| Hawaiian / Pacific | 0 | 0.0% |
| Hispanic or Latino | 624 | 7.0% |
| Native / Alaskan | 1 | 0.0% |
| White / Caucasian | 6,883 | 76.8% |
| Two or more Races | 582 | 6.5% |
| Some other Race | 48 | 0.5% |
| Total | 8,962 | 100.0% |
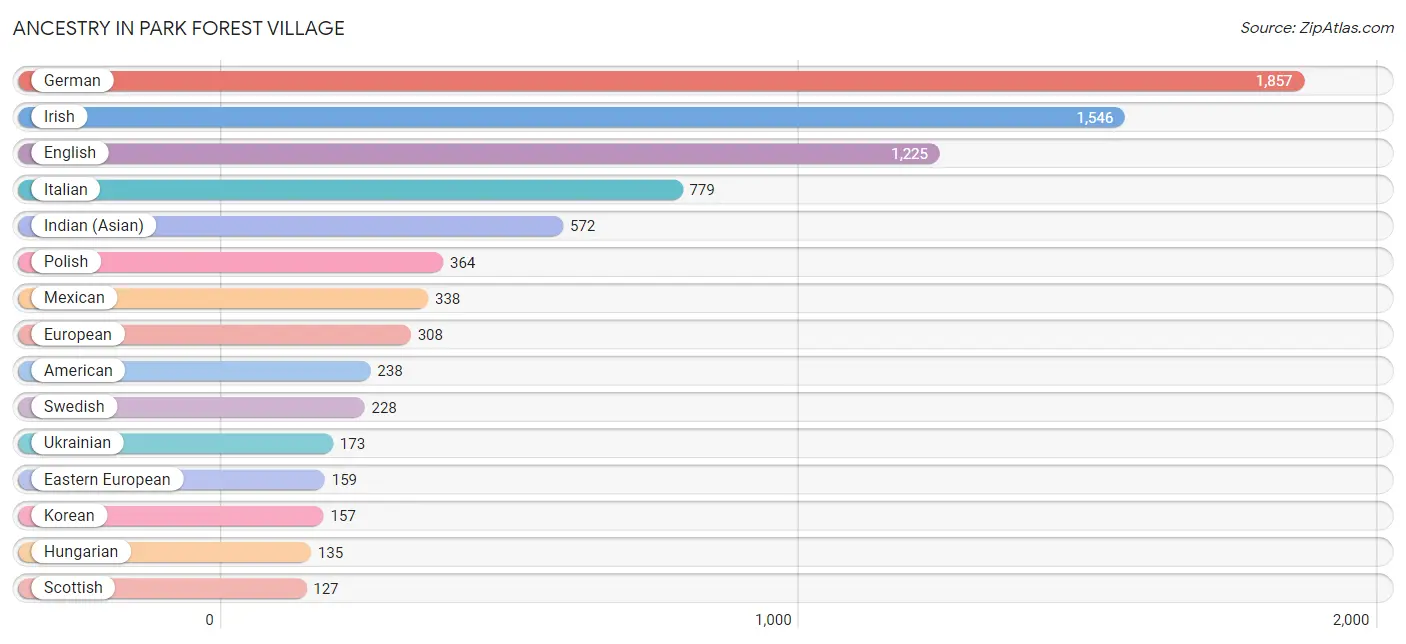
Ancestry in Park Forest Village
The most populous ancestries reported in Park Forest Village are German (1,857 | 20.7%), Irish (1,546 | 17.2%), English (1,225 | 13.7%), Italian (779 | 8.7%), and Indian (Asian) (572 | 6.4%), together accounting for 66.7% of all Park Forest Village residents.
| Ancestry | # Population | % Population |
| American | 238 | 2.7% |
| Arab | 20 | 0.2% |
| Argentinean | 22 | 0.3% |
| Armenian | 16 | 0.2% |
| Austrian | 18 | 0.2% |
| Basque | 11 | 0.1% |
| Belgian | 49 | 0.5% |
| Bhutanese | 14 | 0.2% |
| British | 84 | 0.9% |
| Burmese | 62 | 0.7% |
| Central American | 122 | 1.4% |
| Cherokee | 1 | 0.0% |
| Colombian | 29 | 0.3% |
| Costa Rican | 39 | 0.4% |
| Croatian | 52 | 0.6% |
| Cuban | 7 | 0.1% |
| Czech | 82 | 0.9% |
| Czechoslovakian | 22 | 0.3% |
| Danish | 16 | 0.2% |
| Dutch | 64 | 0.7% |
| Eastern European | 159 | 1.8% |
| Ecuadorian | 38 | 0.4% |
| English | 1,225 | 13.7% |
| European | 308 | 3.4% |
| Filipino | 18 | 0.2% |
| Finnish | 13 | 0.2% |
| French | 43 | 0.5% |
| French Canadian | 13 | 0.2% |
| German | 1,857 | 20.7% |
| Guatemalan | 37 | 0.4% |
| Haitian | 11 | 0.1% |
| Hungarian | 135 | 1.5% |
| Indian (Asian) | 572 | 6.4% |
| Inupiat | 13 | 0.2% |
| Irish | 1,546 | 17.2% |
| Iroquois | 5 | 0.1% |
| Israeli | 36 | 0.4% |
| Italian | 779 | 8.7% |
| Jamaican | 35 | 0.4% |
| Korean | 157 | 1.8% |
| Latvian | 14 | 0.2% |
| Lithuanian | 11 | 0.1% |
| Mexican | 338 | 3.8% |
| Nigerian | 91 | 1.0% |
| Norwegian | 26 | 0.3% |
| Pakistani | 31 | 0.4% |
| Palestinian | 20 | 0.2% |
| Pennsylvania German | 13 | 0.2% |
| Polish | 364 | 4.1% |
| Puerto Rican | 55 | 0.6% |
| Romanian | 11 | 0.1% |
| Russian | 56 | 0.6% |
| Salvadoran | 46 | 0.5% |
| Scotch-Irish | 30 | 0.3% |
| Scottish | 127 | 1.4% |
| Slavic | 14 | 0.2% |
| Slovak | 109 | 1.2% |
| South American | 102 | 1.1% |
| Sri Lankan | 12 | 0.1% |
| Subsaharan African | 91 | 1.0% |
| Swedish | 228 | 2.5% |
| Thai | 98 | 1.1% |
| Turkish | 113 | 1.3% |
| Ukrainian | 173 | 1.9% |
| Venezuelan | 13 | 0.2% |
| Welsh | 56 | 0.6% | View All 66 Rows |
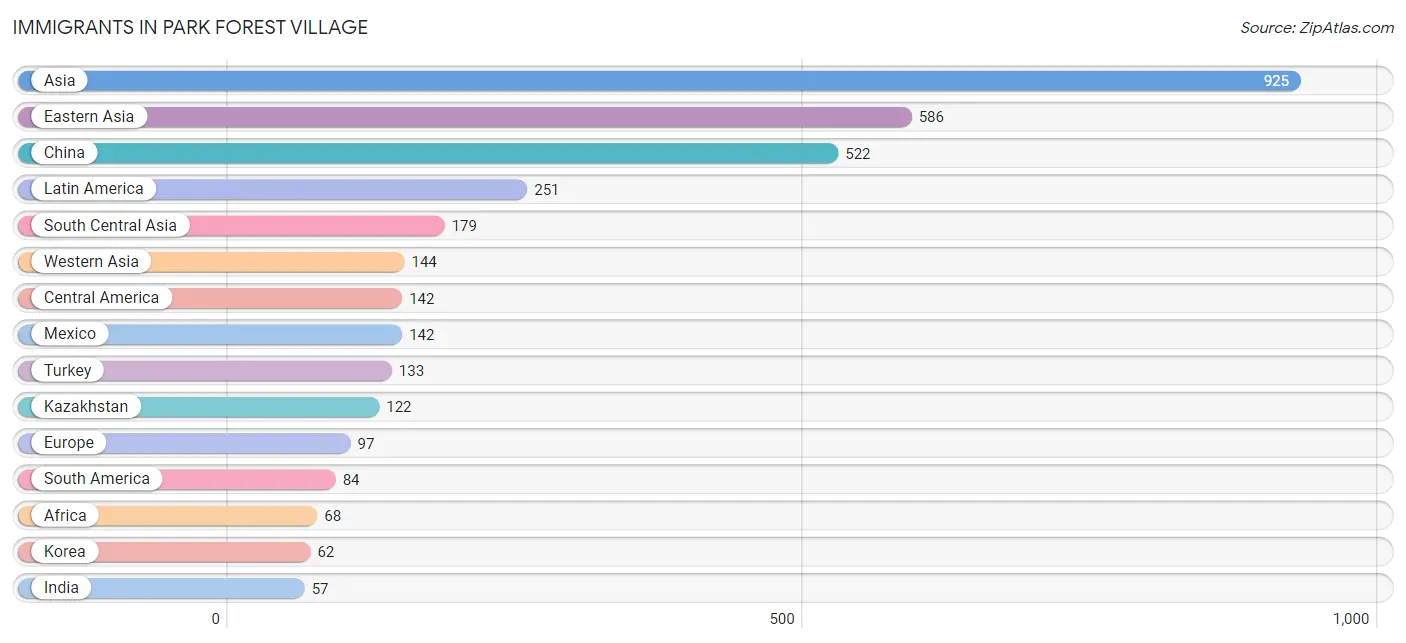
Immigrants in Park Forest Village
The most numerous immigrant groups reported in Park Forest Village came from Asia (925 | 10.3%), Eastern Asia (586 | 6.5%), China (522 | 5.8%), Latin America (251 | 2.8%), and South Central Asia (179 | 2.0%), together accounting for 27.5% of all Park Forest Village residents.
| Immigration Origin | # Population | % Population |
| Africa | 68 | 0.8% |
| Argentina | 17 | 0.2% |
| Asia | 925 | 10.3% |
| Canada | 6 | 0.1% |
| Caribbean | 25 | 0.3% |
| Central America | 142 | 1.6% |
| China | 522 | 5.8% |
| Colombia | 28 | 0.3% |
| Eastern Asia | 586 | 6.5% |
| Eastern Europe | 30 | 0.3% |
| Ecuador | 39 | 0.4% |
| Europe | 97 | 1.1% |
| France | 18 | 0.2% |
| Germany | 15 | 0.2% |
| Haiti | 25 | 0.3% |
| India | 57 | 0.6% |
| Israel | 11 | 0.1% |
| Japan | 2 | 0.0% |
| Kazakhstan | 122 | 1.4% |
| Korea | 62 | 0.7% |
| Latin America | 251 | 2.8% |
| Mexico | 142 | 1.6% |
| Nigeria | 52 | 0.6% |
| Northern Europe | 17 | 0.2% |
| Oceania | 7 | 0.1% |
| Poland | 14 | 0.2% |
| Russia | 16 | 0.2% |
| South America | 84 | 0.9% |
| South Central Asia | 179 | 2.0% |
| South Eastern Asia | 16 | 0.2% |
| Southern Europe | 17 | 0.2% |
| Spain | 17 | 0.2% |
| Taiwan | 29 | 0.3% |
| Thailand | 16 | 0.2% |
| Turkey | 133 | 1.5% |
| Western Africa | 52 | 0.6% |
| Western Asia | 144 | 1.6% |
| Western Europe | 33 | 0.4% | View All 38 Rows |
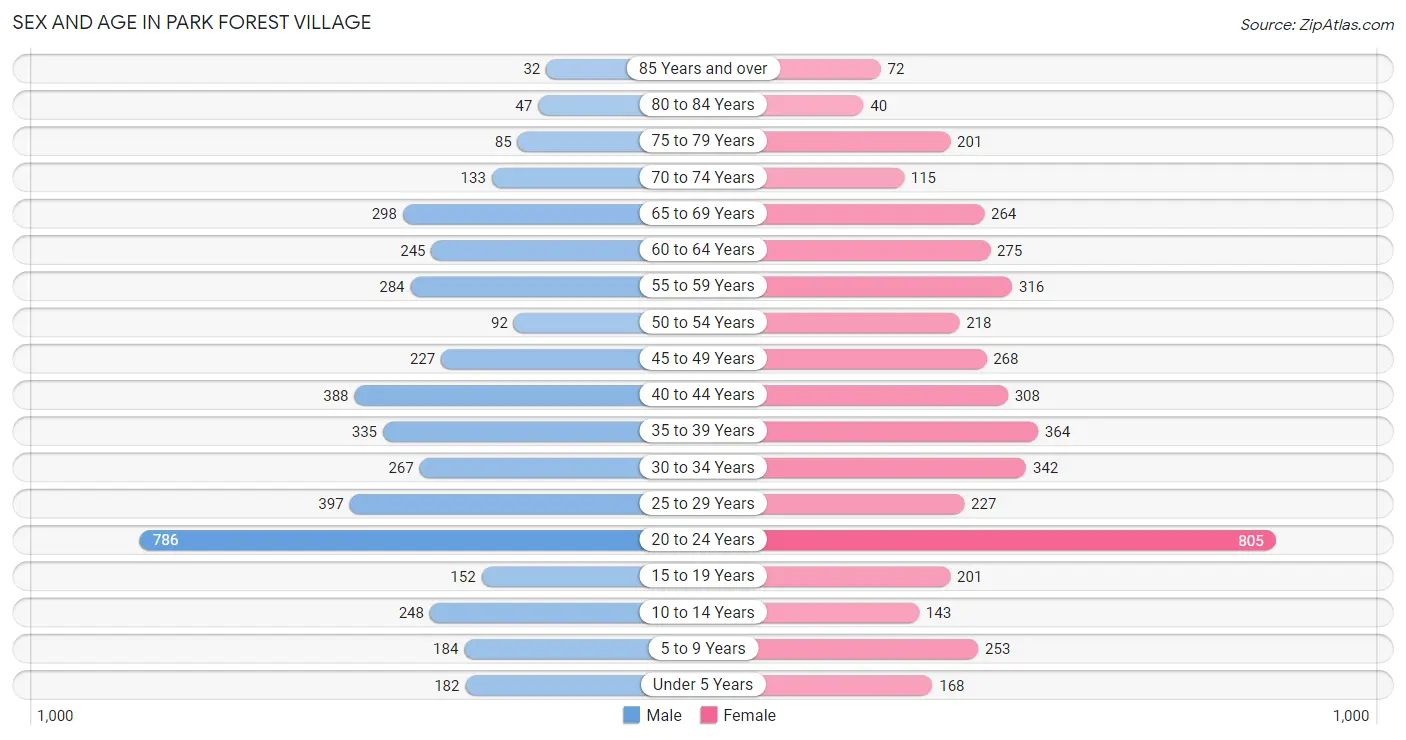
Sex and Age in Park Forest Village
Sex and Age in Park Forest Village
The most populous age groups in Park Forest Village are 20 to 24 Years (786 | 17.9%) for men and 20 to 24 Years (805 | 17.6%) for women.
| Age Bracket | Male | Female |
| Under 5 Years | 182 (4.2%) | 168 (3.7%) |
| 5 to 9 Years | 184 (4.2%) | 253 (5.5%) |
| 10 to 14 Years | 248 (5.7%) | 143 (3.1%) |
| 15 to 19 Years | 152 (3.5%) | 201 (4.4%) |
| 20 to 24 Years | 786 (17.9%) | 805 (17.6%) |
| 25 to 29 Years | 397 (9.1%) | 227 (5.0%) |
| 30 to 34 Years | 267 (6.1%) | 342 (7.5%) |
| 35 to 39 Years | 335 (7.6%) | 364 (8.0%) |
| 40 to 44 Years | 388 (8.8%) | 308 (6.7%) |
| 45 to 49 Years | 227 (5.2%) | 268 (5.9%) |
| 50 to 54 Years | 92 (2.1%) | 218 (4.8%) |
| 55 to 59 Years | 284 (6.5%) | 316 (6.9%) |
| 60 to 64 Years | 245 (5.6%) | 275 (6.0%) |
| 65 to 69 Years | 298 (6.8%) | 264 (5.8%) |
| 70 to 74 Years | 133 (3.0%) | 115 (2.5%) |
| 75 to 79 Years | 85 (1.9%) | 201 (4.4%) |
| 80 to 84 Years | 47 (1.1%) | 40 (0.9%) |
| 85 Years and over | 32 (0.7%) | 72 (1.6%) |
| Total | 4,382 (100.0%) | 4,580 (100.0%) |
Families and Households in Park Forest Village
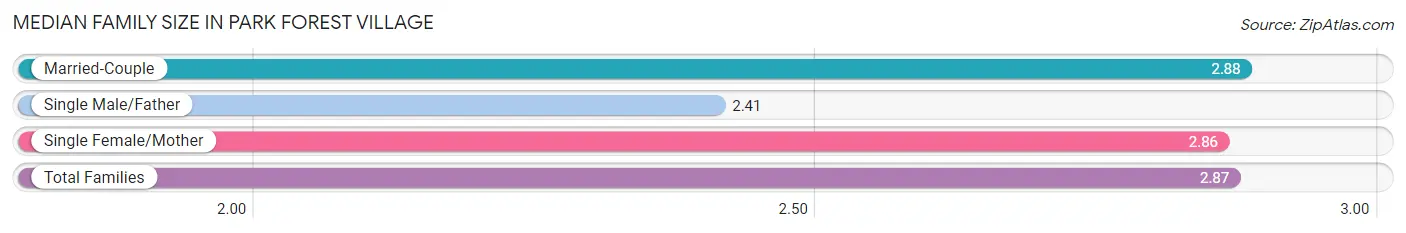
Median Family Size in Park Forest Village
The median family size in Park Forest Village is 2.87 persons per family, with married-couple families (1,808 | 87.9%) accounting for the largest median family size of 2.88 persons per family. On the other hand, single male/father families (58 | 2.8%) represent the smallest median family size with 2.41 persons per family.
| Family Type | # Families | Family Size |
| Married-Couple | 1,808 (87.9%) | 2.88 |
| Single Male/Father | 58 (2.8%) | 2.41 |
| Single Female/Mother | 190 (9.2%) | 2.86 |
| Total Families | 2,056 (100.0%) | 2.87 |
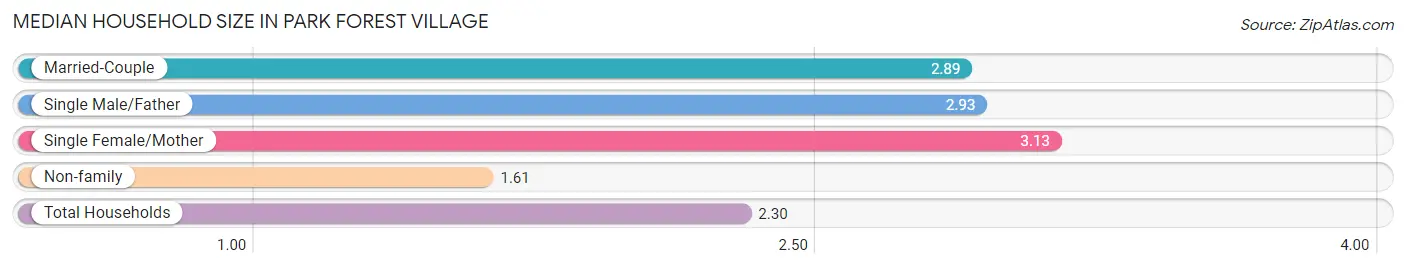
Median Household Size in Park Forest Village
The median household size in Park Forest Village is 2.30 persons per household, with single female/mother households (190 | 4.9%) accounting for the largest median household size of 3.13 persons per household. non-family households (1,815 | 46.9%) represent the smallest median household size with 1.61 persons per household.
| Household Type | # Households | Household Size |
| Married-Couple | 1,808 (46.7%) | 2.89 |
| Single Male/Father | 58 (1.5%) | 2.93 |
| Single Female/Mother | 190 (4.9%) | 3.13 |
| Non-family | 1,815 (46.9%) | 1.61 |
| Total Households | 3,871 (100.0%) | 2.30 |
Household Size by Marriage Status in Park Forest Village
Out of a total of 3,871 households in Park Forest Village, 2,056 (53.1%) are family households, while 1,815 (46.9%) are nonfamily households. The most numerous type of family households are 2-person households, comprising 939, and the most common type of nonfamily households are 1-person households, comprising 1,360.
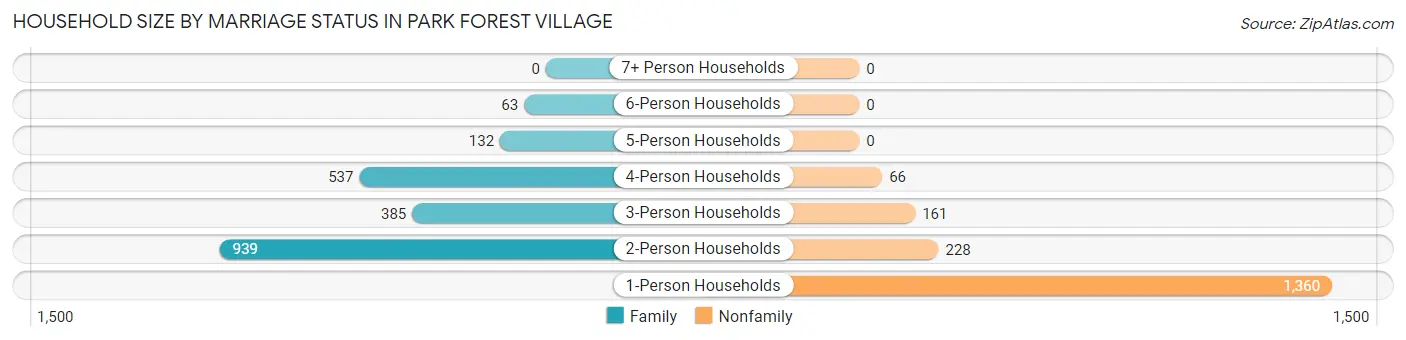
| Household Size | Family Households | Nonfamily Households |
| 1-Person Households | - | 1,360 (35.1%) |
| 2-Person Households | 939 (24.3%) | 228 (5.9%) |
| 3-Person Households | 385 (10.0%) | 161 (4.2%) |
| 4-Person Households | 537 (13.9%) | 66 (1.7%) |
| 5-Person Households | 132 (3.4%) | 0 (0.0%) |
| 6-Person Households | 63 (1.6%) | 0 (0.0%) |
| 7+ Person Households | 0 (0.0%) | 0 (0.0%) |
| Total | 2,056 (53.1%) | 1,815 (46.9%) |
Female Fertility in Park Forest Village
Fertility by Age in Park Forest Village
Average fertility rate in Park Forest Village is 19.0 births per 1,000 women. Women in the age bracket of 20 to 34 years have the highest fertility rate with 27.0 births per 1,000 women. Women in the age bracket of 20 to 34 years acount for 77.1% of all women with births.
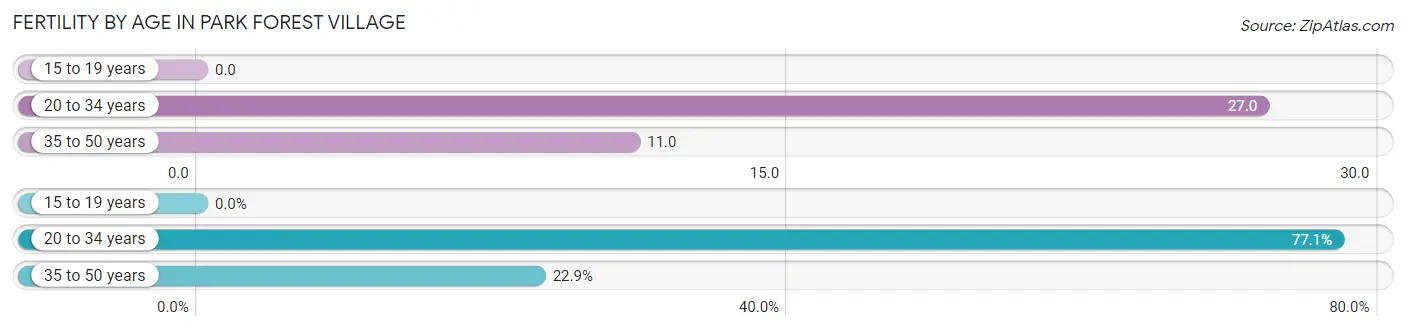
| Age Bracket | Women with Births | Births / 1,000 Women |
| 15 to 19 years | 0 (0.0%) | 0.0 |
| 20 to 34 years | 37 (77.1%) | 27.0 |
| 35 to 50 years | 11 (22.9%) | 11.0 |
| Total | 48 (100.0%) | 19.0 |
Fertility by Age by Marriage Status in Park Forest Village
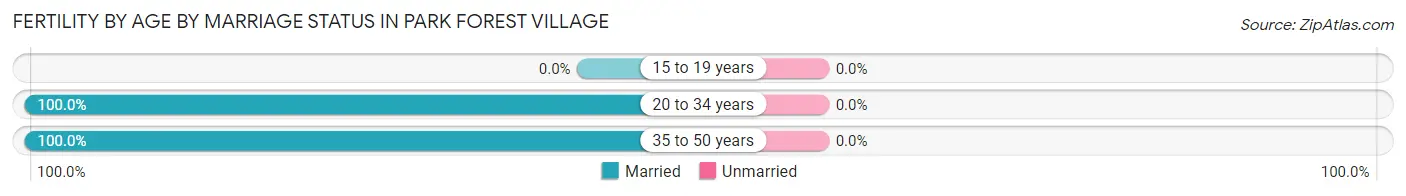
| Age Bracket | Married | Unmarried |
| 15 to 19 years | 0 (0.0%) | 0 (0.0%) |
| 20 to 34 years | 37 (100.0%) | 0 (0.0%) |
| 35 to 50 years | 11 (100.0%) | 0 (0.0%) |
| Total | 48 (100.0%) | 0 (0.0%) |
Fertility by Education in Park Forest Village
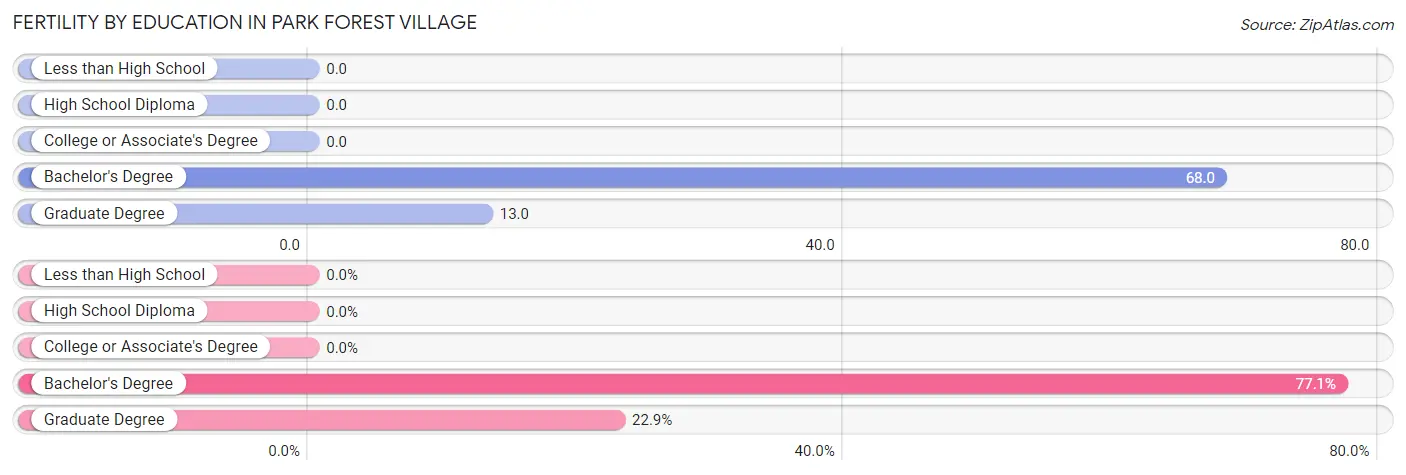
| Educational Attainment | Women with Births | Births / 1,000 Women |
| Less than High School | 0 (0.0%) | 0.0 |
| High School Diploma | 0 (0.0%) | 0.0 |
| College or Associate's Degree | 0 (0.0%) | 0.0 |
| Bachelor's Degree | 37 (77.1%) | 68.0 |
| Graduate Degree | 11 (22.9%) | 13.0 |
| Total | 48 (100.0%) | 19.0 |
Fertility by Education by Marriage Status in Park Forest Village
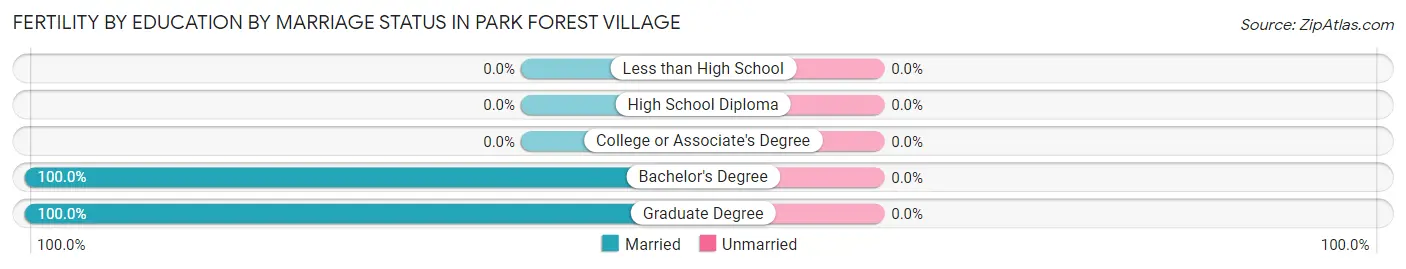
| Educational Attainment | Married | Unmarried |
| Less than High School | 0 (0.0%) | 0 (0.0%) |
| High School Diploma | 0 (0.0%) | 0 (0.0%) |
| College or Associate's Degree | 0 (0.0%) | 0 (0.0%) |
| Bachelor's Degree | 37 (100.0%) | 0 (0.0%) |
| Graduate Degree | 11 (100.0%) | 0 (0.0%) |
| Total | 48 (100.0%) | 0 (0.0%) |
Employment Characteristics in Park Forest Village
Employment by Class of Employer in Park Forest Village
Among the 4,382 employed individuals in Park Forest Village, private company employees (1,882 | 42.9%), state government employees (1,086 | 24.8%), and not-for-profit organizations (1,018 | 23.2%) make up the most common classes of employment.
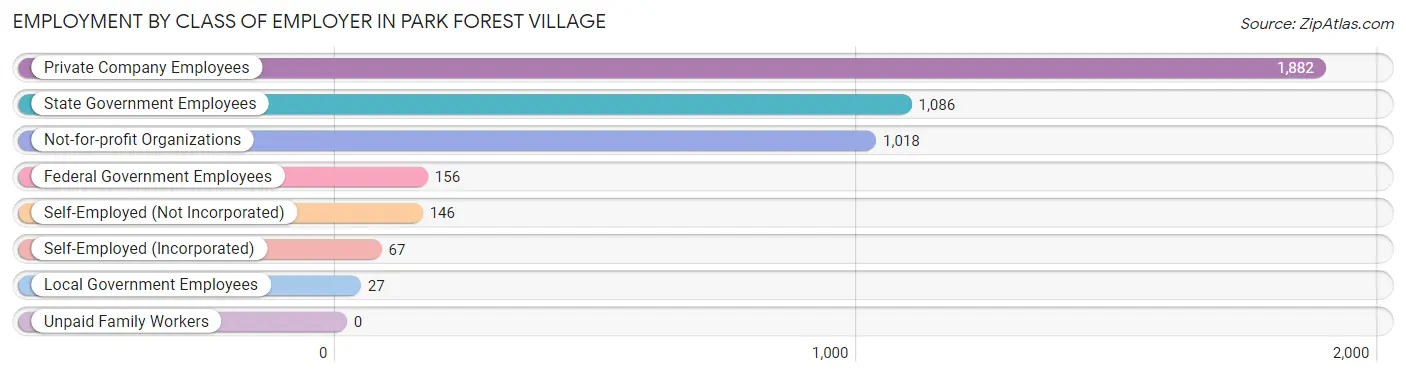
| Employer Class | # Employees | % Employees |
| Private Company Employees | 1,882 | 42.9% |
| Self-Employed (Incorporated) | 67 | 1.5% |
| Self-Employed (Not Incorporated) | 146 | 3.3% |
| Not-for-profit Organizations | 1,018 | 23.2% |
| Local Government Employees | 27 | 0.6% |
| State Government Employees | 1,086 | 24.8% |
| Federal Government Employees | 156 | 3.6% |
| Unpaid Family Workers | 0 | 0.0% |
| Total | 4,382 | 100.0% |
Employment Status by Age in Park Forest Village
According to the labor force statistics for Park Forest Village, out of the total population over 16 years of age (7,664), 60.5% or 4,637 individuals are in the labor force, with 4.7% or 218 of them unemployed. The age group with the highest labor force participation rate is 45 to 54 years, with 89.6% or 721 individuals in the labor force. Within the labor force, the 25 to 29 years age range has the highest percentage of unemployed individuals, with 21.6% or 117 of them being unemployed.
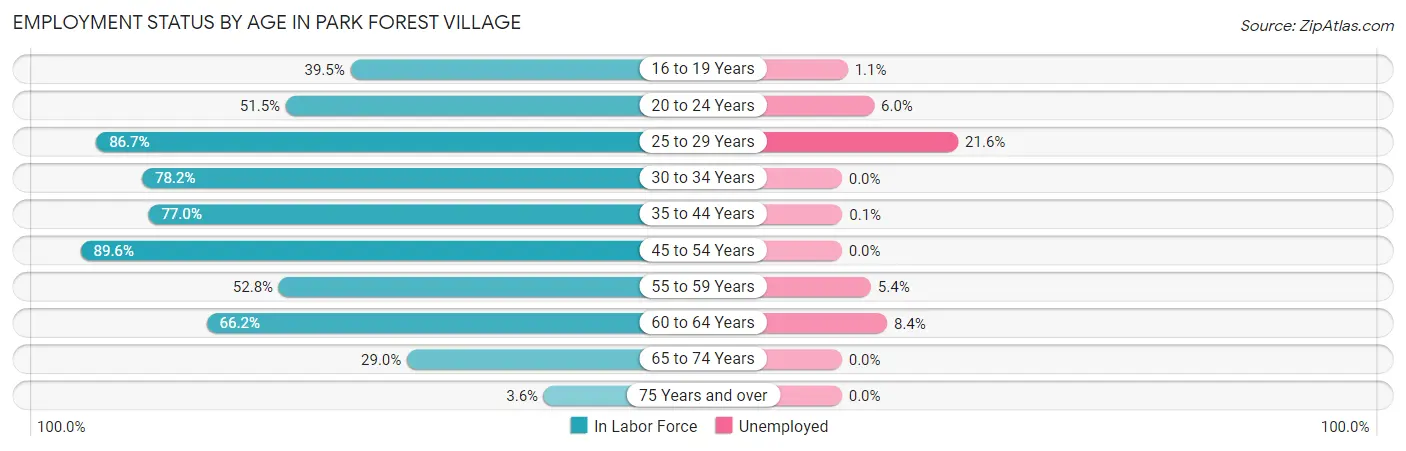
| Age Bracket | In Labor Force | Unemployed |
| 16 to 19 Years | 92 (39.5%) | 1 (1.1%) |
| 20 to 24 Years | 819 (51.5%) | 49 (6.0%) |
| 25 to 29 Years | 541 (86.7%) | 117 (21.6%) |
| 30 to 34 Years | 476 (78.2%) | 0 (0.0%) |
| 35 to 44 Years | 1,074 (77.0%) | 1 (0.1%) |
| 45 to 54 Years | 721 (89.6%) | 0 (0.0%) |
| 55 to 59 Years | 317 (52.8%) | 17 (5.4%) |
| 60 to 64 Years | 344 (66.2%) | 29 (8.4%) |
| 65 to 74 Years | 235 (29.0%) | 0 (0.0%) |
| 75 Years and over | 17 (3.6%) | 0 (0.0%) |
| Total | 4,637 (60.5%) | 218 (4.7%) |
Employment Status by Educational Attainment in Park Forest Village
According to labor force statistics for Park Forest Village, 76.3% of individuals (3,474) out of the total population between 25 and 64 years of age (4,553) are in the labor force, with 4.8% or 167 of them being unemployed. The group with the highest labor force participation rate are those with the educational attainment of less than high school, with 100.0% or 47 individuals in the labor force. Within the labor force, individuals with high school diploma education have the highest percentage of unemployment, with 19.4% or 111 of them being unemployed.
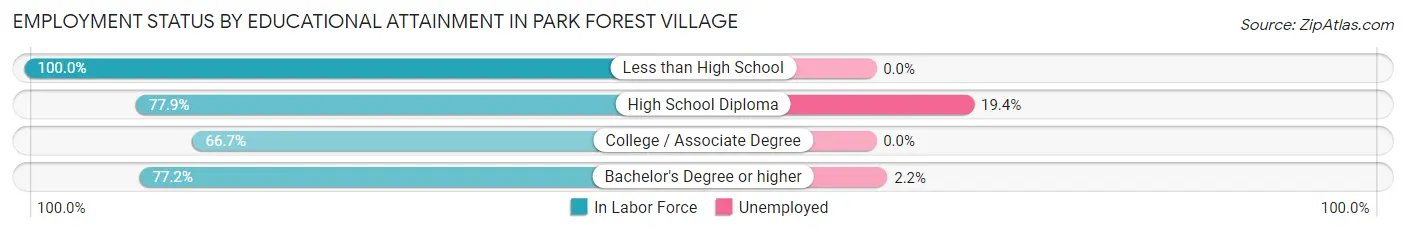
| Educational Attainment | In Labor Force | Unemployed |
| Less than High School | 47 (100.0%) | 0 (0.0%) |
| High School Diploma | 572 (77.9%) | 142 (19.4%) |
| College / Associate Degree | 364 (66.7%) | 0 (0.0%) |
| Bachelor's Degree or higher | 2,490 (77.2%) | 71 (2.2%) |
| Total | 3,474 (76.3%) | 219 (4.8%) |
Employment Occupations by Sex in Park Forest Village
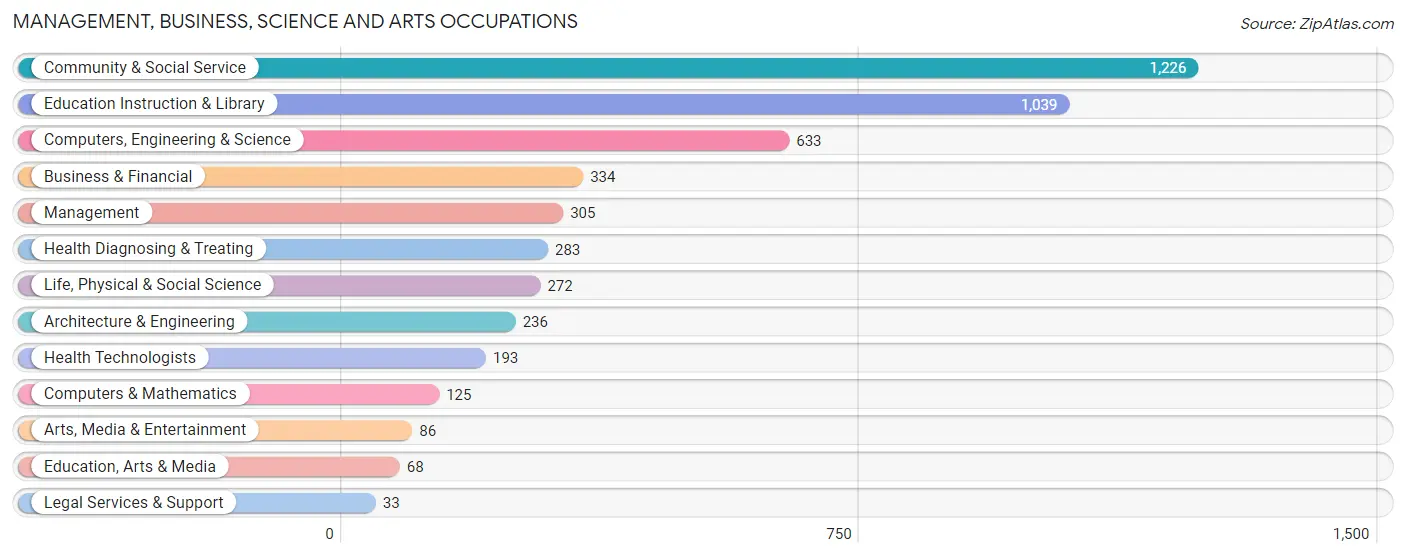
Management, Business, Science and Arts Occupations
The most common Management, Business, Science and Arts occupations in Park Forest Village are Community & Social Service (1,226 | 28.1%), Education Instruction & Library (1,039 | 23.8%), Computers, Engineering & Science (633 | 14.5%), Business & Financial (334 | 7.7%), and Management (305 | 7.0%).
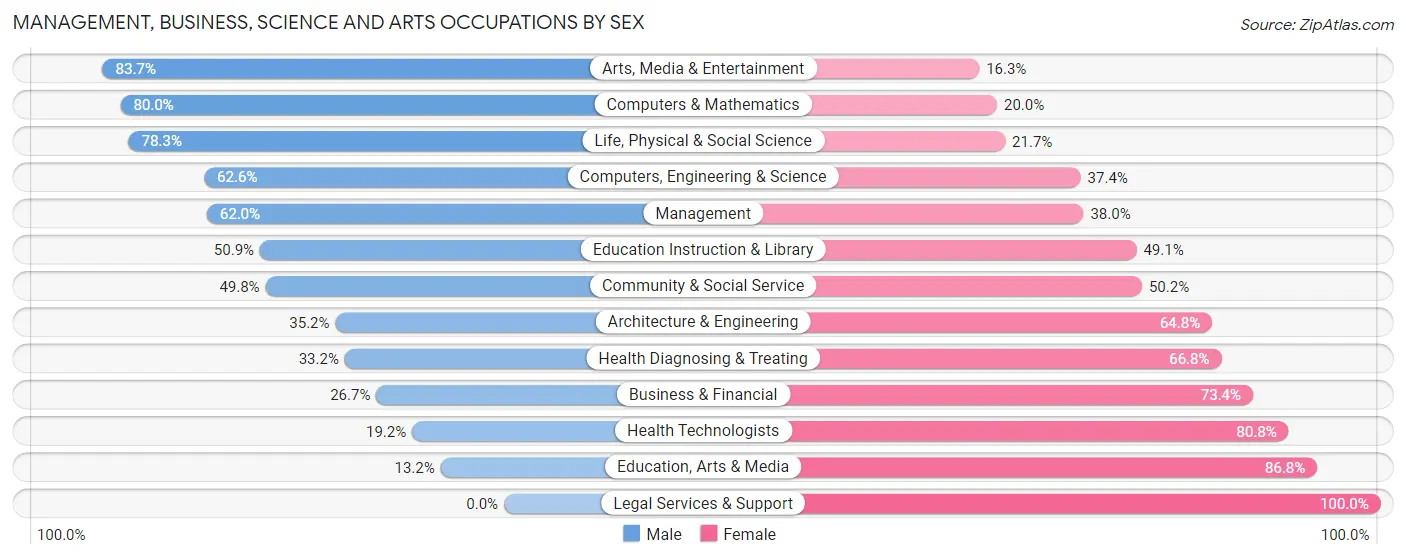
Management, Business, Science and Arts Occupations by Sex
Within the Management, Business, Science and Arts occupations in Park Forest Village, the most male-oriented occupations are Arts, Media & Entertainment (83.7%), Computers & Mathematics (80.0%), and Life, Physical & Social Science (78.3%), while the most female-oriented occupations are Legal Services & Support (100.0%), Education, Arts & Media (86.8%), and Health Technologists (80.8%).
| Occupation | Male | Female |
| Management | 189 (62.0%) | 116 (38.0%) |
| Business & Financial | 89 (26.7%) | 245 (73.4%) |
| Computers, Engineering & Science | 396 (62.6%) | 237 (37.4%) |
| Computers & Mathematics | 100 (80.0%) | 25 (20.0%) |
| Architecture & Engineering | 83 (35.2%) | 153 (64.8%) |
| Life, Physical & Social Science | 213 (78.3%) | 59 (21.7%) |
| Community & Social Service | 610 (49.8%) | 616 (50.2%) |
| Education, Arts & Media | 9 (13.2%) | 59 (86.8%) |
| Legal Services & Support | 0 (0.0%) | 33 (100.0%) |
| Education Instruction & Library | 529 (50.9%) | 510 (49.1%) |
| Arts, Media & Entertainment | 72 (83.7%) | 14 (16.3%) |
| Health Diagnosing & Treating | 94 (33.2%) | 189 (66.8%) |
| Health Technologists | 37 (19.2%) | 156 (80.8%) |
| Total (Category) | 1,378 (49.5%) | 1,403 (50.4%) |
| Total (Overall) | 2,229 (51.1%) | 2,133 (48.9%) |
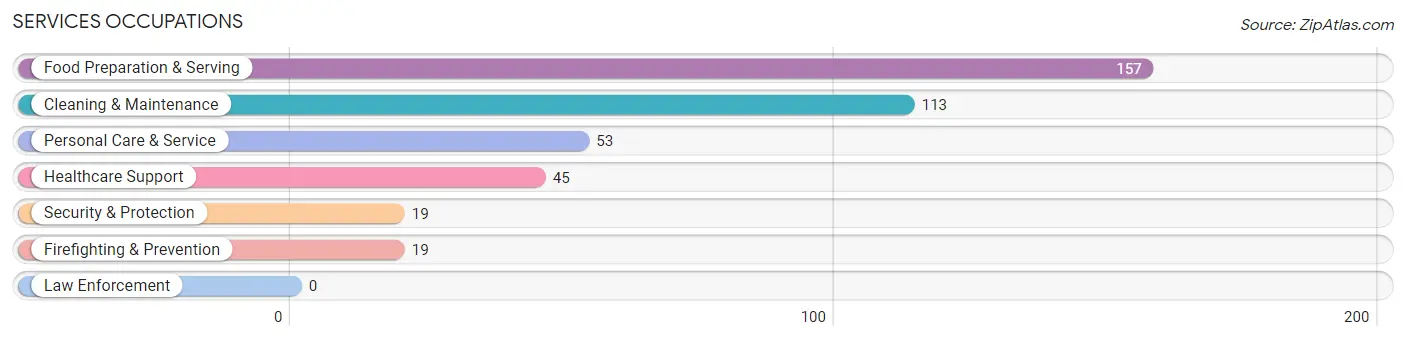
Services Occupations
The most common Services occupations in Park Forest Village are Food Preparation & Serving (157 | 3.6%), Cleaning & Maintenance (113 | 2.6%), Personal Care & Service (53 | 1.2%), Healthcare Support (45 | 1.0%), and Security & Protection (19 | 0.4%).
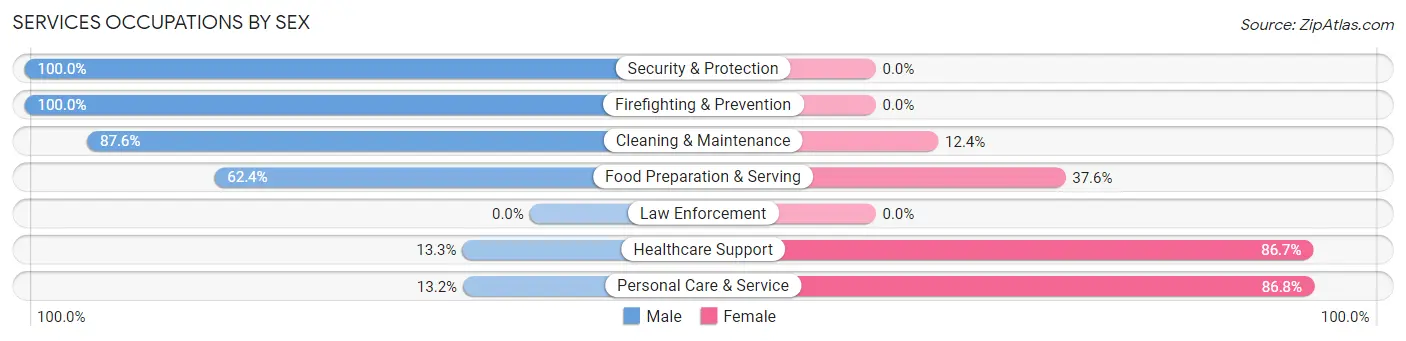
Services Occupations by Sex
Within the Services occupations in Park Forest Village, the most male-oriented occupations are Security & Protection (100.0%), Firefighting & Prevention (100.0%), and Cleaning & Maintenance (87.6%), while the most female-oriented occupations are Personal Care & Service (86.8%), Healthcare Support (86.7%), and Food Preparation & Serving (37.6%).
| Occupation | Male | Female |
| Healthcare Support | 6 (13.3%) | 39 (86.7%) |
| Security & Protection | 19 (100.0%) | 0 (0.0%) |
| Firefighting & Prevention | 19 (100.0%) | 0 (0.0%) |
| Law Enforcement | 0 (0.0%) | 0 (0.0%) |
| Food Preparation & Serving | 98 (62.4%) | 59 (37.6%) |
| Cleaning & Maintenance | 99 (87.6%) | 14 (12.4%) |
| Personal Care & Service | 7 (13.2%) | 46 (86.8%) |
| Total (Category) | 229 (59.2%) | 158 (40.8%) |
| Total (Overall) | 2,229 (51.1%) | 2,133 (48.9%) |
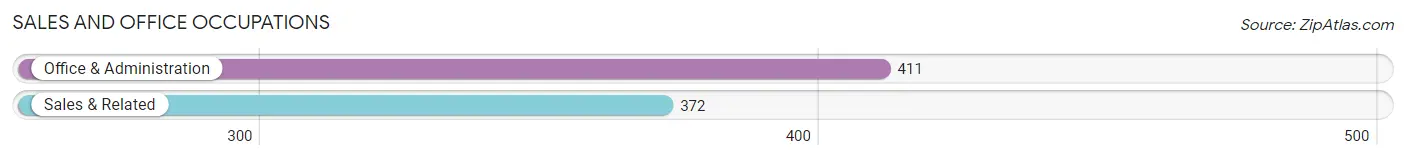
Sales and Office Occupations
The most common Sales and Office occupations in Park Forest Village are Office & Administration (411 | 9.4%), and Sales & Related (372 | 8.5%).
Sales and Office Occupations by Sex
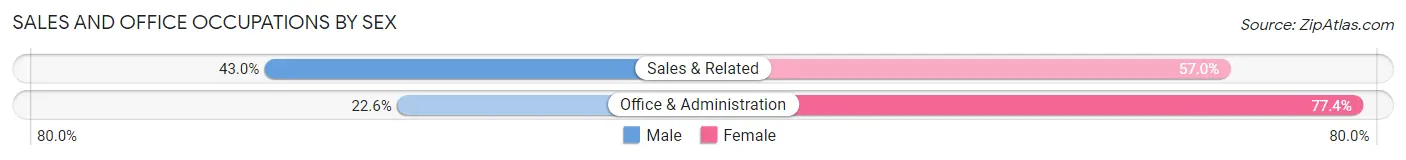
| Occupation | Male | Female |
| Sales & Related | 160 (43.0%) | 212 (57.0%) |
| Office & Administration | 93 (22.6%) | 318 (77.4%) |
| Total (Category) | 253 (32.3%) | 530 (67.7%) |
| Total (Overall) | 2,229 (51.1%) | 2,133 (48.9%) |
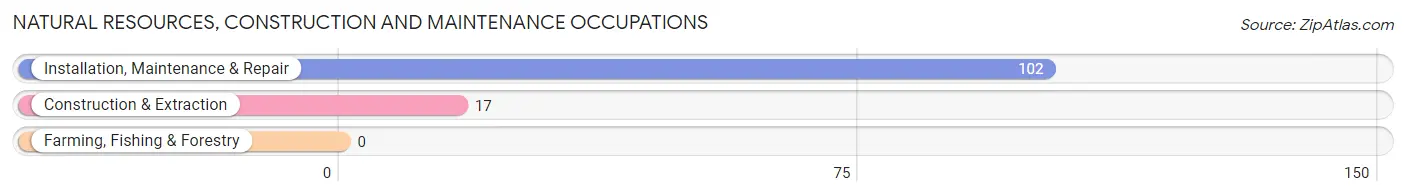
Natural Resources, Construction and Maintenance Occupations
The most common Natural Resources, Construction and Maintenance occupations in Park Forest Village are Installation, Maintenance & Repair (102 | 2.3%), and Construction & Extraction (17 | 0.4%).
Natural Resources, Construction and Maintenance Occupations by Sex
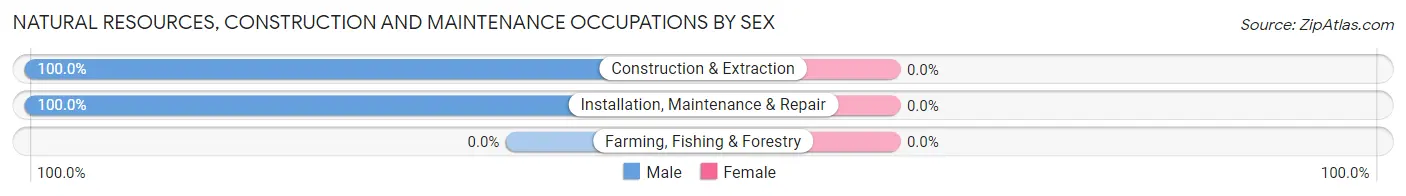
| Occupation | Male | Female |
| Farming, Fishing & Forestry | 0 (0.0%) | 0 (0.0%) |
| Construction & Extraction | 17 (100.0%) | 0 (0.0%) |
| Installation, Maintenance & Repair | 102 (100.0%) | 0 (0.0%) |
| Total (Category) | 119 (100.0%) | 0 (0.0%) |
| Total (Overall) | 2,229 (51.1%) | 2,133 (48.9%) |
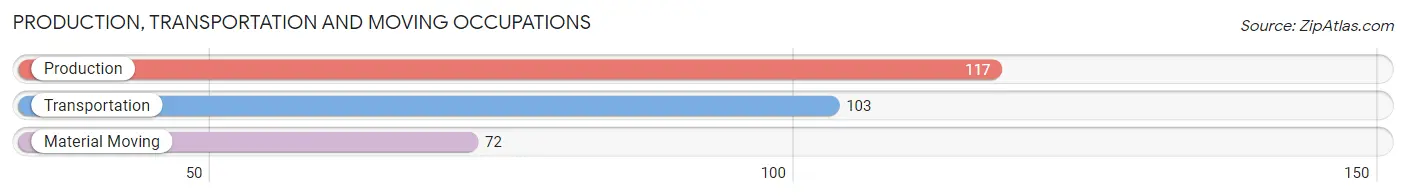
Production, Transportation and Moving Occupations
The most common Production, Transportation and Moving occupations in Park Forest Village are Production (117 | 2.7%), Transportation (103 | 2.4%), and Material Moving (72 | 1.7%).
Production, Transportation and Moving Occupations by Sex
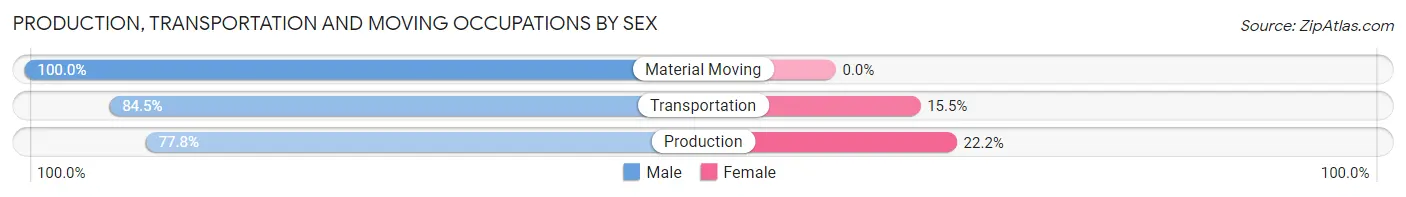
| Occupation | Male | Female |
| Production | 91 (77.8%) | 26 (22.2%) |
| Transportation | 87 (84.5%) | 16 (15.5%) |
| Material Moving | 72 (100.0%) | 0 (0.0%) |
| Total (Category) | 250 (85.6%) | 42 (14.4%) |
| Total (Overall) | 2,229 (51.1%) | 2,133 (48.9%) |
Employment Industries by Sex in Park Forest Village
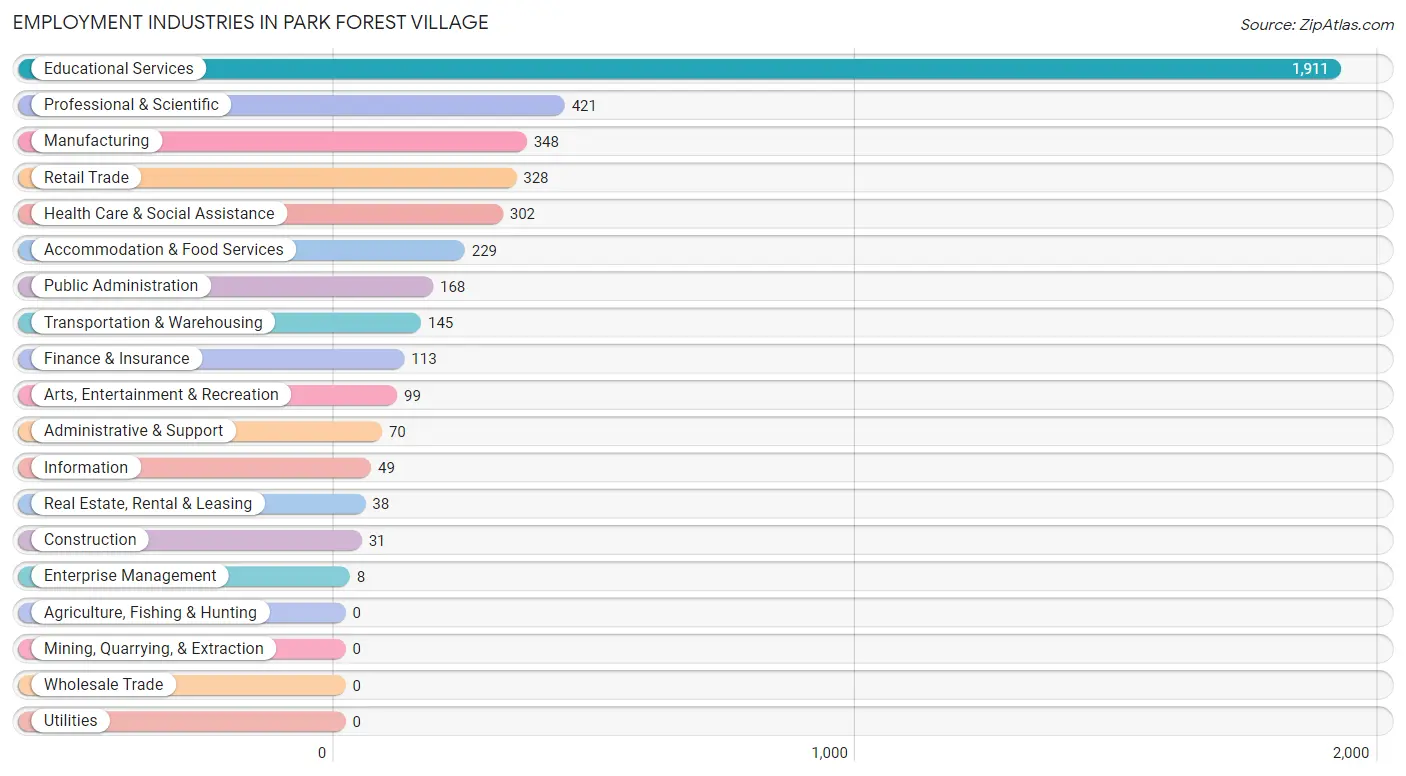
Employment Industries in Park Forest Village
The major employment industries in Park Forest Village include Educational Services (1,911 | 43.8%), Professional & Scientific (421 | 9.7%), Manufacturing (348 | 8.0%), Retail Trade (328 | 7.5%), and Health Care & Social Assistance (302 | 6.9%).
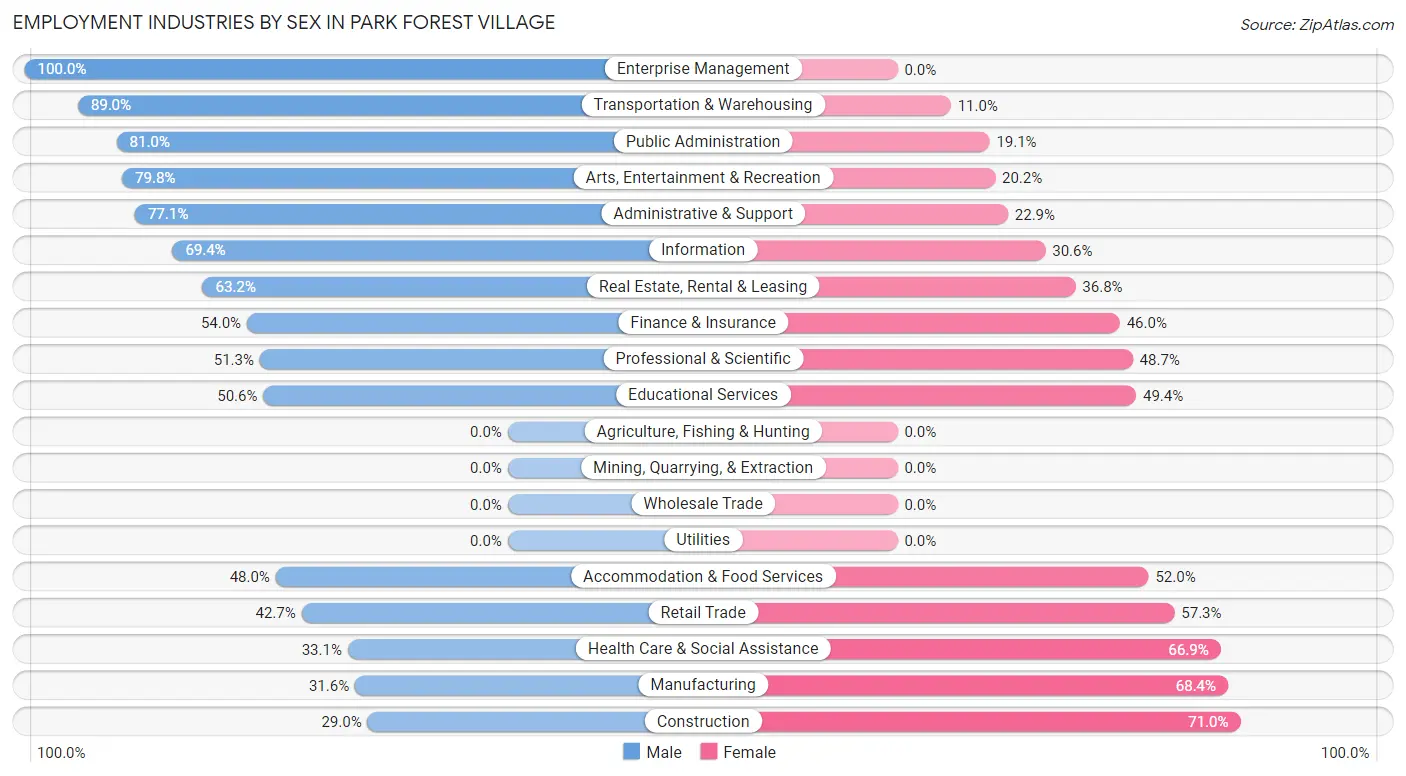
Employment Industries by Sex in Park Forest Village
The Park Forest Village industries that see more men than women are Enterprise Management (100.0%), Transportation & Warehousing (89.0%), and Public Administration (80.9%), whereas the industries that tend to have a higher number of women are Construction (71.0%), Manufacturing (68.4%), and Health Care & Social Assistance (66.9%).
| Industry | Male | Female |
| Agriculture, Fishing & Hunting | 0 (0.0%) | 0 (0.0%) |
| Mining, Quarrying, & Extraction | 0 (0.0%) | 0 (0.0%) |
| Construction | 9 (29.0%) | 22 (71.0%) |
| Manufacturing | 110 (31.6%) | 238 (68.4%) |
| Wholesale Trade | 0 (0.0%) | 0 (0.0%) |
| Retail Trade | 140 (42.7%) | 188 (57.3%) |
| Transportation & Warehousing | 129 (89.0%) | 16 (11.0%) |
| Utilities | 0 (0.0%) | 0 (0.0%) |
| Information | 34 (69.4%) | 15 (30.6%) |
| Finance & Insurance | 61 (54.0%) | 52 (46.0%) |
| Real Estate, Rental & Leasing | 24 (63.2%) | 14 (36.8%) |
| Professional & Scientific | 216 (51.3%) | 205 (48.7%) |
| Enterprise Management | 8 (100.0%) | 0 (0.0%) |
| Administrative & Support | 54 (77.1%) | 16 (22.9%) |
| Educational Services | 967 (50.6%) | 944 (49.4%) |
| Health Care & Social Assistance | 100 (33.1%) | 202 (66.9%) |
| Arts, Entertainment & Recreation | 79 (79.8%) | 20 (20.2%) |
| Accommodation & Food Services | 110 (48.0%) | 119 (52.0%) |
| Public Administration | 136 (80.9%) | 32 (19.1%) |
| Total | 2,229 (51.1%) | 2,133 (48.9%) |
Education in Park Forest Village
School Enrollment in Park Forest Village
The most common levels of schooling among the 3,363 students in Park Forest Village are college / undergraduate (1,469 | 43.7%), graduate / professional (741 | 22.0%), and elementary school (370 | 11.0%).
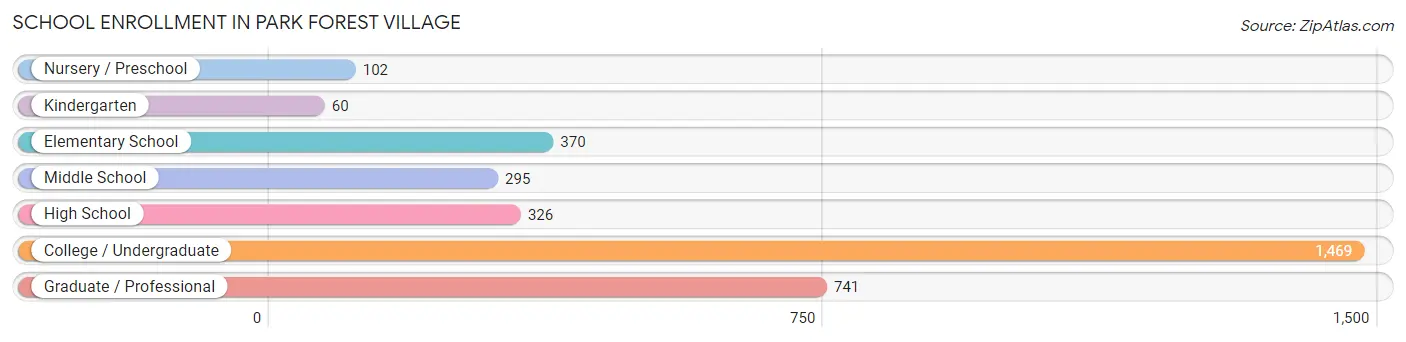
| School Level | # Students | % Students |
| Nursery / Preschool | 102 | 3.0% |
| Kindergarten | 60 | 1.8% |
| Elementary School | 370 | 11.0% |
| Middle School | 295 | 8.8% |
| High School | 326 | 9.7% |
| College / Undergraduate | 1,469 | 43.7% |
| Graduate / Professional | 741 | 22.0% |
| Total | 3,363 | 100.0% |
School Enrollment by Age by Funding Source in Park Forest Village
Out of a total of 3,363 students who are enrolled in schools in Park Forest Village, 269 (8.0%) attend a private institution, while the remaining 3,094 (92.0%) are enrolled in public schools. The age group of 3 to 4 year olds has the highest likelihood of being enrolled in private schools, with 69 (100.0% in the age bracket) enrolled. Conversely, the age group of 18 to 19 year olds has the lowest likelihood of being enrolled in a private school, with 96 (100.0% in the age bracket) attending a public institution.
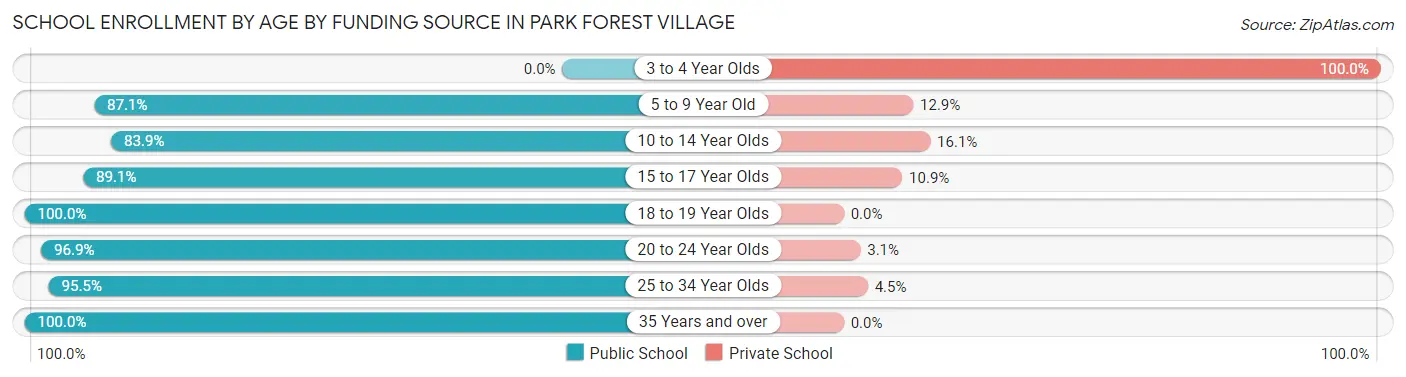
| Age Bracket | Public School | Private School |
| 3 to 4 Year Olds | 0 (0.0%) | 69 (100.0%) |
| 5 to 9 Year Old | 350 (87.1%) | 52 (12.9%) |
| 10 to 14 Year Olds | 328 (83.9%) | 63 (16.1%) |
| 15 to 17 Year Olds | 229 (89.1%) | 28 (10.9%) |
| 18 to 19 Year Olds | 96 (100.0%) | 0 (0.0%) |
| 20 to 24 Year Olds | 1,348 (96.9%) | 43 (3.1%) |
| 25 to 34 Year Olds | 277 (95.5%) | 13 (4.5%) |
| 35 Years and over | 467 (100.0%) | 0 (0.0%) |
| Total | 3,094 (92.0%) | 269 (8.0%) |
Educational Attainment by Field of Study in Park Forest Village
Education (565 | 12.1%), bio, nature & agricultural (536 | 11.5%), literature & languages (517 | 11.1%), engineering (436 | 9.3%), and science & technology (401 | 8.6%) are the most common fields of study among 4,673 individuals in Park Forest Village who have obtained a bachelor's degree or higher.
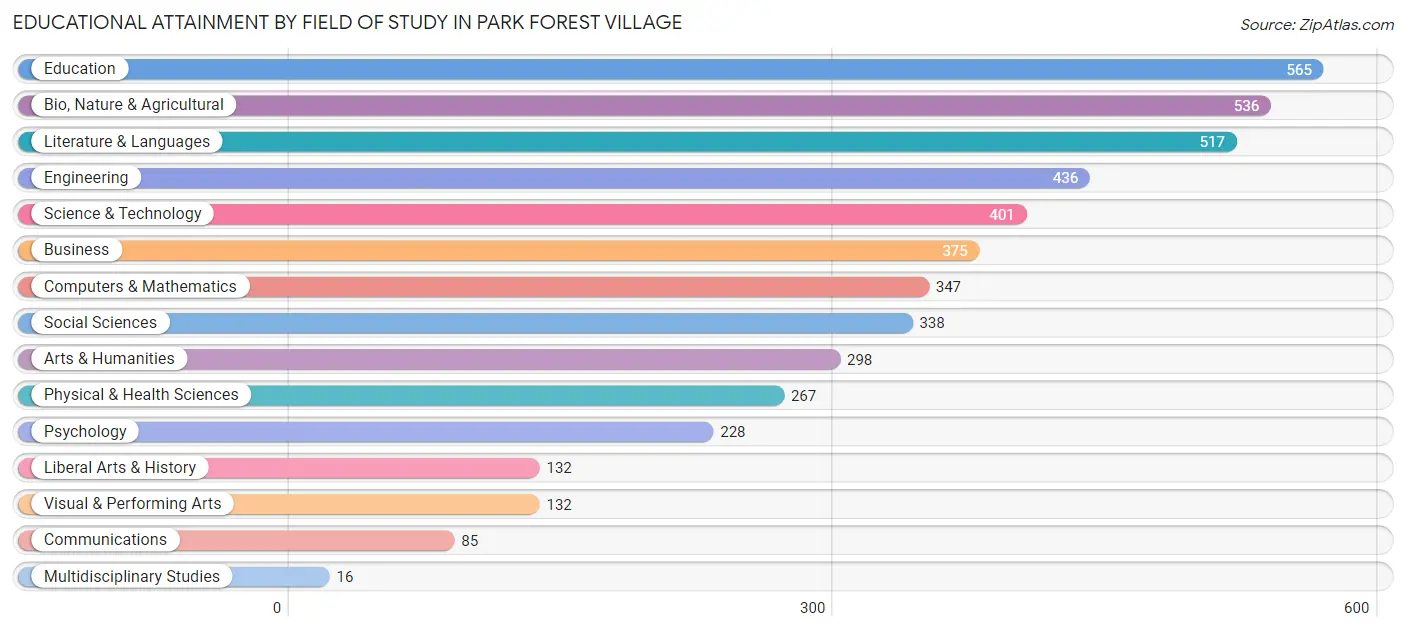
| Field of Study | # Graduates | % Graduates |
| Computers & Mathematics | 347 | 7.4% |
| Bio, Nature & Agricultural | 536 | 11.5% |
| Physical & Health Sciences | 267 | 5.7% |
| Psychology | 228 | 4.9% |
| Social Sciences | 338 | 7.2% |
| Engineering | 436 | 9.3% |
| Multidisciplinary Studies | 16 | 0.3% |
| Science & Technology | 401 | 8.6% |
| Business | 375 | 8.0% |
| Education | 565 | 12.1% |
| Literature & Languages | 517 | 11.1% |
| Liberal Arts & History | 132 | 2.8% |
| Visual & Performing Arts | 132 | 2.8% |
| Communications | 85 | 1.8% |
| Arts & Humanities | 298 | 6.4% |
| Total | 4,673 | 100.0% |
Transportation & Commute in Park Forest Village
Vehicle Availability by Sex in Park Forest Village
The most prevalent vehicle ownership categories in Park Forest Village are males with 2 vehicles (882, accounting for 39.1%) and females with 2 vehicles (881, making up 41.6%).
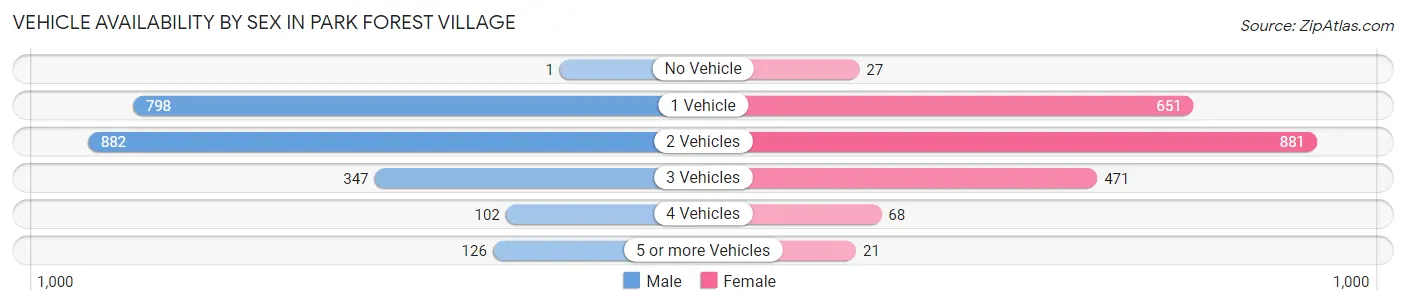
| Vehicles Available | Male | Female |
| No Vehicle | 1 (0.0%) | 27 (1.3%) |
| 1 Vehicle | 798 (35.4%) | 651 (30.7%) |
| 2 Vehicles | 882 (39.1%) | 881 (41.6%) |
| 3 Vehicles | 347 (15.4%) | 471 (22.2%) |
| 4 Vehicles | 102 (4.5%) | 68 (3.2%) |
| 5 or more Vehicles | 126 (5.6%) | 21 (1.0%) |
| Total | 2,256 (100.0%) | 2,119 (100.0%) |
Commute Time in Park Forest Village
The most frequently occuring commute durations in Park Forest Village are 15 to 19 minutes (1,109 commuters, 32.3%), 10 to 14 minutes (783 commuters, 22.8%), and 5 to 9 minutes (715 commuters, 20.8%).
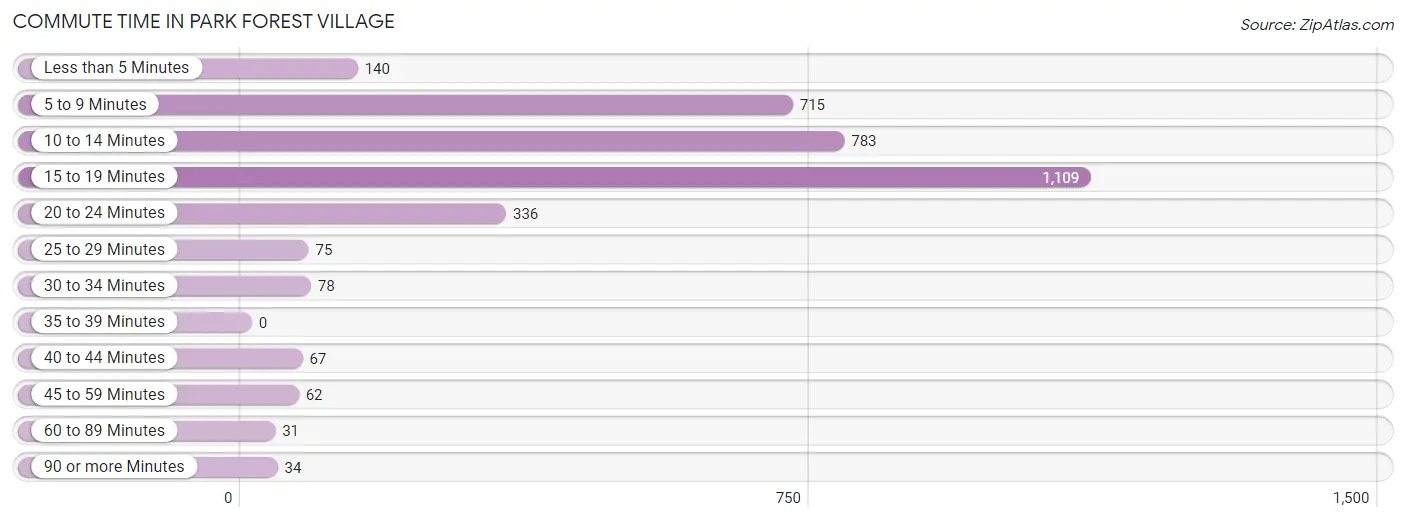
| Commute Time | # Commuters | % Commuters |
| Less than 5 Minutes | 140 | 4.1% |
| 5 to 9 Minutes | 715 | 20.8% |
| 10 to 14 Minutes | 783 | 22.8% |
| 15 to 19 Minutes | 1,109 | 32.3% |
| 20 to 24 Minutes | 336 | 9.8% |
| 25 to 29 Minutes | 75 | 2.2% |
| 30 to 34 Minutes | 78 | 2.3% |
| 35 to 39 Minutes | 0 | 0.0% |
| 40 to 44 Minutes | 67 | 1.9% |
| 45 to 59 Minutes | 62 | 1.8% |
| 60 to 89 Minutes | 31 | 0.9% |
| 90 or more Minutes | 34 | 1.0% |
Commute Time by Sex in Park Forest Village
The most common commute times in Park Forest Village are 15 to 19 minutes (624 commuters, 32.5%) for males and 15 to 19 minutes (485 commuters, 32.1%) for females.
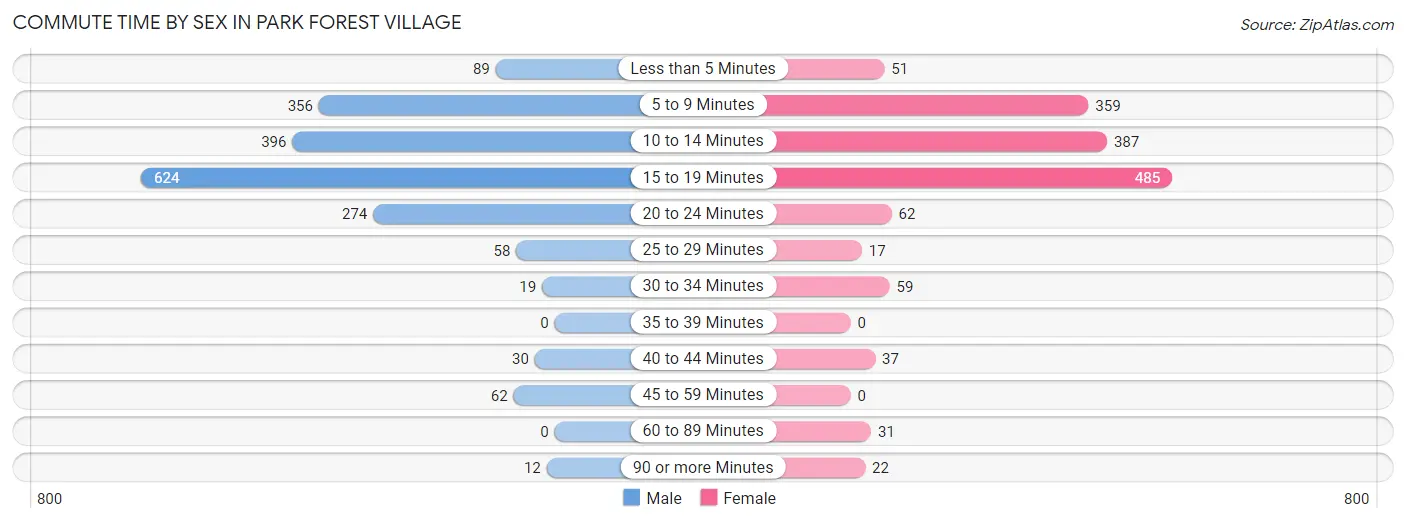
| Commute Time | Male | Female |
| Less than 5 Minutes | 89 (4.6%) | 51 (3.4%) |
| 5 to 9 Minutes | 356 (18.5%) | 359 (23.8%) |
| 10 to 14 Minutes | 396 (20.6%) | 387 (25.6%) |
| 15 to 19 Minutes | 624 (32.5%) | 485 (32.1%) |
| 20 to 24 Minutes | 274 (14.3%) | 62 (4.1%) |
| 25 to 29 Minutes | 58 (3.0%) | 17 (1.1%) |
| 30 to 34 Minutes | 19 (1.0%) | 59 (3.9%) |
| 35 to 39 Minutes | 0 (0.0%) | 0 (0.0%) |
| 40 to 44 Minutes | 30 (1.6%) | 37 (2.5%) |
| 45 to 59 Minutes | 62 (3.2%) | 0 (0.0%) |
| 60 to 89 Minutes | 0 (0.0%) | 31 (2.1%) |
| 90 or more Minutes | 12 (0.6%) | 22 (1.5%) |
Time of Departure to Work by Sex in Park Forest Village
The most frequent times of departure to work in Park Forest Village are 8:00 AM to 8:29 AM (380, 19.8%) for males and 8:00 AM to 8:29 AM (397, 26.3%) for females.
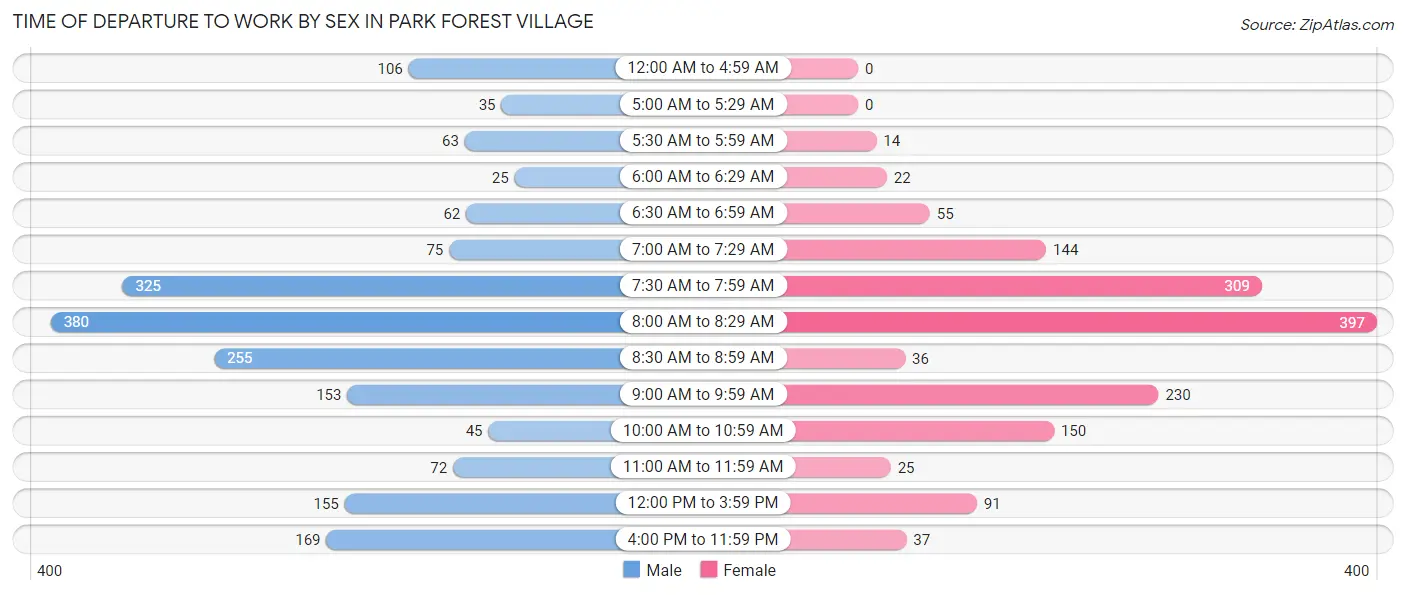
| Time of Departure | Male | Female |
| 12:00 AM to 4:59 AM | 106 (5.5%) | 0 (0.0%) |
| 5:00 AM to 5:29 AM | 35 (1.8%) | 0 (0.0%) |
| 5:30 AM to 5:59 AM | 63 (3.3%) | 14 (0.9%) |
| 6:00 AM to 6:29 AM | 25 (1.3%) | 22 (1.5%) |
| 6:30 AM to 6:59 AM | 62 (3.2%) | 55 (3.6%) |
| 7:00 AM to 7:29 AM | 75 (3.9%) | 144 (9.5%) |
| 7:30 AM to 7:59 AM | 325 (16.9%) | 309 (20.5%) |
| 8:00 AM to 8:29 AM | 380 (19.8%) | 397 (26.3%) |
| 8:30 AM to 8:59 AM | 255 (13.3%) | 36 (2.4%) |
| 9:00 AM to 9:59 AM | 153 (8.0%) | 230 (15.2%) |
| 10:00 AM to 10:59 AM | 45 (2.3%) | 150 (9.9%) |
| 11:00 AM to 11:59 AM | 72 (3.7%) | 25 (1.7%) |
| 12:00 PM to 3:59 PM | 155 (8.1%) | 91 (6.0%) |
| 4:00 PM to 11:59 PM | 169 (8.8%) | 37 (2.5%) |
| Total | 1,920 (100.0%) | 1,510 (100.0%) |
Housing Occupancy in Park Forest Village
Occupancy by Ownership in Park Forest Village
Of the total 3,871 dwellings in Park Forest Village, owner-occupied units account for 2,120 (54.8%), while renter-occupied units make up 1,751 (45.2%).
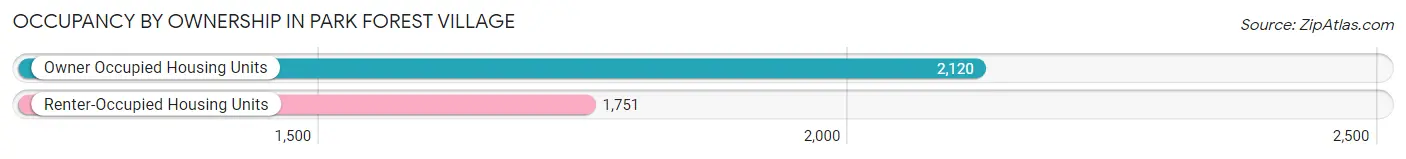
| Occupancy | # Housing Units | % Housing Units |
| Owner Occupied Housing Units | 2,120 | 54.8% |
| Renter-Occupied Housing Units | 1,751 | 45.2% |
| Total Occupied Housing Units | 3,871 | 100.0% |
Occupancy by Household Size in Park Forest Village
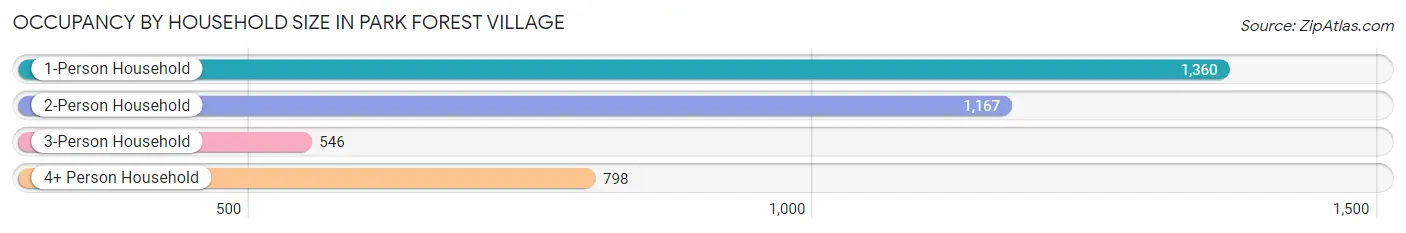
| Household Size | # Housing Units | % Housing Units |
| 1-Person Household | 1,360 | 35.1% |
| 2-Person Household | 1,167 | 30.1% |
| 3-Person Household | 546 | 14.1% |
| 4+ Person Household | 798 | 20.6% |
| Total Housing Units | 3,871 | 100.0% |
Occupancy by Ownership by Household Size in Park Forest Village
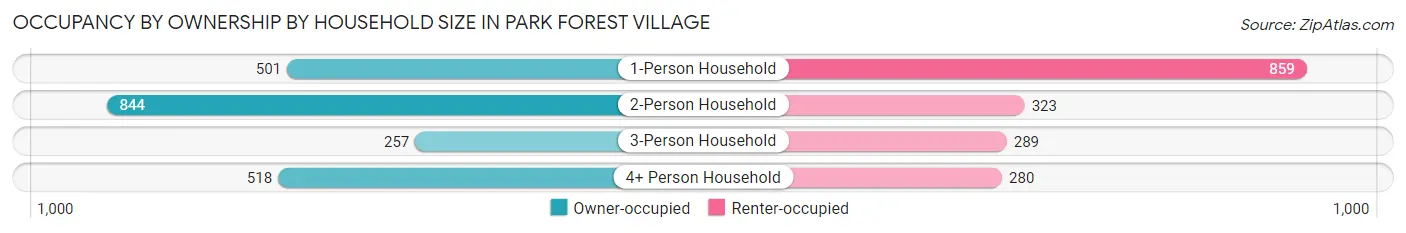
| Household Size | Owner-occupied | Renter-occupied |
| 1-Person Household | 501 (36.8%) | 859 (63.2%) |
| 2-Person Household | 844 (72.3%) | 323 (27.7%) |
| 3-Person Household | 257 (47.1%) | 289 (52.9%) |
| 4+ Person Household | 518 (64.9%) | 280 (35.1%) |
| Total Housing Units | 2,120 (54.8%) | 1,751 (45.2%) |
Occupancy by Educational Attainment in Park Forest Village
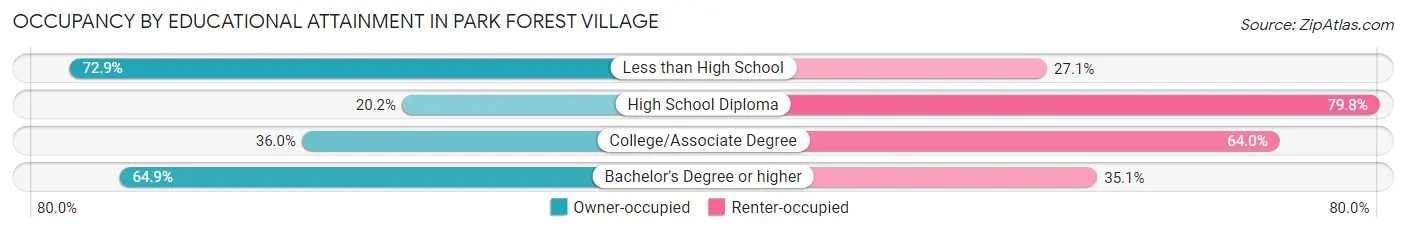
| Household Size | Owner-occupied | Renter-occupied |
| Less than High School | 43 (72.9%) | 16 (27.1%) |
| High School Diploma | 102 (20.2%) | 404 (79.8%) |
| College/Associate Degree | 214 (36.0%) | 380 (64.0%) |
| Bachelor's Degree or higher | 1,761 (64.9%) | 951 (35.1%) |
Occupancy by Age of Householder in Park Forest Village
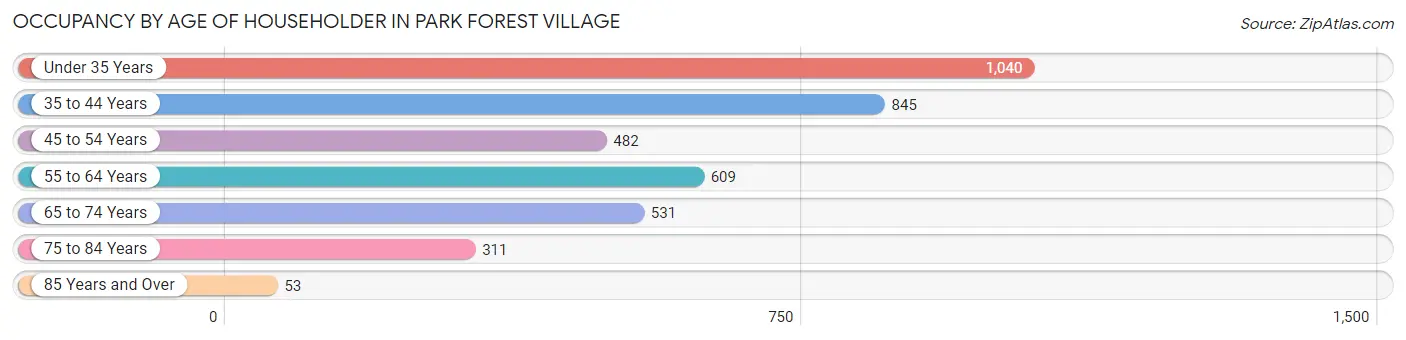
| Age Bracket | # Households | % Households |
| Under 35 Years | 1,040 | 26.9% |
| 35 to 44 Years | 845 | 21.8% |
| 45 to 54 Years | 482 | 12.4% |
| 55 to 64 Years | 609 | 15.7% |
| 65 to 74 Years | 531 | 13.7% |
| 75 to 84 Years | 311 | 8.0% |
| 85 Years and Over | 53 | 1.4% |
| Total | 3,871 | 100.0% |
Housing Finances in Park Forest Village
Median Income by Occupancy in Park Forest Village
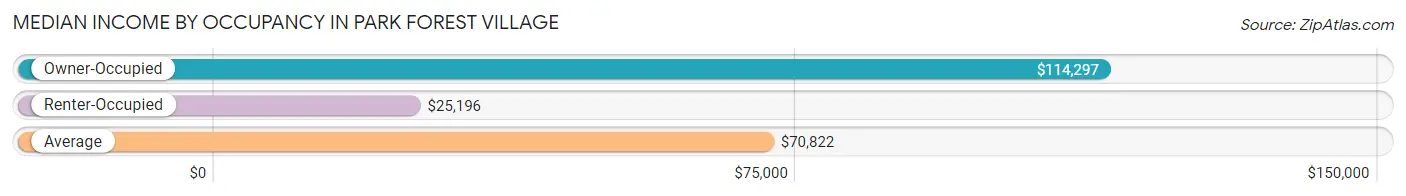
| Occupancy Type | # Households | Median Income |
| Owner-Occupied | 2,120 (54.8%) | $114,297 |
| Renter-Occupied | 1,751 (45.2%) | $25,196 |
| Average | 3,871 (100.0%) | $70,822 |
Occupancy by Householder Income Bracket in Park Forest Village
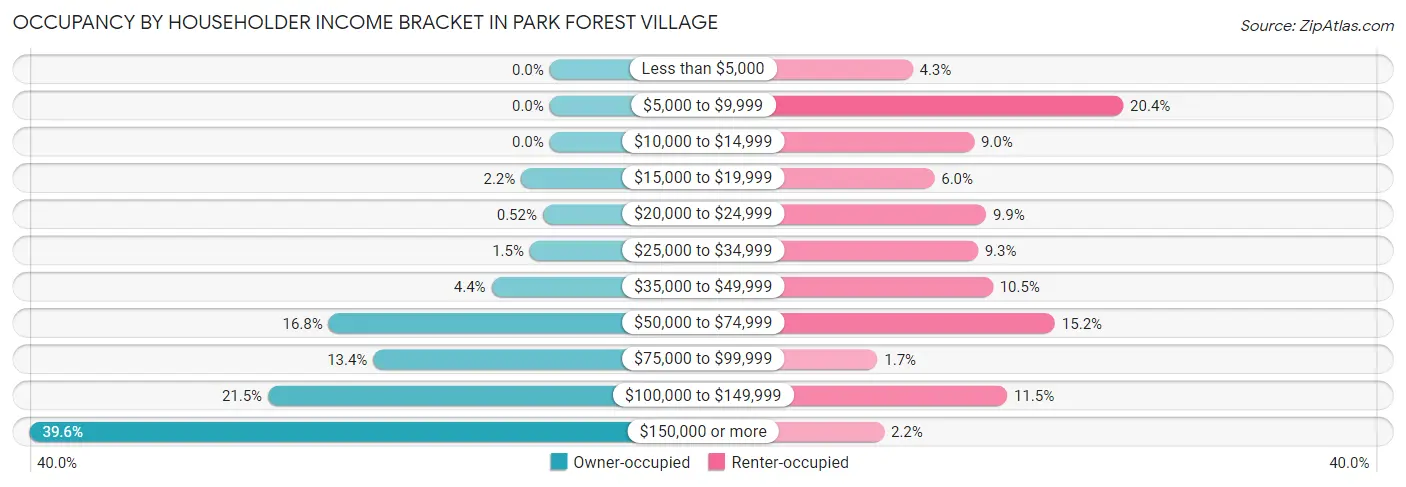
| Income Bracket | Owner-occupied | Renter-occupied |
| Less than $5,000 | 0 (0.0%) | 76 (4.3%) |
| $5,000 to $9,999 | 0 (0.0%) | 357 (20.4%) |
| $10,000 to $14,999 | 0 (0.0%) | 158 (9.0%) |
| $15,000 to $19,999 | 46 (2.2%) | 105 (6.0%) |
| $20,000 to $24,999 | 11 (0.5%) | 174 (9.9%) |
| $25,000 to $34,999 | 32 (1.5%) | 163 (9.3%) |
| $35,000 to $49,999 | 94 (4.4%) | 183 (10.4%) |
| $50,000 to $74,999 | 357 (16.8%) | 266 (15.2%) |
| $75,000 to $99,999 | 285 (13.4%) | 29 (1.7%) |
| $100,000 to $149,999 | 455 (21.5%) | 202 (11.5%) |
| $150,000 or more | 840 (39.6%) | 38 (2.2%) |
| Total | 2,120 (100.0%) | 1,751 (100.0%) |
Monthly Housing Cost Tiers in Park Forest Village
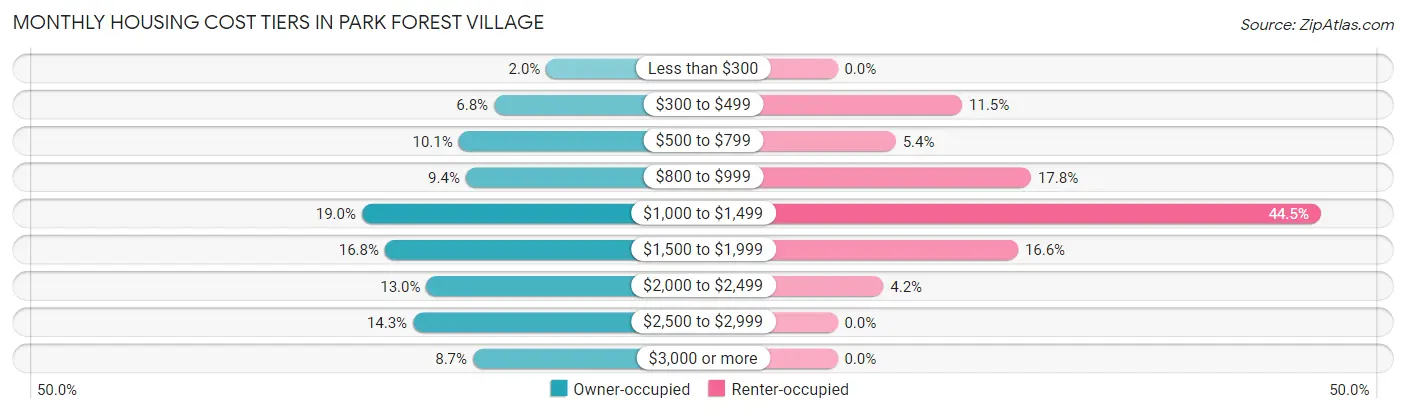
| Monthly Cost | Owner-occupied | Renter-occupied |
| Less than $300 | 42 (2.0%) | 0 (0.0%) |
| $300 to $499 | 144 (6.8%) | 201 (11.5%) |
| $500 to $799 | 213 (10.1%) | 94 (5.4%) |
| $800 to $999 | 199 (9.4%) | 312 (17.8%) |
| $1,000 to $1,499 | 402 (19.0%) | 779 (44.5%) |
| $1,500 to $1,999 | 357 (16.8%) | 291 (16.6%) |
| $2,000 to $2,499 | 276 (13.0%) | 74 (4.2%) |
| $2,500 to $2,999 | 302 (14.2%) | 0 (0.0%) |
| $3,000 or more | 185 (8.7%) | 0 (0.0%) |
| Total | 2,120 (100.0%) | 1,751 (100.0%) |
Physical Housing Characteristics in Park Forest Village
Housing Structures in Park Forest Village
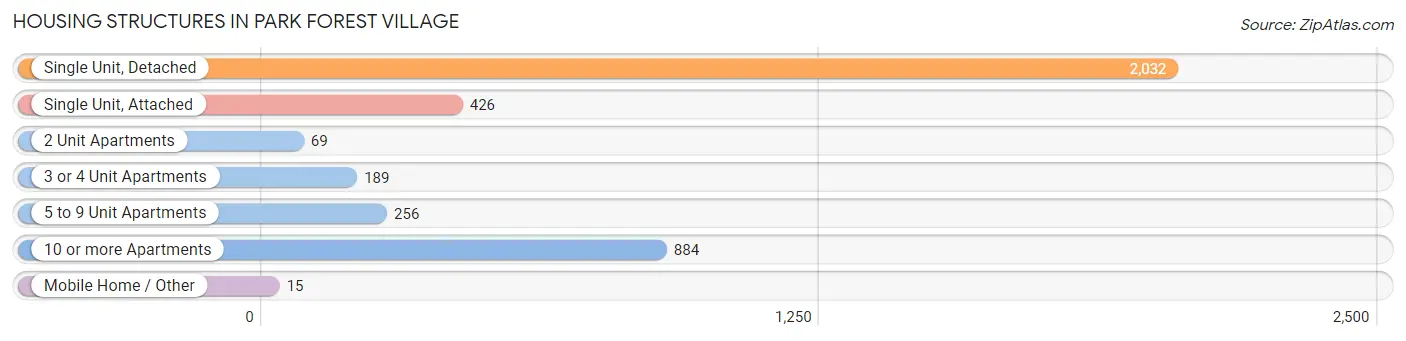
| Structure Type | # Housing Units | % Housing Units |
| Single Unit, Detached | 2,032 | 52.5% |
| Single Unit, Attached | 426 | 11.0% |
| 2 Unit Apartments | 69 | 1.8% |
| 3 or 4 Unit Apartments | 189 | 4.9% |
| 5 to 9 Unit Apartments | 256 | 6.6% |
| 10 or more Apartments | 884 | 22.8% |
| Mobile Home / Other | 15 | 0.4% |
| Total | 3,871 | 100.0% |
Housing Structures by Occupancy in Park Forest Village
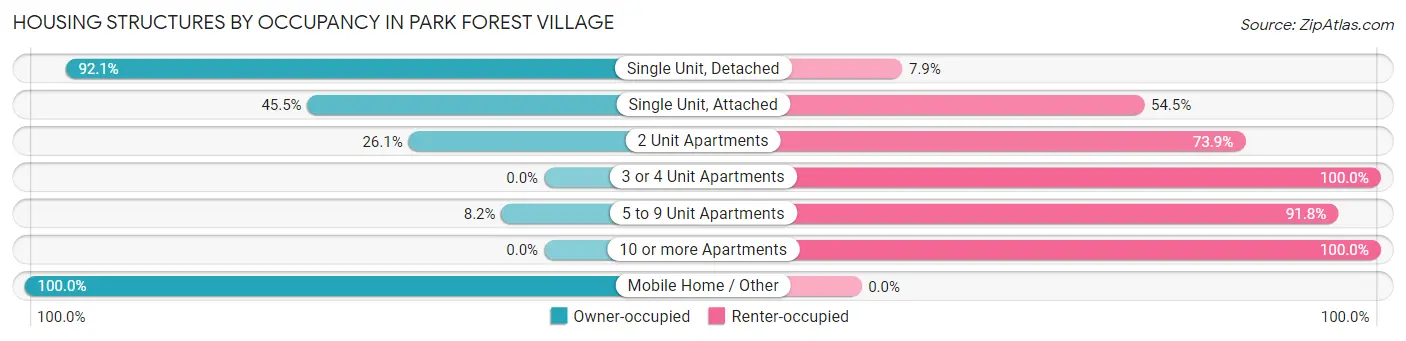
| Structure Type | Owner-occupied | Renter-occupied |
| Single Unit, Detached | 1,872 (92.1%) | 160 (7.9%) |
| Single Unit, Attached | 194 (45.5%) | 232 (54.5%) |
| 2 Unit Apartments | 18 (26.1%) | 51 (73.9%) |
| 3 or 4 Unit Apartments | 0 (0.0%) | 189 (100.0%) |
| 5 to 9 Unit Apartments | 21 (8.2%) | 235 (91.8%) |
| 10 or more Apartments | 0 (0.0%) | 884 (100.0%) |
| Mobile Home / Other | 15 (100.0%) | 0 (0.0%) |
| Total | 2,120 (54.8%) | 1,751 (45.2%) |
Housing Structures by Number of Rooms in Park Forest Village
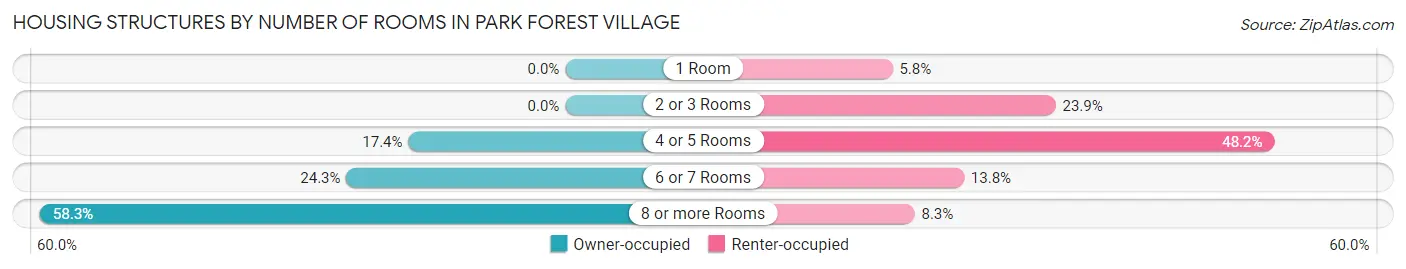
| Number of Rooms | Owner-occupied | Renter-occupied |
| 1 Room | 0 (0.0%) | 102 (5.8%) |
| 2 or 3 Rooms | 0 (0.0%) | 419 (23.9%) |
| 4 or 5 Rooms | 369 (17.4%) | 844 (48.2%) |
| 6 or 7 Rooms | 515 (24.3%) | 241 (13.8%) |
| 8 or more Rooms | 1,236 (58.3%) | 145 (8.3%) |
| Total | 2,120 (100.0%) | 1,751 (100.0%) |
Housing Structure by Heating Type in Park Forest Village
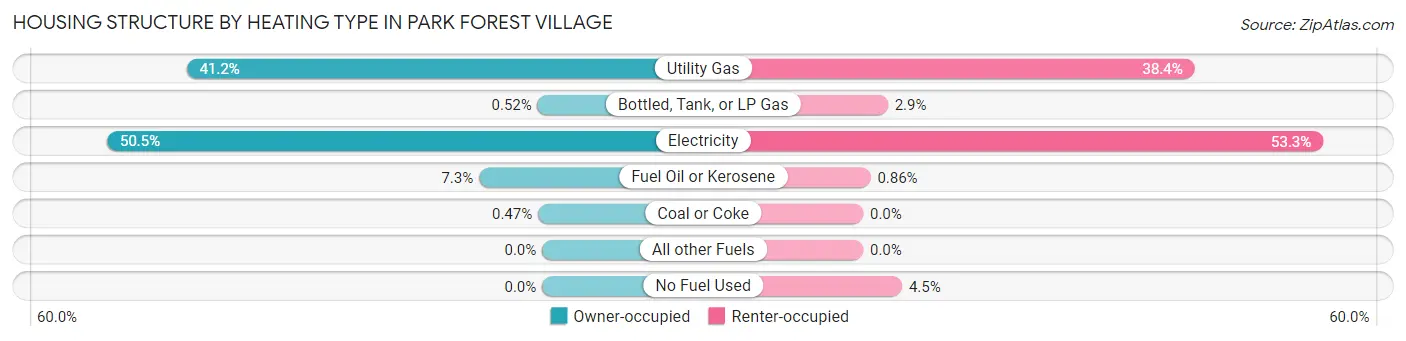
| Heating Type | Owner-occupied | Renter-occupied |
| Utility Gas | 874 (41.2%) | 673 (38.4%) |
| Bottled, Tank, or LP Gas | 11 (0.5%) | 50 (2.9%) |
| Electricity | 1,070 (50.5%) | 934 (53.3%) |
| Fuel Oil or Kerosene | 155 (7.3%) | 15 (0.9%) |
| Coal or Coke | 10 (0.5%) | 0 (0.0%) |
| All other Fuels | 0 (0.0%) | 0 (0.0%) |
| No Fuel Used | 0 (0.0%) | 79 (4.5%) |
| Total | 2,120 (100.0%) | 1,751 (100.0%) |
Household Vehicle Usage in Park Forest Village
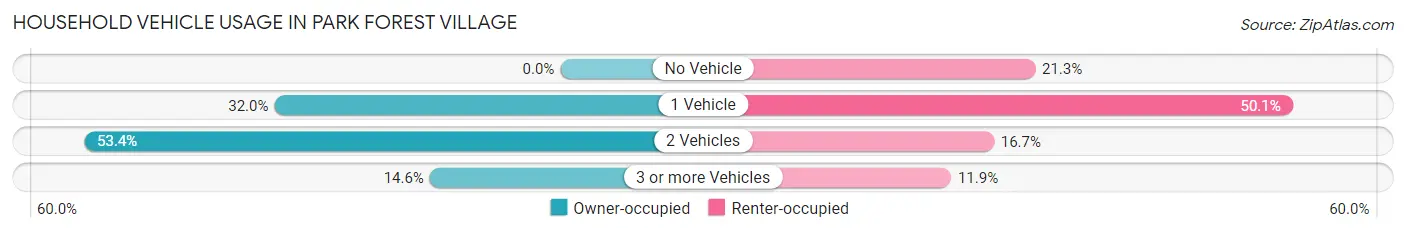
| Vehicles per Household | Owner-occupied | Renter-occupied |
| No Vehicle | 0 (0.0%) | 373 (21.3%) |
| 1 Vehicle | 679 (32.0%) | 878 (50.1%) |
| 2 Vehicles | 1,131 (53.3%) | 292 (16.7%) |
| 3 or more Vehicles | 310 (14.6%) | 208 (11.9%) |
| Total | 2,120 (100.0%) | 1,751 (100.0%) |
Real Estate & Mortgages in Park Forest Village
Real Estate and Mortgage Overview in Park Forest Village
| Characteristic | Without Mortgage | With Mortgage |
| Housing Units | 656 | 1,464 |
| Median Property Value | $395,100 | $369,300 |
| Median Household Income | $98,269 | $581 |
| Monthly Housing Costs | $736 | $185 |
| Real Estate Taxes | $4,288 | $0 |
Property Value by Mortgage Status in Park Forest Village
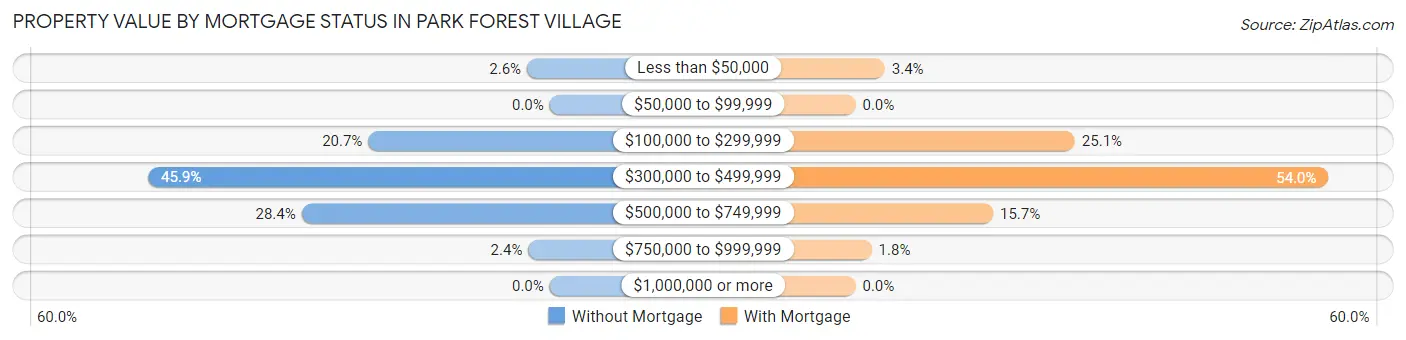
| Property Value | Without Mortgage | With Mortgage |
| Less than $50,000 | 17 (2.6%) | 49 (3.4%) |
| $50,000 to $99,999 | 0 (0.0%) | 0 (0.0%) |
| $100,000 to $299,999 | 136 (20.7%) | 367 (25.1%) |
| $300,000 to $499,999 | 301 (45.9%) | 791 (54.0%) |
| $500,000 to $749,999 | 186 (28.3%) | 230 (15.7%) |
| $750,000 to $999,999 | 16 (2.4%) | 27 (1.8%) |
| $1,000,000 or more | 0 (0.0%) | 0 (0.0%) |
| Total | 656 (100.0%) | 1,464 (100.0%) |
Household Income by Mortgage Status in Park Forest Village
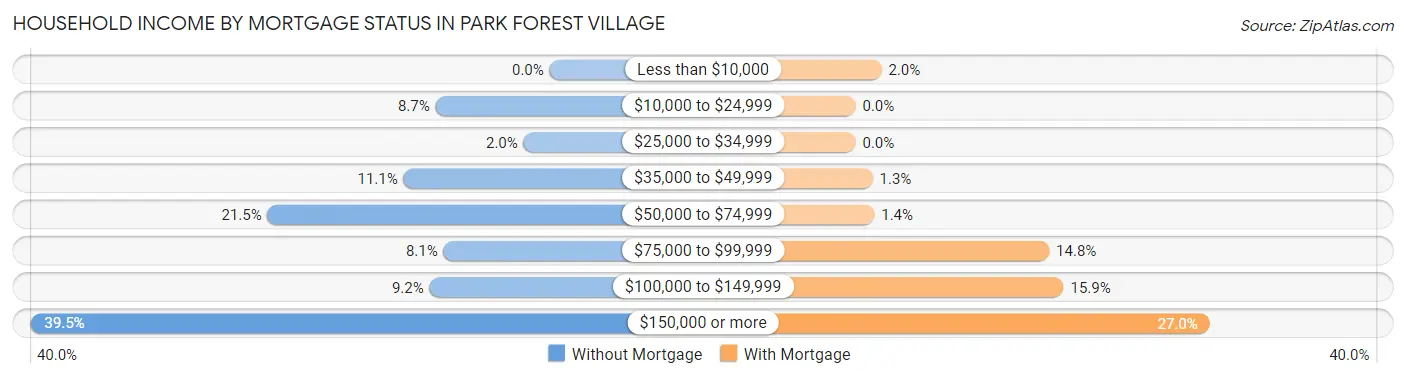
| Household Income | Without Mortgage | With Mortgage |
| Less than $10,000 | 0 (0.0%) | 29 (2.0%) |
| $10,000 to $24,999 | 57 (8.7%) | 0 (0.0%) |
| $25,000 to $34,999 | 13 (2.0%) | 0 (0.0%) |
| $35,000 to $49,999 | 73 (11.1%) | 19 (1.3%) |
| $50,000 to $74,999 | 141 (21.5%) | 21 (1.4%) |
| $75,000 to $99,999 | 53 (8.1%) | 216 (14.7%) |
| $100,000 to $149,999 | 60 (9.1%) | 232 (15.9%) |
| $150,000 or more | 259 (39.5%) | 395 (27.0%) |
| Total | 656 (100.0%) | 1,464 (100.0%) |
Property Value to Household Income Ratio in Park Forest Village
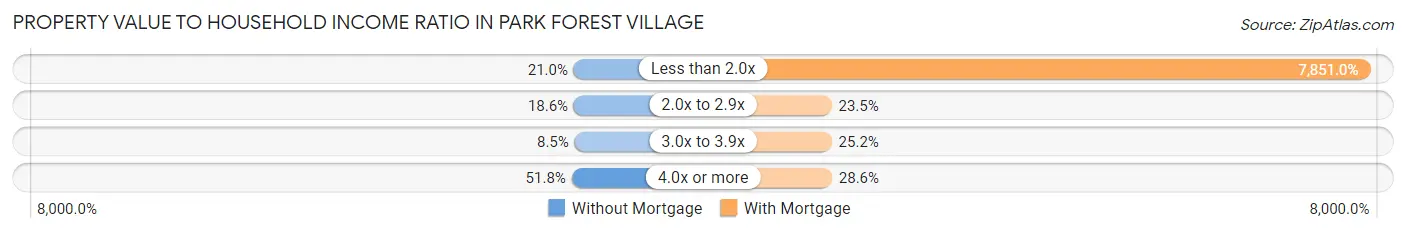
| Value-to-Income Ratio | Without Mortgage | With Mortgage |
| Less than 2.0x | 138 (21.0%) | 114,938 (7,851.0%) |
| 2.0x to 2.9x | 122 (18.6%) | 344 (23.5%) |
| 3.0x to 3.9x | 56 (8.5%) | 369 (25.2%) |
| 4.0x or more | 340 (51.8%) | 418 (28.5%) |
| Total | 656 (100.0%) | 1,464 (100.0%) |
Real Estate Taxes by Mortgage Status in Park Forest Village
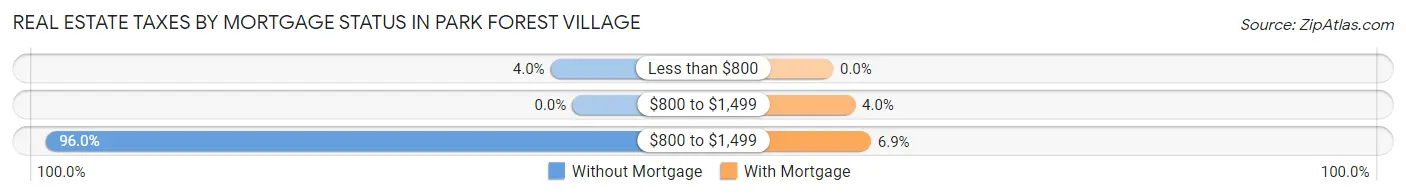
| Property Taxes | Without Mortgage | With Mortgage |
| Less than $800 | 26 (4.0%) | 0 (0.0%) |
| $800 to $1,499 | 0 (0.0%) | 59 (4.0%) |
| $800 to $1,499 | 630 (96.0%) | 101 (6.9%) |
| Total | 656 (100.0%) | 1,464 (100.0%) |
Health & Disability in Park Forest Village
Health Insurance Coverage by Age in Park Forest Village
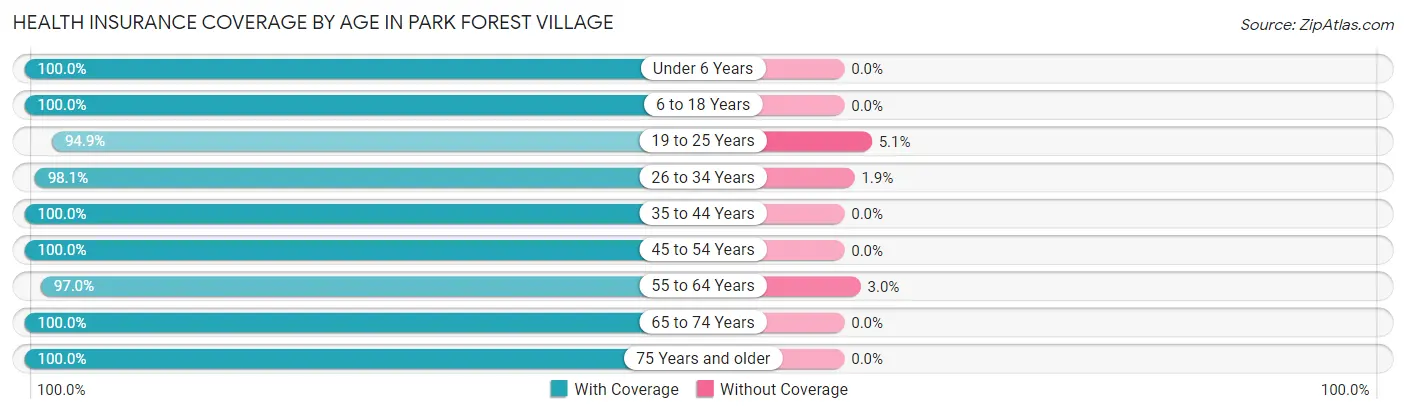
| Age Bracket | With Coverage | Without Coverage |
| Under 6 Years | 388 (100.0%) | 0 (0.0%) |
| 6 to 18 Years | 1,106 (100.0%) | 0 (0.0%) |
| 19 to 25 Years | 1,614 (94.9%) | 87 (5.1%) |
| 26 to 34 Years | 1,138 (98.1%) | 22 (1.9%) |
| 35 to 44 Years | 1,367 (100.0%) | 0 (0.0%) |
| 45 to 54 Years | 772 (100.0%) | 0 (0.0%) |
| 55 to 64 Years | 1,086 (97.0%) | 34 (3.0%) |
| 65 to 74 Years | 810 (100.0%) | 0 (0.0%) |
| 75 Years and older | 477 (100.0%) | 0 (0.0%) |
| Total | 8,758 (98.4%) | 143 (1.6%) |
Health Insurance Coverage by Citizenship Status in Park Forest Village
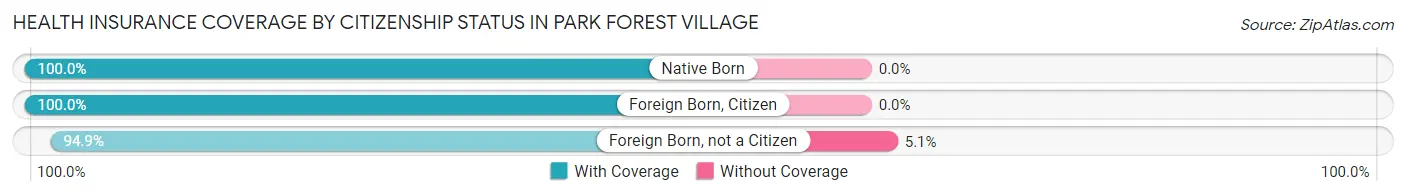
| Citizenship Status | With Coverage | Without Coverage |
| Native Born | 388 (100.0%) | 0 (0.0%) |
| Foreign Born, Citizen | 1,106 (100.0%) | 0 (0.0%) |
| Foreign Born, not a Citizen | 1,614 (94.9%) | 87 (5.1%) |
Health Insurance Coverage by Household Income in Park Forest Village
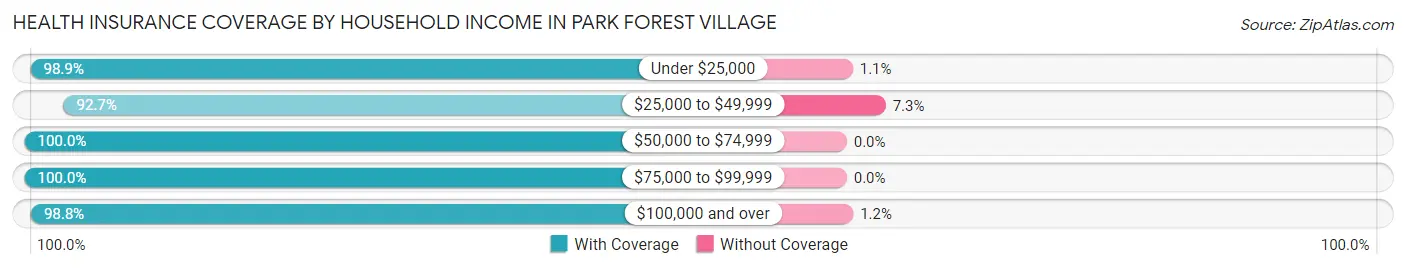
| Household Income | With Coverage | Without Coverage |
| Under $25,000 | 1,595 (98.9%) | 18 (1.1%) |
| $25,000 to $49,999 | 826 (92.7%) | 65 (7.3%) |
| $50,000 to $74,999 | 1,535 (100.0%) | 0 (0.0%) |
| $75,000 to $99,999 | 723 (100.0%) | 0 (0.0%) |
| $100,000 and over | 4,042 (98.8%) | 49 (1.2%) |
Public vs Private Health Insurance Coverage by Age in Park Forest Village
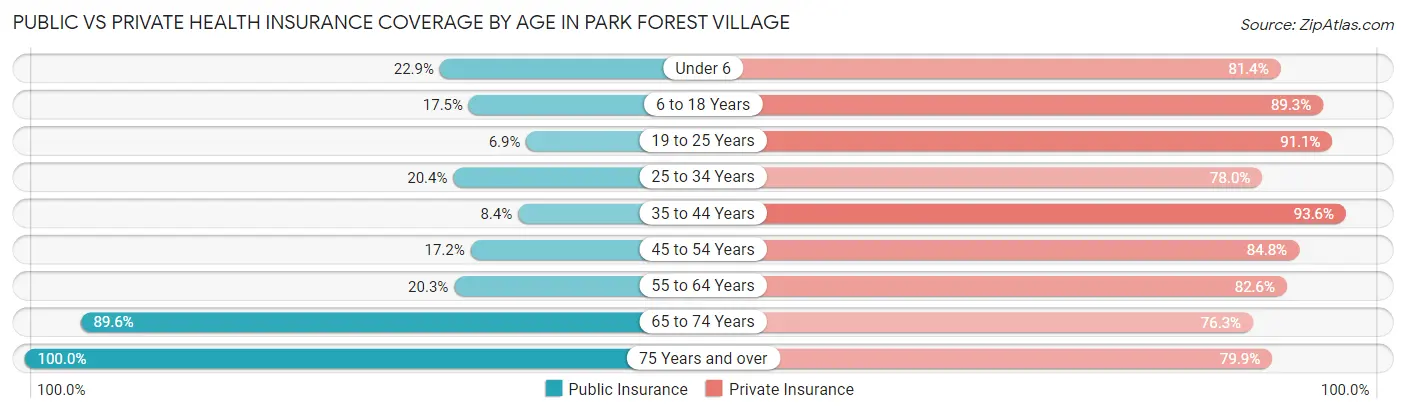
| Age Bracket | Public Insurance | Private Insurance |
| Under 6 | 89 (22.9%) | 316 (81.4%) |
| 6 to 18 Years | 194 (17.5%) | 988 (89.3%) |
| 19 to 25 Years | 117 (6.9%) | 1,549 (91.1%) |
| 25 to 34 Years | 237 (20.4%) | 905 (78.0%) |
| 35 to 44 Years | 115 (8.4%) | 1,279 (93.6%) |
| 45 to 54 Years | 133 (17.2%) | 655 (84.8%) |
| 55 to 64 Years | 227 (20.3%) | 925 (82.6%) |
| 65 to 74 Years | 726 (89.6%) | 618 (76.3%) |
| 75 Years and over | 477 (100.0%) | 381 (79.9%) |
| Total | 2,315 (26.0%) | 7,616 (85.6%) |
Disability Status by Sex by Age in Park Forest Village
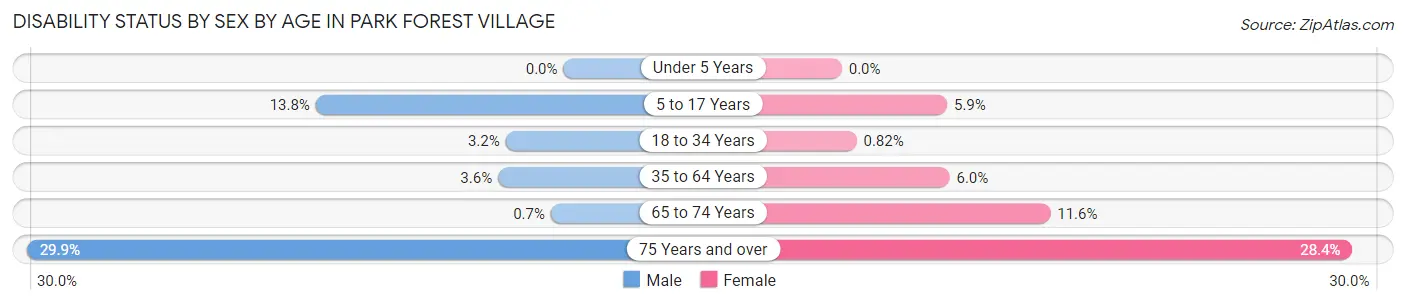
| Age Bracket | Male | Female |
| Under 5 Years | 0 (0.0%) | 0 (0.0%) |
| 5 to 17 Years | 79 (13.8%) | 30 (5.9%) |
| 18 to 34 Years | 47 (3.2%) | 12 (0.8%) |
| 35 to 64 Years | 55 (3.6%) | 105 (6.0%) |
| 65 to 74 Years | 3 (0.7%) | 44 (11.6%) |
| 75 Years and over | 49 (29.9%) | 89 (28.4%) |
Disability Class by Sex by Age in Park Forest Village
Disability Class: Hearing Difficulty
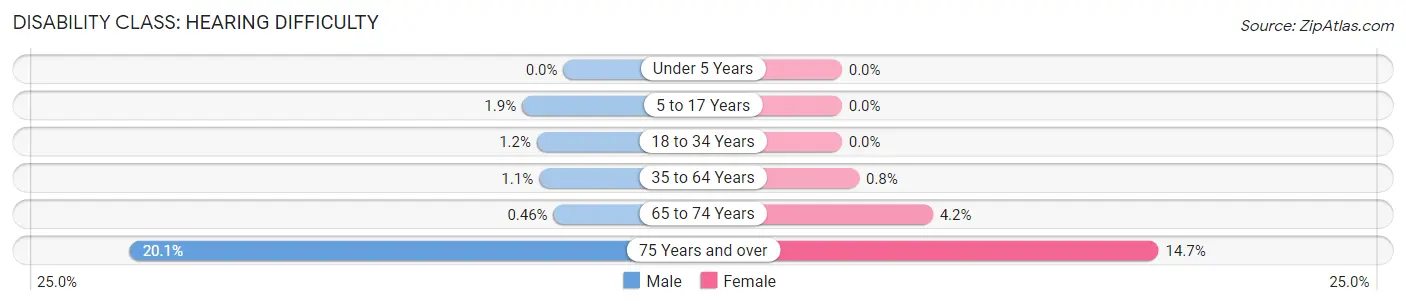
| Age Bracket | Male | Female |
| Under 5 Years | 0 (0.0%) | 0 (0.0%) |
| 5 to 17 Years | 11 (1.9%) | 0 (0.0%) |
| 18 to 34 Years | 18 (1.2%) | 0 (0.0%) |
| 35 to 64 Years | 17 (1.1%) | 14 (0.8%) |
| 65 to 74 Years | 2 (0.5%) | 16 (4.2%) |
| 75 Years and over | 33 (20.1%) | 46 (14.7%) |
Disability Class: Vision Difficulty
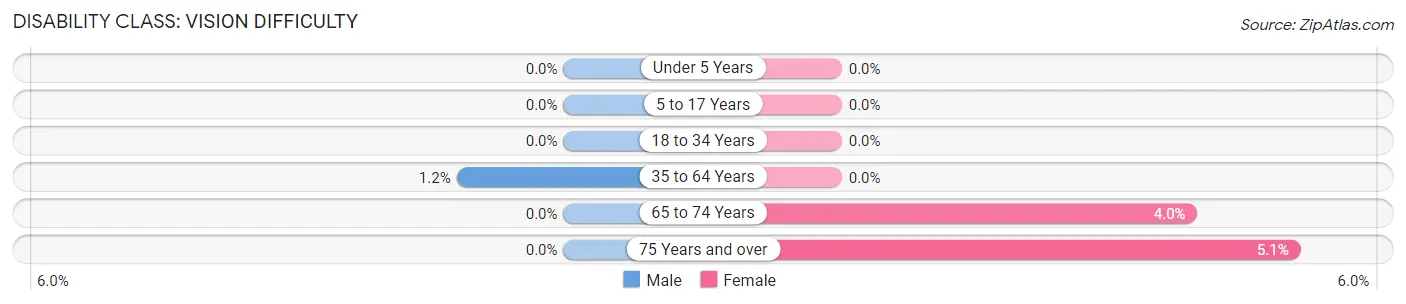
| Age Bracket | Male | Female |
| Under 5 Years | 0 (0.0%) | 0 (0.0%) |
| 5 to 17 Years | 0 (0.0%) | 0 (0.0%) |
| 18 to 34 Years | 0 (0.0%) | 0 (0.0%) |
| 35 to 64 Years | 18 (1.2%) | 0 (0.0%) |
| 65 to 74 Years | 0 (0.0%) | 15 (4.0%) |
| 75 Years and over | 0 (0.0%) | 16 (5.1%) |
Disability Class: Cognitive Difficulty
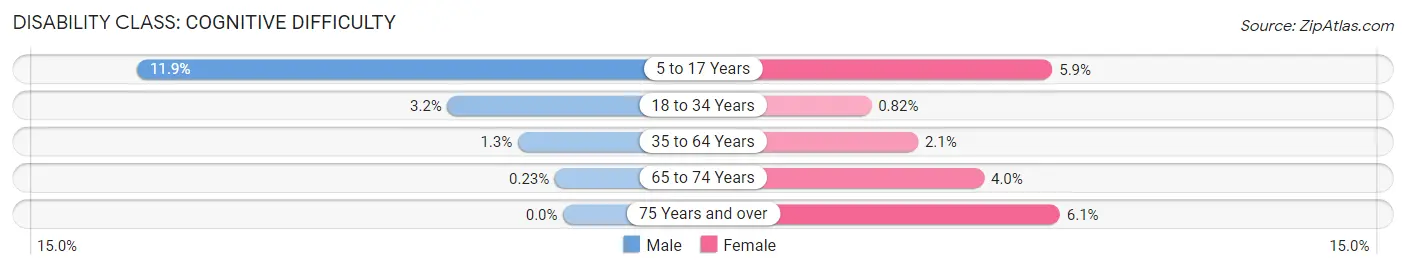
| Age Bracket | Male | Female |
| 5 to 17 Years | 68 (11.9%) | 30 (5.9%) |
| 18 to 34 Years | 47 (3.2%) | 12 (0.8%) |
| 35 to 64 Years | 19 (1.3%) | 37 (2.1%) |
| 65 to 74 Years | 1 (0.2%) | 15 (4.0%) |
| 75 Years and over | 0 (0.0%) | 19 (6.1%) |
Disability Class: Ambulatory Difficulty
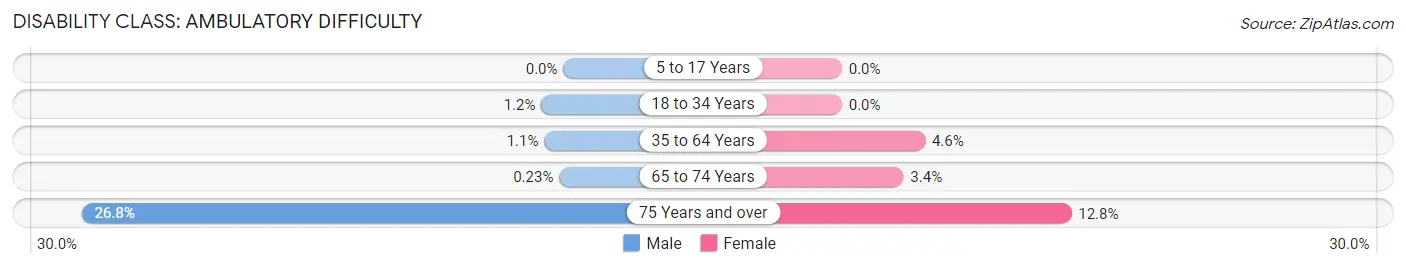
| Age Bracket | Male | Female |
| 5 to 17 Years | 0 (0.0%) | 0 (0.0%) |
| 18 to 34 Years | 18 (1.2%) | 0 (0.0%) |
| 35 to 64 Years | 16 (1.1%) | 81 (4.6%) |
| 65 to 74 Years | 1 (0.2%) | 13 (3.4%) |
| 75 Years and over | 44 (26.8%) | 40 (12.8%) |
Disability Class: Self-Care Difficulty
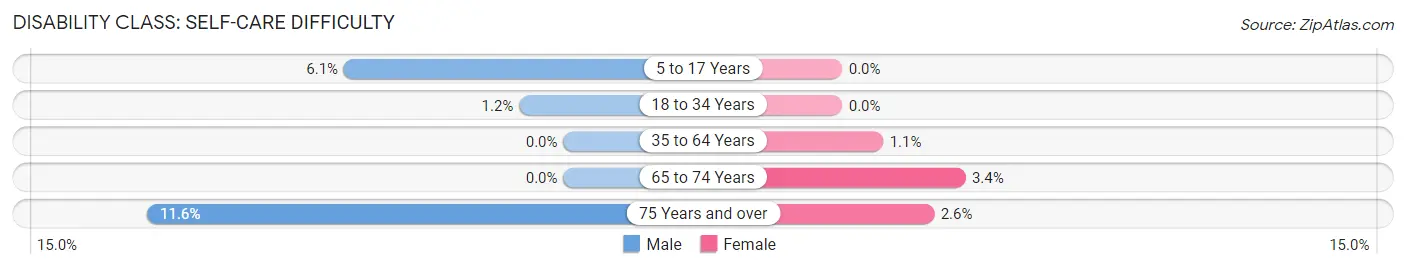
| Age Bracket | Male | Female |
| 5 to 17 Years | 35 (6.1%) | 0 (0.0%) |
| 18 to 34 Years | 18 (1.2%) | 0 (0.0%) |
| 35 to 64 Years | 0 (0.0%) | 20 (1.1%) |
| 65 to 74 Years | 0 (0.0%) | 13 (3.4%) |
| 75 Years and over | 19 (11.6%) | 8 (2.6%) |
Technology Access in Park Forest Village
Computing Device Access in Park Forest Village
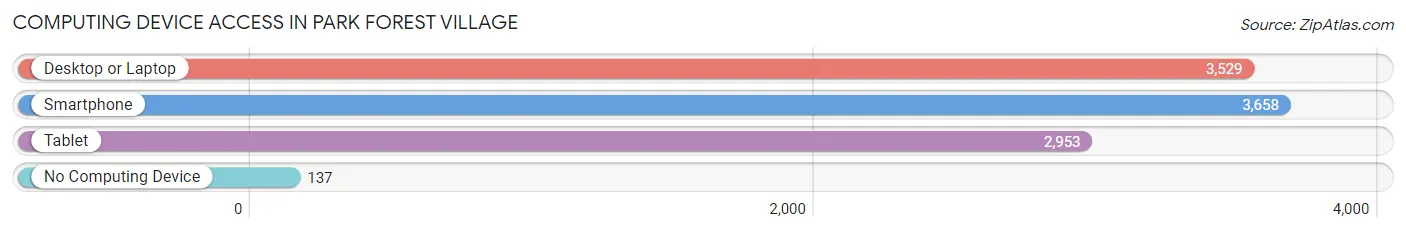
| Device Type | # Households | % Households |
| Desktop or Laptop | 3,529 | 91.2% |
| Smartphone | 3,658 | 94.5% |
| Tablet | 2,953 | 76.3% |
| No Computing Device | 137 | 3.5% |
| Total | 3,871 | 100.0% |
Internet Access in Park Forest Village
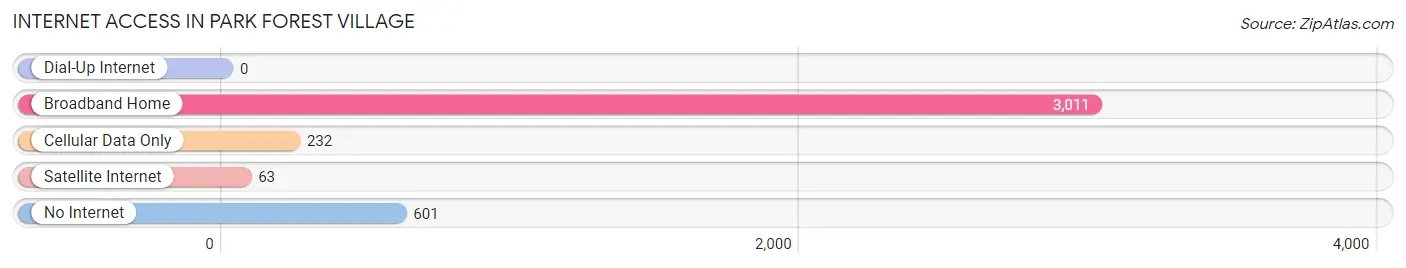
| Internet Type | # Households | % Households |
| Dial-Up Internet | 0 | 0.0% |
| Broadband Home | 3,011 | 77.8% |
| Cellular Data Only | 232 | 6.0% |
| Satellite Internet | 63 | 1.6% |
| No Internet | 601 | 15.5% |
| Total | 3,871 | 100.0% |
Park Forest Village Summary
History
Park Forest Village is a small borough located in Allegheny County, Pennsylvania. It is situated approximately 15 miles east of Pittsburgh and is part of the greater Pittsburgh metropolitan area. The borough was founded in 1952 and was originally known as the Park Forest Development Corporation. The development was created by the U.S. Steel Corporation as a planned community for its employees. The development was designed to provide affordable housing for the company’s workers and their families.
The borough was officially incorporated in 1956 and was named after the nearby Park Forest Country Club. The country club was established in the early 1900s and was a popular destination for golfers and other outdoor enthusiasts. The borough was designed to be a self-contained community with its own schools, shopping centers, and recreational facilities.
Geography
Park Forest Village is located in Allegheny County, Pennsylvania. It is situated approximately 15 miles east of Pittsburgh and is part of the greater Pittsburgh metropolitan area. The borough is bordered by the boroughs of Wilkinsburg, Penn Hills, and Churchill. The borough is situated on a plateau and is surrounded by rolling hills and wooded areas. The borough is located in the Allegheny Plateau region of Pennsylvania and is part of the Appalachian Mountains.
The borough has a total area of 1.2 square miles, all of which is land. The borough is located in the Monongahela River watershed and is drained by the Monongahela River and its tributaries. The borough is located in the Eastern Standard Time Zone and observes daylight saving time.
Economy
The economy of Park Forest Village is largely based on the service industry. The borough is home to a variety of businesses, including restaurants, retail stores, and professional services. The borough is also home to a number of manufacturing companies, including a steel mill and a paper mill. The borough is also home to a number of medical facilities, including a hospital and a nursing home.
The borough is served by the Port Authority of Allegheny County, which provides public transportation to the borough and the surrounding area. The borough is also served by the Pennsylvania Turnpike, which provides access to the greater Pittsburgh area.
Demographics
As of the 2010 census, the population of Park Forest Village was 4,845. The population density was 4,037.7 people per square mile. The racial makeup of the borough was 94.2% White, 2.7% African American, 0.2% Native American, 0.7% Asian, 0.1% Pacific Islander, 0.7% from other races, and 1.4% from two or more races. Hispanic or Latino of any race were 1.7% of the population.
The median income for a household in the borough was $45,938, and the median income for a family was $54,938. The per capita income for the borough was $21,945. About 6.2% of families and 8.2% of the population were below the poverty line, including 11.2% of those under age 18 and 5.2% of those age 65 or over.
Common Questions
What is Per Capita Income in Park Forest Village?
Per Capita income in Park Forest Village is $44,910.
What is the Median Family Income in Park Forest Village?
Median Family Income in Park Forest Village is $114,948.
What is the Median Household income in Park Forest Village?
Median Household Income in Park Forest Village is $70,822.
What is Income or Wage Gap in Park Forest Village?
Income or Wage Gap in Park Forest Village is 5.3%.
Women in Park Forest Village earn 94.7 cents for every dollar earned by a man.
What is Inequality or Gini Index in Park Forest Village?
Inequality or Gini Index in Park Forest Village is 0.50.
What is the Total Population of Park Forest Village?
Total Population of Park Forest Village is 8,962.
What is the Total Male Population of Park Forest Village?
Total Male Population of Park Forest Village is 4,382.
What is the Total Female Population of Park Forest Village?
Total Female Population of Park Forest Village is 4,580.
What is the Ratio of Males per 100 Females in Park Forest Village?
There are 95.68 Males per 100 Females in Park Forest Village.
What is the Ratio of Females per 100 Males in Park Forest Village?
There are 104.52 Females per 100 Males in Park Forest Village.
What is the Median Population Age in Park Forest Village?
Median Population Age in Park Forest Village is 35.9 Years.
What is the Average Family Size in Park Forest Village
Average Family Size in Park Forest Village is 2.9 People.
What is the Average Household Size in Park Forest Village
Average Household Size in Park Forest Village is 2.3 People.
How Large is the Labor Force in Park Forest Village?
There are 4,637 People in the Labor Forcein in Park Forest Village.
What is the Percentage of People in the Labor Force in Park Forest Village?
60.5% of People are in the Labor Force in Park Forest Village.
What is the Unemployment Rate in Park Forest Village?
Unemployment Rate in Park Forest Village is 4.7%.