Lake Murray of Richland, SC Map & Demographics
Lake Murray of Richland Map
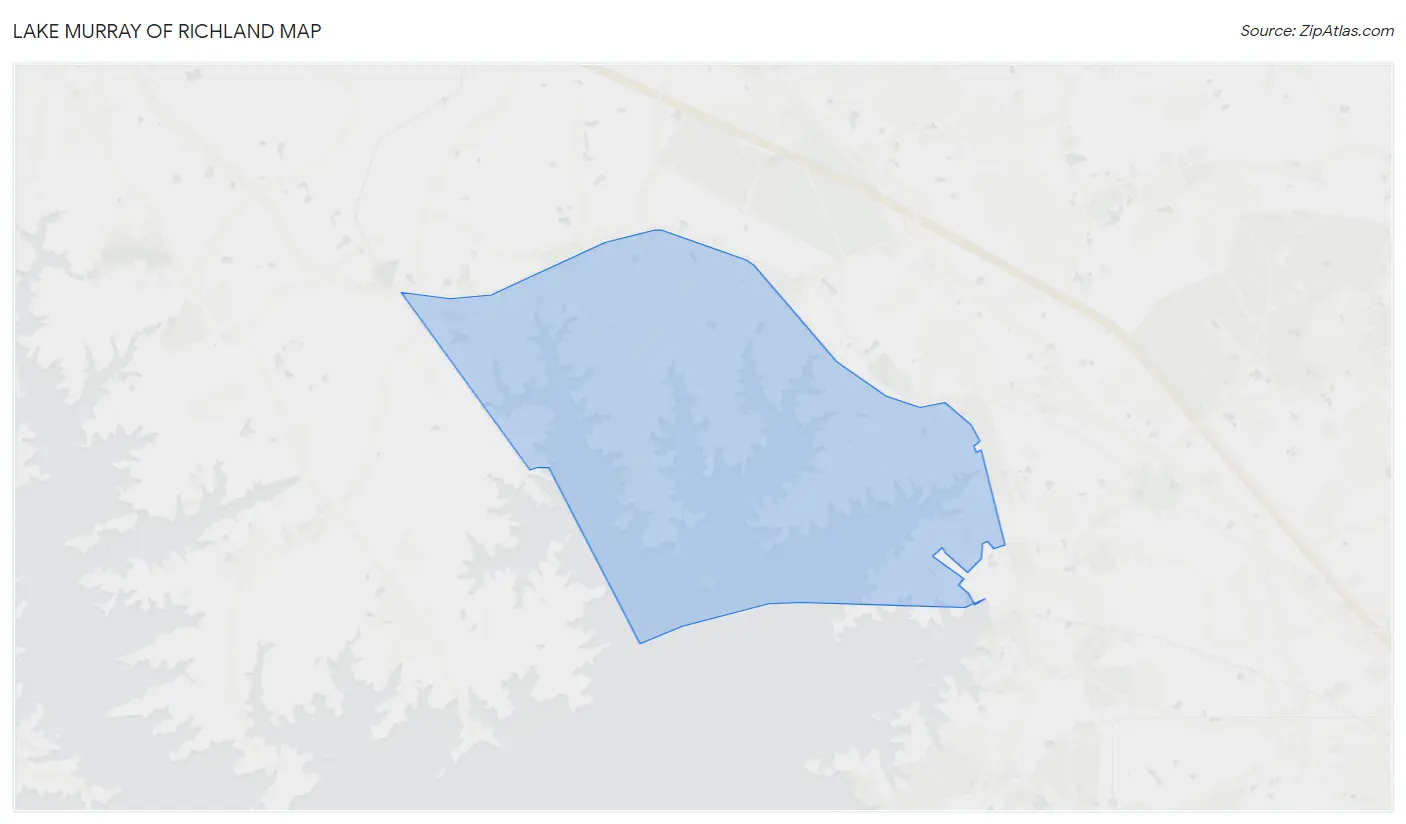
Lake Murray of Richland Overview
$67,986
PER CAPITA INCOME
$133,393
AVG FAMILY INCOME
$111,477
AVG HOUSEHOLD INCOME
20.5%
WAGE / INCOME GAP [ % ]
79.5¢/ $1
WAGE / INCOME GAP [ $ ]
0.44
INEQUALITY / GINI INDEX
6,914
TOTAL POPULATION
3,590
MALE POPULATION
3,324
FEMALE POPULATION
108.00
MALES / 100 FEMALES
92.59
FEMALES / 100 MALES
46.4
MEDIAN AGE
2.8
AVG FAMILY SIZE
2.4
AVG HOUSEHOLD SIZE
3,417
LABOR FORCE [ PEOPLE ]
60.7%
PERCENT IN LABOR FORCE
4.4%
UNEMPLOYMENT RATE
Income in Lake Murray of Richland
Income Overview in Lake Murray of Richland
Per Capita Income in Lake Murray of Richland is $67,986, while median incomes of families and households are $133,393 and $111,477 respectively.
| Characteristic | Number | Measure |
| Per Capita Income | 6,914 | $67,986 |
| Median Family Income | 2,080 | $133,393 |
| Mean Family Income | 2,080 | $187,667 |
| Median Household Income | 2,866 | $111,477 |
| Mean Household Income | 2,866 | $163,081 |
| Income Deficit | 2,080 | $0 |
| Wage / Income Gap (%) | 6,914 | 20.52% |
| Wage / Income Gap ($) | 6,914 | 79.48¢ per $1 |
| Gini / Inequality Index | 6,914 | 0.44 |
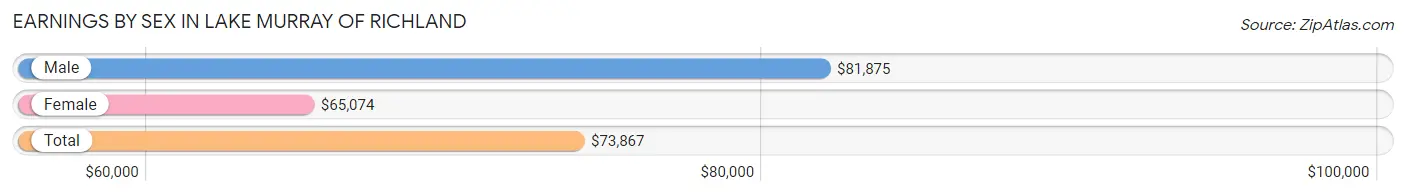
Earnings by Sex in Lake Murray of Richland
Average Earnings in Lake Murray of Richland are $73,867, $81,875 for men and $65,074 for women, a difference of 20.5%.
| Sex | Number | Average Earnings |
| Male | 2,009 (57.0%) | $81,875 |
| Female | 1,515 (43.0%) | $65,074 |
| Total | 3,524 (100.0%) | $73,867 |
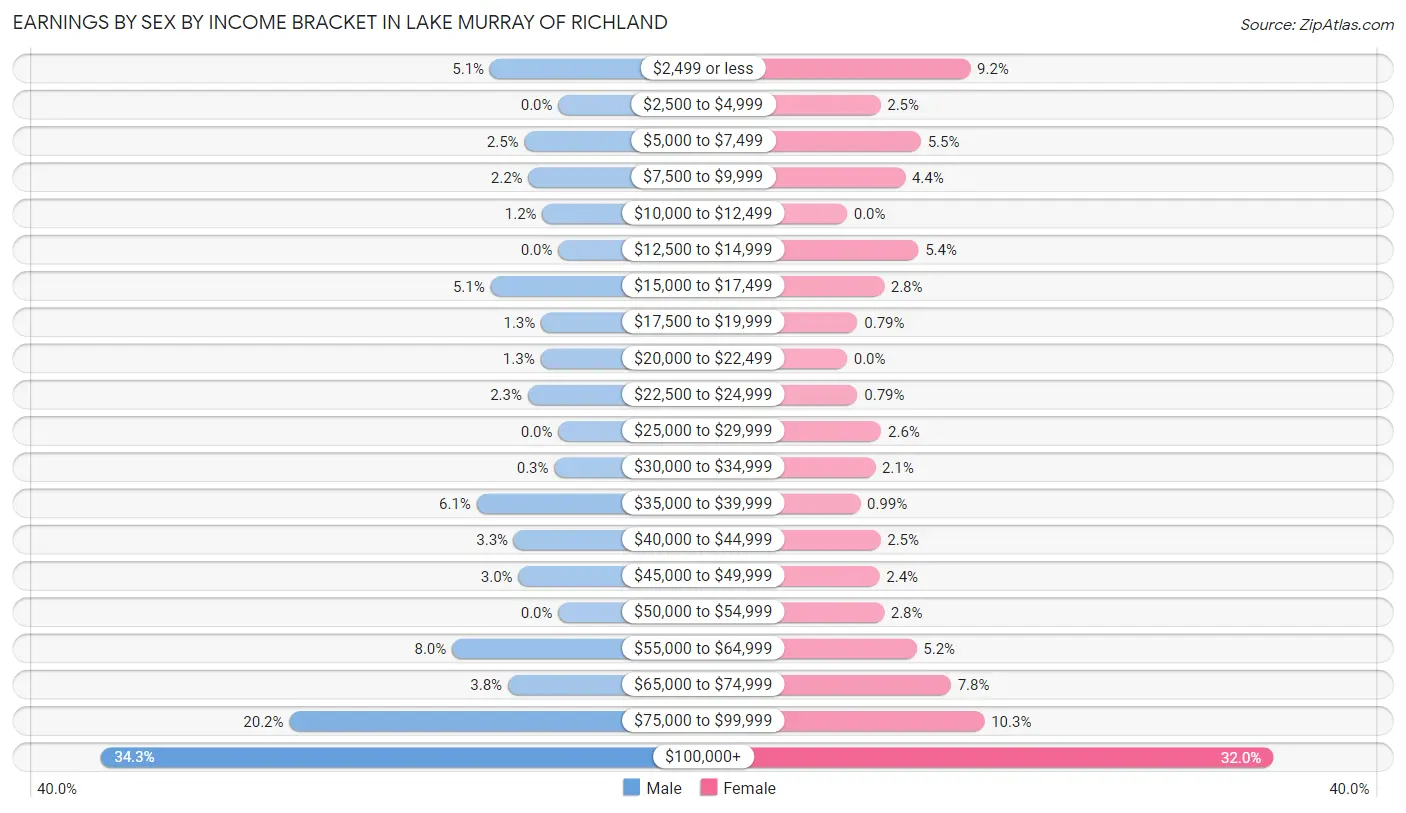
Earnings by Sex by Income Bracket in Lake Murray of Richland
The most common earnings brackets in Lake Murray of Richland are $100,000+ for men (688 | 34.3%) and $100,000+ for women (484 | 32.0%).
| Income | Male | Female |
| $2,499 or less | 103 (5.1%) | 140 (9.2%) |
| $2,500 to $4,999 | 0 (0.0%) | 38 (2.5%) |
| $5,000 to $7,499 | 51 (2.5%) | 84 (5.5%) |
| $7,500 to $9,999 | 45 (2.2%) | 66 (4.4%) |
| $10,000 to $12,499 | 24 (1.2%) | 0 (0.0%) |
| $12,500 to $14,999 | 0 (0.0%) | 81 (5.3%) |
| $15,000 to $17,499 | 102 (5.1%) | 42 (2.8%) |
| $17,500 to $19,999 | 26 (1.3%) | 12 (0.8%) |
| $20,000 to $22,499 | 27 (1.3%) | 0 (0.0%) |
| $22,500 to $24,999 | 46 (2.3%) | 12 (0.8%) |
| $25,000 to $29,999 | 0 (0.0%) | 39 (2.6%) |
| $30,000 to $34,999 | 6 (0.3%) | 32 (2.1%) |
| $35,000 to $39,999 | 123 (6.1%) | 15 (1.0%) |
| $40,000 to $44,999 | 67 (3.3%) | 38 (2.5%) |
| $45,000 to $49,999 | 60 (3.0%) | 37 (2.4%) |
| $50,000 to $54,999 | 0 (0.0%) | 42 (2.8%) |
| $55,000 to $64,999 | 160 (8.0%) | 79 (5.2%) |
| $65,000 to $74,999 | 76 (3.8%) | 118 (7.8%) |
| $75,000 to $99,999 | 405 (20.2%) | 156 (10.3%) |
| $100,000+ | 688 (34.3%) | 484 (32.0%) |
| Total | 2,009 (100.0%) | 1,515 (100.0%) |
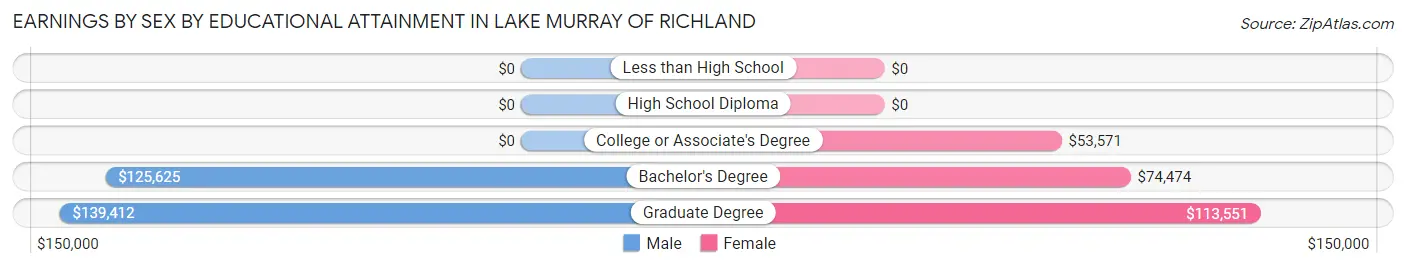
Earnings by Sex by Educational Attainment in Lake Murray of Richland
Average earnings in Lake Murray of Richland are $85,967 for men and $72,961 for women, a difference of 15.1%. Men with an educational attainment of graduate degree enjoy the highest average annual earnings of $139,412, while those with bachelor's degree education earn the least with $125,625. Women with an educational attainment of graduate degree earn the most with the average annual earnings of $113,551, while those with college or associate's degree education have the smallest earnings of $53,571.
| Educational Attainment | Male Income | Female Income |
| Less than High School | - | - |
| High School Diploma | - | - |
| College or Associate's Degree | - | - |
| Bachelor's Degree | $125,625 | $74,474 |
| Graduate Degree | $139,412 | $113,551 |
| Total | $85,967 | $72,961 |
Family Income in Lake Murray of Richland
Family Income Brackets in Lake Murray of Richland
According to the Lake Murray of Richland family income data, there are 603 families falling into the $200,000+ income range, which is the most common income bracket and makes up 29.0% of all families.
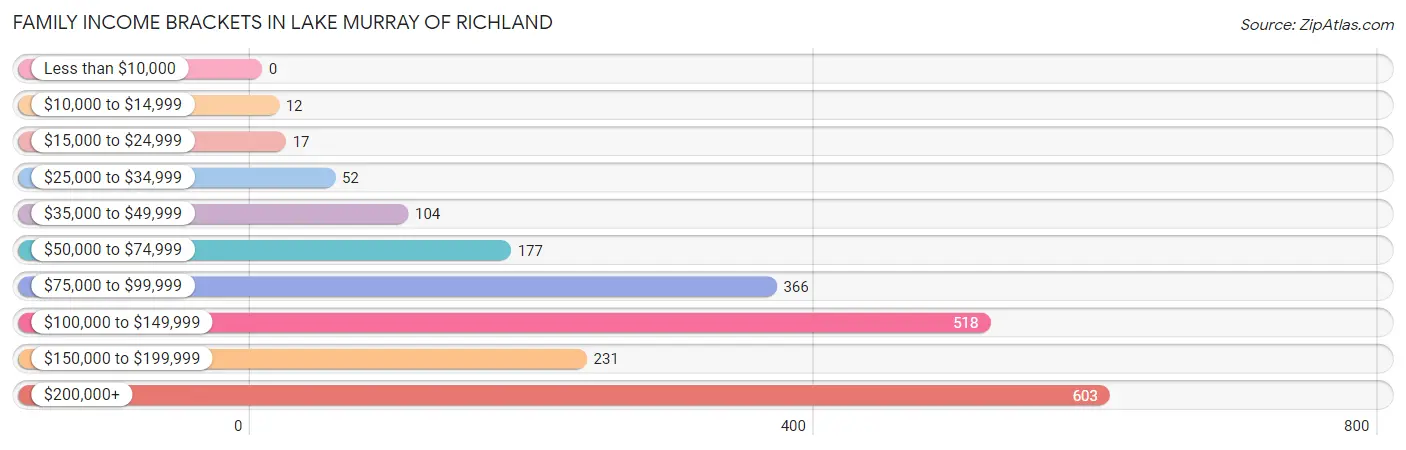
| Income Bracket | # Families | % Families |
| Less than $10,000 | 0 | 0.0% |
| $10,000 to $14,999 | 12 | 0.6% |
| $15,000 to $24,999 | 17 | 0.8% |
| $25,000 to $34,999 | 52 | 2.5% |
| $35,000 to $49,999 | 104 | 5.0% |
| $50,000 to $74,999 | 177 | 8.5% |
| $75,000 to $99,999 | 366 | 17.6% |
| $100,000 to $149,999 | 518 | 24.9% |
| $150,000 to $199,999 | 231 | 11.1% |
| $200,000+ | 603 | 29.0% |
Family Income by Famaliy Size in Lake Murray of Richland
5-person families (165 | 7.9%) account for the highest median family income in Lake Murray of Richland with $214,952 per family, while 2-person families (1,207 | 58.0%) have the highest median income of $59,456 per family member.
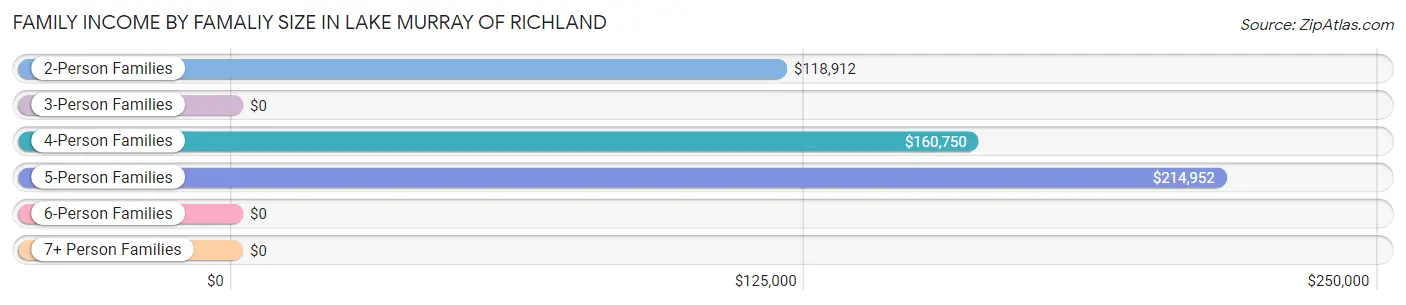
| Income Bracket | # Families | Median Income |
| 2-Person Families | 1,207 (58.0%) | $118,912 |
| 3-Person Families | 391 (18.8%) | $0 |
| 4-Person Families | 317 (15.2%) | $160,750 |
| 5-Person Families | 165 (7.9%) | $214,952 |
| 6-Person Families | 0 (0.0%) | $0 |
| 7+ Person Families | 0 (0.0%) | $0 |
| Total | 2,080 (100.0%) | $133,393 |
Family Income by Number of Earners in Lake Murray of Richland
The median family income in Lake Murray of Richland is $133,393, with families comprising 3+ earners (156) having the highest median family income of $216,759, while families with no earners (551) have the lowest median family income of $80,690, accounting for 7.5% and 26.5% of families, respectively.
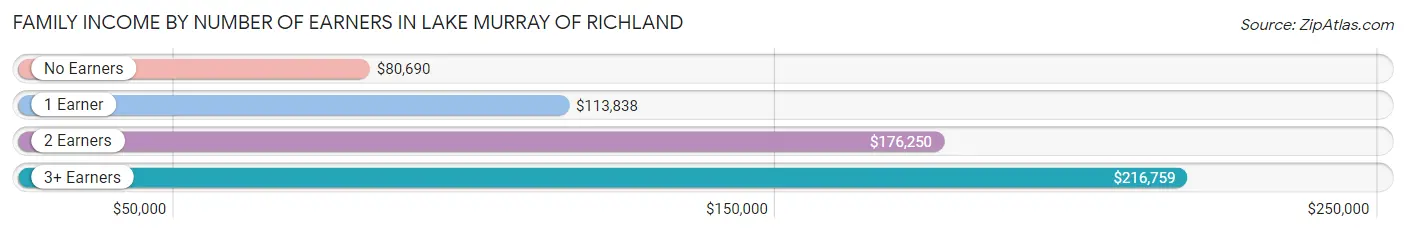
| Number of Earners | # Families | Median Income |
| No Earners | 551 (26.5%) | $80,690 |
| 1 Earner | 469 (22.6%) | $113,838 |
| 2 Earners | 904 (43.5%) | $176,250 |
| 3+ Earners | 156 (7.5%) | $216,759 |
| Total | 2,080 (100.0%) | $133,393 |
Household Income in Lake Murray of Richland
Household Income Brackets in Lake Murray of Richland
With 651 households falling in the category, the $200,000+ income range is the most frequent in Lake Murray of Richland, accounting for 22.7% of all households.
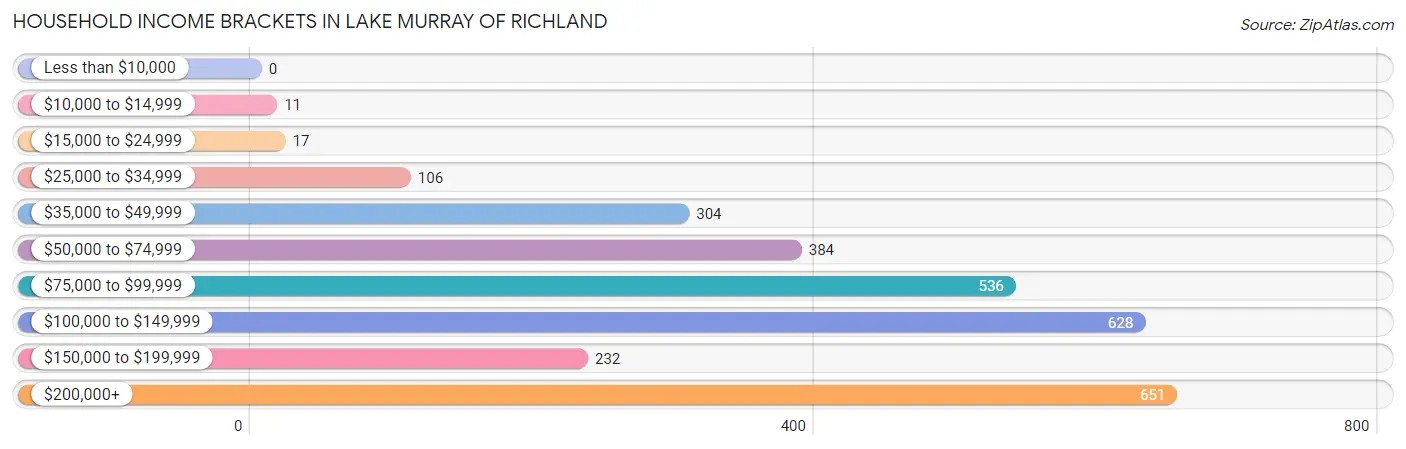
| Income Bracket | # Households | % Households |
| Less than $10,000 | 0 | 0.0% |
| $10,000 to $14,999 | 11 | 0.4% |
| $15,000 to $24,999 | 17 | 0.6% |
| $25,000 to $34,999 | 106 | 3.7% |
| $35,000 to $49,999 | 304 | 10.6% |
| $50,000 to $74,999 | 384 | 13.4% |
| $75,000 to $99,999 | 536 | 18.7% |
| $100,000 to $149,999 | 628 | 21.9% |
| $150,000 to $199,999 | 232 | 8.1% |
| $200,000+ | 651 | 22.7% |
Household Income by Householder Age in Lake Murray of Richland
The median household income in Lake Murray of Richland is $111,477, with the highest median household income of $141,852 found in the 45 to 64 years age bracket for the primary householder. A total of 1,258 households (43.9%) fall into this category. Meanwhile, the 15 to 24 years age bracket for the primary householder has the lowest median household income of $0, with 17 households (0.6%) in this group.
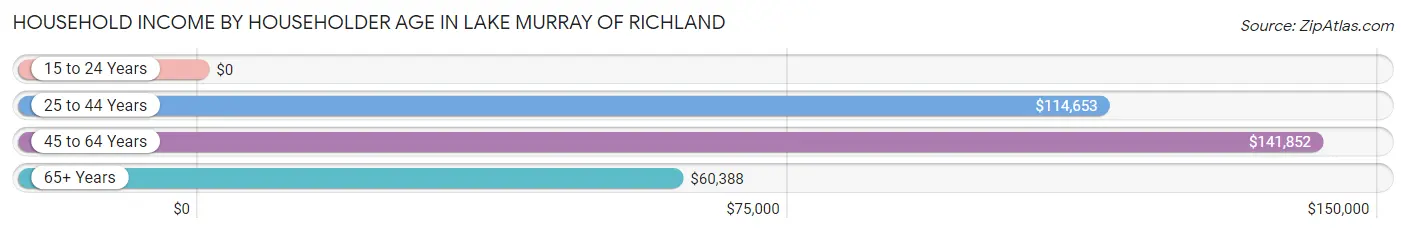
| Income Bracket | # Households | Median Income |
| 15 to 24 Years | 17 (0.6%) | $0 |
| 25 to 44 Years | 774 (27.0%) | $114,653 |
| 45 to 64 Years | 1,258 (43.9%) | $141,852 |
| 65+ Years | 817 (28.5%) | $60,388 |
| Total | 2,866 (100.0%) | $111,477 |
Poverty in Lake Murray of Richland
Income Below Poverty by Sex and Age in Lake Murray of Richland
With 1.3% poverty level for males and 0.3% for females among the residents of Lake Murray of Richland, 15 year old males and 55 to 64 year old females are the most vulnerable to poverty, with 35 males (54.7%) and 11 females (2.7%) in their respective age groups living below the poverty level.
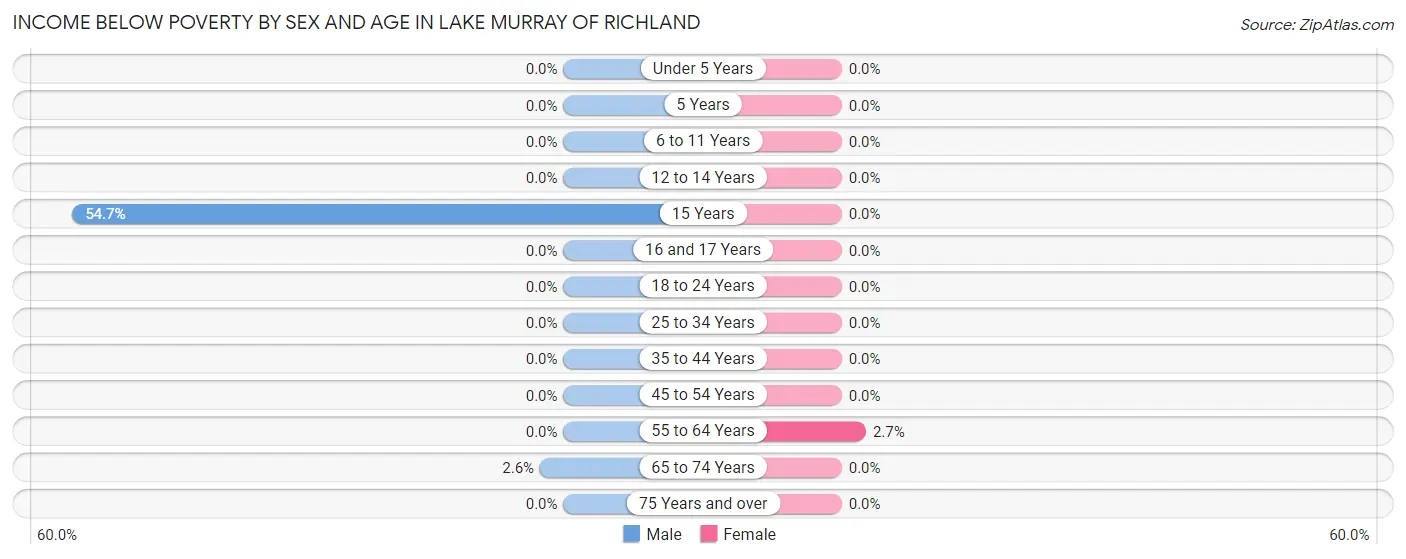
| Age Bracket | Male | Female |
| Under 5 Years | 0 (0.0%) | 0 (0.0%) |
| 5 Years | 0 (0.0%) | 0 (0.0%) |
| 6 to 11 Years | 0 (0.0%) | 0 (0.0%) |
| 12 to 14 Years | 0 (0.0%) | 0 (0.0%) |
| 15 Years | 35 (54.7%) | 0 (0.0%) |
| 16 and 17 Years | 0 (0.0%) | 0 (0.0%) |
| 18 to 24 Years | 0 (0.0%) | 0 (0.0%) |
| 25 to 34 Years | 0 (0.0%) | 0 (0.0%) |
| 35 to 44 Years | 0 (0.0%) | 0 (0.0%) |
| 45 to 54 Years | 0 (0.0%) | 0 (0.0%) |
| 55 to 64 Years | 0 (0.0%) | 11 (2.7%) |
| 65 to 74 Years | 12 (2.6%) | 0 (0.0%) |
| 75 Years and over | 0 (0.0%) | 0 (0.0%) |
| Total | 47 (1.3%) | 11 (0.3%) |
Income Above Poverty by Sex and Age in Lake Murray of Richland
According to the poverty statistics in Lake Murray of Richland, males aged under 5 years and females aged under 5 years are the age groups that are most secure financially, with 100.0% of males and 100.0% of females in these age groups living above the poverty line.
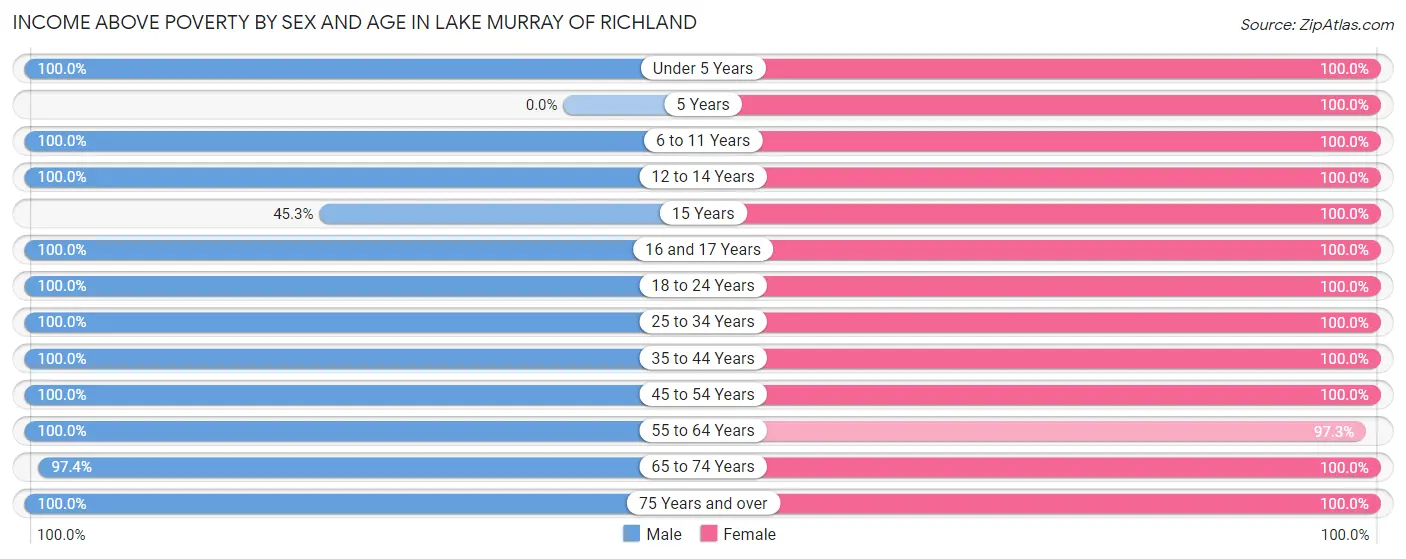
| Age Bracket | Male | Female |
| Under 5 Years | 82 (100.0%) | 293 (100.0%) |
| 5 Years | 0 (0.0%) | 103 (100.0%) |
| 6 to 11 Years | 200 (100.0%) | 111 (100.0%) |
| 12 to 14 Years | 131 (100.0%) | 265 (100.0%) |
| 15 Years | 29 (45.3%) | 35 (100.0%) |
| 16 and 17 Years | 33 (100.0%) | 111 (100.0%) |
| 18 to 24 Years | 238 (100.0%) | 93 (100.0%) |
| 25 to 34 Years | 181 (100.0%) | 254 (100.0%) |
| 35 to 44 Years | 544 (100.0%) | 450 (100.0%) |
| 45 to 54 Years | 775 (100.0%) | 457 (100.0%) |
| 55 to 64 Years | 458 (100.0%) | 398 (97.3%) |
| 65 to 74 Years | 448 (97.4%) | 358 (100.0%) |
| 75 Years and over | 318 (100.0%) | 315 (100.0%) |
| Total | 3,437 (98.7%) | 3,243 (99.7%) |
Income Below Poverty Among Married-Couple Families in Lake Murray of Richland
The poverty statistics for married-couple families in Lake Murray of Richland show that 0.7% or 12 of the total 1,729 families live below the poverty line. Families with no children have the highest poverty rate of 1.1%, comprising of 12 families. On the other hand, families with 1 or 2 children have the lowest poverty rate of 0.0%, which includes 0 families.
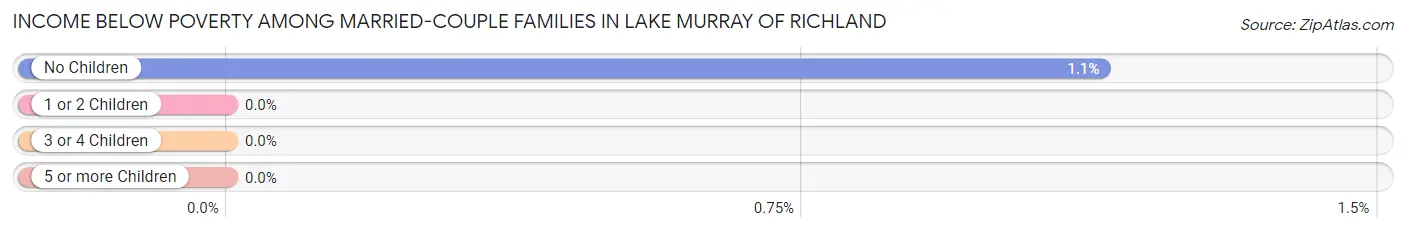
| Children | Above Poverty | Below Poverty |
| No Children | 1,038 (98.9%) | 12 (1.1%) |
| 1 or 2 Children | 514 (100.0%) | 0 (0.0%) |
| 3 or 4 Children | 165 (100.0%) | 0 (0.0%) |
| 5 or more Children | 0 (0.0%) | 0 (0.0%) |
| Total | 1,717 (99.3%) | 12 (0.7%) |
Income Below Poverty Among Single-Parent Households in Lake Murray of Richland
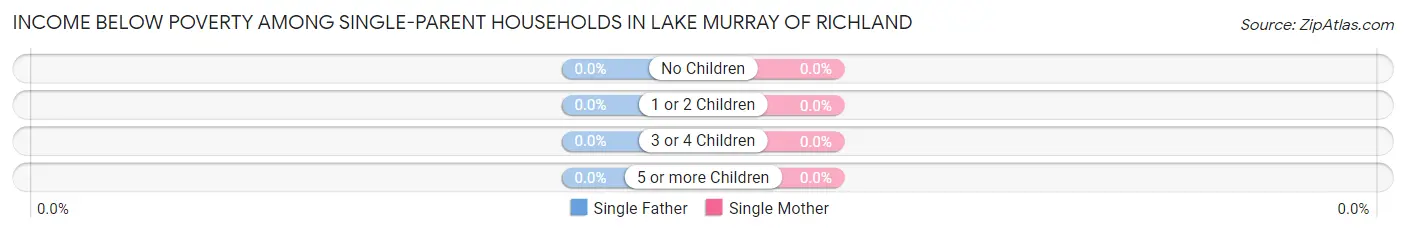
| Children | Single Father | Single Mother |
| No Children | 0 (0.0%) | 0 (0.0%) |
| 1 or 2 Children | 0 (0.0%) | 0 (0.0%) |
| 3 or 4 Children | 0 (0.0%) | 0 (0.0%) |
| 5 or more Children | 0 (0.0%) | 0 (0.0%) |
| Total | 0 (0.0%) | 0 (0.0%) |
Income Below Poverty Among Married-Couple vs Single-Parent Households in Lake Murray of Richland
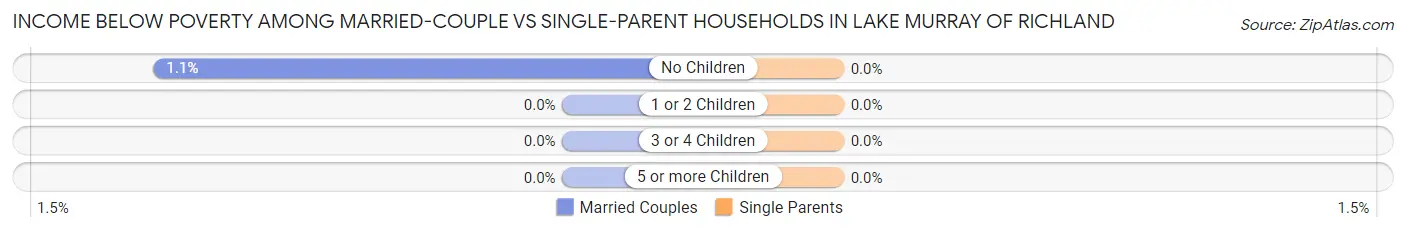
| Children | Married-Couple Families | Single-Parent Households |
| No Children | 12 (1.1%) | 0 (0.0%) |
| 1 or 2 Children | 0 (0.0%) | 0 (0.0%) |
| 3 or 4 Children | 0 (0.0%) | 0 (0.0%) |
| 5 or more Children | 0 (0.0%) | 0 (0.0%) |
| Total | 12 (0.7%) | 0 (0.0%) |
Race in Lake Murray of Richland
The most populous races in Lake Murray of Richland are White / Caucasian (6,111 | 88.4%), Black / African American (463 | 6.7%), and Asian (200 | 2.9%).
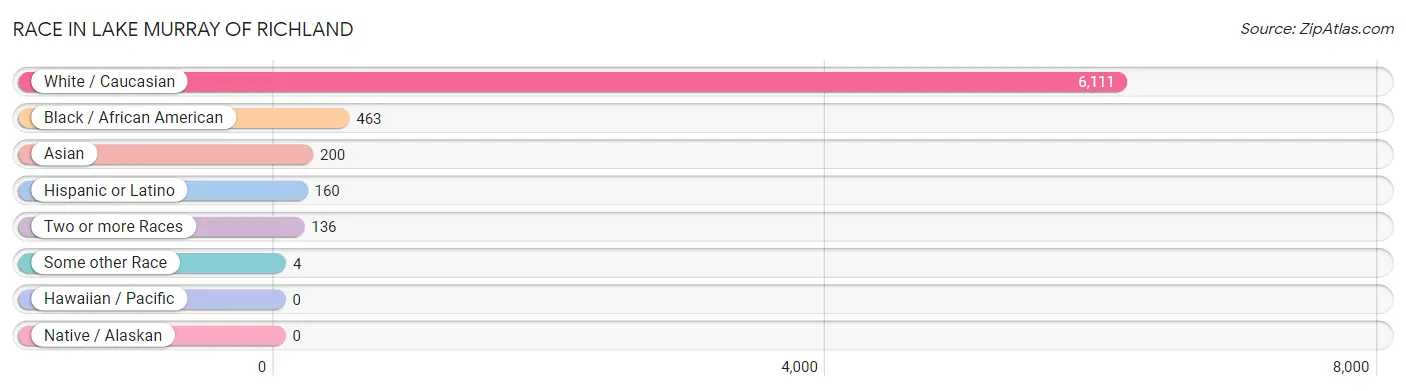
| Race | # Population | % Population |
| Asian | 200 | 2.9% |
| Black / African American | 463 | 6.7% |
| Hawaiian / Pacific | 0 | 0.0% |
| Hispanic or Latino | 160 | 2.3% |
| Native / Alaskan | 0 | 0.0% |
| White / Caucasian | 6,111 | 88.4% |
| Two or more Races | 136 | 2.0% |
| Some other Race | 4 | 0.1% |
| Total | 6,914 | 100.0% |
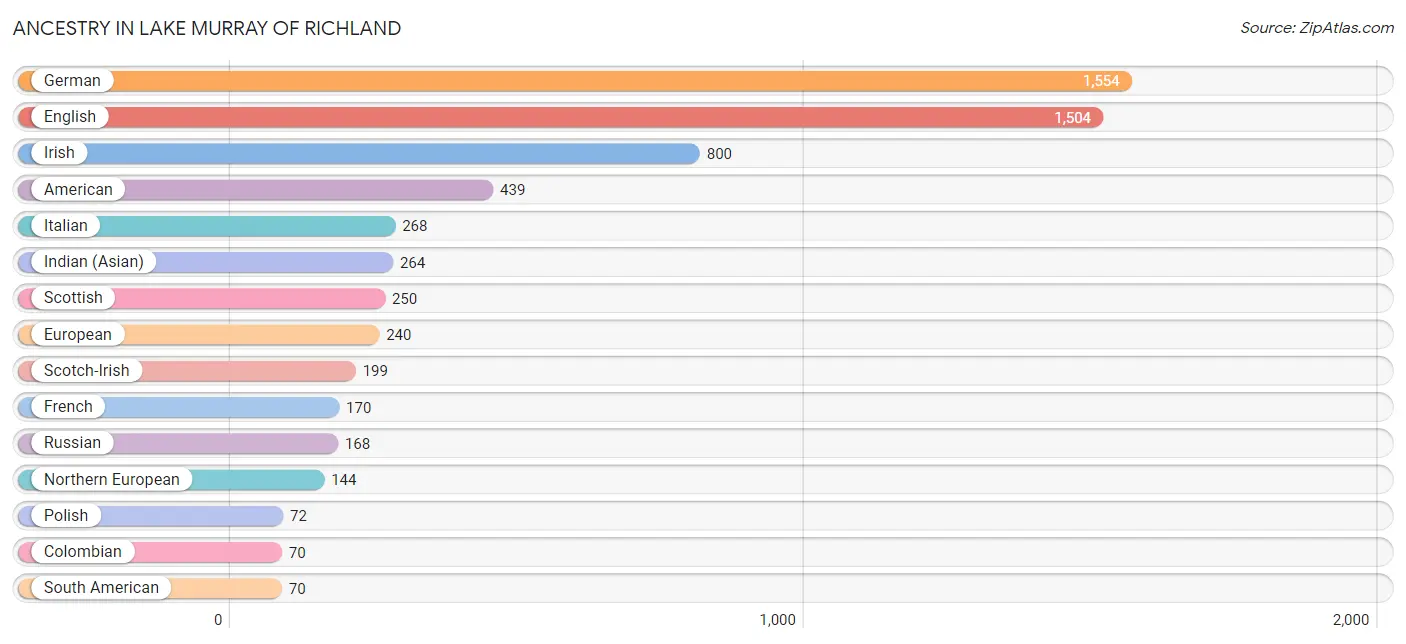
Ancestry in Lake Murray of Richland
The most populous ancestries reported in Lake Murray of Richland are German (1,554 | 22.5%), English (1,504 | 21.7%), Irish (800 | 11.6%), American (439 | 6.4%), and Italian (268 | 3.9%), together accounting for 66.0% of all Lake Murray of Richland residents.
| Ancestry | # Population | % Population |
| African | 32 | 0.5% |
| American | 439 | 6.4% |
| British | 22 | 0.3% |
| Canadian | 15 | 0.2% |
| Colombian | 70 | 1.0% |
| Croatian | 51 | 0.7% |
| Czech | 23 | 0.3% |
| Dutch | 39 | 0.6% |
| English | 1,504 | 21.7% |
| European | 240 | 3.5% |
| French | 170 | 2.5% |
| German | 1,554 | 22.5% |
| Indian (Asian) | 264 | 3.8% |
| Irish | 800 | 11.6% |
| Italian | 268 | 3.9% |
| Jamaican | 25 | 0.4% |
| Korean | 6 | 0.1% |
| Mexican | 4 | 0.1% |
| Northern European | 144 | 2.1% |
| Norwegian | 45 | 0.6% |
| Polish | 72 | 1.0% |
| Puerto Rican | 32 | 0.5% |
| Russian | 168 | 2.4% |
| Scotch-Irish | 199 | 2.9% |
| Scottish | 250 | 3.6% |
| South American | 70 | 1.0% |
| Spanish | 27 | 0.4% |
| Subsaharan African | 32 | 0.5% |
| Swedish | 60 | 0.9% |
| Swiss | 27 | 0.4% |
| Ukrainian | 24 | 0.4% |
| Yugoslavian | 15 | 0.2% | View All 32 Rows |
Immigrants in Lake Murray of Richland
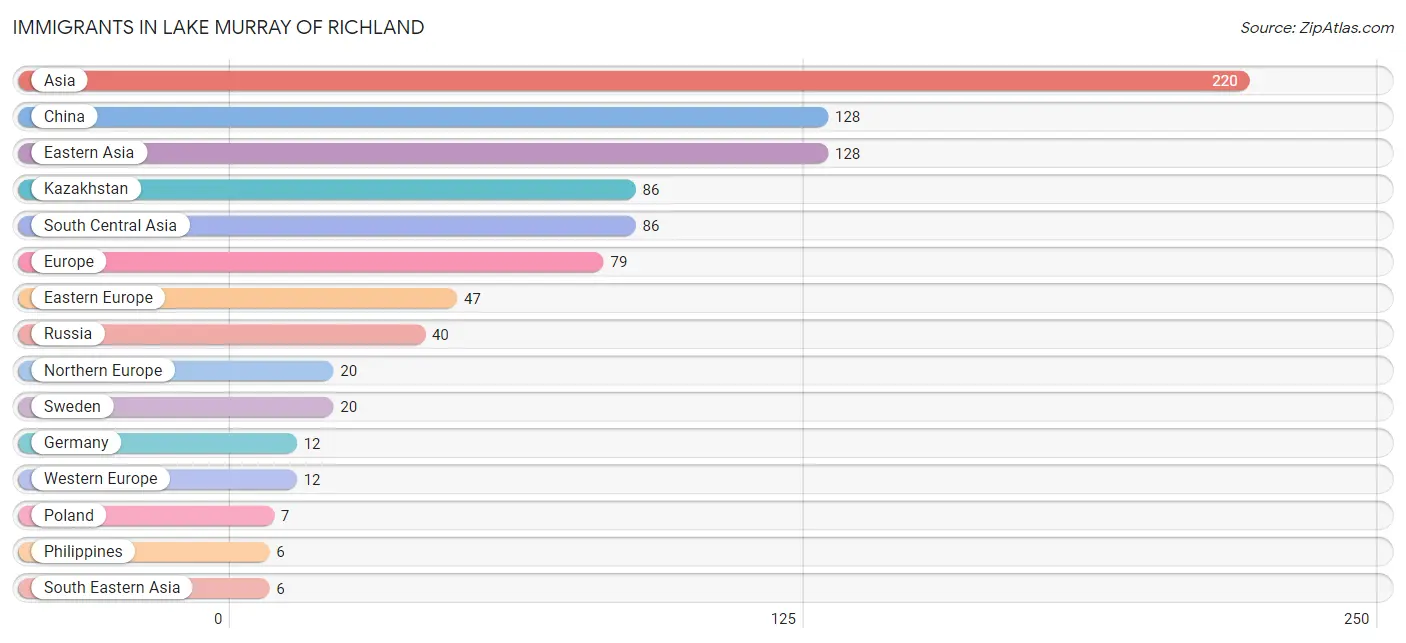
The most numerous immigrant groups reported in Lake Murray of Richland came from Asia (220 | 3.2%), China (128 | 1.8%), Eastern Asia (128 | 1.8%), Kazakhstan (86 | 1.2%), and South Central Asia (86 | 1.2%), together accounting for 9.4% of all Lake Murray of Richland residents.
| Immigration Origin | # Population | % Population |
| Asia | 220 | 3.2% |
| China | 128 | 1.8% |
| Eastern Asia | 128 | 1.8% |
| Eastern Europe | 47 | 0.7% |
| Europe | 79 | 1.1% |
| Germany | 12 | 0.2% |
| Kazakhstan | 86 | 1.2% |
| Northern Europe | 20 | 0.3% |
| Philippines | 6 | 0.1% |
| Poland | 7 | 0.1% |
| Russia | 40 | 0.6% |
| South Central Asia | 86 | 1.2% |
| South Eastern Asia | 6 | 0.1% |
| Sweden | 20 | 0.3% |
| Western Europe | 12 | 0.2% | View All 15 Rows |
Sex and Age in Lake Murray of Richland
Sex and Age in Lake Murray of Richland
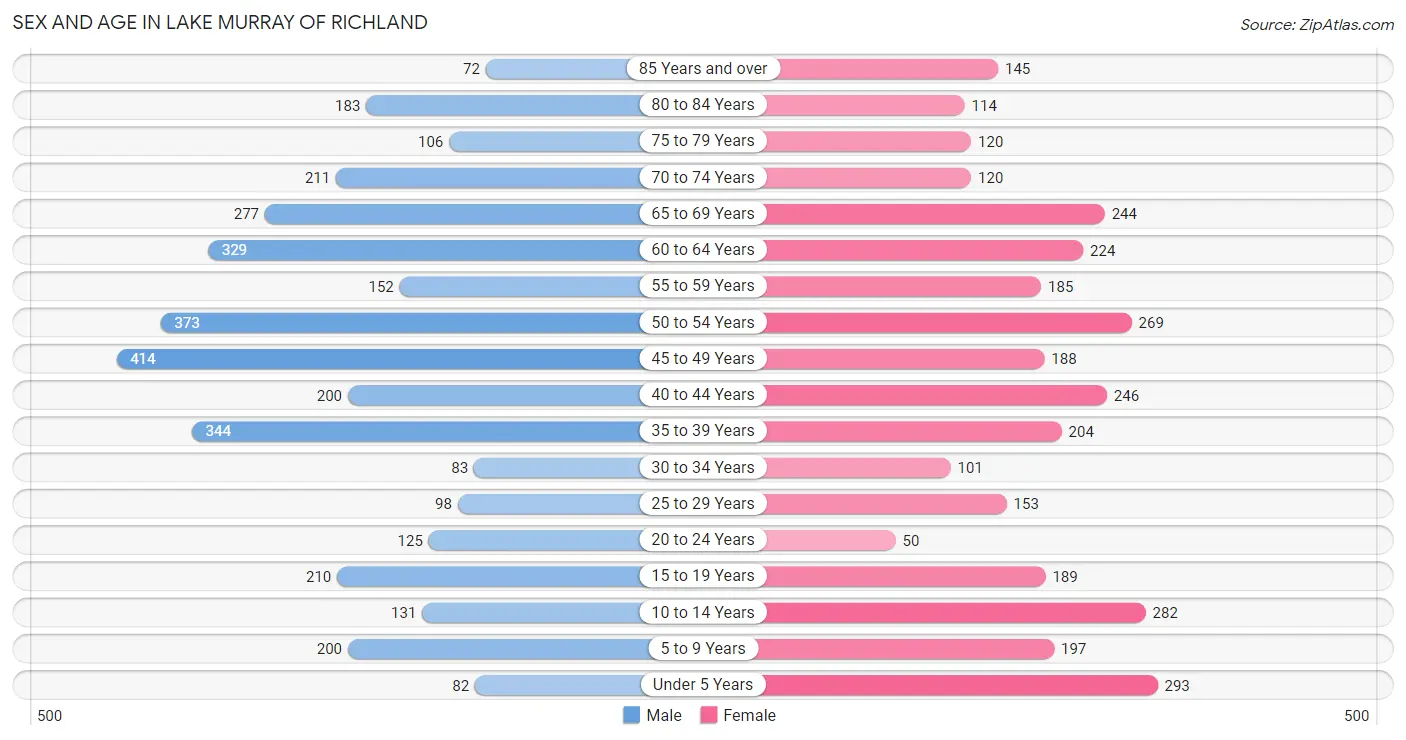
The most populous age groups in Lake Murray of Richland are 45 to 49 Years (414 | 11.5%) for men and Under 5 Years (293 | 8.8%) for women.
| Age Bracket | Male | Female |
| Under 5 Years | 82 (2.3%) | 293 (8.8%) |
| 5 to 9 Years | 200 (5.6%) | 197 (5.9%) |
| 10 to 14 Years | 131 (3.6%) | 282 (8.5%) |
| 15 to 19 Years | 210 (5.9%) | 189 (5.7%) |
| 20 to 24 Years | 125 (3.5%) | 50 (1.5%) |
| 25 to 29 Years | 98 (2.7%) | 153 (4.6%) |
| 30 to 34 Years | 83 (2.3%) | 101 (3.0%) |
| 35 to 39 Years | 344 (9.6%) | 204 (6.1%) |
| 40 to 44 Years | 200 (5.6%) | 246 (7.4%) |
| 45 to 49 Years | 414 (11.5%) | 188 (5.7%) |
| 50 to 54 Years | 373 (10.4%) | 269 (8.1%) |
| 55 to 59 Years | 152 (4.2%) | 185 (5.6%) |
| 60 to 64 Years | 329 (9.2%) | 224 (6.7%) |
| 65 to 69 Years | 277 (7.7%) | 244 (7.3%) |
| 70 to 74 Years | 211 (5.9%) | 120 (3.6%) |
| 75 to 79 Years | 106 (2.9%) | 120 (3.6%) |
| 80 to 84 Years | 183 (5.1%) | 114 (3.4%) |
| 85 Years and over | 72 (2.0%) | 145 (4.4%) |
| Total | 3,590 (100.0%) | 3,324 (100.0%) |
Families and Households in Lake Murray of Richland
Median Family Size in Lake Murray of Richland
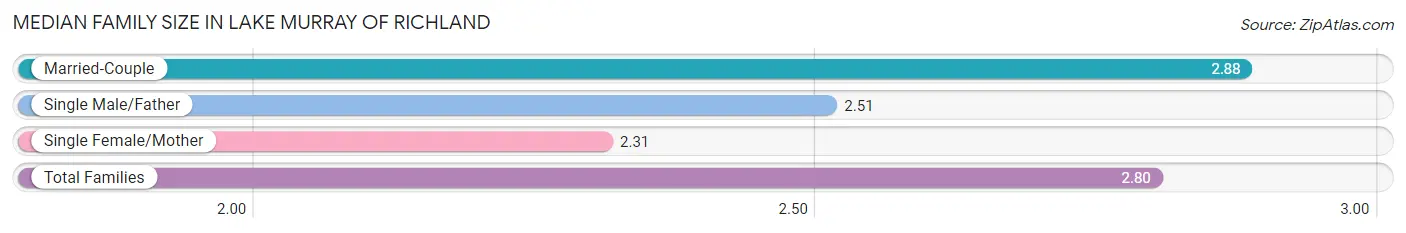
The median family size in Lake Murray of Richland is 2.80 persons per family, with married-couple families (1,729 | 83.1%) accounting for the largest median family size of 2.88 persons per family. On the other hand, single female/mother families (144 | 6.9%) represent the smallest median family size with 2.31 persons per family.
| Family Type | # Families | Family Size |
| Married-Couple | 1,729 (83.1%) | 2.88 |
| Single Male/Father | 207 (10.0%) | 2.51 |
| Single Female/Mother | 144 (6.9%) | 2.31 |
| Total Families | 2,080 (100.0%) | 2.80 |
Median Household Size in Lake Murray of Richland
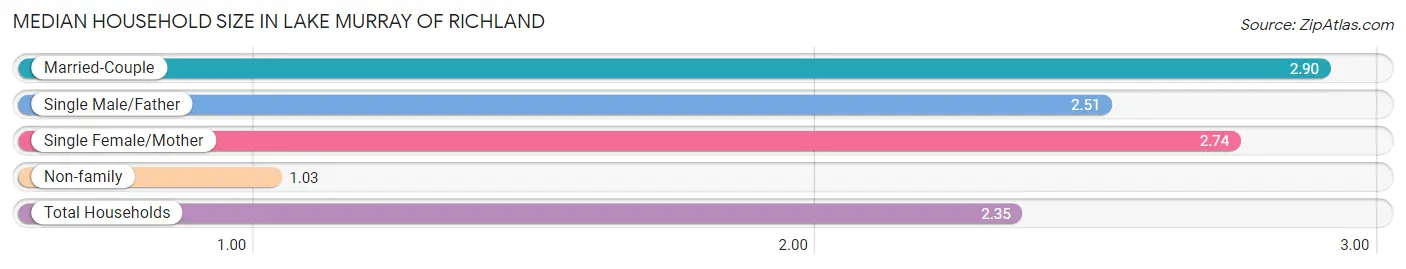
The median household size in Lake Murray of Richland is 2.35 persons per household, with married-couple households (1,729 | 60.3%) accounting for the largest median household size of 2.9 persons per household. non-family households (786 | 27.4%) represent the smallest median household size with 1.03 persons per household.
| Household Type | # Households | Household Size |
| Married-Couple | 1,729 (60.3%) | 2.90 |
| Single Male/Father | 207 (7.2%) | 2.51 |
| Single Female/Mother | 144 (5.0%) | 2.74 |
| Non-family | 786 (27.4%) | 1.03 |
| Total Households | 2,866 (100.0%) | 2.35 |
Household Size by Marriage Status in Lake Murray of Richland
Out of a total of 2,866 households in Lake Murray of Richland, 2,080 (72.6%) are family households, while 786 (27.4%) are nonfamily households. The most numerous type of family households are 2-person households, comprising 1,118, and the most common type of nonfamily households are 1-person households, comprising 765.
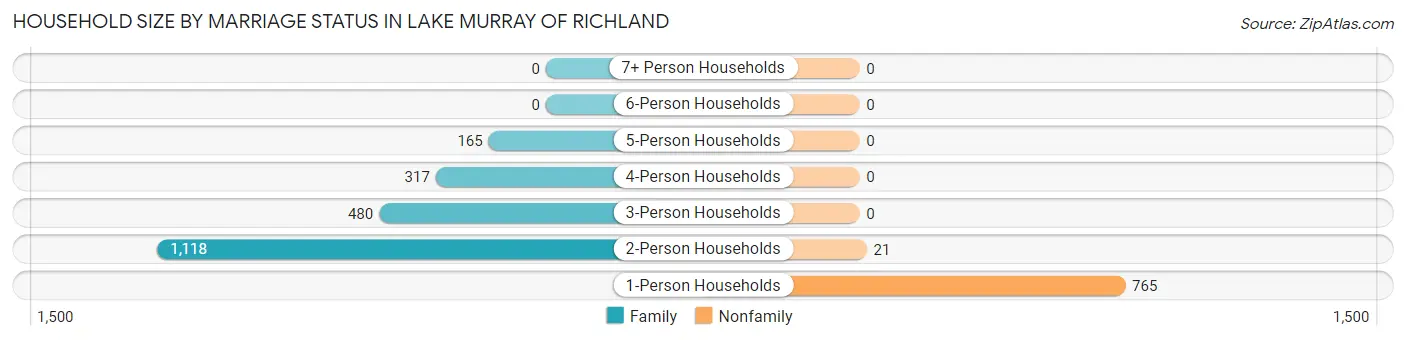
| Household Size | Family Households | Nonfamily Households |
| 1-Person Households | - | 765 (26.7%) |
| 2-Person Households | 1,118 (39.0%) | 21 (0.7%) |
| 3-Person Households | 480 (16.8%) | 0 (0.0%) |
| 4-Person Households | 317 (11.1%) | 0 (0.0%) |
| 5-Person Households | 165 (5.8%) | 0 (0.0%) |
| 6-Person Households | 0 (0.0%) | 0 (0.0%) |
| 7+ Person Households | 0 (0.0%) | 0 (0.0%) |
| Total | 2,080 (72.6%) | 786 (27.4%) |
Female Fertility in Lake Murray of Richland
Fertility by Age in Lake Murray of Richland
Average fertility rate in Lake Murray of Richland is 28.0 births per 1,000 women. Women in the age bracket of 35 to 50 years have the highest fertility rate with 47.0 births per 1,000 women. Women in the age bracket of 35 to 50 years acount for 100.0% of all women with births.
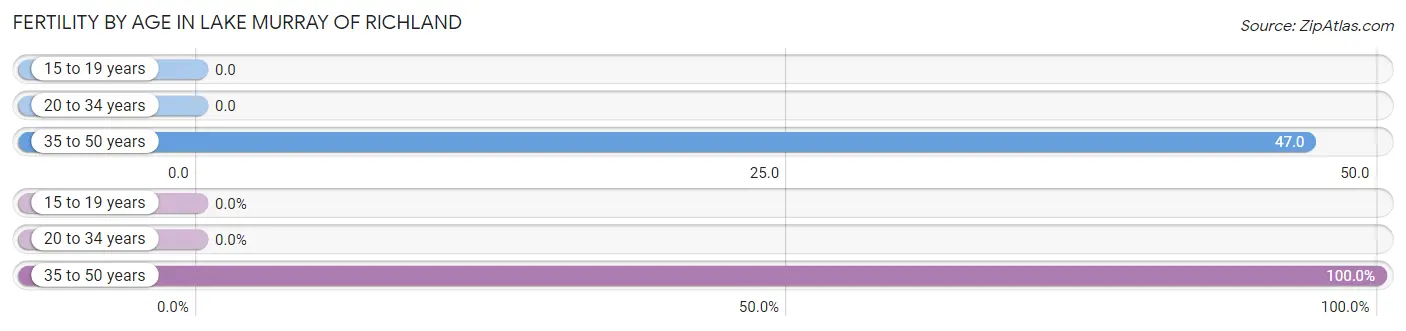
| Age Bracket | Women with Births | Births / 1,000 Women |
| 15 to 19 years | 0 (0.0%) | 0.0 |
| 20 to 34 years | 0 (0.0%) | 0.0 |
| 35 to 50 years | 34 (100.0%) | 47.0 |
| Total | 34 (100.0%) | 28.0 |
Fertility by Age by Marriage Status in Lake Murray of Richland
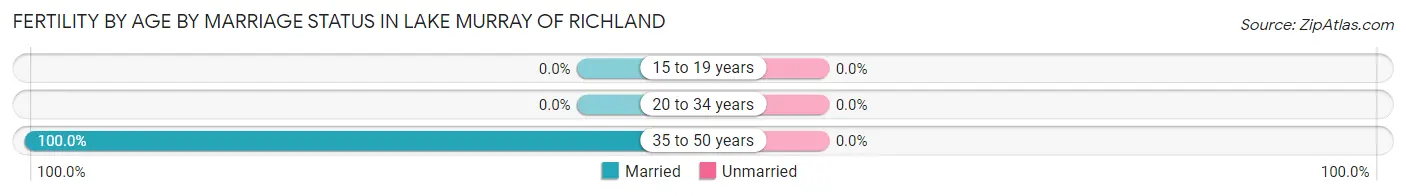
| Age Bracket | Married | Unmarried |
| 15 to 19 years | 0 (0.0%) | 0 (0.0%) |
| 20 to 34 years | 0 (0.0%) | 0 (0.0%) |
| 35 to 50 years | 34 (100.0%) | 0 (0.0%) |
| Total | 34 (100.0%) | 0 (0.0%) |
Fertility by Education in Lake Murray of Richland
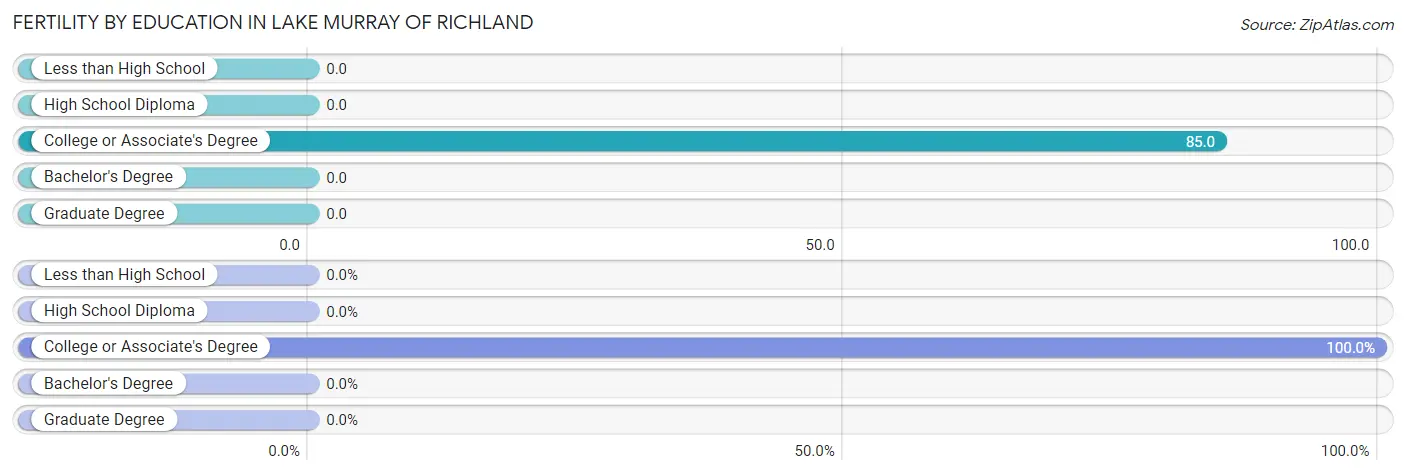
| Educational Attainment | Women with Births | Births / 1,000 Women |
| Less than High School | 0 (0.0%) | 0.0 |
| High School Diploma | 0 (0.0%) | 0.0 |
| College or Associate's Degree | 34 (100.0%) | 85.0 |
| Bachelor's Degree | 0 (0.0%) | 0.0 |
| Graduate Degree | 0 (0.0%) | 0.0 |
| Total | 34 (100.0%) | 28.0 |
Fertility by Education by Marriage Status in Lake Murray of Richland
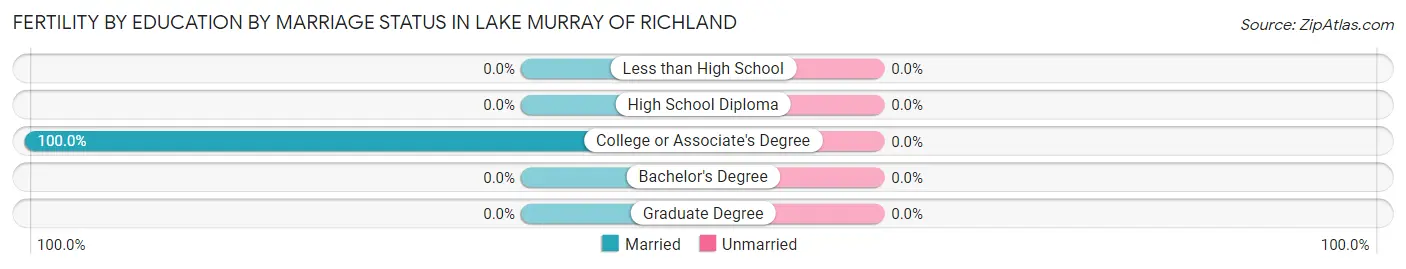
| Educational Attainment | Married | Unmarried |
| Less than High School | 0 (0.0%) | 0 (0.0%) |
| High School Diploma | 0 (0.0%) | 0 (0.0%) |
| College or Associate's Degree | 34 (100.0%) | 0 (0.0%) |
| Bachelor's Degree | 0 (0.0%) | 0 (0.0%) |
| Graduate Degree | 0 (0.0%) | 0 (0.0%) |
| Total | 34 (100.0%) | 0 (0.0%) |
Employment Characteristics in Lake Murray of Richland
Employment by Class of Employer in Lake Murray of Richland
Among the 3,201 employed individuals in Lake Murray of Richland, private company employees (1,891 | 59.1%), self-employed (not incorporated) (332 | 10.4%), and self-employed (incorporated) (291 | 9.1%) make up the most common classes of employment.
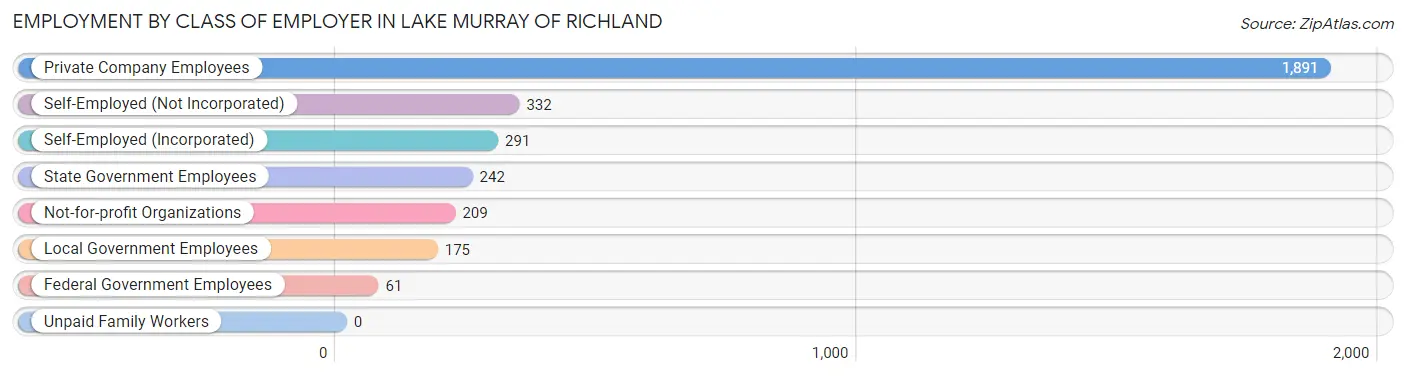
| Employer Class | # Employees | % Employees |
| Private Company Employees | 1,891 | 59.1% |
| Self-Employed (Incorporated) | 291 | 9.1% |
| Self-Employed (Not Incorporated) | 332 | 10.4% |
| Not-for-profit Organizations | 209 | 6.5% |
| Local Government Employees | 175 | 5.5% |
| State Government Employees | 242 | 7.6% |
| Federal Government Employees | 61 | 1.9% |
| Unpaid Family Workers | 0 | 0.0% |
| Total | 3,201 | 100.0% |
Employment Status by Age in Lake Murray of Richland
According to the labor force statistics for Lake Murray of Richland, out of the total population over 16 years of age (5,630), 60.7% or 3,417 individuals are in the labor force, with 4.4% or 150 of them unemployed. The age group with the highest labor force participation rate is 30 to 34 years, with 100.0% or 184 individuals in the labor force. Within the labor force, the 20 to 24 years age range has the highest percentage of unemployed individuals, with 51.1% or 71 of them being unemployed.
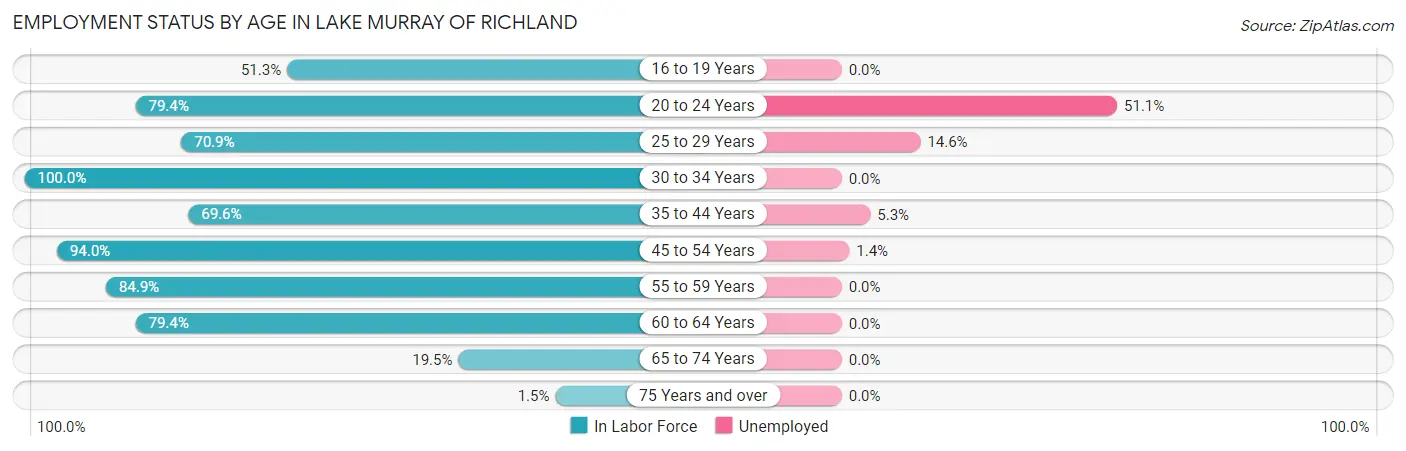
| Age Bracket | In Labor Force | Unemployed |
| 16 to 19 Years | 154 (51.3%) | 0 (0.0%) |
| 20 to 24 Years | 139 (79.4%) | 71 (51.1%) |
| 25 to 29 Years | 178 (70.9%) | 26 (14.6%) |
| 30 to 34 Years | 184 (100.0%) | 0 (0.0%) |
| 35 to 44 Years | 692 (69.6%) | 37 (5.3%) |
| 45 to 54 Years | 1,169 (94.0%) | 16 (1.4%) |
| 55 to 59 Years | 286 (84.9%) | 0 (0.0%) |
| 60 to 64 Years | 439 (79.4%) | 0 (0.0%) |
| 65 to 74 Years | 166 (19.5%) | 0 (0.0%) |
| 75 Years and over | 11 (1.5%) | 0 (0.0%) |
| Total | 3,417 (60.7%) | 150 (4.4%) |
Employment Status by Educational Attainment in Lake Murray of Richland
According to labor force statistics for Lake Murray of Richland, 82.7% of individuals (2,947) out of the total population between 25 and 64 years of age (3,563) are in the labor force, with 2.7% or 80 of them being unemployed. The group with the highest labor force participation rate are those with the educational attainment of bachelor's degree or higher, with 88.1% or 1,714 individuals in the labor force. Within the labor force, individuals with college / associate degree education have the highest percentage of unemployment, with 9.2% or 79 of them being unemployed.
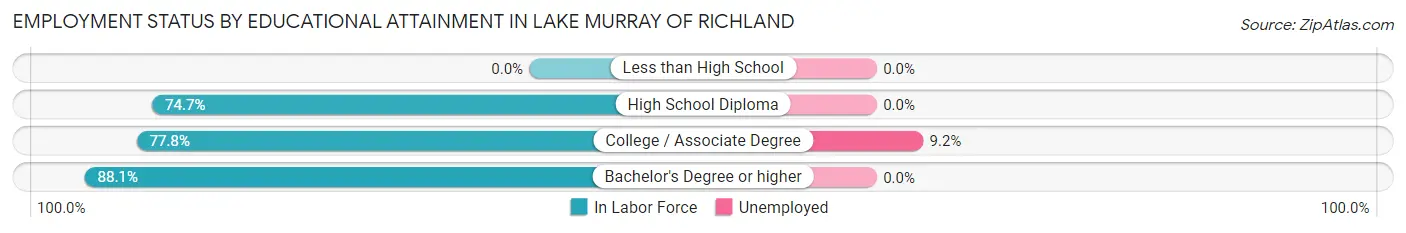
| Educational Attainment | In Labor Force | Unemployed |
| Less than High School | 0 (0.0%) | 0 (0.0%) |
| High School Diploma | 377 (74.7%) | 0 (0.0%) |
| College / Associate Degree | 857 (77.8%) | 101 (9.2%) |
| Bachelor's Degree or higher | 1,714 (88.1%) | 0 (0.0%) |
| Total | 2,947 (82.7%) | 96 (2.7%) |
Employment Occupations by Sex in Lake Murray of Richland
Management, Business, Science and Arts Occupations
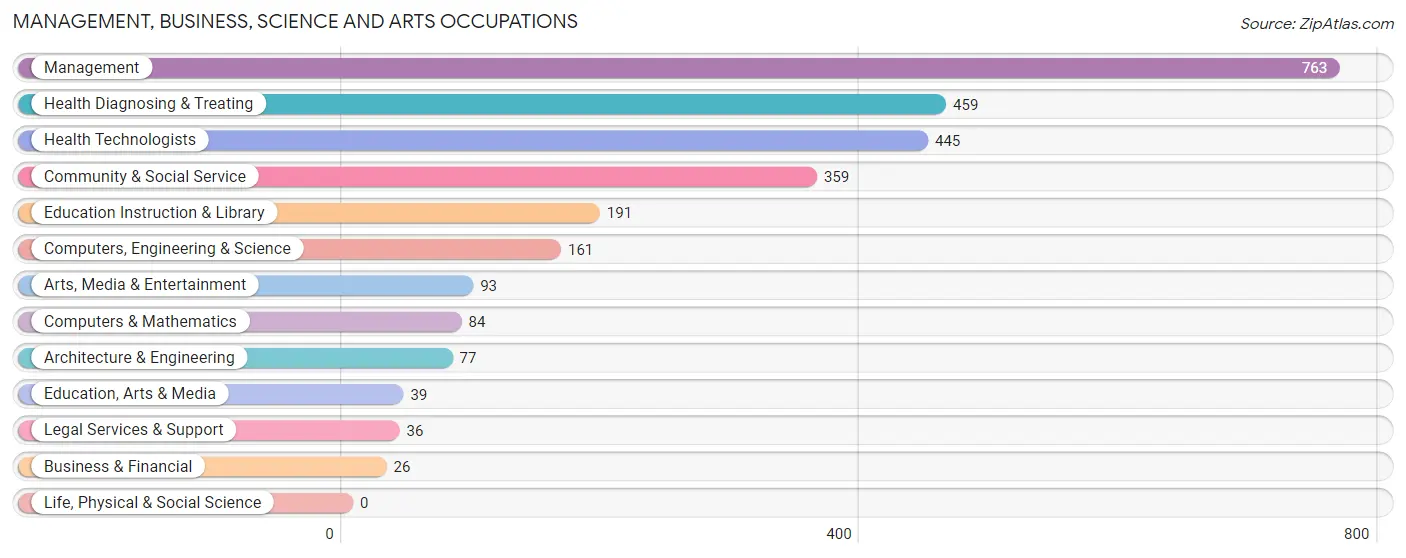
The most common Management, Business, Science and Arts occupations in Lake Murray of Richland are Management (763 | 23.4%), Health Diagnosing & Treating (459 | 14.1%), Health Technologists (445 | 13.6%), Community & Social Service (359 | 11.0%), and Education Instruction & Library (191 | 5.8%).
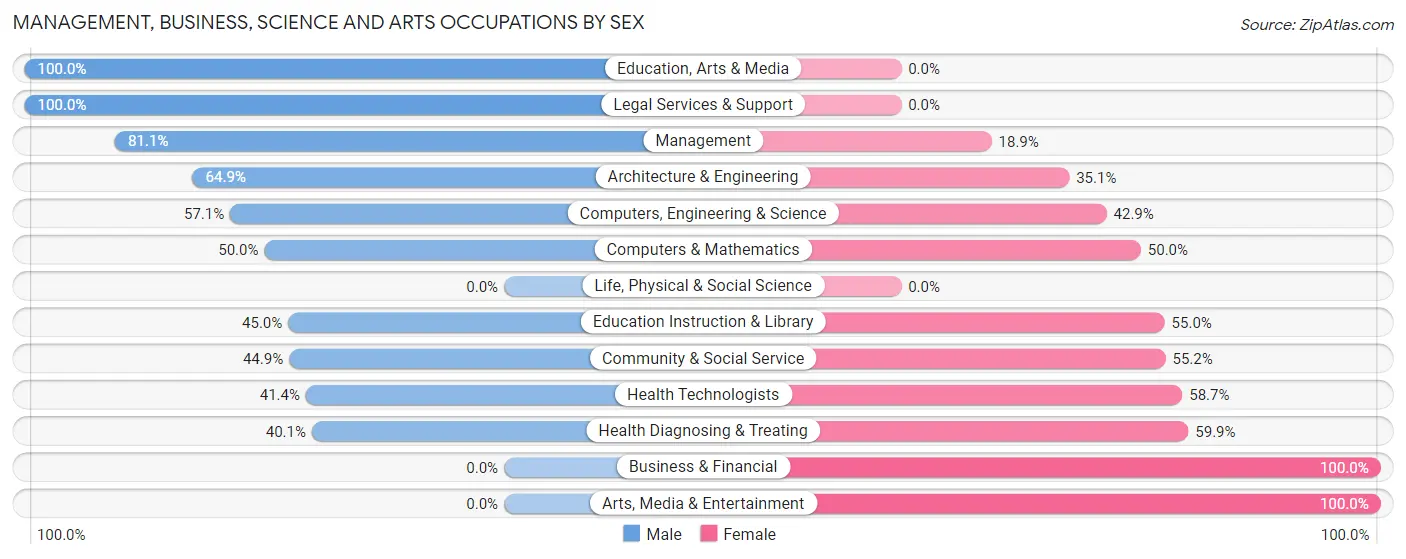
Management, Business, Science and Arts Occupations by Sex
Within the Management, Business, Science and Arts occupations in Lake Murray of Richland, the most male-oriented occupations are Education, Arts & Media (100.0%), Legal Services & Support (100.0%), and Management (81.1%), while the most female-oriented occupations are Business & Financial (100.0%), Arts, Media & Entertainment (100.0%), and Health Diagnosing & Treating (59.9%).
| Occupation | Male | Female |
| Management | 619 (81.1%) | 144 (18.9%) |
| Business & Financial | 0 (0.0%) | 26 (100.0%) |
| Computers, Engineering & Science | 92 (57.1%) | 69 (42.9%) |
| Computers & Mathematics | 42 (50.0%) | 42 (50.0%) |
| Architecture & Engineering | 50 (64.9%) | 27 (35.1%) |
| Life, Physical & Social Science | 0 (0.0%) | 0 (0.0%) |
| Community & Social Service | 161 (44.9%) | 198 (55.1%) |
| Education, Arts & Media | 39 (100.0%) | 0 (0.0%) |
| Legal Services & Support | 36 (100.0%) | 0 (0.0%) |
| Education Instruction & Library | 86 (45.0%) | 105 (55.0%) |
| Arts, Media & Entertainment | 0 (0.0%) | 93 (100.0%) |
| Health Diagnosing & Treating | 184 (40.1%) | 275 (59.9%) |
| Health Technologists | 184 (41.3%) | 261 (58.7%) |
| Total (Category) | 1,056 (59.7%) | 712 (40.3%) |
| Total (Overall) | 1,846 (56.5%) | 1,422 (43.5%) |
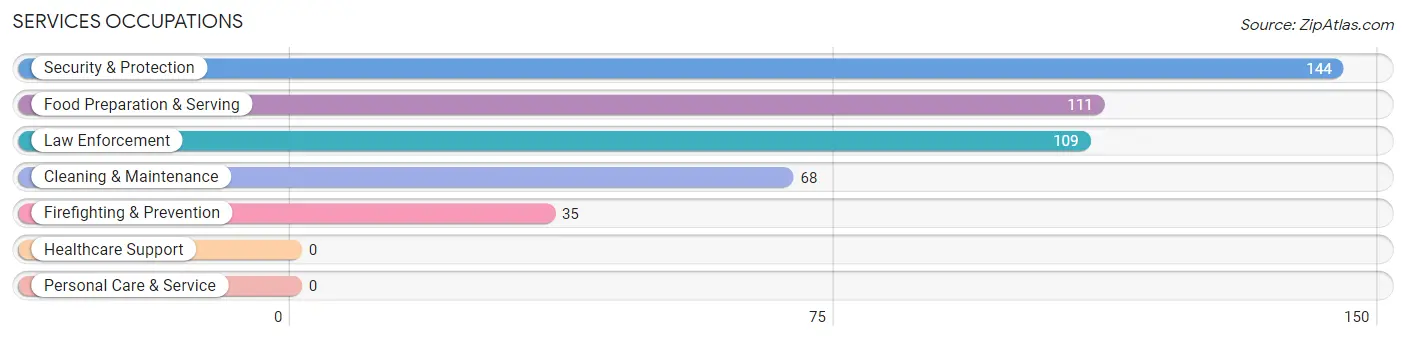
Services Occupations
The most common Services occupations in Lake Murray of Richland are Security & Protection (144 | 4.4%), Food Preparation & Serving (111 | 3.4%), Law Enforcement (109 | 3.3%), Cleaning & Maintenance (68 | 2.1%), and Firefighting & Prevention (35 | 1.1%).
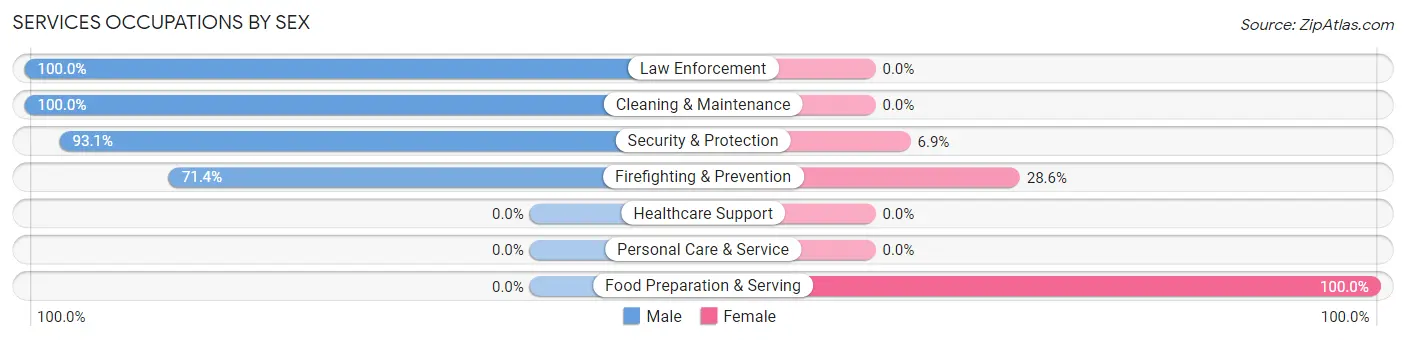
Services Occupations by Sex
Within the Services occupations in Lake Murray of Richland, the most male-oriented occupations are Law Enforcement (100.0%), Cleaning & Maintenance (100.0%), and Security & Protection (93.1%), while the most female-oriented occupations are Food Preparation & Serving (100.0%), Firefighting & Prevention (28.6%), and Security & Protection (6.9%).
| Occupation | Male | Female |
| Healthcare Support | 0 (0.0%) | 0 (0.0%) |
| Security & Protection | 134 (93.1%) | 10 (6.9%) |
| Firefighting & Prevention | 25 (71.4%) | 10 (28.6%) |
| Law Enforcement | 109 (100.0%) | 0 (0.0%) |
| Food Preparation & Serving | 0 (0.0%) | 111 (100.0%) |
| Cleaning & Maintenance | 68 (100.0%) | 0 (0.0%) |
| Personal Care & Service | 0 (0.0%) | 0 (0.0%) |
| Total (Category) | 202 (62.5%) | 121 (37.5%) |
| Total (Overall) | 1,846 (56.5%) | 1,422 (43.5%) |
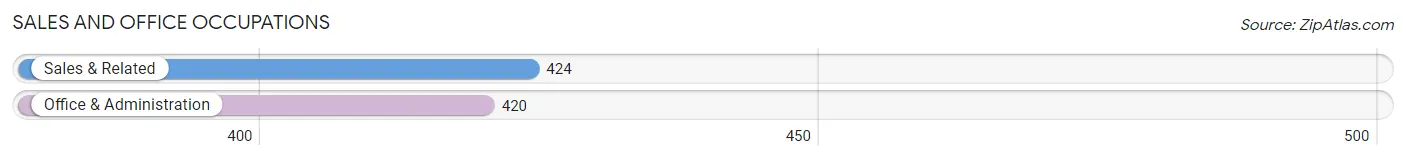
Sales and Office Occupations
The most common Sales and Office occupations in Lake Murray of Richland are Sales & Related (424 | 13.0%), and Office & Administration (420 | 12.9%).
Sales and Office Occupations by Sex
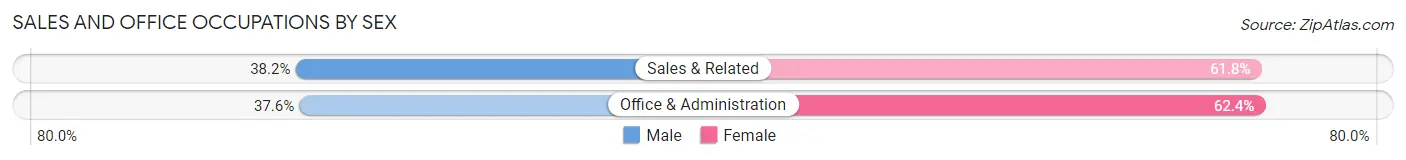
| Occupation | Male | Female |
| Sales & Related | 162 (38.2%) | 262 (61.8%) |
| Office & Administration | 158 (37.6%) | 262 (62.4%) |
| Total (Category) | 320 (37.9%) | 524 (62.1%) |
| Total (Overall) | 1,846 (56.5%) | 1,422 (43.5%) |
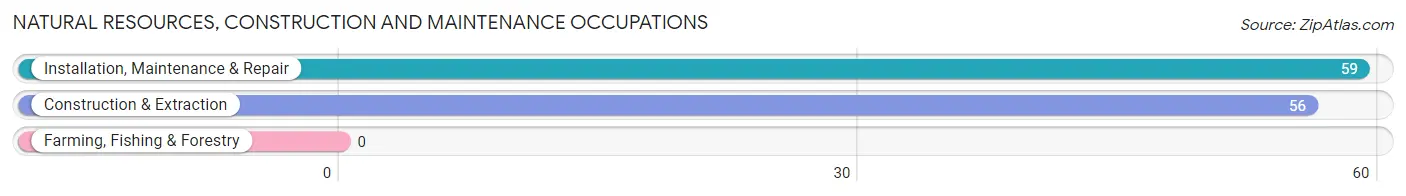
Natural Resources, Construction and Maintenance Occupations
The most common Natural Resources, Construction and Maintenance occupations in Lake Murray of Richland are Installation, Maintenance & Repair (59 | 1.8%), and Construction & Extraction (56 | 1.7%).
Natural Resources, Construction and Maintenance Occupations by Sex
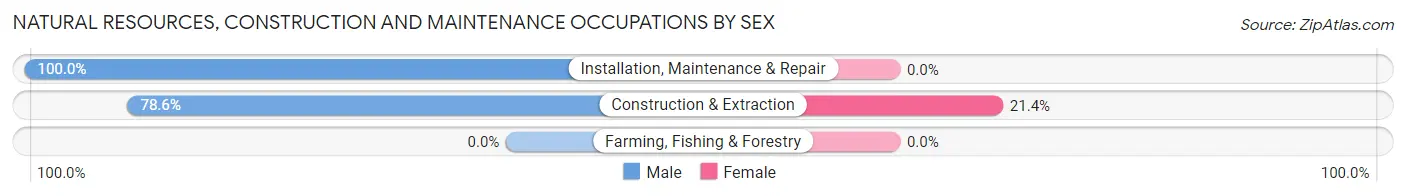
| Occupation | Male | Female |
| Farming, Fishing & Forestry | 0 (0.0%) | 0 (0.0%) |
| Construction & Extraction | 44 (78.6%) | 12 (21.4%) |
| Installation, Maintenance & Repair | 59 (100.0%) | 0 (0.0%) |
| Total (Category) | 103 (89.6%) | 12 (10.4%) |
| Total (Overall) | 1,846 (56.5%) | 1,422 (43.5%) |
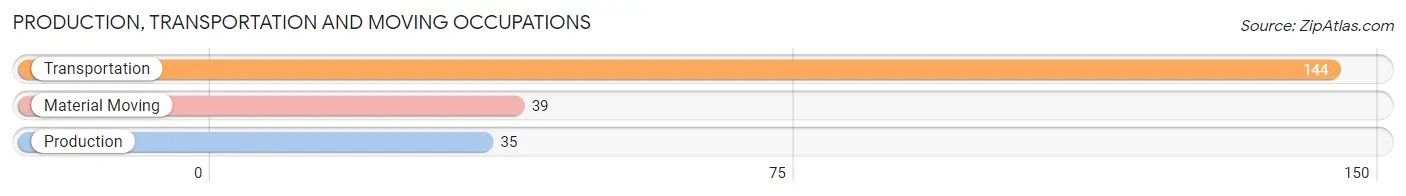
Production, Transportation and Moving Occupations
The most common Production, Transportation and Moving occupations in Lake Murray of Richland are Transportation (144 | 4.4%), Material Moving (39 | 1.2%), and Production (35 | 1.1%).
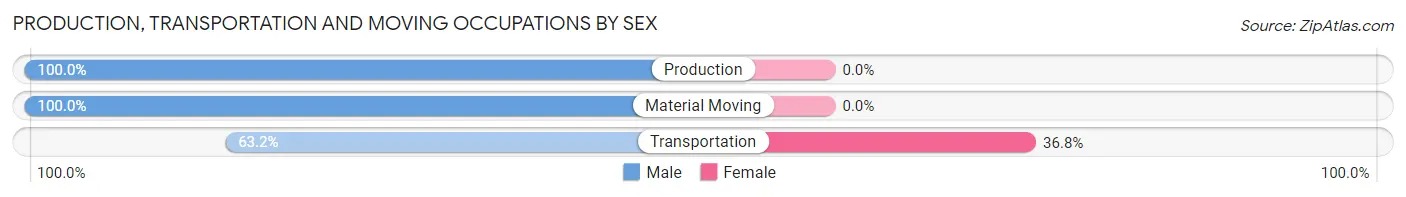
Production, Transportation and Moving Occupations by Sex
| Occupation | Male | Female |
| Production | 35 (100.0%) | 0 (0.0%) |
| Transportation | 91 (63.2%) | 53 (36.8%) |
| Material Moving | 39 (100.0%) | 0 (0.0%) |
| Total (Category) | 165 (75.7%) | 53 (24.3%) |
| Total (Overall) | 1,846 (56.5%) | 1,422 (43.5%) |
Employment Industries by Sex in Lake Murray of Richland
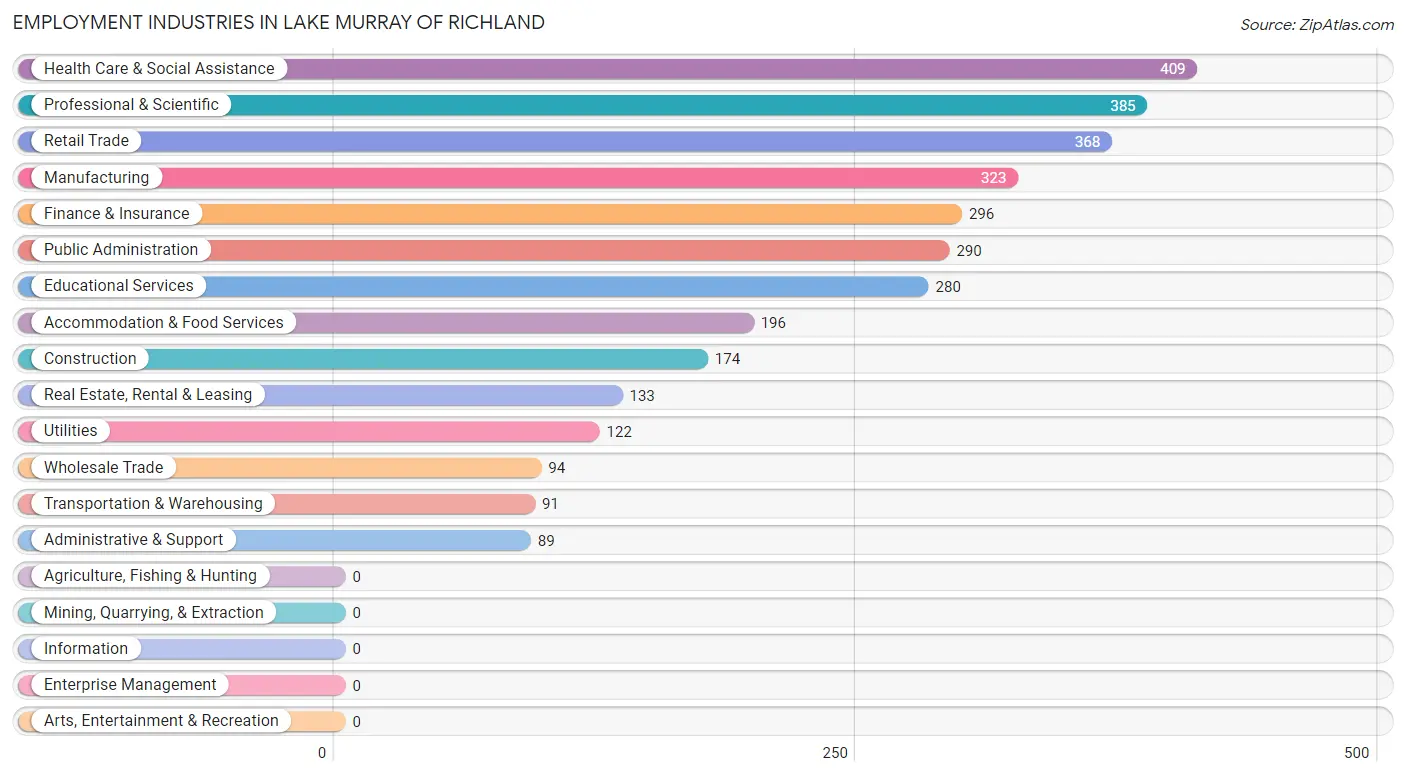
Employment Industries in Lake Murray of Richland
The major employment industries in Lake Murray of Richland include Health Care & Social Assistance (409 | 12.5%), Professional & Scientific (385 | 11.8%), Retail Trade (368 | 11.3%), Manufacturing (323 | 9.9%), and Finance & Insurance (296 | 9.1%).
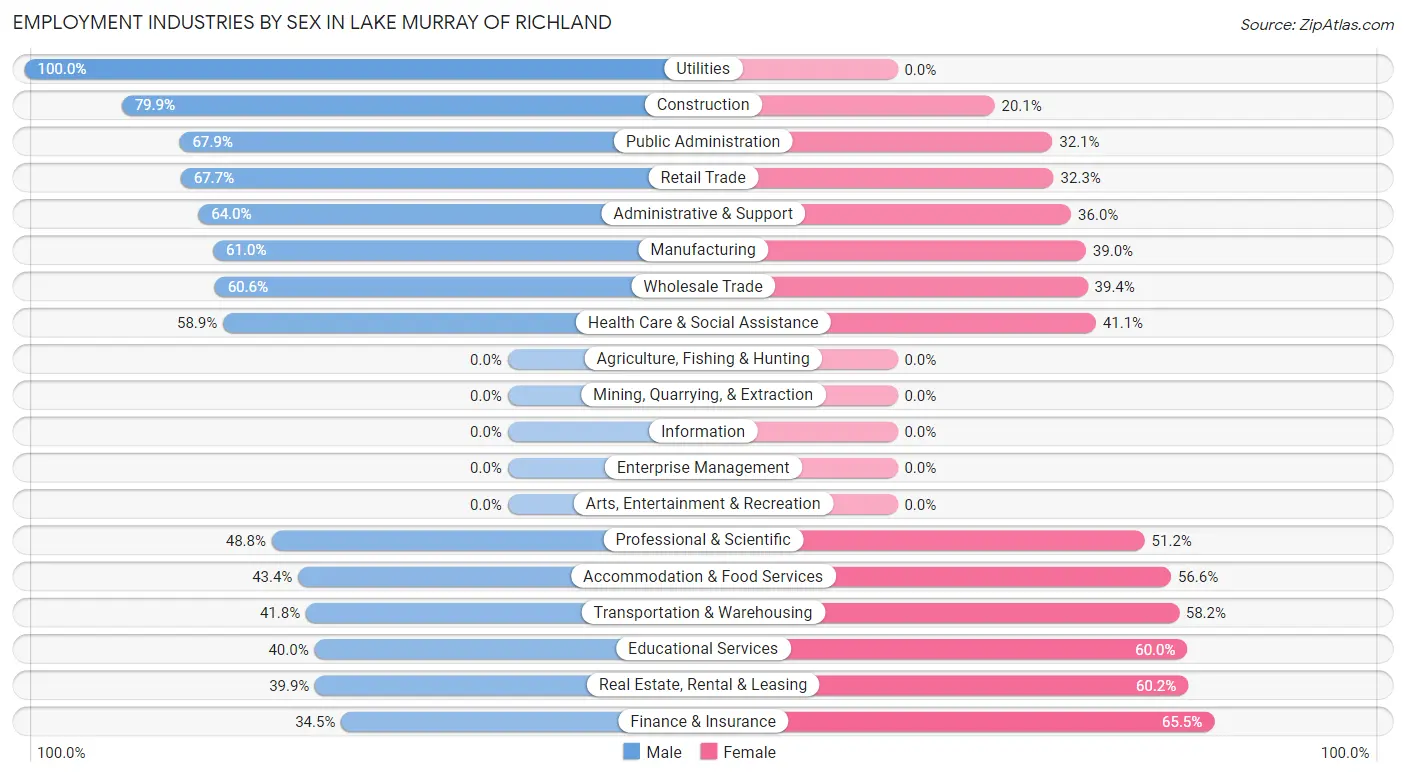
Employment Industries by Sex in Lake Murray of Richland
The Lake Murray of Richland industries that see more men than women are Utilities (100.0%), Construction (79.9%), and Public Administration (67.9%), whereas the industries that tend to have a higher number of women are Finance & Insurance (65.5%), Real Estate, Rental & Leasing (60.2%), and Educational Services (60.0%).
| Industry | Male | Female |
| Agriculture, Fishing & Hunting | 0 (0.0%) | 0 (0.0%) |
| Mining, Quarrying, & Extraction | 0 (0.0%) | 0 (0.0%) |
| Construction | 139 (79.9%) | 35 (20.1%) |
| Manufacturing | 197 (61.0%) | 126 (39.0%) |
| Wholesale Trade | 57 (60.6%) | 37 (39.4%) |
| Retail Trade | 249 (67.7%) | 119 (32.3%) |
| Transportation & Warehousing | 38 (41.8%) | 53 (58.2%) |
| Utilities | 122 (100.0%) | 0 (0.0%) |
| Information | 0 (0.0%) | 0 (0.0%) |
| Finance & Insurance | 102 (34.5%) | 194 (65.5%) |
| Real Estate, Rental & Leasing | 53 (39.9%) | 80 (60.2%) |
| Professional & Scientific | 188 (48.8%) | 197 (51.2%) |
| Enterprise Management | 0 (0.0%) | 0 (0.0%) |
| Administrative & Support | 57 (64.0%) | 32 (36.0%) |
| Educational Services | 112 (40.0%) | 168 (60.0%) |
| Health Care & Social Assistance | 241 (58.9%) | 168 (41.1%) |
| Arts, Entertainment & Recreation | 0 (0.0%) | 0 (0.0%) |
| Accommodation & Food Services | 85 (43.4%) | 111 (56.6%) |
| Public Administration | 197 (67.9%) | 93 (32.1%) |
| Total | 1,846 (56.5%) | 1,422 (43.5%) |
Education in Lake Murray of Richland
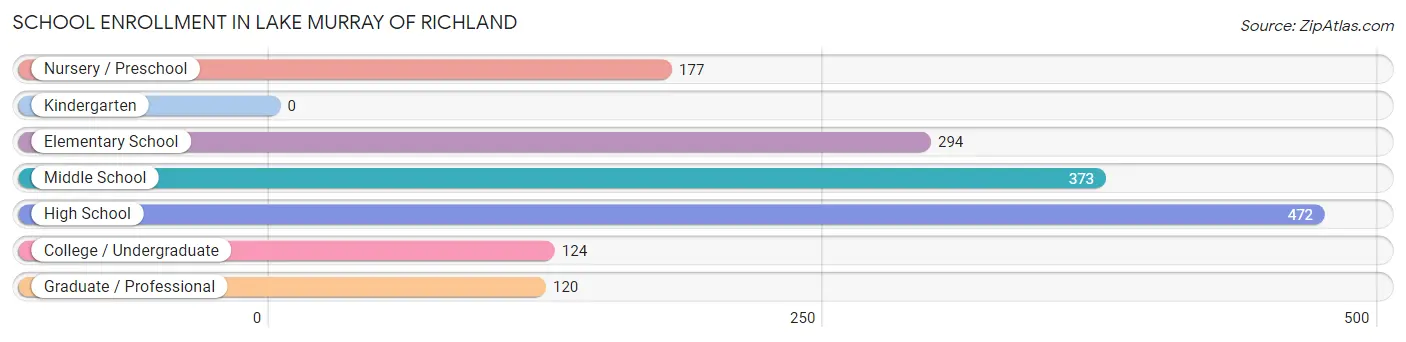
School Enrollment in Lake Murray of Richland
The most common levels of schooling among the 1,560 students in Lake Murray of Richland are high school (472 | 30.3%), middle school (373 | 23.9%), and elementary school (294 | 18.9%).
| School Level | # Students | % Students |
| Nursery / Preschool | 177 | 11.4% |
| Kindergarten | 0 | 0.0% |
| Elementary School | 294 | 18.9% |
| Middle School | 373 | 23.9% |
| High School | 472 | 30.3% |
| College / Undergraduate | 124 | 8.0% |
| Graduate / Professional | 120 | 7.7% |
| Total | 1,560 | 100.0% |
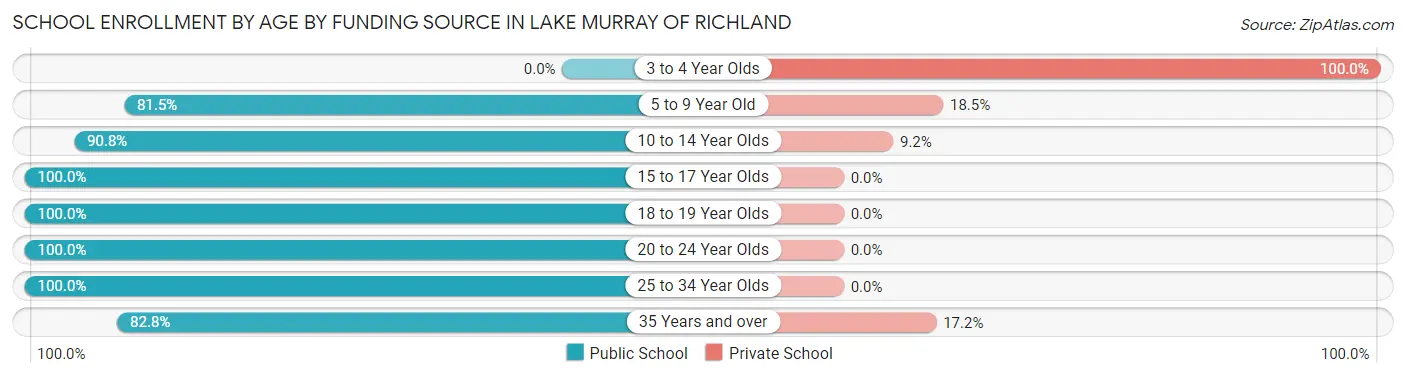
School Enrollment by Age by Funding Source in Lake Murray of Richland
Out of a total of 1,560 students who are enrolled in schools in Lake Murray of Richland, 234 (15.0%) attend a private institution, while the remaining 1,326 (85.0%) are enrolled in public schools. The age group of 3 to 4 year olds has the highest likelihood of being enrolled in private schools, with 109 (100.0% in the age bracket) enrolled. Conversely, the age group of 15 to 17 year olds has the lowest likelihood of being enrolled in a private school, with 243 (100.0% in the age bracket) attending a public institution.
| Age Bracket | Public School | Private School |
| 3 to 4 Year Olds | 0 (0.0%) | 109 (100.0%) |
| 5 to 9 Year Old | 295 (81.5%) | 67 (18.5%) |
| 10 to 14 Year Olds | 375 (90.8%) | 38 (9.2%) |
| 15 to 17 Year Olds | 243 (100.0%) | 0 (0.0%) |
| 18 to 19 Year Olds | 156 (100.0%) | 0 (0.0%) |
| 20 to 24 Year Olds | 81 (100.0%) | 0 (0.0%) |
| 25 to 34 Year Olds | 80 (100.0%) | 0 (0.0%) |
| 35 Years and over | 96 (82.8%) | 20 (17.2%) |
| Total | 1,326 (85.0%) | 234 (15.0%) |
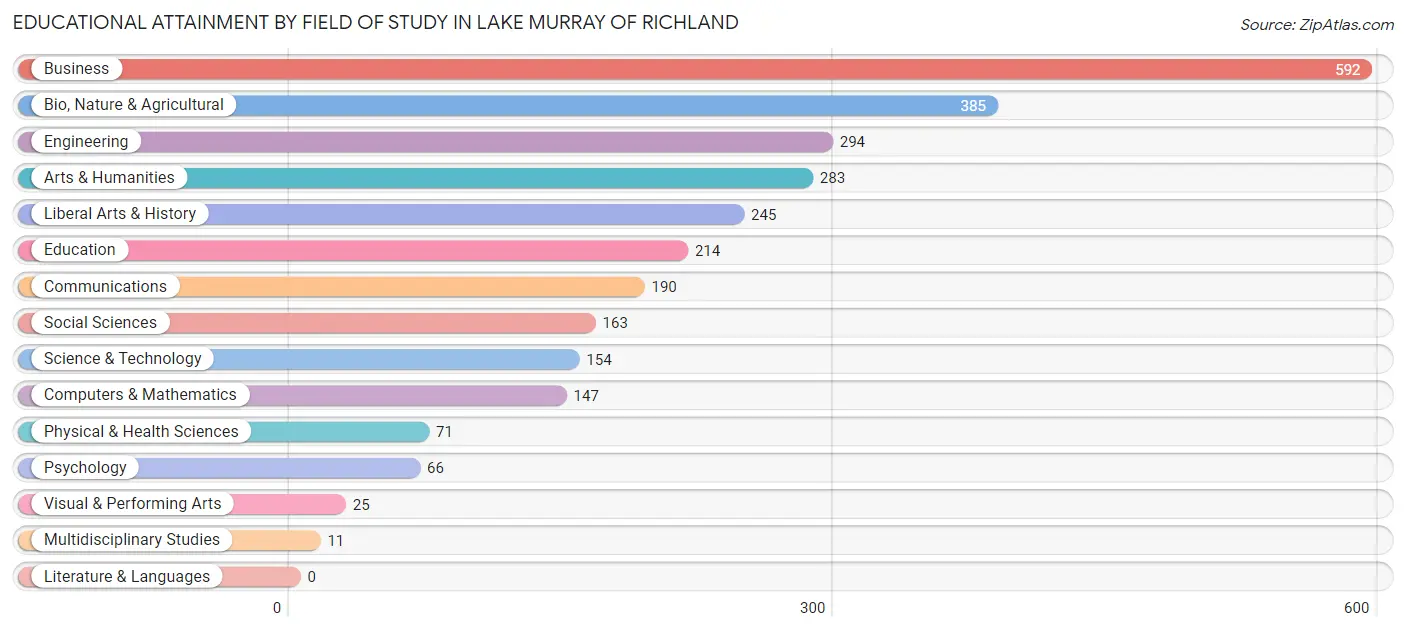
Educational Attainment by Field of Study in Lake Murray of Richland
Business (592 | 20.8%), bio, nature & agricultural (385 | 13.6%), engineering (294 | 10.3%), arts & humanities (283 | 10.0%), and liberal arts & history (245 | 8.6%) are the most common fields of study among 2,840 individuals in Lake Murray of Richland who have obtained a bachelor's degree or higher.
| Field of Study | # Graduates | % Graduates |
| Computers & Mathematics | 147 | 5.2% |
| Bio, Nature & Agricultural | 385 | 13.6% |
| Physical & Health Sciences | 71 | 2.5% |
| Psychology | 66 | 2.3% |
| Social Sciences | 163 | 5.7% |
| Engineering | 294 | 10.3% |
| Multidisciplinary Studies | 11 | 0.4% |
| Science & Technology | 154 | 5.4% |
| Business | 592 | 20.8% |
| Education | 214 | 7.5% |
| Literature & Languages | 0 | 0.0% |
| Liberal Arts & History | 245 | 8.6% |
| Visual & Performing Arts | 25 | 0.9% |
| Communications | 190 | 6.7% |
| Arts & Humanities | 283 | 10.0% |
| Total | 2,840 | 100.0% |
Transportation & Commute in Lake Murray of Richland
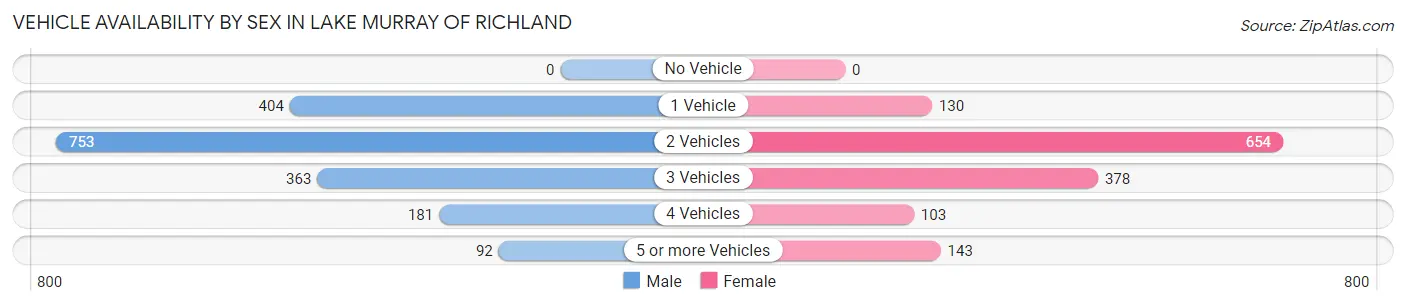
Vehicle Availability by Sex in Lake Murray of Richland
The most prevalent vehicle ownership categories in Lake Murray of Richland are males with 2 vehicles (753, accounting for 42.0%) and females with 2 vehicles (654, making up 53.5%).
| Vehicles Available | Male | Female |
| No Vehicle | 0 (0.0%) | 0 (0.0%) |
| 1 Vehicle | 404 (22.5%) | 130 (9.2%) |
| 2 Vehicles | 753 (42.0%) | 654 (46.5%) |
| 3 Vehicles | 363 (20.3%) | 378 (26.9%) |
| 4 Vehicles | 181 (10.1%) | 103 (7.3%) |
| 5 or more Vehicles | 92 (5.1%) | 143 (10.2%) |
| Total | 1,793 (100.0%) | 1,408 (100.0%) |
Commute Time in Lake Murray of Richland
The most frequently occuring commute durations in Lake Murray of Richland are 30 to 34 minutes (861 commuters, 29.9%), 20 to 24 minutes (482 commuters, 16.8%), and 45 to 59 minutes (391 commuters, 13.6%).
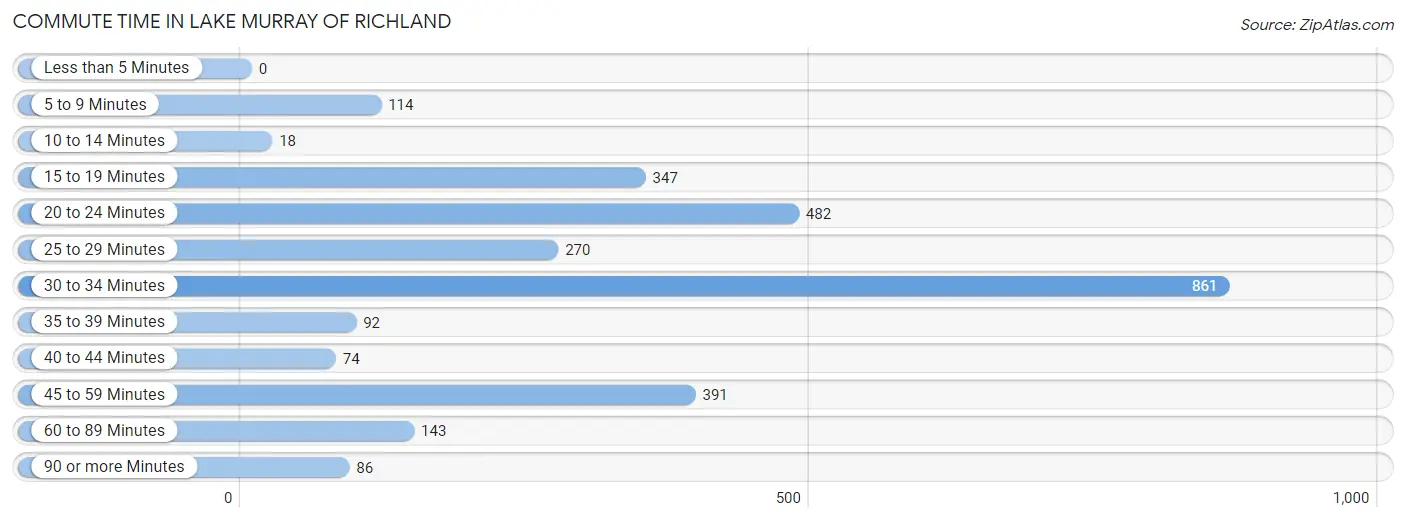
| Commute Time | # Commuters | % Commuters |
| Less than 5 Minutes | 0 | 0.0% |
| 5 to 9 Minutes | 114 | 4.0% |
| 10 to 14 Minutes | 18 | 0.6% |
| 15 to 19 Minutes | 347 | 12.1% |
| 20 to 24 Minutes | 482 | 16.8% |
| 25 to 29 Minutes | 270 | 9.4% |
| 30 to 34 Minutes | 861 | 29.9% |
| 35 to 39 Minutes | 92 | 3.2% |
| 40 to 44 Minutes | 74 | 2.6% |
| 45 to 59 Minutes | 391 | 13.6% |
| 60 to 89 Minutes | 143 | 5.0% |
| 90 or more Minutes | 86 | 3.0% |
Commute Time by Sex in Lake Murray of Richland
The most common commute times in Lake Murray of Richland are 20 to 24 minutes (386 commuters, 24.6%) for males and 30 to 34 minutes (490 commuters, 37.3%) for females.
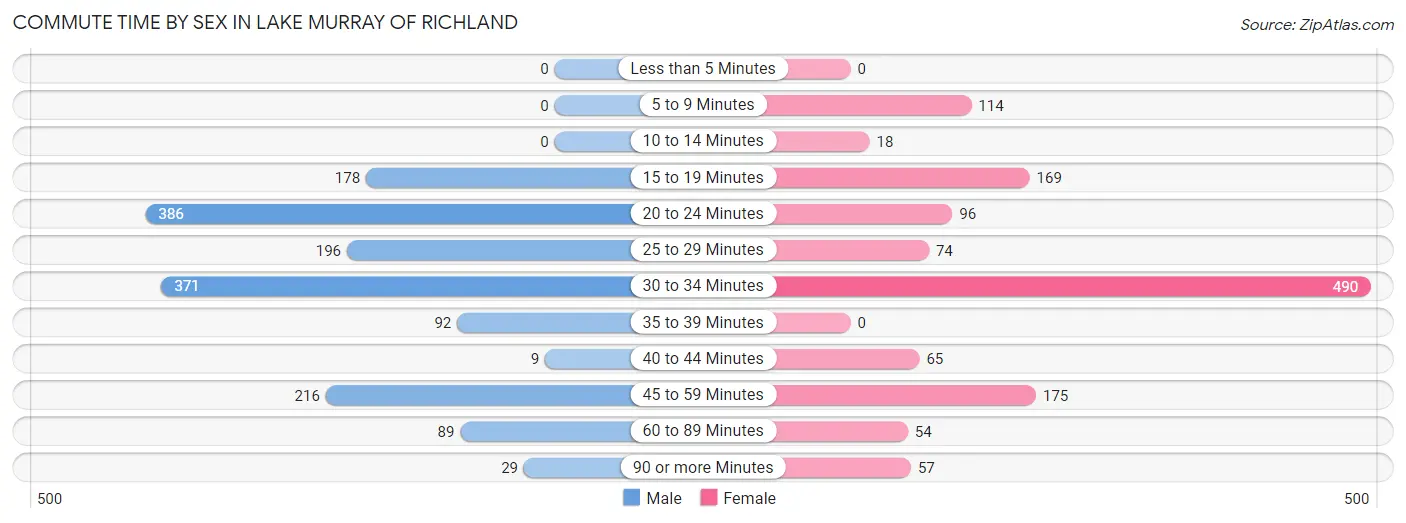
| Commute Time | Male | Female |
| Less than 5 Minutes | 0 (0.0%) | 0 (0.0%) |
| 5 to 9 Minutes | 0 (0.0%) | 114 (8.7%) |
| 10 to 14 Minutes | 0 (0.0%) | 18 (1.4%) |
| 15 to 19 Minutes | 178 (11.4%) | 169 (12.9%) |
| 20 to 24 Minutes | 386 (24.6%) | 96 (7.3%) |
| 25 to 29 Minutes | 196 (12.5%) | 74 (5.6%) |
| 30 to 34 Minutes | 371 (23.7%) | 490 (37.3%) |
| 35 to 39 Minutes | 92 (5.9%) | 0 (0.0%) |
| 40 to 44 Minutes | 9 (0.6%) | 65 (5.0%) |
| 45 to 59 Minutes | 216 (13.8%) | 175 (13.3%) |
| 60 to 89 Minutes | 89 (5.7%) | 54 (4.1%) |
| 90 or more Minutes | 29 (1.8%) | 57 (4.3%) |
Time of Departure to Work by Sex in Lake Murray of Richland
The most frequent times of departure to work in Lake Murray of Richland are 7:30 AM to 7:59 AM (363, 23.2%) for males and 7:00 AM to 7:29 AM (491, 37.4%) for females.
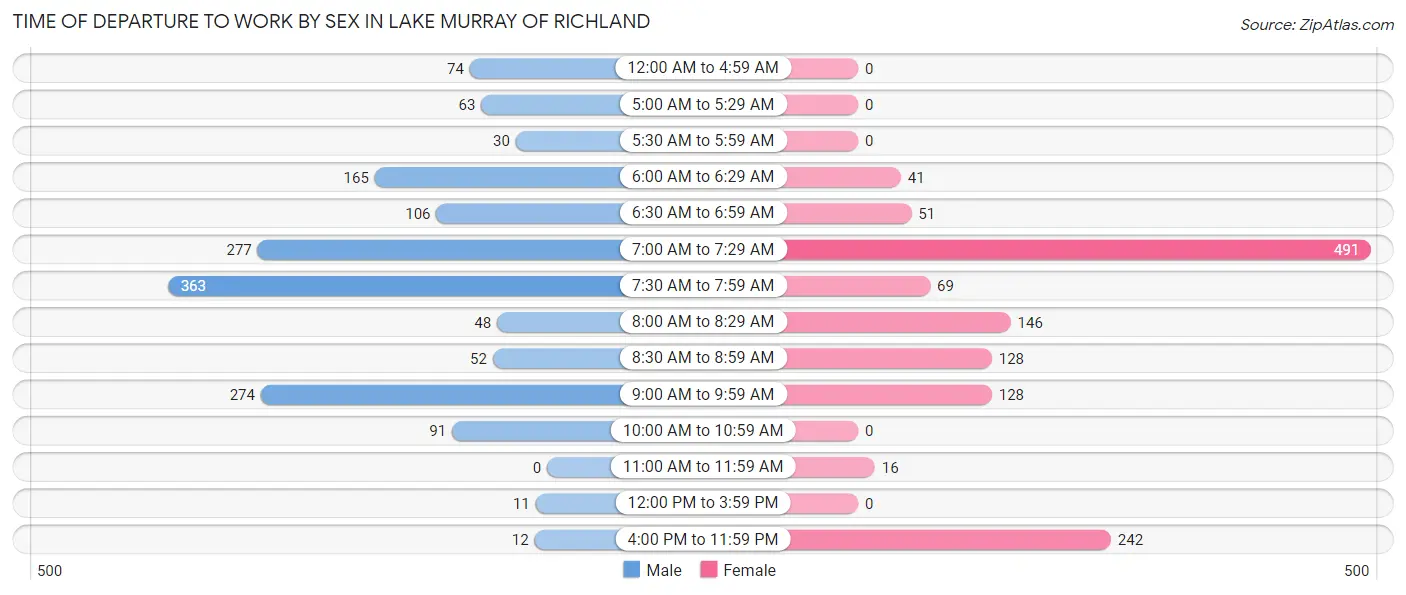
| Time of Departure | Male | Female |
| 12:00 AM to 4:59 AM | 74 (4.7%) | 0 (0.0%) |
| 5:00 AM to 5:29 AM | 63 (4.0%) | 0 (0.0%) |
| 5:30 AM to 5:59 AM | 30 (1.9%) | 0 (0.0%) |
| 6:00 AM to 6:29 AM | 165 (10.5%) | 41 (3.1%) |
| 6:30 AM to 6:59 AM | 106 (6.8%) | 51 (3.9%) |
| 7:00 AM to 7:29 AM | 277 (17.7%) | 491 (37.4%) |
| 7:30 AM to 7:59 AM | 363 (23.2%) | 69 (5.3%) |
| 8:00 AM to 8:29 AM | 48 (3.1%) | 146 (11.1%) |
| 8:30 AM to 8:59 AM | 52 (3.3%) | 128 (9.8%) |
| 9:00 AM to 9:59 AM | 274 (17.5%) | 128 (9.8%) |
| 10:00 AM to 10:59 AM | 91 (5.8%) | 0 (0.0%) |
| 11:00 AM to 11:59 AM | 0 (0.0%) | 16 (1.2%) |
| 12:00 PM to 3:59 PM | 11 (0.7%) | 0 (0.0%) |
| 4:00 PM to 11:59 PM | 12 (0.8%) | 242 (18.4%) |
| Total | 1,566 (100.0%) | 1,312 (100.0%) |
Housing Occupancy in Lake Murray of Richland
Occupancy by Ownership in Lake Murray of Richland
Of the total 2,866 dwellings in Lake Murray of Richland, owner-occupied units account for 2,399 (83.7%), while renter-occupied units make up 467 (16.3%).
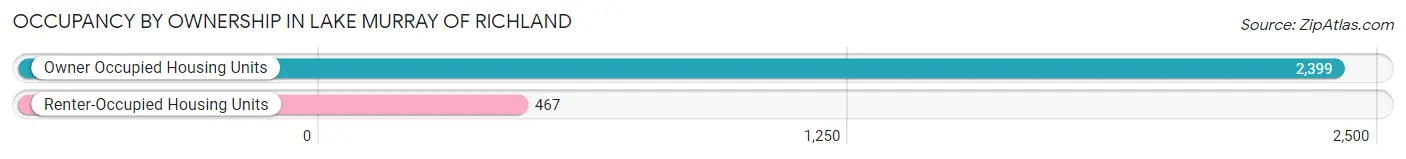
| Occupancy | # Housing Units | % Housing Units |
| Owner Occupied Housing Units | 2,399 | 83.7% |
| Renter-Occupied Housing Units | 467 | 16.3% |
| Total Occupied Housing Units | 2,866 | 100.0% |
Occupancy by Household Size in Lake Murray of Richland
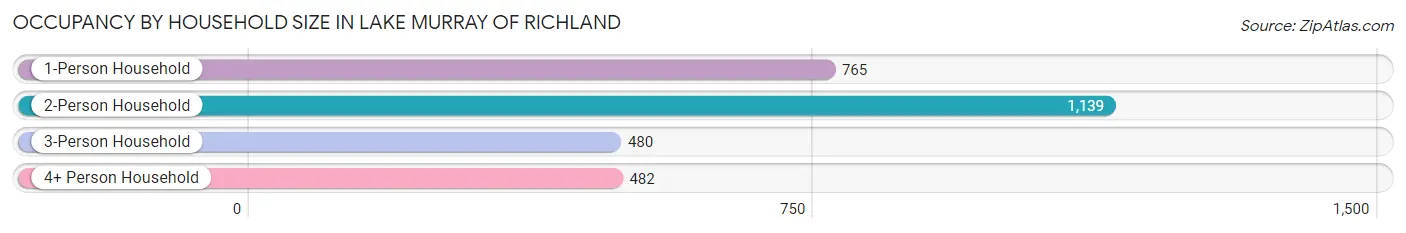
| Household Size | # Housing Units | % Housing Units |
| 1-Person Household | 765 | 26.7% |
| 2-Person Household | 1,139 | 39.7% |
| 3-Person Household | 480 | 16.8% |
| 4+ Person Household | 482 | 16.8% |
| Total Housing Units | 2,866 | 100.0% |
Occupancy by Ownership by Household Size in Lake Murray of Richland
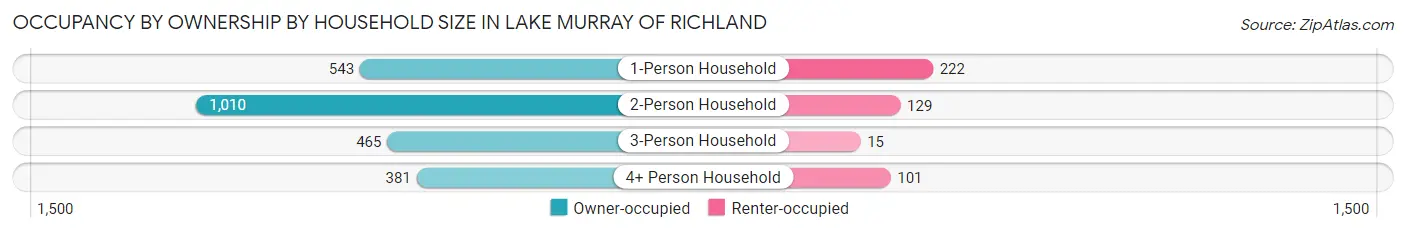
| Household Size | Owner-occupied | Renter-occupied |
| 1-Person Household | 543 (71.0%) | 222 (29.0%) |
| 2-Person Household | 1,010 (88.7%) | 129 (11.3%) |
| 3-Person Household | 465 (96.9%) | 15 (3.1%) |
| 4+ Person Household | 381 (79.0%) | 101 (20.9%) |
| Total Housing Units | 2,399 (83.7%) | 467 (16.3%) |
Occupancy by Educational Attainment in Lake Murray of Richland
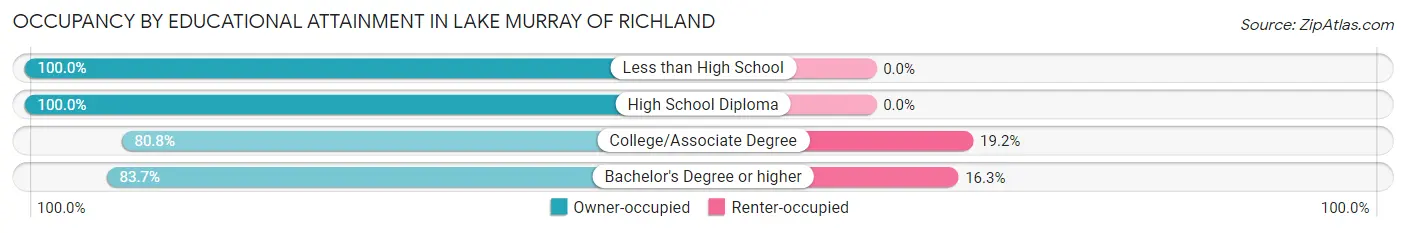
| Household Size | Owner-occupied | Renter-occupied |
| Less than High School | 14 (100.0%) | 0 (0.0%) |
| High School Diploma | 176 (100.0%) | 0 (0.0%) |
| College/Associate Degree | 861 (80.8%) | 205 (19.2%) |
| Bachelor's Degree or higher | 1,348 (83.7%) | 262 (16.3%) |
Occupancy by Age of Householder in Lake Murray of Richland
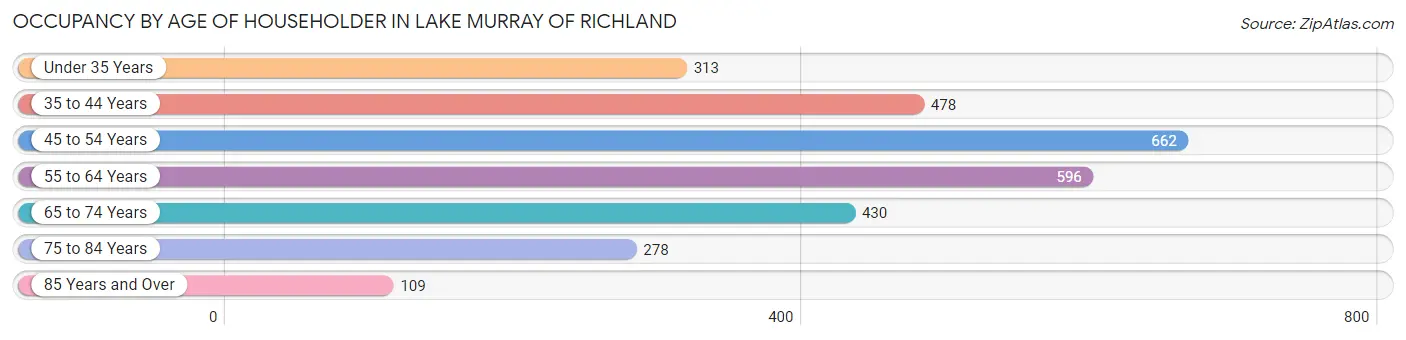
| Age Bracket | # Households | % Households |
| Under 35 Years | 313 | 10.9% |
| 35 to 44 Years | 478 | 16.7% |
| 45 to 54 Years | 662 | 23.1% |
| 55 to 64 Years | 596 | 20.8% |
| 65 to 74 Years | 430 | 15.0% |
| 75 to 84 Years | 278 | 9.7% |
| 85 Years and Over | 109 | 3.8% |
| Total | 2,866 | 100.0% |
Housing Finances in Lake Murray of Richland
Median Income by Occupancy in Lake Murray of Richland
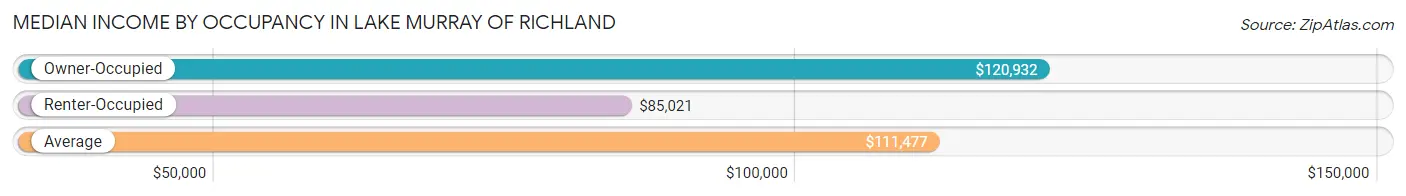
| Occupancy Type | # Households | Median Income |
| Owner-Occupied | 2,399 (83.7%) | $120,932 |
| Renter-Occupied | 467 (16.3%) | $85,021 |
| Average | 2,866 (100.0%) | $111,477 |
Occupancy by Householder Income Bracket in Lake Murray of Richland
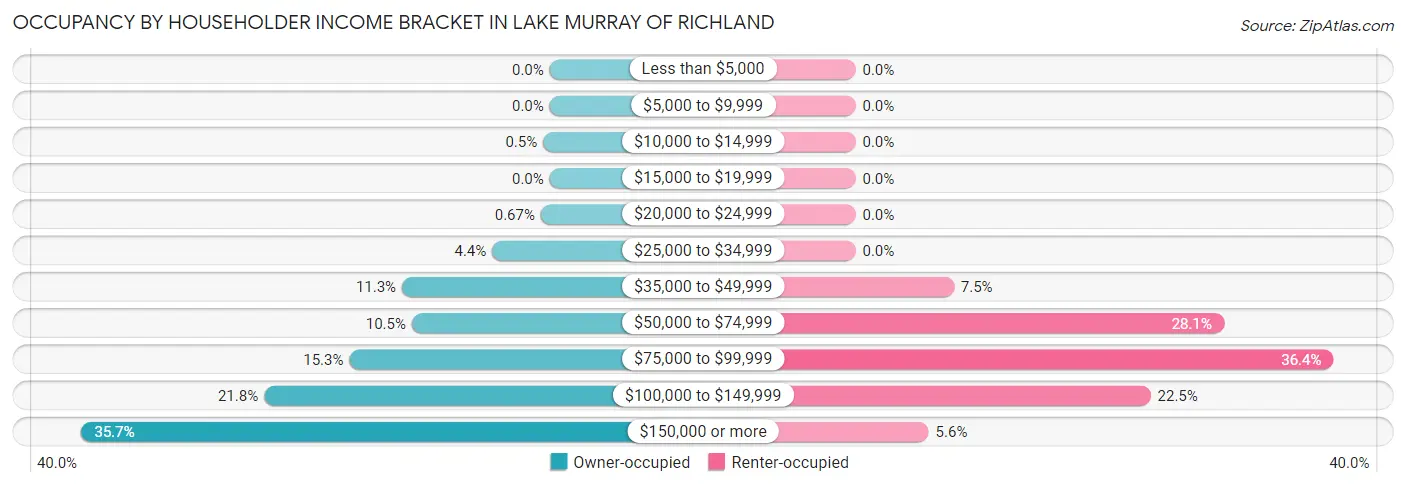
| Income Bracket | Owner-occupied | Renter-occupied |
| Less than $5,000 | 0 (0.0%) | 0 (0.0%) |
| $5,000 to $9,999 | 0 (0.0%) | 0 (0.0%) |
| $10,000 to $14,999 | 12 (0.5%) | 0 (0.0%) |
| $15,000 to $19,999 | 0 (0.0%) | 0 (0.0%) |
| $20,000 to $24,999 | 16 (0.7%) | 0 (0.0%) |
| $25,000 to $34,999 | 105 (4.4%) | 0 (0.0%) |
| $35,000 to $49,999 | 270 (11.3%) | 35 (7.5%) |
| $50,000 to $74,999 | 252 (10.5%) | 131 (28.1%) |
| $75,000 to $99,999 | 366 (15.3%) | 170 (36.4%) |
| $100,000 to $149,999 | 522 (21.8%) | 105 (22.5%) |
| $150,000 or more | 856 (35.7%) | 26 (5.6%) |
| Total | 2,399 (100.0%) | 467 (100.0%) |
Monthly Housing Cost Tiers in Lake Murray of Richland
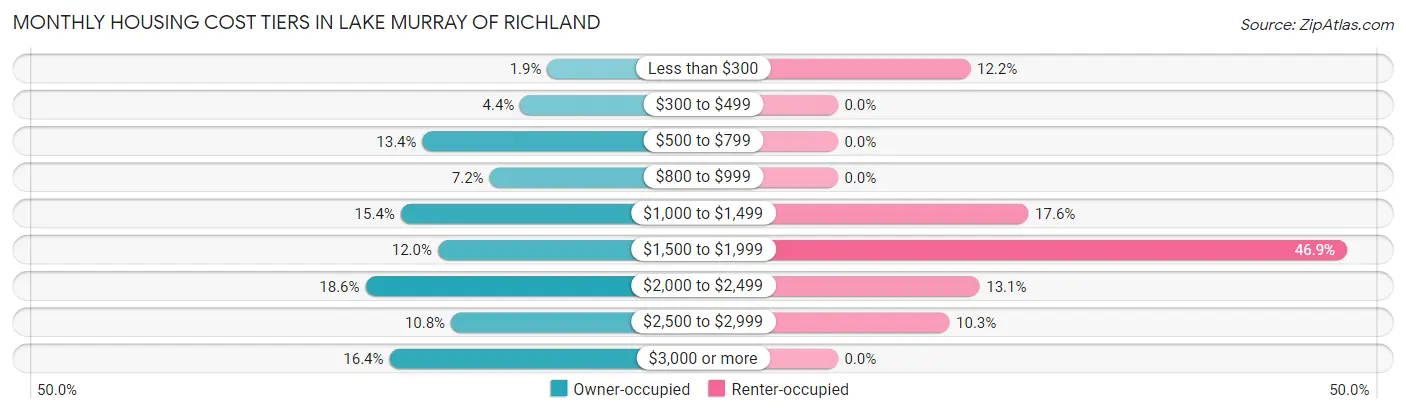
| Monthly Cost | Owner-occupied | Renter-occupied |
| Less than $300 | 45 (1.9%) | 57 (12.2%) |
| $300 to $499 | 105 (4.4%) | 0 (0.0%) |
| $500 to $799 | 321 (13.4%) | 0 (0.0%) |
| $800 to $999 | 173 (7.2%) | 0 (0.0%) |
| $1,000 to $1,499 | 369 (15.4%) | 82 (17.6%) |
| $1,500 to $1,999 | 287 (12.0%) | 219 (46.9%) |
| $2,000 to $2,499 | 447 (18.6%) | 61 (13.1%) |
| $2,500 to $2,999 | 258 (10.7%) | 48 (10.3%) |
| $3,000 or more | 394 (16.4%) | 0 (0.0%) |
| Total | 2,399 (100.0%) | 467 (100.0%) |
Physical Housing Characteristics in Lake Murray of Richland
Housing Structures in Lake Murray of Richland
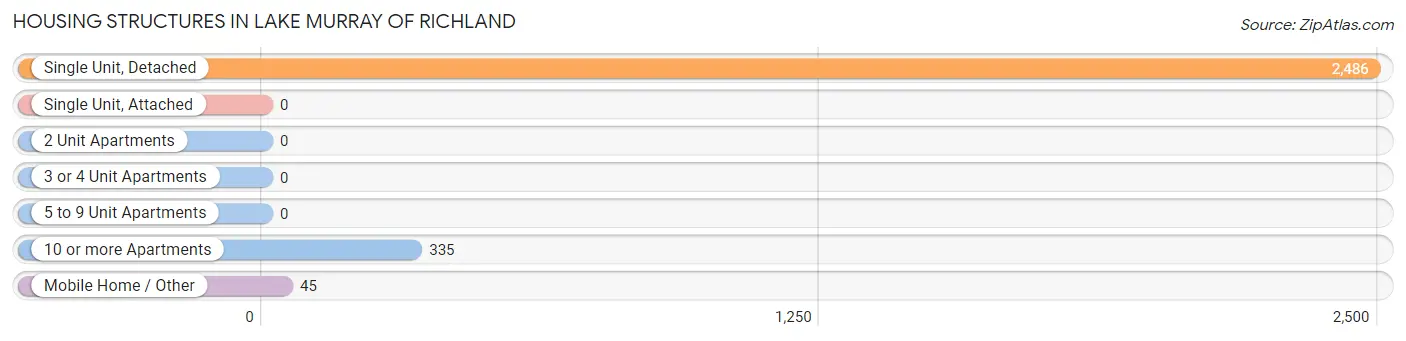
| Structure Type | # Housing Units | % Housing Units |
| Single Unit, Detached | 2,486 | 86.7% |
| Single Unit, Attached | 0 | 0.0% |
| 2 Unit Apartments | 0 | 0.0% |
| 3 or 4 Unit Apartments | 0 | 0.0% |
| 5 to 9 Unit Apartments | 0 | 0.0% |
| 10 or more Apartments | 335 | 11.7% |
| Mobile Home / Other | 45 | 1.6% |
| Total | 2,866 | 100.0% |
Housing Structures by Occupancy in Lake Murray of Richland
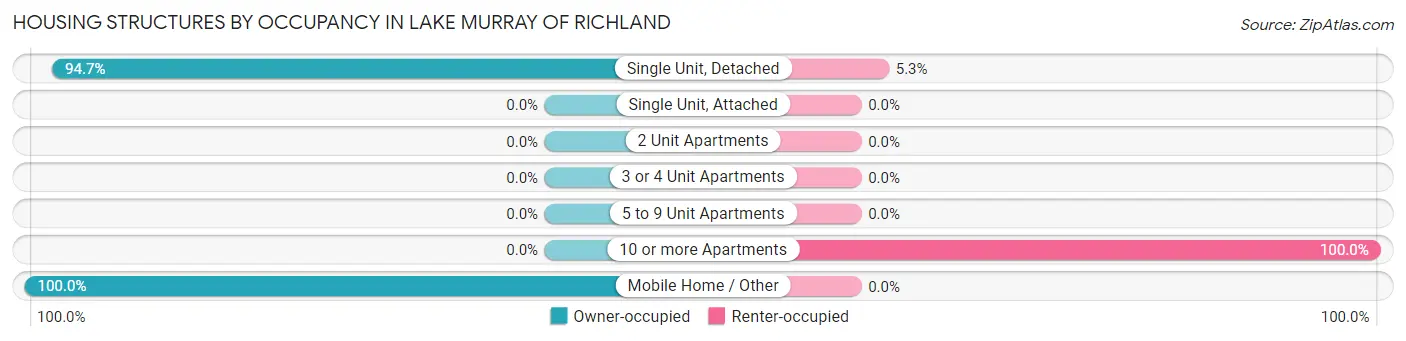
| Structure Type | Owner-occupied | Renter-occupied |
| Single Unit, Detached | 2,354 (94.7%) | 132 (5.3%) |
| Single Unit, Attached | 0 (0.0%) | 0 (0.0%) |
| 2 Unit Apartments | 0 (0.0%) | 0 (0.0%) |
| 3 or 4 Unit Apartments | 0 (0.0%) | 0 (0.0%) |
| 5 to 9 Unit Apartments | 0 (0.0%) | 0 (0.0%) |
| 10 or more Apartments | 0 (0.0%) | 335 (100.0%) |
| Mobile Home / Other | 45 (100.0%) | 0 (0.0%) |
| Total | 2,399 (83.7%) | 467 (16.3%) |
Housing Structures by Number of Rooms in Lake Murray of Richland
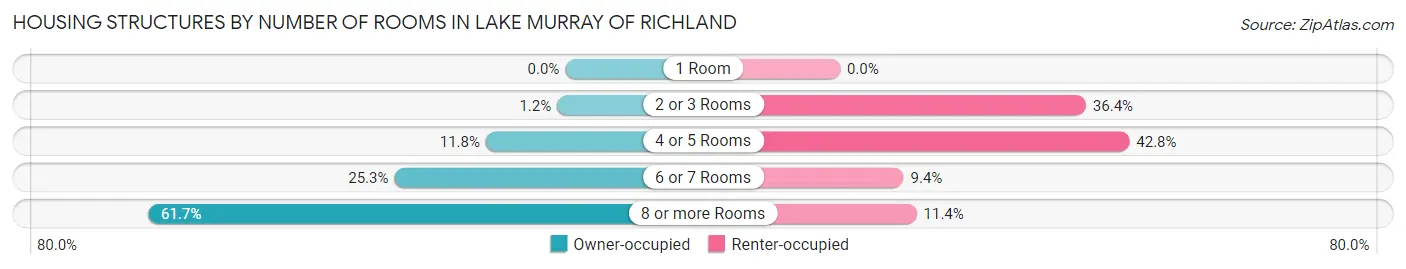
| Number of Rooms | Owner-occupied | Renter-occupied |
| 1 Room | 0 (0.0%) | 0 (0.0%) |
| 2 or 3 Rooms | 29 (1.2%) | 170 (36.4%) |
| 4 or 5 Rooms | 282 (11.7%) | 200 (42.8%) |
| 6 or 7 Rooms | 607 (25.3%) | 44 (9.4%) |
| 8 or more Rooms | 1,481 (61.7%) | 53 (11.4%) |
| Total | 2,399 (100.0%) | 467 (100.0%) |
Housing Structure by Heating Type in Lake Murray of Richland
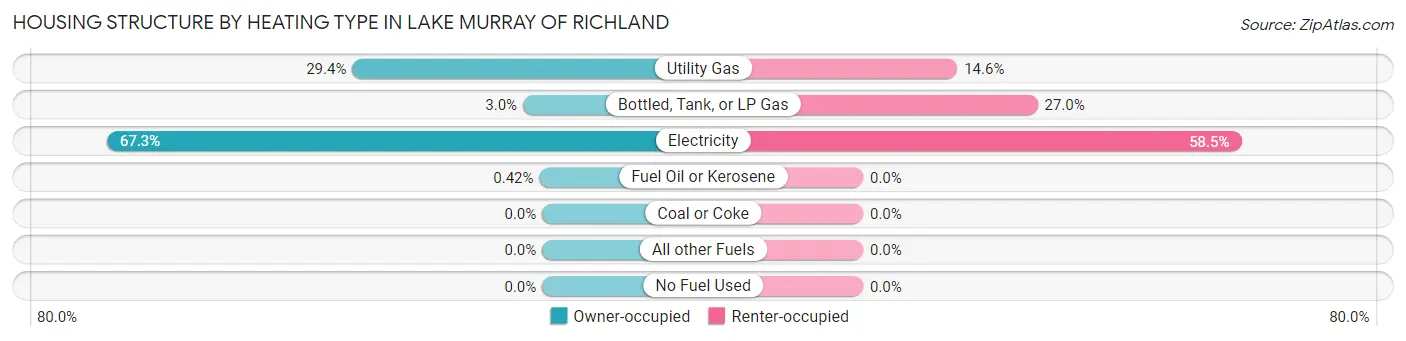
| Heating Type | Owner-occupied | Renter-occupied |
| Utility Gas | 704 (29.3%) | 68 (14.6%) |
| Bottled, Tank, or LP Gas | 71 (3.0%) | 126 (27.0%) |
| Electricity | 1,614 (67.3%) | 273 (58.5%) |
| Fuel Oil or Kerosene | 10 (0.4%) | 0 (0.0%) |
| Coal or Coke | 0 (0.0%) | 0 (0.0%) |
| All other Fuels | 0 (0.0%) | 0 (0.0%) |
| No Fuel Used | 0 (0.0%) | 0 (0.0%) |
| Total | 2,399 (100.0%) | 467 (100.0%) |
Household Vehicle Usage in Lake Murray of Richland
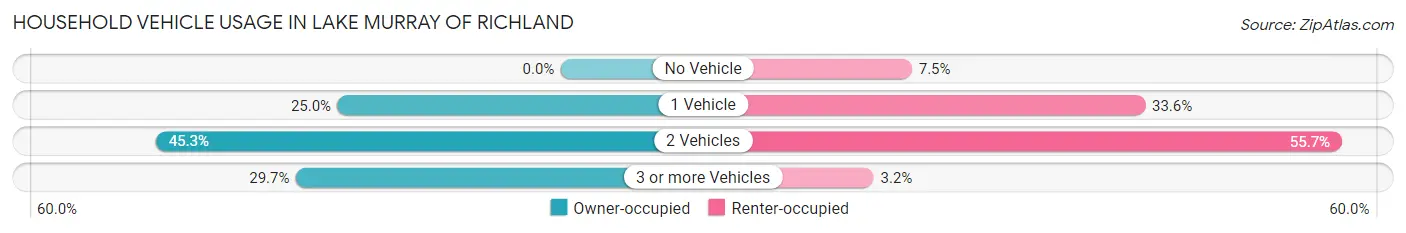
| Vehicles per Household | Owner-occupied | Renter-occupied |
| No Vehicle | 0 (0.0%) | 35 (7.5%) |
| 1 Vehicle | 600 (25.0%) | 157 (33.6%) |
| 2 Vehicles | 1,087 (45.3%) | 260 (55.7%) |
| 3 or more Vehicles | 712 (29.7%) | 15 (3.2%) |
| Total | 2,399 (100.0%) | 467 (100.0%) |
Real Estate & Mortgages in Lake Murray of Richland
Real Estate and Mortgage Overview in Lake Murray of Richland
| Characteristic | Without Mortgage | With Mortgage |
| Housing Units | 678 | 1,721 |
| Median Property Value | $379,300 | $385,300 |
| Median Household Income | $120,000 | $635 |
| Monthly Housing Costs | $673 | $394 |
| Real Estate Taxes | $2,349 | $4 |
Property Value by Mortgage Status in Lake Murray of Richland
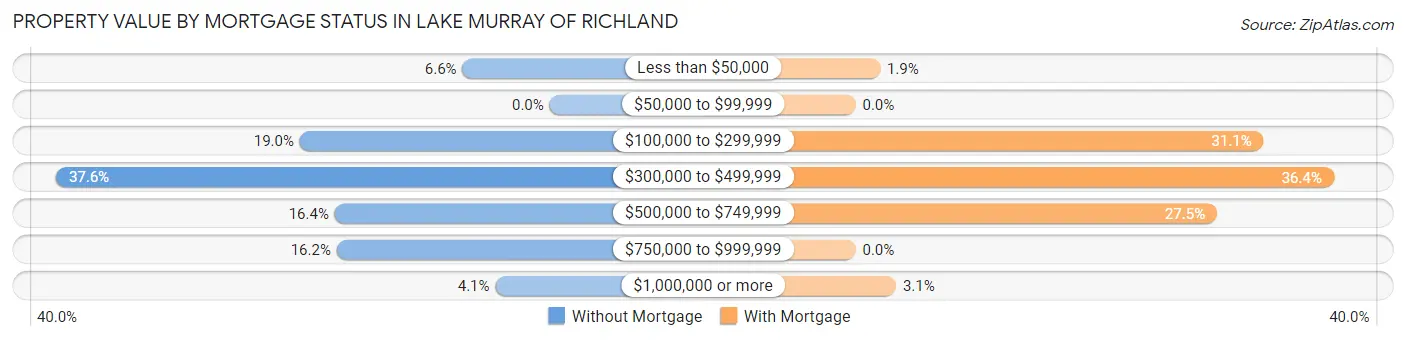
| Property Value | Without Mortgage | With Mortgage |
| Less than $50,000 | 45 (6.6%) | 32 (1.9%) |
| $50,000 to $99,999 | 0 (0.0%) | 0 (0.0%) |
| $100,000 to $299,999 | 129 (19.0%) | 535 (31.1%) |
| $300,000 to $499,999 | 255 (37.6%) | 627 (36.4%) |
| $500,000 to $749,999 | 111 (16.4%) | 474 (27.5%) |
| $750,000 to $999,999 | 110 (16.2%) | 0 (0.0%) |
| $1,000,000 or more | 28 (4.1%) | 53 (3.1%) |
| Total | 678 (100.0%) | 1,721 (100.0%) |
Household Income by Mortgage Status in Lake Murray of Richland
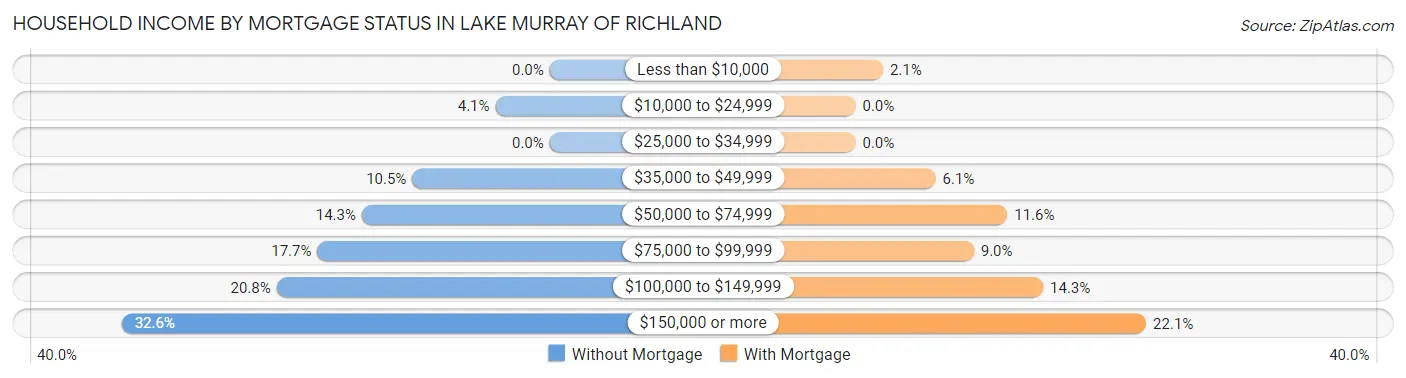
| Household Income | Without Mortgage | With Mortgage |
| Less than $10,000 | 0 (0.0%) | 36 (2.1%) |
| $10,000 to $24,999 | 28 (4.1%) | 0 (0.0%) |
| $25,000 to $34,999 | 0 (0.0%) | 0 (0.0%) |
| $35,000 to $49,999 | 71 (10.5%) | 105 (6.1%) |
| $50,000 to $74,999 | 97 (14.3%) | 199 (11.6%) |
| $75,000 to $99,999 | 120 (17.7%) | 155 (9.0%) |
| $100,000 to $149,999 | 141 (20.8%) | 246 (14.3%) |
| $150,000 or more | 221 (32.6%) | 381 (22.1%) |
| Total | 678 (100.0%) | 1,721 (100.0%) |
Property Value to Household Income Ratio in Lake Murray of Richland
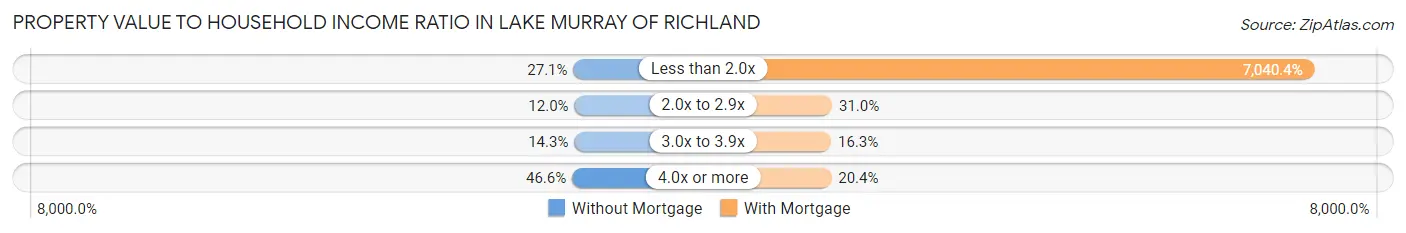
| Value-to-Income Ratio | Without Mortgage | With Mortgage |
| Less than 2.0x | 184 (27.1%) | 121,165 (7,040.4%) |
| 2.0x to 2.9x | 81 (11.9%) | 534 (31.0%) |
| 3.0x to 3.9x | 97 (14.3%) | 280 (16.3%) |
| 4.0x or more | 316 (46.6%) | 351 (20.4%) |
| Total | 678 (100.0%) | 1,721 (100.0%) |
Real Estate Taxes by Mortgage Status in Lake Murray of Richland
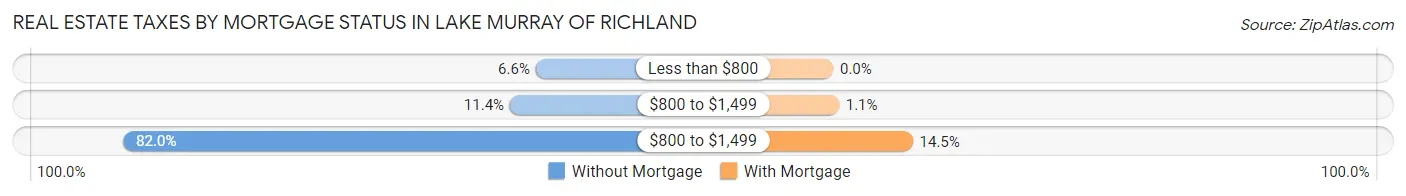
| Property Taxes | Without Mortgage | With Mortgage |
| Less than $800 | 45 (6.6%) | 0 (0.0%) |
| $800 to $1,499 | 77 (11.4%) | 18 (1.1%) |
| $800 to $1,499 | 556 (82.0%) | 250 (14.5%) |
| Total | 678 (100.0%) | 1,721 (100.0%) |
Health & Disability in Lake Murray of Richland
Health Insurance Coverage by Age in Lake Murray of Richland
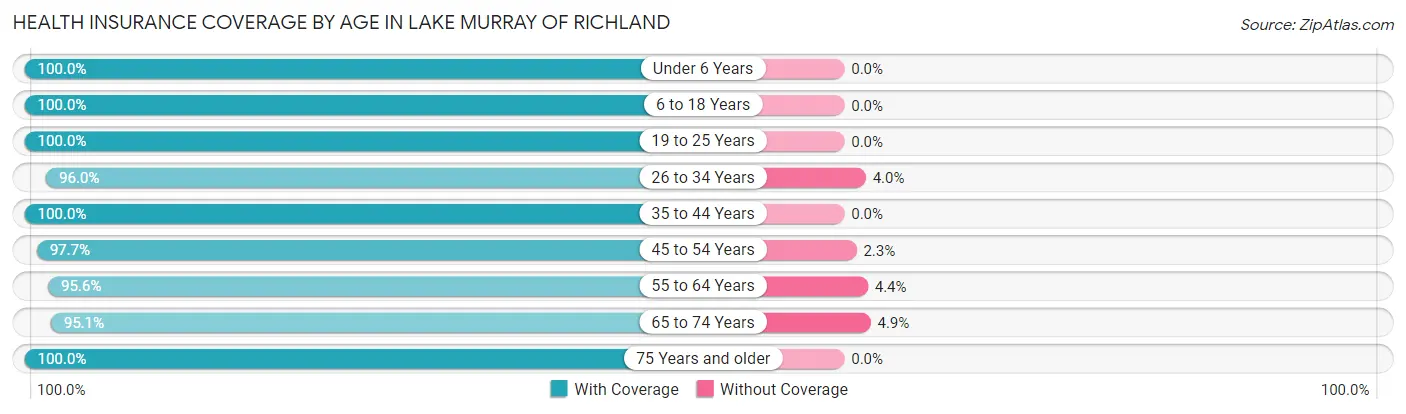
| Age Bracket | With Coverage | Without Coverage |
| Under 6 Years | 478 (100.0%) | 0 (0.0%) |
| 6 to 18 Years | 1,106 (100.0%) | 0 (0.0%) |
| 19 to 25 Years | 210 (100.0%) | 0 (0.0%) |
| 26 to 34 Years | 384 (96.0%) | 16 (4.0%) |
| 35 to 44 Years | 994 (100.0%) | 0 (0.0%) |
| 45 to 54 Years | 1,204 (97.7%) | 28 (2.3%) |
| 55 to 64 Years | 829 (95.6%) | 38 (4.4%) |
| 65 to 74 Years | 778 (95.1%) | 40 (4.9%) |
| 75 Years and older | 633 (100.0%) | 0 (0.0%) |
| Total | 6,616 (98.2%) | 122 (1.8%) |
Health Insurance Coverage by Citizenship Status in Lake Murray of Richland
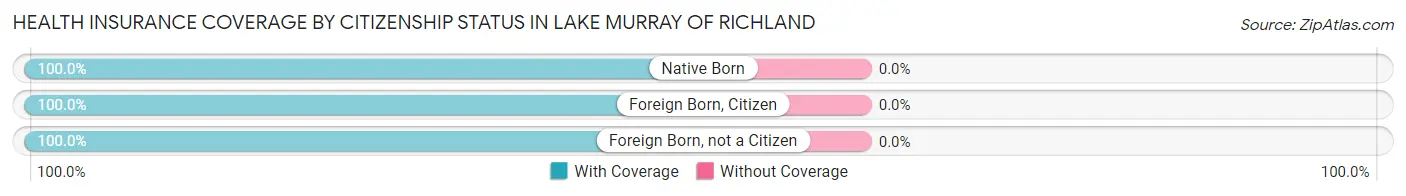
| Citizenship Status | With Coverage | Without Coverage |
| Native Born | 478 (100.0%) | 0 (0.0%) |
| Foreign Born, Citizen | 1,106 (100.0%) | 0 (0.0%) |
| Foreign Born, not a Citizen | 210 (100.0%) | 0 (0.0%) |
Health Insurance Coverage by Household Income in Lake Murray of Richland
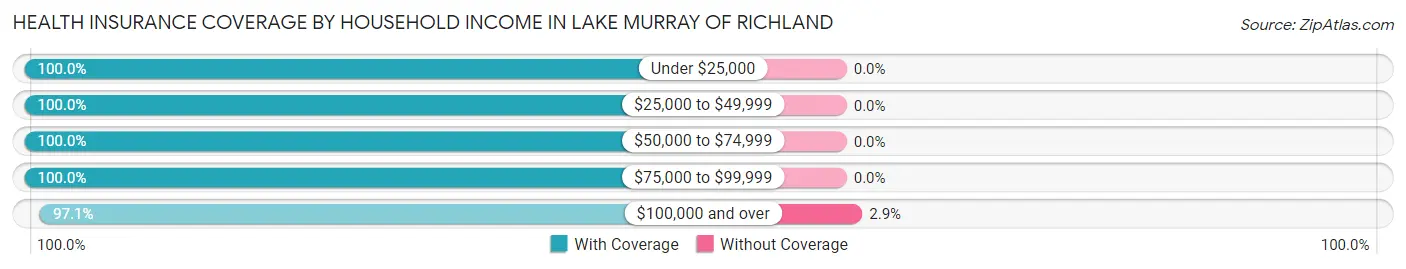
| Household Income | With Coverage | Without Coverage |
| Under $25,000 | 55 (100.0%) | 0 (0.0%) |
| $25,000 to $49,999 | 623 (100.0%) | 0 (0.0%) |
| $50,000 to $74,999 | 655 (100.0%) | 0 (0.0%) |
| $75,000 to $99,999 | 1,226 (100.0%) | 0 (0.0%) |
| $100,000 and over | 4,057 (97.1%) | 122 (2.9%) |
Public vs Private Health Insurance Coverage by Age in Lake Murray of Richland
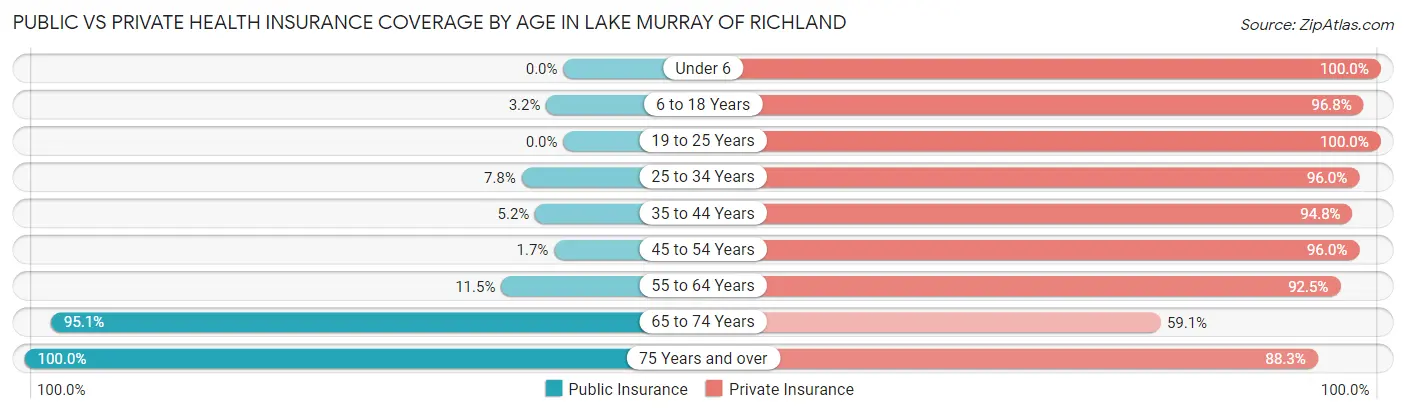
| Age Bracket | Public Insurance | Private Insurance |
| Under 6 | 0 (0.0%) | 478 (100.0%) |
| 6 to 18 Years | 35 (3.2%) | 1,071 (96.8%) |
| 19 to 25 Years | 0 (0.0%) | 210 (100.0%) |
| 25 to 34 Years | 31 (7.7%) | 384 (96.0%) |
| 35 to 44 Years | 52 (5.2%) | 942 (94.8%) |
| 45 to 54 Years | 21 (1.7%) | 1,183 (96.0%) |
| 55 to 64 Years | 100 (11.5%) | 802 (92.5%) |
| 65 to 74 Years | 778 (95.1%) | 483 (59.1%) |
| 75 Years and over | 633 (100.0%) | 559 (88.3%) |
| Total | 1,650 (24.5%) | 6,112 (90.7%) |
Disability Status by Sex by Age in Lake Murray of Richland
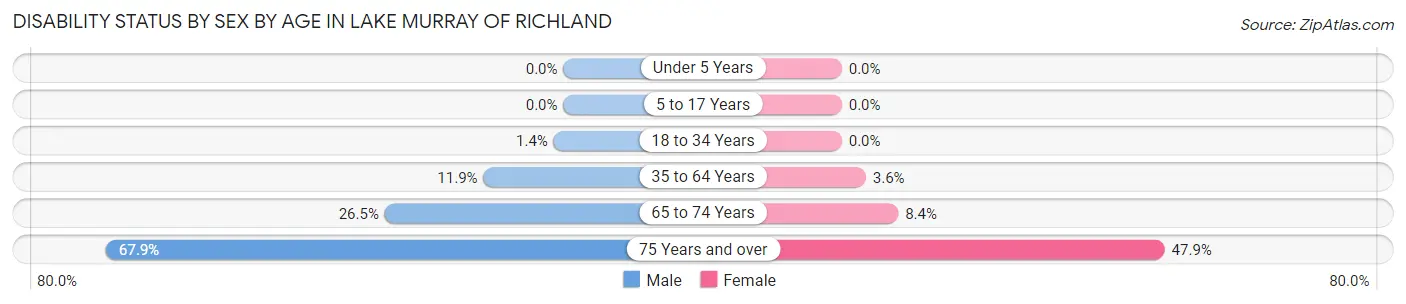
| Age Bracket | Male | Female |
| Under 5 Years | 0 (0.0%) | 0 (0.0%) |
| 5 to 17 Years | 0 (0.0%) | 0 (0.0%) |
| 18 to 34 Years | 6 (1.4%) | 0 (0.0%) |
| 35 to 64 Years | 211 (11.9%) | 47 (3.6%) |
| 65 to 74 Years | 122 (26.5%) | 30 (8.4%) |
| 75 Years and over | 216 (67.9%) | 151 (47.9%) |
Disability Class by Sex by Age in Lake Murray of Richland
Disability Class: Hearing Difficulty
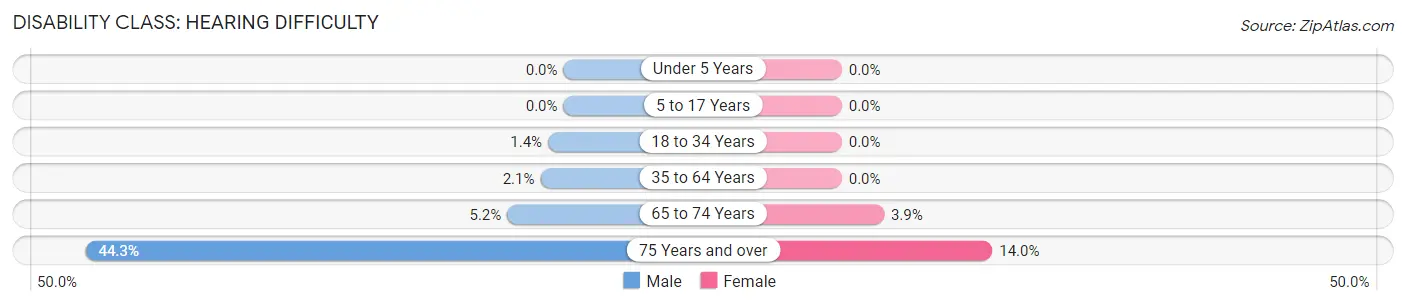
| Age Bracket | Male | Female |
| Under 5 Years | 0 (0.0%) | 0 (0.0%) |
| 5 to 17 Years | 0 (0.0%) | 0 (0.0%) |
| 18 to 34 Years | 6 (1.4%) | 0 (0.0%) |
| 35 to 64 Years | 38 (2.1%) | 0 (0.0%) |
| 65 to 74 Years | 24 (5.2%) | 14 (3.9%) |
| 75 Years and over | 141 (44.3%) | 44 (14.0%) |
Disability Class: Vision Difficulty
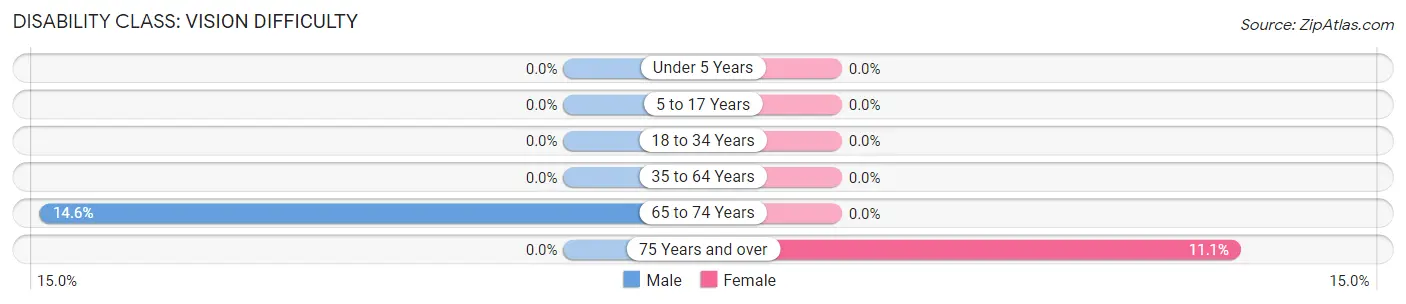
| Age Bracket | Male | Female |
| Under 5 Years | 0 (0.0%) | 0 (0.0%) |
| 5 to 17 Years | 0 (0.0%) | 0 (0.0%) |
| 18 to 34 Years | 0 (0.0%) | 0 (0.0%) |
| 35 to 64 Years | 0 (0.0%) | 0 (0.0%) |
| 65 to 74 Years | 67 (14.6%) | 0 (0.0%) |
| 75 Years and over | 0 (0.0%) | 35 (11.1%) |
Disability Class: Cognitive Difficulty
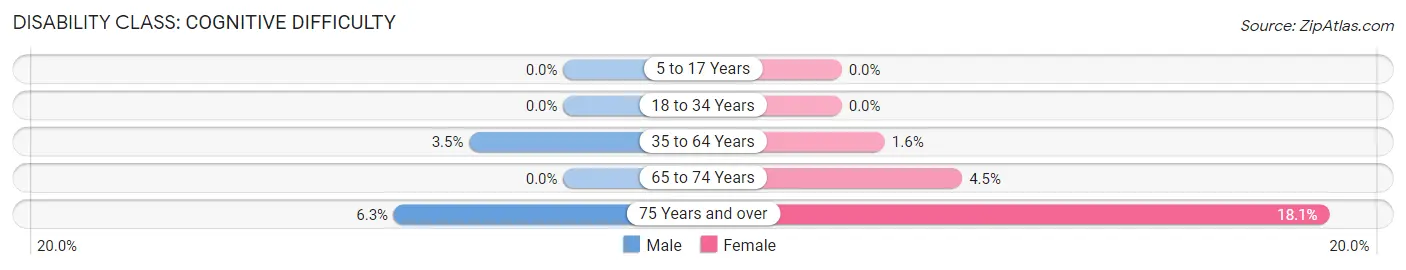
| Age Bracket | Male | Female |
| 5 to 17 Years | 0 (0.0%) | 0 (0.0%) |
| 18 to 34 Years | 0 (0.0%) | 0 (0.0%) |
| 35 to 64 Years | 62 (3.5%) | 21 (1.6%) |
| 65 to 74 Years | 0 (0.0%) | 16 (4.5%) |
| 75 Years and over | 20 (6.3%) | 57 (18.1%) |
Disability Class: Ambulatory Difficulty
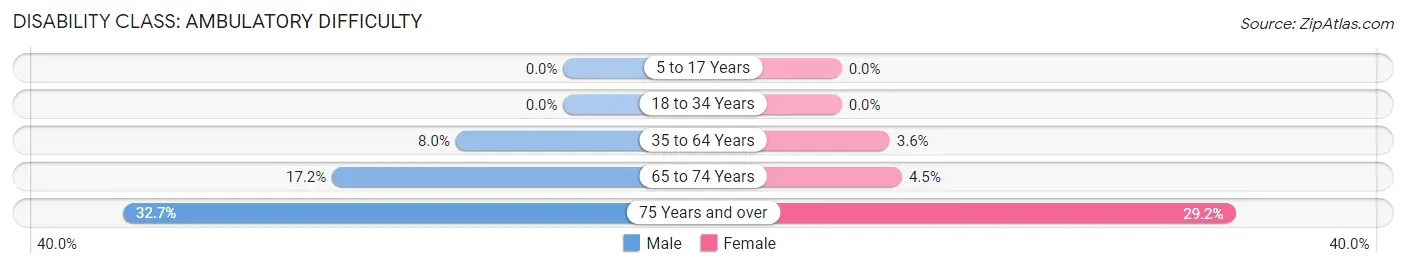
| Age Bracket | Male | Female |
| 5 to 17 Years | 0 (0.0%) | 0 (0.0%) |
| 18 to 34 Years | 0 (0.0%) | 0 (0.0%) |
| 35 to 64 Years | 142 (8.0%) | 47 (3.6%) |
| 65 to 74 Years | 79 (17.2%) | 16 (4.5%) |
| 75 Years and over | 104 (32.7%) | 92 (29.2%) |
Disability Class: Self-Care Difficulty
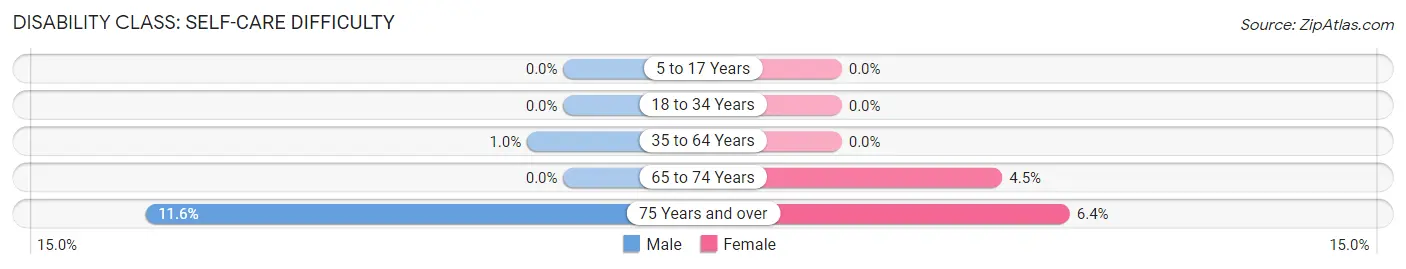
| Age Bracket | Male | Female |
| 5 to 17 Years | 0 (0.0%) | 0 (0.0%) |
| 18 to 34 Years | 0 (0.0%) | 0 (0.0%) |
| 35 to 64 Years | 18 (1.0%) | 0 (0.0%) |
| 65 to 74 Years | 0 (0.0%) | 16 (4.5%) |
| 75 Years and over | 37 (11.6%) | 20 (6.4%) |
Technology Access in Lake Murray of Richland
Computing Device Access in Lake Murray of Richland
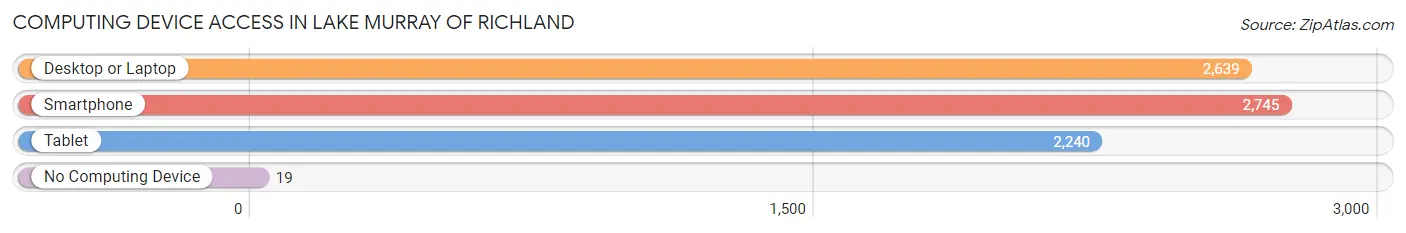
| Device Type | # Households | % Households |
| Desktop or Laptop | 2,639 | 92.1% |
| Smartphone | 2,745 | 95.8% |
| Tablet | 2,240 | 78.2% |
| No Computing Device | 19 | 0.7% |
| Total | 2,866 | 100.0% |
Internet Access in Lake Murray of Richland
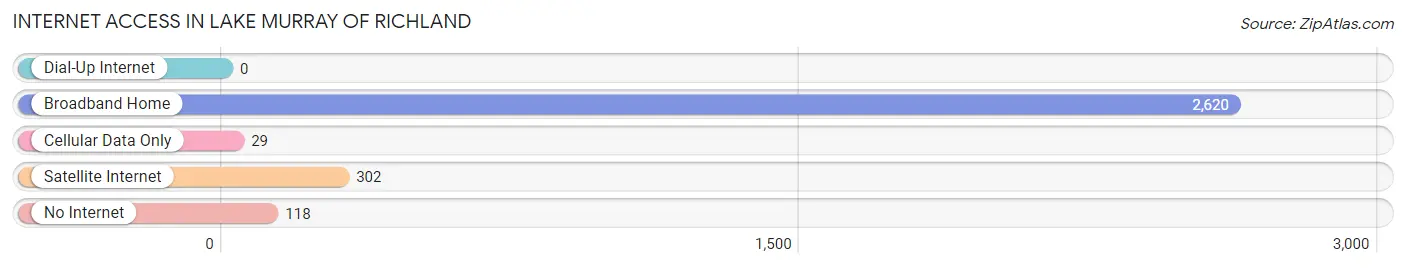
| Internet Type | # Households | % Households |
| Dial-Up Internet | 0 | 0.0% |
| Broadband Home | 2,620 | 91.4% |
| Cellular Data Only | 29 | 1.0% |
| Satellite Internet | 302 | 10.5% |
| No Internet | 118 | 4.1% |
| Total | 2,866 | 100.0% |
Lake Murray of Richland Summary
Lake Murray of Richland, SC is a large reservoir located in the Midlands of South Carolina. It is a popular recreational destination for locals and visitors alike, offering a variety of activities such as fishing, boating, swimming, and camping. The lake is also a major source of hydroelectric power for the state.
History
Lake Murray was created in 1930 by the construction of the Saluda Dam on the Saluda River. The dam was built by the South Carolina Electric & Gas Company (SCE&G) to generate hydroelectric power for the state. The lake was named after William S. Murray, the president of SCE&G at the time.
The lake was created by flooding the area around the Saluda River, which included several small towns and farms. The lake was created to provide hydroelectric power to the state, but it also provided recreational opportunities for the local population.
Geography
Lake Murray is located in the Midlands of South Carolina, about 20 miles northwest of Columbia. It is a large reservoir, covering an area of approximately 50,000 acres. The lake is fed by the Saluda River and is bordered by the cities of Columbia, Lexington, and Irmo.
The lake is surrounded by several state parks, including Dreher Island State Park, Lake Murray State Park, and Sesquicentennial State Park. These parks offer a variety of recreational activities, such as camping, fishing, boating, and swimming.
Economy
Lake Murray is a major source of hydroelectric power for the state of South Carolina. The lake is also a popular recreational destination, providing a variety of activities for locals and visitors alike.
The lake is home to several marinas, which offer boat rentals, fishing charters, and other services. There are also several restaurants and resorts located on the lake, which cater to tourists and locals alike.
Demographics
The population of the Lake Murray area is approximately 50,000. The majority of the population is white (83%), followed by African American (13%), Hispanic (2%), and other (2%). The median household income is $50,000, and the median age is 38.
Conclusion
Lake Murray of Richland, SC is a large reservoir located in the Midlands of South Carolina. It was created in 1930 by the construction of the Saluda Dam, and is a major source of hydroelectric power for the state. The lake is also a popular recreational destination, offering a variety of activities such as fishing, boating, swimming, and camping. The population of the Lake Murray area is approximately 50,000, with a median household income of $50,000 and a median age of 38.
Common Questions
What is Per Capita Income in Lake Murray of Richland?
Per Capita income in Lake Murray of Richland is $67,986.
What is the Median Family Income in Lake Murray of Richland?
Median Family Income in Lake Murray of Richland is $133,393.
What is the Median Household income in Lake Murray of Richland?
Median Household Income in Lake Murray of Richland is $111,477.
What is Income or Wage Gap in Lake Murray of Richland?
Income or Wage Gap in Lake Murray of Richland is 20.5%.
Women in Lake Murray of Richland earn 79.5 cents for every dollar earned by a man.
What is Inequality or Gini Index in Lake Murray of Richland?
Inequality or Gini Index in Lake Murray of Richland is 0.44.
What is the Total Population of Lake Murray of Richland?
Total Population of Lake Murray of Richland is 6,914.
What is the Total Male Population of Lake Murray of Richland?
Total Male Population of Lake Murray of Richland is 3,590.
What is the Total Female Population of Lake Murray of Richland?
Total Female Population of Lake Murray of Richland is 3,324.
What is the Ratio of Males per 100 Females in Lake Murray of Richland?
There are 108.00 Males per 100 Females in Lake Murray of Richland.
What is the Ratio of Females per 100 Males in Lake Murray of Richland?
There are 92.59 Females per 100 Males in Lake Murray of Richland.
What is the Median Population Age in Lake Murray of Richland?
Median Population Age in Lake Murray of Richland is 46.4 Years.
What is the Average Family Size in Lake Murray of Richland
Average Family Size in Lake Murray of Richland is 2.8 People.
What is the Average Household Size in Lake Murray of Richland
Average Household Size in Lake Murray of Richland is 2.4 People.
How Large is the Labor Force in Lake Murray of Richland?
There are 3,417 People in the Labor Forcein in Lake Murray of Richland.
What is the Percentage of People in the Labor Force in Lake Murray of Richland?
60.7% of People are in the Labor Force in Lake Murray of Richland.
What is the Unemployment Rate in Lake Murray of Richland?
Unemployment Rate in Lake Murray of Richland is 4.4%.