Chicopee, MA Map & Demographics
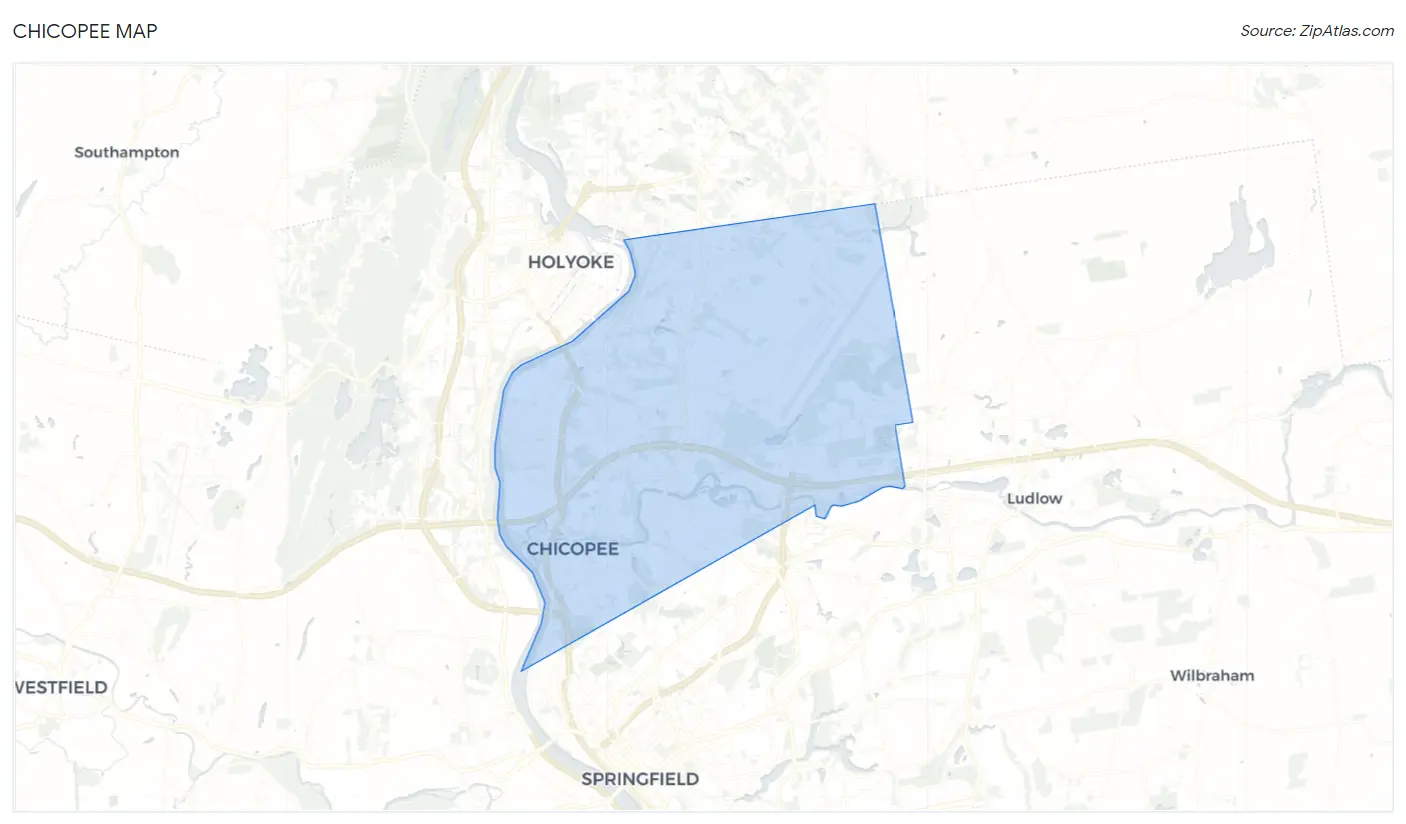
Chicopee Map
Chicopee Overview
$34,719
PER CAPITA INCOME
$77,179
AVG FAMILY INCOME
$63,866
AVG HOUSEHOLD INCOME
14.5%
WAGE / INCOME GAP [ % ]
85.5¢/ $1
WAGE / INCOME GAP [ $ ]
$9,832
FAMILY INCOME DEFICIT
0.44
INEQUALITY / GINI INDEX
55,441
TOTAL POPULATION
26,977
MALE POPULATION
28,464
FEMALE POPULATION
94.78
MALES / 100 FEMALES
105.51
FEMALES / 100 MALES
41.4
MEDIAN AGE
2.9
AVG FAMILY SIZE
2.3
AVG HOUSEHOLD SIZE
28,561
LABOR FORCE [ PEOPLE ]
61.4%
PERCENT IN LABOR FORCE
6.1%
UNEMPLOYMENT RATE
Chicopee Area Codes
Income in Chicopee
Income Overview in Chicopee
Per Capita Income in Chicopee is $34,719, while median incomes of families and households are $77,179 and $63,866 respectively.
| Characteristic | Number | Measure |
| Per Capita Income | 55,441 | $34,719 |
| Median Family Income | 13,823 | $77,179 |
| Mean Family Income | 13,823 | $94,204 |
| Median Household Income | 23,732 | $63,866 |
| Mean Household Income | 23,732 | $80,168 |
| Income Deficit | 13,823 | $9,832 |
| Wage / Income Gap (%) | 55,441 | 14.54% |
| Wage / Income Gap ($) | 55,441 | 85.46¢ per $1 |
| Gini / Inequality Index | 55,441 | 0.44 |
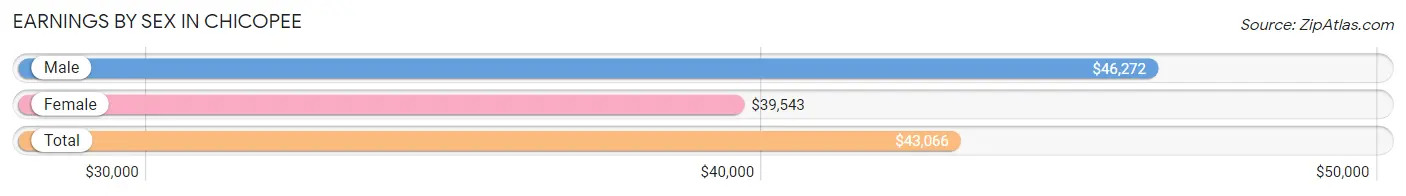
Earnings by Sex in Chicopee
Average Earnings in Chicopee are $43,066, $46,272 for men and $39,543 for women, a difference of 14.5%.
| Sex | Number | Average Earnings |
| Male | 14,821 (49.9%) | $46,272 |
| Female | 14,848 (50.0%) | $39,543 |
| Total | 29,669 (100.0%) | $43,066 |
Earnings by Sex by Income Bracket in Chicopee
The most common earnings brackets in Chicopee are $75,000 to $99,999 for men (2,030 | 13.7%) and $75,000 to $99,999 for women (1,569 | 10.6%).
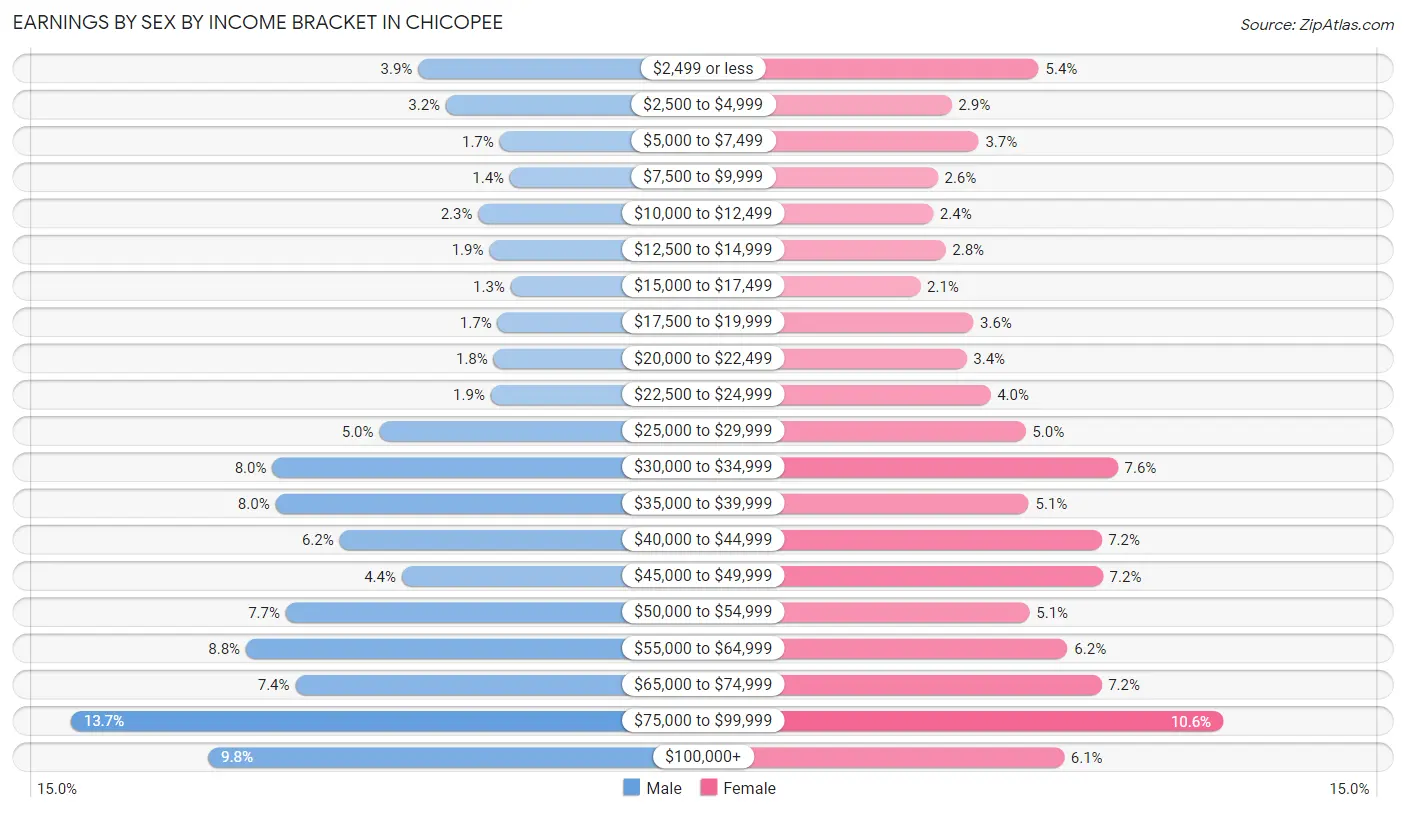
| Income | Male | Female |
| $2,499 or less | 584 (3.9%) | 800 (5.4%) |
| $2,500 to $4,999 | 469 (3.2%) | 437 (2.9%) |
| $5,000 to $7,499 | 245 (1.7%) | 549 (3.7%) |
| $7,500 to $9,999 | 201 (1.4%) | 379 (2.5%) |
| $10,000 to $12,499 | 334 (2.2%) | 359 (2.4%) |
| $12,500 to $14,999 | 287 (1.9%) | 412 (2.8%) |
| $15,000 to $17,499 | 198 (1.3%) | 306 (2.1%) |
| $17,500 to $19,999 | 253 (1.7%) | 527 (3.5%) |
| $20,000 to $22,499 | 270 (1.8%) | 499 (3.4%) |
| $22,500 to $24,999 | 282 (1.9%) | 599 (4.0%) |
| $25,000 to $29,999 | 745 (5.0%) | 746 (5.0%) |
| $30,000 to $34,999 | 1,191 (8.0%) | 1,130 (7.6%) |
| $35,000 to $39,999 | 1,179 (8.0%) | 758 (5.1%) |
| $40,000 to $44,999 | 911 (6.1%) | 1,061 (7.1%) |
| $45,000 to $49,999 | 652 (4.4%) | 1,067 (7.2%) |
| $50,000 to $54,999 | 1,135 (7.7%) | 762 (5.1%) |
| $55,000 to $64,999 | 1,301 (8.8%) | 921 (6.2%) |
| $65,000 to $74,999 | 1,096 (7.4%) | 1,061 (7.1%) |
| $75,000 to $99,999 | 2,030 (13.7%) | 1,569 (10.6%) |
| $100,000+ | 1,458 (9.8%) | 906 (6.1%) |
| Total | 14,821 (100.0%) | 14,848 (100.0%) |
Earnings by Sex by Educational Attainment in Chicopee
Average earnings in Chicopee are $51,620 for men and $44,286 for women, a difference of 14.2%. Men with an educational attainment of graduate degree enjoy the highest average annual earnings of $67,730, while those with less than high school education earn the least with $39,443. Women with an educational attainment of graduate degree earn the most with the average annual earnings of $69,036, while those with high school diploma education have the smallest earnings of $32,073.
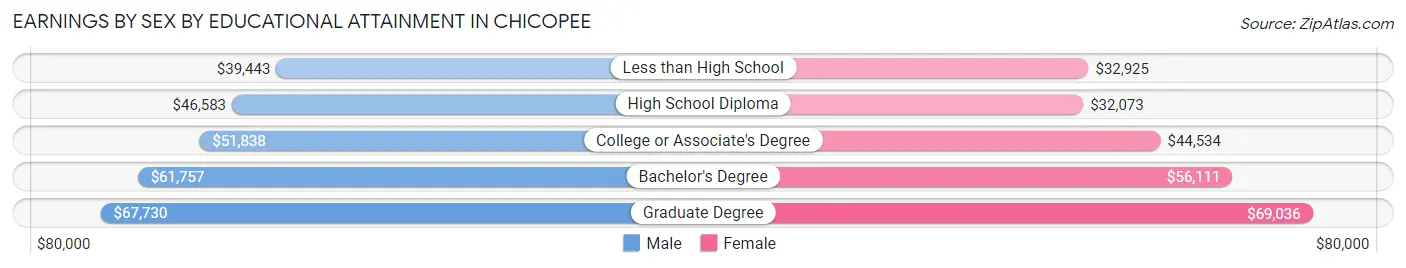
| Educational Attainment | Male Income | Female Income |
| Less than High School | $39,443 | $32,925 |
| High School Diploma | $46,583 | $32,073 |
| College or Associate's Degree | $51,838 | $44,534 |
| Bachelor's Degree | $61,757 | $56,111 |
| Graduate Degree | $67,730 | $69,036 |
| Total | $51,620 | $44,286 |
Family Income in Chicopee
Family Income Brackets in Chicopee
According to the Chicopee family income data, there are 2,834 families falling into the $100,000 to $149,999 income range, which is the most common income bracket and makes up 20.5% of all families. Conversely, the $10,000 to $14,999 income bracket is the least frequent group with only 290 families (2.1%) belonging to this category.
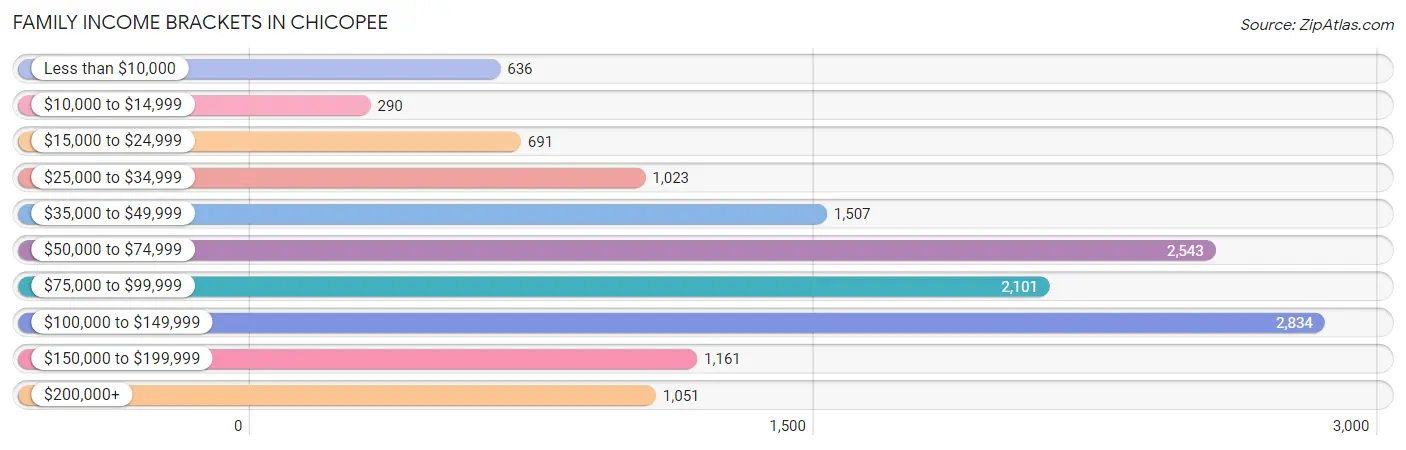
| Income Bracket | # Families | % Families |
| Less than $10,000 | 636 | 4.6% |
| $10,000 to $14,999 | 290 | 2.1% |
| $15,000 to $24,999 | 691 | 5.0% |
| $25,000 to $34,999 | 1,023 | 7.4% |
| $35,000 to $49,999 | 1,507 | 10.9% |
| $50,000 to $74,999 | 2,543 | 18.4% |
| $75,000 to $99,999 | 2,101 | 15.2% |
| $100,000 to $149,999 | 2,834 | 20.5% |
| $150,000 to $199,999 | 1,161 | 8.4% |
| $200,000+ | 1,051 | 7.6% |
Family Income by Famaliy Size in Chicopee
5-person families (536 | 3.9%) account for the highest median family income in Chicopee with $120,152 per family, while 2-person families (6,962 | 50.4%) have the highest median income of $32,092 per family member.
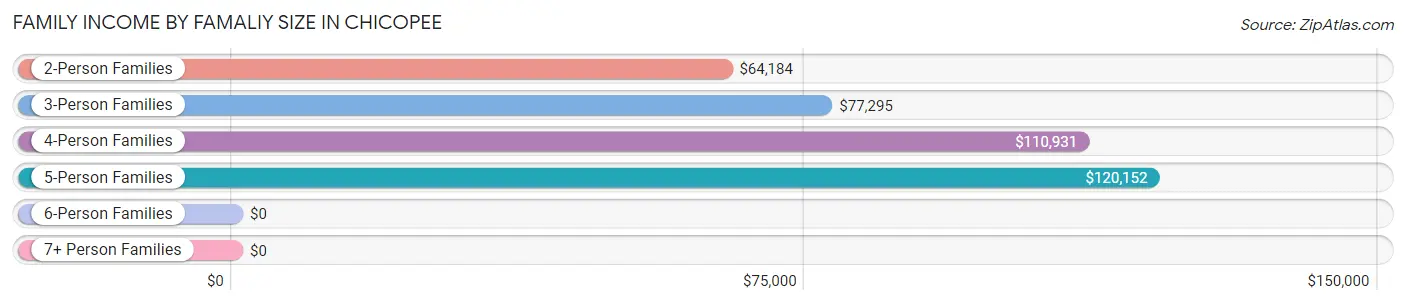
| Income Bracket | # Families | Median Income |
| 2-Person Families | 6,962 (50.4%) | $64,184 |
| 3-Person Families | 3,841 (27.8%) | $77,295 |
| 4-Person Families | 2,003 (14.5%) | $110,931 |
| 5-Person Families | 536 (3.9%) | $120,152 |
| 6-Person Families | 292 (2.1%) | $0 |
| 7+ Person Families | 189 (1.4%) | $0 |
| Total | 13,823 (100.0%) | $77,179 |
Family Income by Number of Earners in Chicopee
The median family income in Chicopee is $77,179, with families comprising 3+ earners (1,589) having the highest median family income of $137,342, while families with no earners (2,142) have the lowest median family income of $36,481, accounting for 11.5% and 15.5% of families, respectively.
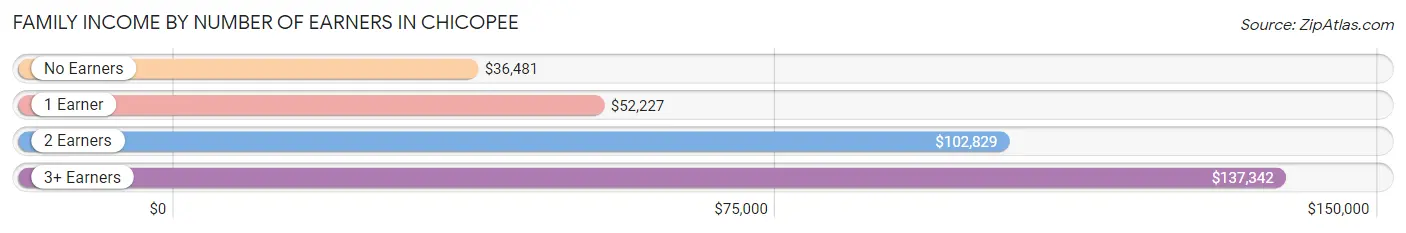
| Number of Earners | # Families | Median Income |
| No Earners | 2,142 (15.5%) | $36,481 |
| 1 Earner | 4,765 (34.5%) | $52,227 |
| 2 Earners | 5,327 (38.5%) | $102,829 |
| 3+ Earners | 1,589 (11.5%) | $137,342 |
| Total | 13,823 (100.0%) | $77,179 |
Household Income in Chicopee
Household Income Brackets in Chicopee
With 4,082 households falling in the category, the $50,000 to $74,999 income range is the most frequent in Chicopee, accounting for 17.2% of all households. In contrast, only 1,210 households (5.1%) fall into the $10,000 to $14,999 income bracket, making it the least populous group.
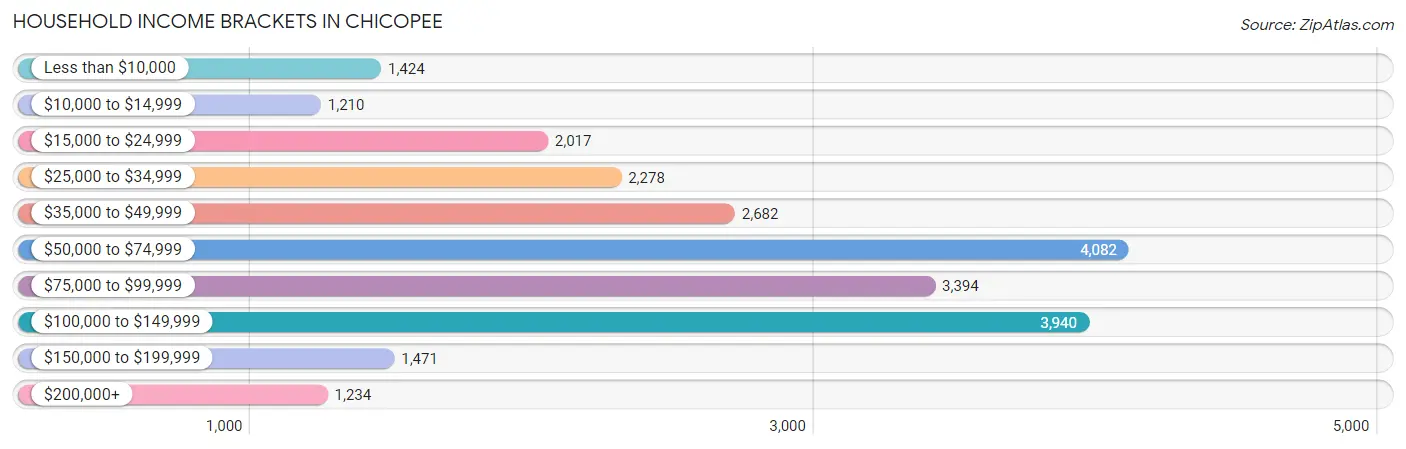
| Income Bracket | # Households | % Households |
| Less than $10,000 | 1,424 | 6.0% |
| $10,000 to $14,999 | 1,210 | 5.1% |
| $15,000 to $24,999 | 2,017 | 8.5% |
| $25,000 to $34,999 | 2,278 | 9.6% |
| $35,000 to $49,999 | 2,682 | 11.3% |
| $50,000 to $74,999 | 4,082 | 17.2% |
| $75,000 to $99,999 | 3,394 | 14.3% |
| $100,000 to $149,999 | 3,940 | 16.6% |
| $150,000 to $199,999 | 1,471 | 6.2% |
| $200,000+ | 1,234 | 5.2% |
Household Income by Householder Age in Chicopee
The median household income in Chicopee is $63,866, with the highest median household income of $79,518 found in the 45 to 64 years age bracket for the primary householder. A total of 8,876 households (37.4%) fall into this category. Meanwhile, the 65+ years age bracket for the primary householder has the lowest median household income of $38,898, with 7,291 households (30.7%) in this group.
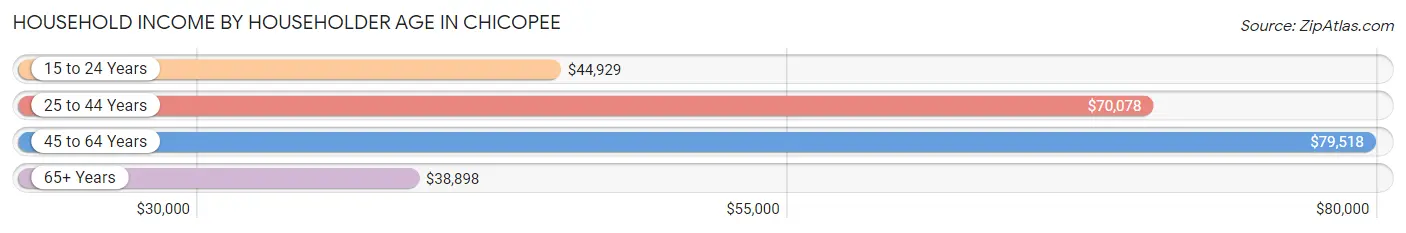
| Income Bracket | # Households | Median Income |
| 15 to 24 Years | 286 (1.2%) | $44,929 |
| 25 to 44 Years | 7,279 (30.7%) | $70,078 |
| 45 to 64 Years | 8,876 (37.4%) | $79,518 |
| 65+ Years | 7,291 (30.7%) | $38,898 |
| Total | 23,732 (100.0%) | $63,866 |
Poverty in Chicopee
Income Below Poverty by Sex and Age in Chicopee
With 13.4% poverty level for males and 17.4% for females among the residents of Chicopee, 15 year old males and 15 year old females are the most vulnerable to poverty, with 267 males (68.1%) and 152 females (45.8%) in their respective age groups living below the poverty level.
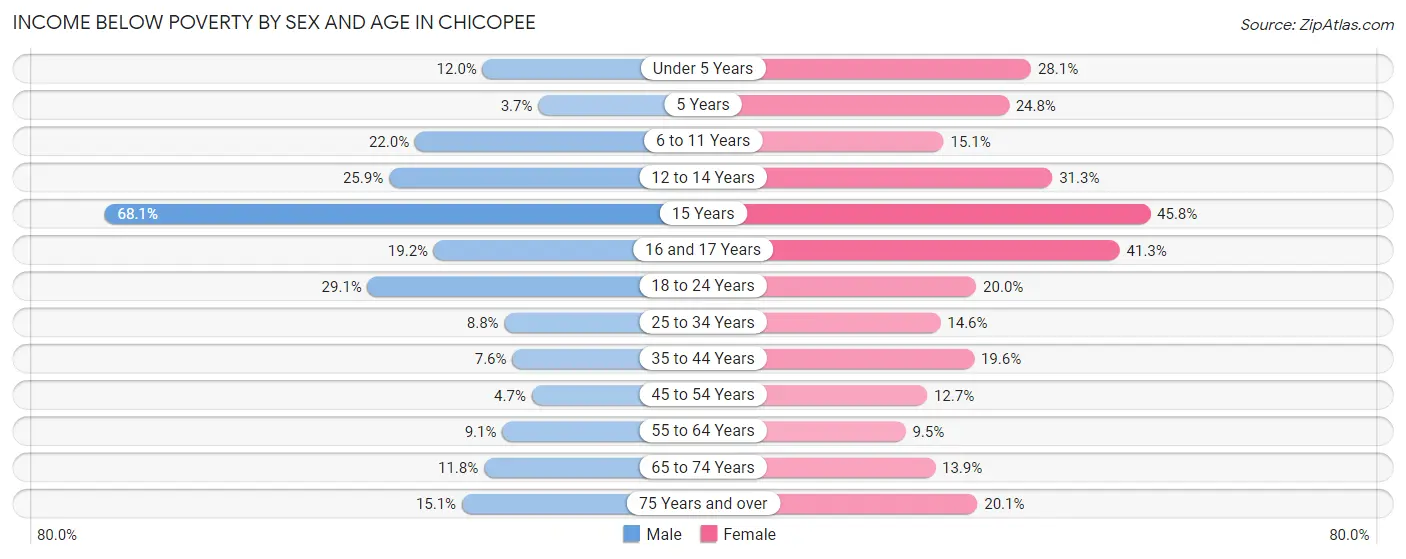
| Age Bracket | Male | Female |
| Under 5 Years | 157 (12.0%) | 311 (28.1%) |
| 5 Years | 7 (3.7%) | 84 (24.8%) |
| 6 to 11 Years | 341 (22.0%) | 250 (15.1%) |
| 12 to 14 Years | 262 (25.9%) | 230 (31.2%) |
| 15 Years | 267 (68.1%) | 152 (45.8%) |
| 16 and 17 Years | 208 (19.2%) | 297 (41.2%) |
| 18 to 24 Years | 648 (29.1%) | 503 (20.0%) |
| 25 to 34 Years | 304 (8.7%) | 526 (14.6%) |
| 35 to 44 Years | 257 (7.6%) | 734 (19.6%) |
| 45 to 54 Years | 146 (4.7%) | 452 (12.7%) |
| 55 to 64 Years | 385 (9.1%) | 378 (9.5%) |
| 65 to 74 Years | 364 (11.8%) | 424 (13.9%) |
| 75 Years and over | 241 (15.1%) | 500 (20.1%) |
| Total | 3,587 (13.4%) | 4,841 (17.4%) |
Income Above Poverty by Sex and Age in Chicopee
According to the poverty statistics in Chicopee, males aged 5 years and females aged 55 to 64 years are the age groups that are most secure financially, with 96.3% of males and 90.5% of females in these age groups living above the poverty line.
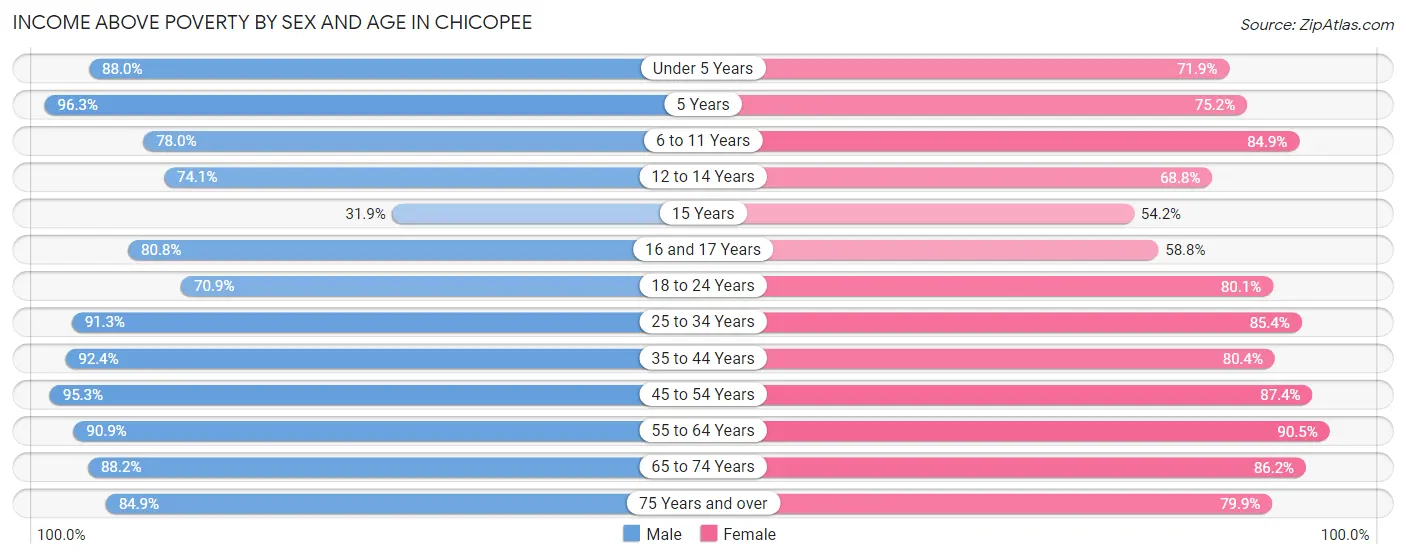
| Age Bracket | Male | Female |
| Under 5 Years | 1,154 (88.0%) | 796 (71.9%) |
| 5 Years | 181 (96.3%) | 255 (75.2%) |
| 6 to 11 Years | 1,207 (78.0%) | 1,405 (84.9%) |
| 12 to 14 Years | 750 (74.1%) | 506 (68.8%) |
| 15 Years | 125 (31.9%) | 180 (54.2%) |
| 16 and 17 Years | 874 (80.8%) | 423 (58.8%) |
| 18 to 24 Years | 1,582 (70.9%) | 2,018 (80.0%) |
| 25 to 34 Years | 3,172 (91.2%) | 3,067 (85.4%) |
| 35 to 44 Years | 3,138 (92.4%) | 3,006 (80.4%) |
| 45 to 54 Years | 2,970 (95.3%) | 3,120 (87.4%) |
| 55 to 64 Years | 3,858 (90.9%) | 3,618 (90.5%) |
| 65 to 74 Years | 2,729 (88.2%) | 2,638 (86.2%) |
| 75 Years and over | 1,359 (84.9%) | 1,985 (79.9%) |
| Total | 23,099 (86.6%) | 23,017 (82.6%) |
Income Below Poverty Among Married-Couple Families in Chicopee
The poverty statistics for married-couple families in Chicopee show that 5.4% or 449 of the total 8,312 families live below the poverty line. Families with no children have the highest poverty rate of 6.8%, comprising of 379 families. On the other hand, families with 5 or more children have the lowest poverty rate of 0.0%, which includes 0 families.
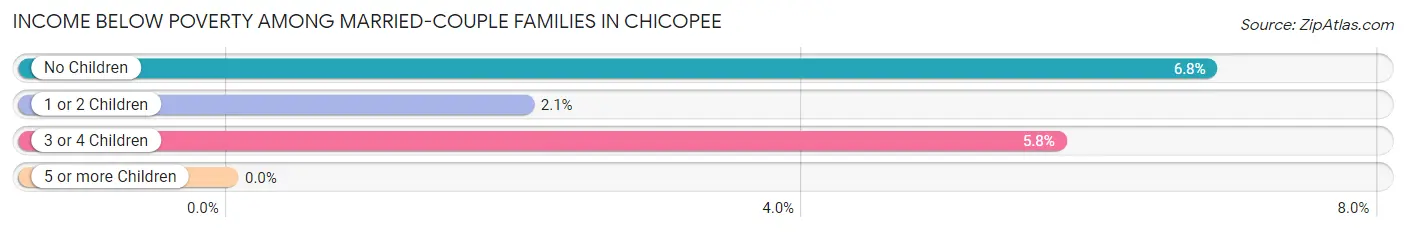
| Children | Above Poverty | Below Poverty |
| No Children | 5,182 (93.2%) | 379 (6.8%) |
| 1 or 2 Children | 2,325 (97.9%) | 49 (2.1%) |
| 3 or 4 Children | 343 (94.2%) | 21 (5.8%) |
| 5 or more Children | 13 (100.0%) | 0 (0.0%) |
| Total | 7,863 (94.6%) | 449 (5.4%) |
Income Below Poverty Among Single-Parent Households in Chicopee
According to the poverty data in Chicopee, 6.8% or 102 single-father households and 26.0% or 1,042 single-mother households are living below the poverty line. Among single-father households, those with 1 or 2 children have the highest poverty rate, with 46 households (7.4%) experiencing poverty. Likewise, among single-mother households, those with 5 or more children have the highest poverty rate, with 69 households (100.0%) falling below the poverty line.
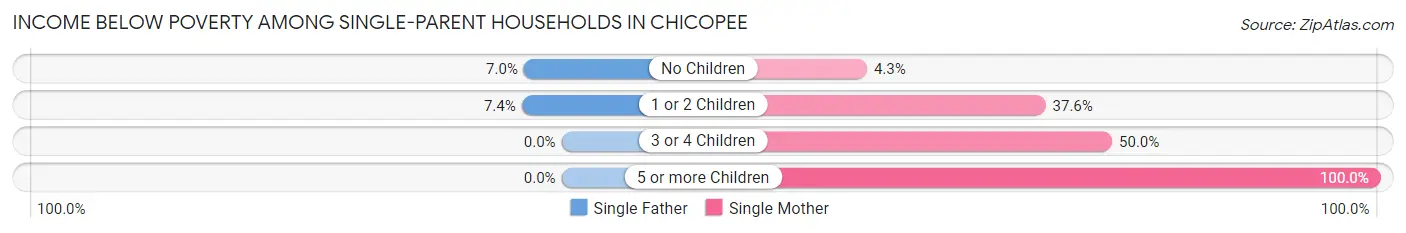
| Children | Single Father | Single Mother |
| No Children | 56 (7.0%) | 69 (4.3%) |
| 1 or 2 Children | 46 (7.4%) | 814 (37.6%) |
| 3 or 4 Children | 0 (0.0%) | 90 (50.0%) |
| 5 or more Children | 0 (0.0%) | 69 (100.0%) |
| Total | 102 (6.8%) | 1,042 (26.0%) |
Income Below Poverty Among Married-Couple vs Single-Parent Households in Chicopee
The poverty data for Chicopee shows that 449 of the married-couple family households (5.4%) and 1,144 of the single-parent households (20.8%) are living below the poverty level. Within the married-couple family households, those with no children have the highest poverty rate, with 379 households (6.8%) falling below the poverty line. Among the single-parent households, those with 5 or more children have the highest poverty rate, with 69 household (100.0%) living below poverty.
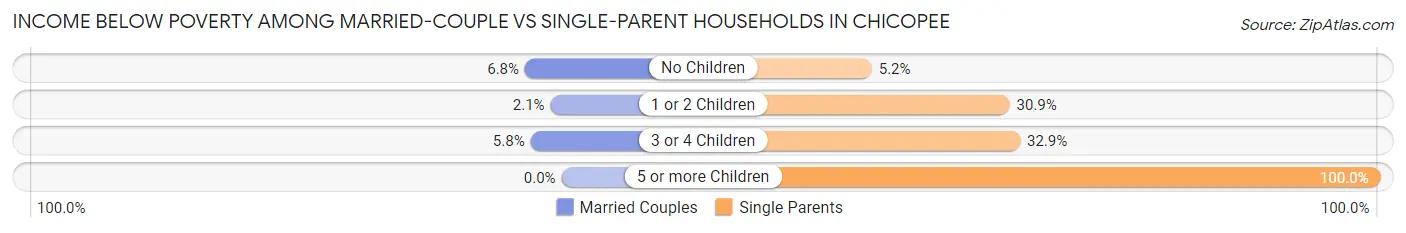
| Children | Married-Couple Families | Single-Parent Households |
| No Children | 379 (6.8%) | 125 (5.2%) |
| 1 or 2 Children | 49 (2.1%) | 860 (30.9%) |
| 3 or 4 Children | 21 (5.8%) | 90 (32.9%) |
| 5 or more Children | 0 (0.0%) | 69 (100.0%) |
| Total | 449 (5.4%) | 1,144 (20.8%) |
Race in Chicopee
The most populous races in Chicopee are White / Caucasian (42,428 | 76.5%), Hispanic or Latino (13,316 | 24.0%), and Two or more Races (4,458 | 8.0%).
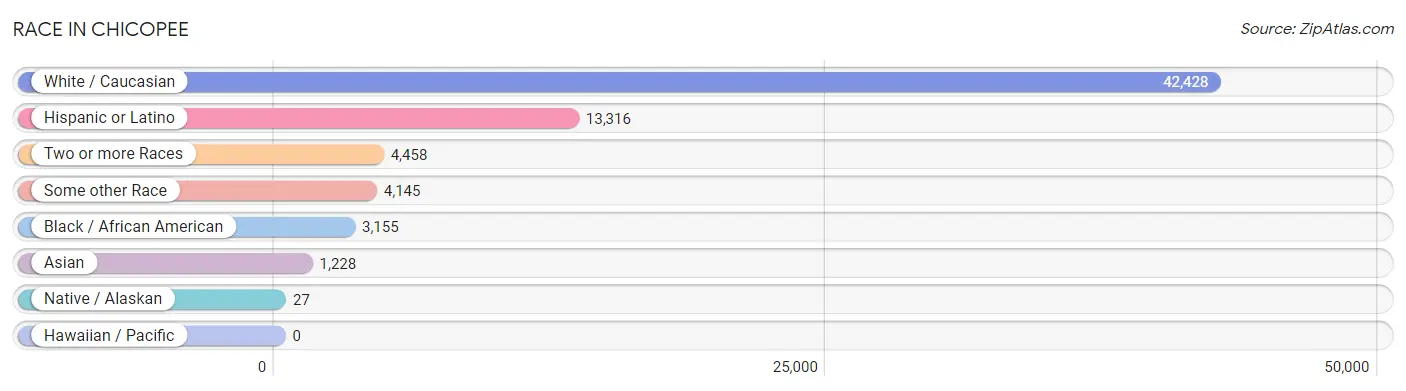
| Race | # Population | % Population |
| Asian | 1,228 | 2.2% |
| Black / African American | 3,155 | 5.7% |
| Hawaiian / Pacific | 0 | 0.0% |
| Hispanic or Latino | 13,316 | 24.0% |
| Native / Alaskan | 27 | 0.1% |
| White / Caucasian | 42,428 | 76.5% |
| Two or more Races | 4,458 | 8.0% |
| Some other Race | 4,145 | 7.5% |
| Total | 55,441 | 100.0% |
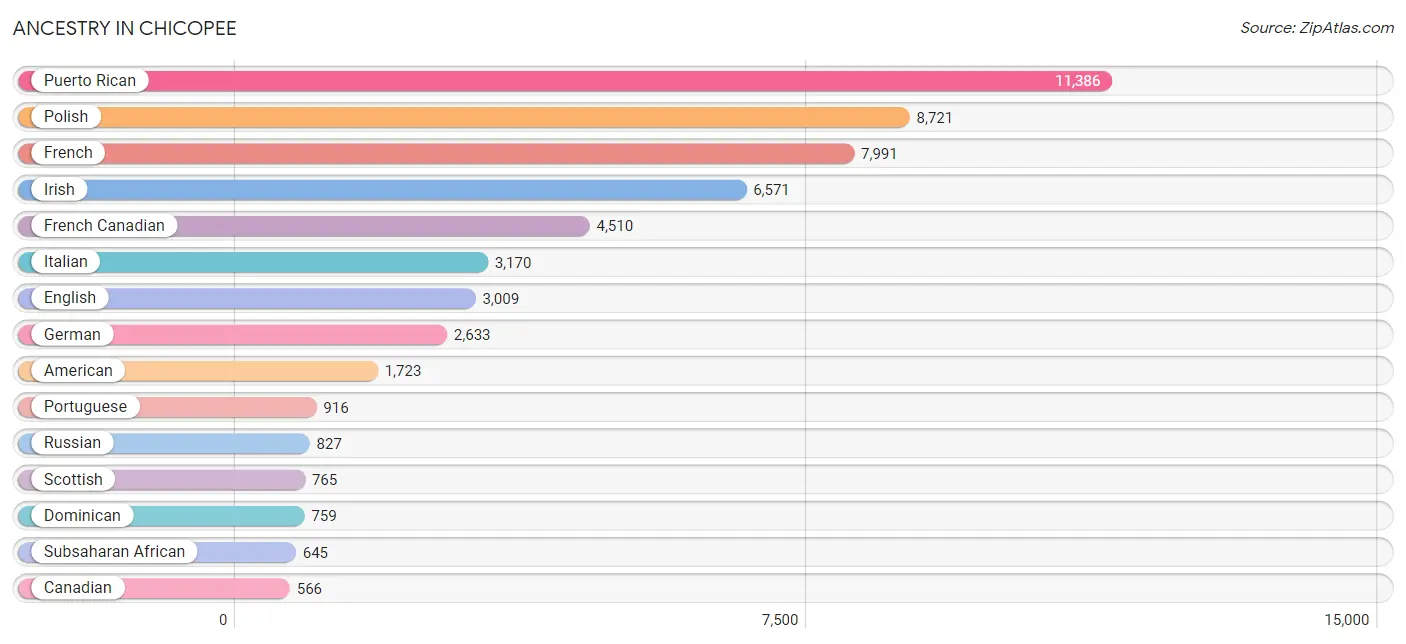
Ancestry in Chicopee
The most populous ancestries reported in Chicopee are Puerto Rican (11,386 | 20.5%), Polish (8,721 | 15.7%), French (7,991 | 14.4%), Irish (6,571 | 11.8%), and French Canadian (4,510 | 8.1%), together accounting for 70.7% of all Chicopee residents.
| Ancestry | # Population | % Population |
| African | 243 | 0.4% |
| Albanian | 30 | 0.1% |
| American | 1,723 | 3.1% |
| Apache | 2 | 0.0% |
| Arab | 362 | 0.6% |
| Armenian | 23 | 0.0% |
| Austrian | 34 | 0.1% |
| Bhutanese | 163 | 0.3% |
| Blackfeet | 1 | 0.0% |
| Brazilian | 9 | 0.0% |
| British | 123 | 0.2% |
| British West Indian | 30 | 0.1% |
| Bulgarian | 9 | 0.0% |
| Burmese | 22 | 0.0% |
| Canadian | 566 | 1.0% |
| Cape Verdean | 10 | 0.0% |
| Central American | 423 | 0.8% |
| Central American Indian | 25 | 0.1% |
| Cherokee | 65 | 0.1% |
| Choctaw | 5 | 0.0% |
| Colombian | 116 | 0.2% |
| Costa Rican | 33 | 0.1% |
| Croatian | 25 | 0.1% |
| Cuban | 113 | 0.2% |
| Czech | 52 | 0.1% |
| Czechoslovakian | 11 | 0.0% |
| Danish | 24 | 0.0% |
| Dominican | 759 | 1.4% |
| Dutch | 325 | 0.6% |
| Eastern European | 48 | 0.1% |
| Ecuadorian | 9 | 0.0% |
| English | 3,009 | 5.4% |
| European | 233 | 0.4% |
| Filipino | 23 | 0.0% |
| Finnish | 109 | 0.2% |
| French | 7,991 | 14.4% |
| French American Indian | 57 | 0.1% |
| French Canadian | 4,510 | 8.1% |
| German | 2,633 | 4.8% |
| Ghanaian | 54 | 0.1% |
| Greek | 383 | 0.7% |
| Guatemalan | 87 | 0.2% |
| Haitian | 40 | 0.1% |
| Honduran | 73 | 0.1% |
| Hungarian | 69 | 0.1% |
| Icelander | 8 | 0.0% |
| Indian (Asian) | 180 | 0.3% |
| Iraqi | 16 | 0.0% |
| Irish | 6,571 | 11.8% |
| Italian | 3,170 | 5.7% |
| Jamaican | 107 | 0.2% |
| Japanese | 545 | 1.0% |
| Korean | 79 | 0.1% |
| Latvian | 9 | 0.0% |
| Lebanese | 240 | 0.4% |
| Lithuanian | 140 | 0.3% |
| Mexican | 220 | 0.4% |
| Nigerian | 153 | 0.3% |
| Northern European | 3 | 0.0% |
| Norwegian | 42 | 0.1% |
| Peruvian | 176 | 0.3% |
| Polish | 8,721 | 15.7% |
| Portuguese | 916 | 1.7% |
| Puerto Rican | 11,386 | 20.5% |
| Romanian | 43 | 0.1% |
| Russian | 827 | 1.5% |
| Salvadoran | 230 | 0.4% |
| Samoan | 27 | 0.1% |
| Scotch-Irish | 260 | 0.5% |
| Scottish | 765 | 1.4% |
| Slovak | 39 | 0.1% |
| South American | 301 | 0.5% |
| Spaniard | 20 | 0.0% |
| Sri Lankan | 50 | 0.1% |
| Subsaharan African | 645 | 1.2% |
| Swedish | 295 | 0.5% |
| Swiss | 114 | 0.2% |
| Thai | 75 | 0.1% |
| Turkish | 22 | 0.0% |
| U.S. Virgin Islander | 48 | 0.1% |
| Ukrainian | 187 | 0.3% |
| Welsh | 147 | 0.3% |
| West Indian | 56 | 0.1% |
| Yugoslavian | 31 | 0.1% | View All 84 Rows |
Immigrants in Chicopee
The most numerous immigrant groups reported in Chicopee came from Europe (2,064 | 3.7%), Eastern Europe (1,451 | 2.6%), Asia (1,395 | 2.5%), Poland (995 | 1.8%), and Latin America (759 | 1.4%), together accounting for 12.0% of all Chicopee residents.
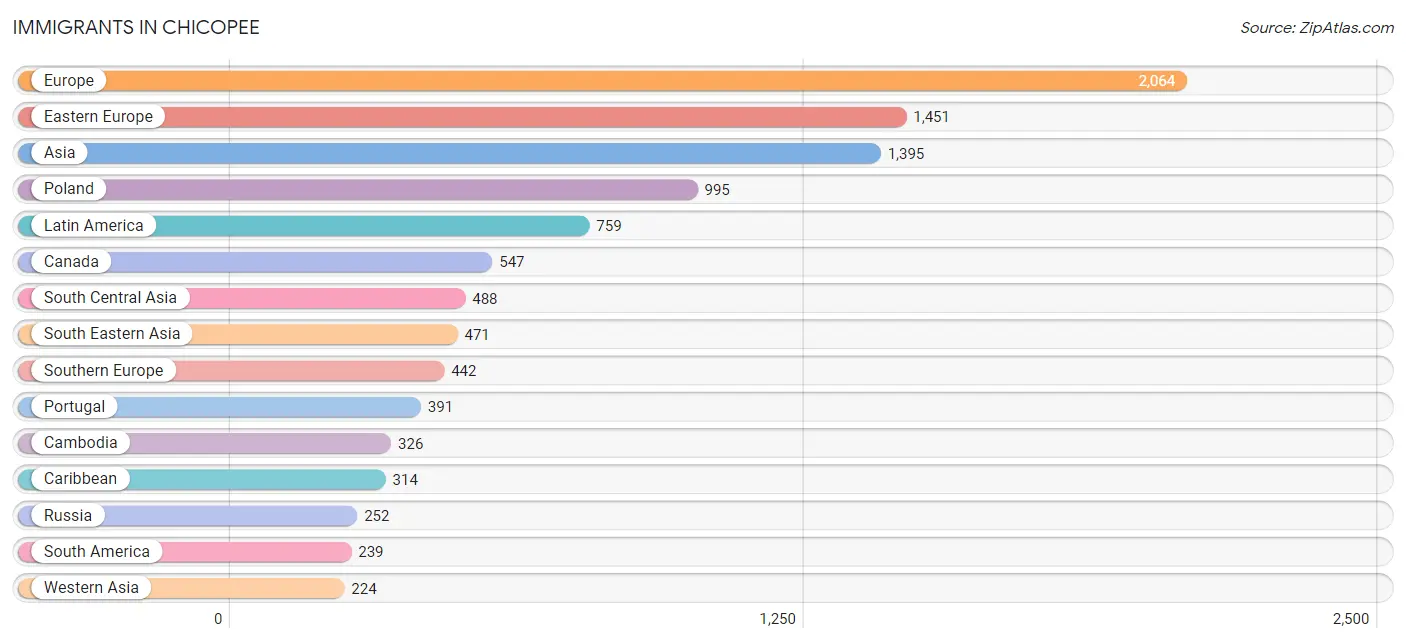
| Immigration Origin | # Population | % Population |
| Africa | 196 | 0.4% |
| Asia | 1,395 | 2.5% |
| Barbados | 21 | 0.0% |
| Belgium | 9 | 0.0% |
| Brazil | 18 | 0.0% |
| Bulgaria | 18 | 0.0% |
| Cambodia | 326 | 0.6% |
| Cameroon | 66 | 0.1% |
| Canada | 547 | 1.0% |
| Caribbean | 314 | 0.6% |
| Central America | 206 | 0.4% |
| China | 155 | 0.3% |
| Colombia | 116 | 0.2% |
| Costa Rica | 25 | 0.1% |
| Cuba | 24 | 0.0% |
| Czechoslovakia | 16 | 0.0% |
| Dominican Republic | 210 | 0.4% |
| Eastern Africa | 23 | 0.0% |
| Eastern Asia | 212 | 0.4% |
| Eastern Europe | 1,451 | 2.6% |
| Ecuador | 9 | 0.0% |
| Egypt | 15 | 0.0% |
| El Salvador | 119 | 0.2% |
| England | 28 | 0.1% |
| Europe | 2,064 | 3.7% |
| France | 12 | 0.0% |
| Germany | 47 | 0.1% |
| Ghana | 15 | 0.0% |
| Greece | 49 | 0.1% |
| Haiti | 18 | 0.0% |
| Honduras | 62 | 0.1% |
| India | 33 | 0.1% |
| Iraq | 170 | 0.3% |
| Ireland | 21 | 0.0% |
| Italy | 2 | 0.0% |
| Jamaica | 25 | 0.1% |
| Japan | 57 | 0.1% |
| Kazakhstan | 77 | 0.1% |
| Latin America | 759 | 1.4% |
| Lebanon | 32 | 0.1% |
| Middle Africa | 66 | 0.1% |
| Moldova | 33 | 0.1% |
| Netherlands | 12 | 0.0% |
| Nigeria | 44 | 0.1% |
| Northern Africa | 15 | 0.0% |
| Northern Europe | 82 | 0.2% |
| Pakistan | 217 | 0.4% |
| Peru | 96 | 0.2% |
| Philippines | 50 | 0.1% |
| Poland | 995 | 1.8% |
| Portugal | 391 | 0.7% |
| Romania | 1 | 0.0% |
| Russia | 252 | 0.4% |
| South America | 239 | 0.4% |
| South Central Asia | 488 | 0.9% |
| South Eastern Asia | 471 | 0.9% |
| Southern Europe | 442 | 0.8% |
| Taiwan | 23 | 0.0% |
| Thailand | 56 | 0.1% |
| Turkey | 22 | 0.0% |
| Ukraine | 87 | 0.2% |
| Vietnam | 39 | 0.1% |
| West Indies | 16 | 0.0% |
| Western Africa | 92 | 0.2% |
| Western Asia | 224 | 0.4% |
| Western Europe | 89 | 0.2% | View All 66 Rows |
Sex and Age in Chicopee
Sex and Age in Chicopee
The most populous age groups in Chicopee are 15 to 19 Years (2,294 | 8.5%) for men and 35 to 39 Years (2,173 | 7.6%) for women.
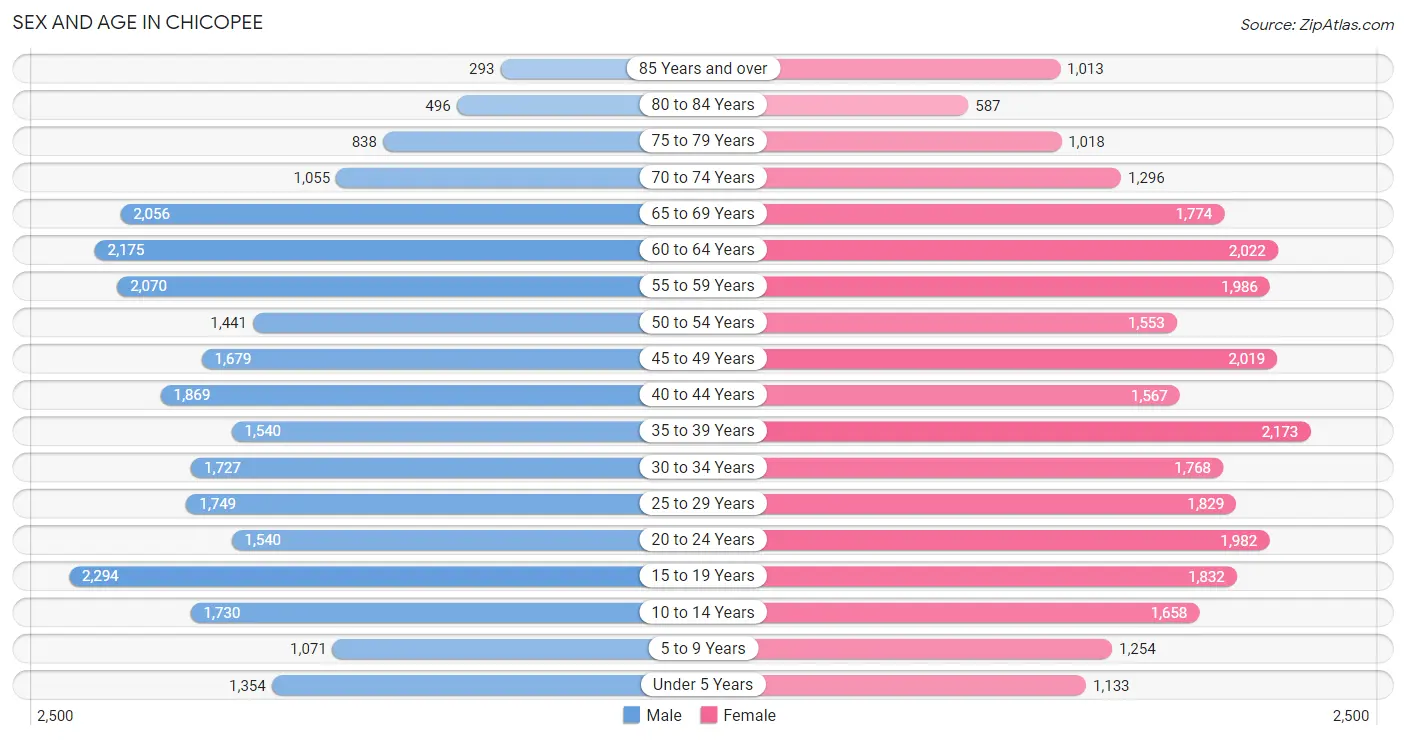
| Age Bracket | Male | Female |
| Under 5 Years | 1,354 (5.0%) | 1,133 (4.0%) |
| 5 to 9 Years | 1,071 (4.0%) | 1,254 (4.4%) |
| 10 to 14 Years | 1,730 (6.4%) | 1,658 (5.8%) |
| 15 to 19 Years | 2,294 (8.5%) | 1,832 (6.4%) |
| 20 to 24 Years | 1,540 (5.7%) | 1,982 (7.0%) |
| 25 to 29 Years | 1,749 (6.5%) | 1,829 (6.4%) |
| 30 to 34 Years | 1,727 (6.4%) | 1,768 (6.2%) |
| 35 to 39 Years | 1,540 (5.7%) | 2,173 (7.6%) |
| 40 to 44 Years | 1,869 (6.9%) | 1,567 (5.5%) |
| 45 to 49 Years | 1,679 (6.2%) | 2,019 (7.1%) |
| 50 to 54 Years | 1,441 (5.3%) | 1,553 (5.5%) |
| 55 to 59 Years | 2,070 (7.7%) | 1,986 (7.0%) |
| 60 to 64 Years | 2,175 (8.1%) | 2,022 (7.1%) |
| 65 to 69 Years | 2,056 (7.6%) | 1,774 (6.2%) |
| 70 to 74 Years | 1,055 (3.9%) | 1,296 (4.5%) |
| 75 to 79 Years | 838 (3.1%) | 1,018 (3.6%) |
| 80 to 84 Years | 496 (1.8%) | 587 (2.1%) |
| 85 Years and over | 293 (1.1%) | 1,013 (3.6%) |
| Total | 26,977 (100.0%) | 28,464 (100.0%) |
Families and Households in Chicopee
Median Family Size in Chicopee
The median family size in Chicopee is 2.93 persons per family, with single female/mother families (4,002 | 28.9%) accounting for the largest median family size of 3.03 persons per family. On the other hand, single male/father families (1,509 | 10.9%) represent the smallest median family size with 2.42 persons per family.
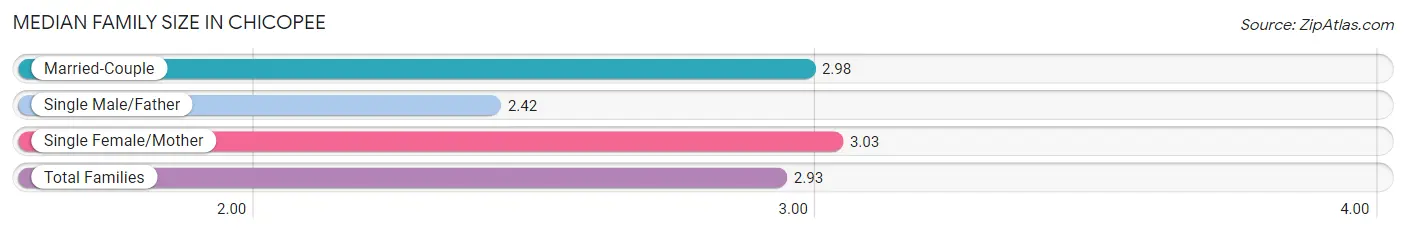
| Family Type | # Families | Family Size |
| Married-Couple | 8,312 (60.1%) | 2.98 |
| Single Male/Father | 1,509 (10.9%) | 2.42 |
| Single Female/Mother | 4,002 (28.9%) | 3.03 |
| Total Families | 13,823 (100.0%) | 2.93 |
Median Household Size in Chicopee
The median household size in Chicopee is 2.29 persons per household, with single female/mother households (4,002 | 16.9%) accounting for the largest median household size of 3.28 persons per household. non-family households (9,909 | 41.7%) represent the smallest median household size with 1.20 persons per household.
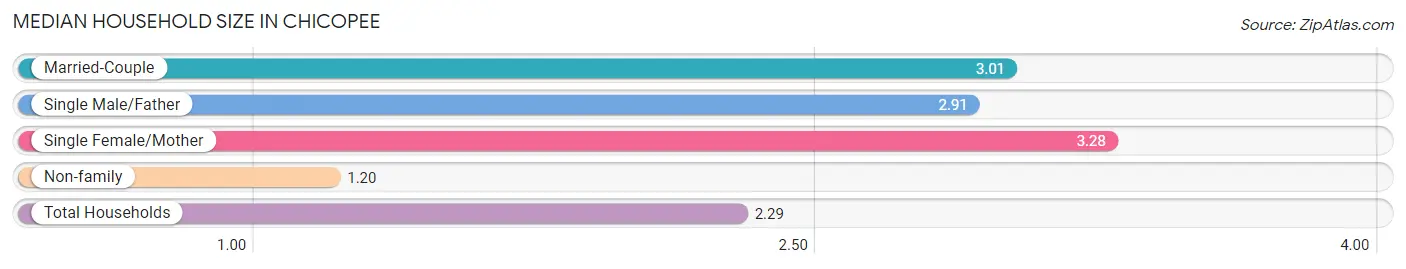
| Household Type | # Households | Household Size |
| Married-Couple | 8,312 (35.0%) | 3.01 |
| Single Male/Father | 1,509 (6.4%) | 2.91 |
| Single Female/Mother | 4,002 (16.9%) | 3.28 |
| Non-family | 9,909 (41.7%) | 1.20 |
| Total Households | 23,732 (100.0%) | 2.29 |
Household Size by Marriage Status in Chicopee
Out of a total of 23,732 households in Chicopee, 13,823 (58.3%) are family households, while 9,909 (41.7%) are nonfamily households. The most numerous type of family households are 2-person households, comprising 6,120, and the most common type of nonfamily households are 1-person households, comprising 8,230.
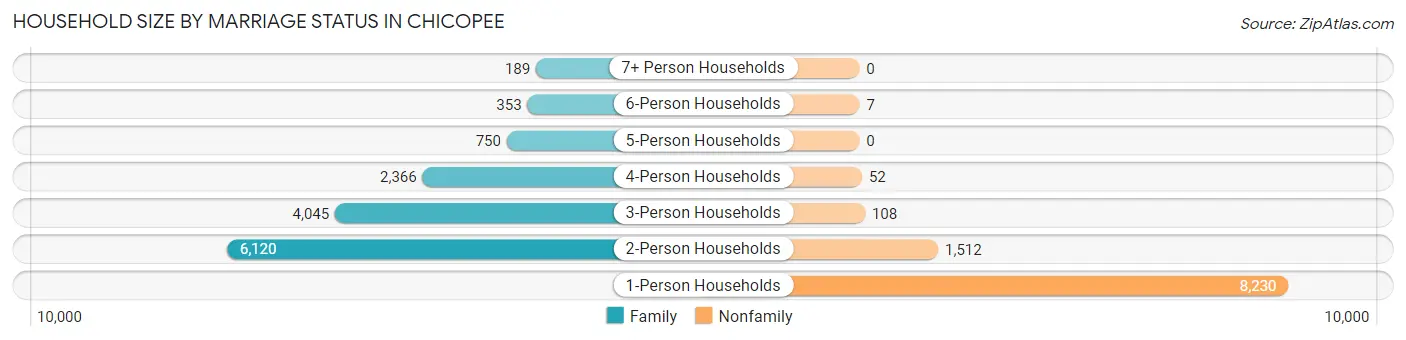
| Household Size | Family Households | Nonfamily Households |
| 1-Person Households | - | 8,230 (34.7%) |
| 2-Person Households | 6,120 (25.8%) | 1,512 (6.4%) |
| 3-Person Households | 4,045 (17.0%) | 108 (0.5%) |
| 4-Person Households | 2,366 (10.0%) | 52 (0.2%) |
| 5-Person Households | 750 (3.2%) | 0 (0.0%) |
| 6-Person Households | 353 (1.5%) | 7 (0.0%) |
| 7+ Person Households | 189 (0.8%) | 0 (0.0%) |
| Total | 13,823 (58.3%) | 9,909 (41.7%) |
Female Fertility in Chicopee
Fertility by Age in Chicopee
Average fertility rate in Chicopee is 43.0 births per 1,000 women. Women in the age bracket of 20 to 34 years have the highest fertility rate with 53.0 births per 1,000 women. Women in the age bracket of 20 to 34 years acount for 50.1% of all women with births.
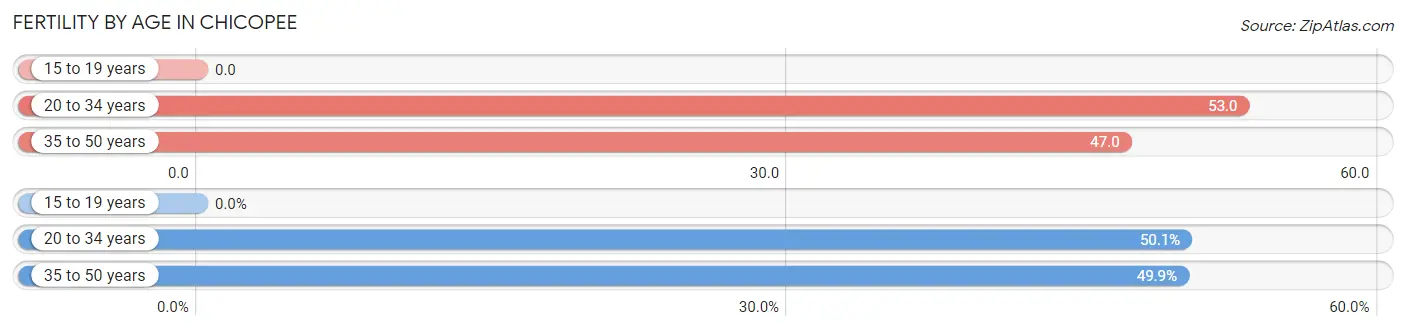
| Age Bracket | Women with Births | Births / 1,000 Women |
| 15 to 19 years | 0 (0.0%) | 0.0 |
| 20 to 34 years | 295 (50.1%) | 53.0 |
| 35 to 50 years | 294 (49.9%) | 47.0 |
| Total | 589 (100.0%) | 43.0 |
Fertility by Age by Marriage Status in Chicopee
61.1% of women with births (589) in Chicopee are married. The highest percentage of unmarried women with births falls into 20 to 34 years age bracket with 55.2% of them unmarried at the time of birth, while the lowest percentage of unmarried women with births belong to 35 to 50 years age bracket with 22.5% of them unmarried.
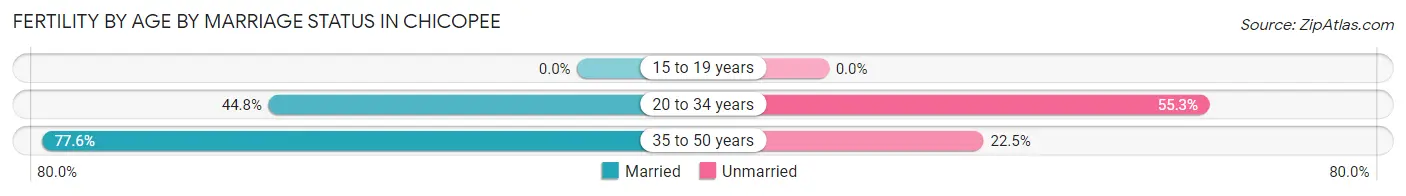
| Age Bracket | Married | Unmarried |
| 15 to 19 years | 0 (0.0%) | 0 (0.0%) |
| 20 to 34 years | 132 (44.8%) | 163 (55.2%) |
| 35 to 50 years | 228 (77.5%) | 66 (22.5%) |
| Total | 360 (61.1%) | 229 (38.9%) |
Fertility by Education in Chicopee
Average fertility rate in Chicopee is 43.0 births per 1,000 women. Women with the education attainment of less than high school have the highest fertility rate of 67.0 births per 1,000 women, while women with the education attainment of college or associate's degree have the lowest fertility at 27.0 births per 1,000 women. Women with the education attainment of less than high school represent 26.0% of all women with births.
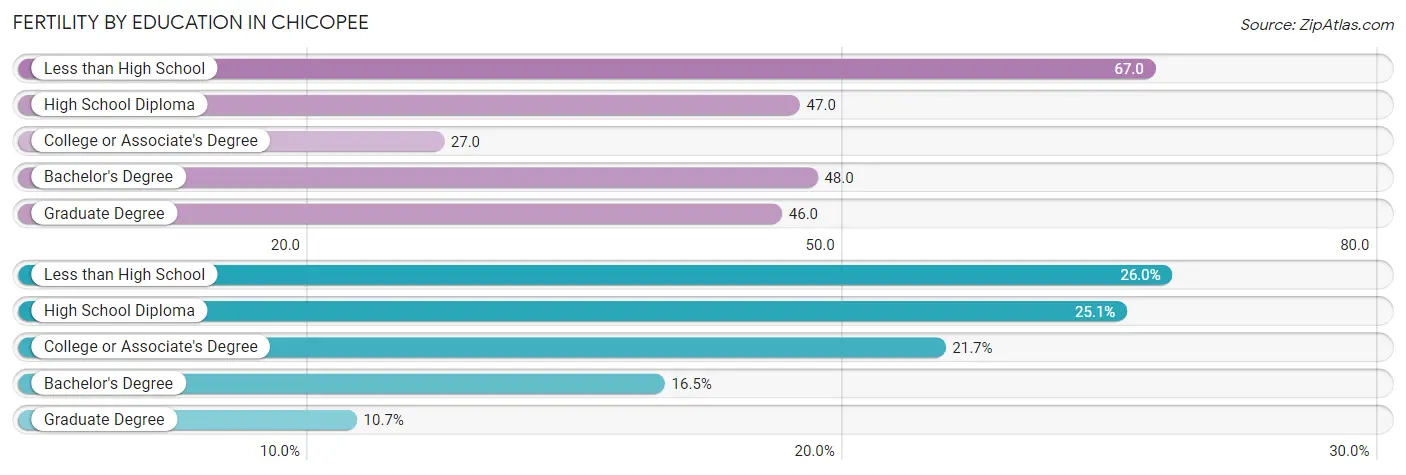
| Educational Attainment | Women with Births | Births / 1,000 Women |
| Less than High School | 153 (26.0%) | 67.0 |
| High School Diploma | 148 (25.1%) | 47.0 |
| College or Associate's Degree | 128 (21.7%) | 27.0 |
| Bachelor's Degree | 97 (16.5%) | 48.0 |
| Graduate Degree | 63 (10.7%) | 46.0 |
| Total | 589 (100.0%) | 43.0 |
Fertility by Education by Marriage Status in Chicopee
38.9% of women with births in Chicopee are unmarried. Women with the educational attainment of graduate degree are most likely to be married with 100.0% of them married at childbirth, while women with the educational attainment of high school diploma are least likely to be married with 100.0% of them unmarried at childbirth.
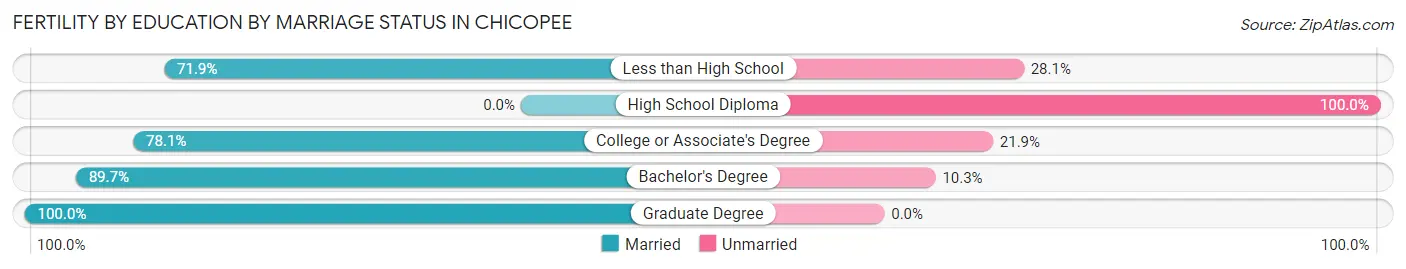
| Educational Attainment | Married | Unmarried |
| Less than High School | 110 (71.9%) | 43 (28.1%) |
| High School Diploma | 0 (0.0%) | 148 (100.0%) |
| College or Associate's Degree | 100 (78.1%) | 28 (21.9%) |
| Bachelor's Degree | 87 (89.7%) | 10 (10.3%) |
| Graduate Degree | 63 (100.0%) | 0 (0.0%) |
| Total | 360 (61.1%) | 229 (38.9%) |
Employment Characteristics in Chicopee
Employment by Class of Employer in Chicopee
Among the 26,403 employed individuals in Chicopee, private company employees (17,460 | 66.1%), not-for-profit organizations (3,065 | 11.6%), and local government employees (2,101 | 8.0%) make up the most common classes of employment.
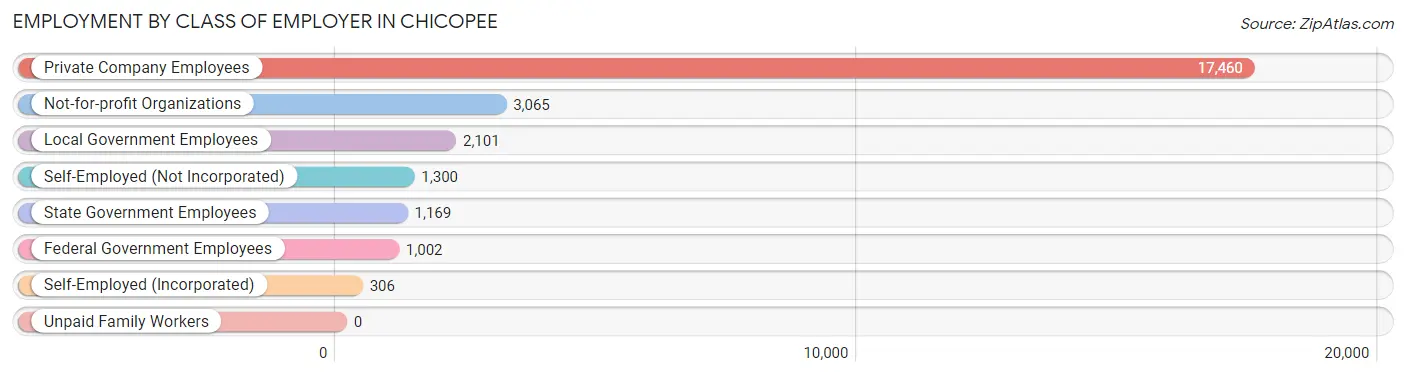
| Employer Class | # Employees | % Employees |
| Private Company Employees | 17,460 | 66.1% |
| Self-Employed (Incorporated) | 306 | 1.2% |
| Self-Employed (Not Incorporated) | 1,300 | 4.9% |
| Not-for-profit Organizations | 3,065 | 11.6% |
| Local Government Employees | 2,101 | 8.0% |
| State Government Employees | 1,169 | 4.4% |
| Federal Government Employees | 1,002 | 3.8% |
| Unpaid Family Workers | 0 | 0.0% |
| Total | 26,403 | 100.0% |
Employment Status by Age in Chicopee
According to the labor force statistics for Chicopee, out of the total population over 16 years of age (46,516), 61.4% or 28,561 individuals are in the labor force, with 6.1% or 1,742 of them unemployed. The age group with the highest labor force participation rate is 25 to 29 years, with 88.6% or 3,170 individuals in the labor force. Within the labor force, the 16 to 19 years age range has the highest percentage of unemployed individuals, with 26.9% or 304 of them being unemployed.
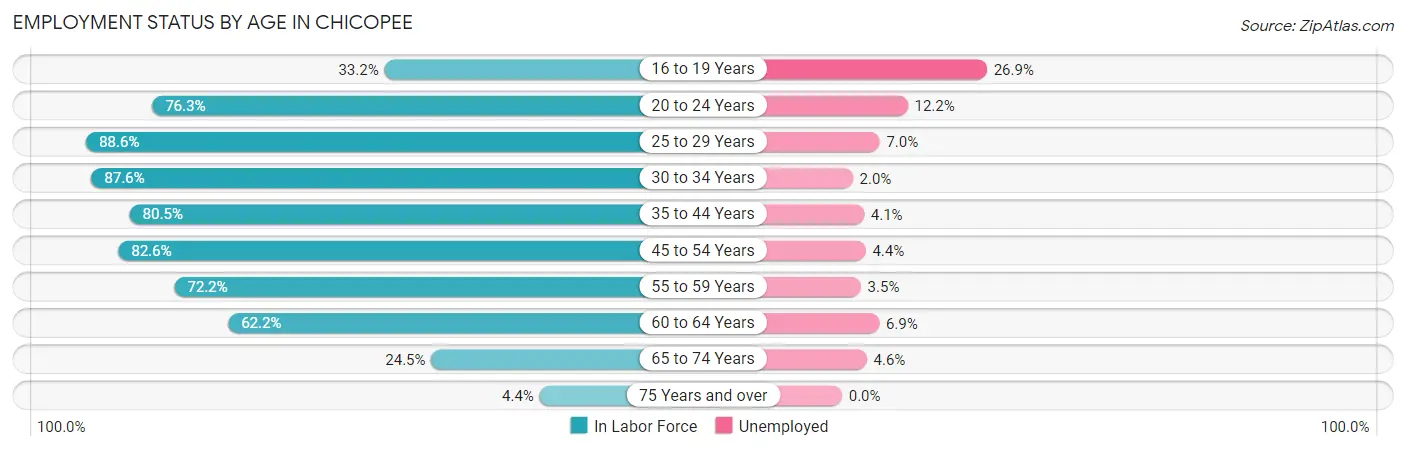
| Age Bracket | In Labor Force | Unemployed |
| 16 to 19 Years | 1,129 (33.2%) | 304 (26.9%) |
| 20 to 24 Years | 2,687 (76.3%) | 328 (12.2%) |
| 25 to 29 Years | 3,170 (88.6%) | 222 (7.0%) |
| 30 to 34 Years | 3,062 (87.6%) | 61 (2.0%) |
| 35 to 44 Years | 5,755 (80.5%) | 236 (4.1%) |
| 45 to 54 Years | 5,528 (82.6%) | 243 (4.4%) |
| 55 to 59 Years | 2,928 (72.2%) | 102 (3.5%) |
| 60 to 64 Years | 2,611 (62.2%) | 180 (6.9%) |
| 65 to 74 Years | 1,514 (24.5%) | 70 (4.6%) |
| 75 Years and over | 187 (4.4%) | 0 (0.0%) |
| Total | 28,561 (61.4%) | 1,742 (6.1%) |
Employment Status by Educational Attainment in Chicopee
According to labor force statistics for Chicopee, 79.0% of individuals (23,042) out of the total population between 25 and 64 years of age (29,167) are in the labor force, with 4.5% or 1,037 of them being unemployed. The group with the highest labor force participation rate are those with the educational attainment of bachelor's degree or higher, with 90.4% or 6,406 individuals in the labor force. Within the labor force, individuals with less than high school education have the highest percentage of unemployment, with 7.5% or 129 of them being unemployed.
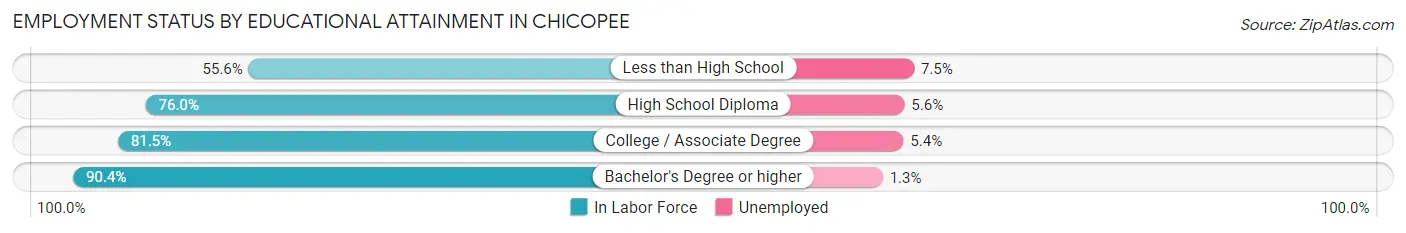
| Educational Attainment | In Labor Force | Unemployed |
| Less than High School | 1,725 (55.6%) | 233 (7.5%) |
| High School Diploma | 7,616 (76.0%) | 561 (5.6%) |
| College / Associate Degree | 7,301 (81.5%) | 484 (5.4%) |
| Bachelor's Degree or higher | 6,406 (90.4%) | 92 (1.3%) |
| Total | 23,042 (79.0%) | 1,313 (4.5%) |
Employment Occupations by Sex in Chicopee
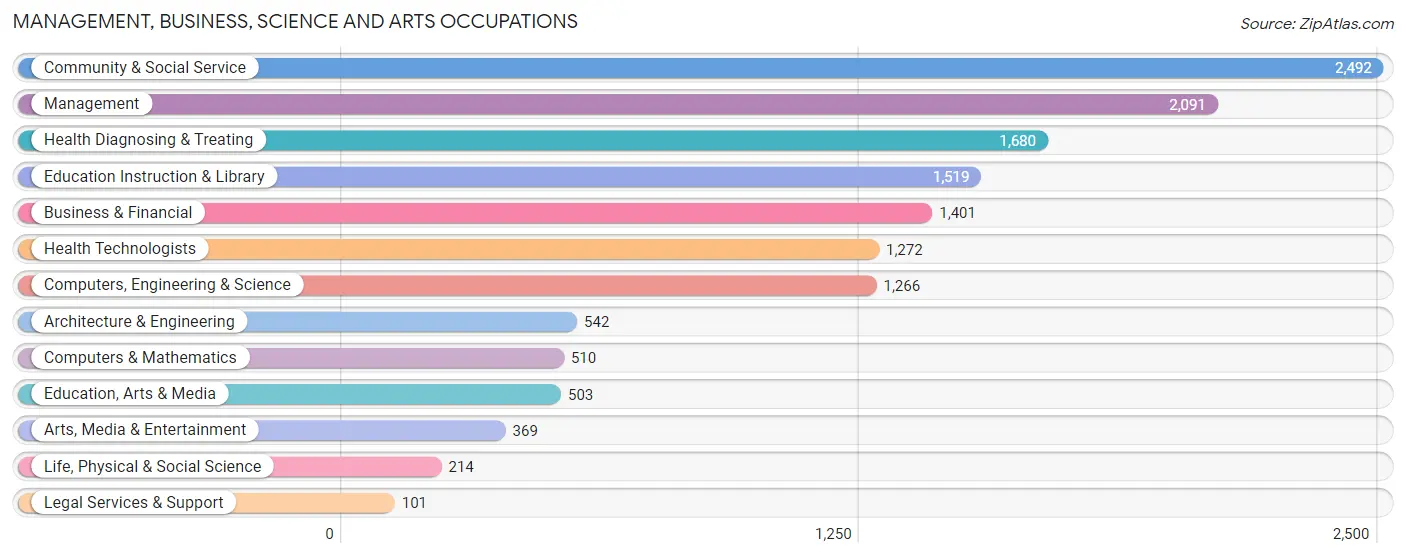
Management, Business, Science and Arts Occupations
The most common Management, Business, Science and Arts occupations in Chicopee are Community & Social Service (2,492 | 9.4%), Management (2,091 | 7.9%), Health Diagnosing & Treating (1,680 | 6.3%), Education Instruction & Library (1,519 | 5.7%), and Business & Financial (1,401 | 5.3%).
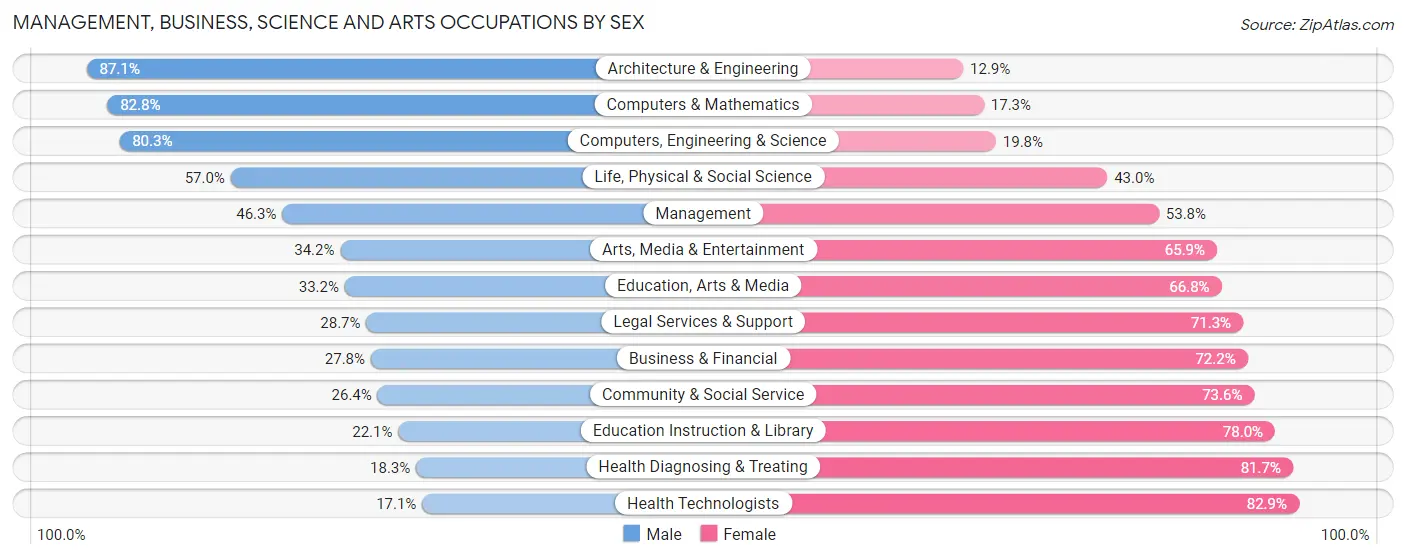
Management, Business, Science and Arts Occupations by Sex
Within the Management, Business, Science and Arts occupations in Chicopee, the most male-oriented occupations are Architecture & Engineering (87.1%), Computers & Mathematics (82.8%), and Computers, Engineering & Science (80.2%), while the most female-oriented occupations are Health Technologists (82.9%), Health Diagnosing & Treating (81.7%), and Education Instruction & Library (77.9%).
| Occupation | Male | Female |
| Management | 967 (46.3%) | 1,124 (53.7%) |
| Business & Financial | 389 (27.8%) | 1,012 (72.2%) |
| Computers, Engineering & Science | 1,016 (80.2%) | 250 (19.8%) |
| Computers & Mathematics | 422 (82.8%) | 88 (17.2%) |
| Architecture & Engineering | 472 (87.1%) | 70 (12.9%) |
| Life, Physical & Social Science | 122 (57.0%) | 92 (43.0%) |
| Community & Social Service | 657 (26.4%) | 1,835 (73.6%) |
| Education, Arts & Media | 167 (33.2%) | 336 (66.8%) |
| Legal Services & Support | 29 (28.7%) | 72 (71.3%) |
| Education Instruction & Library | 335 (22.1%) | 1,184 (77.9%) |
| Arts, Media & Entertainment | 126 (34.2%) | 243 (65.8%) |
| Health Diagnosing & Treating | 308 (18.3%) | 1,372 (81.7%) |
| Health Technologists | 217 (17.1%) | 1,055 (82.9%) |
| Total (Category) | 3,337 (37.4%) | 5,593 (62.6%) |
| Total (Overall) | 13,518 (50.8%) | 13,108 (49.2%) |
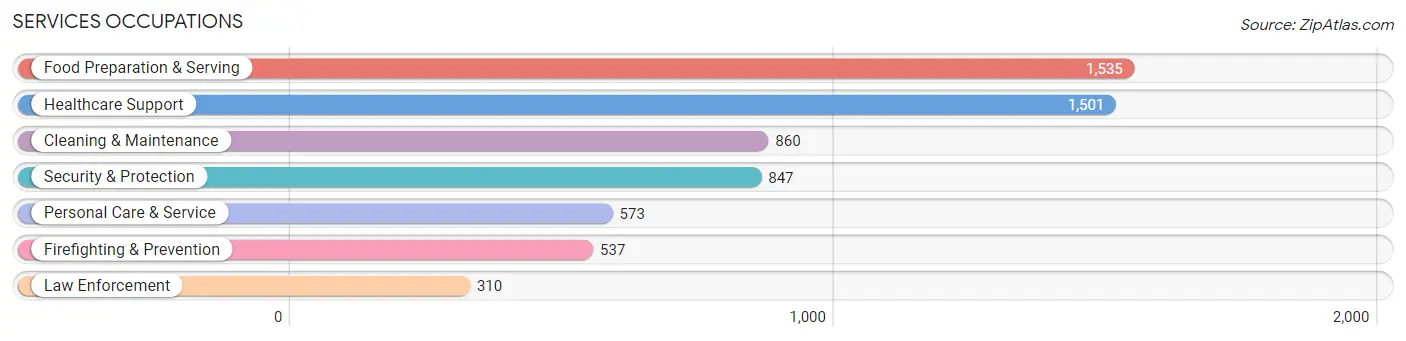
Services Occupations
The most common Services occupations in Chicopee are Food Preparation & Serving (1,535 | 5.8%), Healthcare Support (1,501 | 5.6%), Cleaning & Maintenance (860 | 3.2%), Security & Protection (847 | 3.2%), and Personal Care & Service (573 | 2.1%).
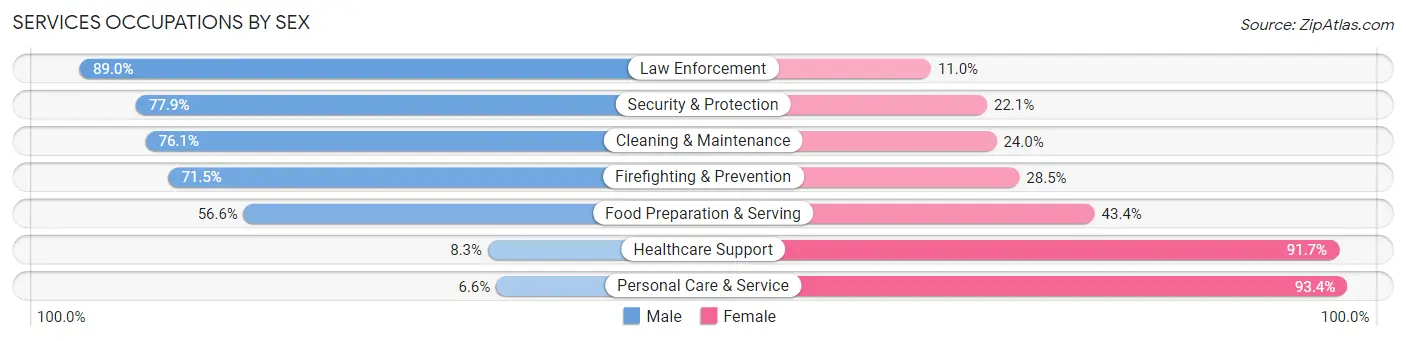
Services Occupations by Sex
Within the Services occupations in Chicopee, the most male-oriented occupations are Law Enforcement (89.0%), Security & Protection (77.9%), and Cleaning & Maintenance (76.0%), while the most female-oriented occupations are Personal Care & Service (93.4%), Healthcare Support (91.7%), and Food Preparation & Serving (43.4%).
| Occupation | Male | Female |
| Healthcare Support | 124 (8.3%) | 1,377 (91.7%) |
| Security & Protection | 660 (77.9%) | 187 (22.1%) |
| Firefighting & Prevention | 384 (71.5%) | 153 (28.5%) |
| Law Enforcement | 276 (89.0%) | 34 (11.0%) |
| Food Preparation & Serving | 869 (56.6%) | 666 (43.4%) |
| Cleaning & Maintenance | 654 (76.0%) | 206 (23.9%) |
| Personal Care & Service | 38 (6.6%) | 535 (93.4%) |
| Total (Category) | 2,345 (44.1%) | 2,971 (55.9%) |
| Total (Overall) | 13,518 (50.8%) | 13,108 (49.2%) |
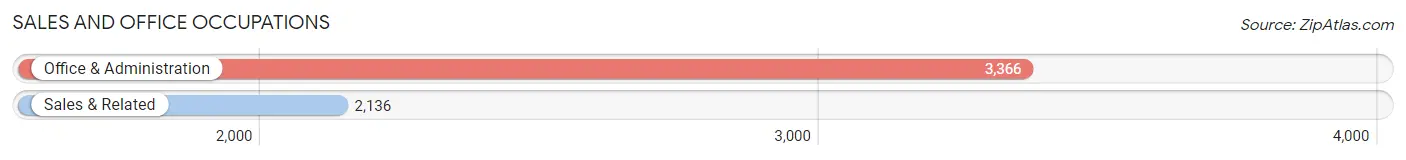
Sales and Office Occupations
The most common Sales and Office occupations in Chicopee are Office & Administration (3,366 | 12.6%), and Sales & Related (2,136 | 8.0%).
Sales and Office Occupations by Sex
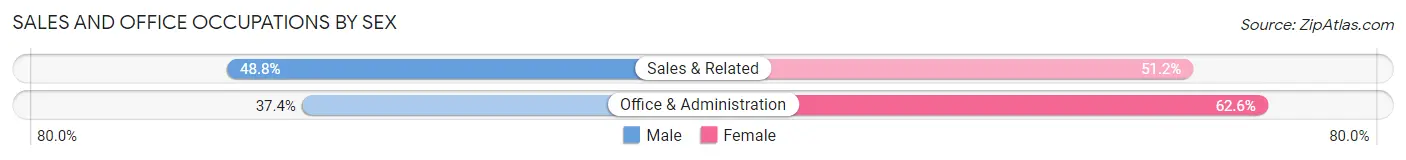
| Occupation | Male | Female |
| Sales & Related | 1,043 (48.8%) | 1,093 (51.2%) |
| Office & Administration | 1,258 (37.4%) | 2,108 (62.6%) |
| Total (Category) | 2,301 (41.8%) | 3,201 (58.2%) |
| Total (Overall) | 13,518 (50.8%) | 13,108 (49.2%) |
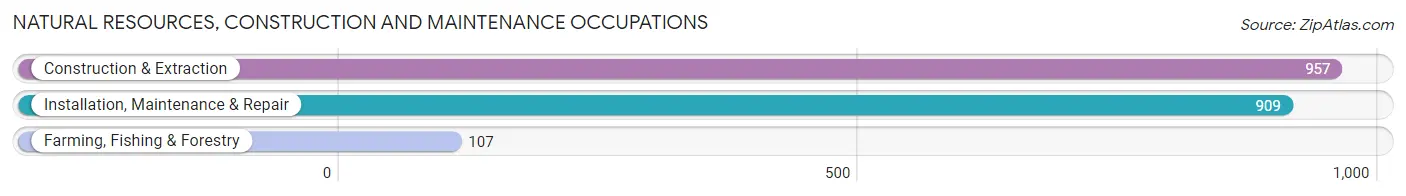
Natural Resources, Construction and Maintenance Occupations
The most common Natural Resources, Construction and Maintenance occupations in Chicopee are Construction & Extraction (957 | 3.6%), Installation, Maintenance & Repair (909 | 3.4%), and Farming, Fishing & Forestry (107 | 0.4%).
Natural Resources, Construction and Maintenance Occupations by Sex
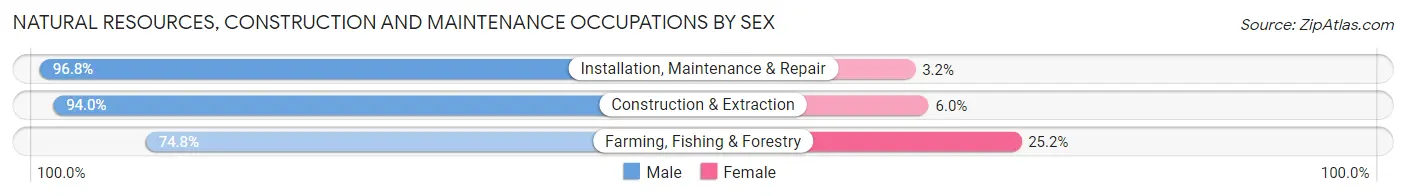
| Occupation | Male | Female |
| Farming, Fishing & Forestry | 80 (74.8%) | 27 (25.2%) |
| Construction & Extraction | 900 (94.0%) | 57 (6.0%) |
| Installation, Maintenance & Repair | 880 (96.8%) | 29 (3.2%) |
| Total (Category) | 1,860 (94.3%) | 113 (5.7%) |
| Total (Overall) | 13,518 (50.8%) | 13,108 (49.2%) |
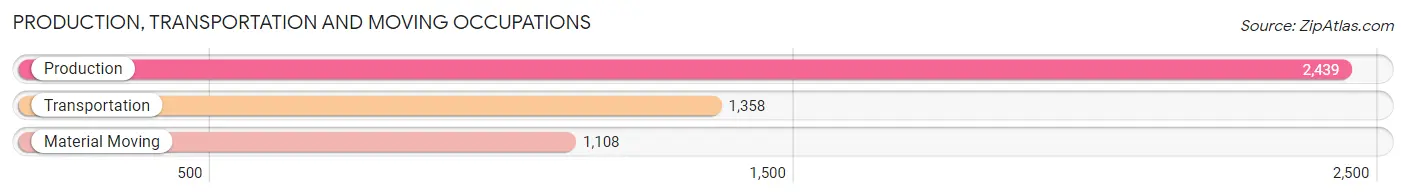
Production, Transportation and Moving Occupations
The most common Production, Transportation and Moving occupations in Chicopee are Production (2,439 | 9.2%), Transportation (1,358 | 5.1%), and Material Moving (1,108 | 4.2%).
Production, Transportation and Moving Occupations by Sex
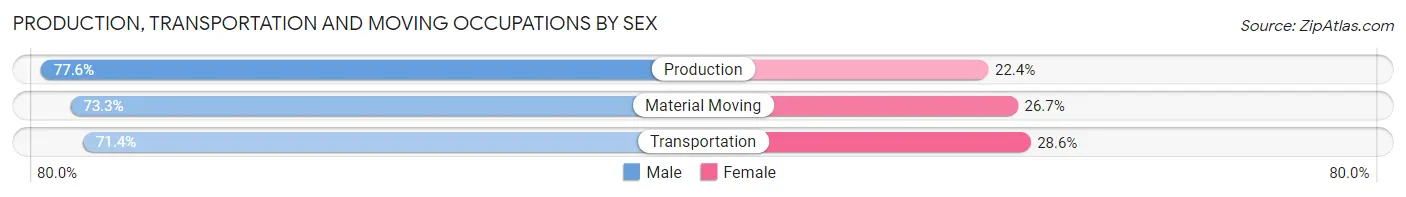
| Occupation | Male | Female |
| Production | 1,893 (77.6%) | 546 (22.4%) |
| Transportation | 970 (71.4%) | 388 (28.6%) |
| Material Moving | 812 (73.3%) | 296 (26.7%) |
| Total (Category) | 3,675 (74.9%) | 1,230 (25.1%) |
| Total (Overall) | 13,518 (50.8%) | 13,108 (49.2%) |
Employment Industries by Sex in Chicopee
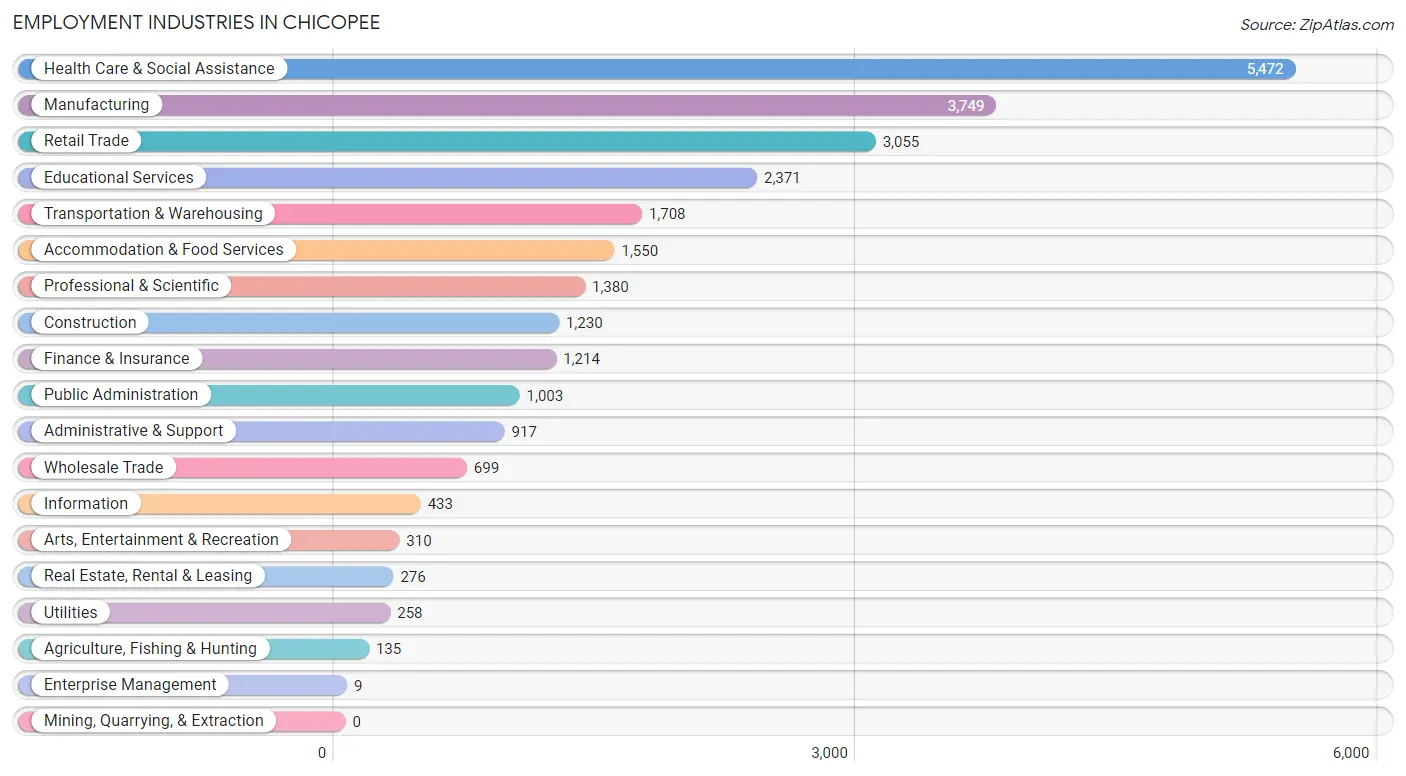
Employment Industries in Chicopee
The major employment industries in Chicopee include Health Care & Social Assistance (5,472 | 20.5%), Manufacturing (3,749 | 14.1%), Retail Trade (3,055 | 11.5%), Educational Services (2,371 | 8.9%), and Transportation & Warehousing (1,708 | 6.4%).
Employment Industries by Sex in Chicopee
The Chicopee industries that see more men than women are Enterprise Management (100.0%), Construction (86.9%), and Utilities (79.8%), whereas the industries that tend to have a higher number of women are Finance & Insurance (85.4%), Health Care & Social Assistance (79.8%), and Information (77.1%).
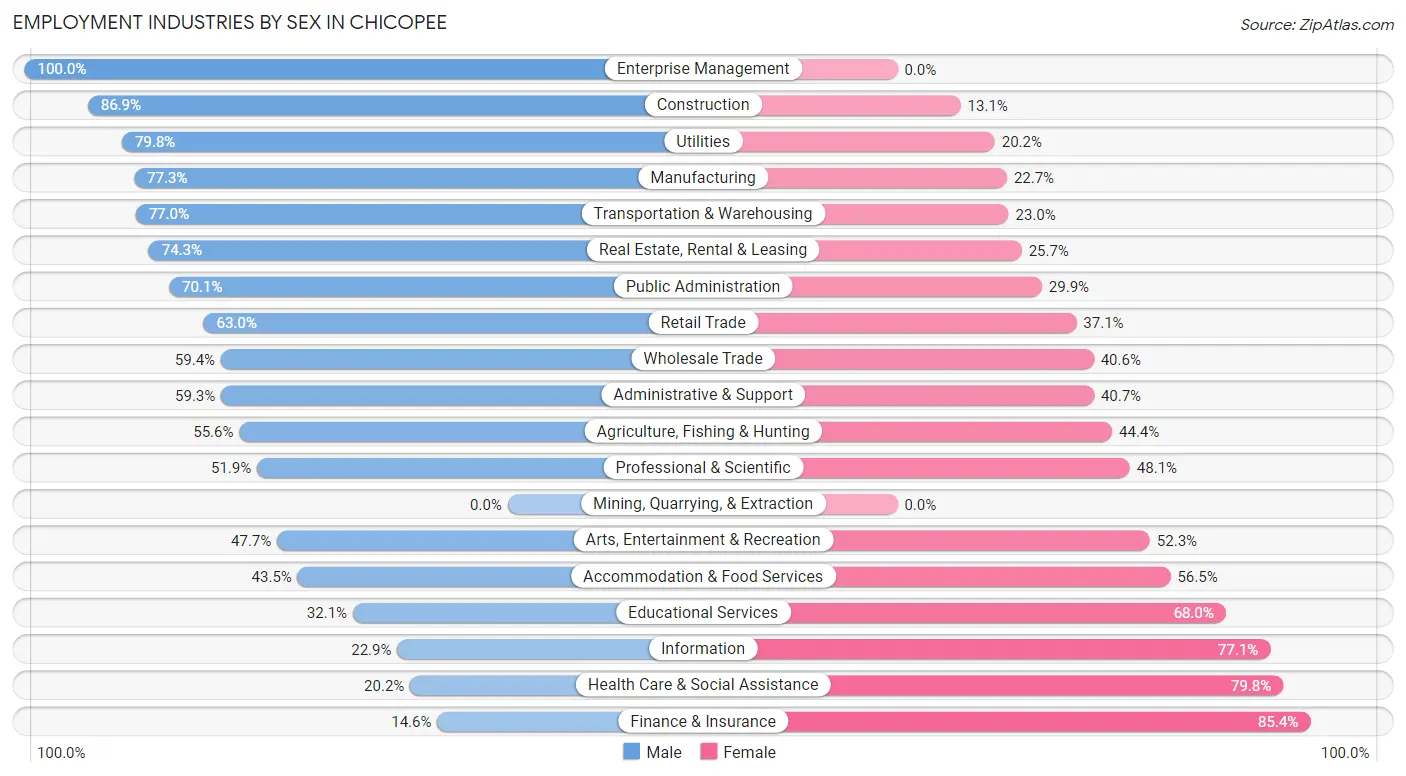
| Industry | Male | Female |
| Agriculture, Fishing & Hunting | 75 (55.6%) | 60 (44.4%) |
| Mining, Quarrying, & Extraction | 0 (0.0%) | 0 (0.0%) |
| Construction | 1,069 (86.9%) | 161 (13.1%) |
| Manufacturing | 2,899 (77.3%) | 850 (22.7%) |
| Wholesale Trade | 415 (59.4%) | 284 (40.6%) |
| Retail Trade | 1,923 (62.9%) | 1,132 (37.0%) |
| Transportation & Warehousing | 1,315 (77.0%) | 393 (23.0%) |
| Utilities | 206 (79.8%) | 52 (20.2%) |
| Information | 99 (22.9%) | 334 (77.1%) |
| Finance & Insurance | 177 (14.6%) | 1,037 (85.4%) |
| Real Estate, Rental & Leasing | 205 (74.3%) | 71 (25.7%) |
| Professional & Scientific | 716 (51.9%) | 664 (48.1%) |
| Enterprise Management | 9 (100.0%) | 0 (0.0%) |
| Administrative & Support | 544 (59.3%) | 373 (40.7%) |
| Educational Services | 760 (32.1%) | 1,611 (67.9%) |
| Health Care & Social Assistance | 1,105 (20.2%) | 4,367 (79.8%) |
| Arts, Entertainment & Recreation | 148 (47.7%) | 162 (52.3%) |
| Accommodation & Food Services | 674 (43.5%) | 876 (56.5%) |
| Public Administration | 703 (70.1%) | 300 (29.9%) |
| Total | 13,518 (50.8%) | 13,108 (49.2%) |
Education in Chicopee
School Enrollment in Chicopee
The most common levels of schooling among the 11,791 students in Chicopee are high school (3,589 | 30.4%), middle school (2,609 | 22.1%), and college / undergraduate (2,129 | 18.1%).
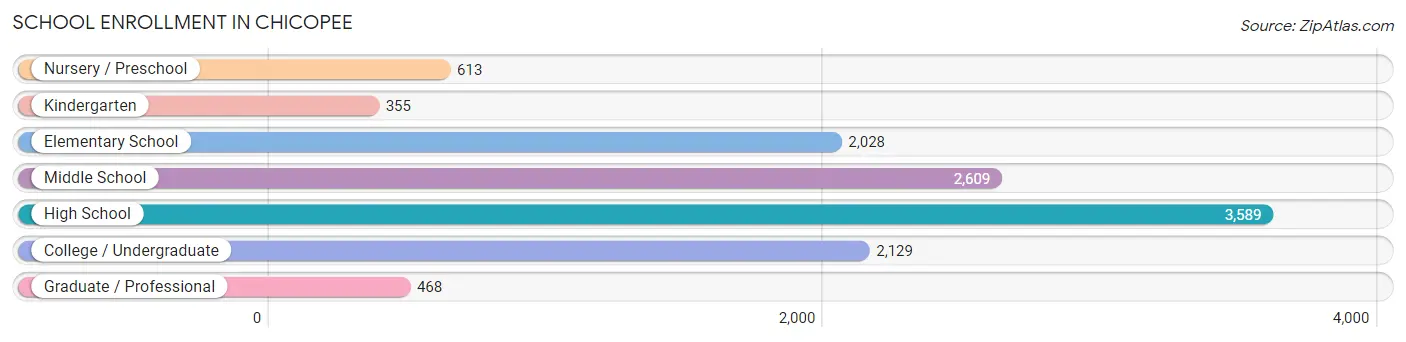
| School Level | # Students | % Students |
| Nursery / Preschool | 613 | 5.2% |
| Kindergarten | 355 | 3.0% |
| Elementary School | 2,028 | 17.2% |
| Middle School | 2,609 | 22.1% |
| High School | 3,589 | 30.4% |
| College / Undergraduate | 2,129 | 18.1% |
| Graduate / Professional | 468 | 4.0% |
| Total | 11,791 | 100.0% |
School Enrollment by Age by Funding Source in Chicopee
Out of a total of 11,791 students who are enrolled in schools in Chicopee, 2,382 (20.2%) attend a private institution, while the remaining 9,409 (79.8%) are enrolled in public schools. The age group of 20 to 24 year olds has the highest likelihood of being enrolled in private schools, with 641 (45.3% in the age bracket) enrolled. Conversely, the age group of 15 to 17 year olds has the lowest likelihood of being enrolled in a private school, with 2,215 (93.0% in the age bracket) attending a public institution.
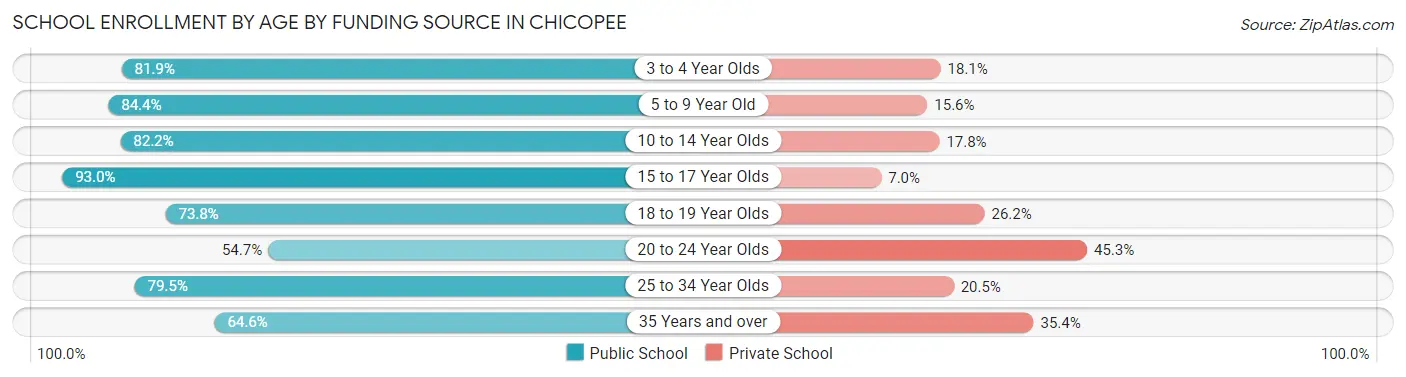
| Age Bracket | Public School | Private School |
| 3 to 4 Year Olds | 431 (81.9%) | 95 (18.1%) |
| 5 to 9 Year Old | 1,744 (84.4%) | 322 (15.6%) |
| 10 to 14 Year Olds | 2,763 (82.2%) | 600 (17.8%) |
| 15 to 17 Year Olds | 2,215 (93.0%) | 167 (7.0%) |
| 18 to 19 Year Olds | 804 (73.8%) | 286 (26.2%) |
| 20 to 24 Year Olds | 773 (54.7%) | 641 (45.3%) |
| 25 to 34 Year Olds | 326 (79.5%) | 84 (20.5%) |
| 35 Years and over | 349 (64.6%) | 191 (35.4%) |
| Total | 9,409 (79.8%) | 2,382 (20.2%) |
Educational Attainment by Field of Study in Chicopee
Business (1,910 | 20.0%), education (1,371 | 14.4%), science & technology (1,023 | 10.7%), arts & humanities (917 | 9.6%), and psychology (680 | 7.1%) are the most common fields of study among 9,541 individuals in Chicopee who have obtained a bachelor's degree or higher.
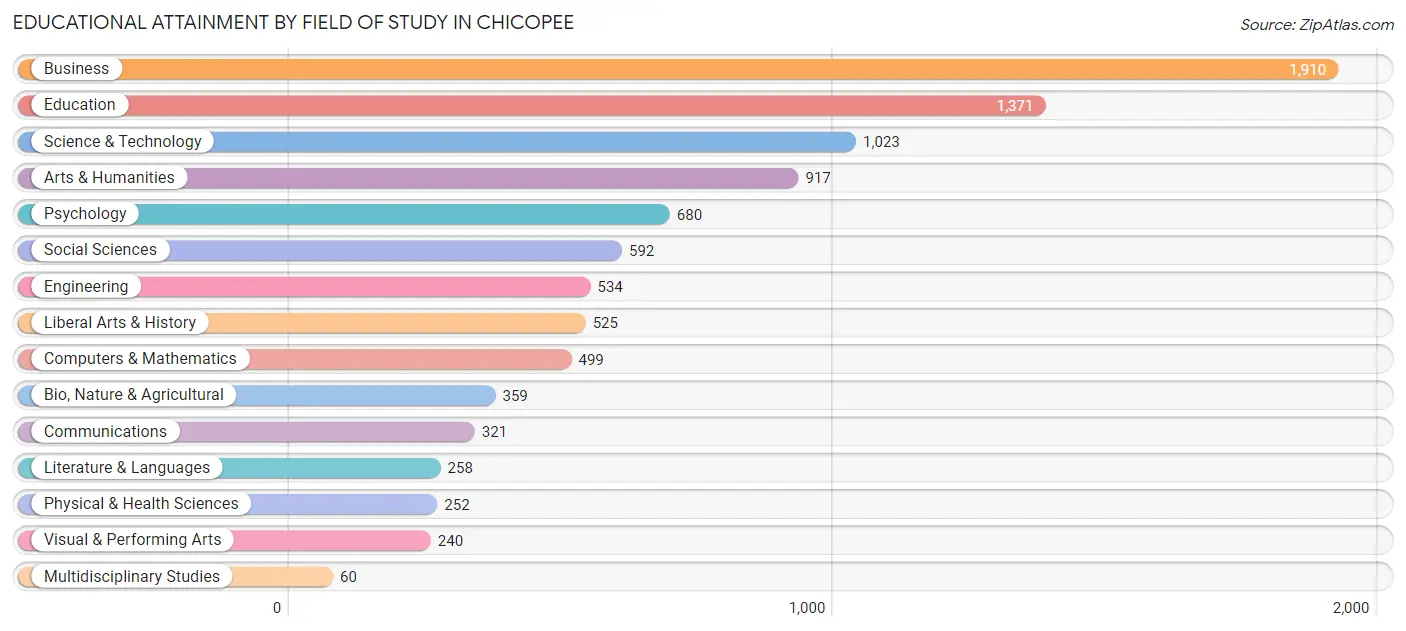
| Field of Study | # Graduates | % Graduates |
| Computers & Mathematics | 499 | 5.2% |
| Bio, Nature & Agricultural | 359 | 3.8% |
| Physical & Health Sciences | 252 | 2.6% |
| Psychology | 680 | 7.1% |
| Social Sciences | 592 | 6.2% |
| Engineering | 534 | 5.6% |
| Multidisciplinary Studies | 60 | 0.6% |
| Science & Technology | 1,023 | 10.7% |
| Business | 1,910 | 20.0% |
| Education | 1,371 | 14.4% |
| Literature & Languages | 258 | 2.7% |
| Liberal Arts & History | 525 | 5.5% |
| Visual & Performing Arts | 240 | 2.5% |
| Communications | 321 | 3.4% |
| Arts & Humanities | 917 | 9.6% |
| Total | 9,541 | 100.0% |
Transportation & Commute in Chicopee
Vehicle Availability by Sex in Chicopee
The most prevalent vehicle ownership categories in Chicopee are males with 2 vehicles (5,980, accounting for 44.6%) and females with 2 vehicles (6,341, making up 46.6%).
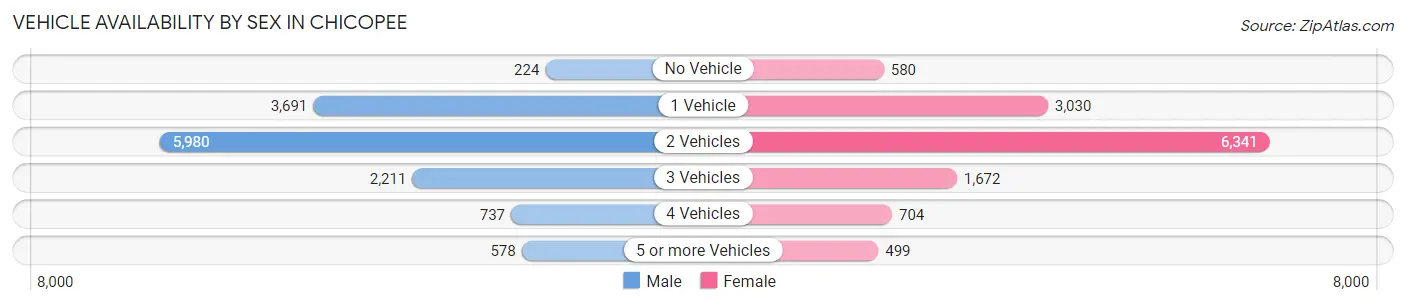
| Vehicles Available | Male | Female |
| No Vehicle | 224 (1.7%) | 580 (4.5%) |
| 1 Vehicle | 3,691 (27.5%) | 3,030 (23.6%) |
| 2 Vehicles | 5,980 (44.6%) | 6,341 (49.4%) |
| 3 Vehicles | 2,211 (16.5%) | 1,672 (13.0%) |
| 4 Vehicles | 737 (5.5%) | 704 (5.5%) |
| 5 or more Vehicles | 578 (4.3%) | 499 (3.9%) |
| Total | 13,421 (100.0%) | 12,826 (100.0%) |
Commute Time in Chicopee
The most frequently occuring commute durations in Chicopee are 15 to 19 minutes (5,284 commuters, 21.5%), 10 to 14 minutes (4,282 commuters, 17.4%), and 20 to 24 minutes (4,250 commuters, 17.3%).
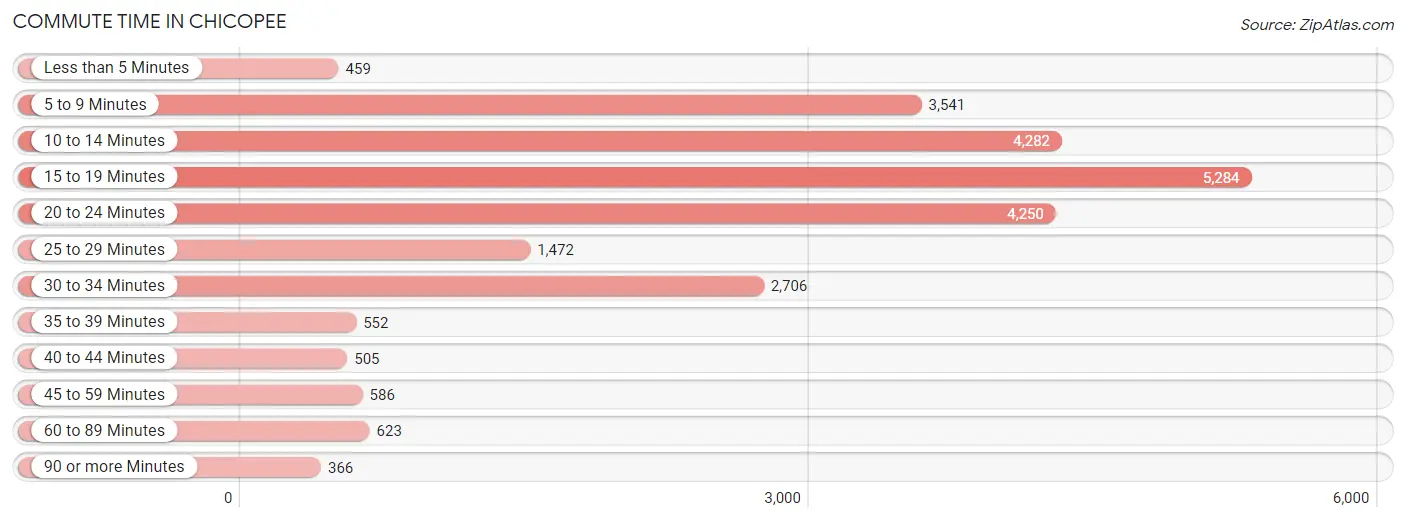
| Commute Time | # Commuters | % Commuters |
| Less than 5 Minutes | 459 | 1.9% |
| 5 to 9 Minutes | 3,541 | 14.4% |
| 10 to 14 Minutes | 4,282 | 17.4% |
| 15 to 19 Minutes | 5,284 | 21.5% |
| 20 to 24 Minutes | 4,250 | 17.3% |
| 25 to 29 Minutes | 1,472 | 6.0% |
| 30 to 34 Minutes | 2,706 | 11.0% |
| 35 to 39 Minutes | 552 | 2.2% |
| 40 to 44 Minutes | 505 | 2.1% |
| 45 to 59 Minutes | 586 | 2.4% |
| 60 to 89 Minutes | 623 | 2.5% |
| 90 or more Minutes | 366 | 1.5% |
Commute Time by Sex in Chicopee
The most common commute times in Chicopee are 15 to 19 minutes (2,387 commuters, 18.8%) for males and 15 to 19 minutes (2,897 commuters, 24.4%) for females.
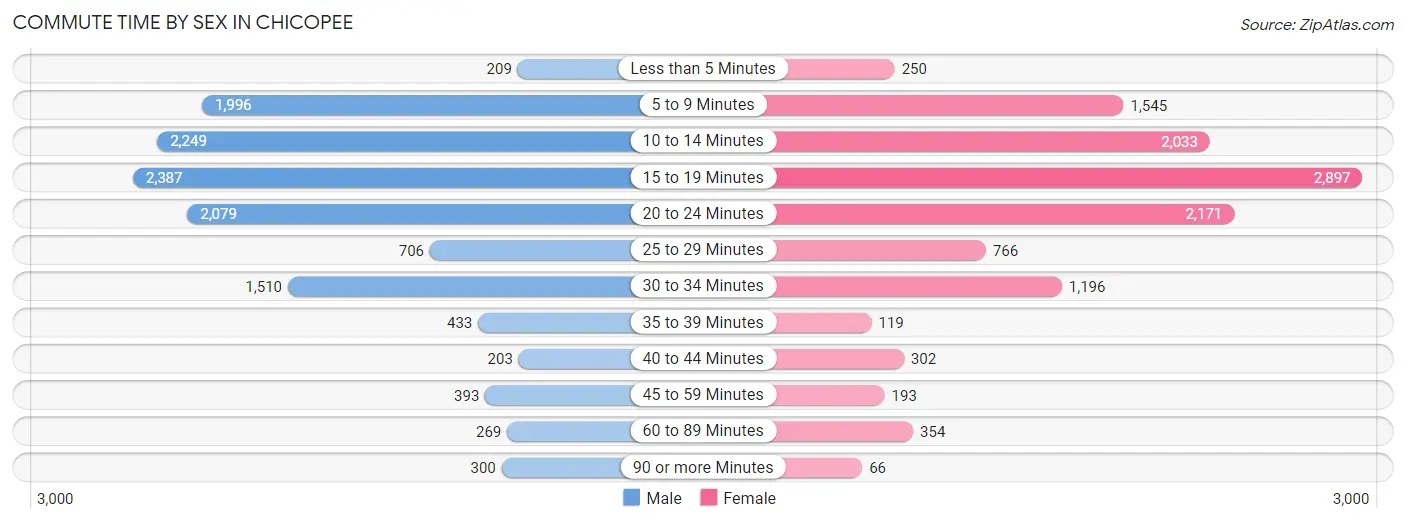
| Commute Time | Male | Female |
| Less than 5 Minutes | 209 (1.6%) | 250 (2.1%) |
| 5 to 9 Minutes | 1,996 (15.7%) | 1,545 (13.0%) |
| 10 to 14 Minutes | 2,249 (17.7%) | 2,033 (17.1%) |
| 15 to 19 Minutes | 2,387 (18.8%) | 2,897 (24.4%) |
| 20 to 24 Minutes | 2,079 (16.3%) | 2,171 (18.3%) |
| 25 to 29 Minutes | 706 (5.5%) | 766 (6.4%) |
| 30 to 34 Minutes | 1,510 (11.9%) | 1,196 (10.1%) |
| 35 to 39 Minutes | 433 (3.4%) | 119 (1.0%) |
| 40 to 44 Minutes | 203 (1.6%) | 302 (2.5%) |
| 45 to 59 Minutes | 393 (3.1%) | 193 (1.6%) |
| 60 to 89 Minutes | 269 (2.1%) | 354 (3.0%) |
| 90 or more Minutes | 300 (2.4%) | 66 (0.5%) |
Time of Departure to Work by Sex in Chicopee
The most frequent times of departure to work in Chicopee are 6:30 AM to 6:59 AM (1,840, 14.4%) for males and 7:30 AM to 7:59 AM (2,319, 19.5%) for females.
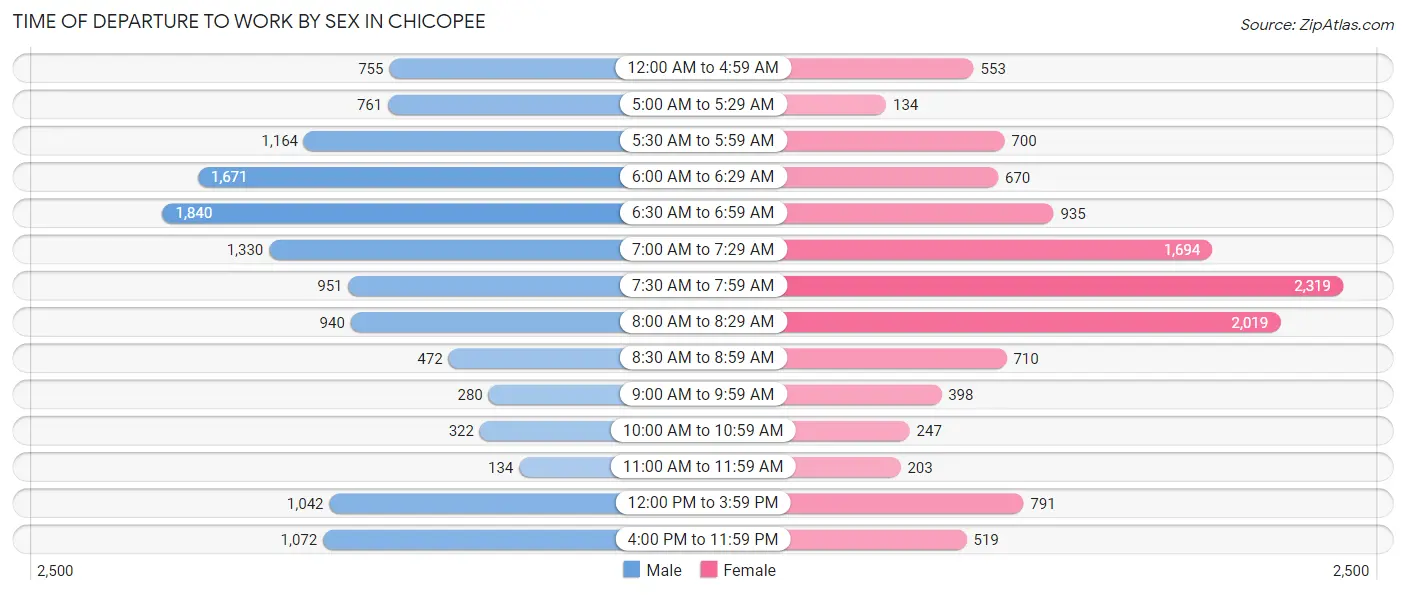
| Time of Departure | Male | Female |
| 12:00 AM to 4:59 AM | 755 (5.9%) | 553 (4.6%) |
| 5:00 AM to 5:29 AM | 761 (6.0%) | 134 (1.1%) |
| 5:30 AM to 5:59 AM | 1,164 (9.1%) | 700 (5.9%) |
| 6:00 AM to 6:29 AM | 1,671 (13.1%) | 670 (5.6%) |
| 6:30 AM to 6:59 AM | 1,840 (14.4%) | 935 (7.9%) |
| 7:00 AM to 7:29 AM | 1,330 (10.4%) | 1,694 (14.2%) |
| 7:30 AM to 7:59 AM | 951 (7.5%) | 2,319 (19.5%) |
| 8:00 AM to 8:29 AM | 940 (7.4%) | 2,019 (17.0%) |
| 8:30 AM to 8:59 AM | 472 (3.7%) | 710 (6.0%) |
| 9:00 AM to 9:59 AM | 280 (2.2%) | 398 (3.4%) |
| 10:00 AM to 10:59 AM | 322 (2.5%) | 247 (2.1%) |
| 11:00 AM to 11:59 AM | 134 (1.1%) | 203 (1.7%) |
| 12:00 PM to 3:59 PM | 1,042 (8.2%) | 791 (6.7%) |
| 4:00 PM to 11:59 PM | 1,072 (8.4%) | 519 (4.4%) |
| Total | 12,734 (100.0%) | 11,892 (100.0%) |
Housing Occupancy in Chicopee
Occupancy by Ownership in Chicopee
Of the total 23,732 dwellings in Chicopee, owner-occupied units account for 13,996 (59.0%), while renter-occupied units make up 9,736 (41.0%).
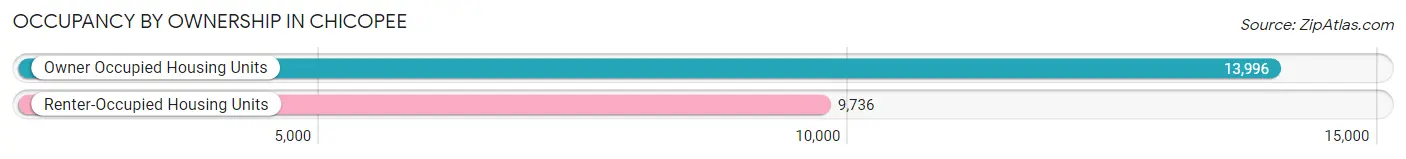
| Occupancy | # Housing Units | % Housing Units |
| Owner Occupied Housing Units | 13,996 | 59.0% |
| Renter-Occupied Housing Units | 9,736 | 41.0% |
| Total Occupied Housing Units | 23,732 | 100.0% |
Occupancy by Household Size in Chicopee
| Household Size | # Housing Units | % Housing Units |
| 1-Person Household | 8,230 | 34.7% |
| 2-Person Household | 7,632 | 32.2% |
| 3-Person Household | 4,153 | 17.5% |
| 4+ Person Household | 3,717 | 15.7% |
| Total Housing Units | 23,732 | 100.0% |
Occupancy by Ownership by Household Size in Chicopee
| Household Size | Owner-occupied | Renter-occupied |
| 1-Person Household | 3,669 (44.6%) | 4,561 (55.4%) |
| 2-Person Household | 5,320 (69.7%) | 2,312 (30.3%) |
| 3-Person Household | 2,372 (57.1%) | 1,781 (42.9%) |
| 4+ Person Household | 2,635 (70.9%) | 1,082 (29.1%) |
| Total Housing Units | 13,996 (59.0%) | 9,736 (41.0%) |
Occupancy by Educational Attainment in Chicopee
| Household Size | Owner-occupied | Renter-occupied |
| Less than High School | 1,278 (43.2%) | 1,681 (56.8%) |
| High School Diploma | 4,292 (57.9%) | 3,122 (42.1%) |
| College/Associate Degree | 4,479 (58.8%) | 3,135 (41.2%) |
| Bachelor's Degree or higher | 3,947 (68.7%) | 1,798 (31.3%) |
Occupancy by Age of Householder in Chicopee
| Age Bracket | # Households | % Households |
| Under 35 Years | 3,773 | 15.9% |
| 35 to 44 Years | 3,792 | 16.0% |
| 45 to 54 Years | 4,073 | 17.2% |
| 55 to 64 Years | 4,803 | 20.2% |
| 65 to 74 Years | 4,220 | 17.8% |
| 75 to 84 Years | 2,090 | 8.8% |
| 85 Years and Over | 981 | 4.1% |
| Total | 23,732 | 100.0% |
Housing Finances in Chicopee
Median Income by Occupancy in Chicopee
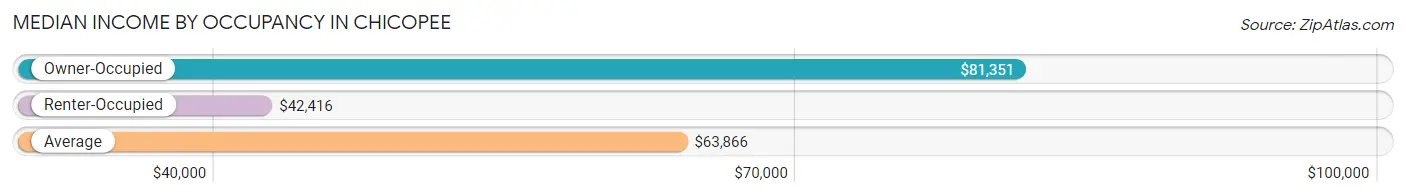
| Occupancy Type | # Households | Median Income |
| Owner-Occupied | 13,996 (59.0%) | $81,351 |
| Renter-Occupied | 9,736 (41.0%) | $42,416 |
| Average | 23,732 (100.0%) | $63,866 |
Occupancy by Householder Income Bracket in Chicopee
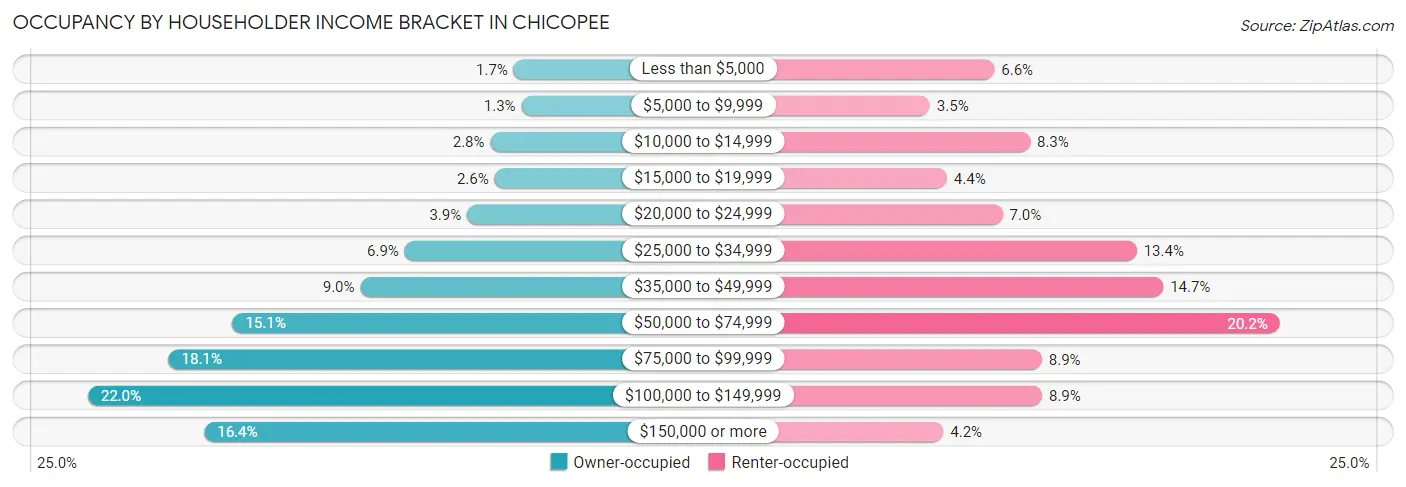
| Income Bracket | Owner-occupied | Renter-occupied |
| Less than $5,000 | 239 (1.7%) | 644 (6.6%) |
| $5,000 to $9,999 | 187 (1.3%) | 345 (3.5%) |
| $10,000 to $14,999 | 394 (2.8%) | 809 (8.3%) |
| $15,000 to $19,999 | 367 (2.6%) | 424 (4.3%) |
| $20,000 to $24,999 | 550 (3.9%) | 682 (7.0%) |
| $25,000 to $34,999 | 966 (6.9%) | 1,304 (13.4%) |
| $35,000 to $49,999 | 1,261 (9.0%) | 1,426 (14.6%) |
| $50,000 to $74,999 | 2,114 (15.1%) | 1,966 (20.2%) |
| $75,000 to $99,999 | 2,539 (18.1%) | 864 (8.9%) |
| $100,000 to $149,999 | 3,078 (22.0%) | 865 (8.9%) |
| $150,000 or more | 2,301 (16.4%) | 407 (4.2%) |
| Total | 13,996 (100.0%) | 9,736 (100.0%) |
Monthly Housing Cost Tiers in Chicopee
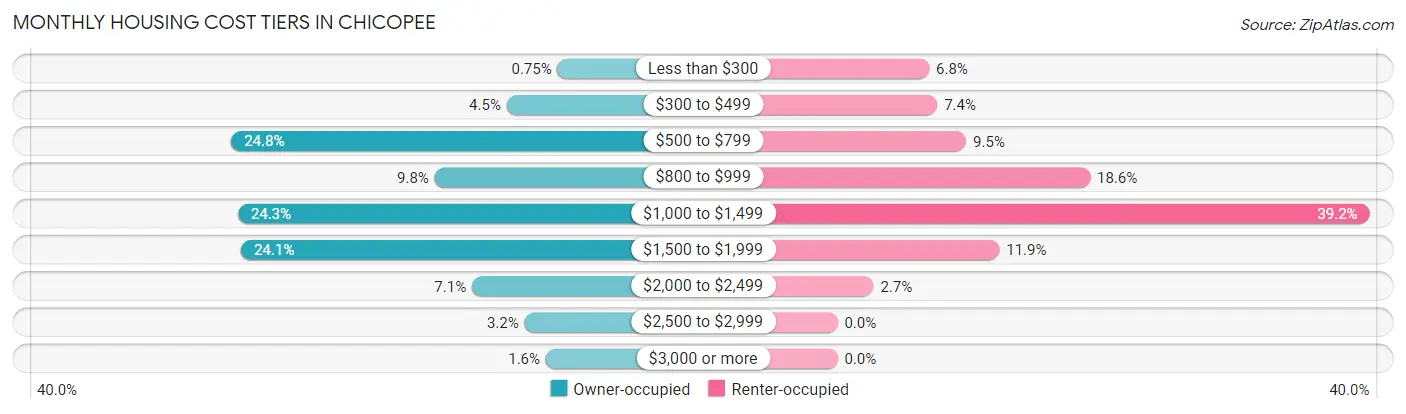
| Monthly Cost | Owner-occupied | Renter-occupied |
| Less than $300 | 105 (0.7%) | 657 (6.8%) |
| $300 to $499 | 628 (4.5%) | 716 (7.3%) |
| $500 to $799 | 3,468 (24.8%) | 923 (9.5%) |
| $800 to $999 | 1,371 (9.8%) | 1,812 (18.6%) |
| $1,000 to $1,499 | 3,399 (24.3%) | 3,815 (39.2%) |
| $1,500 to $1,999 | 3,367 (24.1%) | 1,161 (11.9%) |
| $2,000 to $2,499 | 987 (7.0%) | 259 (2.7%) |
| $2,500 to $2,999 | 445 (3.2%) | 0 (0.0%) |
| $3,000 or more | 226 (1.6%) | 0 (0.0%) |
| Total | 13,996 (100.0%) | 9,736 (100.0%) |
Physical Housing Characteristics in Chicopee
Housing Structures in Chicopee
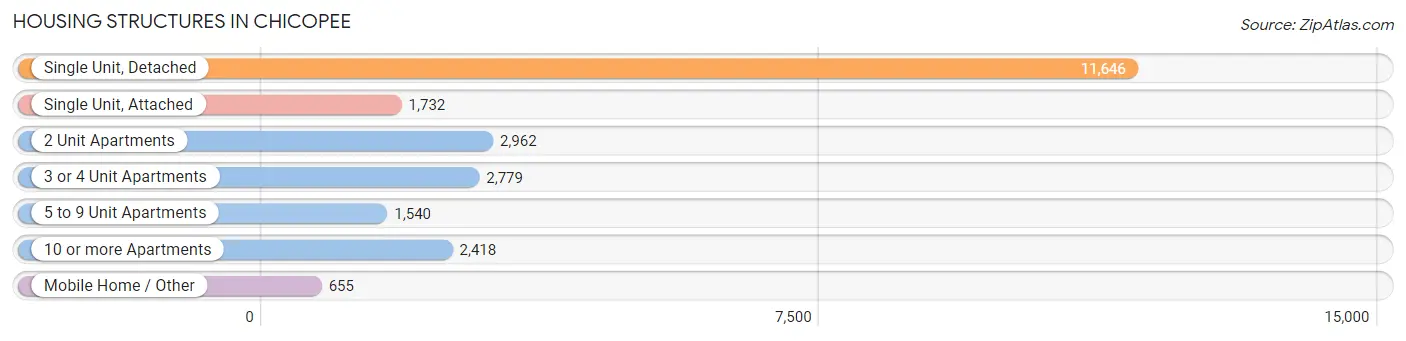
| Structure Type | # Housing Units | % Housing Units |
| Single Unit, Detached | 11,646 | 49.1% |
| Single Unit, Attached | 1,732 | 7.3% |
| 2 Unit Apartments | 2,962 | 12.5% |
| 3 or 4 Unit Apartments | 2,779 | 11.7% |
| 5 to 9 Unit Apartments | 1,540 | 6.5% |
| 10 or more Apartments | 2,418 | 10.2% |
| Mobile Home / Other | 655 | 2.8% |
| Total | 23,732 | 100.0% |
Housing Structures by Occupancy in Chicopee
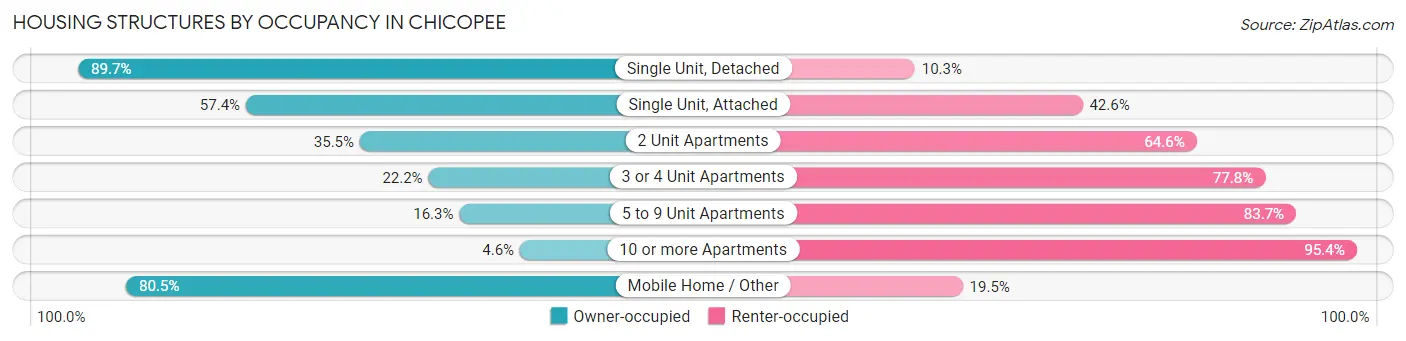
| Structure Type | Owner-occupied | Renter-occupied |
| Single Unit, Detached | 10,444 (89.7%) | 1,202 (10.3%) |
| Single Unit, Attached | 994 (57.4%) | 738 (42.6%) |
| 2 Unit Apartments | 1,050 (35.4%) | 1,912 (64.5%) |
| 3 or 4 Unit Apartments | 618 (22.2%) | 2,161 (77.8%) |
| 5 to 9 Unit Apartments | 251 (16.3%) | 1,289 (83.7%) |
| 10 or more Apartments | 112 (4.6%) | 2,306 (95.4%) |
| Mobile Home / Other | 527 (80.5%) | 128 (19.5%) |
| Total | 13,996 (59.0%) | 9,736 (41.0%) |
Housing Structures by Number of Rooms in Chicopee
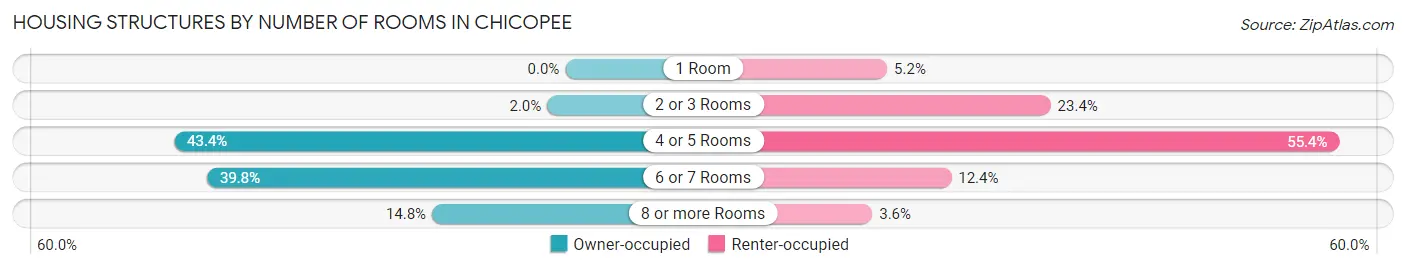
| Number of Rooms | Owner-occupied | Renter-occupied |
| 1 Room | 0 (0.0%) | 510 (5.2%) |
| 2 or 3 Rooms | 282 (2.0%) | 2,277 (23.4%) |
| 4 or 5 Rooms | 6,077 (43.4%) | 5,396 (55.4%) |
| 6 or 7 Rooms | 5,567 (39.8%) | 1,203 (12.4%) |
| 8 or more Rooms | 2,070 (14.8%) | 350 (3.6%) |
| Total | 13,996 (100.0%) | 9,736 (100.0%) |
Housing Structure by Heating Type in Chicopee
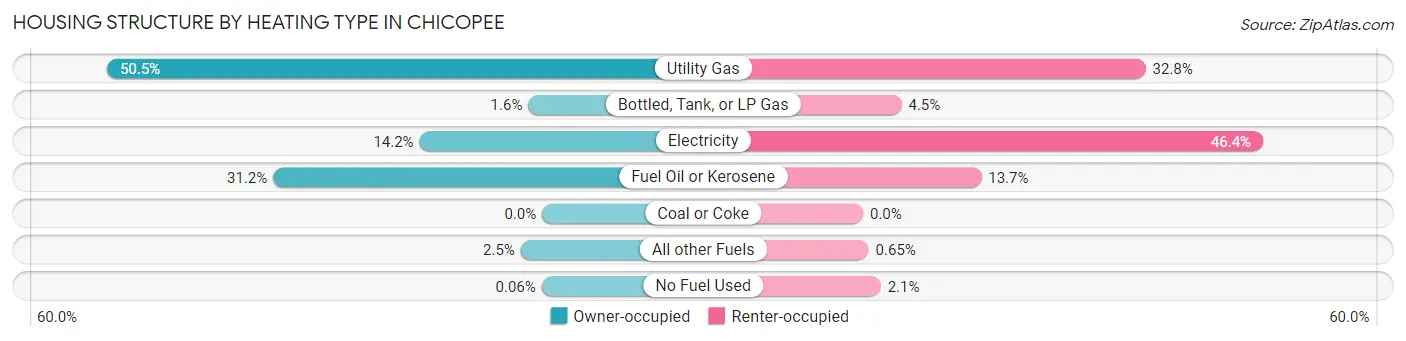
| Heating Type | Owner-occupied | Renter-occupied |
| Utility Gas | 7,061 (50.4%) | 3,190 (32.8%) |
| Bottled, Tank, or LP Gas | 225 (1.6%) | 434 (4.5%) |
| Electricity | 1,990 (14.2%) | 4,514 (46.4%) |
| Fuel Oil or Kerosene | 4,365 (31.2%) | 1,335 (13.7%) |
| Coal or Coke | 0 (0.0%) | 0 (0.0%) |
| All other Fuels | 347 (2.5%) | 63 (0.6%) |
| No Fuel Used | 8 (0.1%) | 200 (2.1%) |
| Total | 13,996 (100.0%) | 9,736 (100.0%) |
Household Vehicle Usage in Chicopee
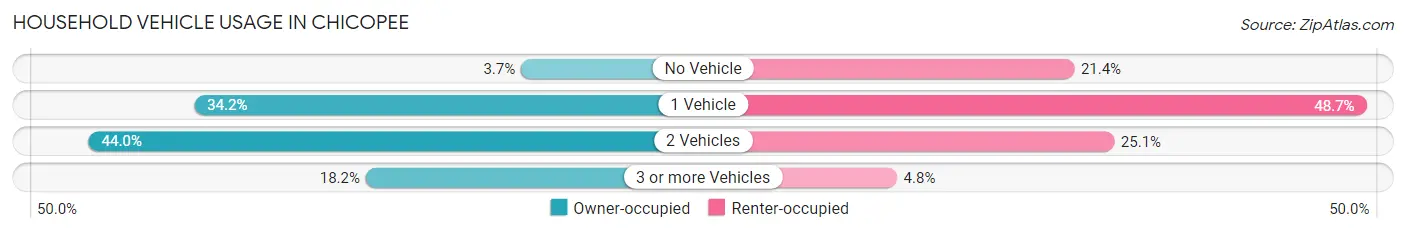
| Vehicles per Household | Owner-occupied | Renter-occupied |
| No Vehicle | 512 (3.7%) | 2,082 (21.4%) |
| 1 Vehicle | 4,783 (34.2%) | 4,739 (48.7%) |
| 2 Vehicles | 6,161 (44.0%) | 2,445 (25.1%) |
| 3 or more Vehicles | 2,540 (18.1%) | 470 (4.8%) |
| Total | 13,996 (100.0%) | 9,736 (100.0%) |
Real Estate & Mortgages in Chicopee
Real Estate and Mortgage Overview in Chicopee
| Characteristic | Without Mortgage | With Mortgage |
| Housing Units | 5,263 | 8,733 |
| Median Property Value | $223,600 | $233,900 |
| Median Household Income | $63,734 | $1,662 |
| Monthly Housing Costs | $676 | $210 |
| Real Estate Taxes | $3,592 | $349 |
Property Value by Mortgage Status in Chicopee
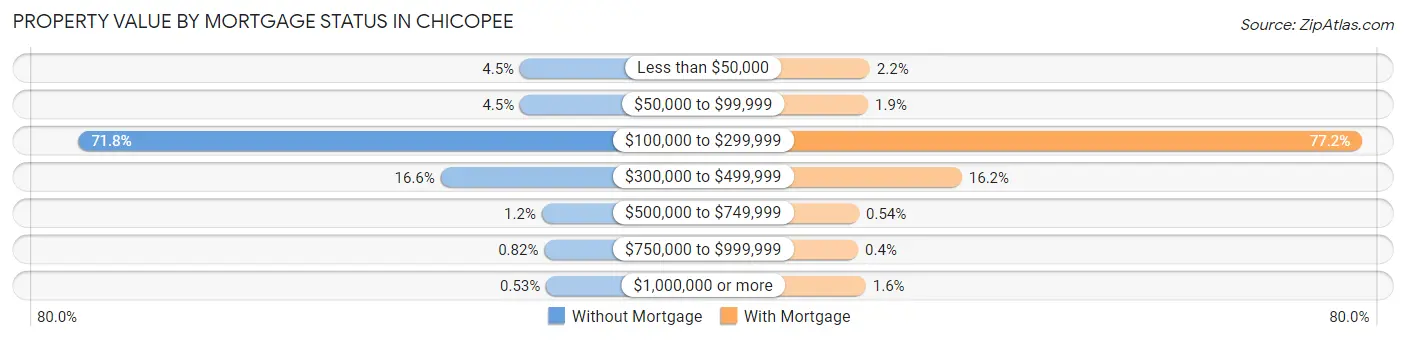
| Property Value | Without Mortgage | With Mortgage |
| Less than $50,000 | 238 (4.5%) | 191 (2.2%) |
| $50,000 to $99,999 | 237 (4.5%) | 168 (1.9%) |
| $100,000 to $299,999 | 3,780 (71.8%) | 6,740 (77.2%) |
| $300,000 to $499,999 | 874 (16.6%) | 1,415 (16.2%) |
| $500,000 to $749,999 | 63 (1.2%) | 47 (0.5%) |
| $750,000 to $999,999 | 43 (0.8%) | 35 (0.4%) |
| $1,000,000 or more | 28 (0.5%) | 137 (1.6%) |
| Total | 5,263 (100.0%) | 8,733 (100.0%) |
Household Income by Mortgage Status in Chicopee
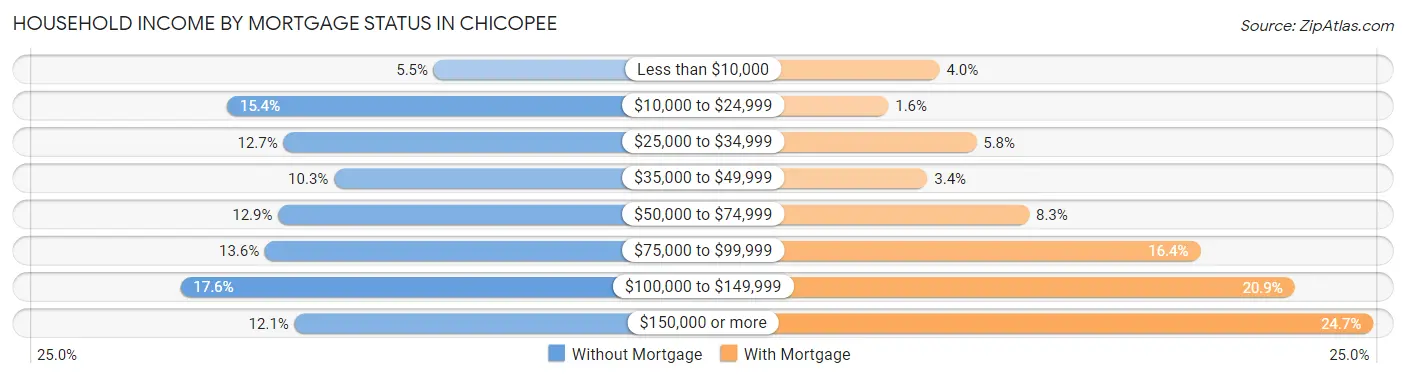
| Household Income | Without Mortgage | With Mortgage |
| Less than $10,000 | 290 (5.5%) | 349 (4.0%) |
| $10,000 to $24,999 | 809 (15.4%) | 136 (1.6%) |
| $25,000 to $34,999 | 667 (12.7%) | 502 (5.8%) |
| $35,000 to $49,999 | 540 (10.3%) | 299 (3.4%) |
| $50,000 to $74,999 | 680 (12.9%) | 721 (8.3%) |
| $75,000 to $99,999 | 713 (13.6%) | 1,434 (16.4%) |
| $100,000 to $149,999 | 925 (17.6%) | 1,826 (20.9%) |
| $150,000 or more | 639 (12.1%) | 2,153 (24.6%) |
| Total | 5,263 (100.0%) | 8,733 (100.0%) |
Property Value to Household Income Ratio in Chicopee
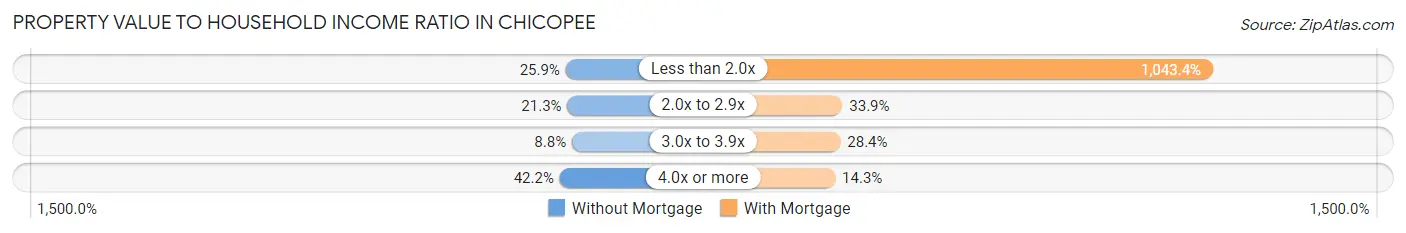
| Value-to-Income Ratio | Without Mortgage | With Mortgage |
| Less than 2.0x | 1,365 (25.9%) | 91,118 (1,043.4%) |
| 2.0x to 2.9x | 1,120 (21.3%) | 2,962 (33.9%) |
| 3.0x to 3.9x | 464 (8.8%) | 2,483 (28.4%) |
| 4.0x or more | 2,222 (42.2%) | 1,248 (14.3%) |
| Total | 5,263 (100.0%) | 8,733 (100.0%) |
Real Estate Taxes by Mortgage Status in Chicopee
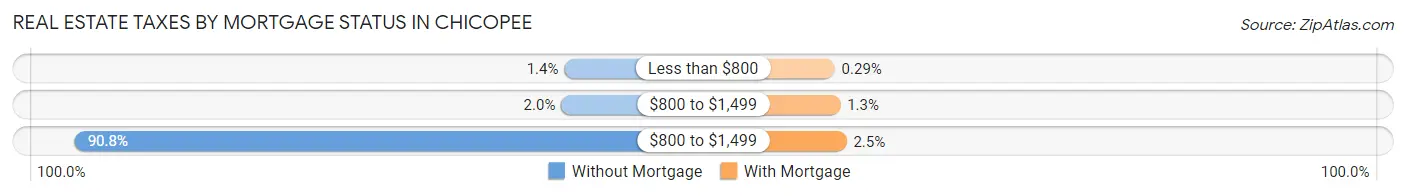
| Property Taxes | Without Mortgage | With Mortgage |
| Less than $800 | 75 (1.4%) | 25 (0.3%) |
| $800 to $1,499 | 104 (2.0%) | 114 (1.3%) |
| $800 to $1,499 | 4,781 (90.8%) | 214 (2.5%) |
| Total | 5,263 (100.0%) | 8,733 (100.0%) |
Health & Disability in Chicopee
Health Insurance Coverage by Age in Chicopee
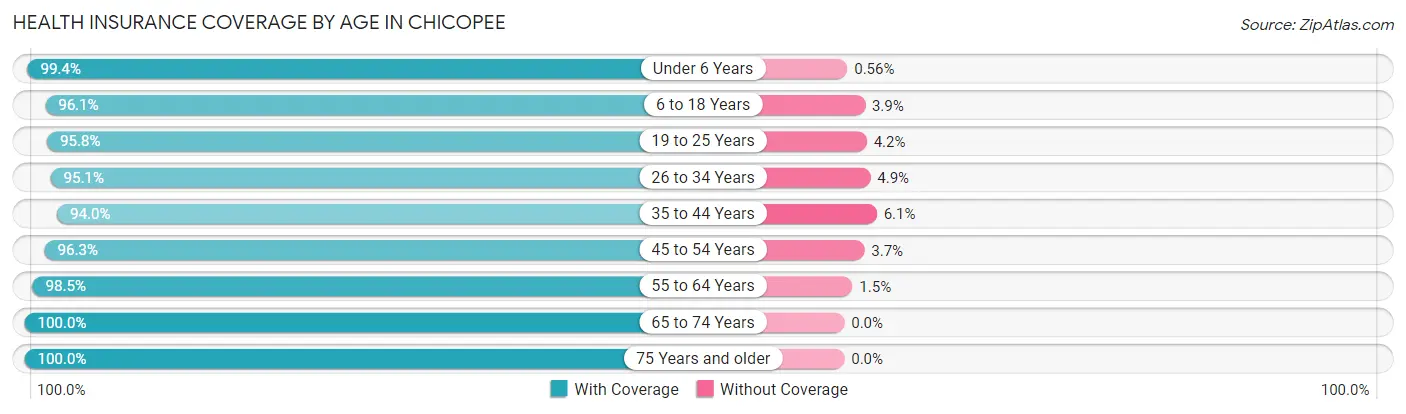
| Age Bracket | With Coverage | Without Coverage |
| Under 6 Years | 2,997 (99.4%) | 17 (0.6%) |
| 6 to 18 Years | 8,458 (96.1%) | 340 (3.9%) |
| 19 to 25 Years | 4,422 (95.8%) | 193 (4.2%) |
| 26 to 34 Years | 6,052 (95.1%) | 309 (4.9%) |
| 35 to 44 Years | 6,632 (94.0%) | 427 (6.0%) |
| 45 to 54 Years | 6,438 (96.3%) | 250 (3.7%) |
| 55 to 64 Years | 8,115 (98.5%) | 124 (1.5%) |
| 65 to 74 Years | 6,155 (100.0%) | 0 (0.0%) |
| 75 Years and older | 4,085 (100.0%) | 0 (0.0%) |
| Total | 53,354 (97.0%) | 1,660 (3.0%) |
Health Insurance Coverage by Citizenship Status in Chicopee
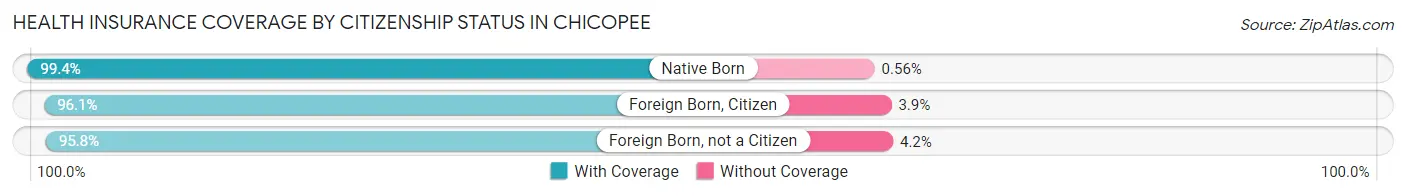
| Citizenship Status | With Coverage | Without Coverage |
| Native Born | 2,997 (99.4%) | 17 (0.6%) |
| Foreign Born, Citizen | 8,458 (96.1%) | 340 (3.9%) |
| Foreign Born, not a Citizen | 4,422 (95.8%) | 193 (4.2%) |
Health Insurance Coverage by Household Income in Chicopee
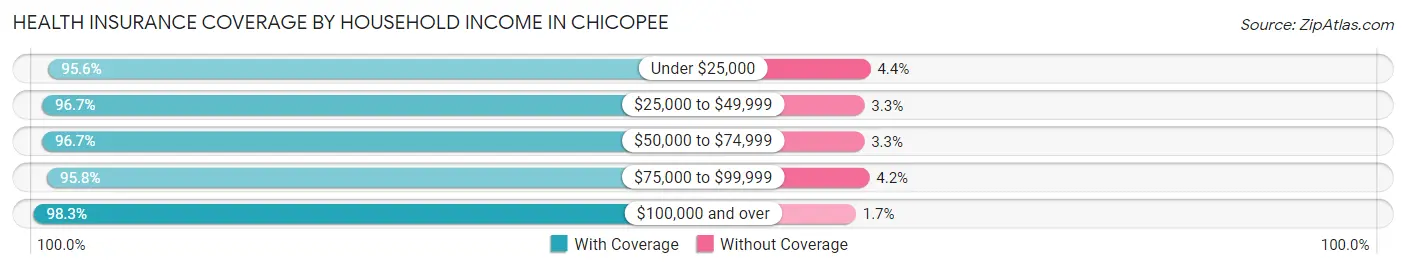
| Household Income | With Coverage | Without Coverage |
| Under $25,000 | 7,342 (95.6%) | 341 (4.4%) |
| $25,000 to $49,999 | 8,851 (96.7%) | 302 (3.3%) |
| $50,000 to $74,999 | 8,804 (96.7%) | 298 (3.3%) |
| $75,000 to $99,999 | 7,440 (95.8%) | 328 (4.2%) |
| $100,000 and over | 20,160 (98.3%) | 346 (1.7%) |
Public vs Private Health Insurance Coverage by Age in Chicopee
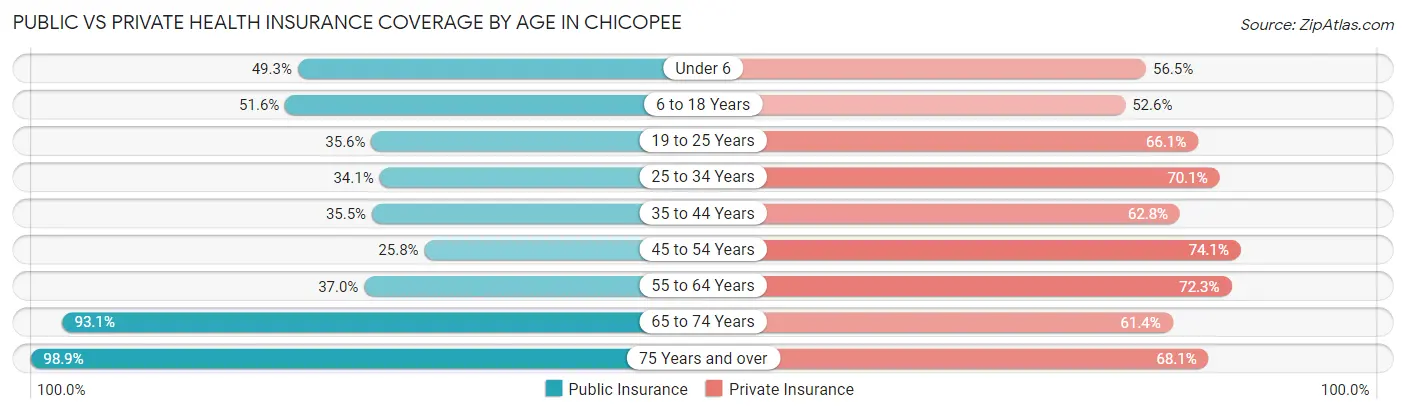
| Age Bracket | Public Insurance | Private Insurance |
| Under 6 | 1,486 (49.3%) | 1,702 (56.5%) |
| 6 to 18 Years | 4,543 (51.6%) | 4,629 (52.6%) |
| 19 to 25 Years | 1,645 (35.6%) | 3,052 (66.1%) |
| 25 to 34 Years | 2,171 (34.1%) | 4,459 (70.1%) |
| 35 to 44 Years | 2,508 (35.5%) | 4,430 (62.8%) |
| 45 to 54 Years | 1,725 (25.8%) | 4,953 (74.1%) |
| 55 to 64 Years | 3,046 (37.0%) | 5,957 (72.3%) |
| 65 to 74 Years | 5,733 (93.1%) | 3,779 (61.4%) |
| 75 Years and over | 4,041 (98.9%) | 2,781 (68.1%) |
| Total | 26,898 (48.9%) | 35,742 (65.0%) |
Disability Status by Sex by Age in Chicopee
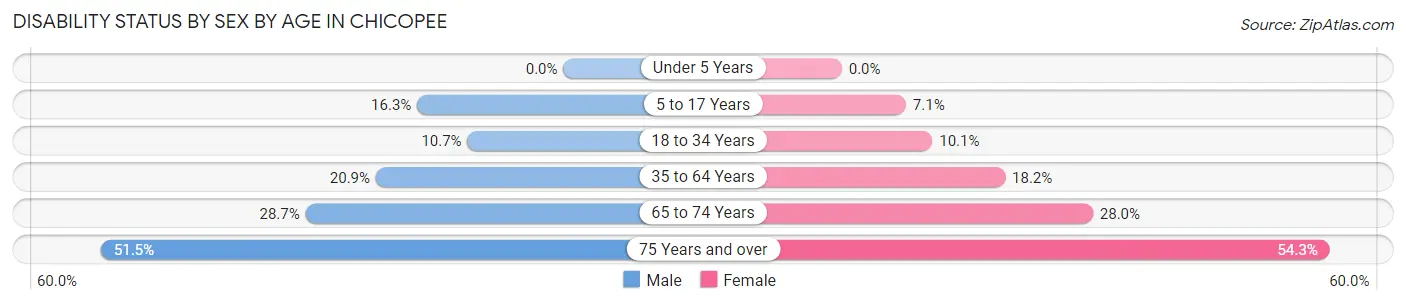
| Age Bracket | Male | Female |
| Under 5 Years | 0 (0.0%) | 0 (0.0%) |
| 5 to 17 Years | 696 (16.3%) | 283 (7.1%) |
| 18 to 34 Years | 609 (10.7%) | 641 (10.1%) |
| 35 to 64 Years | 2,239 (20.9%) | 2,049 (18.2%) |
| 65 to 74 Years | 888 (28.7%) | 856 (28.0%) |
| 75 Years and over | 824 (51.5%) | 1,350 (54.3%) |
Disability Class by Sex by Age in Chicopee
Disability Class: Hearing Difficulty
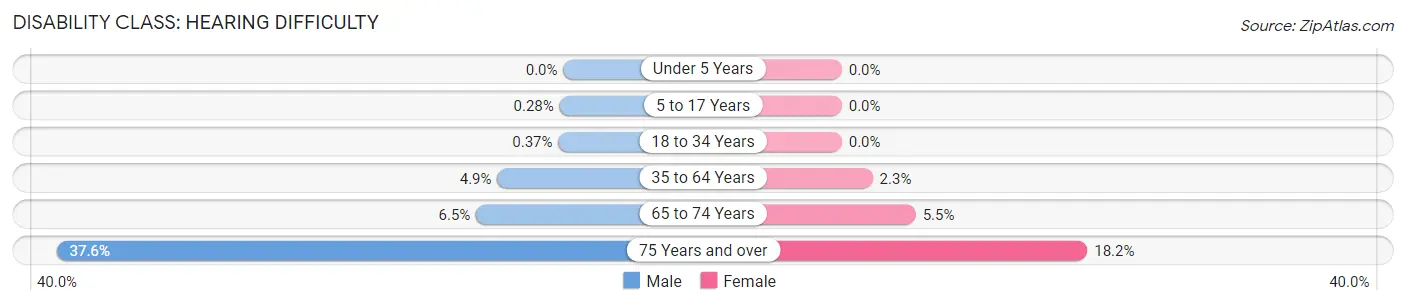
| Age Bracket | Male | Female |
| Under 5 Years | 0 (0.0%) | 0 (0.0%) |
| 5 to 17 Years | 12 (0.3%) | 0 (0.0%) |
| 18 to 34 Years | 21 (0.4%) | 0 (0.0%) |
| 35 to 64 Years | 525 (4.9%) | 258 (2.3%) |
| 65 to 74 Years | 200 (6.5%) | 168 (5.5%) |
| 75 Years and over | 602 (37.6%) | 453 (18.2%) |
Disability Class: Vision Difficulty
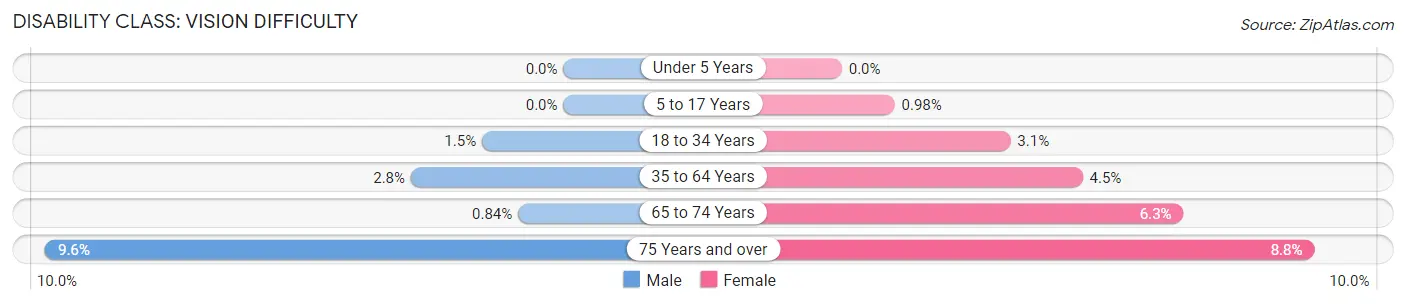
| Age Bracket | Male | Female |
| Under 5 Years | 0 (0.0%) | 0 (0.0%) |
| 5 to 17 Years | 0 (0.0%) | 39 (1.0%) |
| 18 to 34 Years | 86 (1.5%) | 199 (3.1%) |
| 35 to 64 Years | 303 (2.8%) | 504 (4.5%) |
| 65 to 74 Years | 26 (0.8%) | 194 (6.3%) |
| 75 Years and over | 154 (9.6%) | 218 (8.8%) |
Disability Class: Cognitive Difficulty
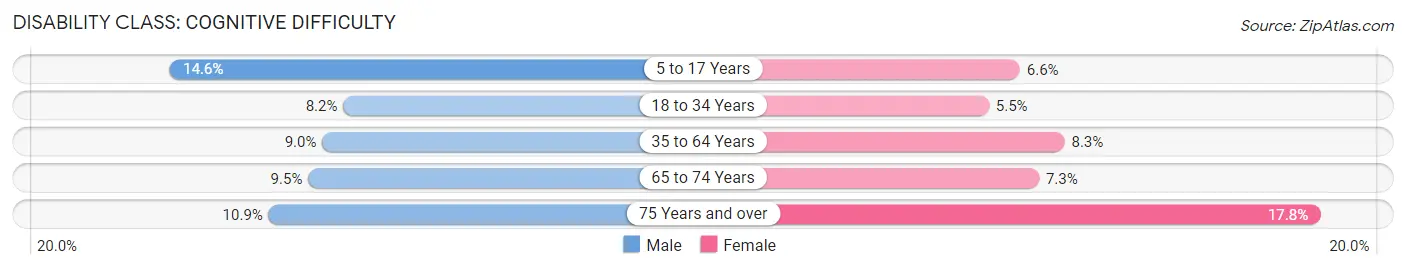
| Age Bracket | Male | Female |
| 5 to 17 Years | 624 (14.6%) | 262 (6.6%) |
| 18 to 34 Years | 466 (8.2%) | 347 (5.5%) |
| 35 to 64 Years | 960 (8.9%) | 932 (8.3%) |
| 65 to 74 Years | 293 (9.5%) | 224 (7.3%) |
| 75 Years and over | 175 (10.9%) | 441 (17.7%) |
Disability Class: Ambulatory Difficulty
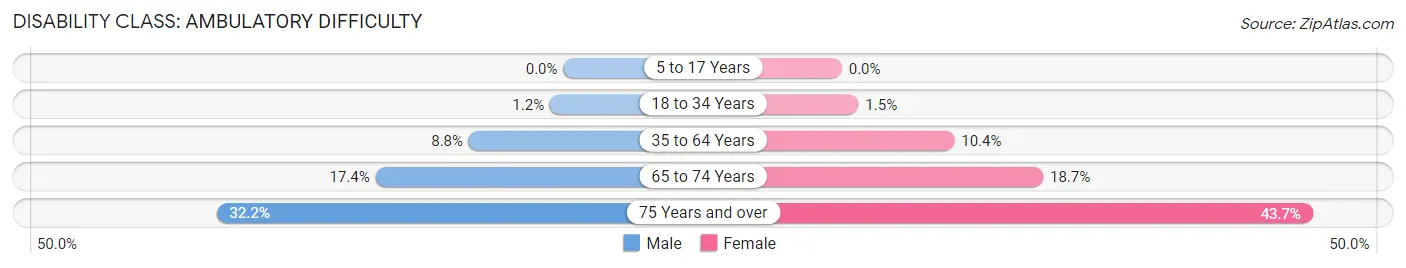
| Age Bracket | Male | Female |
| 5 to 17 Years | 0 (0.0%) | 0 (0.0%) |
| 18 to 34 Years | 71 (1.2%) | 98 (1.5%) |
| 35 to 64 Years | 940 (8.8%) | 1,176 (10.4%) |
| 65 to 74 Years | 539 (17.4%) | 572 (18.7%) |
| 75 Years and over | 515 (32.2%) | 1,086 (43.7%) |
Disability Class: Self-Care Difficulty
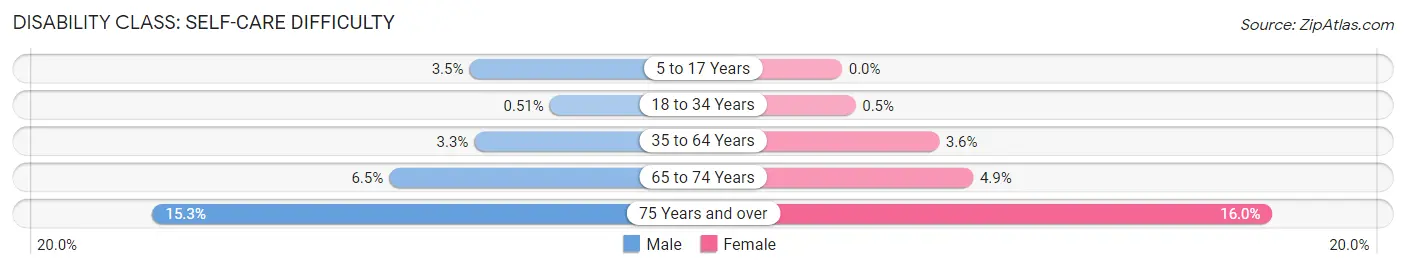
| Age Bracket | Male | Female |
| 5 to 17 Years | 149 (3.5%) | 0 (0.0%) |
| 18 to 34 Years | 29 (0.5%) | 32 (0.5%) |
| 35 to 64 Years | 355 (3.3%) | 405 (3.6%) |
| 65 to 74 Years | 200 (6.5%) | 149 (4.9%) |
| 75 Years and over | 244 (15.2%) | 397 (16.0%) |
Technology Access in Chicopee
Computing Device Access in Chicopee
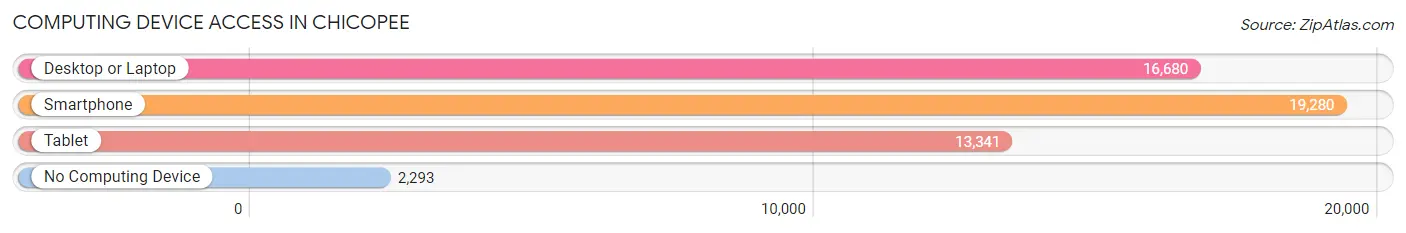
| Device Type | # Households | % Households |
| Desktop or Laptop | 16,680 | 70.3% |
| Smartphone | 19,280 | 81.2% |
| Tablet | 13,341 | 56.2% |
| No Computing Device | 2,293 | 9.7% |
| Total | 23,732 | 100.0% |
Internet Access in Chicopee
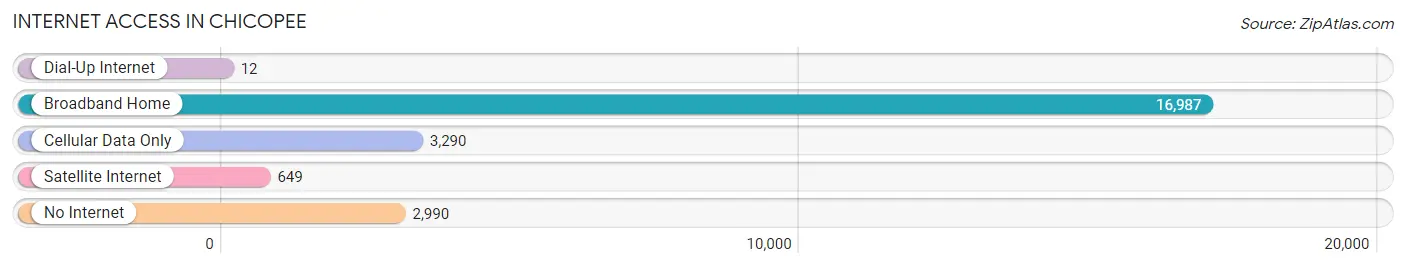
| Internet Type | # Households | % Households |
| Dial-Up Internet | 12 | 0.1% |
| Broadband Home | 16,987 | 71.6% |
| Cellular Data Only | 3,290 | 13.9% |
| Satellite Internet | 649 | 2.7% |
| No Internet | 2,990 | 12.6% |
| Total | 23,732 | 100.0% |
Chicopee Summary
Chicopee, Massachusetts is a city located in Hampden County, in the Pioneer Valley region of the state. It is situated on the Connecticut River, just north of Springfield, and is part of the Springfield Metropolitan Statistical Area. The city has a population of approximately 55,298 people, according to the 2010 United States Census.
History
Chicopee was first settled in 1660 by the Nipmuc tribe, who called the area “Chicopee Falls”. The area was later settled by English colonists in 1665, and was incorporated as a town in 1848. The town was named after the Chicopee River, which flows through the area.
In the late 19th century, Chicopee became a major industrial center, with the opening of several mills and factories. The city was also home to the first public library in the state, which opened in 1852.
Geography
Chicopee is located in Hampden County, in the Pioneer Valley region of Massachusetts. It is situated on the Connecticut River, just north of Springfield. The city has a total area of 22.2 square miles, of which 21.9 square miles is land and 0.3 square miles is water.
The city is located in the Connecticut River Valley, and is surrounded by several hills and mountains. The highest point in the city is the summit of Mount Tom, which has an elevation of 1,200 feet.
Economy
Chicopee’s economy is largely based on manufacturing and services. The city is home to several large companies, including Smith & Wesson, Westinghouse Electric, and the Massachusetts Mutual Life Insurance Company.
The city also has a large retail sector, with several shopping centers and malls. The city is also home to several educational institutions, including Elms College and the University of Massachusetts Amherst.
Demographics
As of the 2010 United States Census, the city had a population of 55,298 people. The racial makeup of the city was 79.2% White, 8.3% African American, 0.4% Native American, 2.2% Asian, 0.1% Pacific Islander, 6.7% from other races, and 2.5% from two or more races. Hispanic or Latino of any race were 14.3% of the population.
The median household income in the city was $45,945, and the median family income was $54,817. The per capita income for the city was $21,945. About 11.2% of families and 14.2% of the population were below the poverty line, including 19.2% of those under age 18 and 10.2% of those age 65 or over.
Common Questions
What is Per Capita Income in Chicopee?
Per Capita income in Chicopee is $34,719.
What is the Median Family Income in Chicopee?
Median Family Income in Chicopee is $77,179.
What is the Median Household income in Chicopee?
Median Household Income in Chicopee is $63,866.
What is Income or Wage Gap in Chicopee?
Income or Wage Gap in Chicopee is 14.5%.
Women in Chicopee earn 85.5 cents for every dollar earned by a man.
What is Family Income Deficit in Chicopee?
Family Income Deficit in Chicopee is $9,832.
Families that are below poverty line in Chicopee earn $9,832 less on average than the poverty threshold level.
What is Inequality or Gini Index in Chicopee?
Inequality or Gini Index in Chicopee is 0.44.
What is the Total Population of Chicopee?
Total Population of Chicopee is 55,441.
What is the Total Male Population of Chicopee?
Total Male Population of Chicopee is 26,977.
What is the Total Female Population of Chicopee?
Total Female Population of Chicopee is 28,464.
What is the Ratio of Males per 100 Females in Chicopee?
There are 94.78 Males per 100 Females in Chicopee.
What is the Ratio of Females per 100 Males in Chicopee?
There are 105.51 Females per 100 Males in Chicopee.
What is the Median Population Age in Chicopee?
Median Population Age in Chicopee is 41.4 Years.
What is the Average Family Size in Chicopee
Average Family Size in Chicopee is 2.9 People.
What is the Average Household Size in Chicopee
Average Household Size in Chicopee is 2.3 People.
How Large is the Labor Force in Chicopee?
There are 28,561 People in the Labor Forcein in Chicopee.
What is the Percentage of People in the Labor Force in Chicopee?
61.4% of People are in the Labor Force in Chicopee.
What is the Unemployment Rate in Chicopee?
Unemployment Rate in Chicopee is 6.1%.