Odessa, TX Map & Demographics
Odessa Map
Odessa Overview
$34,949
PER CAPITA INCOME
$86,796
AVG FAMILY INCOME
$71,293
AVG HOUSEHOLD INCOME
39.0%
WAGE / INCOME GAP [ % ]
61.0¢/ $1
WAGE / INCOME GAP [ $ ]
$13,261
FAMILY INCOME DEFICIT
0.45
INEQUALITY / GINI INDEX
113,353
TOTAL POPULATION
57,438
MALE POPULATION
55,915
FEMALE POPULATION
102.72
MALES / 100 FEMALES
97.35
FEMALES / 100 MALES
30.7
MEDIAN AGE
3.1
AVG FAMILY SIZE
2.5
AVG HOUSEHOLD SIZE
57,812
LABOR FORCE [ PEOPLE ]
69.1%
PERCENT IN LABOR FORCE
6.1%
UNEMPLOYMENT RATE
Odessa Area Codes
Income in Odessa
Income Overview in Odessa
Per Capita Income in Odessa is $34,949, while median incomes of families and households are $86,796 and $71,293 respectively.
| Characteristic | Number | Measure |
| Per Capita Income | 113,353 | $34,949 |
| Median Family Income | 28,935 | $86,796 |
| Mean Family Income | 28,935 | $103,977 |
| Median Household Income | 43,802 | $71,293 |
| Mean Household Income | 43,802 | $91,231 |
| Income Deficit | 28,935 | $13,261 |
| Wage / Income Gap (%) | 113,353 | 39.03% |
| Wage / Income Gap ($) | 113,353 | 60.97¢ per $1 |
| Gini / Inequality Index | 113,353 | 0.45 |
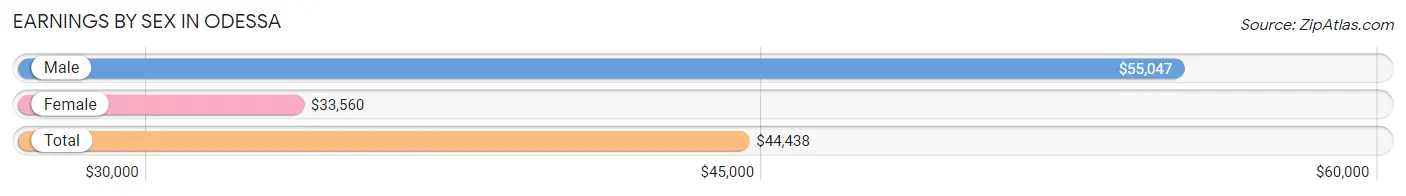
Earnings by Sex in Odessa
Average Earnings in Odessa are $44,438, $55,047 for men and $33,560 for women, a difference of 39.0%.
| Sex | Number | Average Earnings |
| Male | 34,882 (57.9%) | $55,047 |
| Female | 25,398 (42.1%) | $33,560 |
| Total | 60,280 (100.0%) | $44,438 |
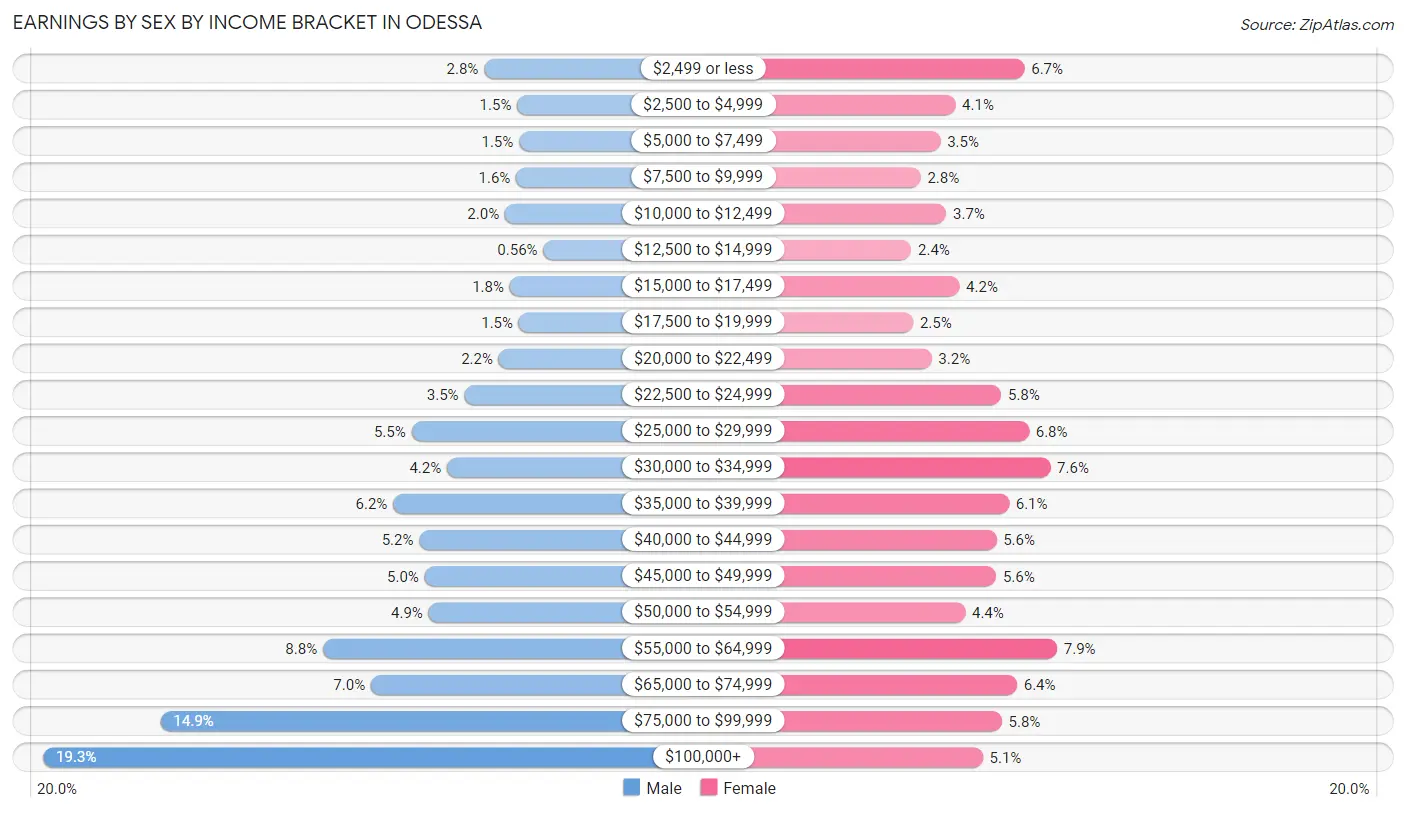
Earnings by Sex by Income Bracket in Odessa
The most common earnings brackets in Odessa are $100,000+ for men (6,734 | 19.3%) and $55,000 to $64,999 for women (2,000 | 7.9%).
| Income | Male | Female |
| $2,499 or less | 971 (2.8%) | 1,690 (6.7%) |
| $2,500 to $4,999 | 537 (1.5%) | 1,031 (4.1%) |
| $5,000 to $7,499 | 512 (1.5%) | 888 (3.5%) |
| $7,500 to $9,999 | 550 (1.6%) | 701 (2.8%) |
| $10,000 to $12,499 | 698 (2.0%) | 944 (3.7%) |
| $12,500 to $14,999 | 197 (0.6%) | 613 (2.4%) |
| $15,000 to $17,499 | 636 (1.8%) | 1,070 (4.2%) |
| $17,500 to $19,999 | 516 (1.5%) | 631 (2.5%) |
| $20,000 to $22,499 | 779 (2.2%) | 804 (3.2%) |
| $22,500 to $24,999 | 1,228 (3.5%) | 1,468 (5.8%) |
| $25,000 to $29,999 | 1,919 (5.5%) | 1,732 (6.8%) |
| $30,000 to $34,999 | 1,456 (4.2%) | 1,935 (7.6%) |
| $35,000 to $39,999 | 2,160 (6.2%) | 1,541 (6.1%) |
| $40,000 to $44,999 | 1,819 (5.2%) | 1,422 (5.6%) |
| $45,000 to $49,999 | 1,749 (5.0%) | 1,419 (5.6%) |
| $50,000 to $54,999 | 1,696 (4.9%) | 1,124 (4.4%) |
| $55,000 to $64,999 | 3,078 (8.8%) | 2,000 (7.9%) |
| $65,000 to $74,999 | 2,447 (7.0%) | 1,617 (6.4%) |
| $75,000 to $99,999 | 5,200 (14.9%) | 1,474 (5.8%) |
| $100,000+ | 6,734 (19.3%) | 1,294 (5.1%) |
| Total | 34,882 (100.0%) | 25,398 (100.0%) |
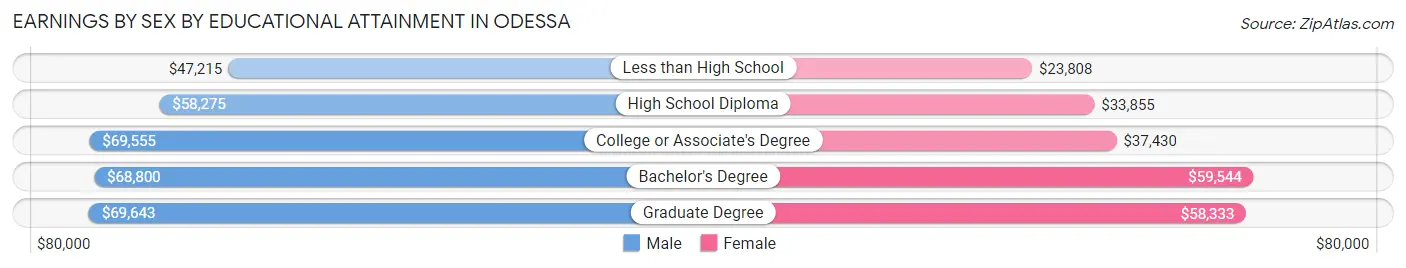
Earnings by Sex by Educational Attainment in Odessa
Average earnings in Odessa are $60,479 for men and $36,922 for women, a difference of 39.0%. Men with an educational attainment of graduate degree enjoy the highest average annual earnings of $69,643, while those with less than high school education earn the least with $47,215. Women with an educational attainment of bachelor's degree earn the most with the average annual earnings of $59,544, while those with less than high school education have the smallest earnings of $23,808.
| Educational Attainment | Male Income | Female Income |
| Less than High School | $47,215 | $23,808 |
| High School Diploma | $58,275 | $33,855 |
| College or Associate's Degree | $69,555 | $37,430 |
| Bachelor's Degree | $68,800 | $59,544 |
| Graduate Degree | $69,643 | $58,333 |
| Total | $60,479 | $36,922 |
Family Income in Odessa
Family Income Brackets in Odessa
According to the Odessa family income data, there are 6,626 families falling into the $100,000 to $149,999 income range, which is the most common income bracket and makes up 22.9% of all families. Conversely, the $10,000 to $14,999 income bracket is the least frequent group with only 492 families (1.7%) belonging to this category.
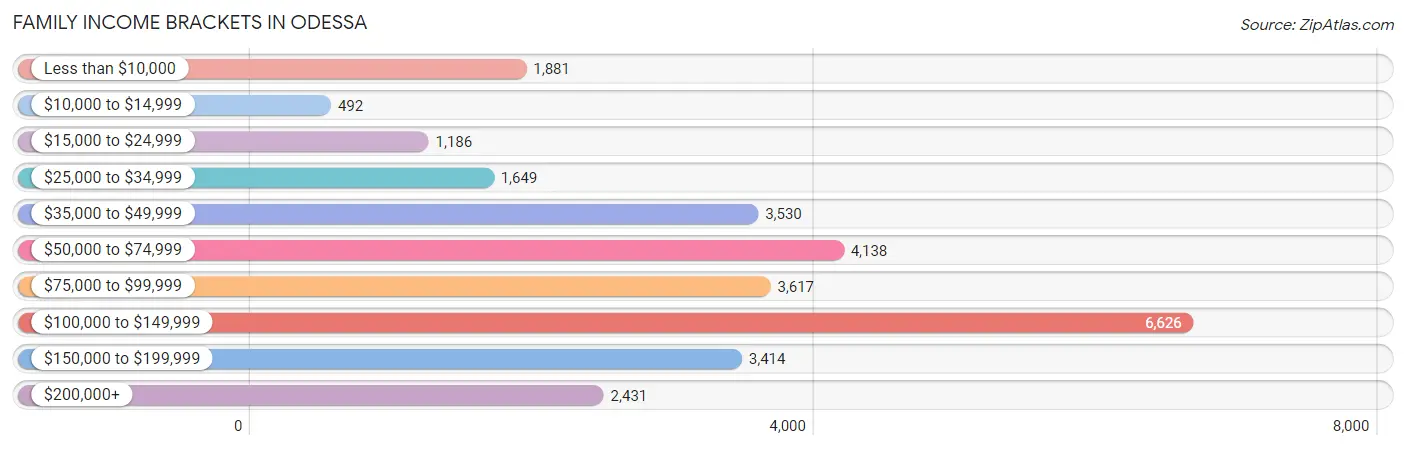
| Income Bracket | # Families | % Families |
| Less than $10,000 | 1,881 | 6.5% |
| $10,000 to $14,999 | 492 | 1.7% |
| $15,000 to $24,999 | 1,186 | 4.1% |
| $25,000 to $34,999 | 1,649 | 5.7% |
| $35,000 to $49,999 | 3,530 | 12.2% |
| $50,000 to $74,999 | 4,138 | 14.3% |
| $75,000 to $99,999 | 3,617 | 12.5% |
| $100,000 to $149,999 | 6,626 | 22.9% |
| $150,000 to $199,999 | 3,414 | 11.8% |
| $200,000+ | 2,431 | 8.4% |
Family Income by Famaliy Size in Odessa
4-person families (5,711 | 19.7%) account for the highest median family income in Odessa with $101,352 per family, while 2-person families (11,626 | 40.2%) have the highest median income of $35,177 per family member.
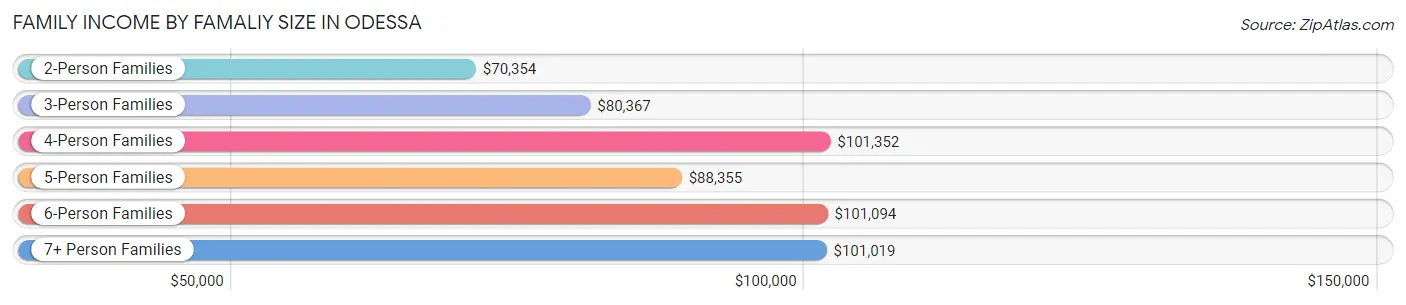
| Income Bracket | # Families | Median Income |
| 2-Person Families | 11,626 (40.2%) | $70,354 |
| 3-Person Families | 6,651 (23.0%) | $80,367 |
| 4-Person Families | 5,711 (19.7%) | $101,352 |
| 5-Person Families | 3,116 (10.8%) | $88,355 |
| 6-Person Families | 1,365 (4.7%) | $101,094 |
| 7+ Person Families | 466 (1.6%) | $101,019 |
| Total | 28,935 (100.0%) | $86,796 |
Family Income by Number of Earners in Odessa
The median family income in Odessa is $86,796, with families comprising 3+ earners (3,693) having the highest median family income of $137,889, while families with no earners (2,836) have the lowest median family income of $22,943, accounting for 12.8% and 9.8% of families, respectively.
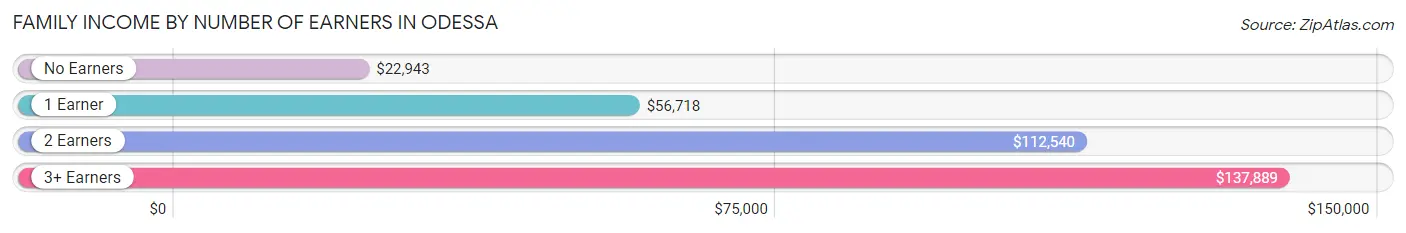
| Number of Earners | # Families | Median Income |
| No Earners | 2,836 (9.8%) | $22,943 |
| 1 Earner | 10,643 (36.8%) | $56,718 |
| 2 Earners | 11,763 (40.6%) | $112,540 |
| 3+ Earners | 3,693 (12.8%) | $137,889 |
| Total | 28,935 (100.0%) | $86,796 |
Household Income in Odessa
Household Income Brackets in Odessa
With 8,235 households falling in the category, the $100,000 to $149,999 income range is the most frequent in Odessa, accounting for 18.8% of all households. In contrast, only 1,883 households (4.3%) fall into the $10,000 to $14,999 income bracket, making it the least populous group.
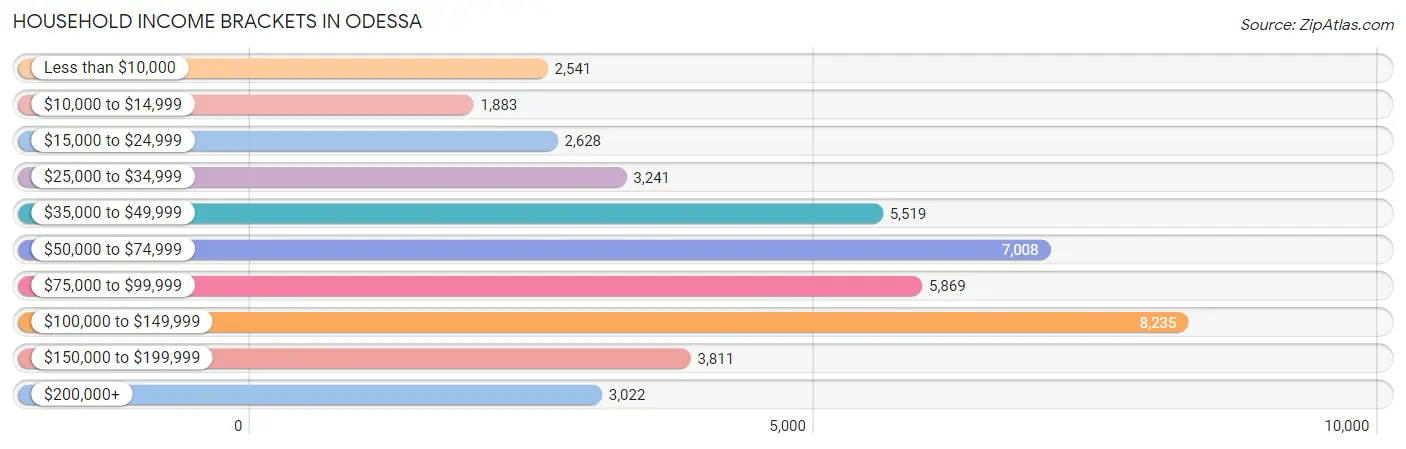
| Income Bracket | # Households | % Households |
| Less than $10,000 | 2,541 | 5.8% |
| $10,000 to $14,999 | 1,883 | 4.3% |
| $15,000 to $24,999 | 2,628 | 6.0% |
| $25,000 to $34,999 | 3,241 | 7.4% |
| $35,000 to $49,999 | 5,519 | 12.6% |
| $50,000 to $74,999 | 7,008 | 16.0% |
| $75,000 to $99,999 | 5,869 | 13.4% |
| $100,000 to $149,999 | 8,235 | 18.8% |
| $150,000 to $199,999 | 3,811 | 8.7% |
| $200,000+ | 3,022 | 6.9% |
Household Income by Householder Age in Odessa
The median household income in Odessa is $71,293, with the highest median household income of $92,005 found in the 45 to 64 years age bracket for the primary householder. A total of 13,914 households (31.8%) fall into this category. Meanwhile, the 65+ years age bracket for the primary householder has the lowest median household income of $38,979, with 7,645 households (17.4%) in this group.
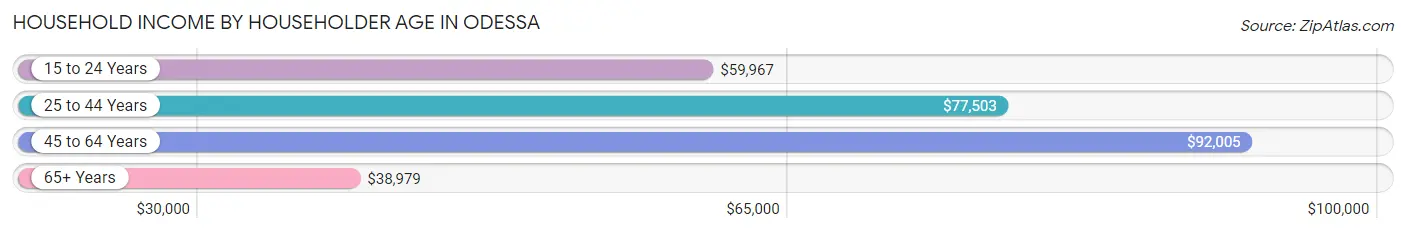
| Income Bracket | # Households | Median Income |
| 15 to 24 Years | 3,700 (8.5%) | $59,967 |
| 25 to 44 Years | 18,543 (42.3%) | $77,503 |
| 45 to 64 Years | 13,914 (31.8%) | $92,005 |
| 65+ Years | 7,645 (17.4%) | $38,979 |
| Total | 43,802 (100.0%) | $71,293 |
Poverty in Odessa
Income Below Poverty by Sex and Age in Odessa
With 11.9% poverty level for males and 17.5% for females among the residents of Odessa, 5 year old males and 15 year old females are the most vulnerable to poverty, with 353 males (37.3%) and 256 females (28.5%) in their respective age groups living below the poverty level.
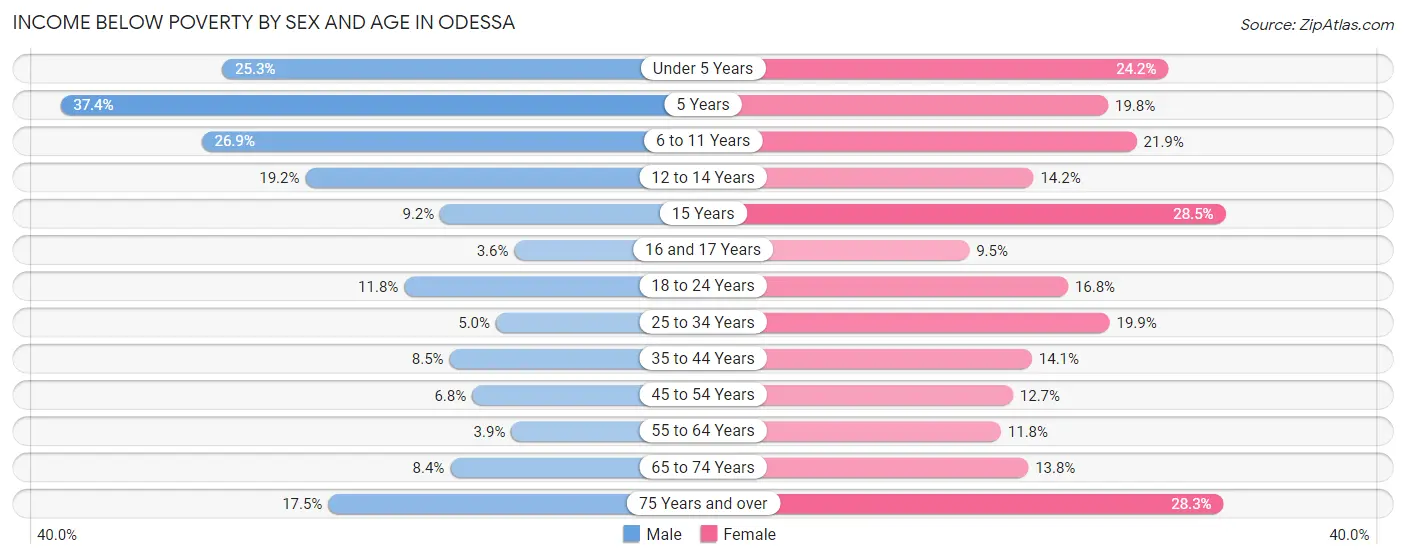
| Age Bracket | Male | Female |
| Under 5 Years | 1,335 (25.3%) | 1,174 (24.2%) |
| 5 Years | 353 (37.3%) | 189 (19.8%) |
| 6 to 11 Years | 1,356 (26.9%) | 1,175 (21.9%) |
| 12 to 14 Years | 454 (19.2%) | 370 (14.2%) |
| 15 Years | 82 (9.1%) | 256 (28.5%) |
| 16 and 17 Years | 66 (3.6%) | 172 (9.5%) |
| 18 to 24 Years | 743 (11.8%) | 853 (16.8%) |
| 25 to 34 Years | 514 (5.0%) | 1,880 (19.9%) |
| 35 to 44 Years | 662 (8.5%) | 1,002 (14.1%) |
| 45 to 54 Years | 421 (6.8%) | 708 (12.7%) |
| 55 to 64 Years | 182 (3.9%) | 620 (11.8%) |
| 65 to 74 Years | 271 (8.4%) | 496 (13.8%) |
| 75 Years and over | 235 (17.5%) | 764 (28.3%) |
| Total | 6,674 (11.9%) | 9,659 (17.5%) |
Income Above Poverty by Sex and Age in Odessa
According to the poverty statistics in Odessa, males aged 16 and 17 years and females aged 16 and 17 years are the age groups that are most secure financially, with 96.4% of males and 90.5% of females in these age groups living above the poverty line.
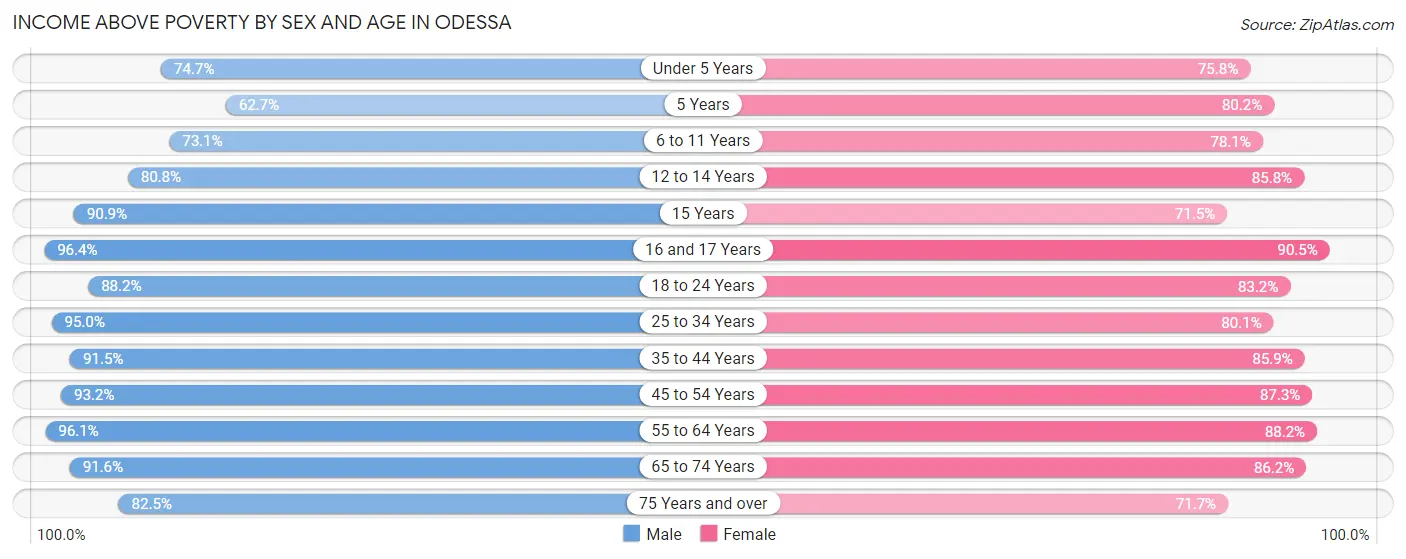
| Age Bracket | Male | Female |
| Under 5 Years | 3,936 (74.7%) | 3,670 (75.8%) |
| 5 Years | 592 (62.6%) | 767 (80.2%) |
| 6 to 11 Years | 3,692 (73.1%) | 4,192 (78.1%) |
| 12 to 14 Years | 1,915 (80.8%) | 2,230 (85.8%) |
| 15 Years | 814 (90.8%) | 643 (71.5%) |
| 16 and 17 Years | 1,747 (96.4%) | 1,646 (90.5%) |
| 18 to 24 Years | 5,541 (88.2%) | 4,228 (83.2%) |
| 25 to 34 Years | 9,753 (95.0%) | 7,577 (80.1%) |
| 35 to 44 Years | 7,160 (91.5%) | 6,099 (85.9%) |
| 45 to 54 Years | 5,785 (93.2%) | 4,868 (87.3%) |
| 55 to 64 Years | 4,517 (96.1%) | 4,631 (88.2%) |
| 65 to 74 Years | 2,954 (91.6%) | 3,089 (86.2%) |
| 75 Years and over | 1,111 (82.5%) | 1,933 (71.7%) |
| Total | 49,517 (88.1%) | 45,573 (82.5%) |
Income Below Poverty Among Married-Couple Families in Odessa
The poverty statistics for married-couple families in Odessa show that 5.2% or 986 of the total 18,897 families live below the poverty line. Families with 5 or more children have the highest poverty rate of 47.2%, comprising of 94 families. On the other hand, families with 1 or 2 children have the lowest poverty rate of 2.9%, which includes 213 families.
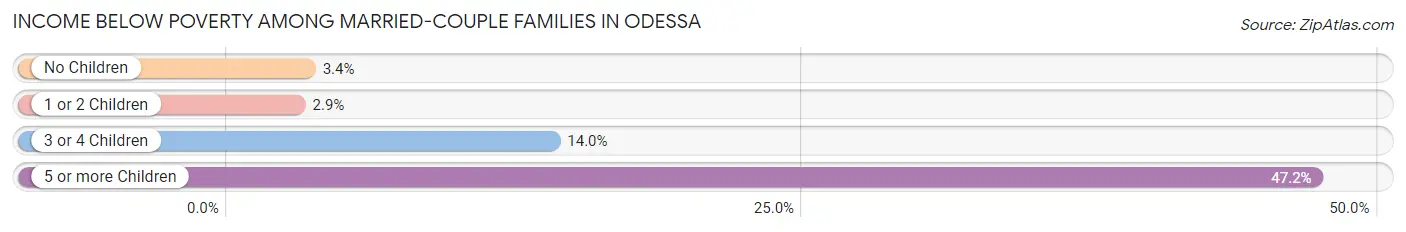
| Children | Above Poverty | Below Poverty |
| No Children | 8,409 (96.6%) | 294 (3.4%) |
| 1 or 2 Children | 7,037 (97.1%) | 213 (2.9%) |
| 3 or 4 Children | 2,360 (86.0%) | 385 (14.0%) |
| 5 or more Children | 105 (52.8%) | 94 (47.2%) |
| Total | 17,911 (94.8%) | 986 (5.2%) |
Income Below Poverty Among Single-Parent Households in Odessa
According to the poverty data in Odessa, 9.8% or 233 single-father households and 29.6% or 2,266 single-mother households are living below the poverty line. Among single-father households, those with 3 or 4 children have the highest poverty rate, with 111 households (43.0%) experiencing poverty. Likewise, among single-mother households, those with 3 or 4 children have the highest poverty rate, with 441 households (53.8%) falling below the poverty line.
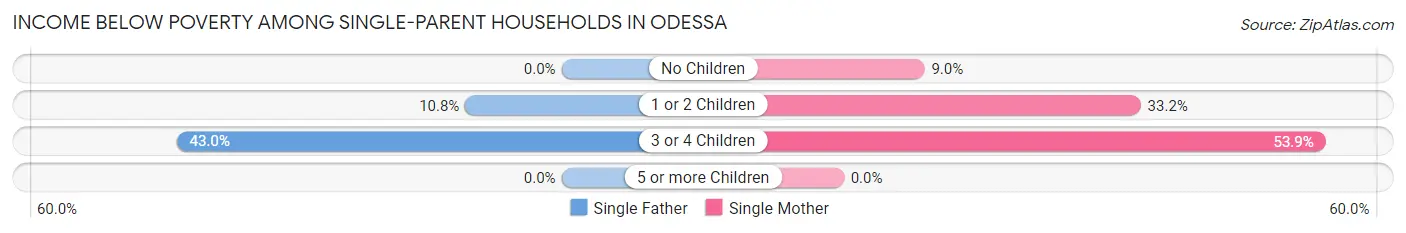
| Children | Single Father | Single Mother |
| No Children | 0 (0.0%) | 167 (9.0%) |
| 1 or 2 Children | 122 (10.8%) | 1,658 (33.2%) |
| 3 or 4 Children | 111 (43.0%) | 441 (53.8%) |
| 5 or more Children | 0 (0.0%) | 0 (0.0%) |
| Total | 233 (9.8%) | 2,266 (29.6%) |
Income Below Poverty Among Married-Couple vs Single-Parent Households in Odessa
The poverty data for Odessa shows that 986 of the married-couple family households (5.2%) and 2,499 of the single-parent households (24.9%) are living below the poverty level. Within the married-couple family households, those with 5 or more children have the highest poverty rate, with 94 households (47.2%) falling below the poverty line. Among the single-parent households, those with 3 or 4 children have the highest poverty rate, with 552 household (51.2%) living below poverty.
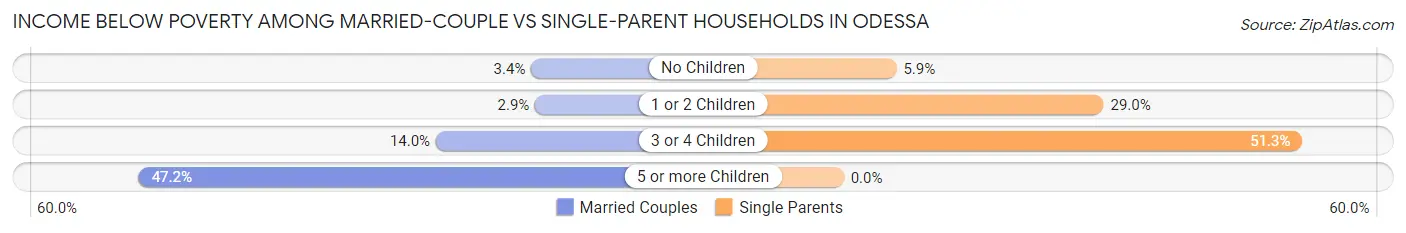
| Children | Married-Couple Families | Single-Parent Households |
| No Children | 294 (3.4%) | 167 (5.9%) |
| 1 or 2 Children | 213 (2.9%) | 1,780 (29.0%) |
| 3 or 4 Children | 385 (14.0%) | 552 (51.2%) |
| 5 or more Children | 94 (47.2%) | 0 (0.0%) |
| Total | 986 (5.2%) | 2,499 (24.9%) |
Race in Odessa
The most populous races in Odessa are Hispanic or Latino (70,262 | 62.0%), White / Caucasian (66,359 | 58.5%), and Some other Race (19,110 | 16.9%).
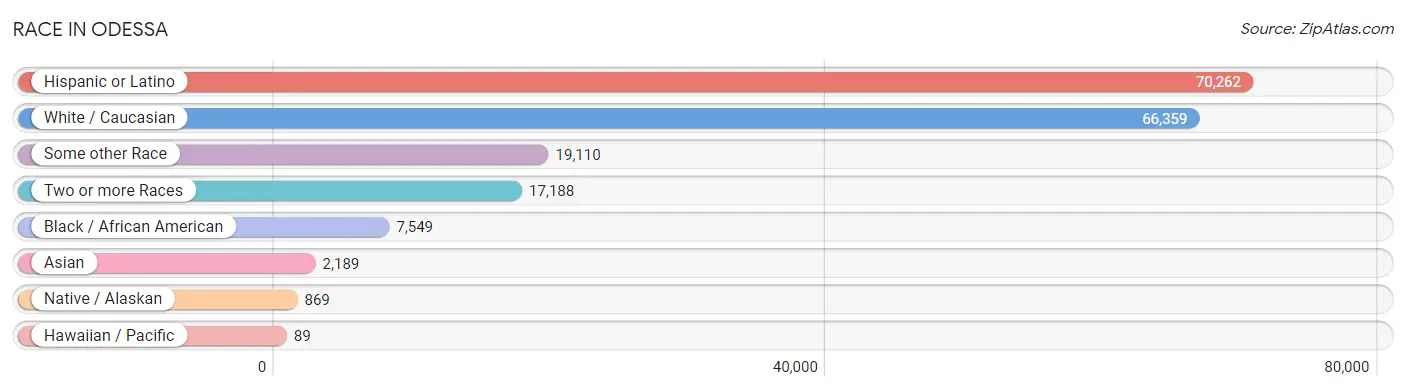
| Race | # Population | % Population |
| Asian | 2,189 | 1.9% |
| Black / African American | 7,549 | 6.7% |
| Hawaiian / Pacific | 89 | 0.1% |
| Hispanic or Latino | 70,262 | 62.0% |
| Native / Alaskan | 869 | 0.8% |
| White / Caucasian | 66,359 | 58.5% |
| Two or more Races | 17,188 | 15.2% |
| Some other Race | 19,110 | 16.9% |
| Total | 113,353 | 100.0% |
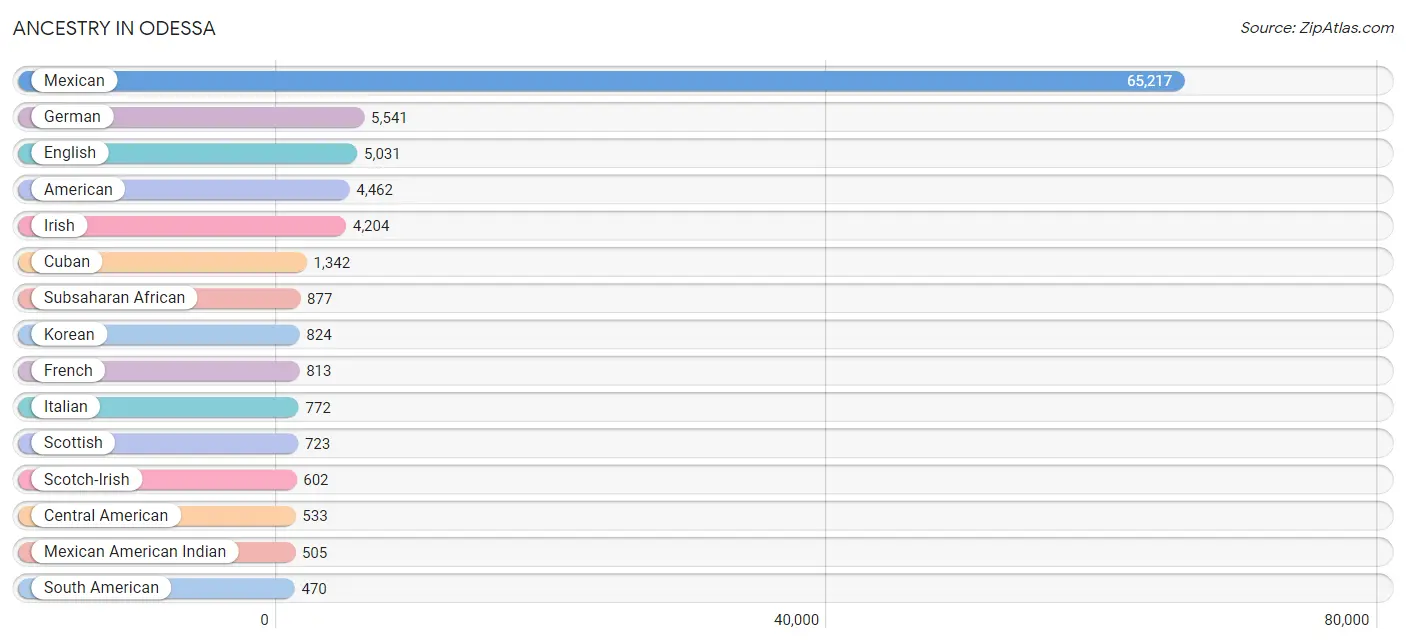
Ancestry in Odessa
The most populous ancestries reported in Odessa are Mexican (65,217 | 57.5%), German (5,541 | 4.9%), English (5,031 | 4.4%), American (4,462 | 3.9%), and Irish (4,204 | 3.7%), together accounting for 74.5% of all Odessa residents.
| Ancestry | # Population | % Population |
| African | 352 | 0.3% |
| Alaska Native | 10 | 0.0% |
| American | 4,462 | 3.9% |
| Apache | 103 | 0.1% |
| Arab | 302 | 0.3% |
| Argentinean | 10 | 0.0% |
| Armenian | 6 | 0.0% |
| Australian | 10 | 0.0% |
| Austrian | 52 | 0.1% |
| Belgian | 92 | 0.1% |
| Bhutanese | 107 | 0.1% |
| Blackfeet | 107 | 0.1% |
| Brazilian | 13 | 0.0% |
| British | 125 | 0.1% |
| Burmese | 157 | 0.1% |
| Canadian | 10 | 0.0% |
| Carpatho Rusyn | 9 | 0.0% |
| Central American | 533 | 0.5% |
| Cherokee | 199 | 0.2% |
| Chickasaw | 37 | 0.0% |
| Chilean | 61 | 0.1% |
| Choctaw | 105 | 0.1% |
| Colombian | 132 | 0.1% |
| Comanche | 75 | 0.1% |
| Cuban | 1,342 | 1.2% |
| Czech | 191 | 0.2% |
| Czechoslovakian | 60 | 0.1% |
| Danish | 11 | 0.0% |
| Delaware | 15 | 0.0% |
| Dominican | 38 | 0.0% |
| Dutch | 214 | 0.2% |
| Dutch West Indian | 18 | 0.0% |
| Eastern European | 40 | 0.0% |
| Egyptian | 290 | 0.3% |
| English | 5,031 | 4.4% |
| European | 416 | 0.4% |
| Finnish | 55 | 0.1% |
| French | 813 | 0.7% |
| French Canadian | 40 | 0.0% |
| German | 5,541 | 4.9% |
| Ghanaian | 9 | 0.0% |
| Greek | 50 | 0.0% |
| Guamanian / Chamorro | 27 | 0.0% |
| Guatemalan | 87 | 0.1% |
| Guyanese | 25 | 0.0% |
| Haitian | 54 | 0.1% |
| Honduran | 162 | 0.1% |
| Hungarian | 180 | 0.2% |
| Indian (Asian) | 400 | 0.4% |
| Iranian | 27 | 0.0% |
| Irish | 4,204 | 3.7% |
| Israeli | 11 | 0.0% |
| Italian | 772 | 0.7% |
| Kenyan | 148 | 0.1% |
| Korean | 824 | 0.7% |
| Lithuanian | 18 | 0.0% |
| Malaysian | 23 | 0.0% |
| Mexican | 65,217 | 57.5% |
| Mexican American Indian | 505 | 0.4% |
| Native Hawaiian | 310 | 0.3% |
| Navajo | 260 | 0.2% |
| Nicaraguan | 73 | 0.1% |
| Nigerian | 167 | 0.2% |
| Northern European | 42 | 0.0% |
| Norwegian | 221 | 0.2% |
| Osage | 105 | 0.1% |
| Pakistani | 1 | 0.0% |
| Panamanian | 76 | 0.1% |
| Pennsylvania German | 16 | 0.0% |
| Polish | 380 | 0.3% |
| Portuguese | 60 | 0.1% |
| Potawatomi | 20 | 0.0% |
| Pueblo | 67 | 0.1% |
| Puerto Rican | 429 | 0.4% |
| Romanian | 6 | 0.0% |
| Russian | 210 | 0.2% |
| Salvadoran | 135 | 0.1% |
| Scandinavian | 176 | 0.2% |
| Scotch-Irish | 602 | 0.5% |
| Scottish | 723 | 0.6% |
| Slavic | 9 | 0.0% |
| South American | 470 | 0.4% |
| Spaniard | 445 | 0.4% |
| Spanish | 180 | 0.2% |
| Sri Lankan | 366 | 0.3% |
| Subsaharan African | 877 | 0.8% |
| Swedish | 238 | 0.2% |
| Swiss | 34 | 0.0% |
| Syrian | 12 | 0.0% |
| Thai | 364 | 0.3% |
| Trinidadian and Tobagonian | 8 | 0.0% |
| Turkish | 81 | 0.1% |
| Venezuelan | 267 | 0.2% |
| Vietnamese | 22 | 0.0% |
| Welsh | 127 | 0.1% | View All 95 Rows |
Immigrants in Odessa
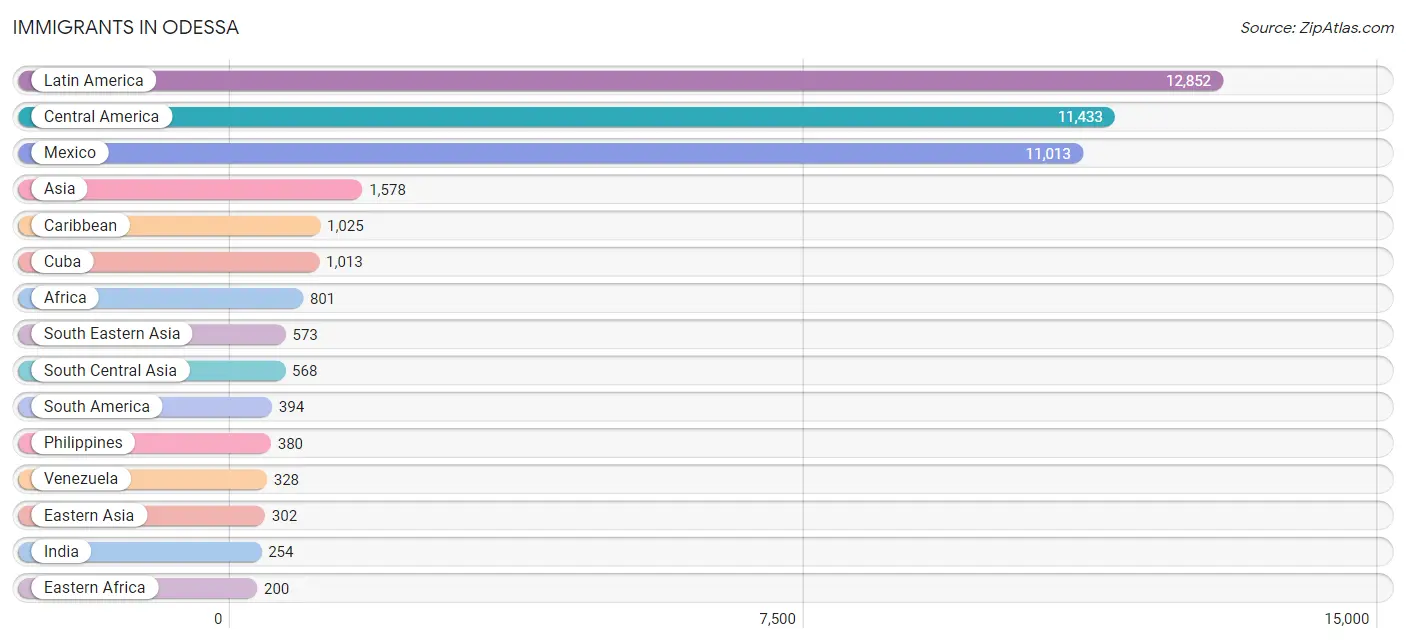
The most numerous immigrant groups reported in Odessa came from Latin America (12,852 | 11.3%), Central America (11,433 | 10.1%), Mexico (11,013 | 9.7%), Asia (1,578 | 1.4%), and Caribbean (1,025 | 0.9%), together accounting for 33.4% of all Odessa residents.
| Immigration Origin | # Population | % Population |
| Africa | 801 | 0.7% |
| Asia | 1,578 | 1.4% |
| Australia | 10 | 0.0% |
| Austria | 5 | 0.0% |
| Bangladesh | 22 | 0.0% |
| Brazil | 17 | 0.0% |
| Cameroon | 15 | 0.0% |
| Canada | 166 | 0.2% |
| Caribbean | 1,025 | 0.9% |
| Central America | 11,433 | 10.1% |
| China | 166 | 0.2% |
| Colombia | 49 | 0.0% |
| Cuba | 1,013 | 0.9% |
| Eastern Africa | 200 | 0.2% |
| Eastern Asia | 302 | 0.3% |
| Egypt | 200 | 0.2% |
| El Salvador | 119 | 0.1% |
| England | 25 | 0.0% |
| Europe | 184 | 0.2% |
| Germany | 50 | 0.0% |
| Ghana | 2 | 0.0% |
| Guatemala | 78 | 0.1% |
| Honduras | 162 | 0.1% |
| India | 254 | 0.2% |
| Ireland | 19 | 0.0% |
| Israel | 11 | 0.0% |
| Italy | 29 | 0.0% |
| Japan | 12 | 0.0% |
| Kazakhstan | 83 | 0.1% |
| Kenya | 200 | 0.2% |
| Korea | 124 | 0.1% |
| Laos | 23 | 0.0% |
| Latin America | 12,852 | 11.3% |
| Malaysia | 28 | 0.0% |
| Mexico | 11,013 | 9.7% |
| Middle Africa | 162 | 0.1% |
| Nepal | 19 | 0.0% |
| Nicaragua | 28 | 0.0% |
| Nigeria | 167 | 0.2% |
| Northern Africa | 200 | 0.2% |
| Northern Europe | 65 | 0.1% |
| Oceania | 10 | 0.0% |
| Pakistan | 190 | 0.2% |
| Panama | 33 | 0.0% |
| Philippines | 380 | 0.3% |
| South America | 394 | 0.4% |
| South Central Asia | 568 | 0.5% |
| South Eastern Asia | 573 | 0.5% |
| Southern Europe | 64 | 0.1% |
| Spain | 35 | 0.0% |
| Taiwan | 24 | 0.0% |
| Thailand | 1 | 0.0% |
| Trinidad and Tobago | 12 | 0.0% |
| Turkey | 124 | 0.1% |
| Venezuela | 328 | 0.3% |
| Vietnam | 141 | 0.1% |
| Western Africa | 169 | 0.2% |
| Western Asia | 135 | 0.1% |
| Western Europe | 55 | 0.1% | View All 59 Rows |
Sex and Age in Odessa
Sex and Age in Odessa
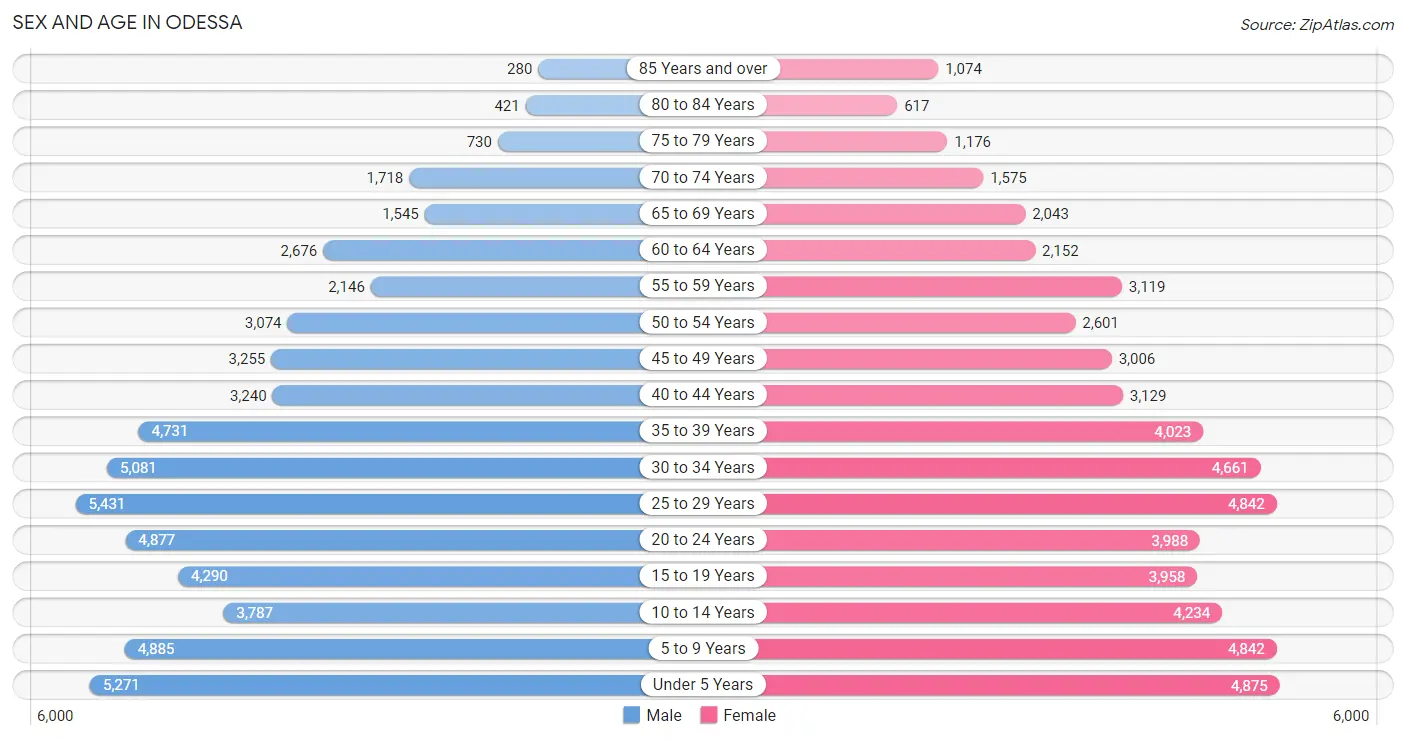
The most populous age groups in Odessa are 25 to 29 Years (5,431 | 9.5%) for men and Under 5 Years (4,875 | 8.7%) for women.
| Age Bracket | Male | Female |
| Under 5 Years | 5,271 (9.2%) | 4,875 (8.7%) |
| 5 to 9 Years | 4,885 (8.5%) | 4,842 (8.7%) |
| 10 to 14 Years | 3,787 (6.6%) | 4,234 (7.6%) |
| 15 to 19 Years | 4,290 (7.5%) | 3,958 (7.1%) |
| 20 to 24 Years | 4,877 (8.5%) | 3,988 (7.1%) |
| 25 to 29 Years | 5,431 (9.5%) | 4,842 (8.7%) |
| 30 to 34 Years | 5,081 (8.8%) | 4,661 (8.3%) |
| 35 to 39 Years | 4,731 (8.2%) | 4,023 (7.2%) |
| 40 to 44 Years | 3,240 (5.6%) | 3,129 (5.6%) |
| 45 to 49 Years | 3,255 (5.7%) | 3,006 (5.4%) |
| 50 to 54 Years | 3,074 (5.3%) | 2,601 (4.6%) |
| 55 to 59 Years | 2,146 (3.7%) | 3,119 (5.6%) |
| 60 to 64 Years | 2,676 (4.7%) | 2,152 (3.8%) |
| 65 to 69 Years | 1,545 (2.7%) | 2,043 (3.6%) |
| 70 to 74 Years | 1,718 (3.0%) | 1,575 (2.8%) |
| 75 to 79 Years | 730 (1.3%) | 1,176 (2.1%) |
| 80 to 84 Years | 421 (0.7%) | 617 (1.1%) |
| 85 Years and over | 280 (0.5%) | 1,074 (1.9%) |
| Total | 57,438 (100.0%) | 55,915 (100.0%) |
Families and Households in Odessa
Median Family Size in Odessa
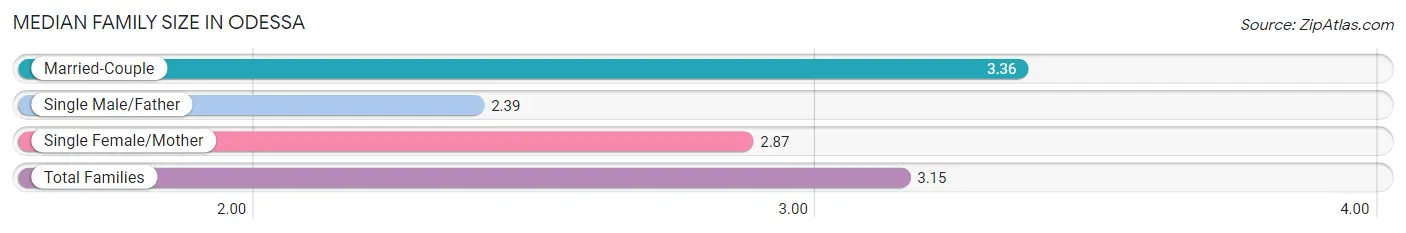
The median family size in Odessa is 3.15 persons per family, with married-couple families (18,897 | 65.3%) accounting for the largest median family size of 3.36 persons per family. On the other hand, single male/father families (2,374 | 8.2%) represent the smallest median family size with 2.39 persons per family.
| Family Type | # Families | Family Size |
| Married-Couple | 18,897 (65.3%) | 3.36 |
| Single Male/Father | 2,374 (8.2%) | 2.39 |
| Single Female/Mother | 7,664 (26.5%) | 2.87 |
| Total Families | 28,935 (100.0%) | 3.15 |
Median Household Size in Odessa
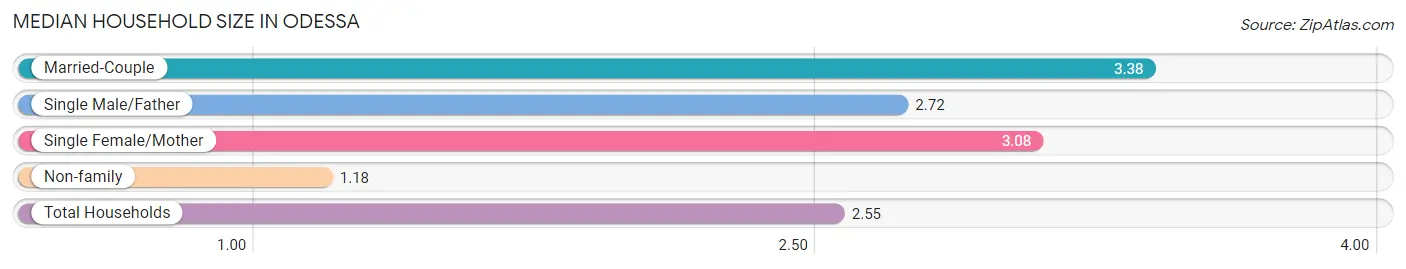
The median household size in Odessa is 2.55 persons per household, with married-couple households (18,897 | 43.1%) accounting for the largest median household size of 3.38 persons per household. non-family households (14,867 | 33.9%) represent the smallest median household size with 1.18 persons per household.
| Household Type | # Households | Household Size |
| Married-Couple | 18,897 (43.1%) | 3.38 |
| Single Male/Father | 2,374 (5.4%) | 2.72 |
| Single Female/Mother | 7,664 (17.5%) | 3.08 |
| Non-family | 14,867 (33.9%) | 1.18 |
| Total Households | 43,802 (100.0%) | 2.55 |
Household Size by Marriage Status in Odessa
Out of a total of 43,802 households in Odessa, 28,935 (66.1%) are family households, while 14,867 (33.9%) are nonfamily households. The most numerous type of family households are 2-person households, comprising 10,397, and the most common type of nonfamily households are 1-person households, comprising 12,264.
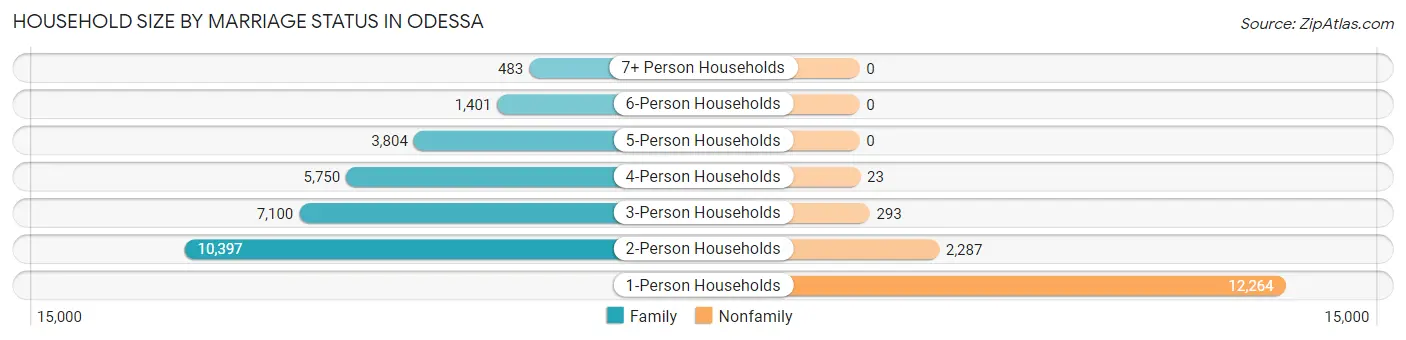
| Household Size | Family Households | Nonfamily Households |
| 1-Person Households | - | 12,264 (28.0%) |
| 2-Person Households | 10,397 (23.7%) | 2,287 (5.2%) |
| 3-Person Households | 7,100 (16.2%) | 293 (0.7%) |
| 4-Person Households | 5,750 (13.1%) | 23 (0.1%) |
| 5-Person Households | 3,804 (8.7%) | 0 (0.0%) |
| 6-Person Households | 1,401 (3.2%) | 0 (0.0%) |
| 7+ Person Households | 483 (1.1%) | 0 (0.0%) |
| Total | 28,935 (66.1%) | 14,867 (33.9%) |
Female Fertility in Odessa
Fertility by Age in Odessa
Average fertility rate in Odessa is 85.0 births per 1,000 women. Women in the age bracket of 20 to 34 years have the highest fertility rate with 141.0 births per 1,000 women. Women in the age bracket of 20 to 34 years acount for 80.2% of all women with births.
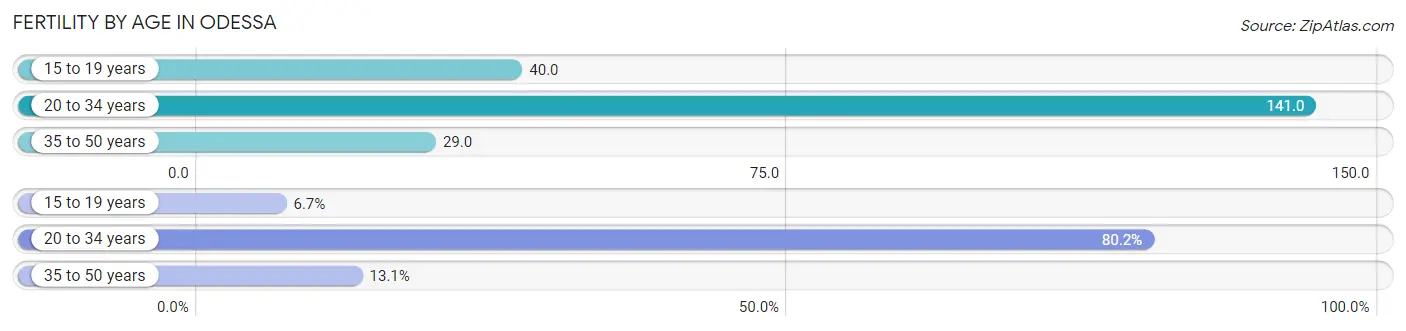
| Age Bracket | Women with Births | Births / 1,000 Women |
| 15 to 19 years | 158 (6.7%) | 40.0 |
| 20 to 34 years | 1,904 (80.2%) | 141.0 |
| 35 to 50 years | 311 (13.1%) | 29.0 |
| Total | 2,373 (100.0%) | 85.0 |
Fertility by Age by Marriage Status in Odessa
60.3% of women with births (2,373) in Odessa are married. The highest percentage of unmarried women with births falls into 15 to 19 years age bracket with 98.1% of them unmarried at the time of birth, while the lowest percentage of unmarried women with births belong to 35 to 50 years age bracket with 31.8% of them unmarried.
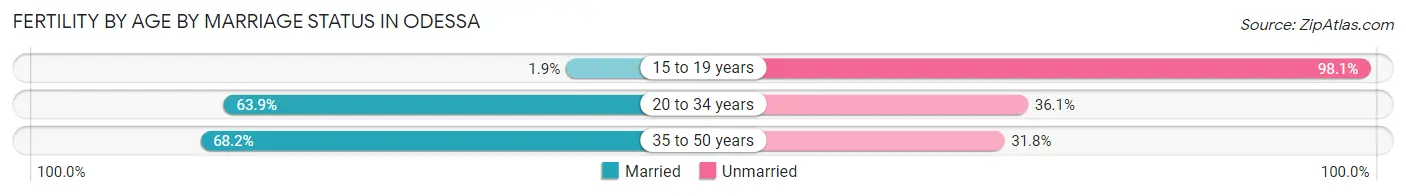
| Age Bracket | Married | Unmarried |
| 15 to 19 years | 3 (1.9%) | 155 (98.1%) |
| 20 to 34 years | 1,217 (63.9%) | 687 (36.1%) |
| 35 to 50 years | 212 (68.2%) | 99 (31.8%) |
| Total | 1,431 (60.3%) | 942 (39.7%) |
Fertility by Education in Odessa
Average fertility rate in Odessa is 85.0 births per 1,000 women. Women with the education attainment of bachelor's degree have the highest fertility rate of 117.0 births per 1,000 women, while women with the education attainment of graduate degree have the lowest fertility at 36.0 births per 1,000 women. Women with the education attainment of college or associate's degree represent 44.4% of all women with births.
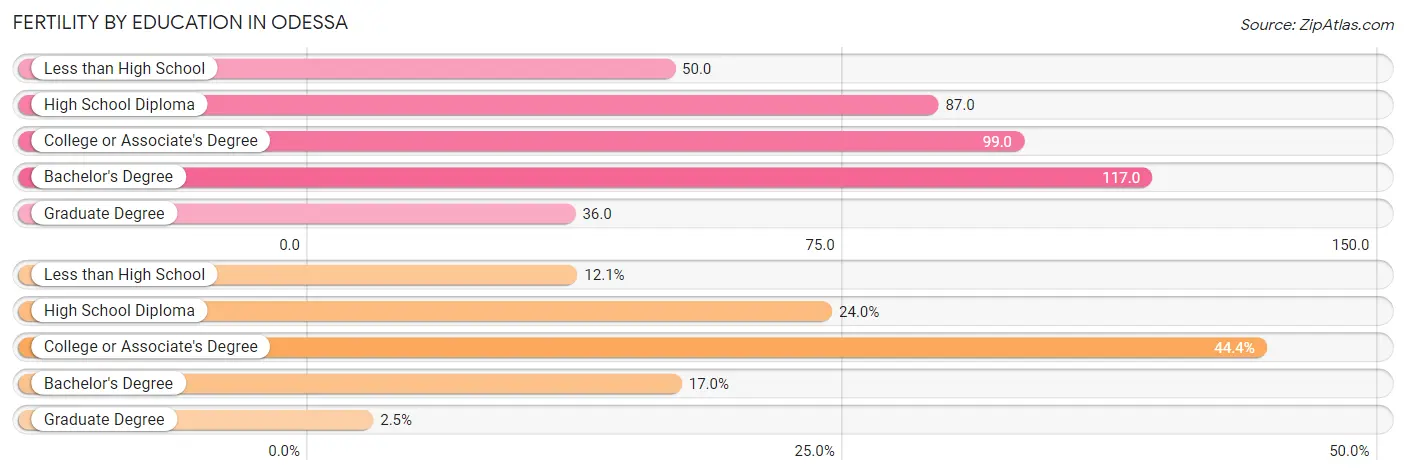
| Educational Attainment | Women with Births | Births / 1,000 Women |
| Less than High School | 287 (12.1%) | 50.0 |
| High School Diploma | 570 (24.0%) | 87.0 |
| College or Associate's Degree | 1,053 (44.4%) | 99.0 |
| Bachelor's Degree | 403 (17.0%) | 117.0 |
| Graduate Degree | 60 (2.5%) | 36.0 |
| Total | 2,373 (100.0%) | 85.0 |
Fertility by Education by Marriage Status in Odessa
39.7% of women with births in Odessa are unmarried. Women with the educational attainment of graduate degree are most likely to be married with 100.0% of them married at childbirth, while women with the educational attainment of less than high school are least likely to be married with 70.7% of them unmarried at childbirth.
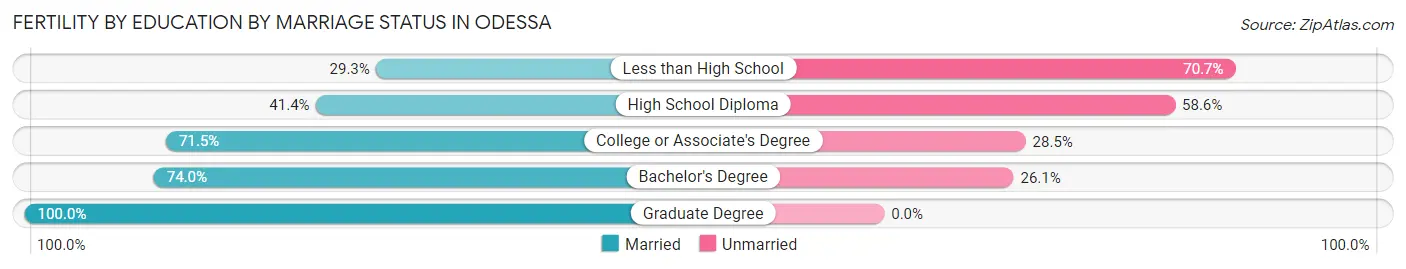
| Educational Attainment | Married | Unmarried |
| Less than High School | 84 (29.3%) | 203 (70.7%) |
| High School Diploma | 236 (41.4%) | 334 (58.6%) |
| College or Associate's Degree | 753 (71.5%) | 300 (28.5%) |
| Bachelor's Degree | 298 (74.0%) | 105 (26.1%) |
| Graduate Degree | 60 (100.0%) | 0 (0.0%) |
| Total | 1,431 (60.3%) | 942 (39.7%) |
Employment Characteristics in Odessa
Employment by Class of Employer in Odessa
Among the 52,871 employed individuals in Odessa, private company employees (38,083 | 72.0%), local government employees (4,350 | 8.2%), and self-employed (not incorporated) (3,260 | 6.2%) make up the most common classes of employment.
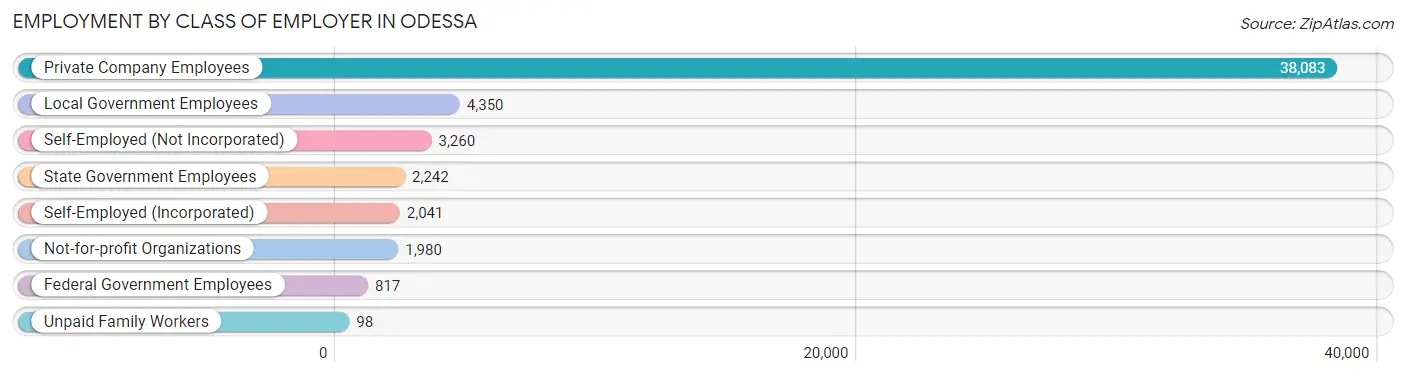
| Employer Class | # Employees | % Employees |
| Private Company Employees | 38,083 | 72.0% |
| Self-Employed (Incorporated) | 2,041 | 3.9% |
| Self-Employed (Not Incorporated) | 3,260 | 6.2% |
| Not-for-profit Organizations | 1,980 | 3.7% |
| Local Government Employees | 4,350 | 8.2% |
| State Government Employees | 2,242 | 4.2% |
| Federal Government Employees | 817 | 1.5% |
| Unpaid Family Workers | 98 | 0.2% |
| Total | 52,871 | 100.0% |
Employment Status by Age in Odessa
According to the labor force statistics for Odessa, out of the total population over 16 years of age (83,664), 69.1% or 57,812 individuals are in the labor force, with 6.1% or 3,527 of them unemployed. The age group with the highest labor force participation rate is 35 to 44 years, with 85.2% or 12,885 individuals in the labor force. Within the labor force, the 16 to 19 years age range has the highest percentage of unemployed individuals, with 11.7% or 330 of them being unemployed.
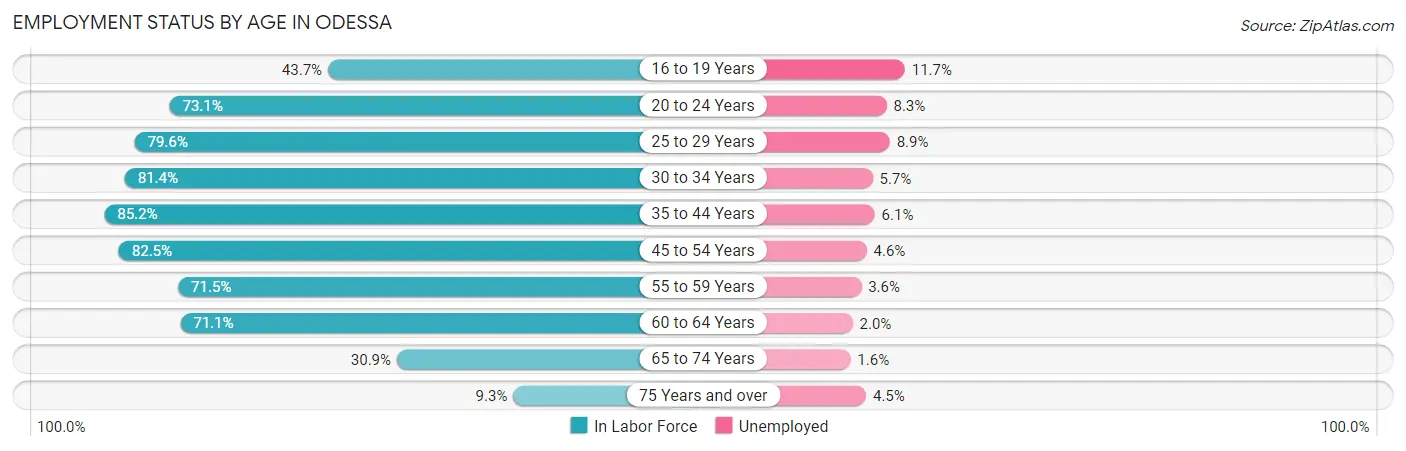
| Age Bracket | In Labor Force | Unemployed |
| 16 to 19 Years | 2,820 (43.7%) | 330 (11.7%) |
| 20 to 24 Years | 6,480 (73.1%) | 538 (8.3%) |
| 25 to 29 Years | 8,177 (79.6%) | 728 (8.9%) |
| 30 to 34 Years | 7,930 (81.4%) | 452 (5.7%) |
| 35 to 44 Years | 12,885 (85.2%) | 786 (6.1%) |
| 45 to 54 Years | 9,847 (82.5%) | 453 (4.6%) |
| 55 to 59 Years | 3,764 (71.5%) | 136 (3.6%) |
| 60 to 64 Years | 3,433 (71.1%) | 69 (2.0%) |
| 65 to 74 Years | 2,126 (30.9%) | 34 (1.6%) |
| 75 Years and over | 400 (9.3%) | 18 (4.5%) |
| Total | 57,812 (69.1%) | 3,527 (6.1%) |
Employment Status by Educational Attainment in Odessa
According to labor force statistics for Odessa, 80.5% of individuals (46,019) out of the total population between 25 and 64 years of age (57,167) are in the labor force, with 5.7% or 2,623 of them being unemployed. The group with the highest labor force participation rate are those with the educational attainment of bachelor's degree or higher, with 86.8% or 9,364 individuals in the labor force. Within the labor force, individuals with less than high school education have the highest percentage of unemployment, with 8.6% or 594 of them being unemployed.
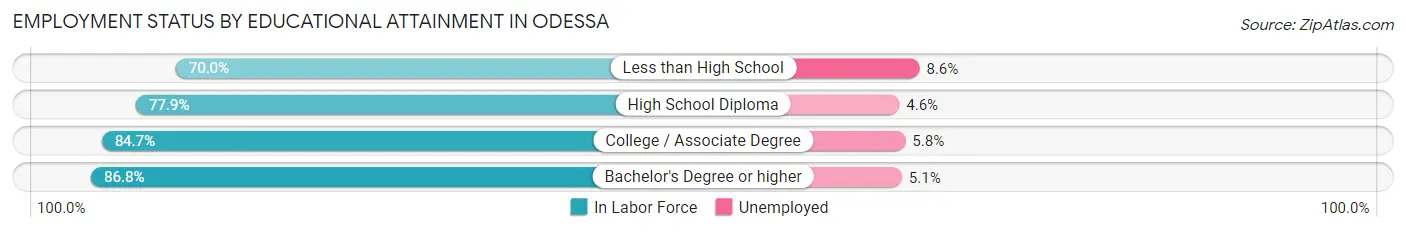
| Educational Attainment | In Labor Force | Unemployed |
| Less than High School | 6,903 (70.0%) | 848 (8.6%) |
| High School Diploma | 13,252 (77.9%) | 783 (4.6%) |
| College / Associate Degree | 16,522 (84.7%) | 1,131 (5.8%) |
| Bachelor's Degree or higher | 9,364 (86.8%) | 550 (5.1%) |
| Total | 46,019 (80.5%) | 3,259 (5.7%) |
Employment Occupations by Sex in Odessa
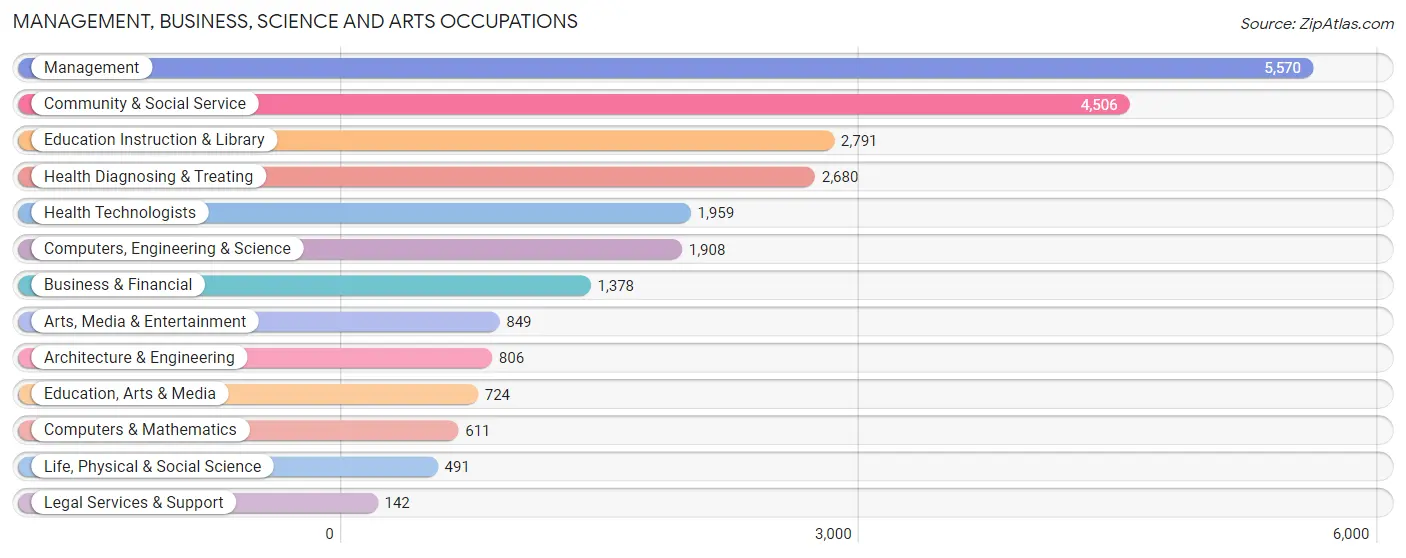
Management, Business, Science and Arts Occupations
The most common Management, Business, Science and Arts occupations in Odessa are Management (5,570 | 10.3%), Community & Social Service (4,506 | 8.3%), Education Instruction & Library (2,791 | 5.1%), Health Diagnosing & Treating (2,680 | 4.9%), and Health Technologists (1,959 | 3.6%).
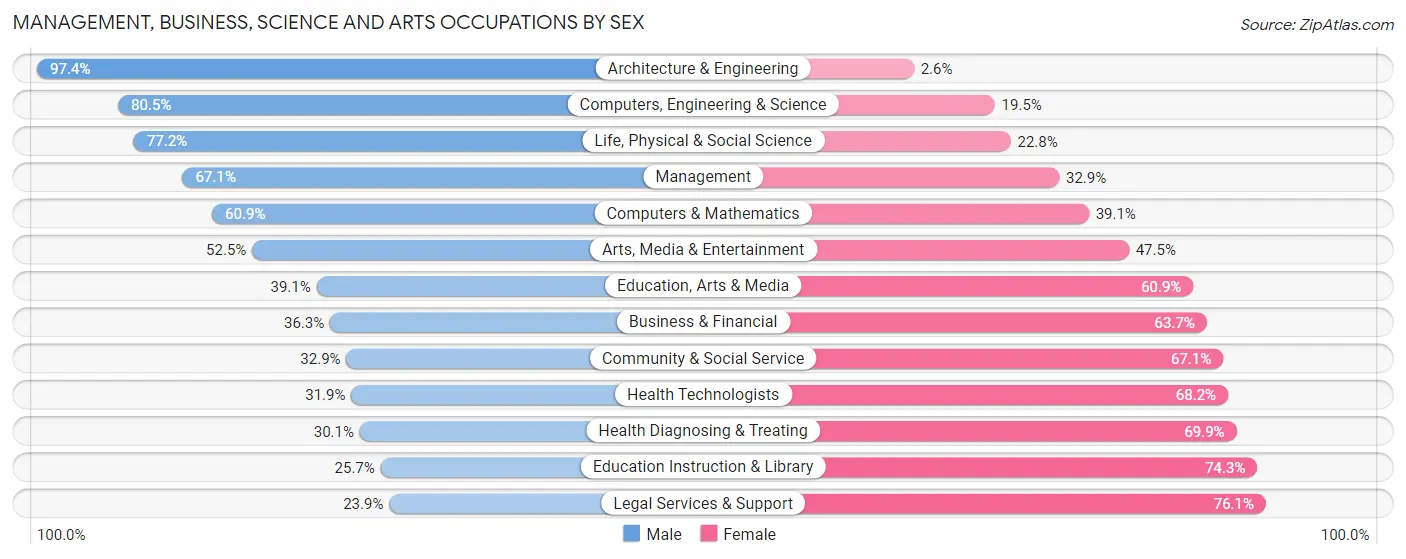
Management, Business, Science and Arts Occupations by Sex
Within the Management, Business, Science and Arts occupations in Odessa, the most male-oriented occupations are Architecture & Engineering (97.4%), Computers, Engineering & Science (80.5%), and Life, Physical & Social Science (77.2%), while the most female-oriented occupations are Legal Services & Support (76.1%), Education Instruction & Library (74.3%), and Health Diagnosing & Treating (69.9%).
| Occupation | Male | Female |
| Management | 3,735 (67.1%) | 1,835 (32.9%) |
| Business & Financial | 500 (36.3%) | 878 (63.7%) |
| Computers, Engineering & Science | 1,536 (80.5%) | 372 (19.5%) |
| Computers & Mathematics | 372 (60.9%) | 239 (39.1%) |
| Architecture & Engineering | 785 (97.4%) | 21 (2.6%) |
| Life, Physical & Social Science | 379 (77.2%) | 112 (22.8%) |
| Community & Social Service | 1,481 (32.9%) | 3,025 (67.1%) |
| Education, Arts & Media | 283 (39.1%) | 441 (60.9%) |
| Legal Services & Support | 34 (23.9%) | 108 (76.1%) |
| Education Instruction & Library | 718 (25.7%) | 2,073 (74.3%) |
| Arts, Media & Entertainment | 446 (52.5%) | 403 (47.5%) |
| Health Diagnosing & Treating | 806 (30.1%) | 1,874 (69.9%) |
| Health Technologists | 624 (31.9%) | 1,335 (68.1%) |
| Total (Category) | 8,058 (50.2%) | 7,984 (49.8%) |
| Total (Overall) | 32,461 (59.8%) | 21,807 (40.2%) |
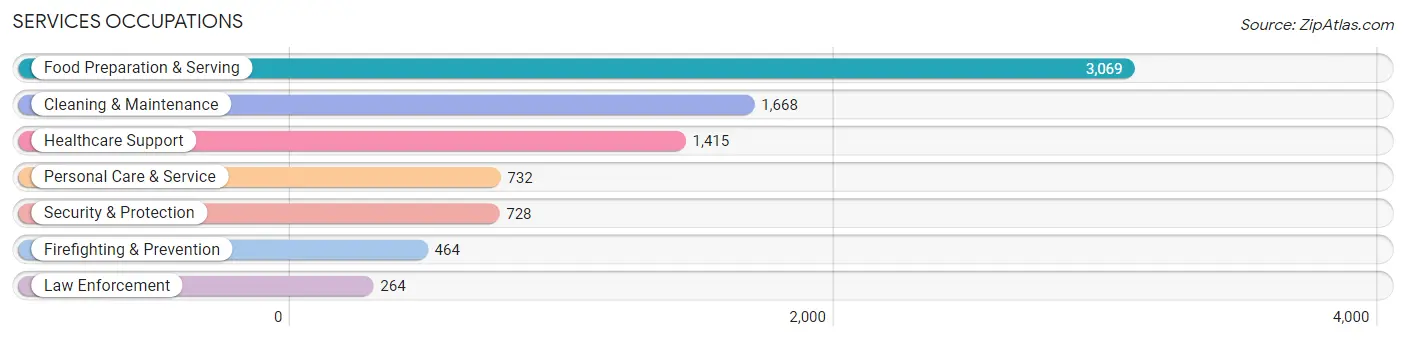
Services Occupations
The most common Services occupations in Odessa are Food Preparation & Serving (3,069 | 5.7%), Cleaning & Maintenance (1,668 | 3.1%), Healthcare Support (1,415 | 2.6%), Personal Care & Service (732 | 1.3%), and Security & Protection (728 | 1.3%).
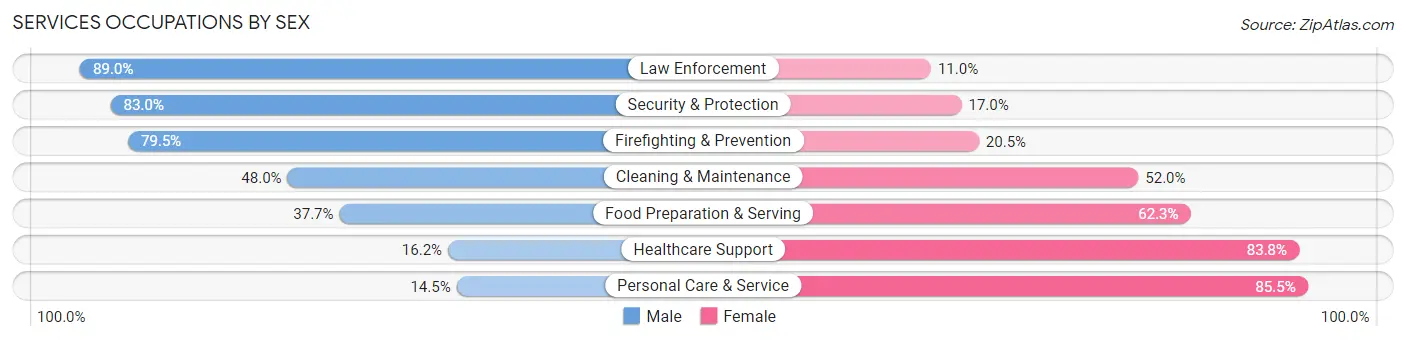
Services Occupations by Sex
Within the Services occupations in Odessa, the most male-oriented occupations are Law Enforcement (89.0%), Security & Protection (83.0%), and Firefighting & Prevention (79.5%), while the most female-oriented occupations are Personal Care & Service (85.5%), Healthcare Support (83.8%), and Food Preparation & Serving (62.3%).
| Occupation | Male | Female |
| Healthcare Support | 229 (16.2%) | 1,186 (83.8%) |
| Security & Protection | 604 (83.0%) | 124 (17.0%) |
| Firefighting & Prevention | 369 (79.5%) | 95 (20.5%) |
| Law Enforcement | 235 (89.0%) | 29 (11.0%) |
| Food Preparation & Serving | 1,156 (37.7%) | 1,913 (62.3%) |
| Cleaning & Maintenance | 800 (48.0%) | 868 (52.0%) |
| Personal Care & Service | 106 (14.5%) | 626 (85.5%) |
| Total (Category) | 2,895 (38.0%) | 4,717 (62.0%) |
| Total (Overall) | 32,461 (59.8%) | 21,807 (40.2%) |
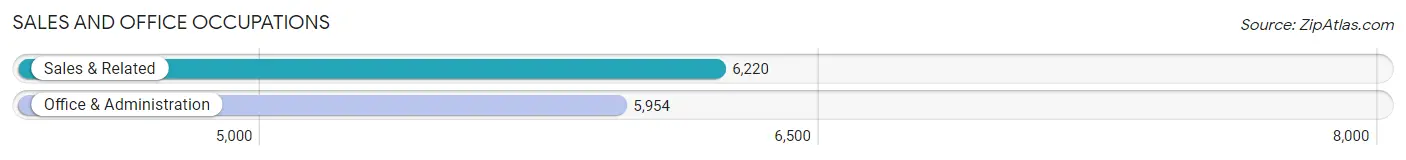
Sales and Office Occupations
The most common Sales and Office occupations in Odessa are Sales & Related (6,220 | 11.5%), and Office & Administration (5,954 | 11.0%).
Sales and Office Occupations by Sex
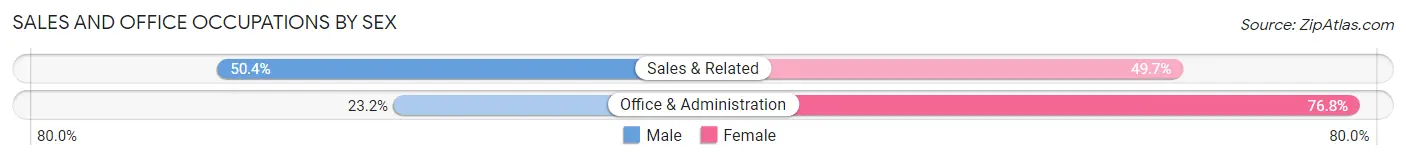
| Occupation | Male | Female |
| Sales & Related | 3,132 (50.3%) | 3,088 (49.6%) |
| Office & Administration | 1,380 (23.2%) | 4,574 (76.8%) |
| Total (Category) | 4,512 (37.1%) | 7,662 (62.9%) |
| Total (Overall) | 32,461 (59.8%) | 21,807 (40.2%) |
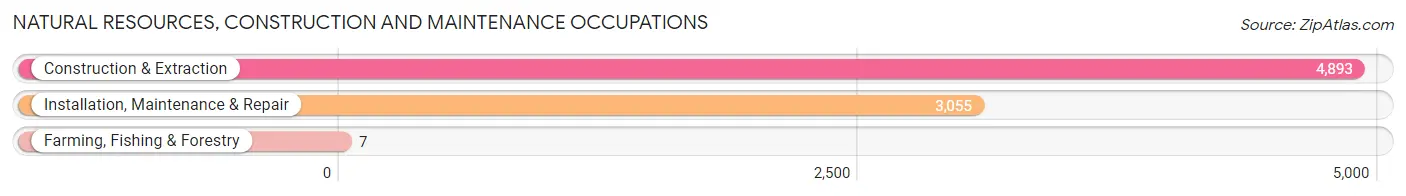
Natural Resources, Construction and Maintenance Occupations
The most common Natural Resources, Construction and Maintenance occupations in Odessa are Construction & Extraction (4,893 | 9.0%), Installation, Maintenance & Repair (3,055 | 5.6%), and Farming, Fishing & Forestry (7 | 0.0%).
Natural Resources, Construction and Maintenance Occupations by Sex
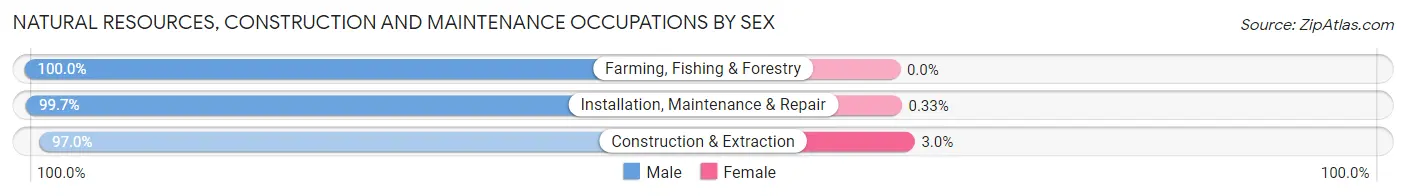
| Occupation | Male | Female |
| Farming, Fishing & Forestry | 7 (100.0%) | 0 (0.0%) |
| Construction & Extraction | 4,745 (97.0%) | 148 (3.0%) |
| Installation, Maintenance & Repair | 3,045 (99.7%) | 10 (0.3%) |
| Total (Category) | 7,797 (98.0%) | 158 (2.0%) |
| Total (Overall) | 32,461 (59.8%) | 21,807 (40.2%) |
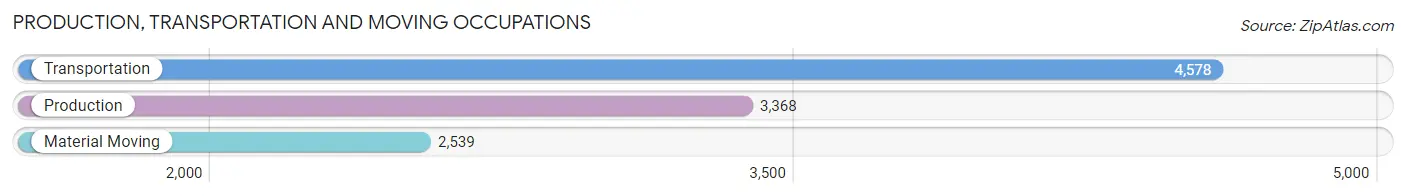
Production, Transportation and Moving Occupations
The most common Production, Transportation and Moving occupations in Odessa are Transportation (4,578 | 8.4%), Production (3,368 | 6.2%), and Material Moving (2,539 | 4.7%).
Production, Transportation and Moving Occupations by Sex
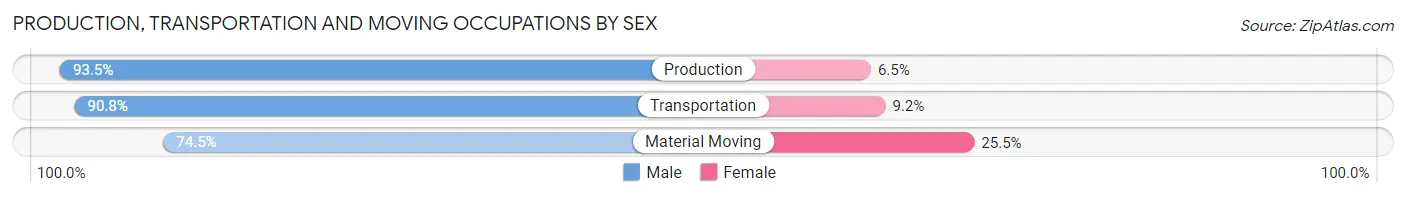
| Occupation | Male | Female |
| Production | 3,149 (93.5%) | 219 (6.5%) |
| Transportation | 4,158 (90.8%) | 420 (9.2%) |
| Material Moving | 1,892 (74.5%) | 647 (25.5%) |
| Total (Category) | 9,199 (87.7%) | 1,286 (12.3%) |
| Total (Overall) | 32,461 (59.8%) | 21,807 (40.2%) |
Employment Industries by Sex in Odessa
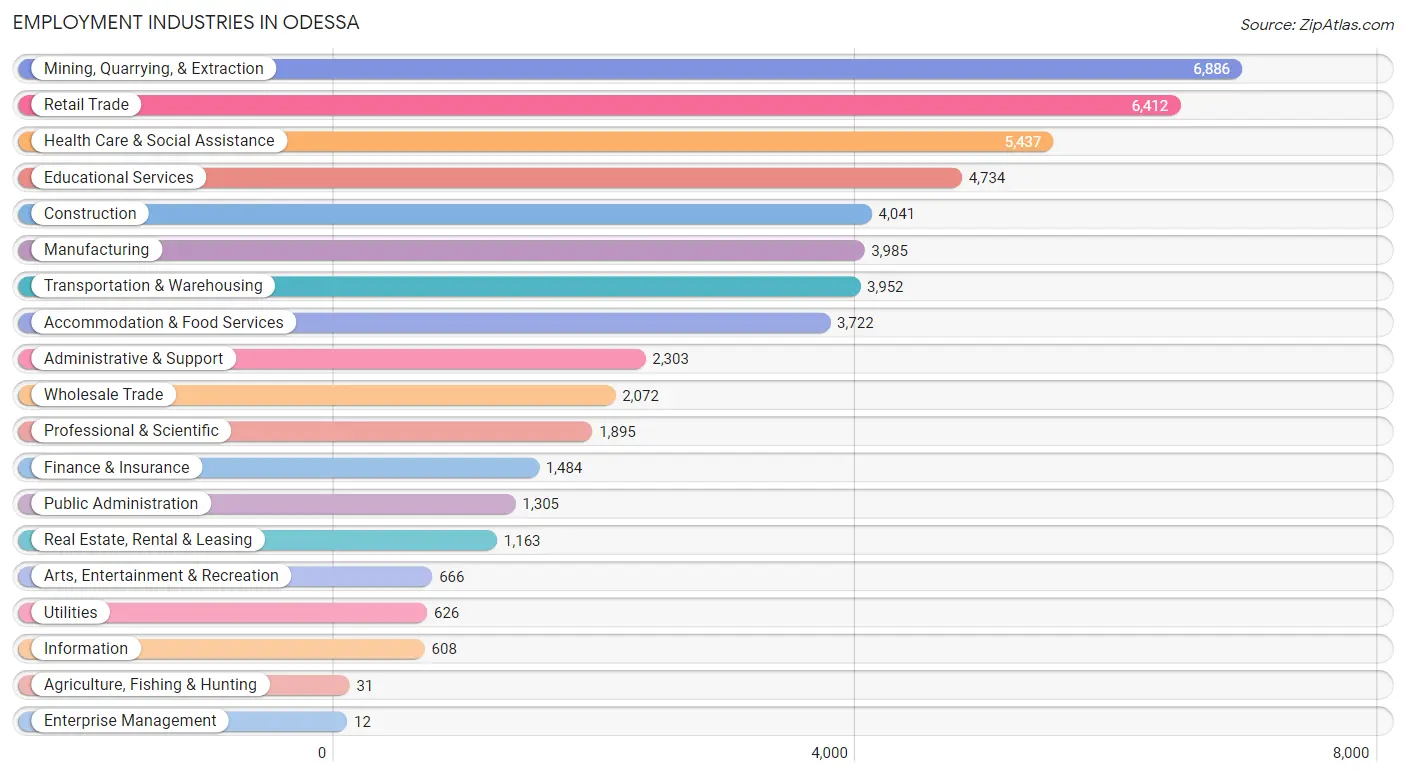
Employment Industries in Odessa
The major employment industries in Odessa include Mining, Quarrying, & Extraction (6,886 | 12.7%), Retail Trade (6,412 | 11.8%), Health Care & Social Assistance (5,437 | 10.0%), Educational Services (4,734 | 8.7%), and Construction (4,041 | 7.4%).
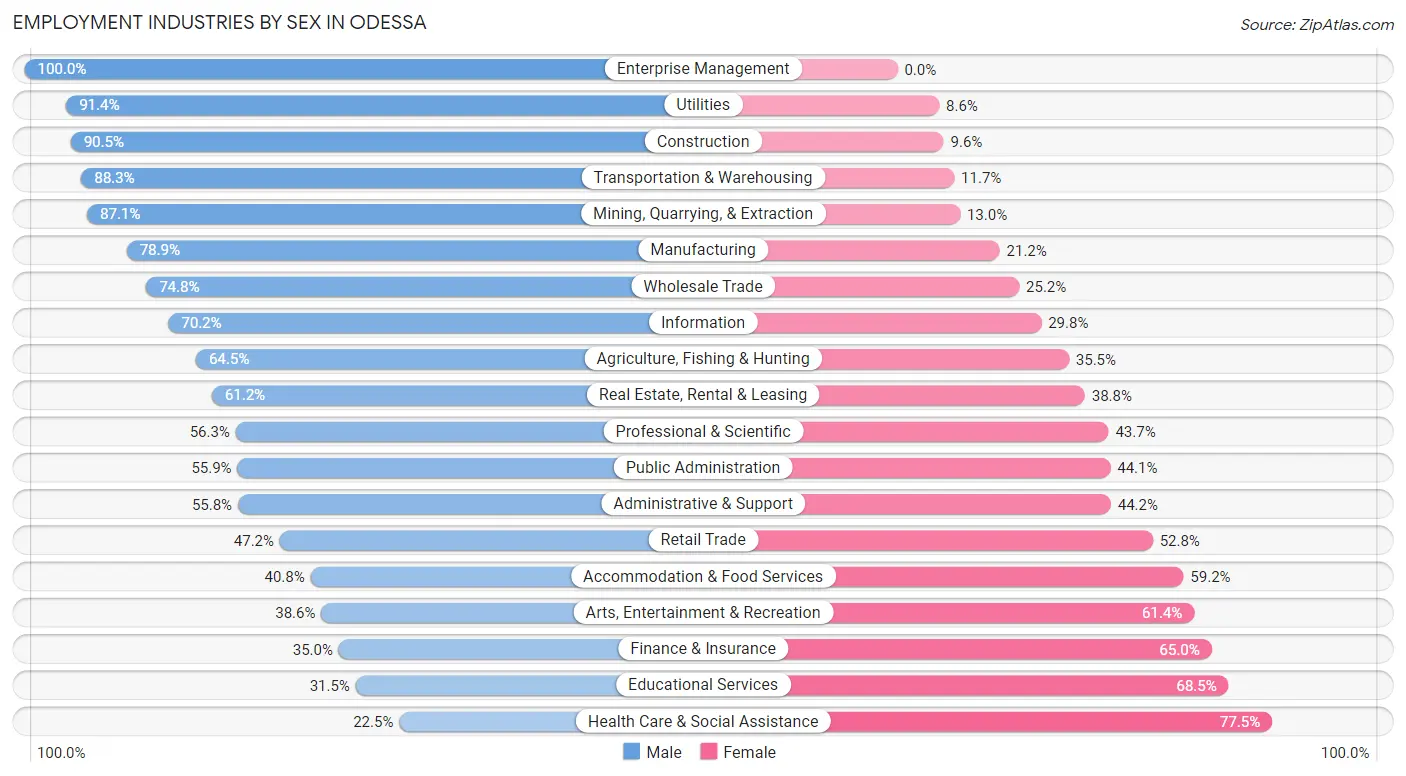
Employment Industries by Sex in Odessa
The Odessa industries that see more men than women are Enterprise Management (100.0%), Utilities (91.4%), and Construction (90.4%), whereas the industries that tend to have a higher number of women are Health Care & Social Assistance (77.5%), Educational Services (68.5%), and Finance & Insurance (65.0%).
| Industry | Male | Female |
| Agriculture, Fishing & Hunting | 20 (64.5%) | 11 (35.5%) |
| Mining, Quarrying, & Extraction | 5,994 (87.1%) | 892 (13.0%) |
| Construction | 3,655 (90.4%) | 386 (9.6%) |
| Manufacturing | 3,142 (78.8%) | 843 (21.1%) |
| Wholesale Trade | 1,550 (74.8%) | 522 (25.2%) |
| Retail Trade | 3,024 (47.2%) | 3,388 (52.8%) |
| Transportation & Warehousing | 3,488 (88.3%) | 464 (11.7%) |
| Utilities | 572 (91.4%) | 54 (8.6%) |
| Information | 427 (70.2%) | 181 (29.8%) |
| Finance & Insurance | 519 (35.0%) | 965 (65.0%) |
| Real Estate, Rental & Leasing | 712 (61.2%) | 451 (38.8%) |
| Professional & Scientific | 1,067 (56.3%) | 828 (43.7%) |
| Enterprise Management | 12 (100.0%) | 0 (0.0%) |
| Administrative & Support | 1,286 (55.8%) | 1,017 (44.2%) |
| Educational Services | 1,490 (31.5%) | 3,244 (68.5%) |
| Health Care & Social Assistance | 1,221 (22.5%) | 4,216 (77.5%) |
| Arts, Entertainment & Recreation | 257 (38.6%) | 409 (61.4%) |
| Accommodation & Food Services | 1,519 (40.8%) | 2,203 (59.2%) |
| Public Administration | 730 (55.9%) | 575 (44.1%) |
| Total | 32,461 (59.8%) | 21,807 (40.2%) |
Education in Odessa
School Enrollment in Odessa
The most common levels of schooling among the 30,855 students in Odessa are high school (7,092 | 23.0%), elementary school (7,083 | 23.0%), and middle school (5,888 | 19.1%).
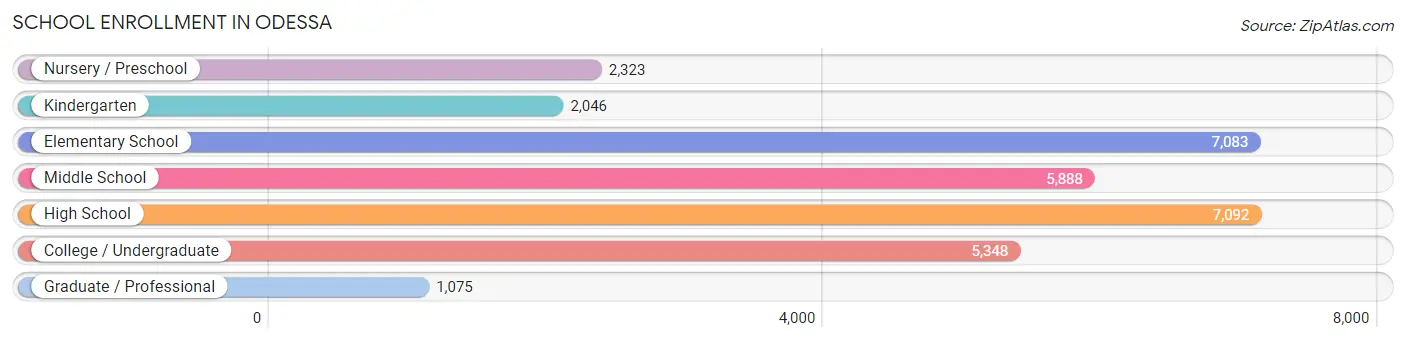
| School Level | # Students | % Students |
| Nursery / Preschool | 2,323 | 7.5% |
| Kindergarten | 2,046 | 6.6% |
| Elementary School | 7,083 | 23.0% |
| Middle School | 5,888 | 19.1% |
| High School | 7,092 | 23.0% |
| College / Undergraduate | 5,348 | 17.3% |
| Graduate / Professional | 1,075 | 3.5% |
| Total | 30,855 | 100.0% |
School Enrollment by Age by Funding Source in Odessa
Out of a total of 30,855 students who are enrolled in schools in Odessa, 3,116 (10.1%) attend a private institution, while the remaining 27,739 (89.9%) are enrolled in public schools. The age group of 3 to 4 year olds has the highest likelihood of being enrolled in private schools, with 598 (36.1% in the age bracket) enrolled. Conversely, the age group of 15 to 17 year olds has the lowest likelihood of being enrolled in a private school, with 4,908 (95.5% in the age bracket) attending a public institution.
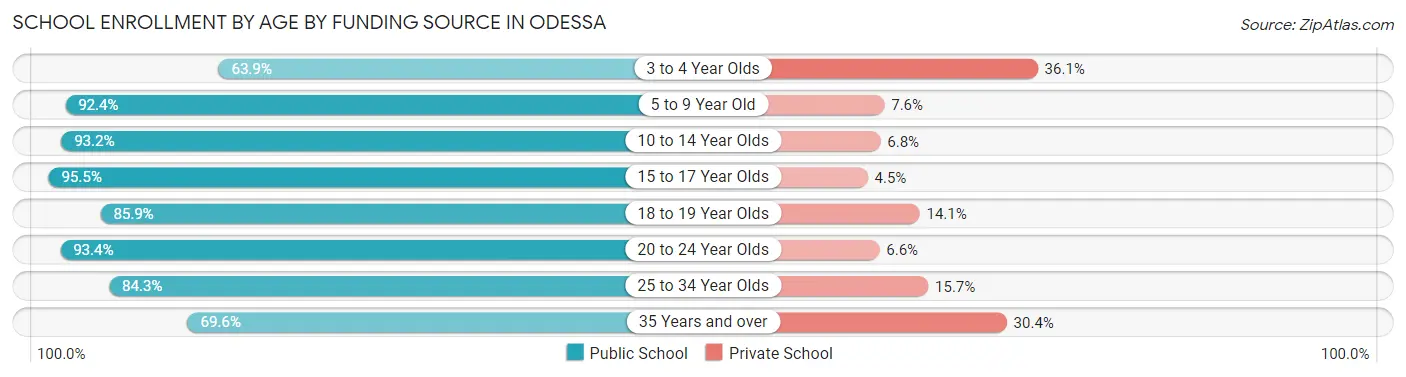
| Age Bracket | Public School | Private School |
| 3 to 4 Year Olds | 1,057 (63.9%) | 598 (36.1%) |
| 5 to 9 Year Old | 8,389 (92.4%) | 687 (7.6%) |
| 10 to 14 Year Olds | 7,126 (93.2%) | 522 (6.8%) |
| 15 to 17 Year Olds | 4,908 (95.5%) | 229 (4.5%) |
| 18 to 19 Year Olds | 1,349 (85.9%) | 222 (14.1%) |
| 20 to 24 Year Olds | 2,389 (93.4%) | 170 (6.6%) |
| 25 to 34 Year Olds | 1,666 (84.3%) | 311 (15.7%) |
| 35 Years and over | 858 (69.6%) | 374 (30.4%) |
| Total | 27,739 (89.9%) | 3,116 (10.1%) |
Educational Attainment by Field of Study in Odessa
Business (2,974 | 21.8%), education (1,792 | 13.2%), science & technology (1,700 | 12.5%), arts & humanities (1,205 | 8.8%), and social sciences (780 | 5.7%) are the most common fields of study among 13,613 individuals in Odessa who have obtained a bachelor's degree or higher.
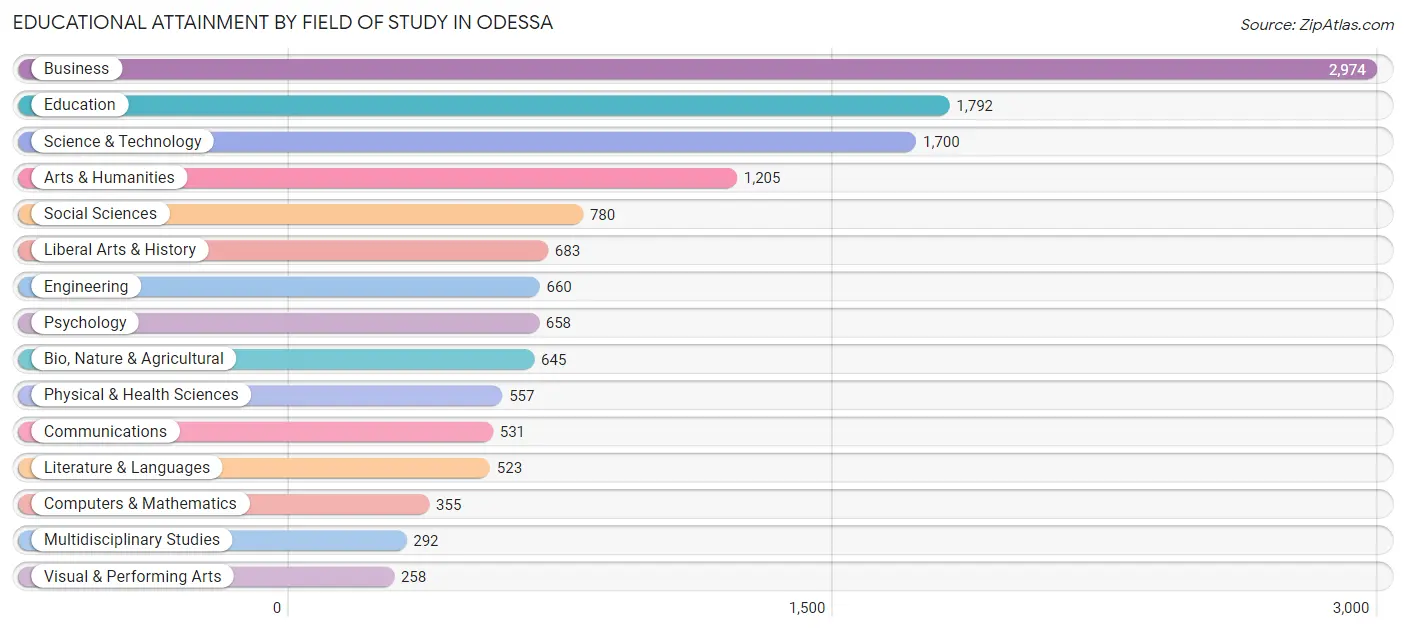
| Field of Study | # Graduates | % Graduates |
| Computers & Mathematics | 355 | 2.6% |
| Bio, Nature & Agricultural | 645 | 4.7% |
| Physical & Health Sciences | 557 | 4.1% |
| Psychology | 658 | 4.8% |
| Social Sciences | 780 | 5.7% |
| Engineering | 660 | 4.9% |
| Multidisciplinary Studies | 292 | 2.1% |
| Science & Technology | 1,700 | 12.5% |
| Business | 2,974 | 21.8% |
| Education | 1,792 | 13.2% |
| Literature & Languages | 523 | 3.8% |
| Liberal Arts & History | 683 | 5.0% |
| Visual & Performing Arts | 258 | 1.9% |
| Communications | 531 | 3.9% |
| Arts & Humanities | 1,205 | 8.8% |
| Total | 13,613 | 100.0% |
Transportation & Commute in Odessa
Vehicle Availability by Sex in Odessa
The most prevalent vehicle ownership categories in Odessa are males with 2 vehicles (13,998, accounting for 43.9%) and females with 2 vehicles (9,486, making up 67.3%).
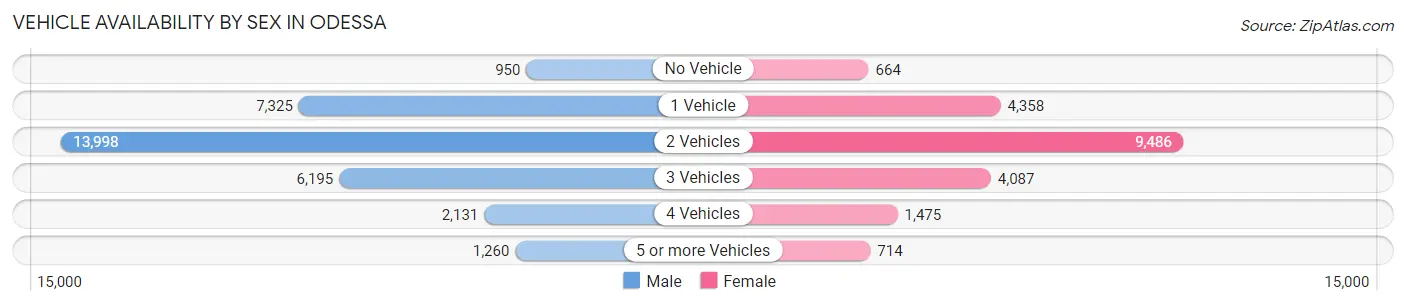
| Vehicles Available | Male | Female |
| No Vehicle | 950 (3.0%) | 664 (3.2%) |
| 1 Vehicle | 7,325 (23.0%) | 4,358 (21.0%) |
| 2 Vehicles | 13,998 (43.9%) | 9,486 (45.6%) |
| 3 Vehicles | 6,195 (19.5%) | 4,087 (19.7%) |
| 4 Vehicles | 2,131 (6.7%) | 1,475 (7.1%) |
| 5 or more Vehicles | 1,260 (4.0%) | 714 (3.4%) |
| Total | 31,859 (100.0%) | 20,784 (100.0%) |
Commute Time in Odessa
The most frequently occuring commute durations in Odessa are 15 to 19 minutes (10,304 commuters, 20.1%), 10 to 14 minutes (10,031 commuters, 19.6%), and 20 to 24 minutes (9,106 commuters, 17.8%).
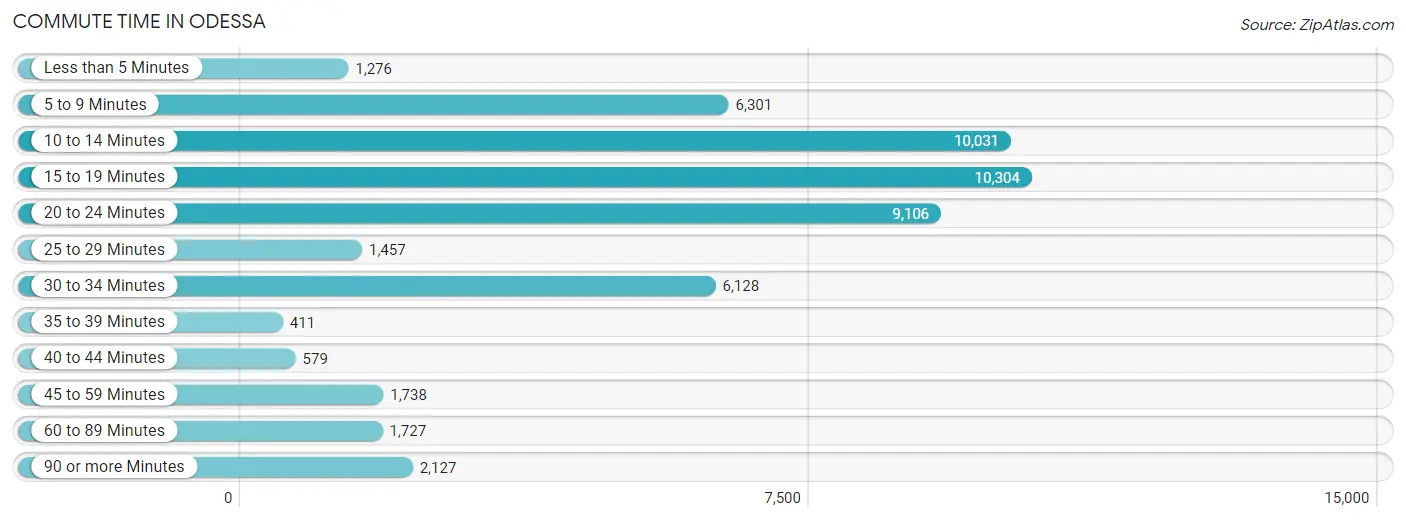
| Commute Time | # Commuters | % Commuters |
| Less than 5 Minutes | 1,276 | 2.5% |
| 5 to 9 Minutes | 6,301 | 12.3% |
| 10 to 14 Minutes | 10,031 | 19.6% |
| 15 to 19 Minutes | 10,304 | 20.1% |
| 20 to 24 Minutes | 9,106 | 17.8% |
| 25 to 29 Minutes | 1,457 | 2.9% |
| 30 to 34 Minutes | 6,128 | 12.0% |
| 35 to 39 Minutes | 411 | 0.8% |
| 40 to 44 Minutes | 579 | 1.1% |
| 45 to 59 Minutes | 1,738 | 3.4% |
| 60 to 89 Minutes | 1,727 | 3.4% |
| 90 or more Minutes | 2,127 | 4.2% |
Commute Time by Sex in Odessa
The most common commute times in Odessa are 15 to 19 minutes (6,193 commuters, 19.8%) for males and 10 to 14 minutes (4,797 commuters, 24.1%) for females.
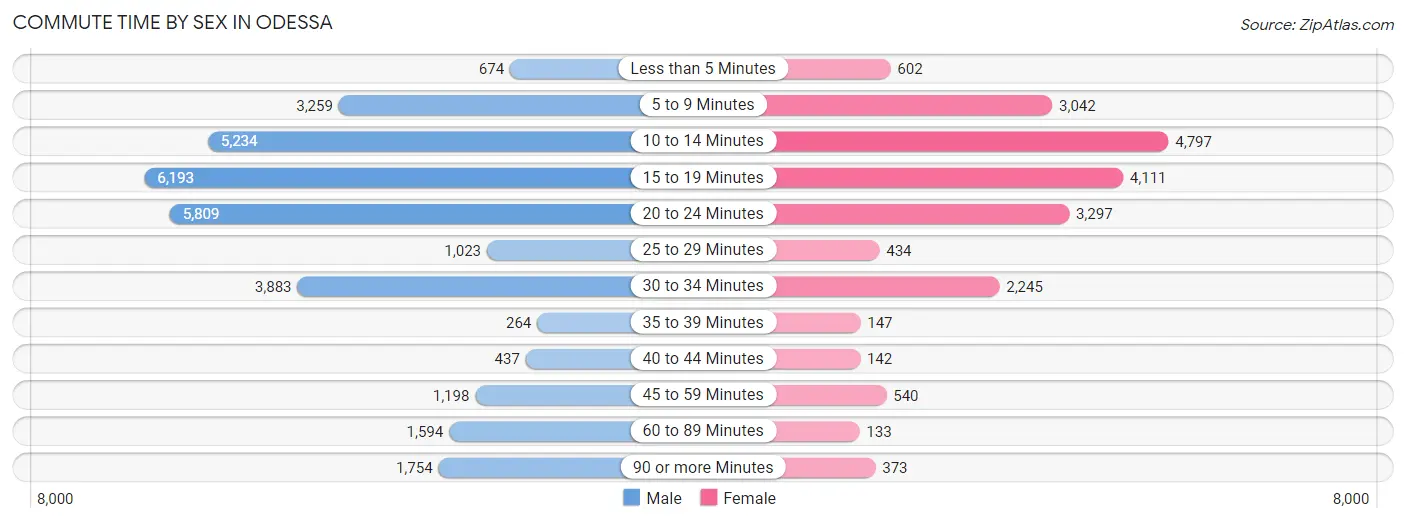
| Commute Time | Male | Female |
| Less than 5 Minutes | 674 (2.1%) | 602 (3.0%) |
| 5 to 9 Minutes | 3,259 (10.4%) | 3,042 (15.3%) |
| 10 to 14 Minutes | 5,234 (16.7%) | 4,797 (24.1%) |
| 15 to 19 Minutes | 6,193 (19.8%) | 4,111 (20.7%) |
| 20 to 24 Minutes | 5,809 (18.5%) | 3,297 (16.6%) |
| 25 to 29 Minutes | 1,023 (3.3%) | 434 (2.2%) |
| 30 to 34 Minutes | 3,883 (12.4%) | 2,245 (11.3%) |
| 35 to 39 Minutes | 264 (0.8%) | 147 (0.7%) |
| 40 to 44 Minutes | 437 (1.4%) | 142 (0.7%) |
| 45 to 59 Minutes | 1,198 (3.8%) | 540 (2.7%) |
| 60 to 89 Minutes | 1,594 (5.1%) | 133 (0.7%) |
| 90 or more Minutes | 1,754 (5.6%) | 373 (1.9%) |
Time of Departure to Work by Sex in Odessa
The most frequent times of departure to work in Odessa are 6:00 AM to 6:29 AM (4,910, 15.7%) for males and 7:30 AM to 7:59 AM (4,551, 22.9%) for females.
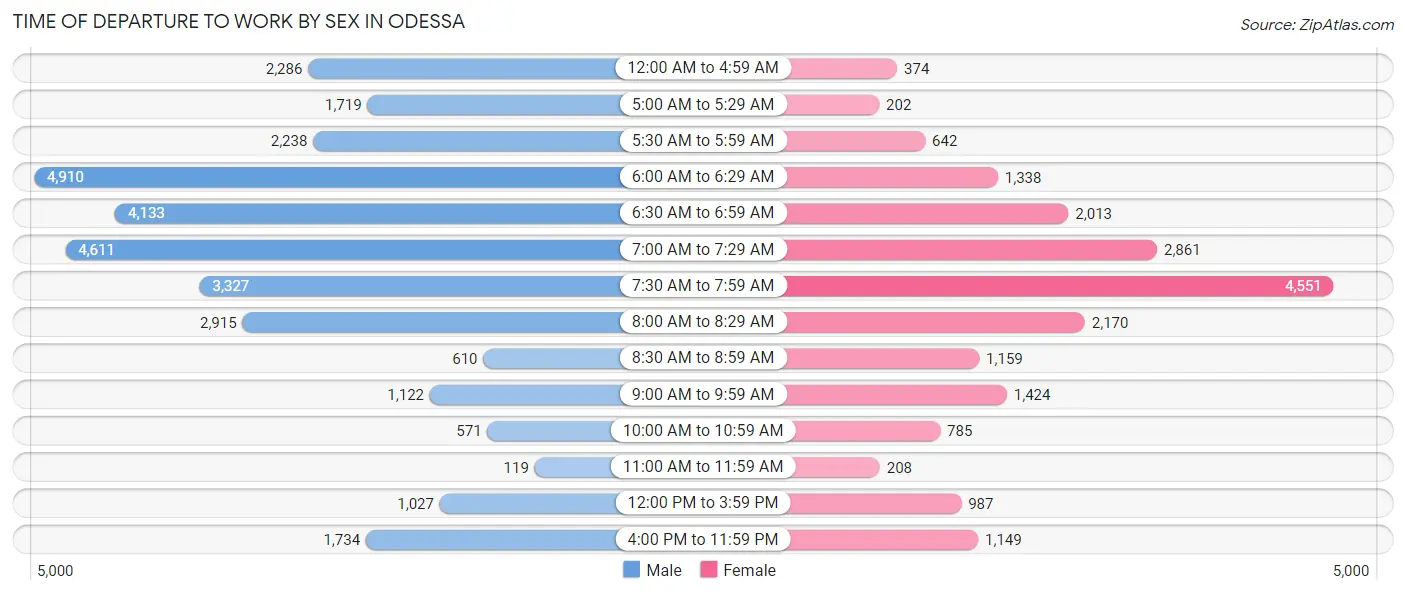
| Time of Departure | Male | Female |
| 12:00 AM to 4:59 AM | 2,286 (7.3%) | 374 (1.9%) |
| 5:00 AM to 5:29 AM | 1,719 (5.5%) | 202 (1.0%) |
| 5:30 AM to 5:59 AM | 2,238 (7.1%) | 642 (3.2%) |
| 6:00 AM to 6:29 AM | 4,910 (15.7%) | 1,338 (6.7%) |
| 6:30 AM to 6:59 AM | 4,133 (13.2%) | 2,013 (10.1%) |
| 7:00 AM to 7:29 AM | 4,611 (14.7%) | 2,861 (14.4%) |
| 7:30 AM to 7:59 AM | 3,327 (10.6%) | 4,551 (22.9%) |
| 8:00 AM to 8:29 AM | 2,915 (9.3%) | 2,170 (10.9%) |
| 8:30 AM to 8:59 AM | 610 (1.9%) | 1,159 (5.8%) |
| 9:00 AM to 9:59 AM | 1,122 (3.6%) | 1,424 (7.2%) |
| 10:00 AM to 10:59 AM | 571 (1.8%) | 785 (4.0%) |
| 11:00 AM to 11:59 AM | 119 (0.4%) | 208 (1.1%) |
| 12:00 PM to 3:59 PM | 1,027 (3.3%) | 987 (5.0%) |
| 4:00 PM to 11:59 PM | 1,734 (5.5%) | 1,149 (5.8%) |
| Total | 31,322 (100.0%) | 19,863 (100.0%) |
Housing Occupancy in Odessa
Occupancy by Ownership in Odessa
Of the total 43,802 dwellings in Odessa, owner-occupied units account for 25,908 (59.2%), while renter-occupied units make up 17,894 (40.8%).
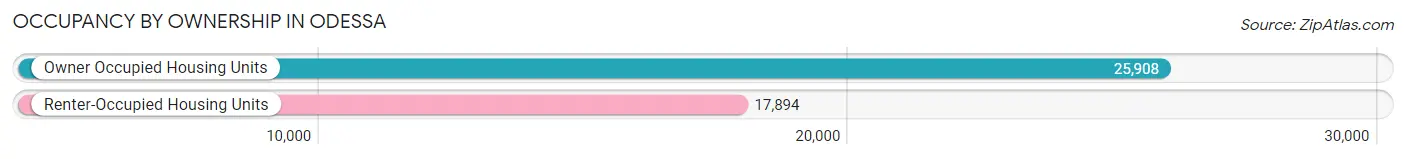
| Occupancy | # Housing Units | % Housing Units |
| Owner Occupied Housing Units | 25,908 | 59.2% |
| Renter-Occupied Housing Units | 17,894 | 40.8% |
| Total Occupied Housing Units | 43,802 | 100.0% |
Occupancy by Household Size in Odessa
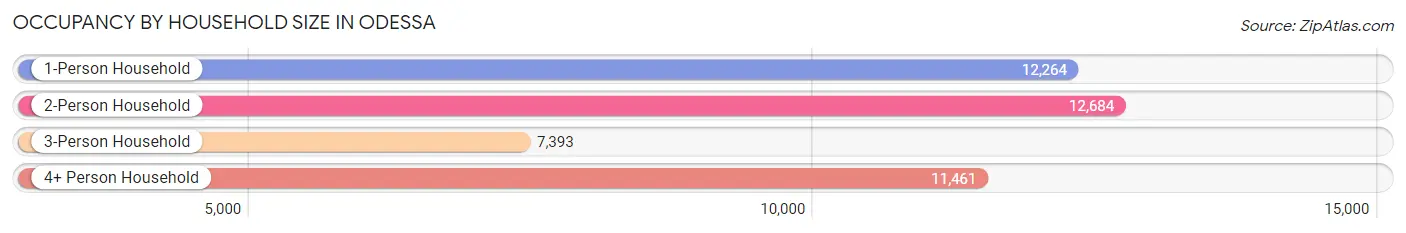
| Household Size | # Housing Units | % Housing Units |
| 1-Person Household | 12,264 | 28.0% |
| 2-Person Household | 12,684 | 29.0% |
| 3-Person Household | 7,393 | 16.9% |
| 4+ Person Household | 11,461 | 26.2% |
| Total Housing Units | 43,802 | 100.0% |
Occupancy by Ownership by Household Size in Odessa
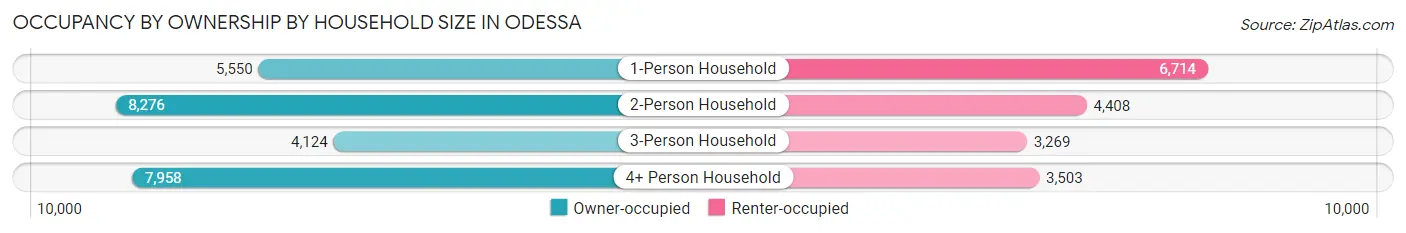
| Household Size | Owner-occupied | Renter-occupied |
| 1-Person Household | 5,550 (45.3%) | 6,714 (54.7%) |
| 2-Person Household | 8,276 (65.2%) | 4,408 (34.7%) |
| 3-Person Household | 4,124 (55.8%) | 3,269 (44.2%) |
| 4+ Person Household | 7,958 (69.4%) | 3,503 (30.6%) |
| Total Housing Units | 25,908 (59.2%) | 17,894 (40.8%) |
Occupancy by Educational Attainment in Odessa
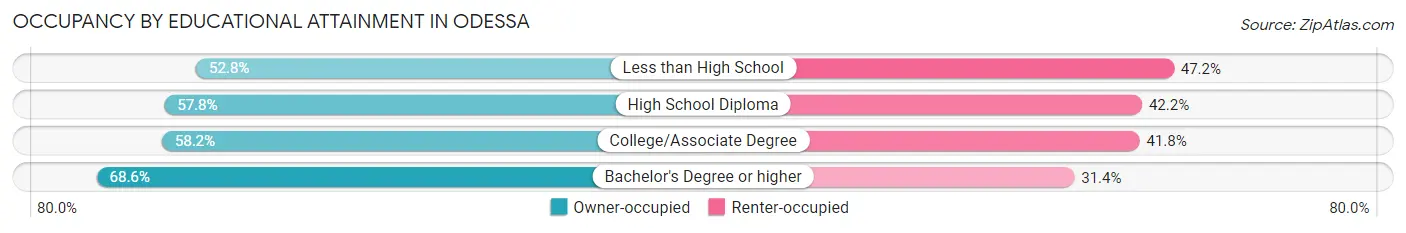
| Household Size | Owner-occupied | Renter-occupied |
| Less than High School | 4,150 (52.8%) | 3,710 (47.2%) |
| High School Diploma | 6,859 (57.8%) | 4,999 (42.2%) |
| College/Associate Degree | 9,088 (58.2%) | 6,522 (41.8%) |
| Bachelor's Degree or higher | 5,811 (68.6%) | 2,663 (31.4%) |
Occupancy by Age of Householder in Odessa
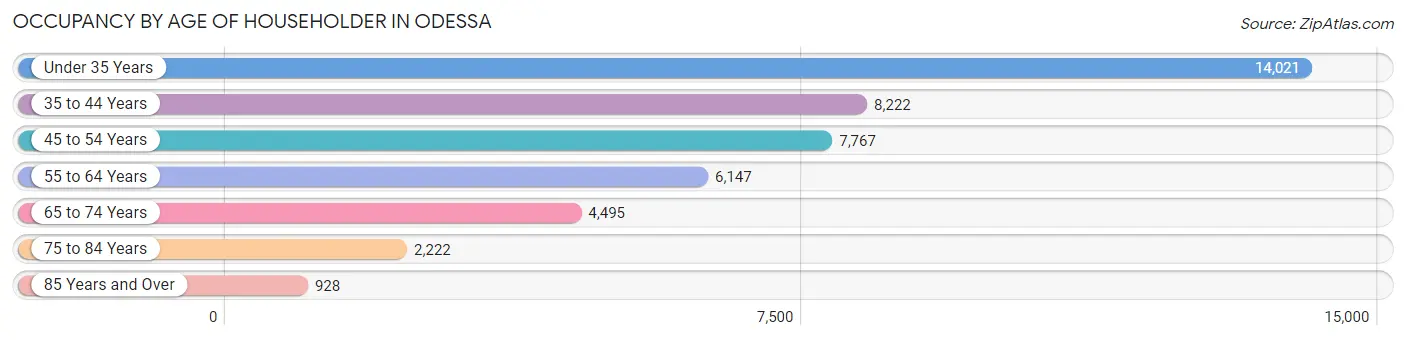
| Age Bracket | # Households | % Households |
| Under 35 Years | 14,021 | 32.0% |
| 35 to 44 Years | 8,222 | 18.8% |
| 45 to 54 Years | 7,767 | 17.7% |
| 55 to 64 Years | 6,147 | 14.0% |
| 65 to 74 Years | 4,495 | 10.3% |
| 75 to 84 Years | 2,222 | 5.1% |
| 85 Years and Over | 928 | 2.1% |
| Total | 43,802 | 100.0% |
Housing Finances in Odessa
Median Income by Occupancy in Odessa
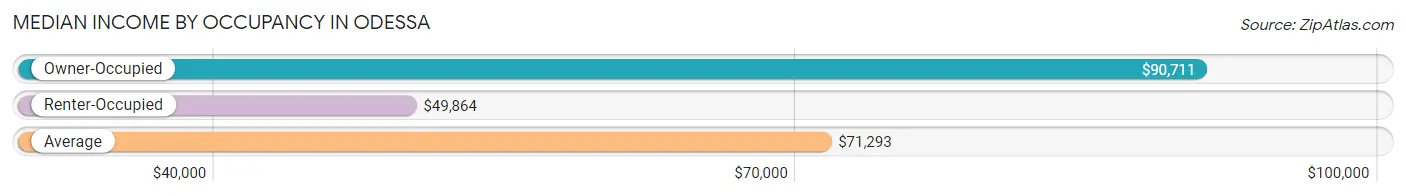
| Occupancy Type | # Households | Median Income |
| Owner-Occupied | 25,908 (59.2%) | $90,711 |
| Renter-Occupied | 17,894 (40.8%) | $49,864 |
| Average | 43,802 (100.0%) | $71,293 |
Occupancy by Householder Income Bracket in Odessa
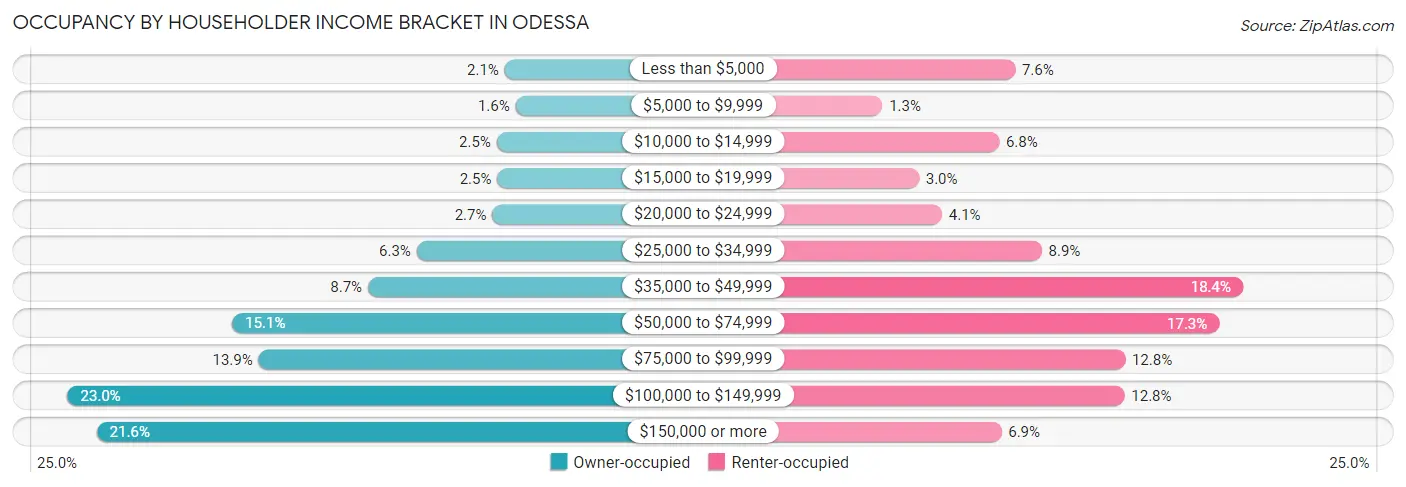
| Income Bracket | Owner-occupied | Renter-occupied |
| Less than $5,000 | 554 (2.1%) | 1,359 (7.6%) |
| $5,000 to $9,999 | 420 (1.6%) | 228 (1.3%) |
| $10,000 to $14,999 | 654 (2.5%) | 1,223 (6.8%) |
| $15,000 to $19,999 | 646 (2.5%) | 538 (3.0%) |
| $20,000 to $24,999 | 707 (2.7%) | 736 (4.1%) |
| $25,000 to $34,999 | 1,640 (6.3%) | 1,586 (8.9%) |
| $35,000 to $49,999 | 2,240 (8.6%) | 3,300 (18.4%) |
| $50,000 to $74,999 | 3,918 (15.1%) | 3,097 (17.3%) |
| $75,000 to $99,999 | 3,591 (13.9%) | 2,295 (12.8%) |
| $100,000 to $149,999 | 5,949 (23.0%) | 2,290 (12.8%) |
| $150,000 or more | 5,589 (21.6%) | 1,242 (6.9%) |
| Total | 25,908 (100.0%) | 17,894 (100.0%) |
Monthly Housing Cost Tiers in Odessa
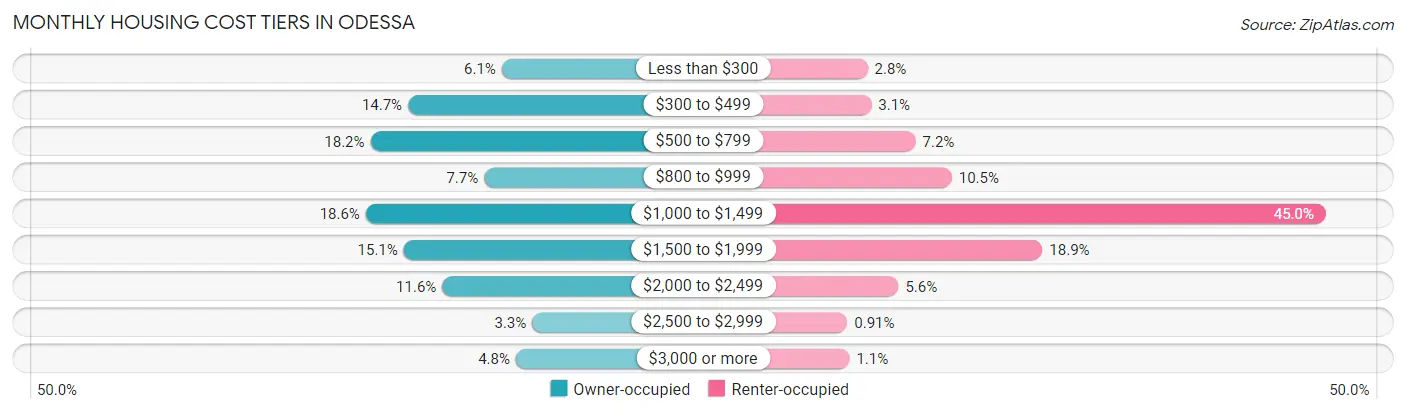
| Monthly Cost | Owner-occupied | Renter-occupied |
| Less than $300 | 1,576 (6.1%) | 498 (2.8%) |
| $300 to $499 | 3,811 (14.7%) | 558 (3.1%) |
| $500 to $799 | 4,708 (18.2%) | 1,289 (7.2%) |
| $800 to $999 | 1,994 (7.7%) | 1,884 (10.5%) |
| $1,000 to $1,499 | 4,820 (18.6%) | 8,045 (45.0%) |
| $1,500 to $1,999 | 3,915 (15.1%) | 3,377 (18.9%) |
| $2,000 to $2,499 | 2,996 (11.6%) | 1,006 (5.6%) |
| $2,500 to $2,999 | 849 (3.3%) | 163 (0.9%) |
| $3,000 or more | 1,239 (4.8%) | 199 (1.1%) |
| Total | 25,908 (100.0%) | 17,894 (100.0%) |
Physical Housing Characteristics in Odessa
Housing Structures in Odessa
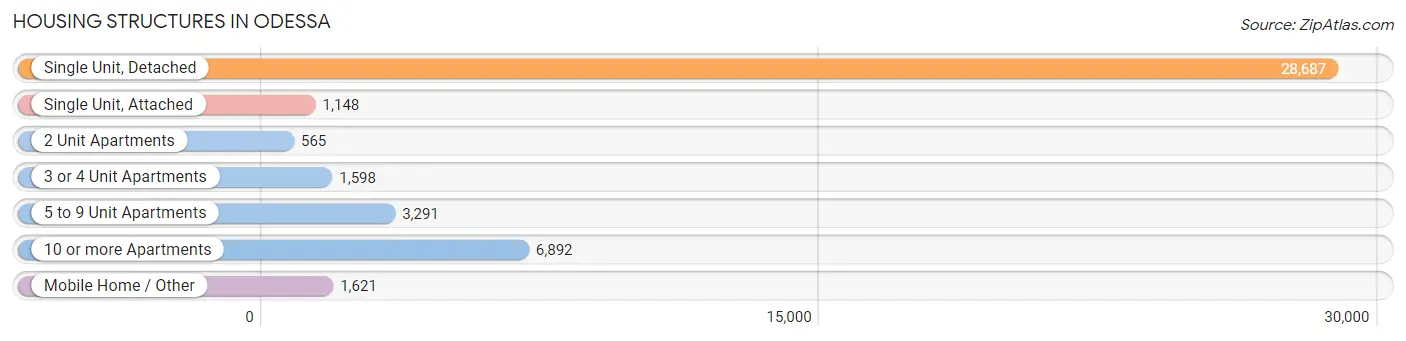
| Structure Type | # Housing Units | % Housing Units |
| Single Unit, Detached | 28,687 | 65.5% |
| Single Unit, Attached | 1,148 | 2.6% |
| 2 Unit Apartments | 565 | 1.3% |
| 3 or 4 Unit Apartments | 1,598 | 3.6% |
| 5 to 9 Unit Apartments | 3,291 | 7.5% |
| 10 or more Apartments | 6,892 | 15.7% |
| Mobile Home / Other | 1,621 | 3.7% |
| Total | 43,802 | 100.0% |
Housing Structures by Occupancy in Odessa
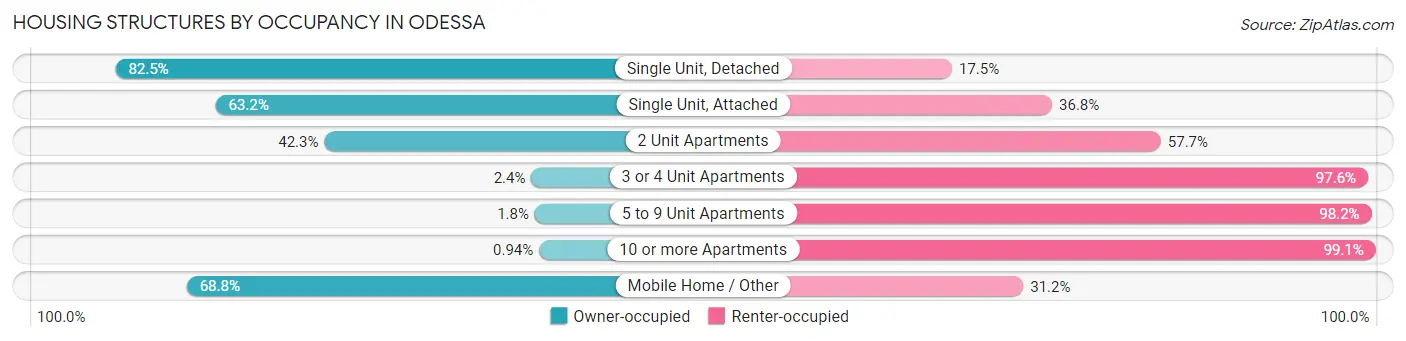
| Structure Type | Owner-occupied | Renter-occupied |
| Single Unit, Detached | 23,666 (82.5%) | 5,021 (17.5%) |
| Single Unit, Attached | 726 (63.2%) | 422 (36.8%) |
| 2 Unit Apartments | 239 (42.3%) | 326 (57.7%) |
| 3 or 4 Unit Apartments | 39 (2.4%) | 1,559 (97.6%) |
| 5 to 9 Unit Apartments | 58 (1.8%) | 3,233 (98.2%) |
| 10 or more Apartments | 65 (0.9%) | 6,827 (99.1%) |
| Mobile Home / Other | 1,115 (68.8%) | 506 (31.2%) |
| Total | 25,908 (59.2%) | 17,894 (40.8%) |
Housing Structures by Number of Rooms in Odessa
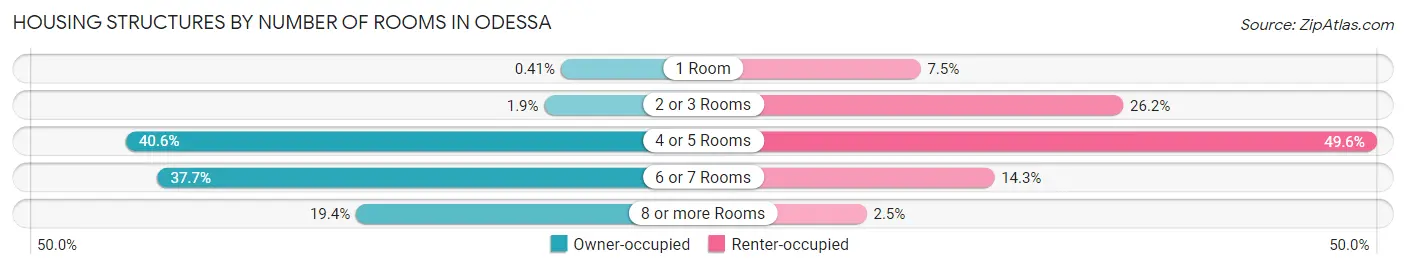
| Number of Rooms | Owner-occupied | Renter-occupied |
| 1 Room | 106 (0.4%) | 1,333 (7.4%) |
| 2 or 3 Rooms | 500 (1.9%) | 4,687 (26.2%) |
| 4 or 5 Rooms | 10,523 (40.6%) | 8,880 (49.6%) |
| 6 or 7 Rooms | 9,767 (37.7%) | 2,554 (14.3%) |
| 8 or more Rooms | 5,012 (19.4%) | 440 (2.5%) |
| Total | 25,908 (100.0%) | 17,894 (100.0%) |
Housing Structure by Heating Type in Odessa
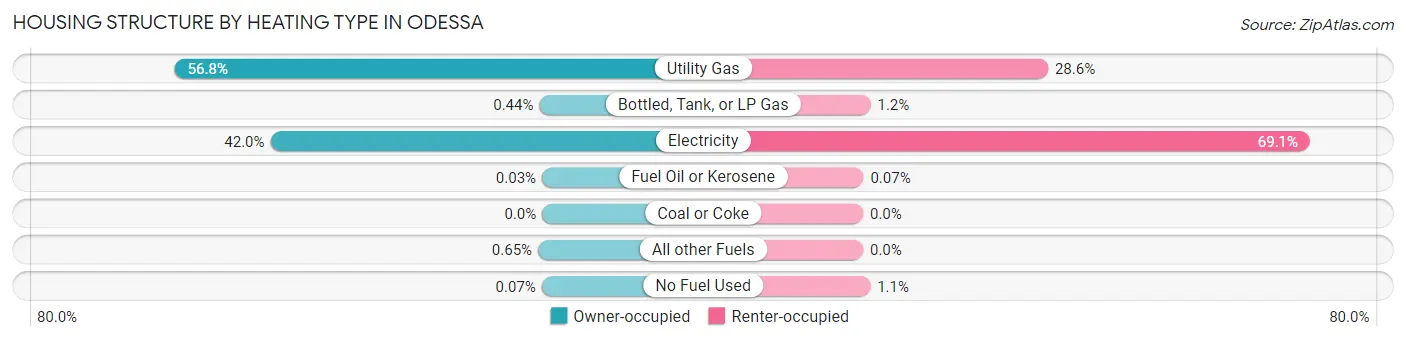
| Heating Type | Owner-occupied | Renter-occupied |
| Utility Gas | 14,716 (56.8%) | 5,115 (28.6%) |
| Bottled, Tank, or LP Gas | 114 (0.4%) | 208 (1.2%) |
| Electricity | 10,884 (42.0%) | 12,360 (69.1%) |
| Fuel Oil or Kerosene | 8 (0.0%) | 12 (0.1%) |
| Coal or Coke | 0 (0.0%) | 0 (0.0%) |
| All other Fuels | 169 (0.6%) | 0 (0.0%) |
| No Fuel Used | 17 (0.1%) | 199 (1.1%) |
| Total | 25,908 (100.0%) | 17,894 (100.0%) |
Household Vehicle Usage in Odessa
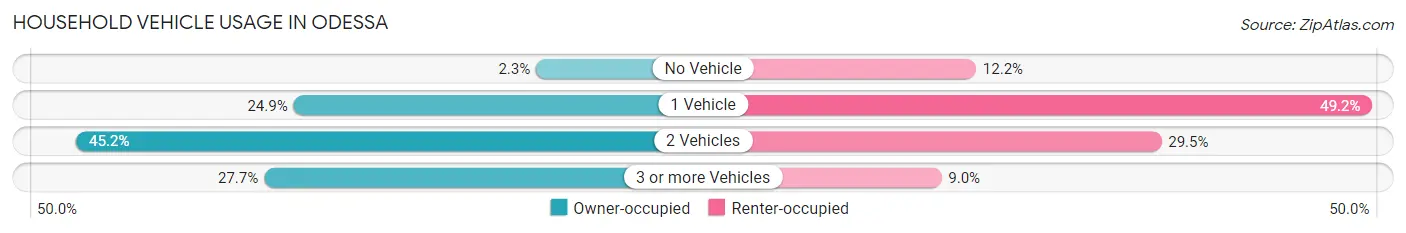
| Vehicles per Household | Owner-occupied | Renter-occupied |
| No Vehicle | 586 (2.3%) | 2,189 (12.2%) |
| 1 Vehicle | 6,450 (24.9%) | 8,810 (49.2%) |
| 2 Vehicles | 11,708 (45.2%) | 5,284 (29.5%) |
| 3 or more Vehicles | 7,164 (27.7%) | 1,611 (9.0%) |
| Total | 25,908 (100.0%) | 17,894 (100.0%) |
Real Estate & Mortgages in Odessa
Real Estate and Mortgage Overview in Odessa
| Characteristic | Without Mortgage | With Mortgage |
| Housing Units | 11,710 | 14,198 |
| Median Property Value | $148,700 | $220,800 |
| Median Household Income | $65,862 | $3,909 |
| Monthly Housing Costs | $530 | $1,142 |
| Real Estate Taxes | $1,832 | $381 |
Property Value by Mortgage Status in Odessa
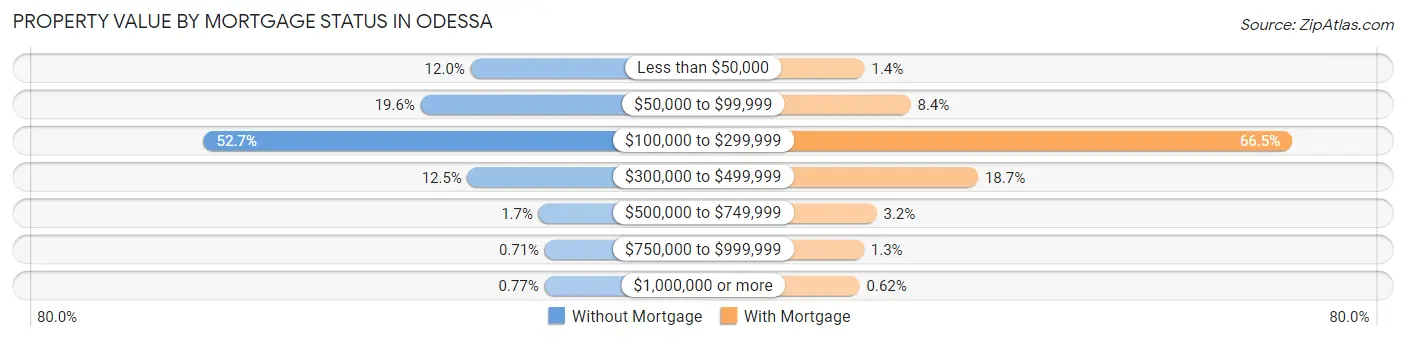
| Property Value | Without Mortgage | With Mortgage |
| Less than $50,000 | 1,409 (12.0%) | 194 (1.4%) |
| $50,000 to $99,999 | 2,300 (19.6%) | 1,190 (8.4%) |
| $100,000 to $299,999 | 6,174 (52.7%) | 9,442 (66.5%) |
| $300,000 to $499,999 | 1,461 (12.5%) | 2,649 (18.7%) |
| $500,000 to $749,999 | 193 (1.7%) | 454 (3.2%) |
| $750,000 to $999,999 | 83 (0.7%) | 181 (1.3%) |
| $1,000,000 or more | 90 (0.8%) | 88 (0.6%) |
| Total | 11,710 (100.0%) | 14,198 (100.0%) |
Household Income by Mortgage Status in Odessa
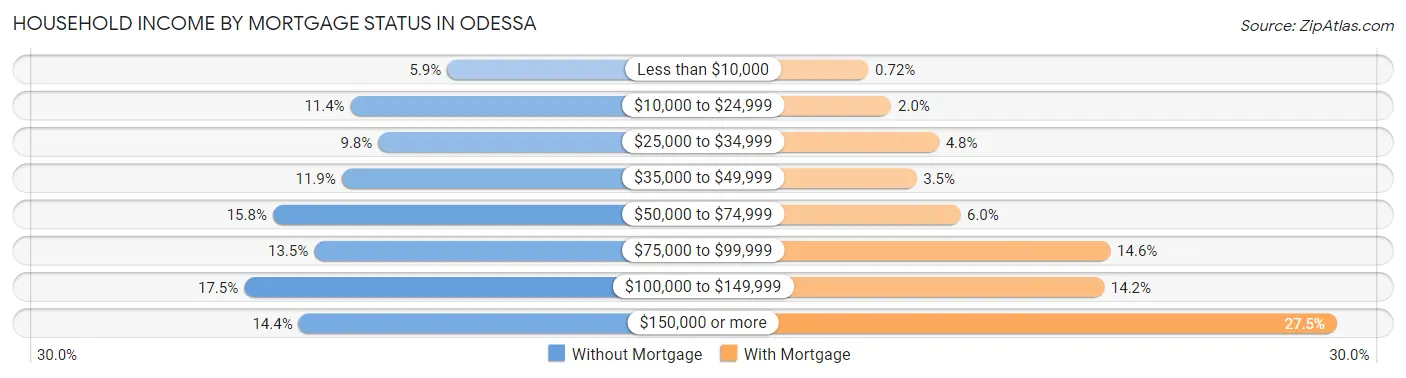
| Household Income | Without Mortgage | With Mortgage |
| Less than $10,000 | 686 (5.9%) | 102 (0.7%) |
| $10,000 to $24,999 | 1,333 (11.4%) | 288 (2.0%) |
| $25,000 to $34,999 | 1,147 (9.8%) | 674 (4.8%) |
| $35,000 to $49,999 | 1,392 (11.9%) | 493 (3.5%) |
| $50,000 to $74,999 | 1,852 (15.8%) | 848 (6.0%) |
| $75,000 to $99,999 | 1,576 (13.5%) | 2,066 (14.5%) |
| $100,000 to $149,999 | 2,044 (17.5%) | 2,015 (14.2%) |
| $150,000 or more | 1,680 (14.3%) | 3,905 (27.5%) |
| Total | 11,710 (100.0%) | 14,198 (100.0%) |
Property Value to Household Income Ratio in Odessa
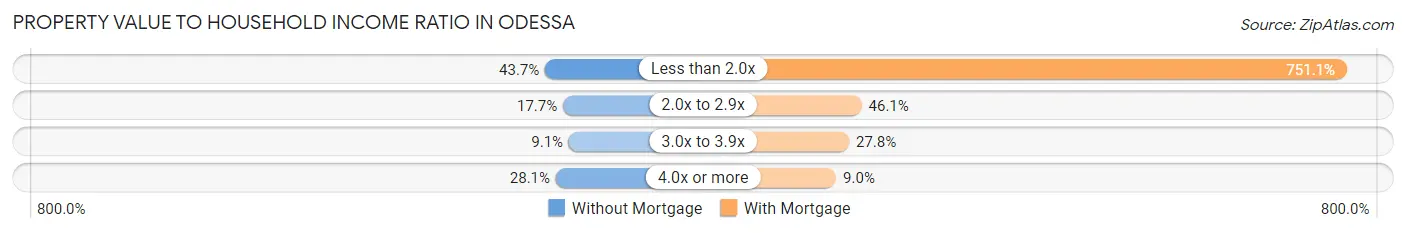
| Value-to-Income Ratio | Without Mortgage | With Mortgage |
| Less than 2.0x | 5,121 (43.7%) | 106,635 (751.1%) |
| 2.0x to 2.9x | 2,069 (17.7%) | 6,540 (46.1%) |
| 3.0x to 3.9x | 1,069 (9.1%) | 3,951 (27.8%) |
| 4.0x or more | 3,290 (28.1%) | 1,284 (9.0%) |
| Total | 11,710 (100.0%) | 14,198 (100.0%) |
Real Estate Taxes by Mortgage Status in Odessa
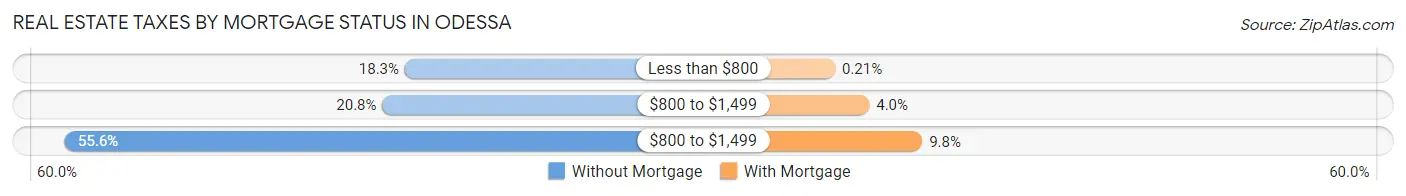
| Property Taxes | Without Mortgage | With Mortgage |
| Less than $800 | 2,147 (18.3%) | 30 (0.2%) |
| $800 to $1,499 | 2,435 (20.8%) | 564 (4.0%) |
| $800 to $1,499 | 6,509 (55.6%) | 1,387 (9.8%) |
| Total | 11,710 (100.0%) | 14,198 (100.0%) |
Health & Disability in Odessa
Health Insurance Coverage by Age in Odessa
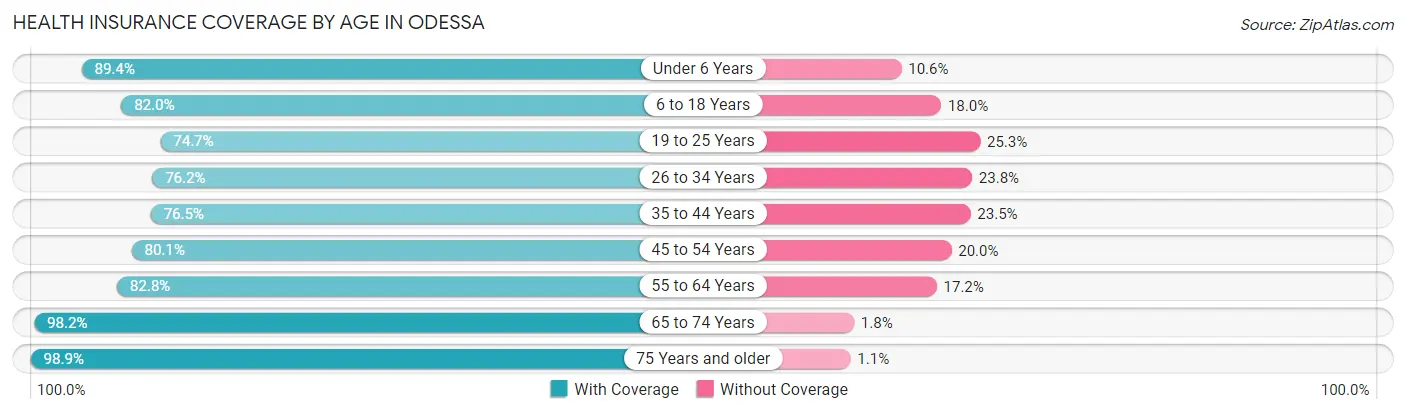
| Age Bracket | With Coverage | Without Coverage |
| Under 6 Years | 10,809 (89.4%) | 1,286 (10.6%) |
| 6 to 18 Years | 18,335 (82.0%) | 4,032 (18.0%) |
| 19 to 25 Years | 9,159 (74.7%) | 3,106 (25.3%) |
| 26 to 34 Years | 13,658 (76.2%) | 4,267 (23.8%) |
| 35 to 44 Years | 11,400 (76.5%) | 3,506 (23.5%) |
| 45 to 54 Years | 9,432 (80.0%) | 2,350 (20.0%) |
| 55 to 64 Years | 8,237 (82.8%) | 1,713 (17.2%) |
| 65 to 74 Years | 6,688 (98.2%) | 122 (1.8%) |
| 75 Years and older | 3,997 (98.9%) | 46 (1.1%) |
| Total | 91,715 (81.8%) | 20,428 (18.2%) |
Health Insurance Coverage by Citizenship Status in Odessa
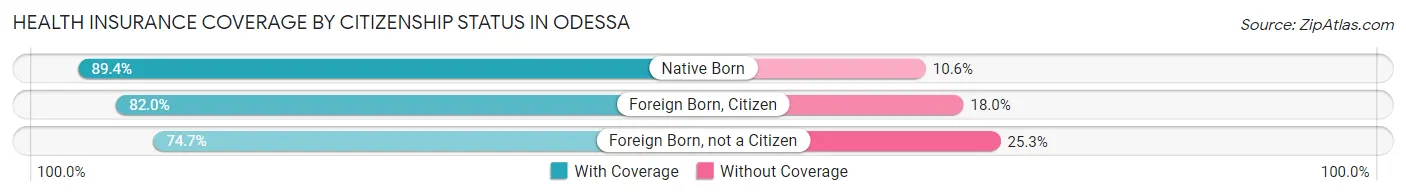
| Citizenship Status | With Coverage | Without Coverage |
| Native Born | 10,809 (89.4%) | 1,286 (10.6%) |
| Foreign Born, Citizen | 18,335 (82.0%) | 4,032 (18.0%) |
| Foreign Born, not a Citizen | 9,159 (74.7%) | 3,106 (25.3%) |
Health Insurance Coverage by Household Income in Odessa
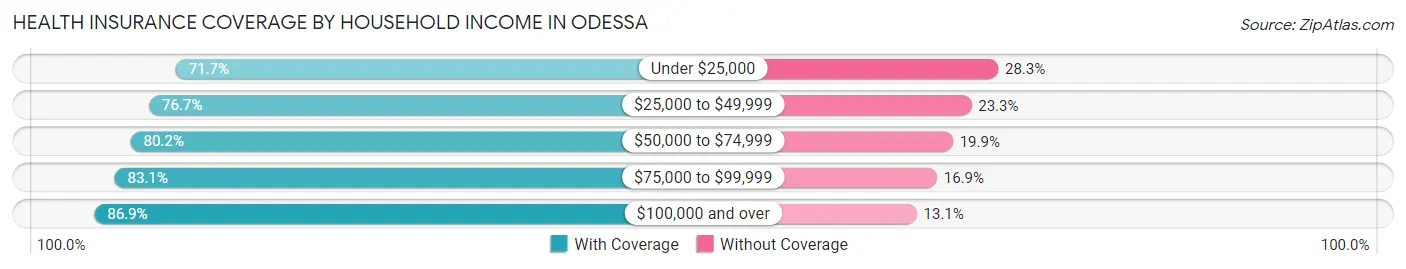
| Household Income | With Coverage | Without Coverage |
| Under $25,000 | 9,447 (71.7%) | 3,734 (28.3%) |
| $25,000 to $49,999 | 15,070 (76.7%) | 4,585 (23.3%) |
| $50,000 to $74,999 | 13,235 (80.1%) | 3,278 (19.9%) |
| $75,000 to $99,999 | 13,001 (83.1%) | 2,639 (16.9%) |
| $100,000 and over | 40,402 (86.9%) | 6,081 (13.1%) |
Public vs Private Health Insurance Coverage by Age in Odessa
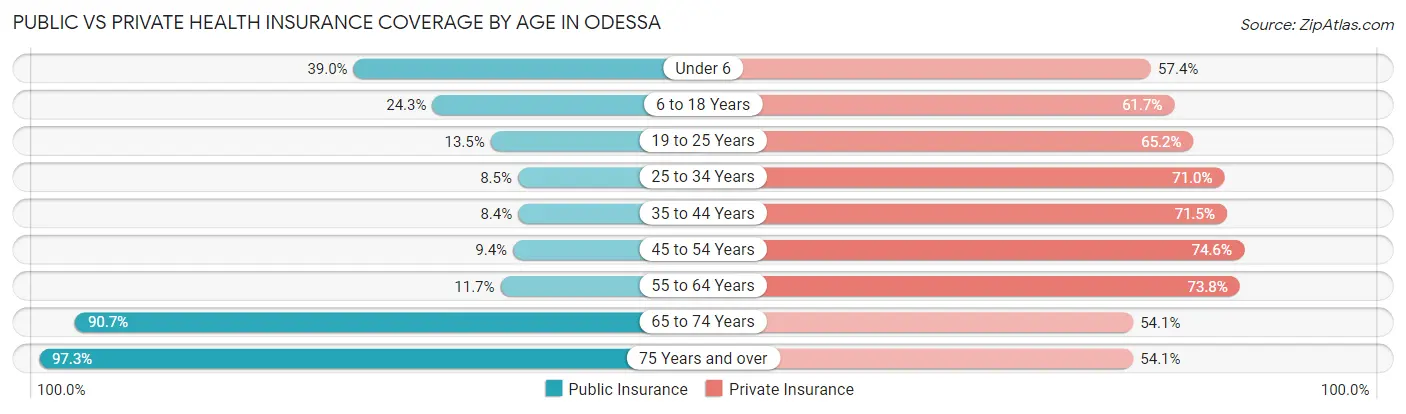
| Age Bracket | Public Insurance | Private Insurance |
| Under 6 | 4,712 (39.0%) | 6,945 (57.4%) |
| 6 to 18 Years | 5,441 (24.3%) | 13,798 (61.7%) |
| 19 to 25 Years | 1,657 (13.5%) | 8,000 (65.2%) |
| 25 to 34 Years | 1,516 (8.5%) | 12,727 (71.0%) |
| 35 to 44 Years | 1,253 (8.4%) | 10,652 (71.5%) |
| 45 to 54 Years | 1,103 (9.4%) | 8,790 (74.6%) |
| 55 to 64 Years | 1,163 (11.7%) | 7,346 (73.8%) |
| 65 to 74 Years | 6,173 (90.6%) | 3,684 (54.1%) |
| 75 Years and over | 3,935 (97.3%) | 2,188 (54.1%) |
| Total | 26,953 (24.0%) | 74,130 (66.1%) |
Disability Status by Sex by Age in Odessa
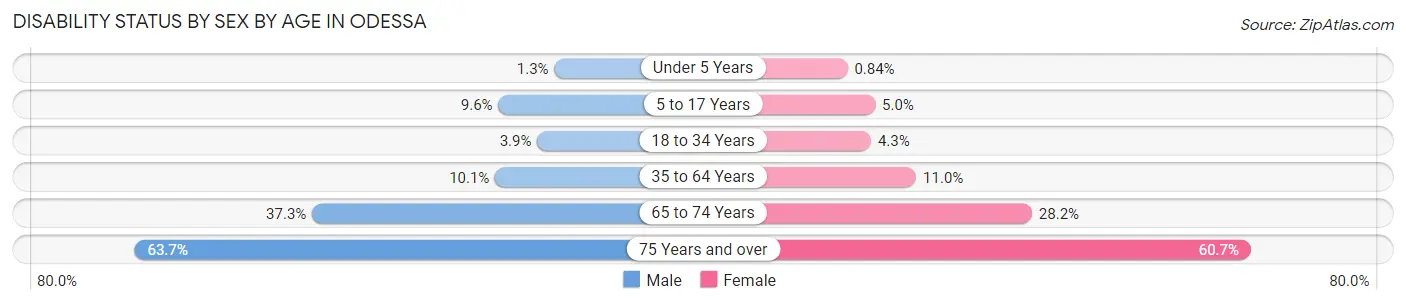
| Age Bracket | Male | Female |
| Under 5 Years | 70 (1.3%) | 41 (0.8%) |
| 5 to 17 Years | 1,098 (9.6%) | 584 (5.0%) |
| 18 to 34 Years | 644 (3.9%) | 635 (4.3%) |
| 35 to 64 Years | 1,893 (10.1%) | 1,979 (11.0%) |
| 65 to 74 Years | 1,203 (37.3%) | 1,012 (28.2%) |
| 75 Years and over | 857 (63.7%) | 1,638 (60.7%) |
Disability Class by Sex by Age in Odessa
Disability Class: Hearing Difficulty
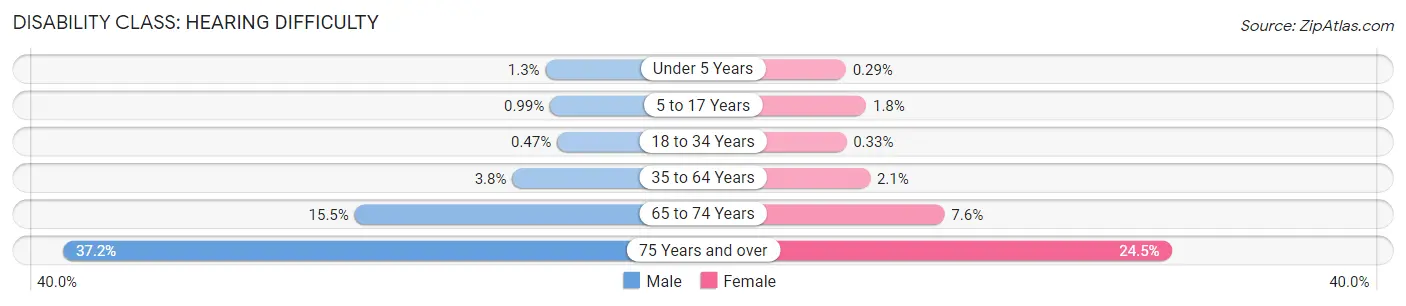
| Age Bracket | Male | Female |
| Under 5 Years | 70 (1.3%) | 14 (0.3%) |
| 5 to 17 Years | 113 (1.0%) | 212 (1.8%) |
| 18 to 34 Years | 79 (0.5%) | 48 (0.3%) |
| 35 to 64 Years | 709 (3.8%) | 375 (2.1%) |
| 65 to 74 Years | 500 (15.5%) | 273 (7.6%) |
| 75 Years and over | 500 (37.1%) | 660 (24.5%) |
Disability Class: Vision Difficulty
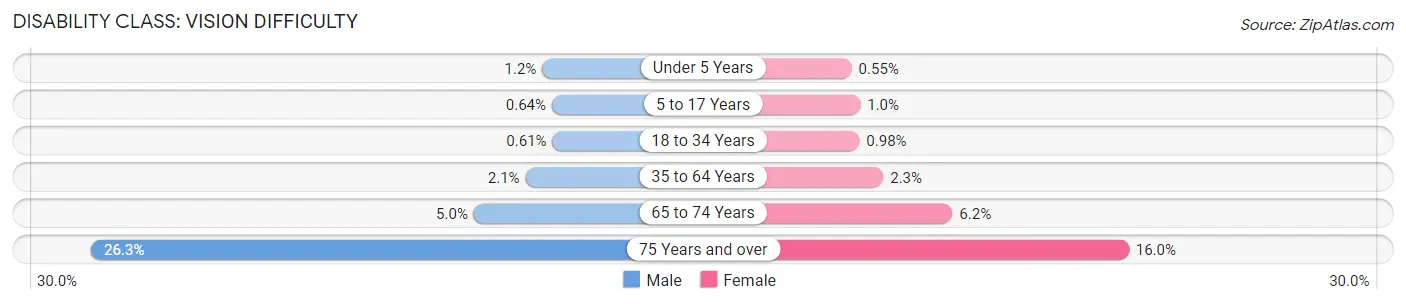
| Age Bracket | Male | Female |
| Under 5 Years | 62 (1.2%) | 27 (0.5%) |
| 5 to 17 Years | 73 (0.6%) | 122 (1.0%) |
| 18 to 34 Years | 101 (0.6%) | 144 (1.0%) |
| 35 to 64 Years | 394 (2.1%) | 414 (2.3%) |
| 65 to 74 Years | 161 (5.0%) | 221 (6.2%) |
| 75 Years and over | 354 (26.3%) | 431 (16.0%) |
Disability Class: Cognitive Difficulty
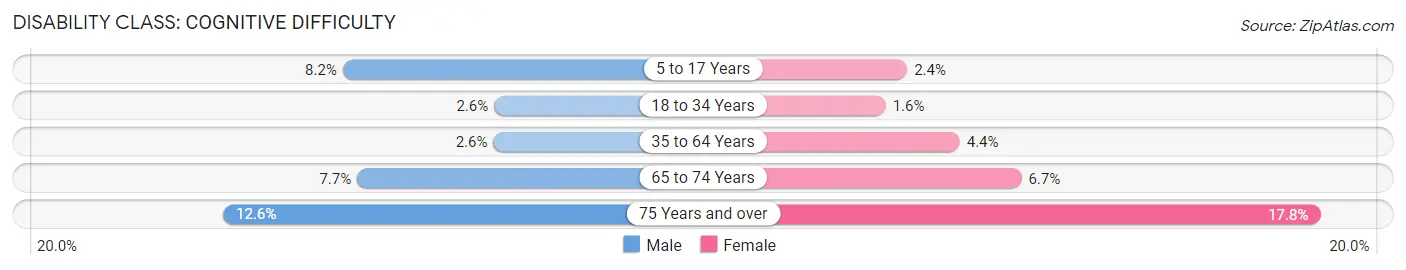
| Age Bracket | Male | Female |
| 5 to 17 Years | 933 (8.2%) | 287 (2.4%) |
| 18 to 34 Years | 428 (2.6%) | 239 (1.6%) |
| 35 to 64 Years | 487 (2.6%) | 786 (4.4%) |
| 65 to 74 Years | 247 (7.7%) | 239 (6.7%) |
| 75 Years and over | 170 (12.6%) | 479 (17.8%) |
Disability Class: Ambulatory Difficulty
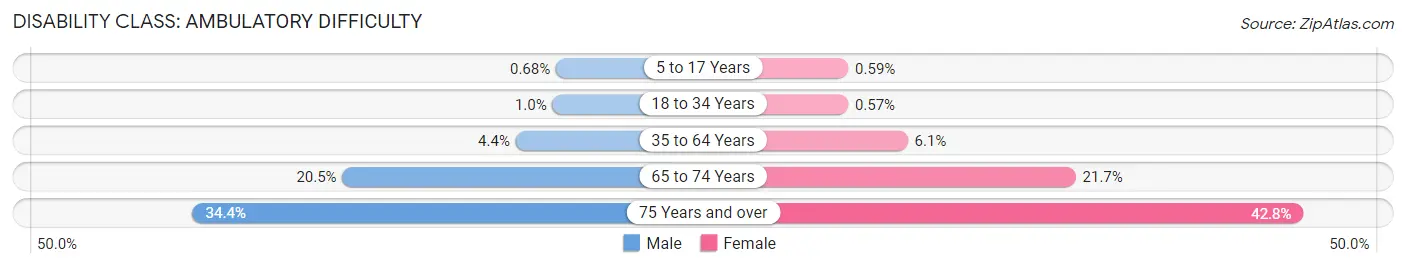
| Age Bracket | Male | Female |
| 5 to 17 Years | 78 (0.7%) | 70 (0.6%) |
| 18 to 34 Years | 166 (1.0%) | 84 (0.6%) |
| 35 to 64 Years | 827 (4.4%) | 1,096 (6.1%) |
| 65 to 74 Years | 661 (20.5%) | 778 (21.7%) |
| 75 Years and over | 463 (34.4%) | 1,155 (42.8%) |
Disability Class: Self-Care Difficulty
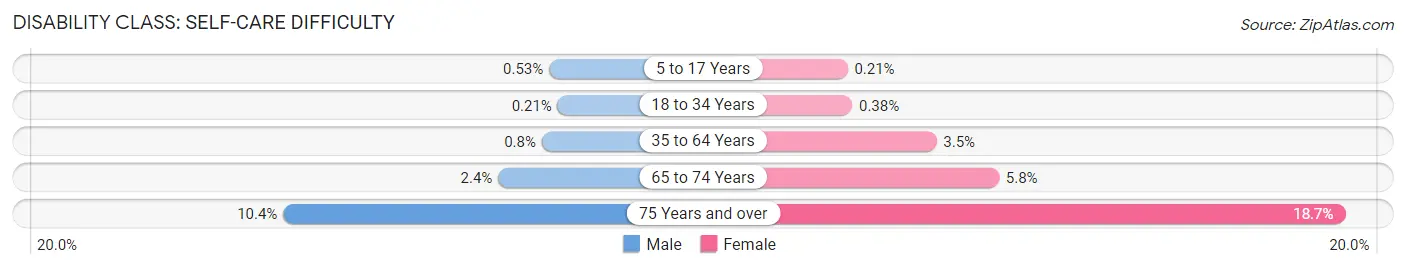
| Age Bracket | Male | Female |
| 5 to 17 Years | 60 (0.5%) | 25 (0.2%) |
| 18 to 34 Years | 35 (0.2%) | 56 (0.4%) |
| 35 to 64 Years | 150 (0.8%) | 630 (3.5%) |
| 65 to 74 Years | 78 (2.4%) | 209 (5.8%) |
| 75 Years and over | 140 (10.4%) | 504 (18.7%) |
Technology Access in Odessa
Computing Device Access in Odessa
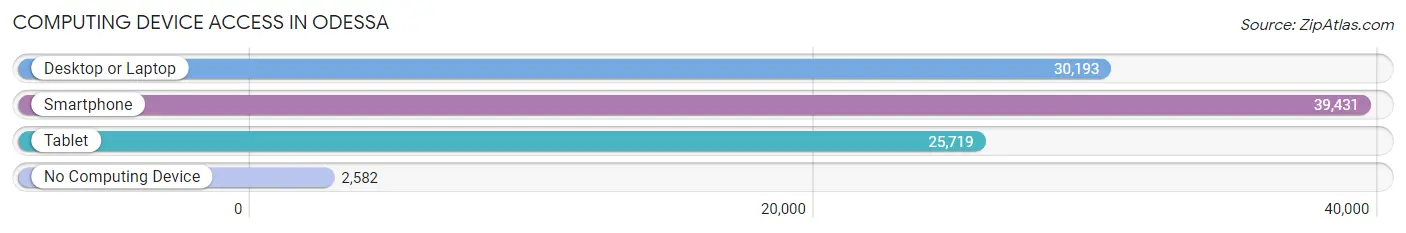
| Device Type | # Households | % Households |
| Desktop or Laptop | 30,193 | 68.9% |
| Smartphone | 39,431 | 90.0% |
| Tablet | 25,719 | 58.7% |
| No Computing Device | 2,582 | 5.9% |
| Total | 43,802 | 100.0% |
Internet Access in Odessa
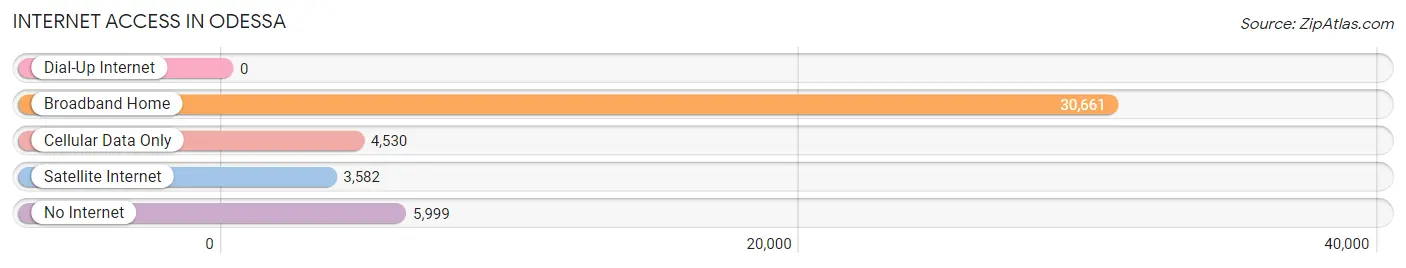
| Internet Type | # Households | % Households |
| Dial-Up Internet | 0 | 0.0% |
| Broadband Home | 30,661 | 70.0% |
| Cellular Data Only | 4,530 | 10.3% |
| Satellite Internet | 3,582 | 8.2% |
| No Internet | 5,999 | 13.7% |
| Total | 43,802 | 100.0% |
Odessa Summary
Odessa, Texas is a city located in Ector County, Texas, United States. It is the county seat of Ector County and is located in the Permian Basin region of West Texas. The city is located approximately 30 miles (48 km) west of Midland, Texas, and is a part of the Midland-Odessa metropolitan area. As of the 2010 census, Odessa had a population of 99,940, making it the 29th-most populous city in Texas.
History
Odessa was founded in 1881 as a water stop and cattle-shipping point on the Texas and Pacific Railway. The city was named after Odessa, Ukraine, because of the local shortgrass prairie's resemblance to Ukraine's steppe landscape. It was incorporated as a city in 1927, after oil was discovered in the area.
The first oil well, Santa Rita No. 1, was drilled in May 1923, and the first producing oil well, the Mabee No. 1, was drilled in August 1923. The city quickly became a major oil-producing center and the population grew rapidly. By 1930, the population had grown to 10,000 people.
Geography
Odessa is located in the Permian Basin region of West Texas, approximately 30 miles (48 km) west of Midland, Texas. The city is situated in the middle of the Permian Basin, a large sedimentary basin that covers an area of approximately 250,000 square miles (650,000 km2). The city is located at the intersection of Interstate 20 and State Highway 191.
The city has a total area of 44.2 square miles (114.5 km2), of which 44.1 square miles (114.4 km2) is land and 0.1 square miles (0.2 km2) is water. The city is located in the Chihuahuan Desert and has a semi-arid climate, with hot summers and mild winters.
Economy
Odessa is a major economic center for the Permian Basin region of West Texas. The city is home to a variety of industries, including oil and gas production, manufacturing, and transportation.
The city is home to several major oil and gas companies, including Chevron, ConocoPhillips, and Halliburton. The city is also home to several manufacturing companies, including Schlumberger, Weatherford International, and Baker Hughes.
The city is also home to several transportation companies, including Union Pacific Railroad, Burlington Northern Santa Fe, and Odessa Transportation.
Demographics
As of the 2010 census, there were 99,940 people, 33,913 households, and 24,868 families residing in the city. The population density was 2,269.2 people per square mile (876.3/km2). There were 37,913 housing units at an average density of 858.2 per square mile (331.2/km2). The racial makeup of the city was 75.2% White, 5.2% African American, 0.7% Native American, 0.7% Asian, 0.1% Pacific Islander, 16.2% from other races, and 2.1% from two or more races. Hispanic or Latino of any race were 44.2% of the population.
The median income for a household in the city was $37,813, and the median income for a family was $45,919. Males had a median income of $37,813 versus $25,988 for females. The per capita income for the city was $19,845. About 14.2% of families and 17.7% of the population were below the poverty line, including 25.2% of those under age 18 and 11.2% of those age 65 or over.
Common Questions
What is Per Capita Income in Odessa?
Per Capita income in Odessa is $34,949.
What is the Median Family Income in Odessa?
Median Family Income in Odessa is $86,796.
What is the Median Household income in Odessa?
Median Household Income in Odessa is $71,293.
What is Income or Wage Gap in Odessa?
Income or Wage Gap in Odessa is 39.0%.
Women in Odessa earn 61.0 cents for every dollar earned by a man.
What is Family Income Deficit in Odessa?
Family Income Deficit in Odessa is $13,261.
Families that are below poverty line in Odessa earn $13,261 less on average than the poverty threshold level.
What is Inequality or Gini Index in Odessa?
Inequality or Gini Index in Odessa is 0.45.
What is the Total Population of Odessa?
Total Population of Odessa is 113,353.
What is the Total Male Population of Odessa?
Total Male Population of Odessa is 57,438.
What is the Total Female Population of Odessa?
Total Female Population of Odessa is 55,915.
What is the Ratio of Males per 100 Females in Odessa?
There are 102.72 Males per 100 Females in Odessa.
What is the Ratio of Females per 100 Males in Odessa?
There are 97.35 Females per 100 Males in Odessa.
What is the Median Population Age in Odessa?
Median Population Age in Odessa is 30.7 Years.
What is the Average Family Size in Odessa
Average Family Size in Odessa is 3.1 People.
What is the Average Household Size in Odessa
Average Household Size in Odessa is 2.5 People.
How Large is the Labor Force in Odessa?
There are 57,812 People in the Labor Forcein in Odessa.
What is the Percentage of People in the Labor Force in Odessa?
69.1% of People are in the Labor Force in Odessa.
What is the Unemployment Rate in Odessa?
Unemployment Rate in Odessa is 6.1%.