Beaverton, OR Map & Demographics
Beaverton Map
Beaverton Overview
$48,119
PER CAPITA INCOME
$111,656
AVG FAMILY INCOME
$88,899
AVG HOUSEHOLD INCOME
22.9%
WAGE / INCOME GAP [ % ]
77.1¢/ $1
WAGE / INCOME GAP [ $ ]
$10,478
FAMILY INCOME DEFICIT
0.43
INEQUALITY / GINI INDEX
97,554
TOTAL POPULATION
49,413
MALE POPULATION
48,141
FEMALE POPULATION
102.64
MALES / 100 FEMALES
97.43
FEMALES / 100 MALES
36.7
MEDIAN AGE
3.0
AVG FAMILY SIZE
2.4
AVG HOUSEHOLD SIZE
57,059
LABOR FORCE [ PEOPLE ]
71.4%
PERCENT IN LABOR FORCE
3.9%
UNEMPLOYMENT RATE
Income in Beaverton
Income Overview in Beaverton
Per Capita Income in Beaverton is $48,119, while median incomes of families and households are $111,656 and $88,899 respectively.
| Characteristic | Number | Measure |
| Per Capita Income | 97,554 | $48,119 |
| Median Family Income | 23,283 | $111,656 |
| Mean Family Income | 23,283 | $137,392 |
| Median Household Income | 40,812 | $88,899 |
| Mean Household Income | 40,812 | $112,475 |
| Income Deficit | 23,283 | $10,478 |
| Wage / Income Gap (%) | 97,554 | 22.88% |
| Wage / Income Gap ($) | 97,554 | 77.12¢ per $1 |
| Gini / Inequality Index | 97,554 | 0.43 |
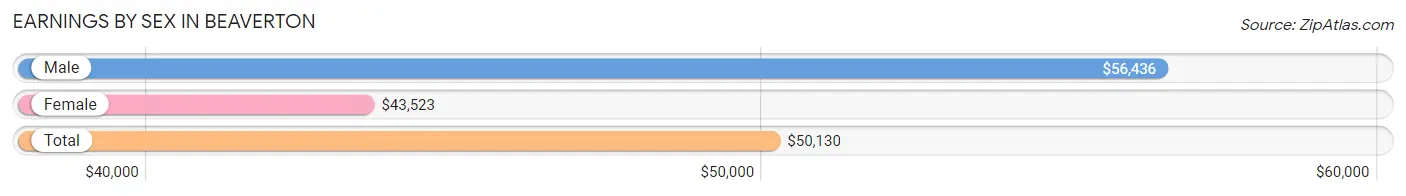
Earnings by Sex in Beaverton
Average Earnings in Beaverton are $50,130, $56,436 for men and $43,523 for women, a difference of 22.9%.
| Sex | Number | Average Earnings |
| Male | 31,235 (53.0%) | $56,436 |
| Female | 27,745 (47.0%) | $43,523 |
| Total | 58,980 (100.0%) | $50,130 |
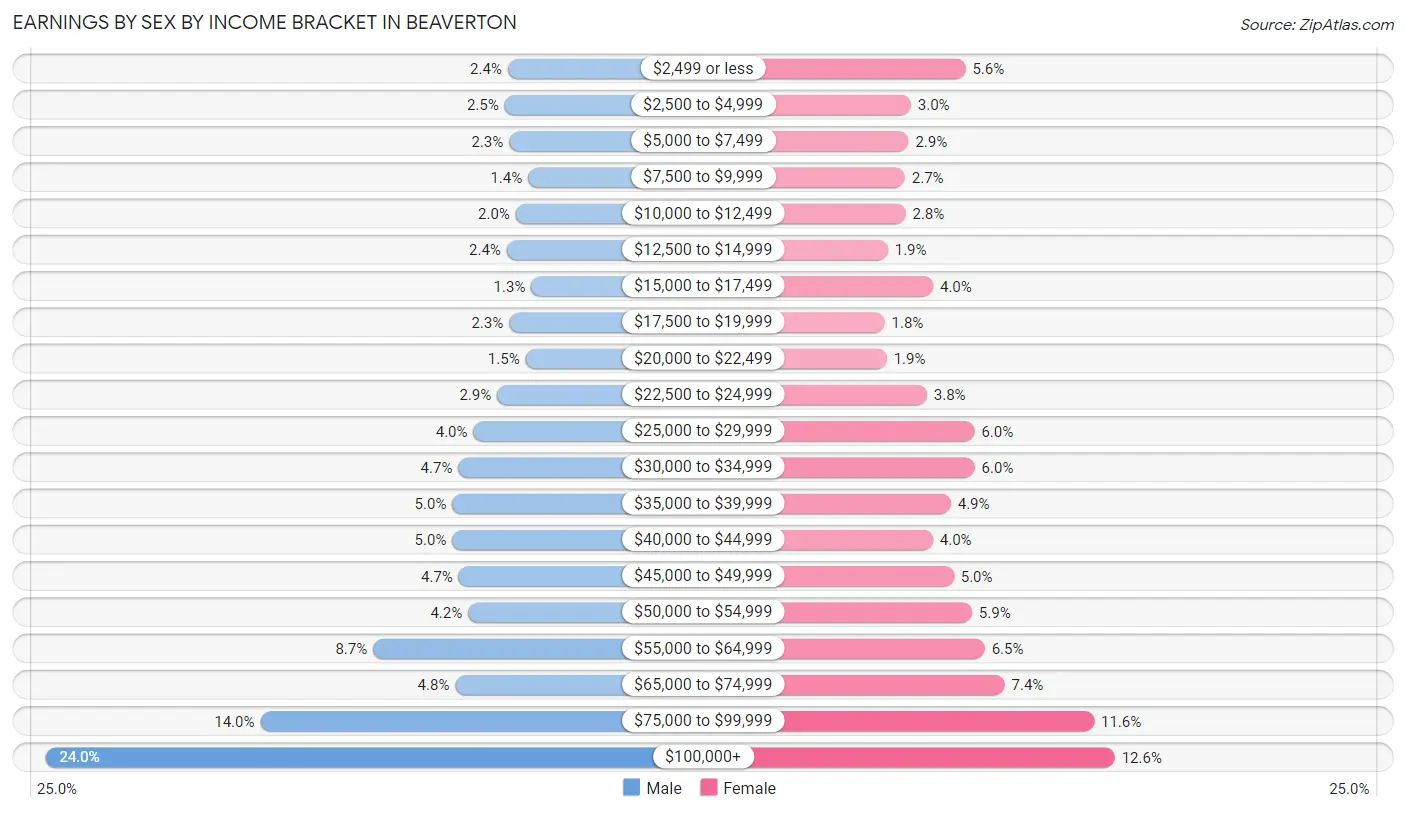
Earnings by Sex by Income Bracket in Beaverton
The most common earnings brackets in Beaverton are $100,000+ for men (7,491 | 24.0%) and $100,000+ for women (3,481 | 12.6%).
| Income | Male | Female |
| $2,499 or less | 741 (2.4%) | 1,544 (5.6%) |
| $2,500 to $4,999 | 787 (2.5%) | 832 (3.0%) |
| $5,000 to $7,499 | 720 (2.3%) | 802 (2.9%) |
| $7,500 to $9,999 | 443 (1.4%) | 754 (2.7%) |
| $10,000 to $12,499 | 626 (2.0%) | 763 (2.8%) |
| $12,500 to $14,999 | 756 (2.4%) | 533 (1.9%) |
| $15,000 to $17,499 | 398 (1.3%) | 1,122 (4.0%) |
| $17,500 to $19,999 | 723 (2.3%) | 490 (1.8%) |
| $20,000 to $22,499 | 481 (1.5%) | 519 (1.9%) |
| $22,500 to $24,999 | 895 (2.9%) | 1,041 (3.7%) |
| $25,000 to $29,999 | 1,243 (4.0%) | 1,660 (6.0%) |
| $30,000 to $34,999 | 1,466 (4.7%) | 1,661 (6.0%) |
| $35,000 to $39,999 | 1,552 (5.0%) | 1,351 (4.9%) |
| $40,000 to $44,999 | 1,552 (5.0%) | 1,119 (4.0%) |
| $45,000 to $49,999 | 1,458 (4.7%) | 1,390 (5.0%) |
| $50,000 to $54,999 | 1,321 (4.2%) | 1,626 (5.9%) |
| $55,000 to $64,999 | 2,712 (8.7%) | 1,793 (6.5%) |
| $65,000 to $74,999 | 1,510 (4.8%) | 2,051 (7.4%) |
| $75,000 to $99,999 | 4,360 (14.0%) | 3,213 (11.6%) |
| $100,000+ | 7,491 (24.0%) | 3,481 (12.6%) |
| Total | 31,235 (100.0%) | 27,745 (100.0%) |
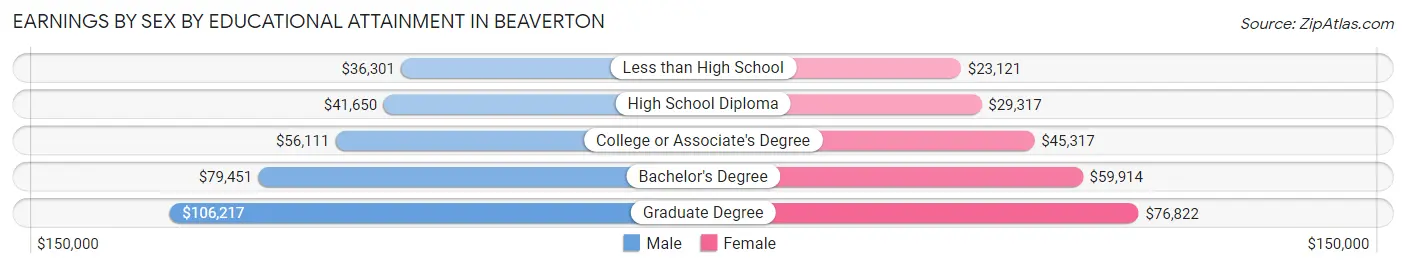
Earnings by Sex by Educational Attainment in Beaverton
Average earnings in Beaverton are $62,802 for men and $49,415 for women, a difference of 21.3%. Men with an educational attainment of graduate degree enjoy the highest average annual earnings of $106,217, while those with less than high school education earn the least with $36,301. Women with an educational attainment of graduate degree earn the most with the average annual earnings of $76,822, while those with less than high school education have the smallest earnings of $23,121.
| Educational Attainment | Male Income | Female Income |
| Less than High School | $36,301 | $23,121 |
| High School Diploma | $41,650 | $29,317 |
| College or Associate's Degree | $56,111 | $45,317 |
| Bachelor's Degree | $79,451 | $59,914 |
| Graduate Degree | $106,217 | $76,822 |
| Total | $62,802 | $49,415 |
Family Income in Beaverton
Family Income Brackets in Beaverton
According to the Beaverton family income data, there are 5,704 families falling into the $100,000 to $149,999 income range, which is the most common income bracket and makes up 24.5% of all families. Conversely, the $10,000 to $14,999 income bracket is the least frequent group with only 279 families (1.2%) belonging to this category.
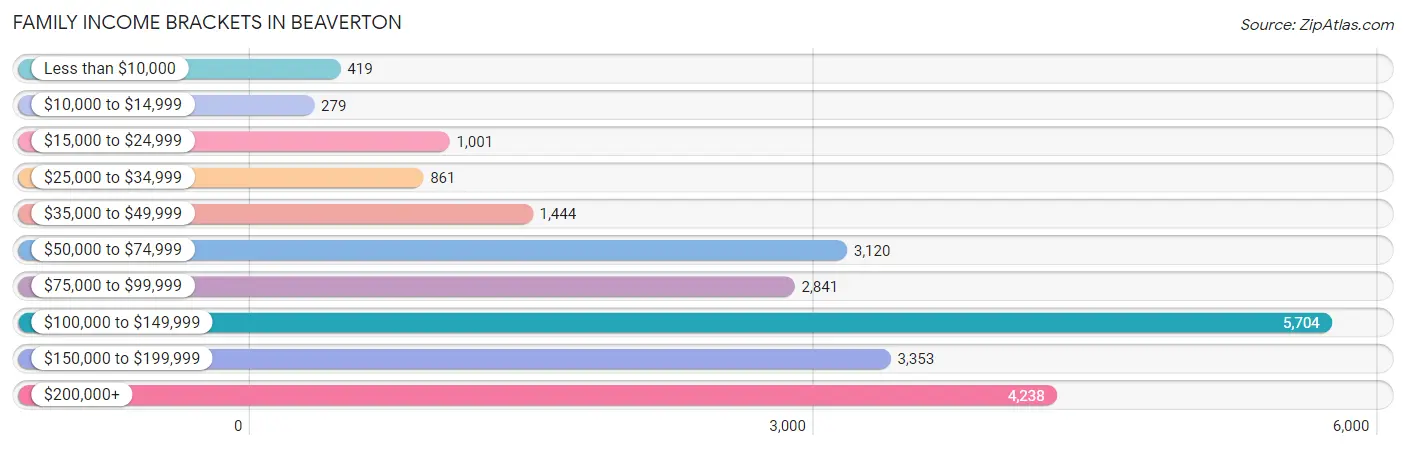
| Income Bracket | # Families | % Families |
| Less than $10,000 | 419 | 1.8% |
| $10,000 to $14,999 | 279 | 1.2% |
| $15,000 to $24,999 | 1,001 | 4.3% |
| $25,000 to $34,999 | 861 | 3.7% |
| $35,000 to $49,999 | 1,444 | 6.2% |
| $50,000 to $74,999 | 3,120 | 13.4% |
| $75,000 to $99,999 | 2,841 | 12.2% |
| $100,000 to $149,999 | 5,704 | 24.5% |
| $150,000 to $199,999 | 3,353 | 14.4% |
| $200,000+ | 4,238 | 18.2% |
Family Income by Famaliy Size in Beaverton
6-person families (525 | 2.2%) account for the highest median family income in Beaverton with $163,281 per family, while 2-person families (11,121 | 47.8%) have the highest median income of $48,686 per family member.
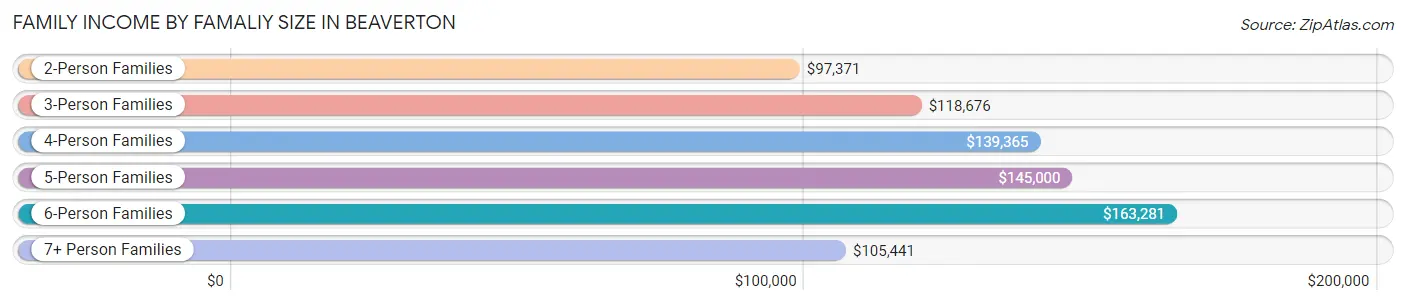
| Income Bracket | # Families | Median Income |
| 2-Person Families | 11,121 (47.8%) | $97,371 |
| 3-Person Families | 5,943 (25.5%) | $118,676 |
| 4-Person Families | 4,316 (18.5%) | $139,365 |
| 5-Person Families | 1,238 (5.3%) | $145,000 |
| 6-Person Families | 525 (2.2%) | $163,281 |
| 7+ Person Families | 140 (0.6%) | $105,441 |
| Total | 23,283 (100.0%) | $111,656 |
Family Income by Number of Earners in Beaverton
The median family income in Beaverton is $111,656, with families comprising 3+ earners (2,088) having the highest median family income of $165,000, while families with no earners (2,353) have the lowest median family income of $65,959, accounting for 9.0% and 10.1% of families, respectively.
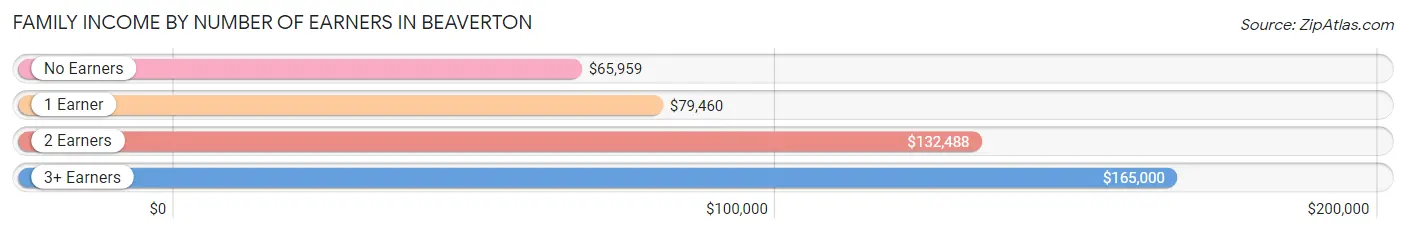
| Number of Earners | # Families | Median Income |
| No Earners | 2,353 (10.1%) | $65,959 |
| 1 Earner | 6,781 (29.1%) | $79,460 |
| 2 Earners | 12,061 (51.8%) | $132,488 |
| 3+ Earners | 2,088 (9.0%) | $165,000 |
| Total | 23,283 (100.0%) | $111,656 |
Household Income in Beaverton
Household Income Brackets in Beaverton
With 7,918 households falling in the category, the $100,000 to $149,999 income range is the most frequent in Beaverton, accounting for 19.4% of all households. In contrast, only 857 households (2.1%) fall into the $10,000 to $14,999 income bracket, making it the least populous group.
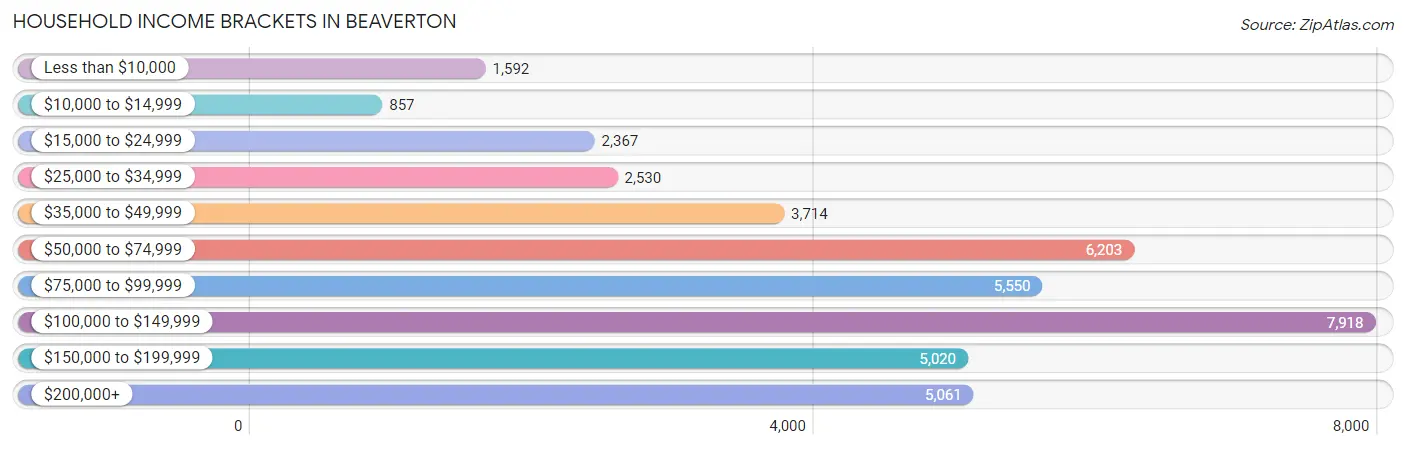
| Income Bracket | # Households | % Households |
| Less than $10,000 | 1,592 | 3.9% |
| $10,000 to $14,999 | 857 | 2.1% |
| $15,000 to $24,999 | 2,367 | 5.8% |
| $25,000 to $34,999 | 2,530 | 6.2% |
| $35,000 to $49,999 | 3,714 | 9.1% |
| $50,000 to $74,999 | 6,203 | 15.2% |
| $75,000 to $99,999 | 5,550 | 13.6% |
| $100,000 to $149,999 | 7,918 | 19.4% |
| $150,000 to $199,999 | 5,020 | 12.3% |
| $200,000+ | 5,061 | 12.4% |
Household Income by Householder Age in Beaverton
The median household income in Beaverton is $88,899, with the highest median household income of $105,013 found in the 45 to 64 years age bracket for the primary householder. A total of 13,724 households (33.6%) fall into this category. Meanwhile, the 15 to 24 years age bracket for the primary householder has the lowest median household income of $49,375, with 1,607 households (3.9%) in this group.
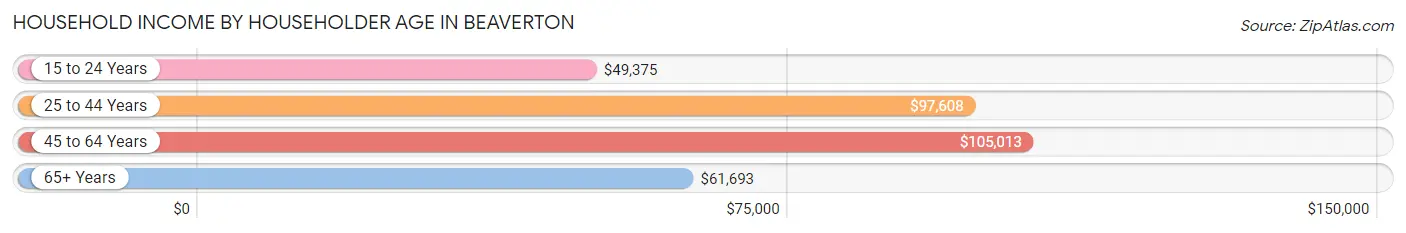
| Income Bracket | # Households | Median Income |
| 15 to 24 Years | 1,607 (3.9%) | $49,375 |
| 25 to 44 Years | 16,460 (40.3%) | $97,608 |
| 45 to 64 Years | 13,724 (33.6%) | $105,013 |
| 65+ Years | 9,021 (22.1%) | $61,693 |
| Total | 40,812 (100.0%) | $88,899 |
Poverty in Beaverton
Income Below Poverty by Sex and Age in Beaverton
With 10.2% poverty level for males and 11.2% for females among the residents of Beaverton, 5 year old males and 18 to 24 year old females are the most vulnerable to poverty, with 112 males (22.6%) and 666 females (17.4%) in their respective age groups living below the poverty level.
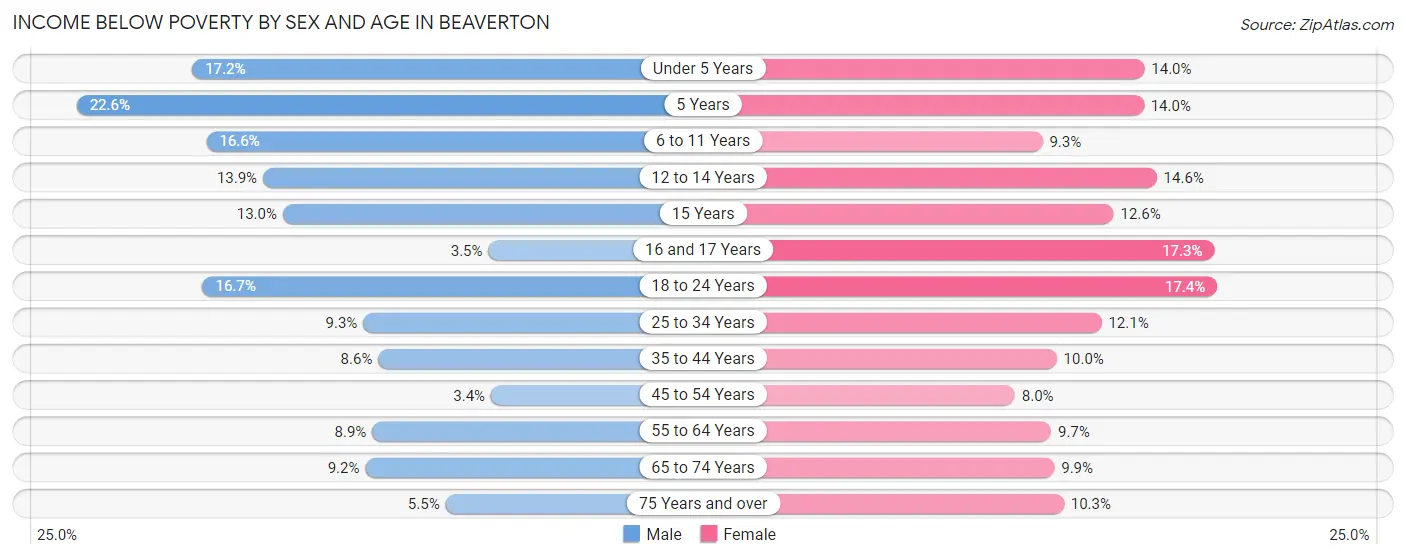
| Age Bracket | Male | Female |
| Under 5 Years | 419 (17.2%) | 346 (14.0%) |
| 5 Years | 112 (22.6%) | 86 (14.0%) |
| 6 to 11 Years | 719 (16.6%) | 258 (9.3%) |
| 12 to 14 Years | 251 (13.9%) | 185 (14.6%) |
| 15 Years | 75 (13.0%) | 84 (12.6%) |
| 16 and 17 Years | 30 (3.5%) | 173 (17.3%) |
| 18 to 24 Years | 679 (16.7%) | 666 (17.4%) |
| 25 to 34 Years | 927 (9.3%) | 1,070 (12.0%) |
| 35 to 44 Years | 662 (8.6%) | 641 (10.0%) |
| 45 to 54 Years | 184 (3.4%) | 499 (8.0%) |
| 55 to 64 Years | 505 (8.9%) | 547 (9.7%) |
| 65 to 74 Years | 344 (9.2%) | 439 (9.9%) |
| 75 Years and over | 107 (5.5%) | 370 (10.3%) |
| Total | 5,014 (10.2%) | 5,364 (11.2%) |
Income Above Poverty by Sex and Age in Beaverton
According to the poverty statistics in Beaverton, males aged 45 to 54 years and females aged 45 to 54 years are the age groups that are most secure financially, with 96.6% of males and 92.0% of females in these age groups living above the poverty line.
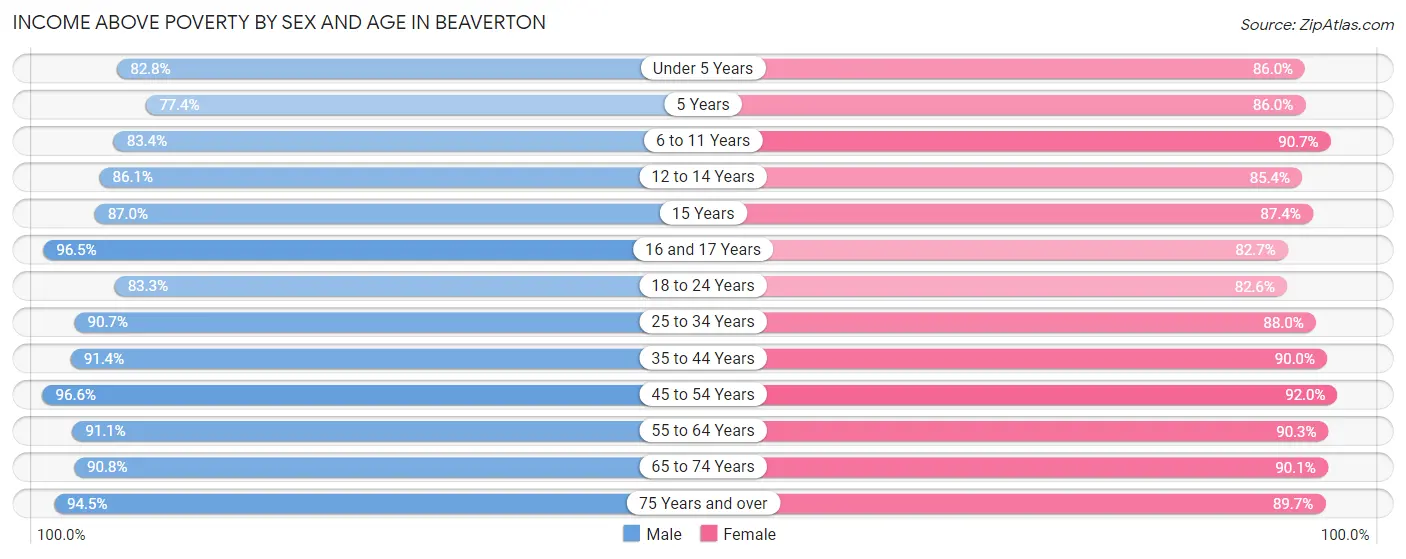
| Age Bracket | Male | Female |
| Under 5 Years | 2,014 (82.8%) | 2,118 (86.0%) |
| 5 Years | 384 (77.4%) | 528 (86.0%) |
| 6 to 11 Years | 3,623 (83.4%) | 2,513 (90.7%) |
| 12 to 14 Years | 1,549 (86.1%) | 1,081 (85.4%) |
| 15 Years | 501 (87.0%) | 582 (87.4%) |
| 16 and 17 Years | 831 (96.5%) | 828 (82.7%) |
| 18 to 24 Years | 3,377 (83.3%) | 3,160 (82.6%) |
| 25 to 34 Years | 9,051 (90.7%) | 7,811 (87.9%) |
| 35 to 44 Years | 7,043 (91.4%) | 5,787 (90.0%) |
| 45 to 54 Years | 5,299 (96.6%) | 5,715 (92.0%) |
| 55 to 64 Years | 5,187 (91.1%) | 5,085 (90.3%) |
| 65 to 74 Years | 3,401 (90.8%) | 4,014 (90.1%) |
| 75 Years and over | 1,848 (94.5%) | 3,221 (89.7%) |
| Total | 44,108 (89.8%) | 42,443 (88.8%) |
Income Below Poverty Among Married-Couple Families in Beaverton
The poverty statistics for married-couple families in Beaverton show that 3.9% or 664 of the total 16,934 families live below the poverty line. Families with 5 or more children have the highest poverty rate of 61.3%, comprising of 38 families. On the other hand, families with no children have the lowest poverty rate of 3.1%, which includes 308 families.
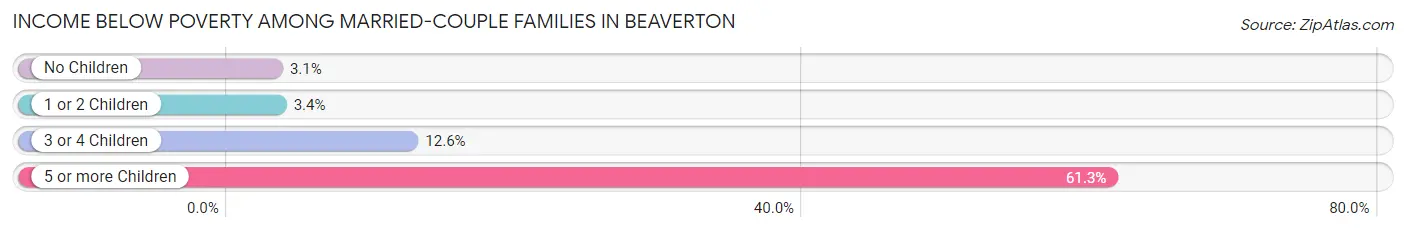
| Children | Above Poverty | Below Poverty |
| No Children | 9,525 (96.9%) | 308 (3.1%) |
| 1 or 2 Children | 5,962 (96.6%) | 209 (3.4%) |
| 3 or 4 Children | 759 (87.4%) | 109 (12.6%) |
| 5 or more Children | 24 (38.7%) | 38 (61.3%) |
| Total | 16,270 (96.1%) | 664 (3.9%) |
Income Below Poverty Among Single-Parent Households in Beaverton
According to the poverty data in Beaverton, 2.1% or 40 single-father households and 19.0% or 845 single-mother households are living below the poverty line. Among single-father households, those with 3 or 4 children have the highest poverty rate, with 6 households (4.6%) experiencing poverty. Likewise, among single-mother households, those with 3 or 4 children have the highest poverty rate, with 294 households (65.8%) falling below the poverty line.
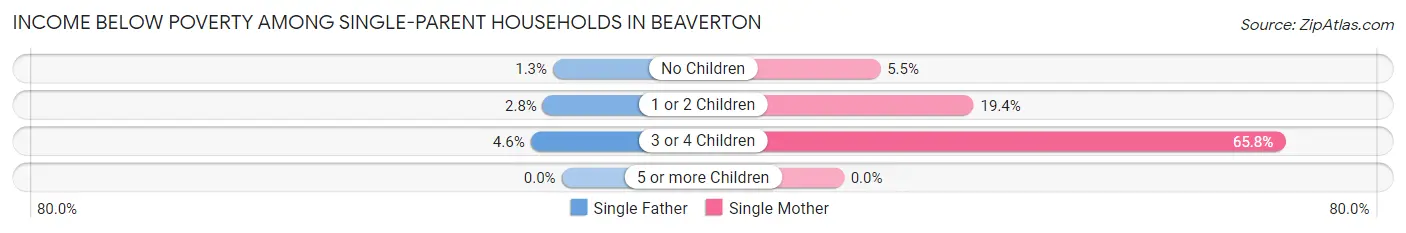
| Children | Single Father | Single Mother |
| No Children | 13 (1.3%) | 88 (5.4%) |
| 1 or 2 Children | 21 (2.8%) | 463 (19.4%) |
| 3 or 4 Children | 6 (4.6%) | 294 (65.8%) |
| 5 or more Children | 0 (0.0%) | 0 (0.0%) |
| Total | 40 (2.1%) | 845 (19.0%) |
Income Below Poverty Among Married-Couple vs Single-Parent Households in Beaverton
The poverty data for Beaverton shows that 664 of the married-couple family households (3.9%) and 885 of the single-parent households (13.9%) are living below the poverty level. Within the married-couple family households, those with 5 or more children have the highest poverty rate, with 38 households (61.3%) falling below the poverty line. Among the single-parent households, those with 3 or 4 children have the highest poverty rate, with 300 household (52.0%) living below poverty.
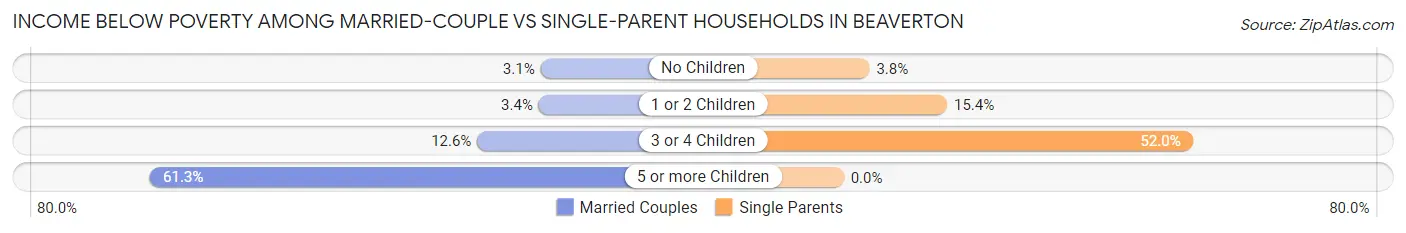
| Children | Married-Couple Families | Single-Parent Households |
| No Children | 308 (3.1%) | 101 (3.8%) |
| 1 or 2 Children | 209 (3.4%) | 484 (15.4%) |
| 3 or 4 Children | 109 (12.6%) | 300 (52.0%) |
| 5 or more Children | 38 (61.3%) | 0 (0.0%) |
| Total | 664 (3.9%) | 885 (13.9%) |
Race in Beaverton
The most populous races in Beaverton are White / Caucasian (66,390 | 68.0%), Hispanic or Latino (17,007 | 17.4%), and Asian (11,630 | 11.9%).
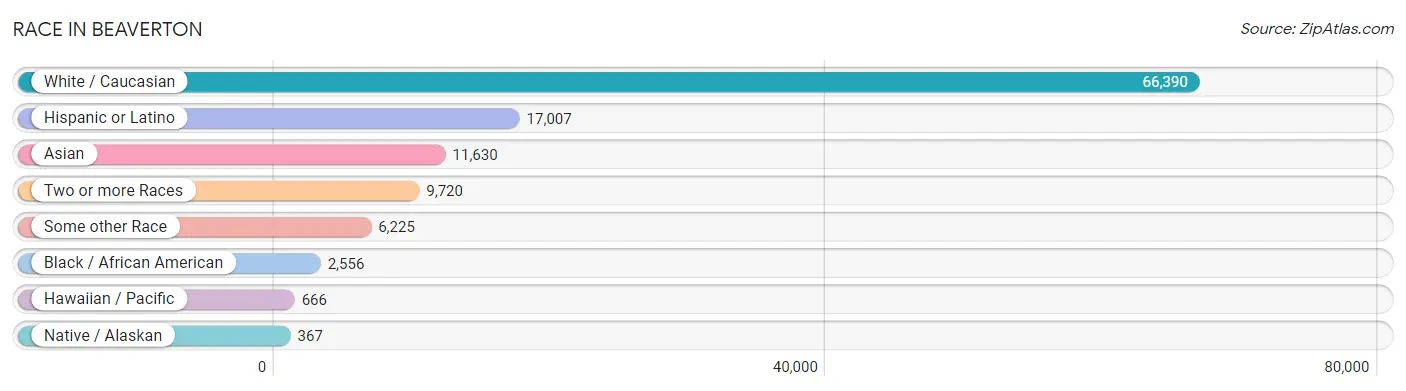
| Race | # Population | % Population |
| Asian | 11,630 | 11.9% |
| Black / African American | 2,556 | 2.6% |
| Hawaiian / Pacific | 666 | 0.7% |
| Hispanic or Latino | 17,007 | 17.4% |
| Native / Alaskan | 367 | 0.4% |
| White / Caucasian | 66,390 | 68.0% |
| Two or more Races | 9,720 | 10.0% |
| Some other Race | 6,225 | 6.4% |
| Total | 97,554 | 100.0% |
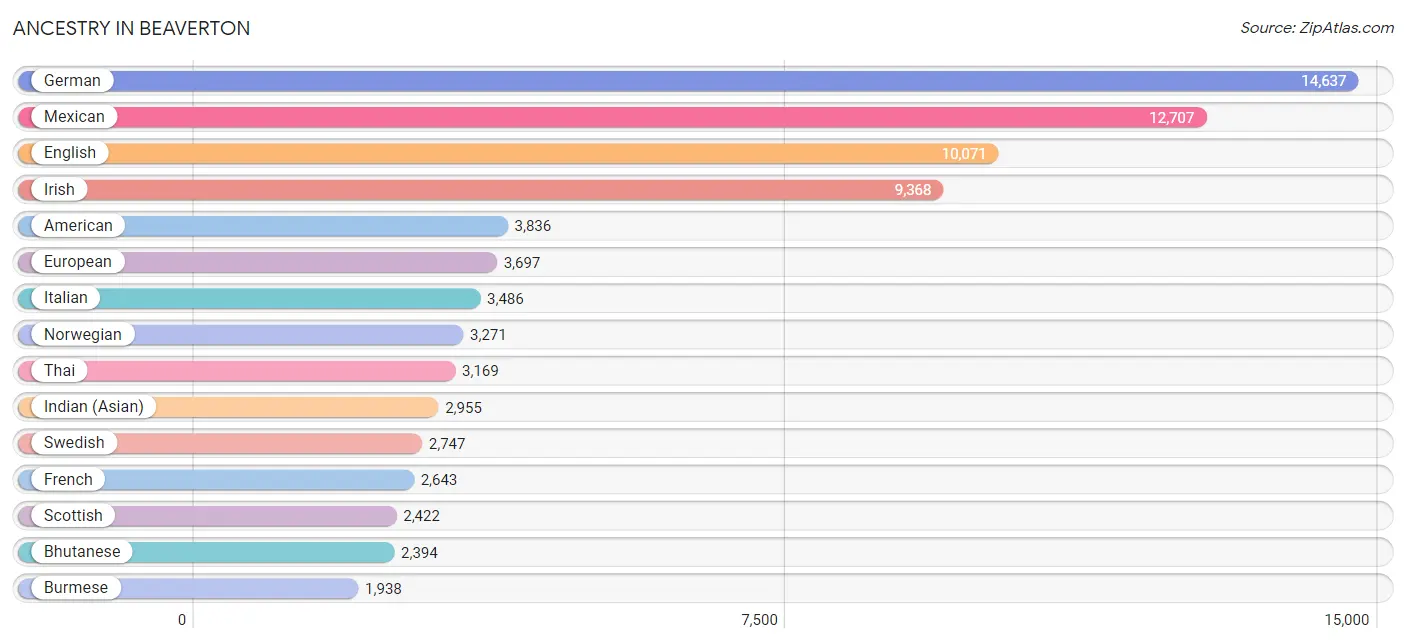
Ancestry in Beaverton
The most populous ancestries reported in Beaverton are German (14,637 | 15.0%), Mexican (12,707 | 13.0%), English (10,071 | 10.3%), Irish (9,368 | 9.6%), and American (3,836 | 3.9%), together accounting for 51.9% of all Beaverton residents.
| Ancestry | # Population | % Population |
| Afghan | 151 | 0.2% |
| African | 450 | 0.5% |
| Aleut | 17 | 0.0% |
| American | 3,836 | 3.9% |
| Apache | 14 | 0.0% |
| Arab | 940 | 1.0% |
| Argentinean | 12 | 0.0% |
| Armenian | 126 | 0.1% |
| Assyrian / Chaldean / Syriac | 74 | 0.1% |
| Austrian | 229 | 0.2% |
| Basque | 89 | 0.1% |
| Belgian | 106 | 0.1% |
| Bhutanese | 2,394 | 2.5% |
| Blackfeet | 91 | 0.1% |
| Bolivian | 184 | 0.2% |
| Brazilian | 55 | 0.1% |
| British | 800 | 0.8% |
| Bulgarian | 2 | 0.0% |
| Burmese | 1,938 | 2.0% |
| Cajun | 14 | 0.0% |
| Canadian | 541 | 0.5% |
| Cape Verdean | 17 | 0.0% |
| Central American | 1,685 | 1.7% |
| Central American Indian | 51 | 0.1% |
| Cherokee | 282 | 0.3% |
| Chickasaw | 14 | 0.0% |
| Chilean | 98 | 0.1% |
| Chinese | 83 | 0.1% |
| Chippewa | 45 | 0.1% |
| Choctaw | 57 | 0.1% |
| Colombian | 157 | 0.2% |
| Costa Rican | 209 | 0.2% |
| Creek | 5 | 0.0% |
| Croatian | 105 | 0.1% |
| Crow | 6 | 0.0% |
| Cuban | 114 | 0.1% |
| Czech | 422 | 0.4% |
| Czechoslovakian | 17 | 0.0% |
| Danish | 788 | 0.8% |
| Dominican | 63 | 0.1% |
| Dutch | 1,006 | 1.0% |
| Eastern European | 272 | 0.3% |
| Ecuadorian | 319 | 0.3% |
| Egyptian | 42 | 0.0% |
| English | 10,071 | 10.3% |
| Ethiopian | 11 | 0.0% |
| European | 3,697 | 3.8% |
| Filipino | 174 | 0.2% |
| Finnish | 520 | 0.5% |
| French | 2,643 | 2.7% |
| French American Indian | 335 | 0.3% |
| French Canadian | 384 | 0.4% |
| German | 14,637 | 15.0% |
| Ghanaian | 30 | 0.0% |
| Greek | 554 | 0.6% |
| Guamanian / Chamorro | 225 | 0.2% |
| Guatemalan | 935 | 1.0% |
| Haitian | 74 | 0.1% |
| Honduran | 12 | 0.0% |
| Hopi | 1 | 0.0% |
| Hungarian | 406 | 0.4% |
| Indian (Asian) | 2,955 | 3.0% |
| Iranian | 928 | 0.9% |
| Iraqi | 197 | 0.2% |
| Irish | 9,368 | 9.6% |
| Israeli | 46 | 0.1% |
| Italian | 3,486 | 3.6% |
| Jamaican | 19 | 0.0% |
| Japanese | 223 | 0.2% |
| Jordanian | 26 | 0.0% |
| Kenyan | 22 | 0.0% |
| Korean | 1,924 | 2.0% |
| Laotian | 67 | 0.1% |
| Lebanese | 321 | 0.3% |
| Lithuanian | 158 | 0.2% |
| Lumbee | 5 | 0.0% |
| Luxembourger | 48 | 0.1% |
| Macedonian | 27 | 0.0% |
| Malaysian | 61 | 0.1% |
| Mexican | 12,707 | 13.0% |
| Mexican American Indian | 217 | 0.2% |
| Mongolian | 80 | 0.1% |
| Moroccan | 9 | 0.0% |
| Native Hawaiian | 962 | 1.0% |
| Navajo | 6 | 0.0% |
| New Zealander | 89 | 0.1% |
| Nicaraguan | 25 | 0.0% |
| Nigerian | 226 | 0.2% |
| Northern European | 660 | 0.7% |
| Norwegian | 3,271 | 3.4% |
| Okinawan | 23 | 0.0% |
| Paiute | 15 | 0.0% |
| Pakistani | 335 | 0.3% |
| Palestinian | 85 | 0.1% |
| Panamanian | 41 | 0.0% |
| Peruvian | 137 | 0.1% |
| Polish | 1,938 | 2.0% |
| Portuguese | 232 | 0.2% |
| Pueblo | 45 | 0.1% |
| Puerto Rican | 384 | 0.4% |
| Romanian | 508 | 0.5% |
| Russian | 903 | 0.9% |
| Salvadoran | 463 | 0.5% |
| Samoan | 128 | 0.1% |
| Scandinavian | 1,070 | 1.1% |
| Scotch-Irish | 975 | 1.0% |
| Scottish | 2,422 | 2.5% |
| Serbian | 178 | 0.2% |
| Sioux | 42 | 0.0% |
| Slovak | 148 | 0.2% |
| Slovene | 16 | 0.0% |
| Somali | 496 | 0.5% |
| South African | 55 | 0.1% |
| South American | 1,077 | 1.1% |
| South American Indian | 14 | 0.0% |
| Spaniard | 334 | 0.3% |
| Spanish | 289 | 0.3% |
| Spanish American | 55 | 0.1% |
| Sri Lankan | 1,817 | 1.9% |
| Subsaharan African | 1,370 | 1.4% |
| Sudanese | 58 | 0.1% |
| Swedish | 2,747 | 2.8% |
| Swiss | 458 | 0.5% |
| Syrian | 35 | 0.0% |
| Thai | 3,169 | 3.3% |
| Tlingit-Haida | 42 | 0.0% |
| Trinidadian and Tobagonian | 6 | 0.0% |
| Turkish | 218 | 0.2% |
| Ukrainian | 485 | 0.5% |
| Uruguayan | 16 | 0.0% |
| Venezuelan | 154 | 0.2% |
| Welsh | 710 | 0.7% |
| West Indian | 40 | 0.0% |
| Yakama | 58 | 0.1% |
| Yugoslavian | 30 | 0.0% | View All 135 Rows |
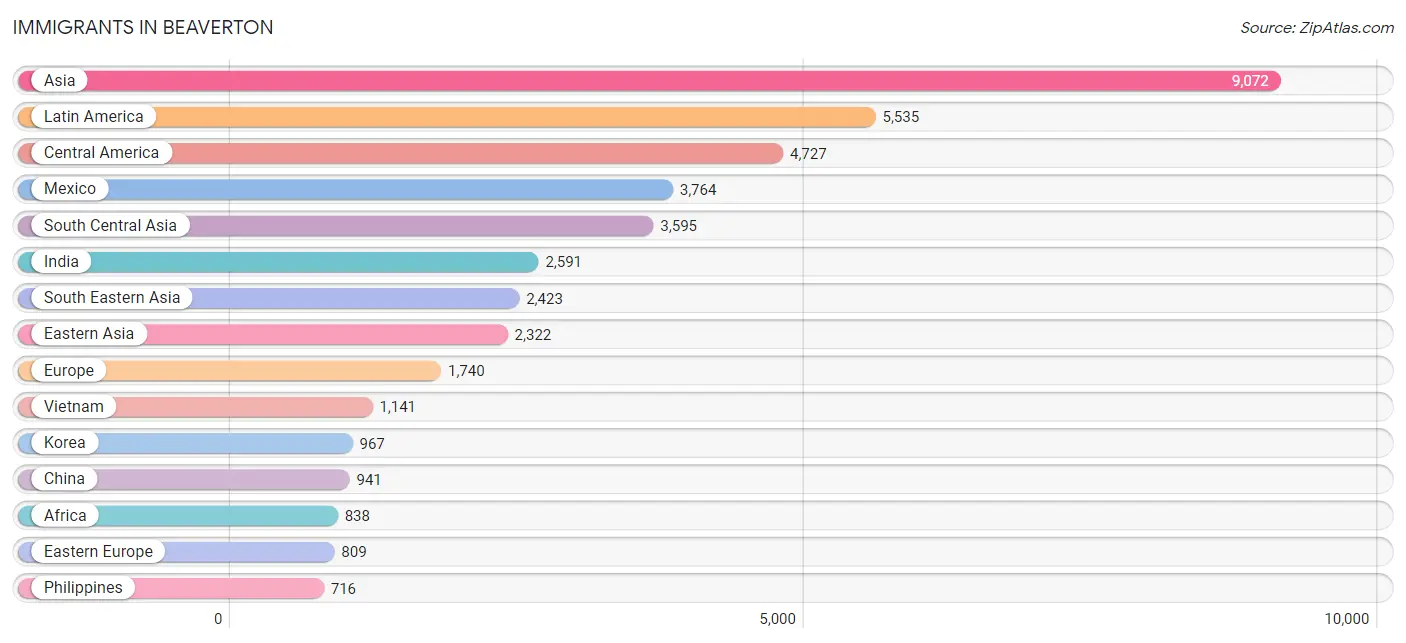
Immigrants in Beaverton
The most numerous immigrant groups reported in Beaverton came from Asia (9,072 | 9.3%), Latin America (5,535 | 5.7%), Central America (4,727 | 4.9%), Mexico (3,764 | 3.9%), and South Central Asia (3,595 | 3.7%), together accounting for 27.4% of all Beaverton residents.
| Immigration Origin | # Population | % Population |
| Afghanistan | 106 | 0.1% |
| Africa | 838 | 0.9% |
| Argentina | 36 | 0.0% |
| Armenia | 14 | 0.0% |
| Asia | 9,072 | 9.3% |
| Australia | 85 | 0.1% |
| Austria | 14 | 0.0% |
| Belarus | 47 | 0.1% |
| Belgium | 67 | 0.1% |
| Bolivia | 48 | 0.1% |
| Bosnia and Herzegovina | 28 | 0.0% |
| Brazil | 77 | 0.1% |
| Bulgaria | 12 | 0.0% |
| Cambodia | 69 | 0.1% |
| Cameroon | 34 | 0.0% |
| Canada | 580 | 0.6% |
| Caribbean | 133 | 0.1% |
| Central America | 4,727 | 4.9% |
| Chile | 98 | 0.1% |
| China | 941 | 1.0% |
| Colombia | 94 | 0.1% |
| Congo | 27 | 0.0% |
| Costa Rica | 85 | 0.1% |
| Croatia | 25 | 0.0% |
| Cuba | 67 | 0.1% |
| Czechoslovakia | 17 | 0.0% |
| Eastern Africa | 438 | 0.4% |
| Eastern Asia | 2,322 | 2.4% |
| Eastern Europe | 809 | 0.8% |
| Ecuador | 165 | 0.2% |
| Egypt | 14 | 0.0% |
| El Salvador | 236 | 0.2% |
| England | 141 | 0.1% |
| Ethiopia | 11 | 0.0% |
| Europe | 1,740 | 1.8% |
| Fiji | 166 | 0.2% |
| France | 12 | 0.0% |
| Germany | 144 | 0.2% |
| Ghana | 45 | 0.1% |
| Greece | 9 | 0.0% |
| Guatemala | 607 | 0.6% |
| Haiti | 50 | 0.1% |
| Hong Kong | 120 | 0.1% |
| Hungary | 12 | 0.0% |
| India | 2,591 | 2.7% |
| Indonesia | 47 | 0.1% |
| Iran | 642 | 0.7% |
| Iraq | 273 | 0.3% |
| Ireland | 115 | 0.1% |
| Israel | 29 | 0.0% |
| Italy | 8 | 0.0% |
| Japan | 414 | 0.4% |
| Jordan | 14 | 0.0% |
| Kazakhstan | 69 | 0.1% |
| Kenya | 63 | 0.1% |
| Korea | 967 | 1.0% |
| Kuwait | 12 | 0.0% |
| Laos | 59 | 0.1% |
| Latin America | 5,535 | 5.7% |
| Latvia | 14 | 0.0% |
| Lebanon | 86 | 0.1% |
| Malaysia | 58 | 0.1% |
| Mexico | 3,764 | 3.9% |
| Middle Africa | 104 | 0.1% |
| Moldova | 15 | 0.0% |
| Nepal | 96 | 0.1% |
| Netherlands | 15 | 0.0% |
| Nicaragua | 25 | 0.0% |
| Nigeria | 80 | 0.1% |
| North Macedonia | 15 | 0.0% |
| Northern Africa | 57 | 0.1% |
| Northern Europe | 516 | 0.5% |
| Norway | 48 | 0.1% |
| Oceania | 316 | 0.3% |
| Pakistan | 11 | 0.0% |
| Panama | 10 | 0.0% |
| Peru | 46 | 0.1% |
| Philippines | 716 | 0.7% |
| Poland | 15 | 0.0% |
| Romania | 180 | 0.2% |
| Russia | 149 | 0.2% |
| Saudi Arabia | 28 | 0.0% |
| Scotland | 6 | 0.0% |
| Singapore | 62 | 0.1% |
| Somalia | 287 | 0.3% |
| South Africa | 44 | 0.1% |
| South America | 675 | 0.7% |
| South Central Asia | 3,595 | 3.7% |
| South Eastern Asia | 2,423 | 2.5% |
| Southern Europe | 37 | 0.0% |
| Spain | 20 | 0.0% |
| Sri Lanka | 55 | 0.1% |
| Sweden | 56 | 0.1% |
| Switzerland | 20 | 0.0% |
| Syria | 26 | 0.0% |
| Taiwan | 263 | 0.3% |
| Thailand | 270 | 0.3% |
| Trinidad and Tobago | 16 | 0.0% |
| Turkey | 170 | 0.2% |
| Ukraine | 164 | 0.2% |
| Uruguay | 16 | 0.0% |
| Uzbekistan | 11 | 0.0% |
| Venezuela | 95 | 0.1% |
| Vietnam | 1,141 | 1.2% |
| Western Africa | 195 | 0.2% |
| Western Asia | 704 | 0.7% |
| Western Europe | 272 | 0.3% |
| Zaire | 43 | 0.0% |
| Zimbabwe | 17 | 0.0% | View All 109 Rows |
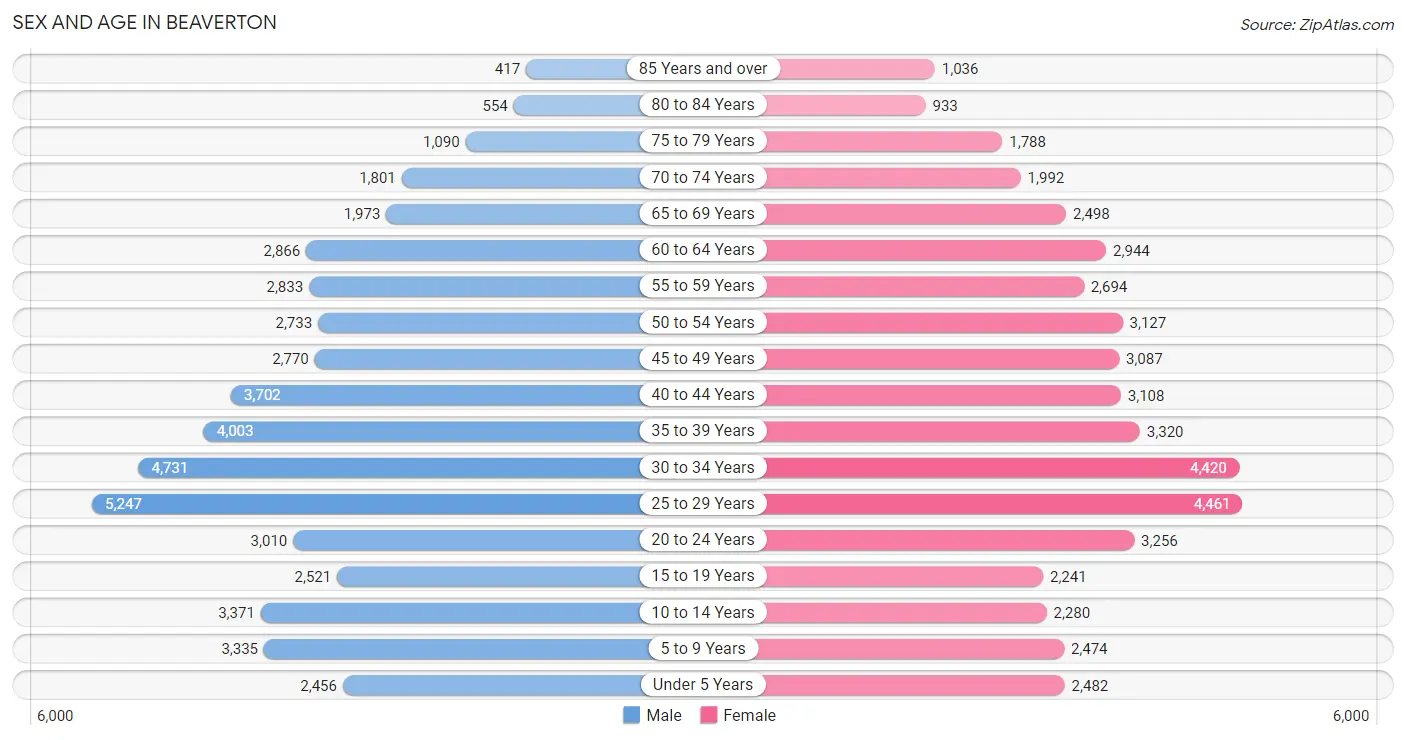
Sex and Age in Beaverton
Sex and Age in Beaverton
The most populous age groups in Beaverton are 25 to 29 Years (5,247 | 10.6%) for men and 25 to 29 Years (4,461 | 9.3%) for women.
| Age Bracket | Male | Female |
| Under 5 Years | 2,456 (5.0%) | 2,482 (5.2%) |
| 5 to 9 Years | 3,335 (6.8%) | 2,474 (5.1%) |
| 10 to 14 Years | 3,371 (6.8%) | 2,280 (4.7%) |
| 15 to 19 Years | 2,521 (5.1%) | 2,241 (4.7%) |
| 20 to 24 Years | 3,010 (6.1%) | 3,256 (6.8%) |
| 25 to 29 Years | 5,247 (10.6%) | 4,461 (9.3%) |
| 30 to 34 Years | 4,731 (9.6%) | 4,420 (9.2%) |
| 35 to 39 Years | 4,003 (8.1%) | 3,320 (6.9%) |
| 40 to 44 Years | 3,702 (7.5%) | 3,108 (6.5%) |
| 45 to 49 Years | 2,770 (5.6%) | 3,087 (6.4%) |
| 50 to 54 Years | 2,733 (5.5%) | 3,127 (6.5%) |
| 55 to 59 Years | 2,833 (5.7%) | 2,694 (5.6%) |
| 60 to 64 Years | 2,866 (5.8%) | 2,944 (6.1%) |
| 65 to 69 Years | 1,973 (4.0%) | 2,498 (5.2%) |
| 70 to 74 Years | 1,801 (3.6%) | 1,992 (4.1%) |
| 75 to 79 Years | 1,090 (2.2%) | 1,788 (3.7%) |
| 80 to 84 Years | 554 (1.1%) | 933 (1.9%) |
| 85 Years and over | 417 (0.8%) | 1,036 (2.1%) |
| Total | 49,413 (100.0%) | 48,141 (100.0%) |
Families and Households in Beaverton
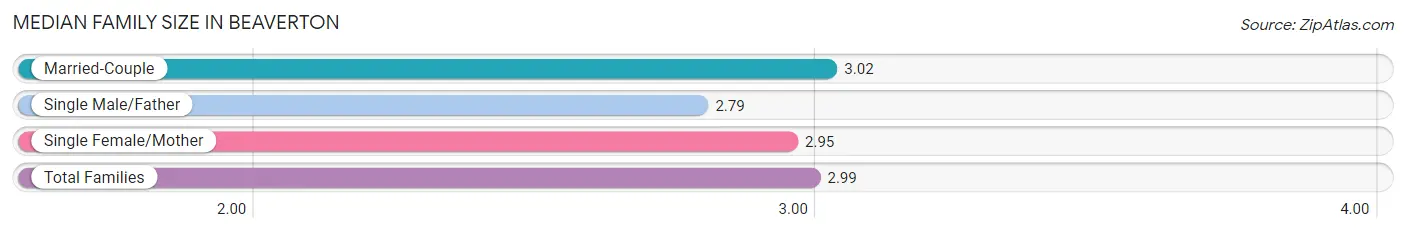
Median Family Size in Beaverton
The median family size in Beaverton is 2.99 persons per family, with married-couple families (16,934 | 72.7%) accounting for the largest median family size of 3.02 persons per family. On the other hand, single male/father families (1,896 | 8.1%) represent the smallest median family size with 2.79 persons per family.
| Family Type | # Families | Family Size |
| Married-Couple | 16,934 (72.7%) | 3.02 |
| Single Male/Father | 1,896 (8.1%) | 2.79 |
| Single Female/Mother | 4,453 (19.1%) | 2.95 |
| Total Families | 23,283 (100.0%) | 2.99 |
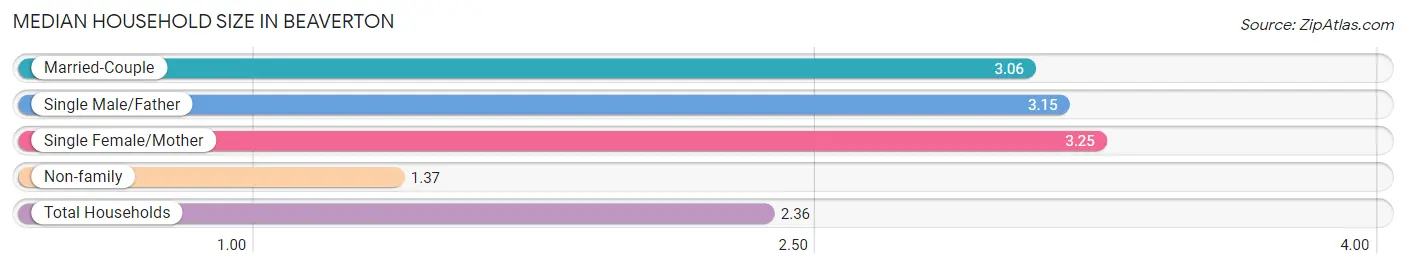
Median Household Size in Beaverton
The median household size in Beaverton is 2.36 persons per household, with single female/mother households (4,453 | 10.9%) accounting for the largest median household size of 3.25 persons per household. non-family households (17,529 | 42.9%) represent the smallest median household size with 1.37 persons per household.
| Household Type | # Households | Household Size |
| Married-Couple | 16,934 (41.5%) | 3.06 |
| Single Male/Father | 1,896 (4.6%) | 3.15 |
| Single Female/Mother | 4,453 (10.9%) | 3.25 |
| Non-family | 17,529 (42.9%) | 1.37 |
| Total Households | 40,812 (100.0%) | 2.36 |
Household Size by Marriage Status in Beaverton
Out of a total of 40,812 households in Beaverton, 23,283 (57.1%) are family households, while 17,529 (42.9%) are nonfamily households. The most numerous type of family households are 2-person households, comprising 10,326, and the most common type of nonfamily households are 1-person households, comprising 12,419.
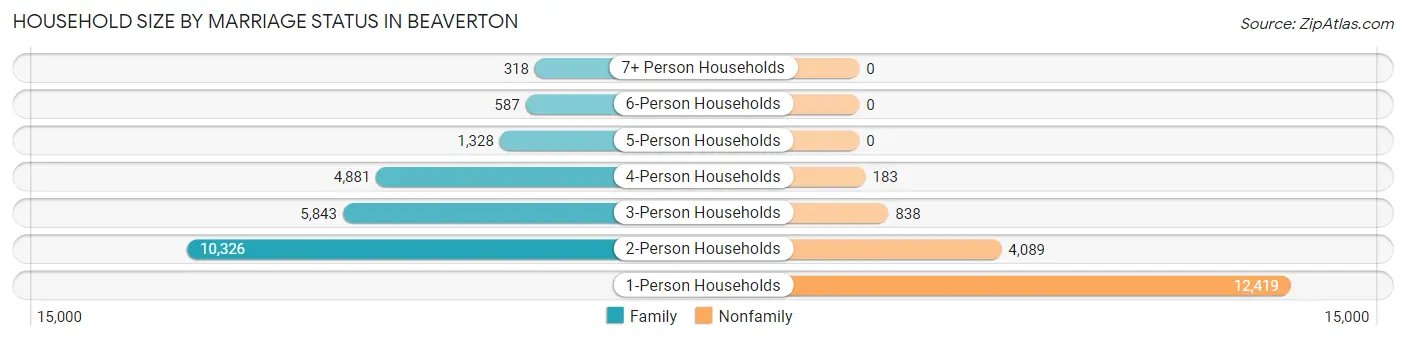
| Household Size | Family Households | Nonfamily Households |
| 1-Person Households | - | 12,419 (30.4%) |
| 2-Person Households | 10,326 (25.3%) | 4,089 (10.0%) |
| 3-Person Households | 5,843 (14.3%) | 838 (2.1%) |
| 4-Person Households | 4,881 (12.0%) | 183 (0.4%) |
| 5-Person Households | 1,328 (3.3%) | 0 (0.0%) |
| 6-Person Households | 587 (1.4%) | 0 (0.0%) |
| 7+ Person Households | 318 (0.8%) | 0 (0.0%) |
| Total | 23,283 (57.1%) | 17,529 (42.9%) |
Female Fertility in Beaverton
Fertility by Age in Beaverton
Average fertility rate in Beaverton is 49.0 births per 1,000 women. Women in the age bracket of 20 to 34 years have the highest fertility rate with 79.0 births per 1,000 women. Women in the age bracket of 20 to 34 years acount for 80.8% of all women with births.
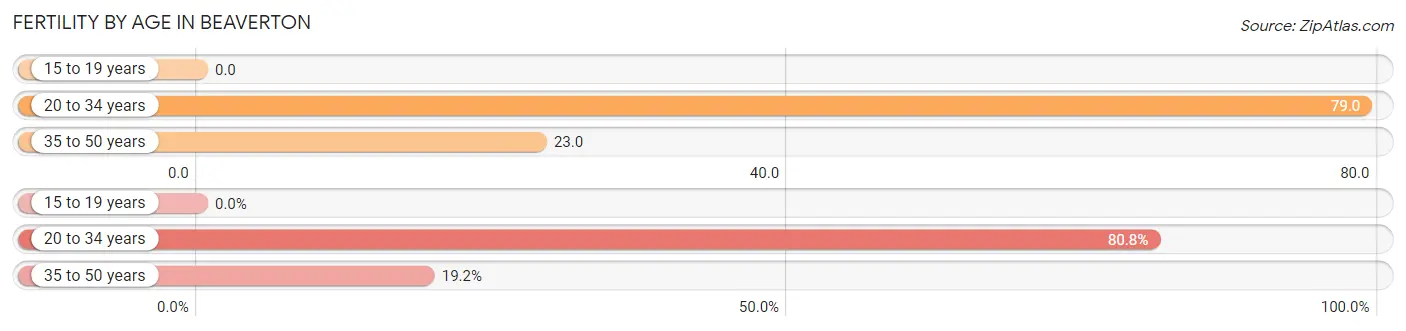
| Age Bracket | Women with Births | Births / 1,000 Women |
| 15 to 19 years | 0 (0.0%) | 0.0 |
| 20 to 34 years | 957 (80.8%) | 79.0 |
| 35 to 50 years | 228 (19.2%) | 23.0 |
| Total | 1,185 (100.0%) | 49.0 |
Fertility by Age by Marriage Status in Beaverton
69.0% of women with births (1,185) in Beaverton are married. The highest percentage of unmarried women with births falls into 20 to 34 years age bracket with 34.5% of them unmarried at the time of birth, while the lowest percentage of unmarried women with births belong to 35 to 50 years age bracket with 16.2% of them unmarried.
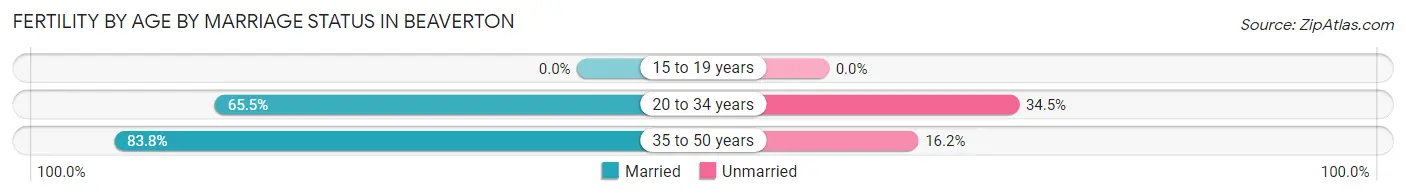
| Age Bracket | Married | Unmarried |
| 15 to 19 years | 0 (0.0%) | 0 (0.0%) |
| 20 to 34 years | 627 (65.5%) | 330 (34.5%) |
| 35 to 50 years | 191 (83.8%) | 37 (16.2%) |
| Total | 818 (69.0%) | 367 (31.0%) |
Fertility by Education in Beaverton
Average fertility rate in Beaverton is 49.0 births per 1,000 women. Women with the education attainment of high school diploma have the highest fertility rate of 79.0 births per 1,000 women, while women with the education attainment of college or associate's degree have the lowest fertility at 22.0 births per 1,000 women. Women with the education attainment of high school diploma represent 24.5% of all women with births.
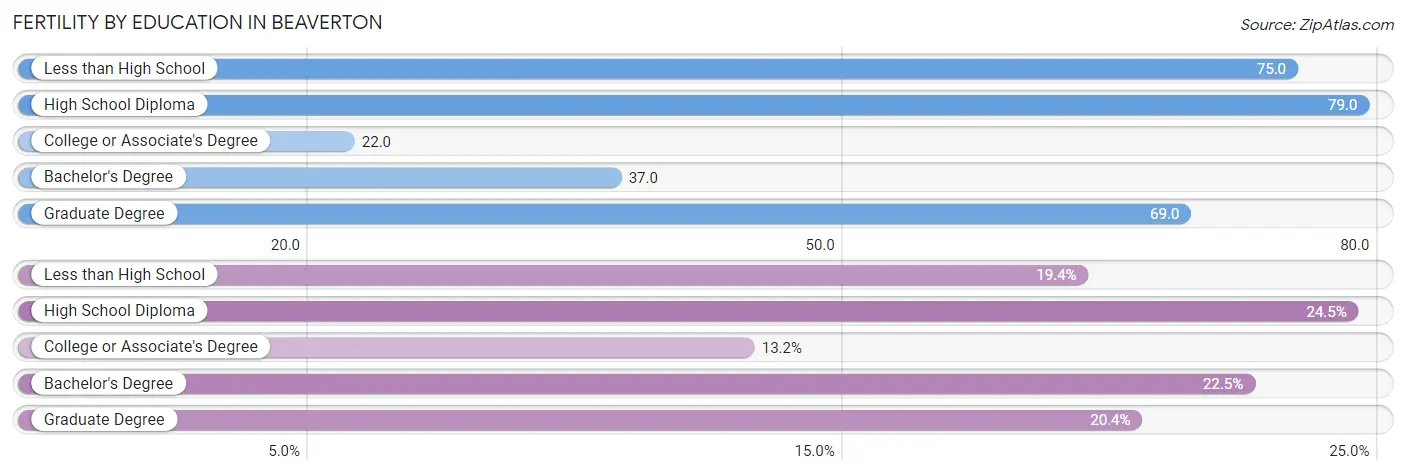
| Educational Attainment | Women with Births | Births / 1,000 Women |
| Less than High School | 230 (19.4%) | 75.0 |
| High School Diploma | 290 (24.5%) | 79.0 |
| College or Associate's Degree | 156 (13.2%) | 22.0 |
| Bachelor's Degree | 267 (22.5%) | 37.0 |
| Graduate Degree | 242 (20.4%) | 69.0 |
| Total | 1,185 (100.0%) | 49.0 |
Fertility by Education by Marriage Status in Beaverton
31.0% of women with births in Beaverton are unmarried. Women with the educational attainment of graduate degree are most likely to be married with 90.1% of them married at childbirth, while women with the educational attainment of less than high school are least likely to be married with 57.0% of them unmarried at childbirth.
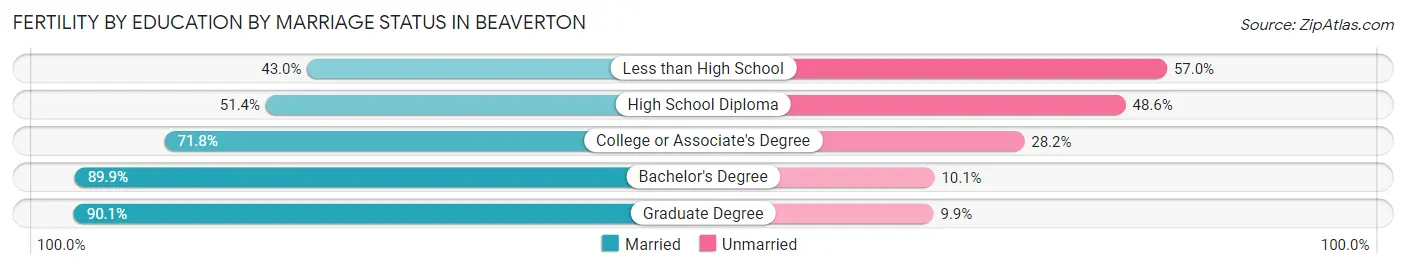
| Educational Attainment | Married | Unmarried |
| Less than High School | 99 (43.0%) | 131 (57.0%) |
| High School Diploma | 149 (51.4%) | 141 (48.6%) |
| College or Associate's Degree | 112 (71.8%) | 44 (28.2%) |
| Bachelor's Degree | 240 (89.9%) | 27 (10.1%) |
| Graduate Degree | 218 (90.1%) | 24 (9.9%) |
| Total | 818 (69.0%) | 367 (31.0%) |
Employment Characteristics in Beaverton
Employment by Class of Employer in Beaverton
Among the 54,155 employed individuals in Beaverton, private company employees (38,478 | 71.1%), not-for-profit organizations (5,545 | 10.2%), and local government employees (2,687 | 5.0%) make up the most common classes of employment.
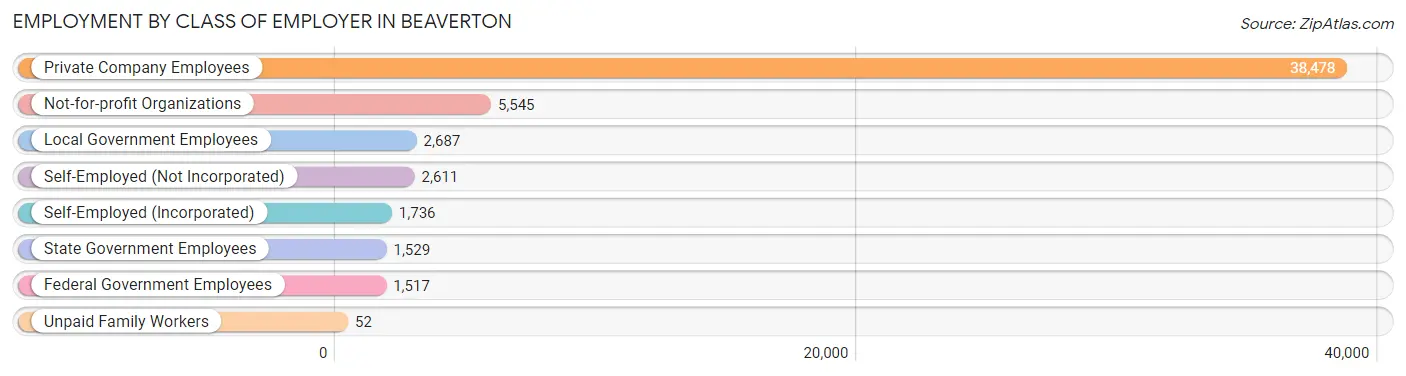
| Employer Class | # Employees | % Employees |
| Private Company Employees | 38,478 | 71.1% |
| Self-Employed (Incorporated) | 1,736 | 3.2% |
| Self-Employed (Not Incorporated) | 2,611 | 4.8% |
| Not-for-profit Organizations | 5,545 | 10.2% |
| Local Government Employees | 2,687 | 5.0% |
| State Government Employees | 1,529 | 2.8% |
| Federal Government Employees | 1,517 | 2.8% |
| Unpaid Family Workers | 52 | 0.1% |
| Total | 54,155 | 100.0% |
Employment Status by Age in Beaverton
According to the labor force statistics for Beaverton, out of the total population over 16 years of age (79,914), 71.4% or 57,059 individuals are in the labor force, with 3.9% or 2,225 of them unemployed. The age group with the highest labor force participation rate is 25 to 29 years, with 90.7% or 8,805 individuals in the labor force. Within the labor force, the 60 to 64 years age range has the highest percentage of unemployed individuals, with 8.3% or 309 of them being unemployed.
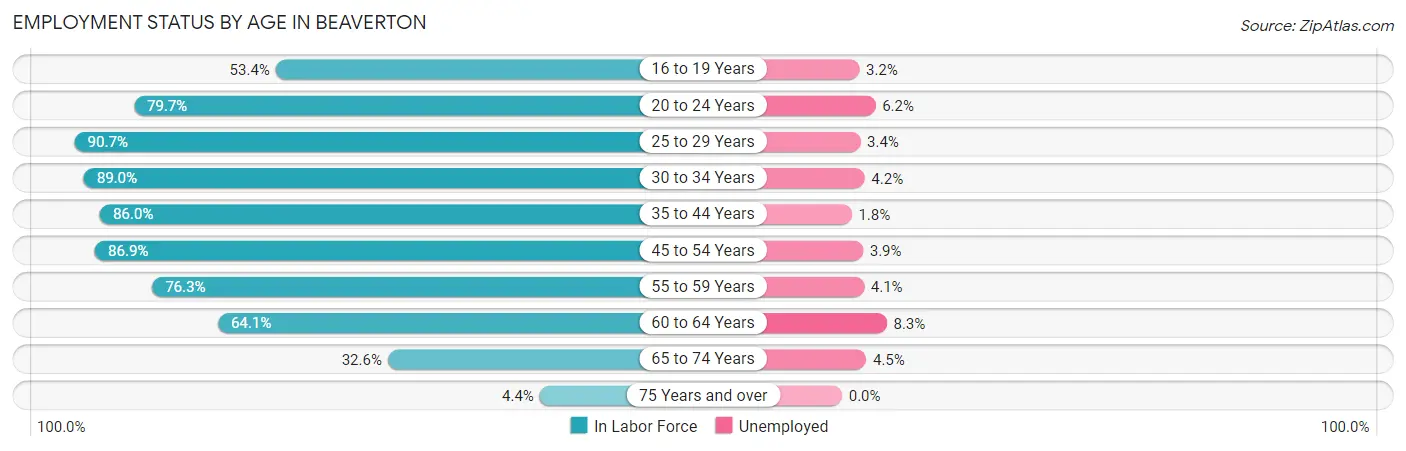
| Age Bracket | In Labor Force | Unemployed |
| 16 to 19 Years | 1,880 (53.4%) | 60 (3.2%) |
| 20 to 24 Years | 4,994 (79.7%) | 310 (6.2%) |
| 25 to 29 Years | 8,805 (90.7%) | 299 (3.4%) |
| 30 to 34 Years | 8,144 (89.0%) | 342 (4.2%) |
| 35 to 44 Years | 12,154 (86.0%) | 219 (1.8%) |
| 45 to 54 Years | 10,182 (86.9%) | 397 (3.9%) |
| 55 to 59 Years | 4,217 (76.3%) | 173 (4.1%) |
| 60 to 64 Years | 3,724 (64.1%) | 309 (8.3%) |
| 65 to 74 Years | 2,694 (32.6%) | 121 (4.5%) |
| 75 Years and over | 256 (4.4%) | 0 (0.0%) |
| Total | 57,059 (71.4%) | 2,225 (3.9%) |
Employment Status by Educational Attainment in Beaverton
According to labor force statistics for Beaverton, 84.3% of individuals (47,247) out of the total population between 25 and 64 years of age (56,046) are in the labor force, with 3.7% or 1,748 of them being unemployed. The group with the highest labor force participation rate are those with the educational attainment of bachelor's degree or higher, with 88.8% or 24,071 individuals in the labor force. Within the labor force, individuals with less than high school education have the highest percentage of unemployment, with 6.4% or 145 of them being unemployed.
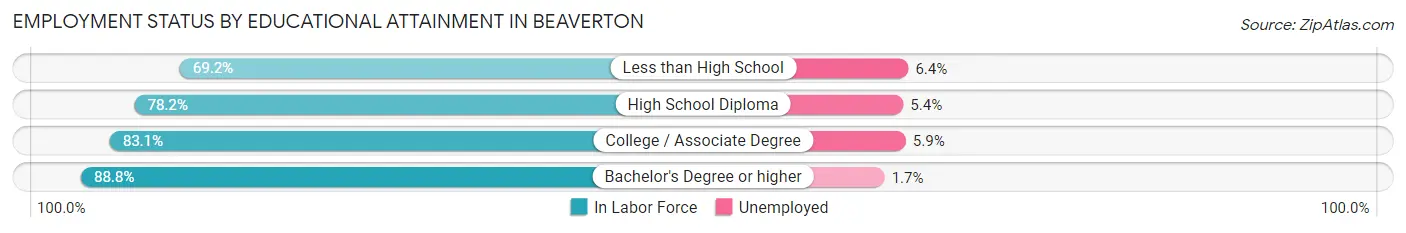
| Educational Attainment | In Labor Force | Unemployed |
| Less than High School | 2,259 (69.2%) | 209 (6.4%) |
| High School Diploma | 6,882 (78.2%) | 475 (5.4%) |
| College / Associate Degree | 14,022 (83.1%) | 996 (5.9%) |
| Bachelor's Degree or higher | 24,071 (88.8%) | 461 (1.7%) |
| Total | 47,247 (84.3%) | 2,074 (3.7%) |
Employment Occupations by Sex in Beaverton
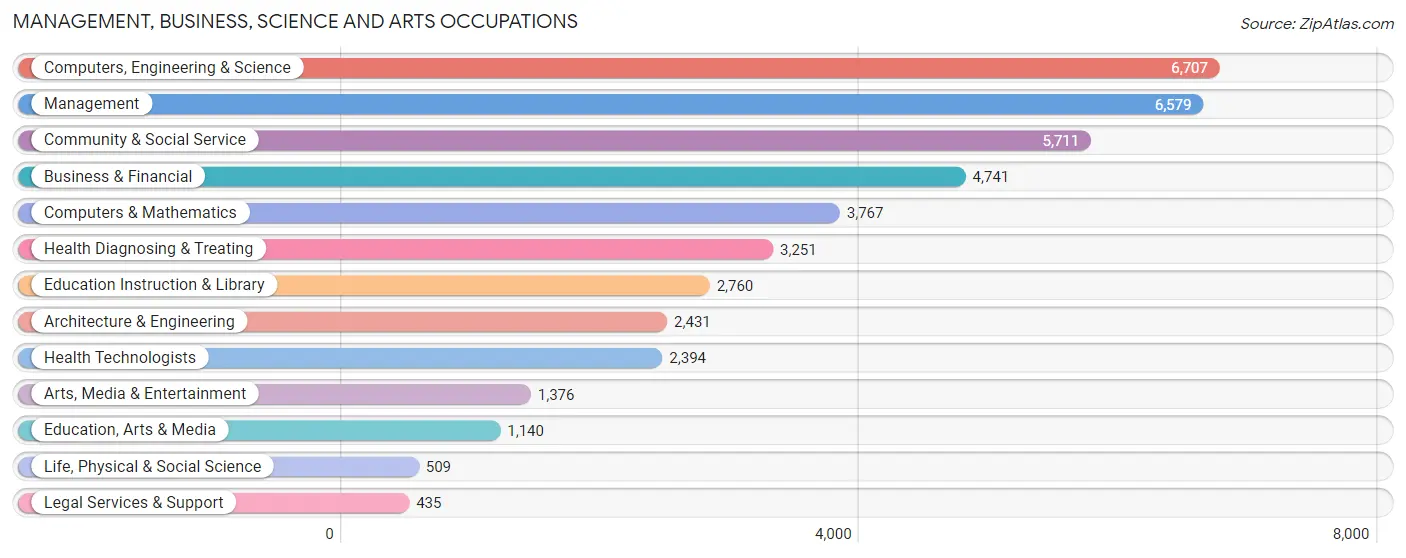
Management, Business, Science and Arts Occupations
The most common Management, Business, Science and Arts occupations in Beaverton are Computers, Engineering & Science (6,707 | 12.3%), Management (6,579 | 12.1%), Community & Social Service (5,711 | 10.5%), Business & Financial (4,741 | 8.7%), and Computers & Mathematics (3,767 | 6.9%).
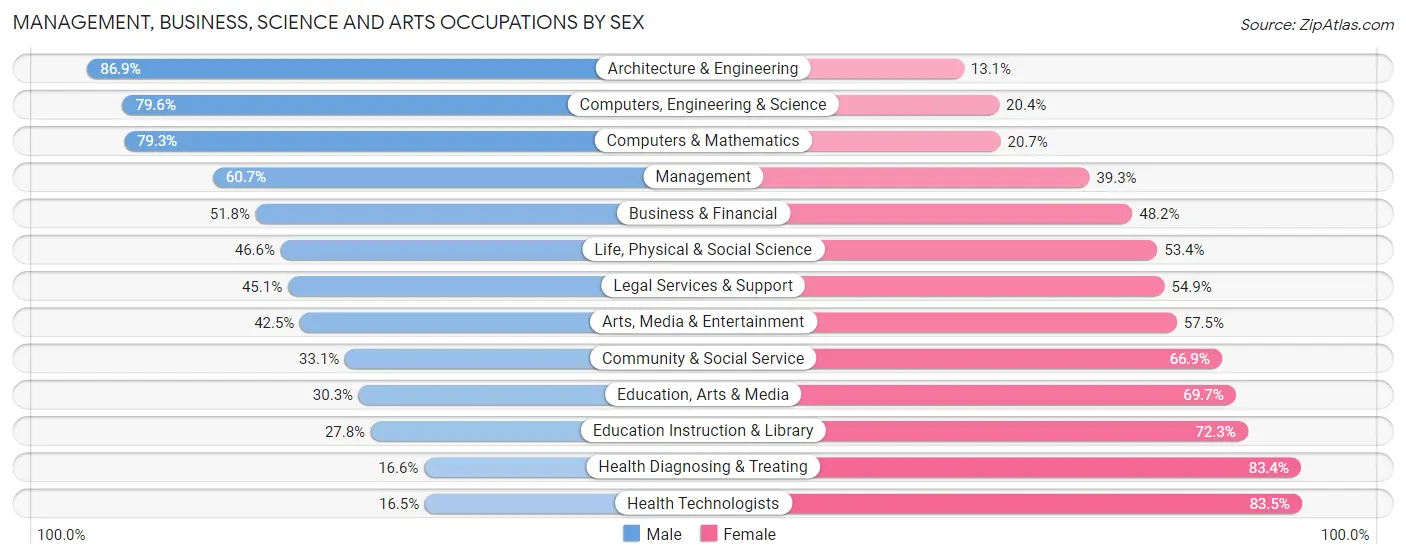
Management, Business, Science and Arts Occupations by Sex
Within the Management, Business, Science and Arts occupations in Beaverton, the most male-oriented occupations are Architecture & Engineering (86.9%), Computers, Engineering & Science (79.6%), and Computers & Mathematics (79.3%), while the most female-oriented occupations are Health Technologists (83.5%), Health Diagnosing & Treating (83.4%), and Education Instruction & Library (72.3%).
| Occupation | Male | Female |
| Management | 3,995 (60.7%) | 2,584 (39.3%) |
| Business & Financial | 2,455 (51.8%) | 2,286 (48.2%) |
| Computers, Engineering & Science | 5,336 (79.6%) | 1,371 (20.4%) |
| Computers & Mathematics | 2,986 (79.3%) | 781 (20.7%) |
| Architecture & Engineering | 2,113 (86.9%) | 318 (13.1%) |
| Life, Physical & Social Science | 237 (46.6%) | 272 (53.4%) |
| Community & Social Service | 1,892 (33.1%) | 3,819 (66.9%) |
| Education, Arts & Media | 345 (30.3%) | 795 (69.7%) |
| Legal Services & Support | 196 (45.1%) | 239 (54.9%) |
| Education Instruction & Library | 766 (27.8%) | 1,994 (72.3%) |
| Arts, Media & Entertainment | 585 (42.5%) | 791 (57.5%) |
| Health Diagnosing & Treating | 541 (16.6%) | 2,710 (83.4%) |
| Health Technologists | 394 (16.5%) | 2,000 (83.5%) |
| Total (Category) | 14,219 (52.7%) | 12,770 (47.3%) |
| Total (Overall) | 28,448 (52.4%) | 25,887 (47.6%) |
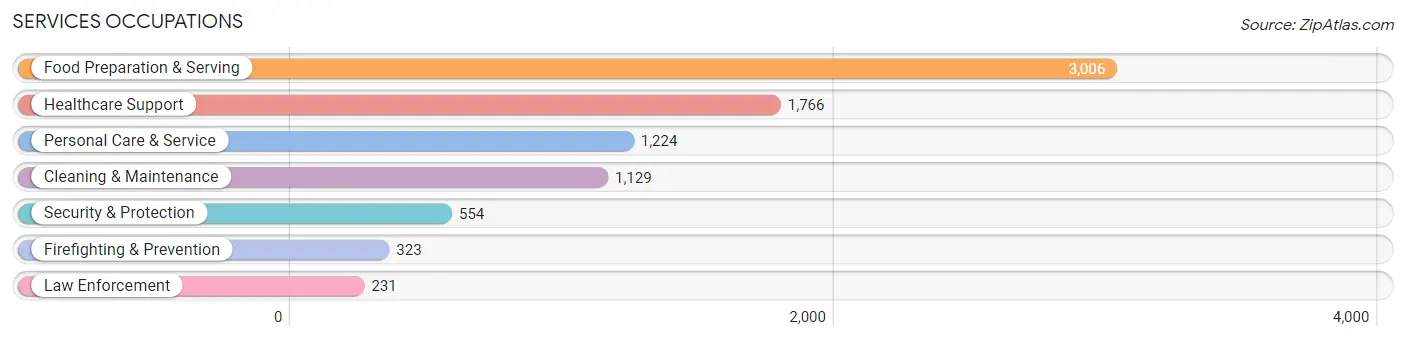
Services Occupations
The most common Services occupations in Beaverton are Food Preparation & Serving (3,006 | 5.5%), Healthcare Support (1,766 | 3.3%), Personal Care & Service (1,224 | 2.2%), Cleaning & Maintenance (1,129 | 2.1%), and Security & Protection (554 | 1.0%).
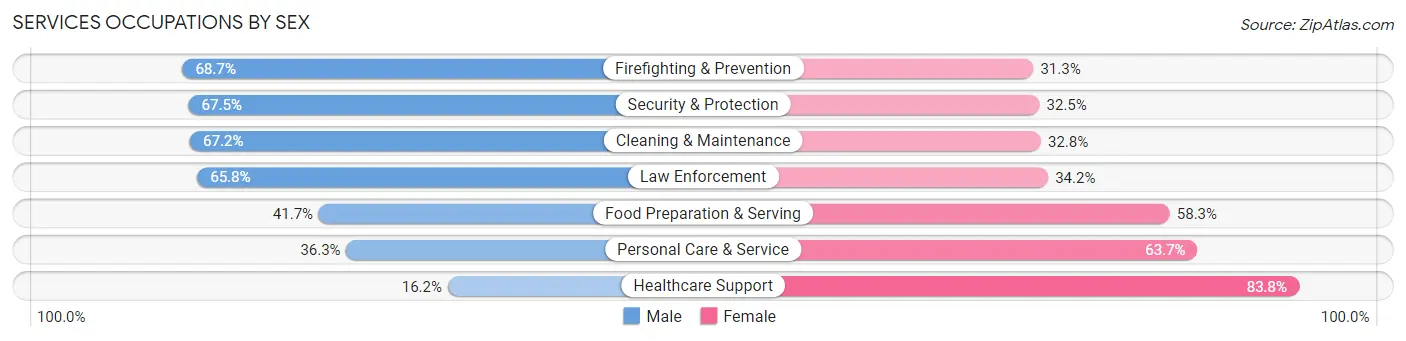
Services Occupations by Sex
Within the Services occupations in Beaverton, the most male-oriented occupations are Firefighting & Prevention (68.7%), Security & Protection (67.5%), and Cleaning & Maintenance (67.2%), while the most female-oriented occupations are Healthcare Support (83.8%), Personal Care & Service (63.7%), and Food Preparation & Serving (58.3%).
| Occupation | Male | Female |
| Healthcare Support | 286 (16.2%) | 1,480 (83.8%) |
| Security & Protection | 374 (67.5%) | 180 (32.5%) |
| Firefighting & Prevention | 222 (68.7%) | 101 (31.3%) |
| Law Enforcement | 152 (65.8%) | 79 (34.2%) |
| Food Preparation & Serving | 1,254 (41.7%) | 1,752 (58.3%) |
| Cleaning & Maintenance | 759 (67.2%) | 370 (32.8%) |
| Personal Care & Service | 444 (36.3%) | 780 (63.7%) |
| Total (Category) | 3,117 (40.6%) | 4,562 (59.4%) |
| Total (Overall) | 28,448 (52.4%) | 25,887 (47.6%) |
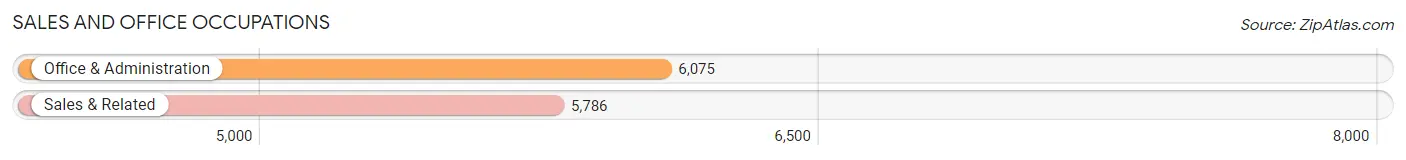
Sales and Office Occupations
The most common Sales and Office occupations in Beaverton are Office & Administration (6,075 | 11.2%), and Sales & Related (5,786 | 10.6%).
Sales and Office Occupations by Sex
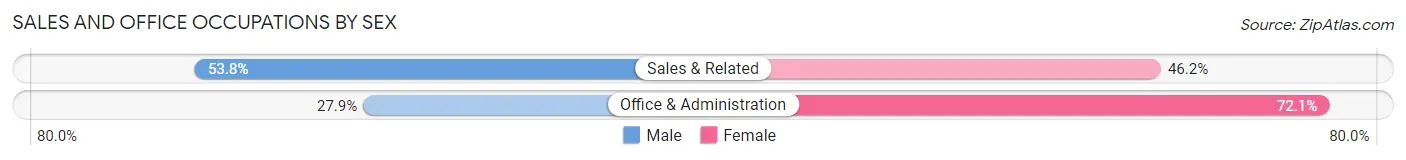
| Occupation | Male | Female |
| Sales & Related | 3,112 (53.8%) | 2,674 (46.2%) |
| Office & Administration | 1,697 (27.9%) | 4,378 (72.1%) |
| Total (Category) | 4,809 (40.5%) | 7,052 (59.5%) |
| Total (Overall) | 28,448 (52.4%) | 25,887 (47.6%) |
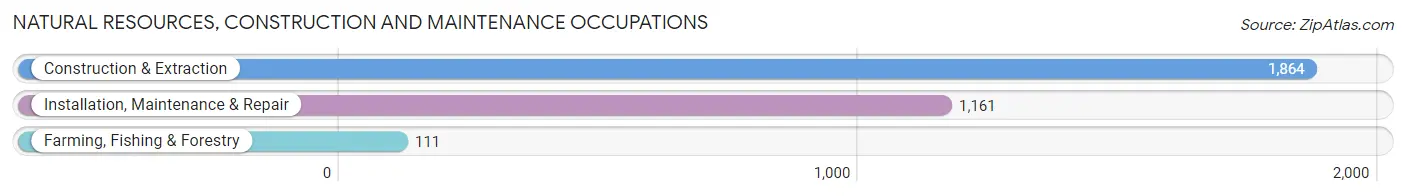
Natural Resources, Construction and Maintenance Occupations
The most common Natural Resources, Construction and Maintenance occupations in Beaverton are Construction & Extraction (1,864 | 3.4%), Installation, Maintenance & Repair (1,161 | 2.1%), and Farming, Fishing & Forestry (111 | 0.2%).
Natural Resources, Construction and Maintenance Occupations by Sex
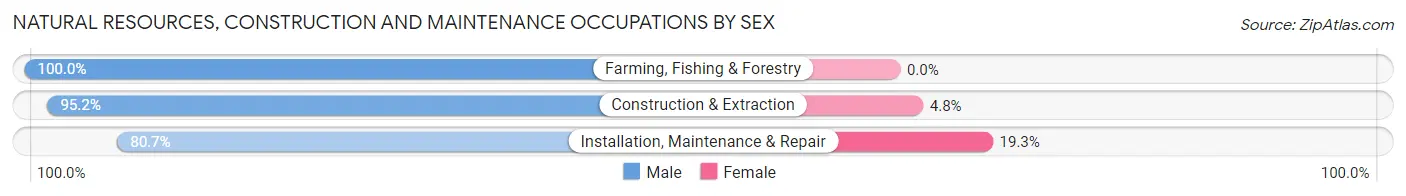
| Occupation | Male | Female |
| Farming, Fishing & Forestry | 111 (100.0%) | 0 (0.0%) |
| Construction & Extraction | 1,775 (95.2%) | 89 (4.8%) |
| Installation, Maintenance & Repair | 937 (80.7%) | 224 (19.3%) |
| Total (Category) | 2,823 (90.0%) | 313 (10.0%) |
| Total (Overall) | 28,448 (52.4%) | 25,887 (47.6%) |
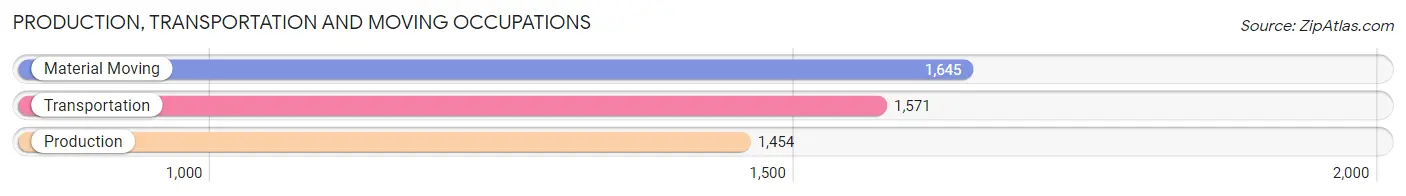
Production, Transportation and Moving Occupations
The most common Production, Transportation and Moving occupations in Beaverton are Material Moving (1,645 | 3.0%), Transportation (1,571 | 2.9%), and Production (1,454 | 2.7%).
Production, Transportation and Moving Occupations by Sex
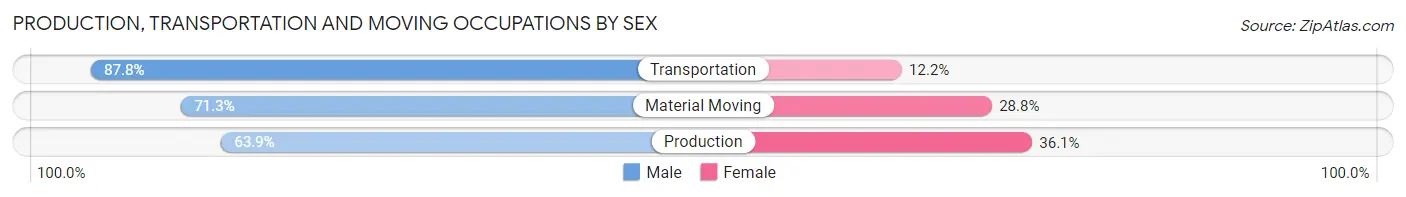
| Occupation | Male | Female |
| Production | 929 (63.9%) | 525 (36.1%) |
| Transportation | 1,379 (87.8%) | 192 (12.2%) |
| Material Moving | 1,172 (71.3%) | 473 (28.7%) |
| Total (Category) | 3,480 (74.5%) | 1,190 (25.5%) |
| Total (Overall) | 28,448 (52.4%) | 25,887 (47.6%) |
Employment Industries by Sex in Beaverton
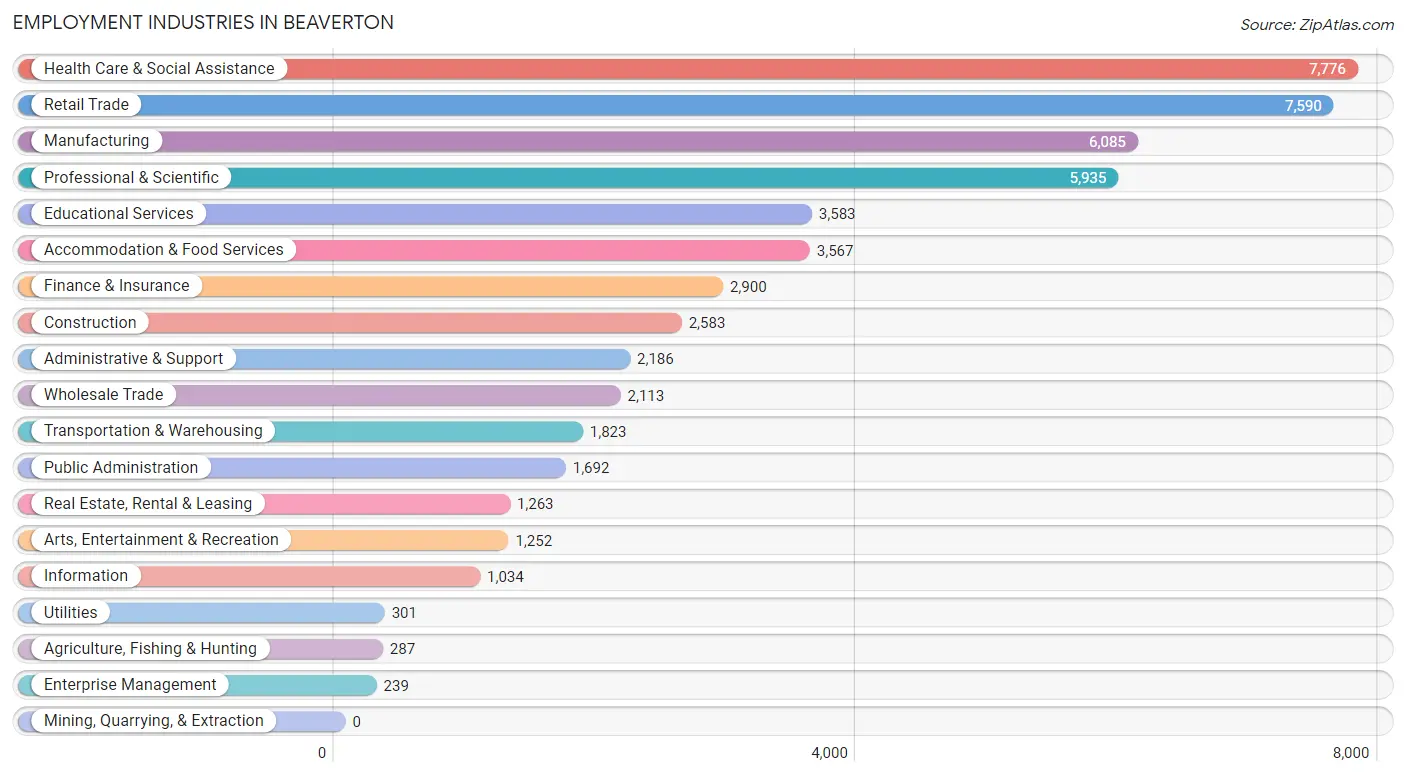
Employment Industries in Beaverton
The major employment industries in Beaverton include Health Care & Social Assistance (7,776 | 14.3%), Retail Trade (7,590 | 14.0%), Manufacturing (6,085 | 11.2%), Professional & Scientific (5,935 | 10.9%), and Educational Services (3,583 | 6.6%).
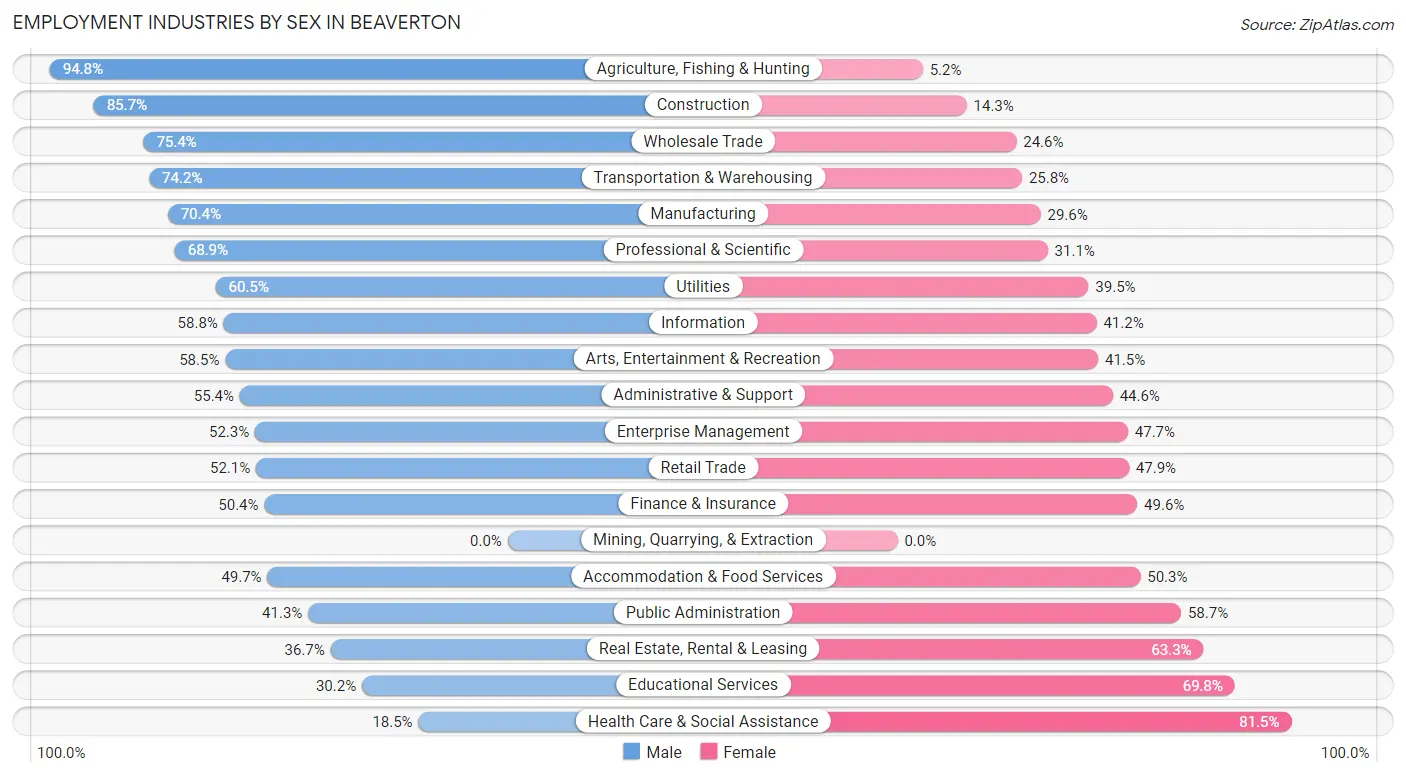
Employment Industries by Sex in Beaverton
The Beaverton industries that see more men than women are Agriculture, Fishing & Hunting (94.8%), Construction (85.7%), and Wholesale Trade (75.4%), whereas the industries that tend to have a higher number of women are Health Care & Social Assistance (81.5%), Educational Services (69.8%), and Real Estate, Rental & Leasing (63.3%).
| Industry | Male | Female |
| Agriculture, Fishing & Hunting | 272 (94.8%) | 15 (5.2%) |
| Mining, Quarrying, & Extraction | 0 (0.0%) | 0 (0.0%) |
| Construction | 2,213 (85.7%) | 370 (14.3%) |
| Manufacturing | 4,282 (70.4%) | 1,803 (29.6%) |
| Wholesale Trade | 1,593 (75.4%) | 520 (24.6%) |
| Retail Trade | 3,954 (52.1%) | 3,636 (47.9%) |
| Transportation & Warehousing | 1,353 (74.2%) | 470 (25.8%) |
| Utilities | 182 (60.5%) | 119 (39.5%) |
| Information | 608 (58.8%) | 426 (41.2%) |
| Finance & Insurance | 1,461 (50.4%) | 1,439 (49.6%) |
| Real Estate, Rental & Leasing | 463 (36.7%) | 800 (63.3%) |
| Professional & Scientific | 4,089 (68.9%) | 1,846 (31.1%) |
| Enterprise Management | 125 (52.3%) | 114 (47.7%) |
| Administrative & Support | 1,212 (55.4%) | 974 (44.6%) |
| Educational Services | 1,081 (30.2%) | 2,502 (69.8%) |
| Health Care & Social Assistance | 1,437 (18.5%) | 6,339 (81.5%) |
| Arts, Entertainment & Recreation | 732 (58.5%) | 520 (41.5%) |
| Accommodation & Food Services | 1,774 (49.7%) | 1,793 (50.3%) |
| Public Administration | 699 (41.3%) | 993 (58.7%) |
| Total | 28,448 (52.4%) | 25,887 (47.6%) |
Education in Beaverton
School Enrollment in Beaverton
The most common levels of schooling among the 21,725 students in Beaverton are college / undergraduate (5,021 | 23.1%), elementary school (4,879 | 22.5%), and middle school (4,325 | 19.9%).
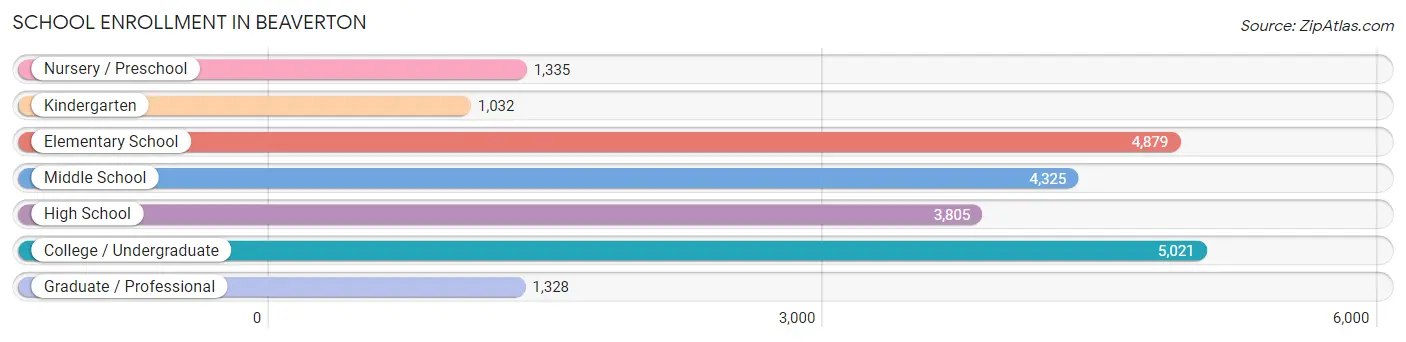
| School Level | # Students | % Students |
| Nursery / Preschool | 1,335 | 6.1% |
| Kindergarten | 1,032 | 4.8% |
| Elementary School | 4,879 | 22.5% |
| Middle School | 4,325 | 19.9% |
| High School | 3,805 | 17.5% |
| College / Undergraduate | 5,021 | 23.1% |
| Graduate / Professional | 1,328 | 6.1% |
| Total | 21,725 | 100.0% |
School Enrollment by Age by Funding Source in Beaverton
Out of a total of 21,725 students who are enrolled in schools in Beaverton, 3,997 (18.4%) attend a private institution, while the remaining 17,728 (81.6%) are enrolled in public schools. The age group of 3 to 4 year olds has the highest likelihood of being enrolled in private schools, with 576 (64.8% in the age bracket) enrolled. Conversely, the age group of 18 to 19 year olds has the lowest likelihood of being enrolled in a private school, with 984 (95.4% in the age bracket) attending a public institution.
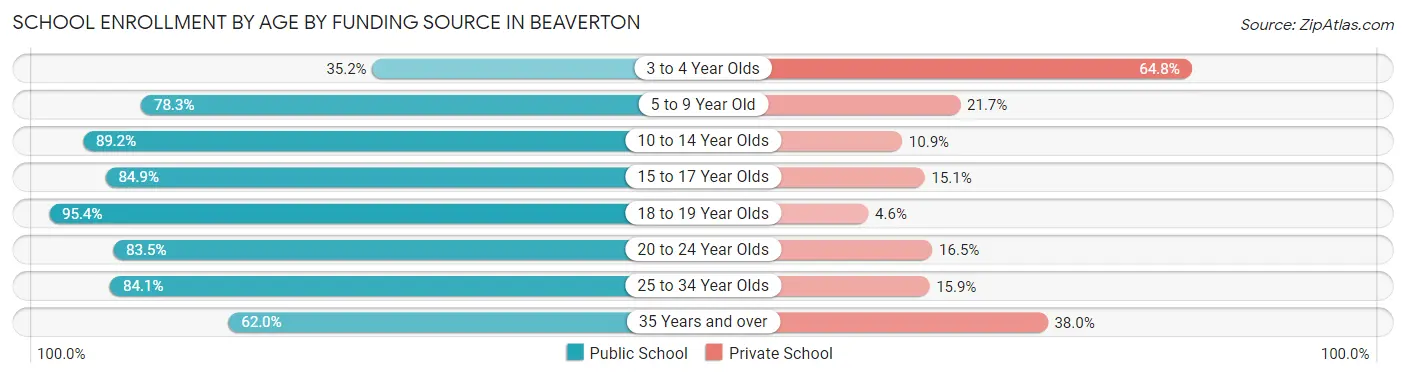
| Age Bracket | Public School | Private School |
| 3 to 4 Year Olds | 313 (35.2%) | 576 (64.8%) |
| 5 to 9 Year Old | 4,220 (78.3%) | 1,169 (21.7%) |
| 10 to 14 Year Olds | 5,004 (89.1%) | 609 (10.8%) |
| 15 to 17 Year Olds | 2,552 (84.9%) | 453 (15.1%) |
| 18 to 19 Year Olds | 984 (95.4%) | 47 (4.6%) |
| 20 to 24 Year Olds | 1,931 (83.5%) | 381 (16.5%) |
| 25 to 34 Year Olds | 2,138 (84.1%) | 405 (15.9%) |
| 35 Years and over | 585 (62.0%) | 358 (38.0%) |
| Total | 17,728 (81.6%) | 3,997 (18.4%) |
Educational Attainment by Field of Study in Beaverton
Business (7,289 | 19.8%), engineering (3,853 | 10.4%), social sciences (3,236 | 8.8%), science & technology (3,156 | 8.6%), and education (2,660 | 7.2%) are the most common fields of study among 36,882 individuals in Beaverton who have obtained a bachelor's degree or higher.
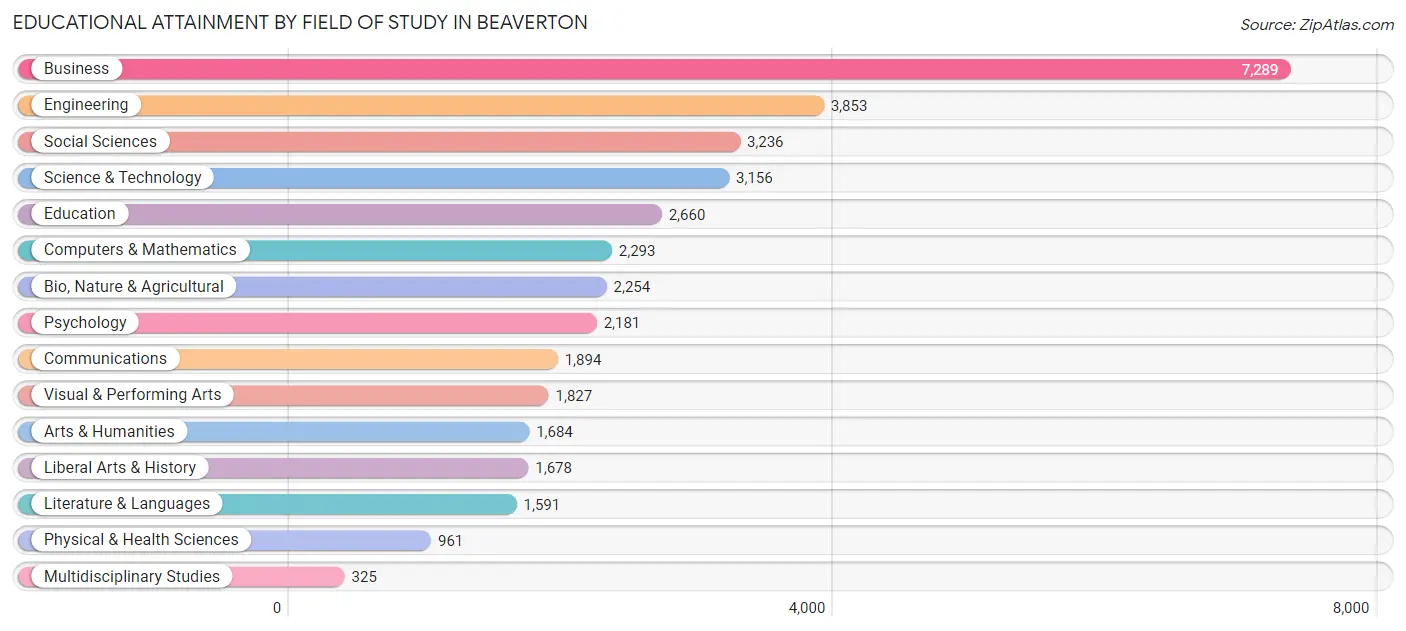
| Field of Study | # Graduates | % Graduates |
| Computers & Mathematics | 2,293 | 6.2% |
| Bio, Nature & Agricultural | 2,254 | 6.1% |
| Physical & Health Sciences | 961 | 2.6% |
| Psychology | 2,181 | 5.9% |
| Social Sciences | 3,236 | 8.8% |
| Engineering | 3,853 | 10.4% |
| Multidisciplinary Studies | 325 | 0.9% |
| Science & Technology | 3,156 | 8.6% |
| Business | 7,289 | 19.8% |
| Education | 2,660 | 7.2% |
| Literature & Languages | 1,591 | 4.3% |
| Liberal Arts & History | 1,678 | 4.5% |
| Visual & Performing Arts | 1,827 | 5.0% |
| Communications | 1,894 | 5.1% |
| Arts & Humanities | 1,684 | 4.6% |
| Total | 36,882 | 100.0% |
Transportation & Commute in Beaverton
Vehicle Availability by Sex in Beaverton
The most prevalent vehicle ownership categories in Beaverton are males with 2 vehicles (13,541, accounting for 47.5%) and females with 2 vehicles (12,182, making up 53.1%).
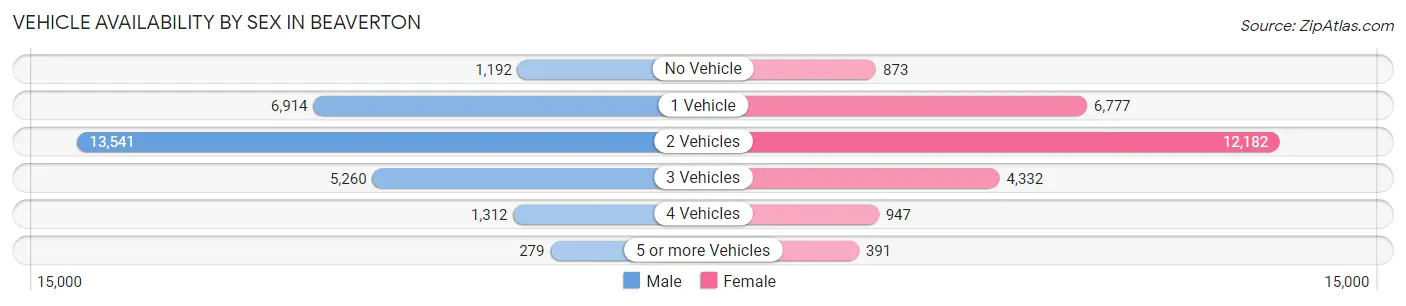
| Vehicles Available | Male | Female |
| No Vehicle | 1,192 (4.2%) | 873 (3.4%) |
| 1 Vehicle | 6,914 (24.3%) | 6,777 (26.6%) |
| 2 Vehicles | 13,541 (47.5%) | 12,182 (47.8%) |
| 3 Vehicles | 5,260 (18.5%) | 4,332 (17.0%) |
| 4 Vehicles | 1,312 (4.6%) | 947 (3.7%) |
| 5 or more Vehicles | 279 (1.0%) | 391 (1.5%) |
| Total | 28,498 (100.0%) | 25,502 (100.0%) |
Commute Time in Beaverton
The most frequently occuring commute durations in Beaverton are 20 to 24 minutes (7,483 commuters, 16.8%), 15 to 19 minutes (7,292 commuters, 16.4%), and 10 to 14 minutes (6,289 commuters, 14.1%).
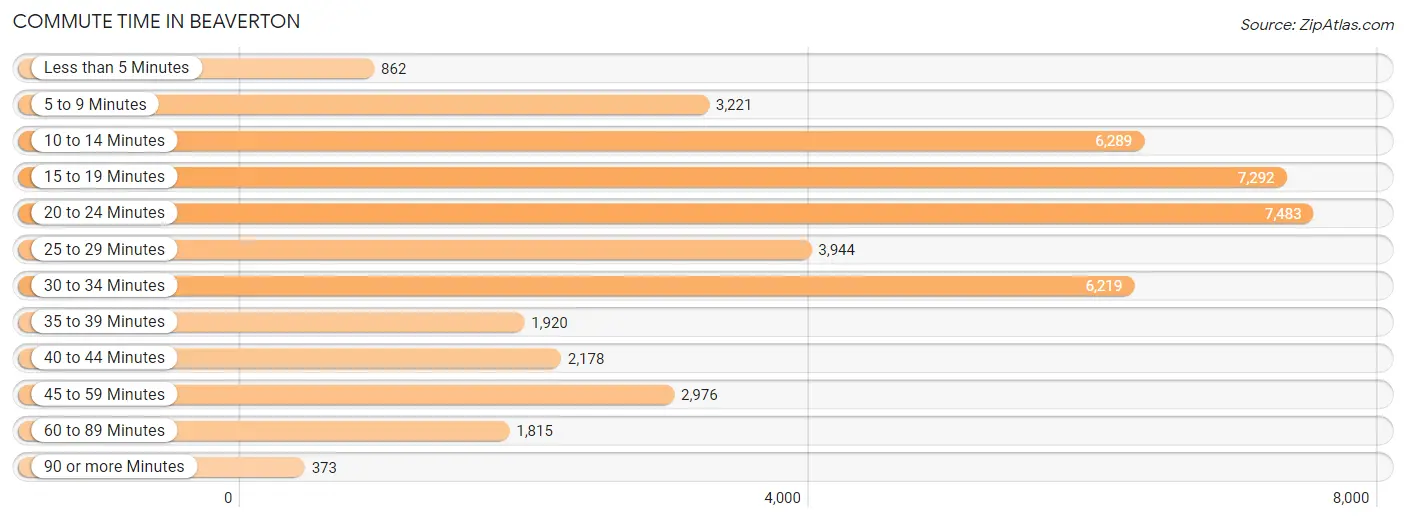
| Commute Time | # Commuters | % Commuters |
| Less than 5 Minutes | 862 | 1.9% |
| 5 to 9 Minutes | 3,221 | 7.2% |
| 10 to 14 Minutes | 6,289 | 14.1% |
| 15 to 19 Minutes | 7,292 | 16.4% |
| 20 to 24 Minutes | 7,483 | 16.8% |
| 25 to 29 Minutes | 3,944 | 8.8% |
| 30 to 34 Minutes | 6,219 | 14.0% |
| 35 to 39 Minutes | 1,920 | 4.3% |
| 40 to 44 Minutes | 2,178 | 4.9% |
| 45 to 59 Minutes | 2,976 | 6.7% |
| 60 to 89 Minutes | 1,815 | 4.1% |
| 90 or more Minutes | 373 | 0.8% |
Commute Time by Sex in Beaverton
The most common commute times in Beaverton are 20 to 24 minutes (3,890 commuters, 16.4%) for males and 15 to 19 minutes (3,775 commuters, 18.1%) for females.
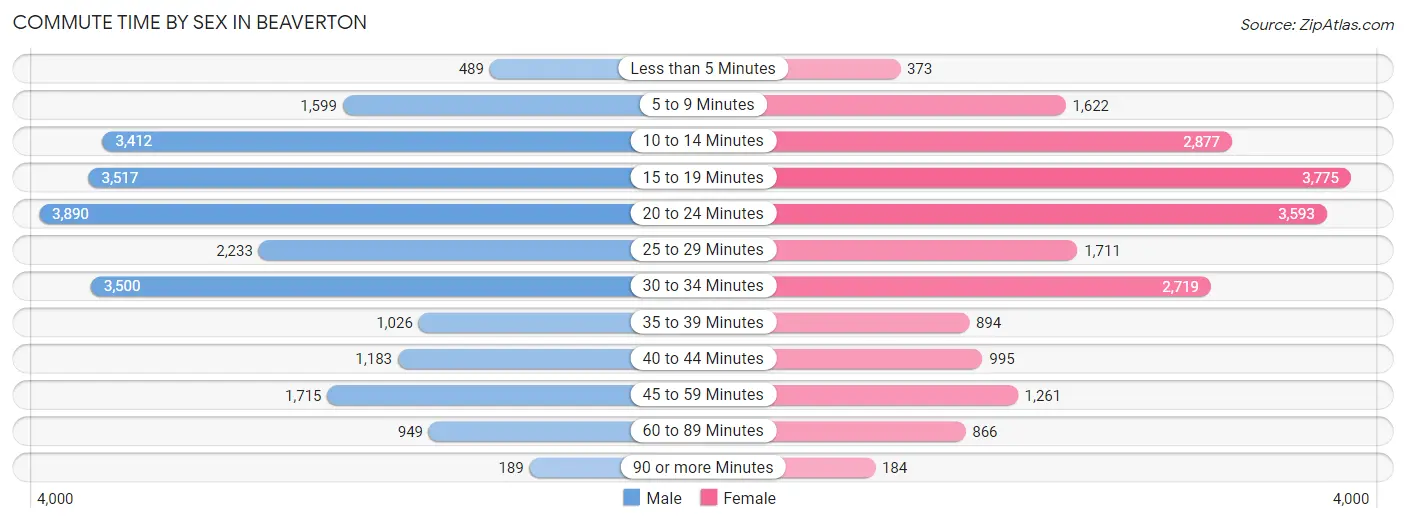
| Commute Time | Male | Female |
| Less than 5 Minutes | 489 (2.1%) | 373 (1.8%) |
| 5 to 9 Minutes | 1,599 (6.8%) | 1,622 (7.8%) |
| 10 to 14 Minutes | 3,412 (14.4%) | 2,877 (13.8%) |
| 15 to 19 Minutes | 3,517 (14.8%) | 3,775 (18.1%) |
| 20 to 24 Minutes | 3,890 (16.4%) | 3,593 (17.2%) |
| 25 to 29 Minutes | 2,233 (9.4%) | 1,711 (8.2%) |
| 30 to 34 Minutes | 3,500 (14.8%) | 2,719 (13.0%) |
| 35 to 39 Minutes | 1,026 (4.3%) | 894 (4.3%) |
| 40 to 44 Minutes | 1,183 (5.0%) | 995 (4.8%) |
| 45 to 59 Minutes | 1,715 (7.2%) | 1,261 (6.0%) |
| 60 to 89 Minutes | 949 (4.0%) | 866 (4.2%) |
| 90 or more Minutes | 189 (0.8%) | 184 (0.9%) |
Time of Departure to Work by Sex in Beaverton
The most frequent times of departure to work in Beaverton are 8:00 AM to 8:29 AM (3,065, 12.9%) for males and 7:30 AM to 7:59 AM (3,044, 14.6%) for females.
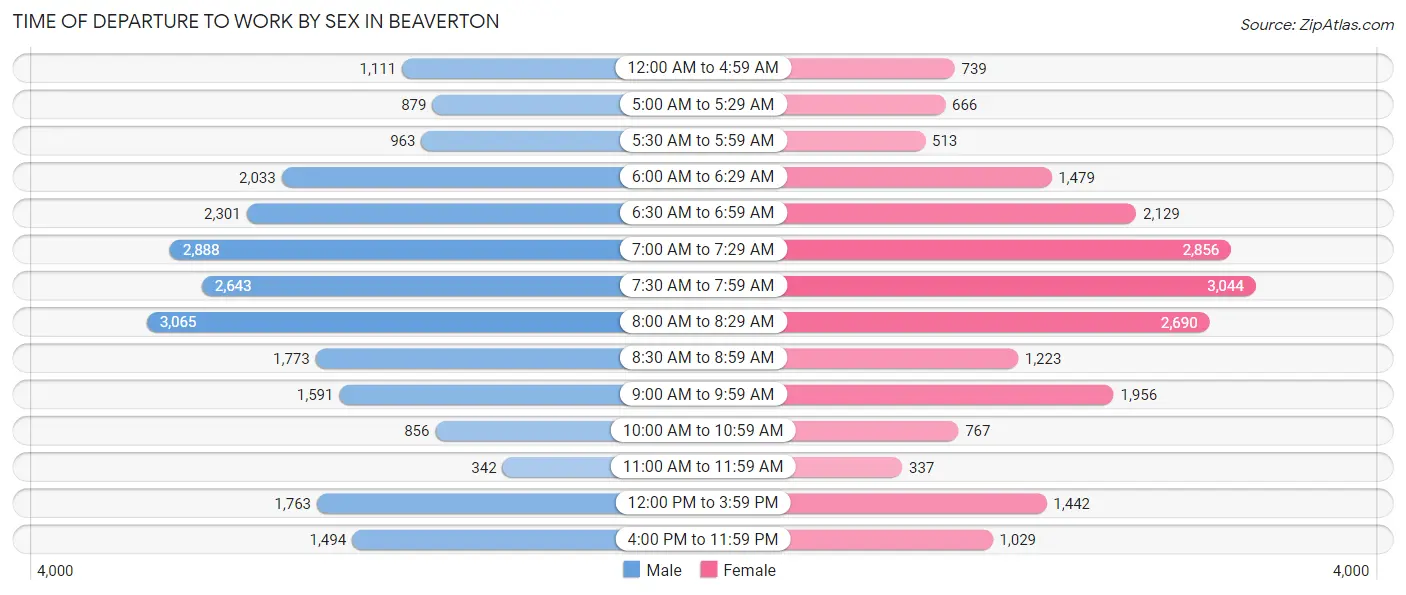
| Time of Departure | Male | Female |
| 12:00 AM to 4:59 AM | 1,111 (4.7%) | 739 (3.5%) |
| 5:00 AM to 5:29 AM | 879 (3.7%) | 666 (3.2%) |
| 5:30 AM to 5:59 AM | 963 (4.1%) | 513 (2.5%) |
| 6:00 AM to 6:29 AM | 2,033 (8.6%) | 1,479 (7.1%) |
| 6:30 AM to 6:59 AM | 2,301 (9.7%) | 2,129 (10.2%) |
| 7:00 AM to 7:29 AM | 2,888 (12.2%) | 2,856 (13.7%) |
| 7:30 AM to 7:59 AM | 2,643 (11.2%) | 3,044 (14.6%) |
| 8:00 AM to 8:29 AM | 3,065 (12.9%) | 2,690 (12.9%) |
| 8:30 AM to 8:59 AM | 1,773 (7.5%) | 1,223 (5.9%) |
| 9:00 AM to 9:59 AM | 1,591 (6.7%) | 1,956 (9.4%) |
| 10:00 AM to 10:59 AM | 856 (3.6%) | 767 (3.7%) |
| 11:00 AM to 11:59 AM | 342 (1.4%) | 337 (1.6%) |
| 12:00 PM to 3:59 PM | 1,763 (7.4%) | 1,442 (6.9%) |
| 4:00 PM to 11:59 PM | 1,494 (6.3%) | 1,029 (4.9%) |
| Total | 23,702 (100.0%) | 20,870 (100.0%) |
Housing Occupancy in Beaverton
Occupancy by Ownership in Beaverton
Of the total 40,812 dwellings in Beaverton, owner-occupied units account for 20,514 (50.3%), while renter-occupied units make up 20,298 (49.7%).
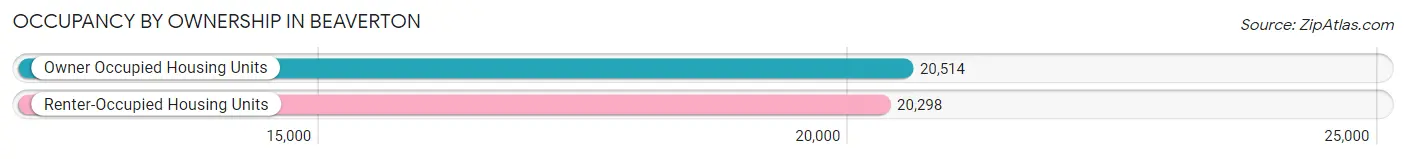
| Occupancy | # Housing Units | % Housing Units |
| Owner Occupied Housing Units | 20,514 | 50.3% |
| Renter-Occupied Housing Units | 20,298 | 49.7% |
| Total Occupied Housing Units | 40,812 | 100.0% |
Occupancy by Household Size in Beaverton
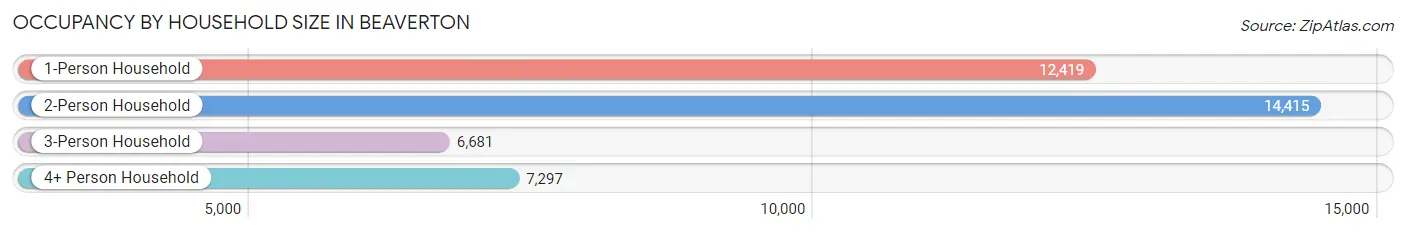
| Household Size | # Housing Units | % Housing Units |
| 1-Person Household | 12,419 | 30.4% |
| 2-Person Household | 14,415 | 35.3% |
| 3-Person Household | 6,681 | 16.4% |
| 4+ Person Household | 7,297 | 17.9% |
| Total Housing Units | 40,812 | 100.0% |
Occupancy by Ownership by Household Size in Beaverton
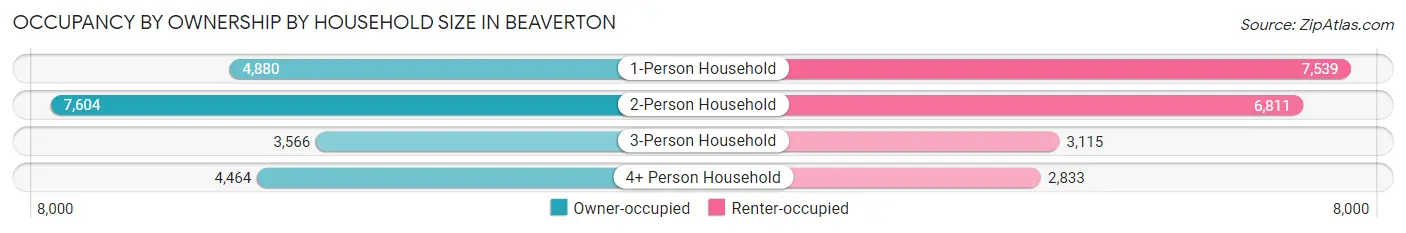
| Household Size | Owner-occupied | Renter-occupied |
| 1-Person Household | 4,880 (39.3%) | 7,539 (60.7%) |
| 2-Person Household | 7,604 (52.7%) | 6,811 (47.2%) |
| 3-Person Household | 3,566 (53.4%) | 3,115 (46.6%) |
| 4+ Person Household | 4,464 (61.2%) | 2,833 (38.8%) |
| Total Housing Units | 20,514 (50.3%) | 20,298 (49.7%) |
Occupancy by Educational Attainment in Beaverton
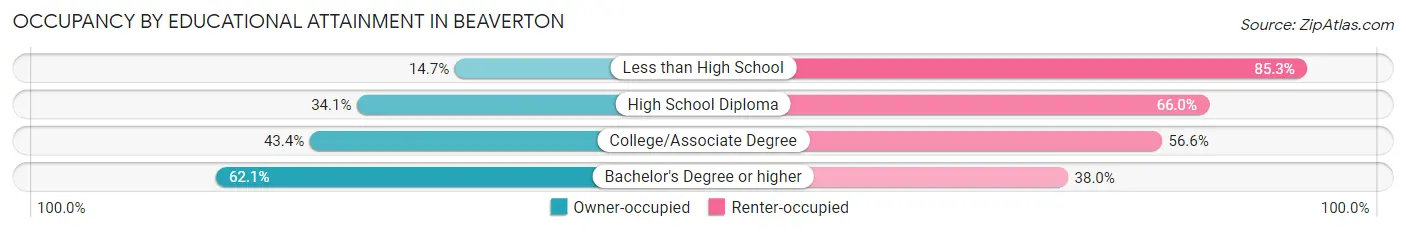
| Household Size | Owner-occupied | Renter-occupied |
| Less than High School | 271 (14.7%) | 1,576 (85.3%) |
| High School Diploma | 1,941 (34.1%) | 3,759 (65.9%) |
| College/Associate Degree | 5,453 (43.4%) | 7,105 (56.6%) |
| Bachelor's Degree or higher | 12,849 (62.1%) | 7,858 (38.0%) |
Occupancy by Age of Householder in Beaverton
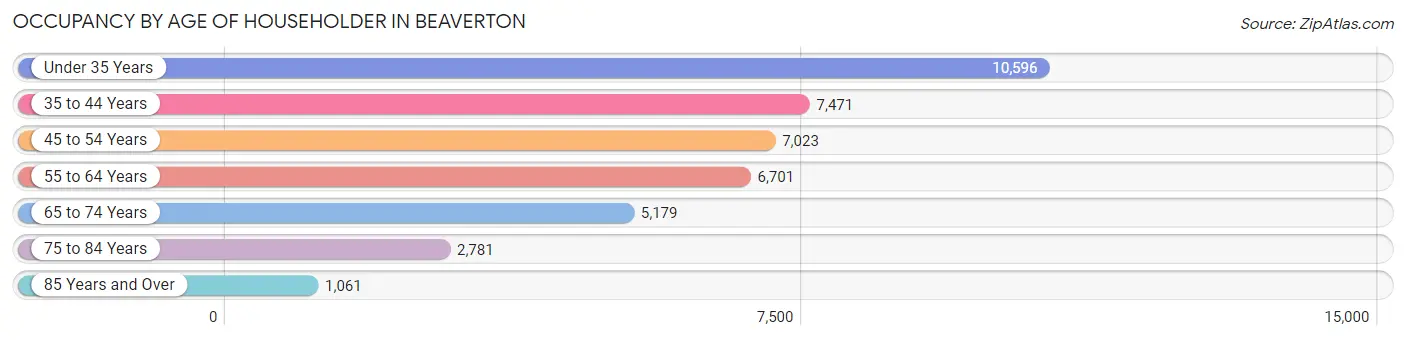
| Age Bracket | # Households | % Households |
| Under 35 Years | 10,596 | 26.0% |
| 35 to 44 Years | 7,471 | 18.3% |
| 45 to 54 Years | 7,023 | 17.2% |
| 55 to 64 Years | 6,701 | 16.4% |
| 65 to 74 Years | 5,179 | 12.7% |
| 75 to 84 Years | 2,781 | 6.8% |
| 85 Years and Over | 1,061 | 2.6% |
| Total | 40,812 | 100.0% |
Housing Finances in Beaverton
Median Income by Occupancy in Beaverton
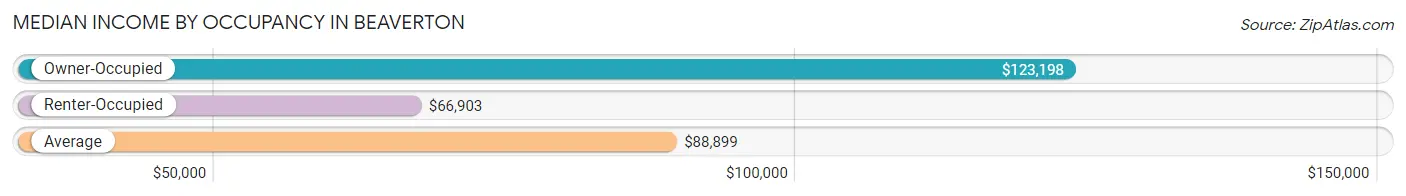
| Occupancy Type | # Households | Median Income |
| Owner-Occupied | 20,514 (50.3%) | $123,198 |
| Renter-Occupied | 20,298 (49.7%) | $66,903 |
| Average | 40,812 (100.0%) | $88,899 |
Occupancy by Householder Income Bracket in Beaverton
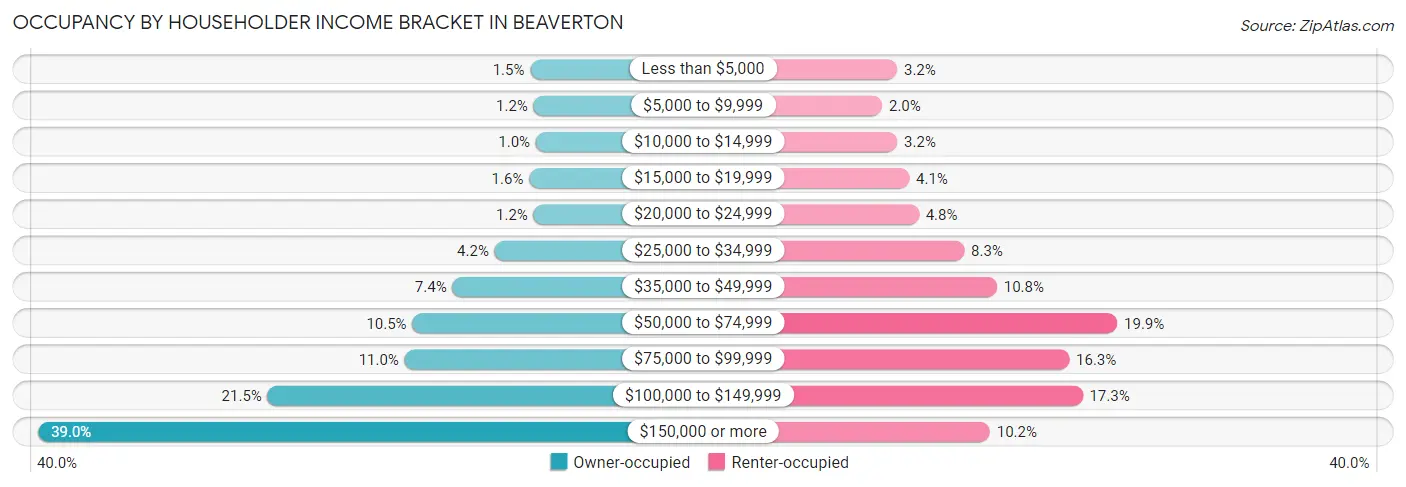
| Income Bracket | Owner-occupied | Renter-occupied |
| Less than $5,000 | 302 (1.5%) | 642 (3.2%) |
| $5,000 to $9,999 | 248 (1.2%) | 411 (2.0%) |
| $10,000 to $14,999 | 213 (1.0%) | 643 (3.2%) |
| $15,000 to $19,999 | 317 (1.5%) | 828 (4.1%) |
| $20,000 to $24,999 | 248 (1.2%) | 977 (4.8%) |
| $25,000 to $34,999 | 857 (4.2%) | 1,678 (8.3%) |
| $35,000 to $49,999 | 1,519 (7.4%) | 2,185 (10.8%) |
| $50,000 to $74,999 | 2,143 (10.4%) | 4,045 (19.9%) |
| $75,000 to $99,999 | 2,264 (11.0%) | 3,303 (16.3%) |
| $100,000 to $149,999 | 4,406 (21.5%) | 3,509 (17.3%) |
| $150,000 or more | 7,997 (39.0%) | 2,077 (10.2%) |
| Total | 20,514 (100.0%) | 20,298 (100.0%) |
Monthly Housing Cost Tiers in Beaverton
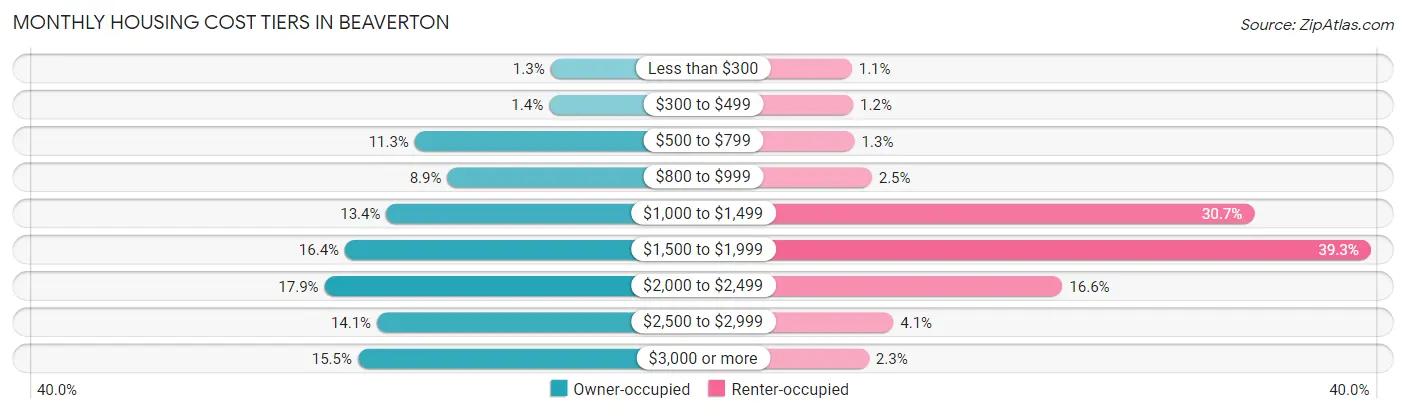
| Monthly Cost | Owner-occupied | Renter-occupied |
| Less than $300 | 261 (1.3%) | 215 (1.1%) |
| $300 to $499 | 284 (1.4%) | 235 (1.2%) |
| $500 to $799 | 2,312 (11.3%) | 257 (1.3%) |
| $800 to $999 | 1,819 (8.9%) | 514 (2.5%) |
| $1,000 to $1,499 | 2,741 (13.4%) | 6,230 (30.7%) |
| $1,500 to $1,999 | 3,367 (16.4%) | 7,971 (39.3%) |
| $2,000 to $2,499 | 3,677 (17.9%) | 3,363 (16.6%) |
| $2,500 to $2,999 | 2,882 (14.1%) | 836 (4.1%) |
| $3,000 or more | 3,171 (15.5%) | 470 (2.3%) |
| Total | 20,514 (100.0%) | 20,298 (100.0%) |
Physical Housing Characteristics in Beaverton
Housing Structures in Beaverton
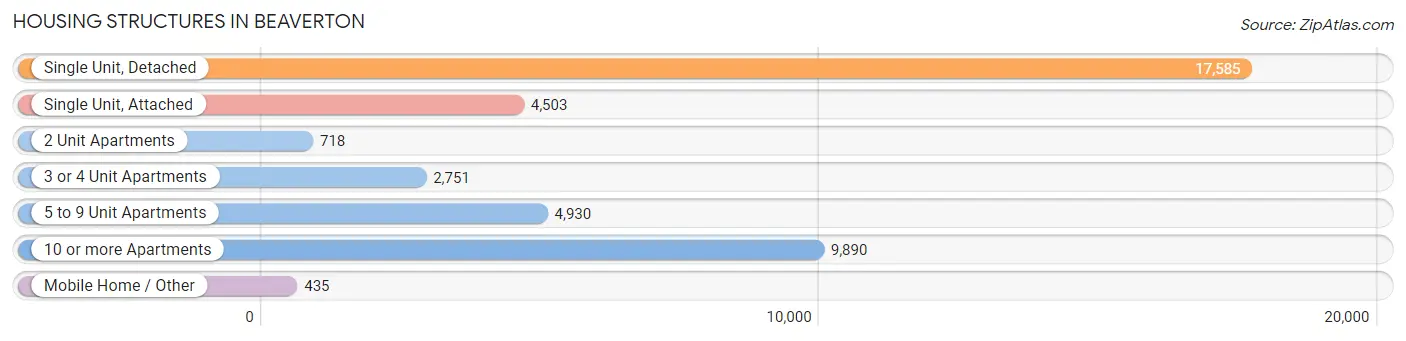
| Structure Type | # Housing Units | % Housing Units |
| Single Unit, Detached | 17,585 | 43.1% |
| Single Unit, Attached | 4,503 | 11.0% |
| 2 Unit Apartments | 718 | 1.8% |
| 3 or 4 Unit Apartments | 2,751 | 6.7% |
| 5 to 9 Unit Apartments | 4,930 | 12.1% |
| 10 or more Apartments | 9,890 | 24.2% |
| Mobile Home / Other | 435 | 1.1% |
| Total | 40,812 | 100.0% |
Housing Structures by Occupancy in Beaverton
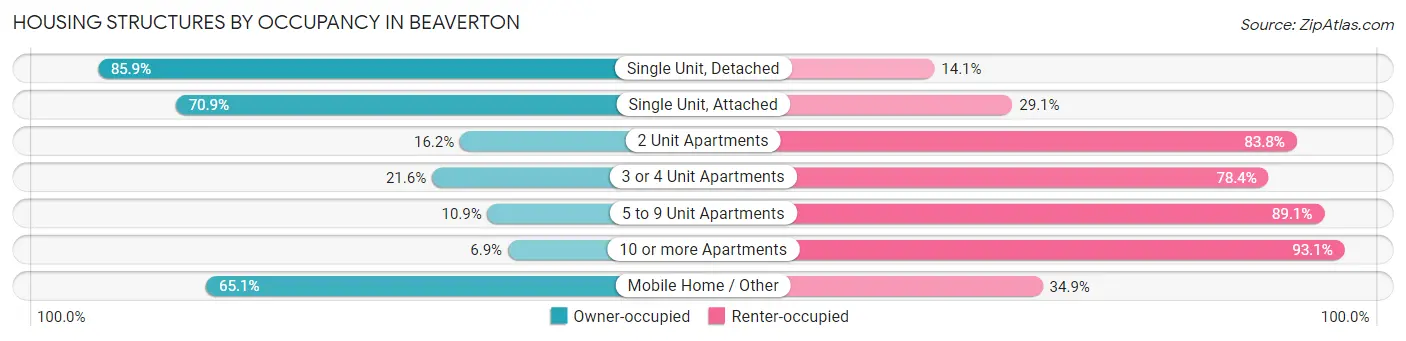
| Structure Type | Owner-occupied | Renter-occupied |
| Single Unit, Detached | 15,108 (85.9%) | 2,477 (14.1%) |
| Single Unit, Attached | 3,192 (70.9%) | 1,311 (29.1%) |
| 2 Unit Apartments | 116 (16.2%) | 602 (83.8%) |
| 3 or 4 Unit Apartments | 593 (21.6%) | 2,158 (78.4%) |
| 5 to 9 Unit Apartments | 536 (10.9%) | 4,394 (89.1%) |
| 10 or more Apartments | 686 (6.9%) | 9,204 (93.1%) |
| Mobile Home / Other | 283 (65.1%) | 152 (34.9%) |
| Total | 20,514 (50.3%) | 20,298 (49.7%) |
Housing Structures by Number of Rooms in Beaverton
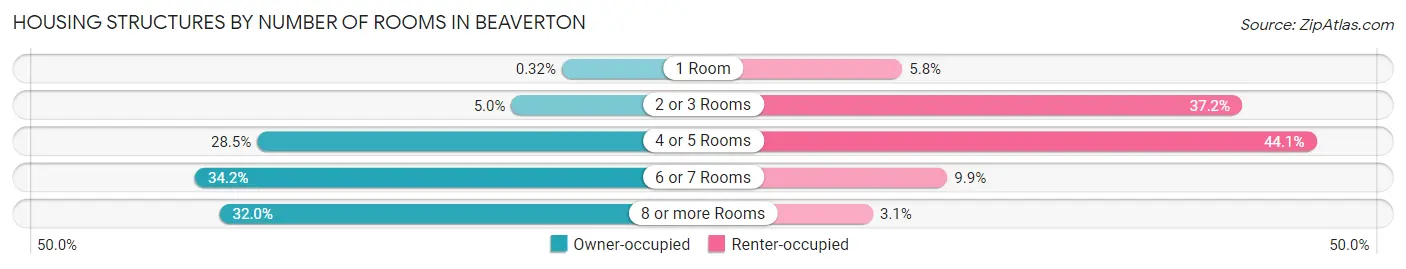
| Number of Rooms | Owner-occupied | Renter-occupied |
| 1 Room | 66 (0.3%) | 1,172 (5.8%) |
| 2 or 3 Rooms | 1,023 (5.0%) | 7,545 (37.2%) |
| 4 or 5 Rooms | 5,847 (28.5%) | 8,941 (44.1%) |
| 6 or 7 Rooms | 7,022 (34.2%) | 2,018 (9.9%) |
| 8 or more Rooms | 6,556 (32.0%) | 622 (3.1%) |
| Total | 20,514 (100.0%) | 20,298 (100.0%) |
Housing Structure by Heating Type in Beaverton
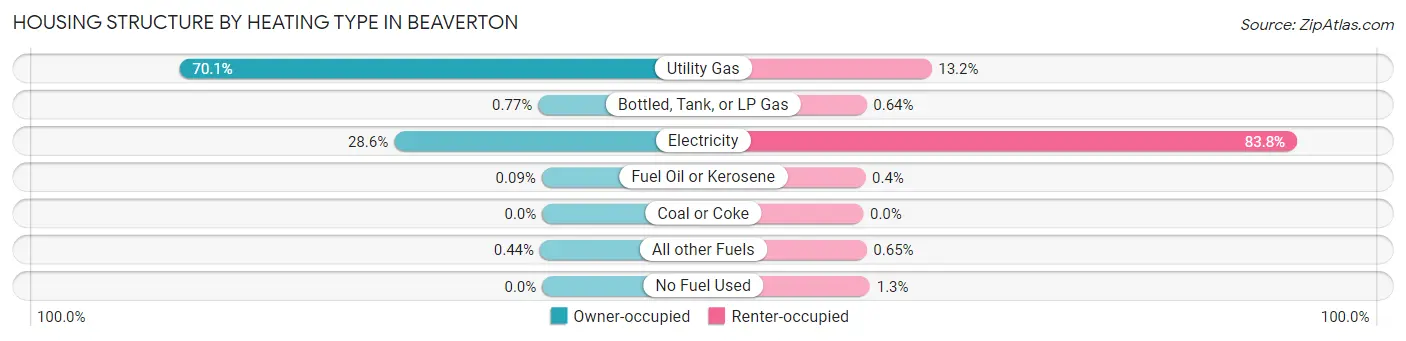
| Heating Type | Owner-occupied | Renter-occupied |
| Utility Gas | 14,376 (70.1%) | 2,677 (13.2%) |
| Bottled, Tank, or LP Gas | 158 (0.8%) | 129 (0.6%) |
| Electricity | 5,871 (28.6%) | 17,016 (83.8%) |
| Fuel Oil or Kerosene | 18 (0.1%) | 82 (0.4%) |
| Coal or Coke | 0 (0.0%) | 0 (0.0%) |
| All other Fuels | 91 (0.4%) | 131 (0.6%) |
| No Fuel Used | 0 (0.0%) | 263 (1.3%) |
| Total | 20,514 (100.0%) | 20,298 (100.0%) |
Household Vehicle Usage in Beaverton
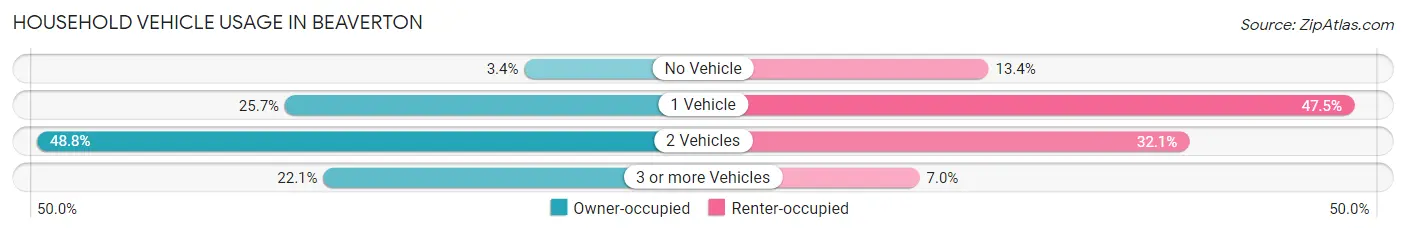
| Vehicles per Household | Owner-occupied | Renter-occupied |
| No Vehicle | 688 (3.4%) | 2,722 (13.4%) |
| 1 Vehicle | 5,273 (25.7%) | 9,642 (47.5%) |
| 2 Vehicles | 10,017 (48.8%) | 6,519 (32.1%) |
| 3 or more Vehicles | 4,536 (22.1%) | 1,415 (7.0%) |
| Total | 20,514 (100.0%) | 20,298 (100.0%) |
Real Estate & Mortgages in Beaverton
Real Estate and Mortgage Overview in Beaverton
| Characteristic | Without Mortgage | With Mortgage |
| Housing Units | 5,436 | 15,078 |
| Median Property Value | $457,100 | $510,600 |
| Median Household Income | $80,306 | $6,711 |
| Monthly Housing Costs | $797 | $3,164 |
| Real Estate Taxes | $5,243 | $61 |
Property Value by Mortgage Status in Beaverton
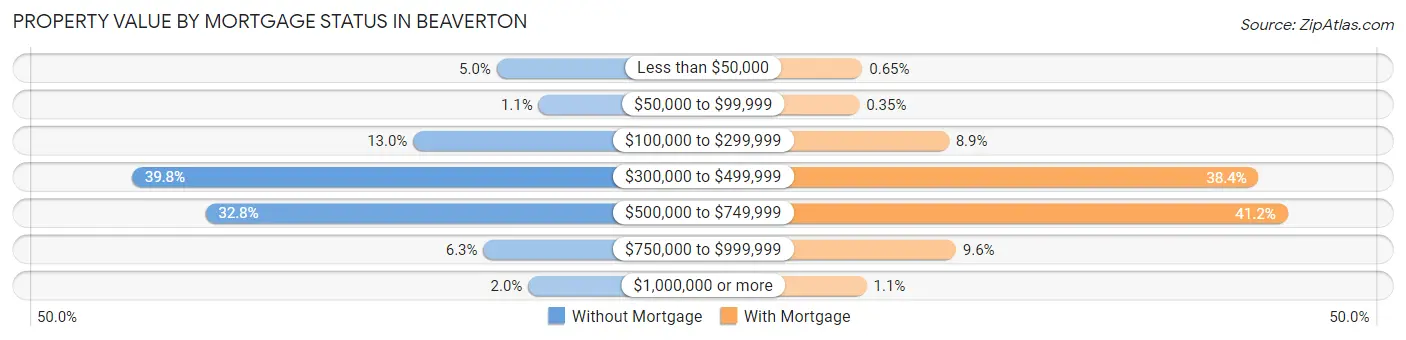
| Property Value | Without Mortgage | With Mortgage |
| Less than $50,000 | 274 (5.0%) | 98 (0.6%) |
| $50,000 to $99,999 | 57 (1.1%) | 53 (0.4%) |
| $100,000 to $299,999 | 706 (13.0%) | 1,337 (8.9%) |
| $300,000 to $499,999 | 2,163 (39.8%) | 5,788 (38.4%) |
| $500,000 to $749,999 | 1,782 (32.8%) | 6,204 (41.1%) |
| $750,000 to $999,999 | 343 (6.3%) | 1,440 (9.6%) |
| $1,000,000 or more | 111 (2.0%) | 158 (1.1%) |
| Total | 5,436 (100.0%) | 15,078 (100.0%) |
Household Income by Mortgage Status in Beaverton
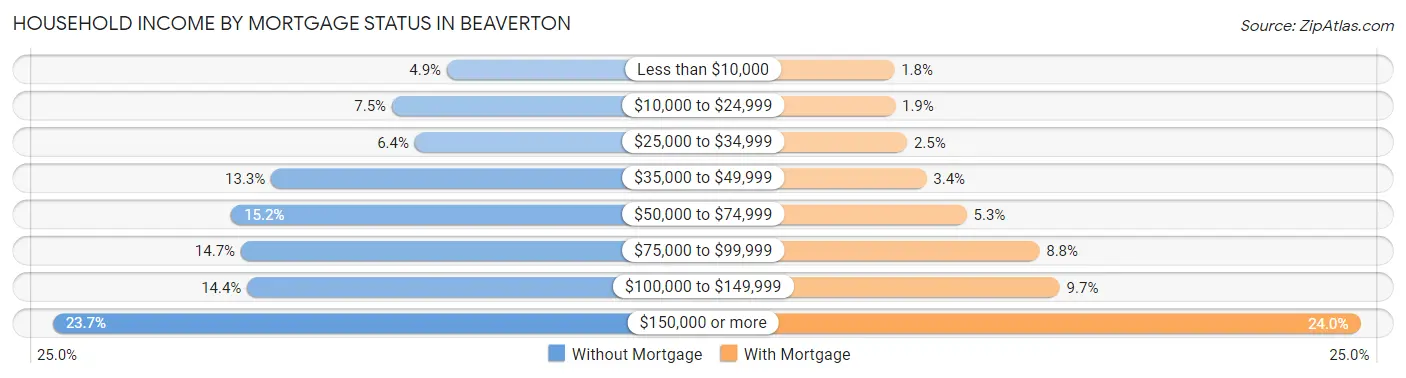
| Household Income | Without Mortgage | With Mortgage |
| Less than $10,000 | 266 (4.9%) | 278 (1.8%) |
| $10,000 to $24,999 | 408 (7.5%) | 284 (1.9%) |
| $25,000 to $34,999 | 349 (6.4%) | 370 (2.5%) |
| $35,000 to $49,999 | 721 (13.3%) | 508 (3.4%) |
| $50,000 to $74,999 | 824 (15.2%) | 798 (5.3%) |
| $75,000 to $99,999 | 799 (14.7%) | 1,319 (8.7%) |
| $100,000 to $149,999 | 783 (14.4%) | 1,465 (9.7%) |
| $150,000 or more | 1,286 (23.7%) | 3,623 (24.0%) |
| Total | 5,436 (100.0%) | 15,078 (100.0%) |
Property Value to Household Income Ratio in Beaverton
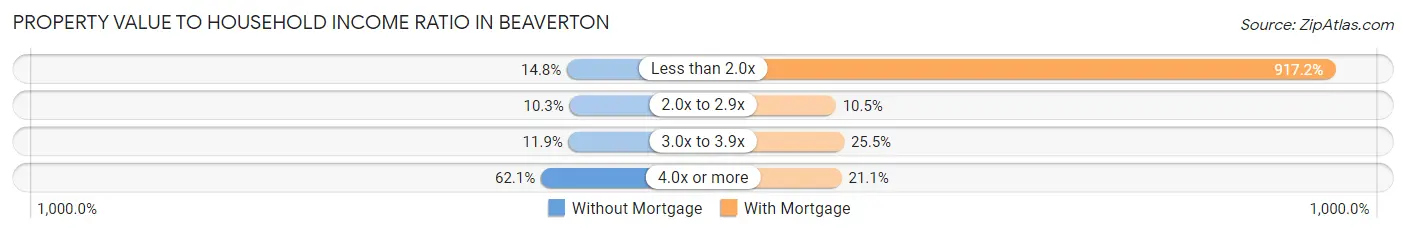
| Value-to-Income Ratio | Without Mortgage | With Mortgage |
| Less than 2.0x | 804 (14.8%) | 138,293 (917.2%) |
| 2.0x to 2.9x | 562 (10.3%) | 1,580 (10.5%) |
| 3.0x to 3.9x | 647 (11.9%) | 3,842 (25.5%) |
| 4.0x or more | 3,378 (62.1%) | 3,177 (21.1%) |
| Total | 5,436 (100.0%) | 15,078 (100.0%) |
Real Estate Taxes by Mortgage Status in Beaverton
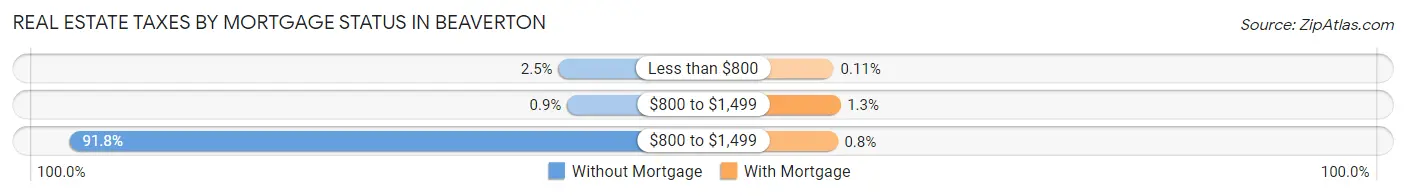
| Property Taxes | Without Mortgage | With Mortgage |
| Less than $800 | 136 (2.5%) | 17 (0.1%) |
| $800 to $1,499 | 49 (0.9%) | 197 (1.3%) |
| $800 to $1,499 | 4,989 (91.8%) | 120 (0.8%) |
| Total | 5,436 (100.0%) | 15,078 (100.0%) |
Health & Disability in Beaverton
Health Insurance Coverage by Age in Beaverton
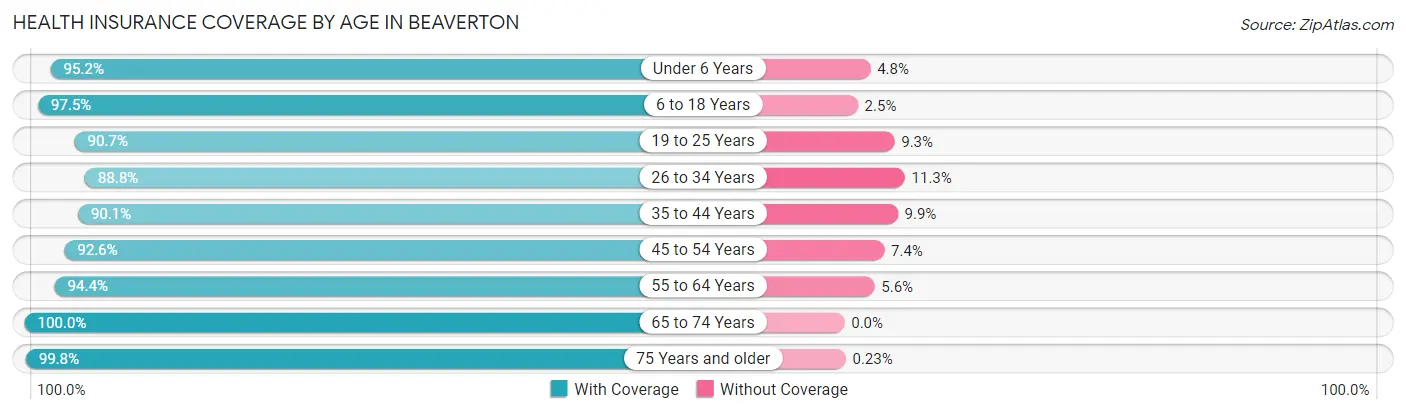
| Age Bracket | With Coverage | Without Coverage |
| Under 6 Years | 5,759 (95.2%) | 292 (4.8%) |
| 6 to 18 Years | 13,728 (97.5%) | 350 (2.5%) |
| 19 to 25 Years | 8,060 (90.7%) | 828 (9.3%) |
| 26 to 34 Years | 14,848 (88.7%) | 1,882 (11.3%) |
| 35 to 44 Years | 12,714 (90.1%) | 1,403 (9.9%) |
| 45 to 54 Years | 10,815 (92.6%) | 867 (7.4%) |
| 55 to 64 Years | 10,689 (94.4%) | 635 (5.6%) |
| 65 to 74 Years | 8,198 (100.0%) | 0 (0.0%) |
| 75 Years and older | 5,533 (99.8%) | 13 (0.2%) |
| Total | 90,344 (93.5%) | 6,270 (6.5%) |
Health Insurance Coverage by Citizenship Status in Beaverton
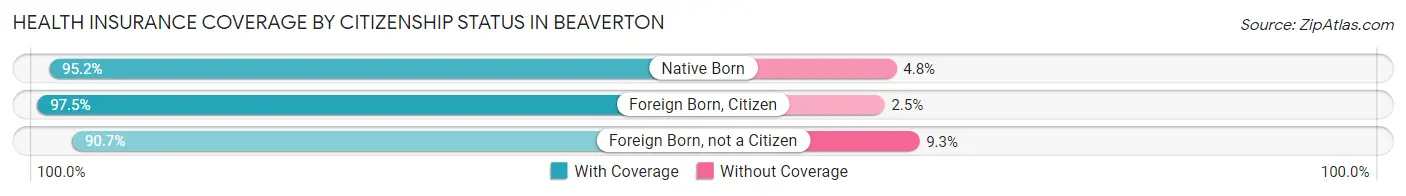
| Citizenship Status | With Coverage | Without Coverage |
| Native Born | 5,759 (95.2%) | 292 (4.8%) |
| Foreign Born, Citizen | 13,728 (97.5%) | 350 (2.5%) |
| Foreign Born, not a Citizen | 8,060 (90.7%) | 828 (9.3%) |
Health Insurance Coverage by Household Income in Beaverton
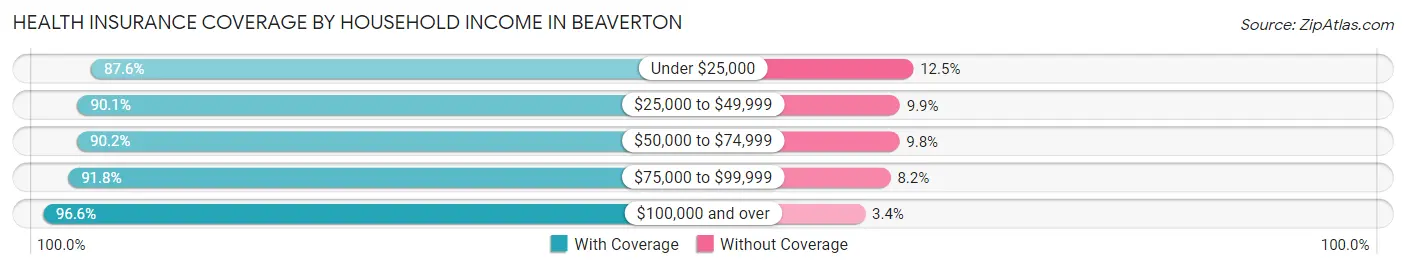
| Household Income | With Coverage | Without Coverage |
| Under $25,000 | 7,344 (87.5%) | 1,044 (12.4%) |
| $25,000 to $49,999 | 10,317 (90.1%) | 1,137 (9.9%) |
| $50,000 to $74,999 | 11,374 (90.2%) | 1,241 (9.8%) |
| $75,000 to $99,999 | 11,569 (91.8%) | 1,031 (8.2%) |
| $100,000 and over | 48,993 (96.6%) | 1,741 (3.4%) |
Public vs Private Health Insurance Coverage by Age in Beaverton
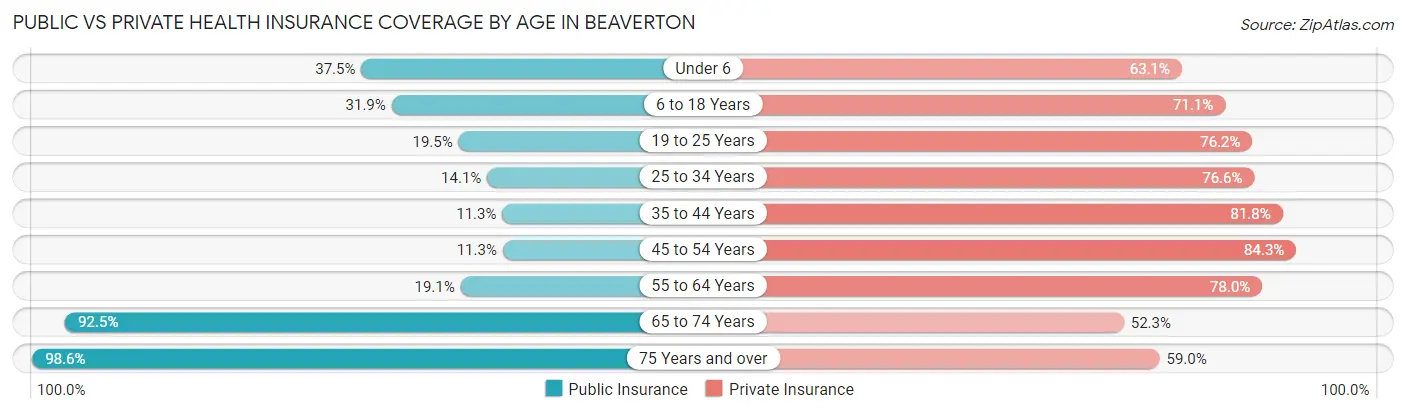
| Age Bracket | Public Insurance | Private Insurance |
| Under 6 | 2,269 (37.5%) | 3,819 (63.1%) |
| 6 to 18 Years | 4,488 (31.9%) | 10,015 (71.1%) |
| 19 to 25 Years | 1,729 (19.5%) | 6,773 (76.2%) |
| 25 to 34 Years | 2,365 (14.1%) | 12,808 (76.6%) |
| 35 to 44 Years | 1,599 (11.3%) | 11,548 (81.8%) |
| 45 to 54 Years | 1,314 (11.3%) | 9,851 (84.3%) |
| 55 to 64 Years | 2,162 (19.1%) | 8,835 (78.0%) |
| 65 to 74 Years | 7,583 (92.5%) | 4,291 (52.3%) |
| 75 Years and over | 5,467 (98.6%) | 3,271 (59.0%) |
| Total | 28,976 (30.0%) | 71,211 (73.7%) |
Disability Status by Sex by Age in Beaverton
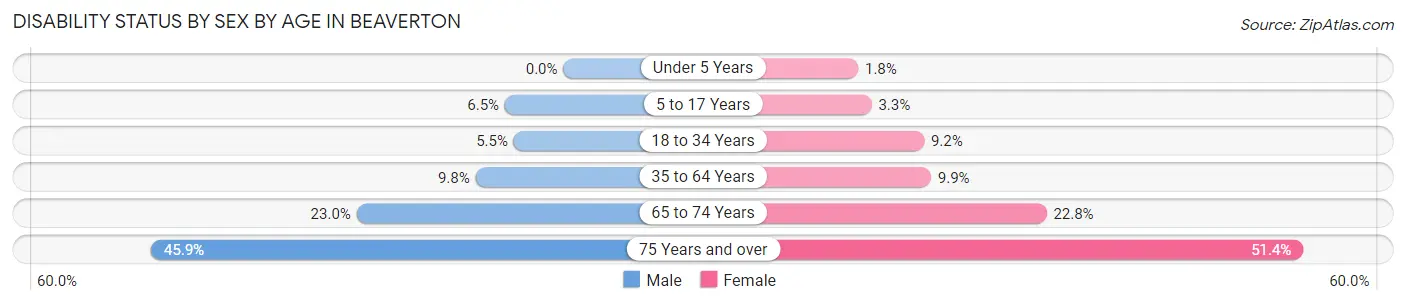
| Age Bracket | Male | Female |
| Under 5 Years | 0 (0.0%) | 45 (1.8%) |
| 5 to 17 Years | 528 (6.5%) | 212 (3.3%) |
| 18 to 34 Years | 749 (5.5%) | 1,163 (9.1%) |
| 35 to 64 Years | 1,843 (9.8%) | 1,813 (9.9%) |
| 65 to 74 Years | 862 (23.0%) | 1,015 (22.8%) |
| 75 Years and over | 898 (45.9%) | 1,845 (51.4%) |
Disability Class by Sex by Age in Beaverton
Disability Class: Hearing Difficulty
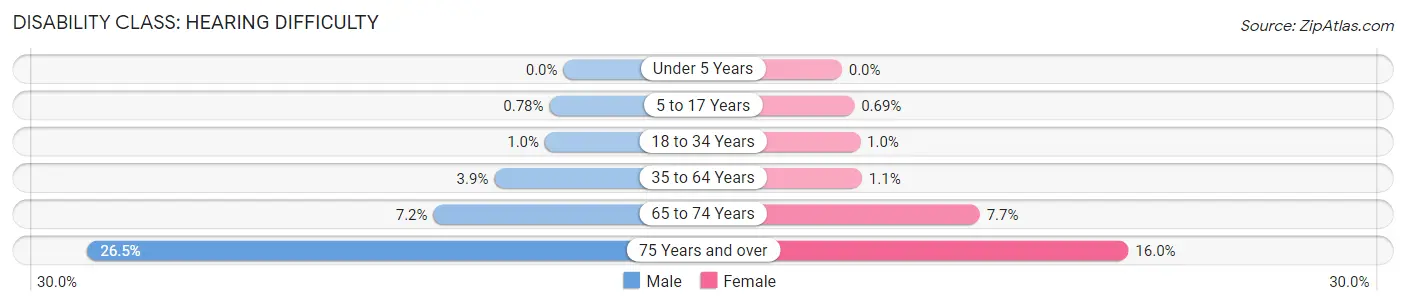
| Age Bracket | Male | Female |
| Under 5 Years | 0 (0.0%) | 0 (0.0%) |
| 5 to 17 Years | 63 (0.8%) | 44 (0.7%) |
| 18 to 34 Years | 140 (1.0%) | 130 (1.0%) |
| 35 to 64 Years | 726 (3.8%) | 204 (1.1%) |
| 65 to 74 Years | 271 (7.2%) | 342 (7.7%) |
| 75 Years and over | 518 (26.5%) | 573 (16.0%) |
Disability Class: Vision Difficulty
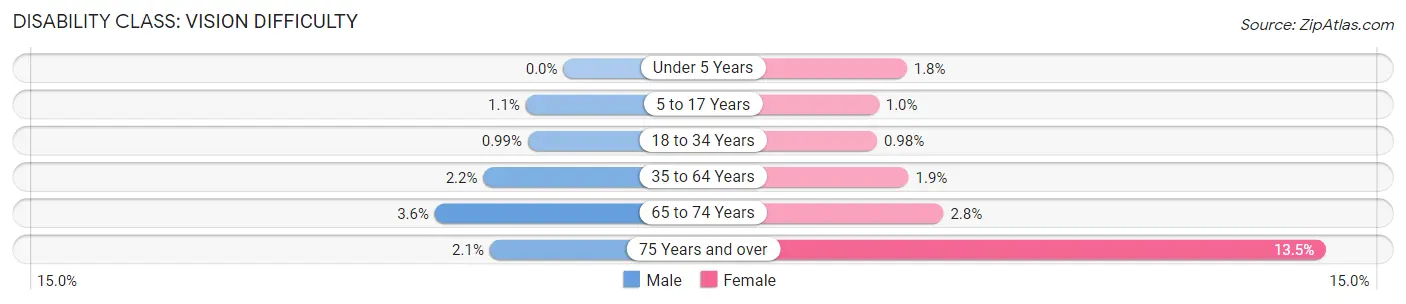
| Age Bracket | Male | Female |
| Under 5 Years | 0 (0.0%) | 45 (1.8%) |
| 5 to 17 Years | 85 (1.1%) | 66 (1.0%) |
| 18 to 34 Years | 134 (1.0%) | 124 (1.0%) |
| 35 to 64 Years | 420 (2.2%) | 340 (1.9%) |
| 65 to 74 Years | 134 (3.6%) | 126 (2.8%) |
| 75 Years and over | 40 (2.1%) | 484 (13.5%) |
Disability Class: Cognitive Difficulty
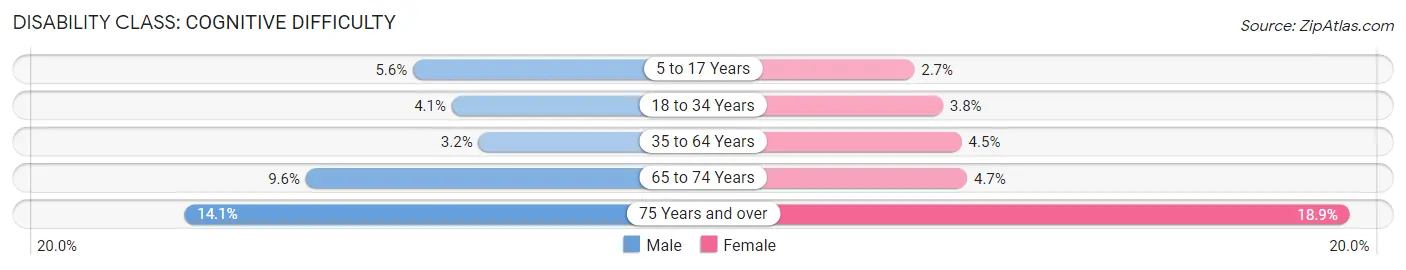
| Age Bracket | Male | Female |
| 5 to 17 Years | 453 (5.6%) | 173 (2.7%) |
| 18 to 34 Years | 561 (4.1%) | 477 (3.7%) |
| 35 to 64 Years | 593 (3.2%) | 814 (4.4%) |
| 65 to 74 Years | 358 (9.6%) | 207 (4.6%) |
| 75 Years and over | 275 (14.1%) | 677 (18.9%) |
Disability Class: Ambulatory Difficulty
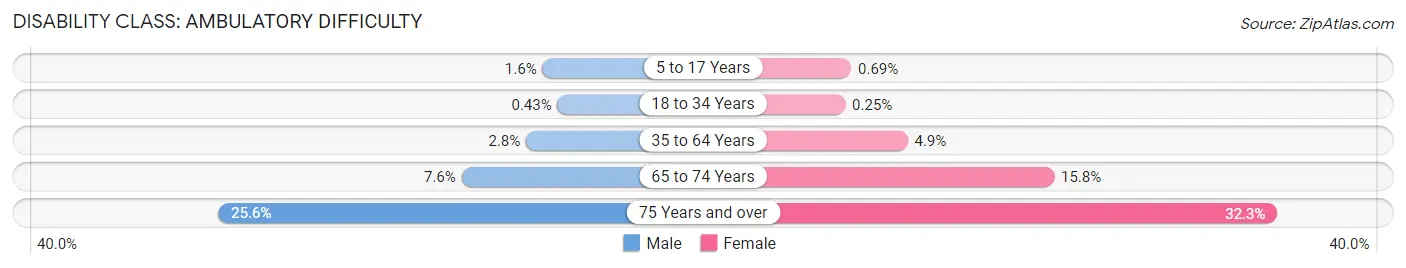
| Age Bracket | Male | Female |
| 5 to 17 Years | 126 (1.5%) | 44 (0.7%) |
| 18 to 34 Years | 58 (0.4%) | 32 (0.3%) |
| 35 to 64 Years | 522 (2.8%) | 891 (4.9%) |
| 65 to 74 Years | 283 (7.6%) | 702 (15.8%) |
| 75 Years and over | 501 (25.6%) | 1,161 (32.3%) |
Disability Class: Self-Care Difficulty
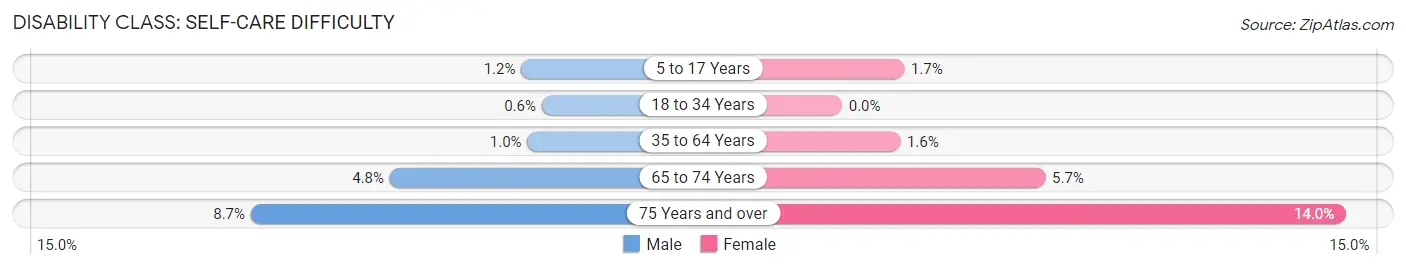
| Age Bracket | Male | Female |
| 5 to 17 Years | 95 (1.2%) | 111 (1.7%) |
| 18 to 34 Years | 81 (0.6%) | 0 (0.0%) |
| 35 to 64 Years | 189 (1.0%) | 296 (1.6%) |
| 65 to 74 Years | 181 (4.8%) | 252 (5.7%) |
| 75 Years and over | 170 (8.7%) | 504 (14.0%) |
Technology Access in Beaverton
Computing Device Access in Beaverton
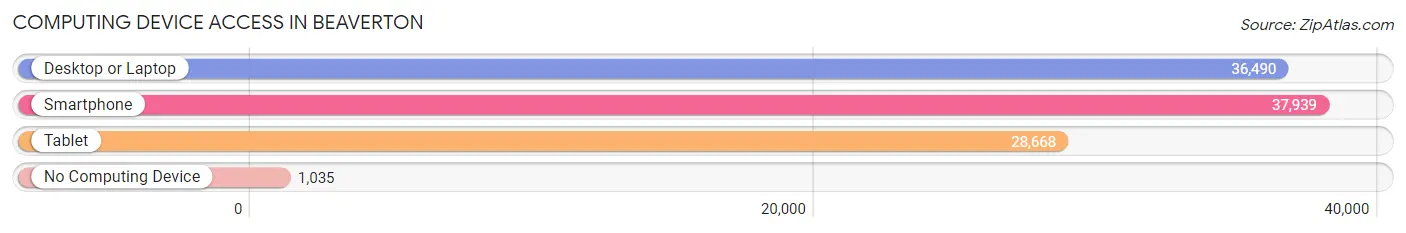
| Device Type | # Households | % Households |
| Desktop or Laptop | 36,490 | 89.4% |
| Smartphone | 37,939 | 93.0% |
| Tablet | 28,668 | 70.2% |
| No Computing Device | 1,035 | 2.5% |
| Total | 40,812 | 100.0% |
Internet Access in Beaverton
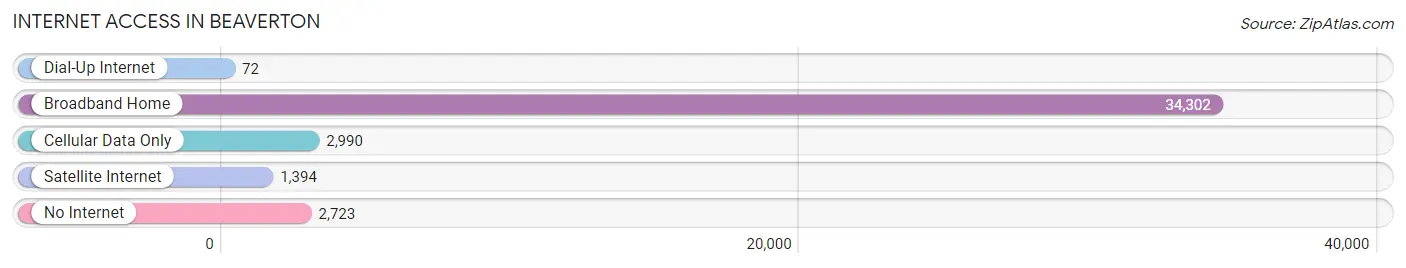
| Internet Type | # Households | % Households |
| Dial-Up Internet | 72 | 0.2% |
| Broadband Home | 34,302 | 84.1% |
| Cellular Data Only | 2,990 | 7.3% |
| Satellite Internet | 1,394 | 3.4% |
| No Internet | 2,723 | 6.7% |
| Total | 40,812 | 100.0% |
Beaverton Summary
Beaverton is a city located in the U.S. state of Oregon, in Washington County, just west of Portland. It is the sixth-largest city in the state, with a population of 97,590 as of the 2019 U.S. Census estimate. The city is part of the Portland metropolitan area, and is located in the Tualatin Valley, a fertile agricultural region.
History
Beaverton was first settled in 1868 by William and Elizabeth Scholl, who were among the first settlers in the area. The Scholls named the area Beaverdam for the many beaver dams in the area. The name was later changed to Beaverton. The city was incorporated in 1893, and was officially recognized as a city in 1905.
In the early 20th century, Beaverton was a small farming community, with a population of just over 1,000. The city began to grow in the 1950s, as the Portland metropolitan area expanded. By the 1970s, Beaverton had become a bedroom community for Portland, and its population had grown to over 20,000.
Geography
Beaverton is located in the Tualatin Valley, a fertile agricultural region in the Willamette Valley. The city is situated on the Tualatin River, and is bordered by the cities of Hillsboro to the west, Tigard to the south, and Portland to the east. The city covers an area of 18.6 square miles, and has an elevation of 250 feet.
The climate in Beaverton is mild and temperate, with warm summers and cool winters. The average annual temperature is around 50°F, and the average annual precipitation is around 40 inches.
Economy
Beaverton is a major economic center in the Portland metropolitan area. The city is home to several major employers, including Nike, Intel, and Tektronix. The city is also home to several shopping centers, including the Cedar Hills Crossing Mall and the Washington Square Mall.
Beaverton is also home to several educational institutions, including Portland Community College, Oregon State University, and the University of Portland. The city is also home to several technology companies, including Oracle, IBM, and HP.
Demographics
As of the 2019 U.S. Census estimate, Beaverton had a population of 97,590. The racial makeup of the city was 73.2% White, 8.3% Asian, 6.2% Black or African American, 0.7% Native American, 0.2% Pacific Islander, and 8.4% from other races. The median household income was $68,845, and the median home value was $372,400.
Beaverton is a diverse city, with a large immigrant population. The city is home to a large number of immigrants from Mexico, India, and China. The city also has a large population of refugees from Iraq, Syria, and Afghanistan.
Conclusion
Beaverton is a vibrant city located in the Portland metropolitan area. The city has a rich history, and is home to several major employers, shopping centers, and educational institutions. The city is also diverse, with a large immigrant population. Beaverton is a great place to live, work, and play.
Common Questions
What is Per Capita Income in Beaverton?
Per Capita income in Beaverton is $48,119.
What is the Median Family Income in Beaverton?
Median Family Income in Beaverton is $111,656.
What is the Median Household income in Beaverton?
Median Household Income in Beaverton is $88,899.
What is Income or Wage Gap in Beaverton?
Income or Wage Gap in Beaverton is 22.9%.
Women in Beaverton earn 77.1 cents for every dollar earned by a man.
What is Family Income Deficit in Beaverton?
Family Income Deficit in Beaverton is $10,478.
Families that are below poverty line in Beaverton earn $10,478 less on average than the poverty threshold level.
What is Inequality or Gini Index in Beaverton?
Inequality or Gini Index in Beaverton is 0.43.
What is the Total Population of Beaverton?
Total Population of Beaverton is 97,554.
What is the Total Male Population of Beaverton?
Total Male Population of Beaverton is 49,413.
What is the Total Female Population of Beaverton?
Total Female Population of Beaverton is 48,141.
What is the Ratio of Males per 100 Females in Beaverton?
There are 102.64 Males per 100 Females in Beaverton.
What is the Ratio of Females per 100 Males in Beaverton?
There are 97.43 Females per 100 Males in Beaverton.
What is the Median Population Age in Beaverton?
Median Population Age in Beaverton is 36.7 Years.
What is the Average Family Size in Beaverton
Average Family Size in Beaverton is 3.0 People.
What is the Average Household Size in Beaverton
Average Household Size in Beaverton is 2.4 People.
How Large is the Labor Force in Beaverton?
There are 57,059 People in the Labor Forcein in Beaverton.
What is the Percentage of People in the Labor Force in Beaverton?
71.4% of People are in the Labor Force in Beaverton.
What is the Unemployment Rate in Beaverton?
Unemployment Rate in Beaverton is 3.9%.