Fairview, CA Map & Demographics
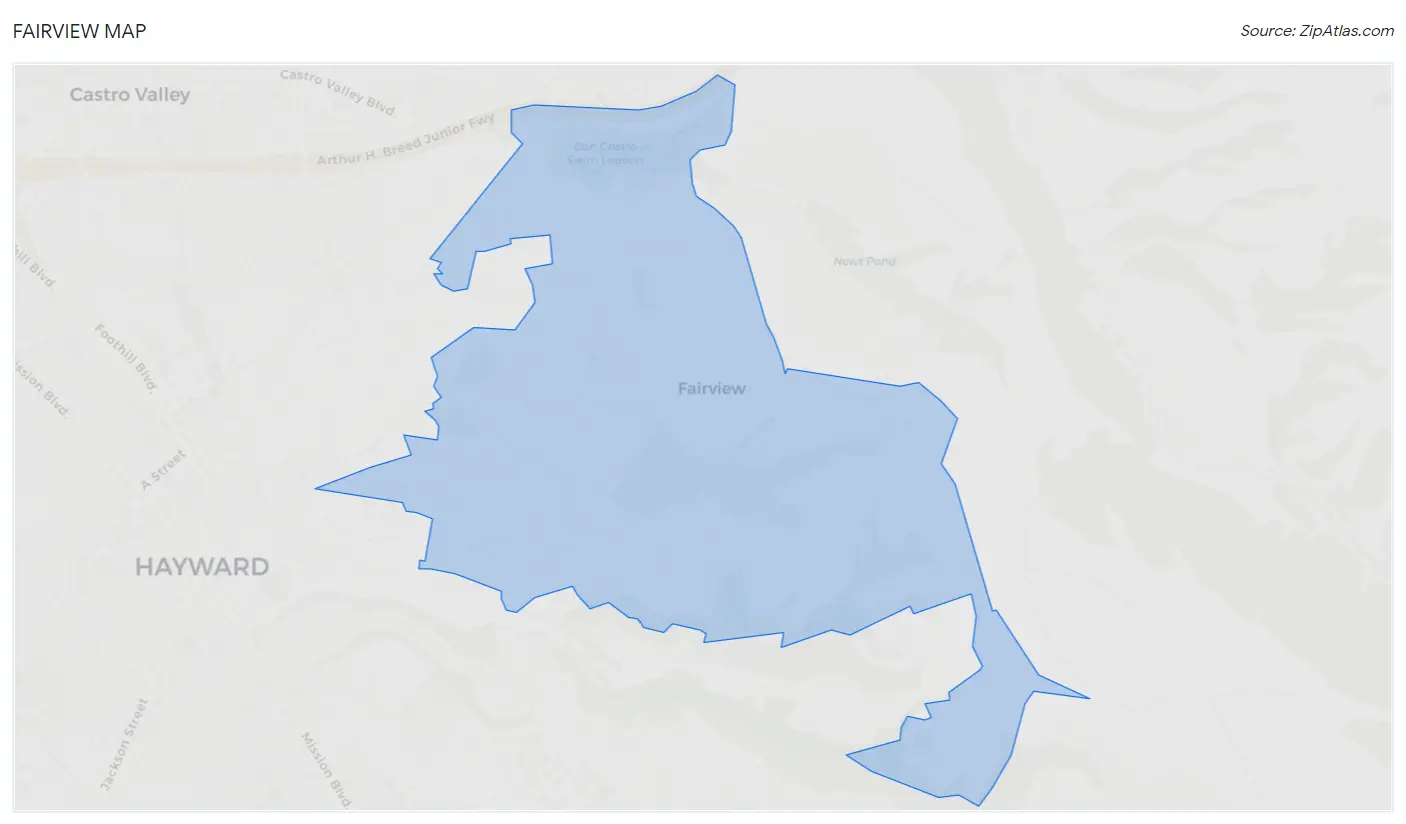
Fairview Map
Fairview Overview
$68,669
PER CAPITA INCOME
$153,315
AVG FAMILY INCOME
$147,931
AVG HOUSEHOLD INCOME
6.4%
WAGE / INCOME GAP [ % ]
93.6¢/ $1
WAGE / INCOME GAP [ $ ]
0.42
INEQUALITY / GINI INDEX
10,583
TOTAL POPULATION
5,603
MALE POPULATION
4,980
FEMALE POPULATION
112.51
MALES / 100 FEMALES
88.88
FEMALES / 100 MALES
46.5
MEDIAN AGE
3.3
AVG FAMILY SIZE
2.9
AVG HOUSEHOLD SIZE
5,794
LABOR FORCE [ PEOPLE ]
63.1%
PERCENT IN LABOR FORCE
4.9%
UNEMPLOYMENT RATE
Income in Fairview
Income Overview in Fairview
Per Capita Income in Fairview is $68,669, while median incomes of families and households are $153,315 and $147,931 respectively.
| Characteristic | Number | Measure |
| Per Capita Income | 10,583 | $68,669 |
| Median Family Income | 2,814 | $153,315 |
| Mean Family Income | 2,814 | $216,214 |
| Median Household Income | 3,570 | $147,931 |
| Mean Household Income | 3,570 | $191,949 |
| Income Deficit | 2,814 | $0 |
| Wage / Income Gap (%) | 10,583 | 6.36% |
| Wage / Income Gap ($) | 10,583 | 93.64¢ per $1 |
| Gini / Inequality Index | 10,583 | 0.42 |
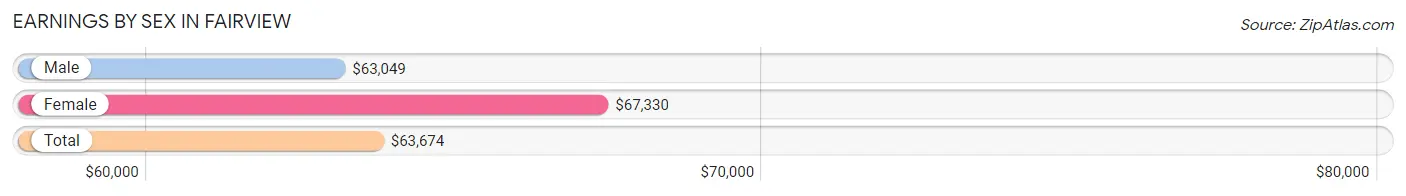
Earnings by Sex in Fairview
Average Earnings in Fairview are $63,674, $63,049 for men and $67,330 for women, a difference of 6.4%.
| Sex | Number | Average Earnings |
| Male | 3,002 (51.4%) | $63,049 |
| Female | 2,839 (48.6%) | $67,330 |
| Total | 5,841 (100.0%) | $63,674 |
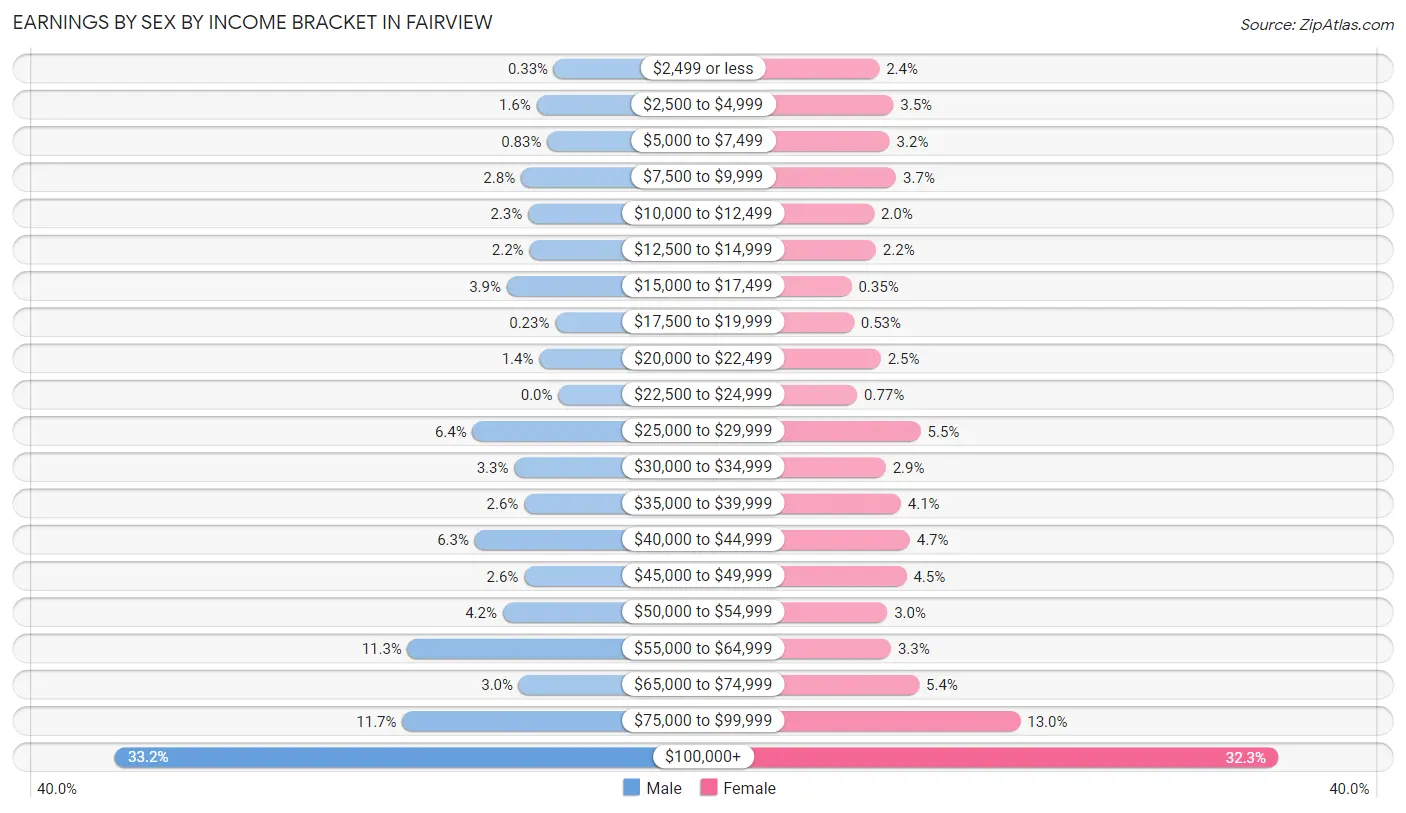
Earnings by Sex by Income Bracket in Fairview
The most common earnings brackets in Fairview are $100,000+ for men (997 | 33.2%) and $100,000+ for women (917 | 32.3%).
| Income | Male | Female |
| $2,499 or less | 10 (0.3%) | 69 (2.4%) |
| $2,500 to $4,999 | 49 (1.6%) | 99 (3.5%) |
| $5,000 to $7,499 | 25 (0.8%) | 91 (3.2%) |
| $7,500 to $9,999 | 84 (2.8%) | 105 (3.7%) |
| $10,000 to $12,499 | 68 (2.3%) | 58 (2.0%) |
| $12,500 to $14,999 | 65 (2.2%) | 62 (2.2%) |
| $15,000 to $17,499 | 116 (3.9%) | 10 (0.4%) |
| $17,500 to $19,999 | 7 (0.2%) | 15 (0.5%) |
| $20,000 to $22,499 | 43 (1.4%) | 72 (2.5%) |
| $22,500 to $24,999 | 0 (0.0%) | 22 (0.8%) |
| $25,000 to $29,999 | 193 (6.4%) | 157 (5.5%) |
| $30,000 to $34,999 | 99 (3.3%) | 83 (2.9%) |
| $35,000 to $39,999 | 77 (2.6%) | 115 (4.1%) |
| $40,000 to $44,999 | 188 (6.3%) | 134 (4.7%) |
| $45,000 to $49,999 | 77 (2.6%) | 127 (4.5%) |
| $50,000 to $54,999 | 125 (4.2%) | 86 (3.0%) |
| $55,000 to $64,999 | 339 (11.3%) | 94 (3.3%) |
| $65,000 to $74,999 | 89 (3.0%) | 154 (5.4%) |
| $75,000 to $99,999 | 351 (11.7%) | 369 (13.0%) |
| $100,000+ | 997 (33.2%) | 917 (32.3%) |
| Total | 3,002 (100.0%) | 2,839 (100.0%) |
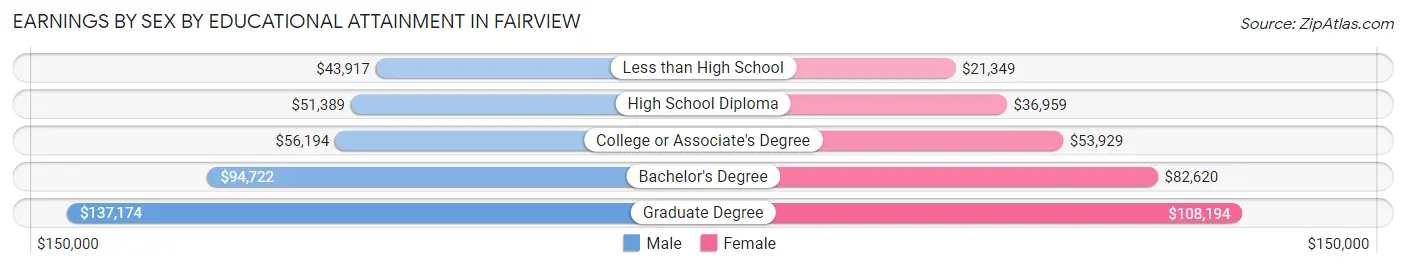
Earnings by Sex by Educational Attainment in Fairview
Average earnings in Fairview are $71,357 for men and $69,074 for women, a difference of 3.2%. Men with an educational attainment of graduate degree enjoy the highest average annual earnings of $137,174, while those with less than high school education earn the least with $43,917. Women with an educational attainment of graduate degree earn the most with the average annual earnings of $108,194, while those with less than high school education have the smallest earnings of $21,349.
| Educational Attainment | Male Income | Female Income |
| Less than High School | $43,917 | $21,349 |
| High School Diploma | $51,389 | $36,959 |
| College or Associate's Degree | $56,194 | $53,929 |
| Bachelor's Degree | $94,722 | $82,620 |
| Graduate Degree | $137,174 | $108,194 |
| Total | $71,357 | $69,074 |
Family Income in Fairview
Family Income Brackets in Fairview
According to the Fairview family income data, there are 864 families falling into the $200,000+ income range, which is the most common income bracket and makes up 30.7% of all families.
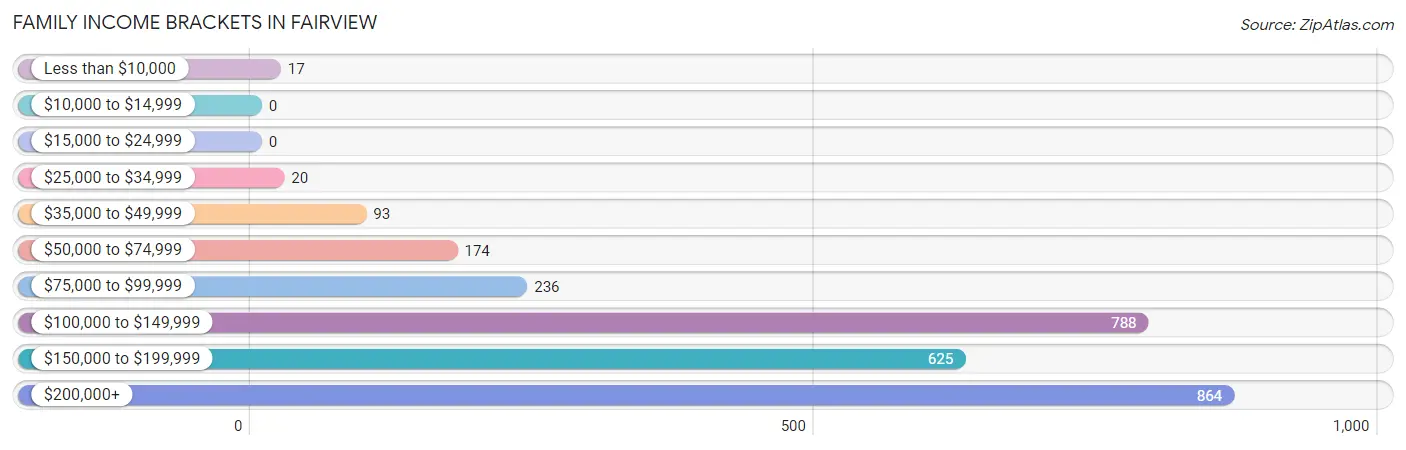
| Income Bracket | # Families | % Families |
| Less than $10,000 | 17 | 0.6% |
| $10,000 to $14,999 | 0 | 0.0% |
| $15,000 to $24,999 | 0 | 0.0% |
| $25,000 to $34,999 | 20 | 0.7% |
| $35,000 to $49,999 | 93 | 3.3% |
| $50,000 to $74,999 | 174 | 6.2% |
| $75,000 to $99,999 | 236 | 8.4% |
| $100,000 to $149,999 | 788 | 28.0% |
| $150,000 to $199,999 | 625 | 22.2% |
| $200,000+ | 864 | 30.7% |
Family Income by Famaliy Size in Fairview
7+ person families (37 | 1.3%) account for the highest median family income in Fairview with $184,306 per family, while 2-person families (1,206 | 42.9%) have the highest median income of $74,634 per family member.
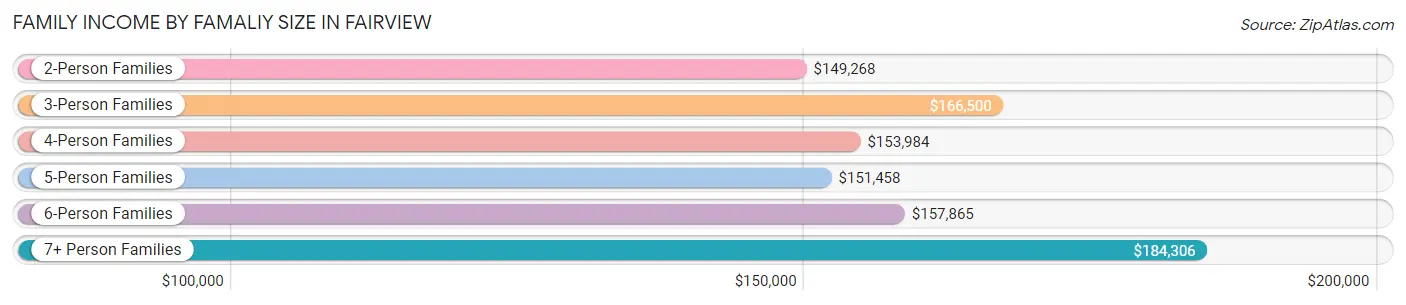
| Income Bracket | # Families | Median Income |
| 2-Person Families | 1,206 (42.9%) | $149,268 |
| 3-Person Families | 700 (24.9%) | $166,500 |
| 4-Person Families | 552 (19.6%) | $153,984 |
| 5-Person Families | 228 (8.1%) | $151,458 |
| 6-Person Families | 91 (3.2%) | $157,865 |
| 7+ Person Families | 37 (1.3%) | $184,306 |
| Total | 2,814 (100.0%) | $153,315 |
Family Income by Number of Earners in Fairview
The median family income in Fairview is $153,315, with families comprising 3+ earners (426) having the highest median family income of $195,625, while families with 1 earner (682) have the lowest median family income of $124,688, accounting for 15.1% and 24.2% of families, respectively.
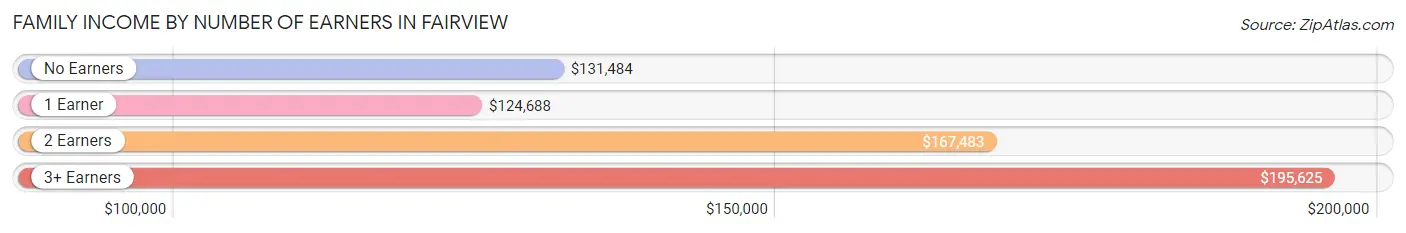
| Number of Earners | # Families | Median Income |
| No Earners | 311 (11.1%) | $131,484 |
| 1 Earner | 682 (24.2%) | $124,688 |
| 2 Earners | 1,395 (49.6%) | $167,483 |
| 3+ Earners | 426 (15.1%) | $195,625 |
| Total | 2,814 (100.0%) | $153,315 |
Household Income in Fairview
Household Income Brackets in Fairview
With 971 households falling in the category, the $200,000+ income range is the most frequent in Fairview, accounting for 27.2% of all households.
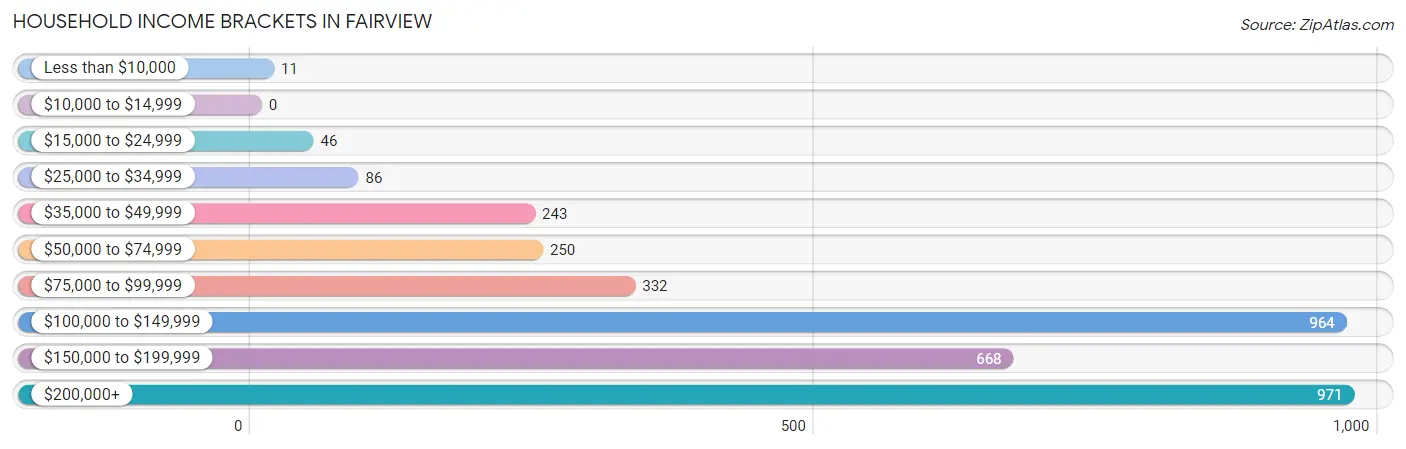
| Income Bracket | # Households | % Households |
| Less than $10,000 | 11 | 0.3% |
| $10,000 to $14,999 | 0 | 0.0% |
| $15,000 to $24,999 | 46 | 1.3% |
| $25,000 to $34,999 | 86 | 2.4% |
| $35,000 to $49,999 | 243 | 6.8% |
| $50,000 to $74,999 | 250 | 7.0% |
| $75,000 to $99,999 | 332 | 9.3% |
| $100,000 to $149,999 | 964 | 27.0% |
| $150,000 to $199,999 | 668 | 18.7% |
| $200,000+ | 971 | 27.2% |
Household Income by Householder Age in Fairview
The median household income in Fairview is $147,931, with the highest median household income of $165,139 found in the 45 to 64 years age bracket for the primary householder. A total of 1,466 households (41.1%) fall into this category. Meanwhile, the 15 to 24 years age bracket for the primary householder has the lowest median household income of $0, with 11 households (0.3%) in this group.
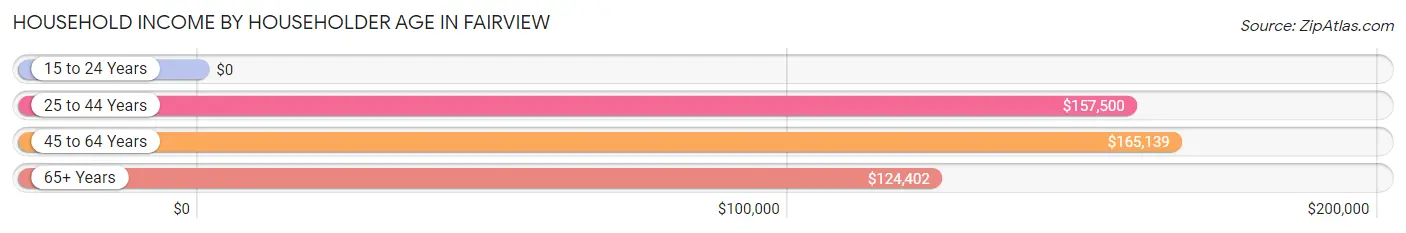
| Income Bracket | # Households | Median Income |
| 15 to 24 Years | 11 (0.3%) | $0 |
| 25 to 44 Years | 942 (26.4%) | $157,500 |
| 45 to 64 Years | 1,466 (41.1%) | $165,139 |
| 65+ Years | 1,151 (32.2%) | $124,402 |
| Total | 3,570 (100.0%) | $147,931 |
Poverty in Fairview
Income Below Poverty by Sex and Age in Fairview
With 2.3% poverty level for males and 2.1% for females among the residents of Fairview, 18 to 24 year old males and 25 to 34 year old females are the most vulnerable to poverty, with 53 males (13.0%) and 36 females (7.8%) in their respective age groups living below the poverty level.
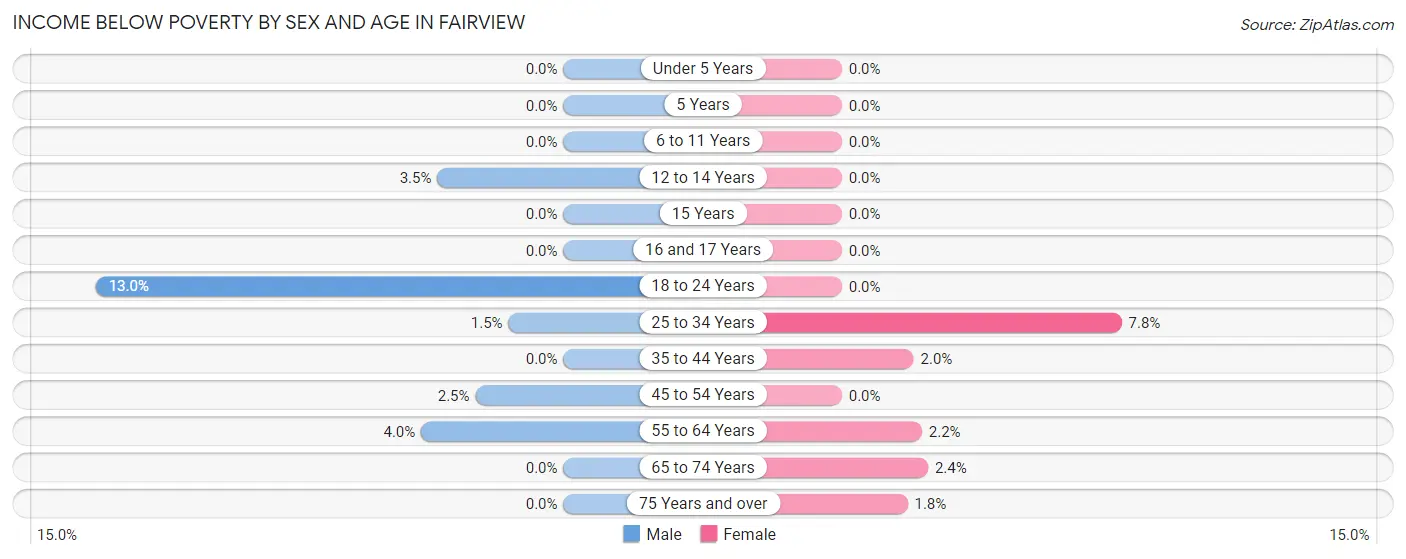
| Age Bracket | Male | Female |
| Under 5 Years | 0 (0.0%) | 0 (0.0%) |
| 5 Years | 0 (0.0%) | 0 (0.0%) |
| 6 to 11 Years | 0 (0.0%) | 0 (0.0%) |
| 12 to 14 Years | 6 (3.5%) | 0 (0.0%) |
| 15 Years | 0 (0.0%) | 0 (0.0%) |
| 16 and 17 Years | 0 (0.0%) | 0 (0.0%) |
| 18 to 24 Years | 53 (13.0%) | 0 (0.0%) |
| 25 to 34 Years | 11 (1.5%) | 36 (7.8%) |
| 35 to 44 Years | 0 (0.0%) | 16 (2.0%) |
| 45 to 54 Years | 16 (2.5%) | 0 (0.0%) |
| 55 to 64 Years | 40 (4.0%) | 22 (2.2%) |
| 65 to 74 Years | 0 (0.0%) | 17 (2.4%) |
| 75 Years and over | 0 (0.0%) | 11 (1.8%) |
| Total | 126 (2.3%) | 102 (2.1%) |
Income Above Poverty by Sex and Age in Fairview
According to the poverty statistics in Fairview, males aged under 5 years and females aged under 5 years are the age groups that are most secure financially, with 100.0% of males and 100.0% of females in these age groups living above the poverty line.
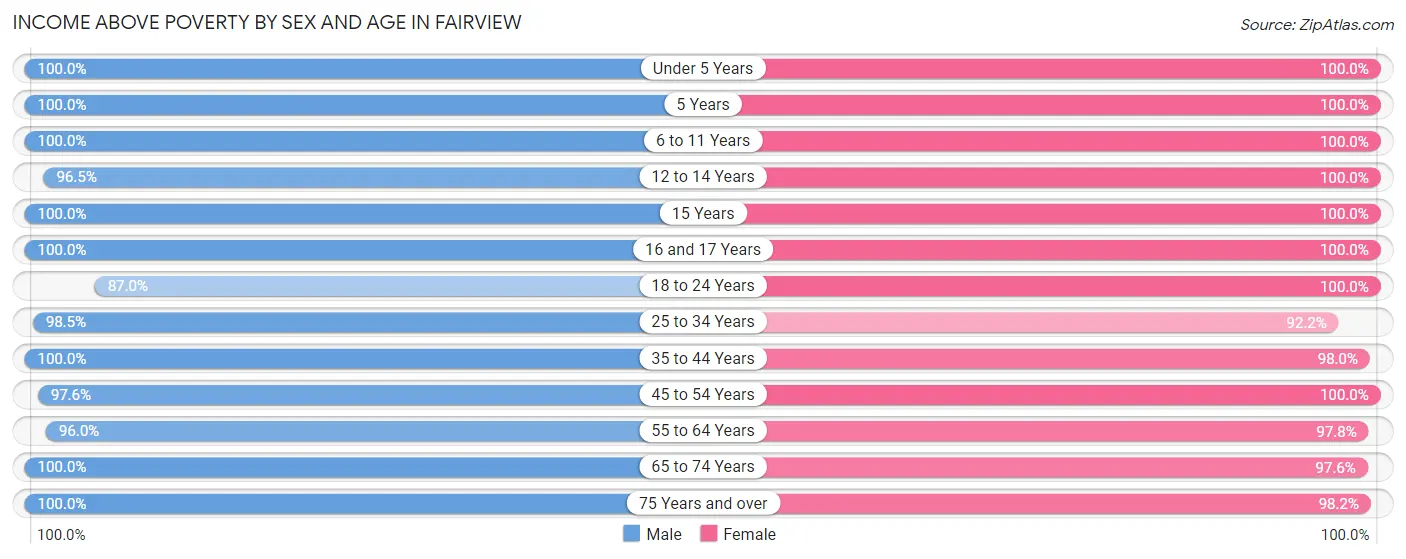
| Age Bracket | Male | Female |
| Under 5 Years | 296 (100.0%) | 136 (100.0%) |
| 5 Years | 65 (100.0%) | 61 (100.0%) |
| 6 to 11 Years | 265 (100.0%) | 129 (100.0%) |
| 12 to 14 Years | 165 (96.5%) | 109 (100.0%) |
| 15 Years | 104 (100.0%) | 13 (100.0%) |
| 16 and 17 Years | 157 (100.0%) | 114 (100.0%) |
| 18 to 24 Years | 354 (87.0%) | 238 (100.0%) |
| 25 to 34 Years | 710 (98.5%) | 426 (92.2%) |
| 35 to 44 Years | 779 (100.0%) | 785 (98.0%) |
| 45 to 54 Years | 638 (97.6%) | 592 (100.0%) |
| 55 to 64 Years | 971 (96.0%) | 964 (97.8%) |
| 65 to 74 Years | 507 (100.0%) | 690 (97.6%) |
| 75 Years and over | 381 (100.0%) | 590 (98.2%) |
| Total | 5,392 (97.7%) | 4,847 (97.9%) |
Income Below Poverty Among Married-Couple Families in Fairview
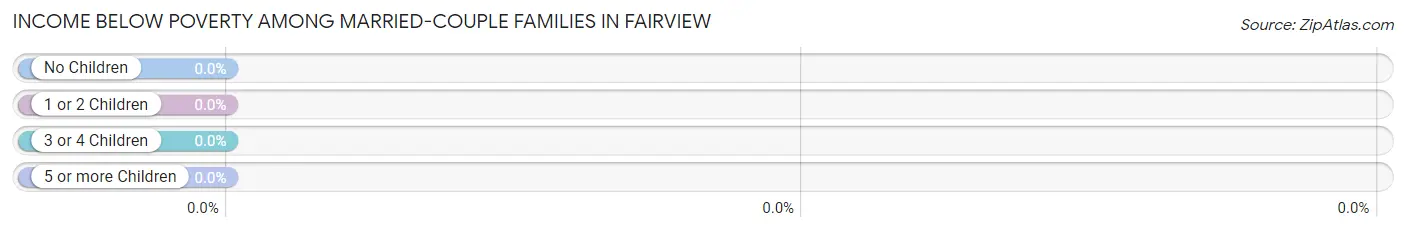
| Children | Above Poverty | Below Poverty |
| No Children | 1,333 (100.0%) | 0 (0.0%) |
| 1 or 2 Children | 770 (100.0%) | 0 (0.0%) |
| 3 or 4 Children | 35 (100.0%) | 0 (0.0%) |
| 5 or more Children | 0 (0.0%) | 0 (0.0%) |
| Total | 2,138 (100.0%) | 0 (0.0%) |
Income Below Poverty Among Single-Parent Households in Fairview
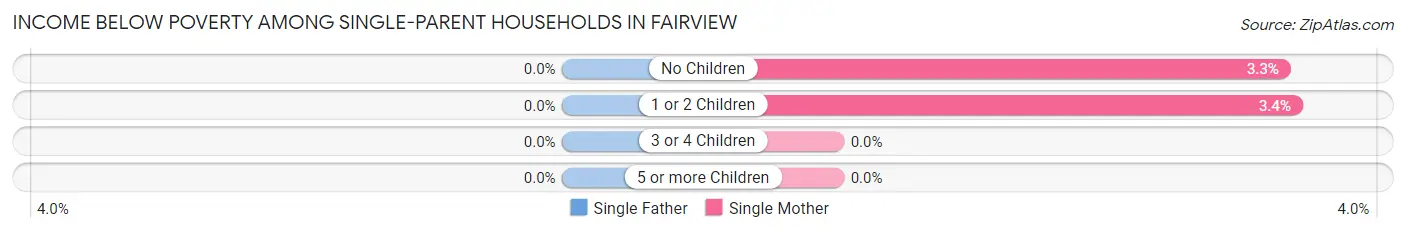
| Children | Single Father | Single Mother |
| No Children | 0 (0.0%) | 11 (3.3%) |
| 1 or 2 Children | 0 (0.0%) | 5 (3.4%) |
| 3 or 4 Children | 0 (0.0%) | 0 (0.0%) |
| 5 or more Children | 0 (0.0%) | 0 (0.0%) |
| Total | 0 (0.0%) | 16 (3.4%) |
Income Below Poverty Among Married-Couple vs Single-Parent Households in Fairview
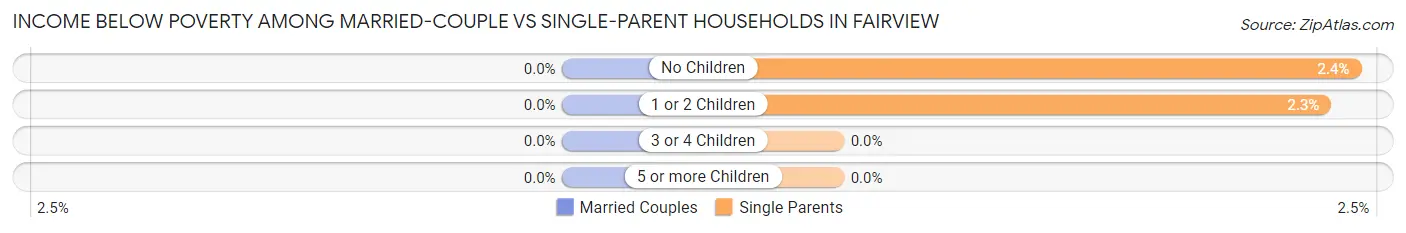
| Children | Married-Couple Families | Single-Parent Households |
| No Children | 0 (0.0%) | 11 (2.4%) |
| 1 or 2 Children | 0 (0.0%) | 5 (2.3%) |
| 3 or 4 Children | 0 (0.0%) | 0 (0.0%) |
| 5 or more Children | 0 (0.0%) | 0 (0.0%) |
| Total | 0 (0.0%) | 16 (2.4%) |
Race in Fairview
The most populous races in Fairview are White / Caucasian (3,916 | 37.0%), Hispanic or Latino (2,455 | 23.2%), and Asian (2,132 | 20.2%).
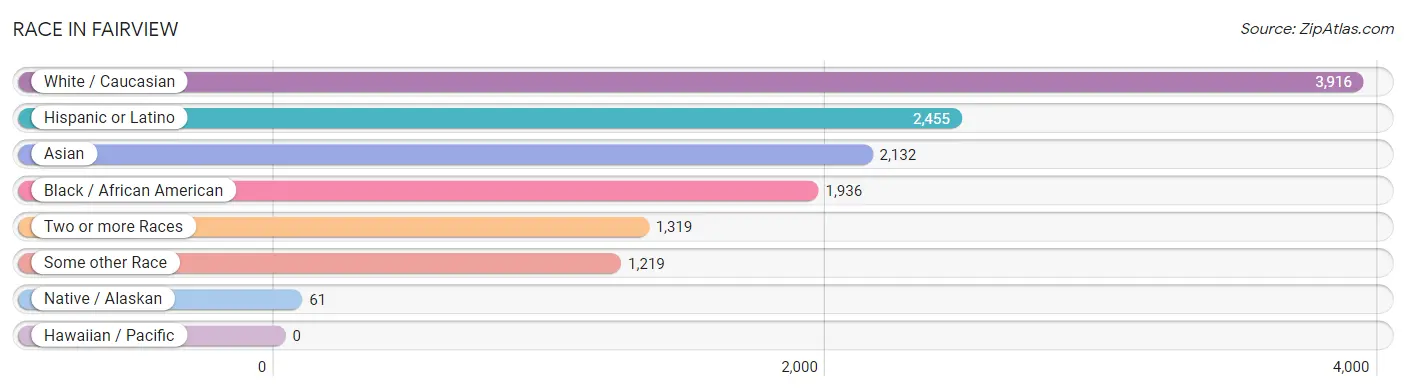
| Race | # Population | % Population |
| Asian | 2,132 | 20.2% |
| Black / African American | 1,936 | 18.3% |
| Hawaiian / Pacific | 0 | 0.0% |
| Hispanic or Latino | 2,455 | 23.2% |
| Native / Alaskan | 61 | 0.6% |
| White / Caucasian | 3,916 | 37.0% |
| Two or more Races | 1,319 | 12.5% |
| Some other Race | 1,219 | 11.5% |
| Total | 10,583 | 100.0% |
Ancestry in Fairview
The most populous ancestries reported in Fairview are Mexican (1,500 | 14.2%), Thai (898 | 8.5%), Korean (652 | 6.2%), American (587 | 5.6%), and German (540 | 5.1%), together accounting for 39.5% of all Fairview residents.
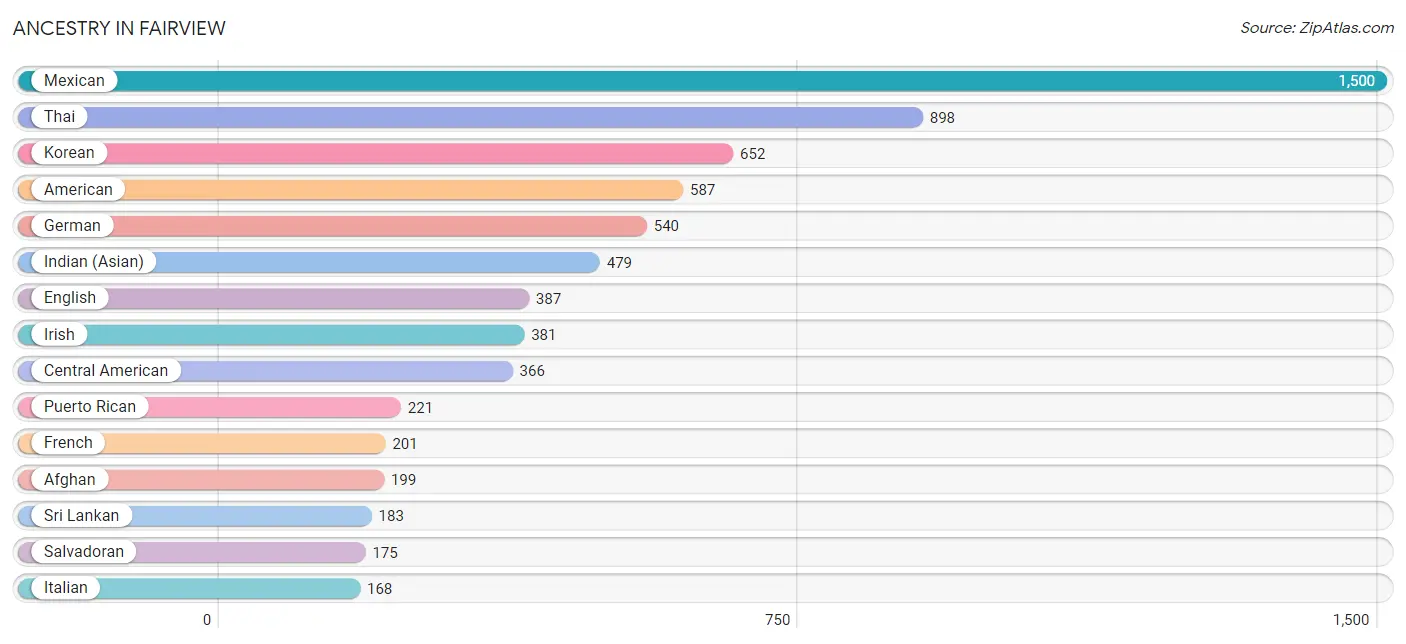
| Ancestry | # Population | % Population |
| Afghan | 199 | 1.9% |
| African | 51 | 0.5% |
| Albanian | 11 | 0.1% |
| American | 587 | 5.6% |
| Apache | 37 | 0.4% |
| Arab | 81 | 0.8% |
| Australian | 9 | 0.1% |
| Austrian | 7 | 0.1% |
| Belgian | 35 | 0.3% |
| Belizean | 96 | 0.9% |
| Bhutanese | 56 | 0.5% |
| Blackfeet | 11 | 0.1% |
| Bolivian | 11 | 0.1% |
| British | 54 | 0.5% |
| Burmese | 154 | 1.5% |
| Cambodian | 8 | 0.1% |
| Canadian | 167 | 1.6% |
| Cape Verdean | 12 | 0.1% |
| Central American | 366 | 3.5% |
| Cherokee | 24 | 0.2% |
| Colombian | 22 | 0.2% |
| Cuban | 32 | 0.3% |
| Danish | 14 | 0.1% |
| Dominican | 51 | 0.5% |
| Dutch | 32 | 0.3% |
| Eastern European | 13 | 0.1% |
| English | 387 | 3.7% |
| Ethiopian | 105 | 1.0% |
| European | 77 | 0.7% |
| Filipino | 21 | 0.2% |
| French | 201 | 1.9% |
| French Canadian | 20 | 0.2% |
| German | 540 | 5.1% |
| Greek | 27 | 0.3% |
| Guatemalan | 69 | 0.6% |
| Honduran | 21 | 0.2% |
| Hopi | 11 | 0.1% |
| Hungarian | 13 | 0.1% |
| Indian (Asian) | 479 | 4.5% |
| Irish | 381 | 3.6% |
| Israeli | 36 | 0.3% |
| Italian | 168 | 1.6% |
| Korean | 652 | 6.2% |
| Lebanese | 14 | 0.1% |
| Lithuanian | 8 | 0.1% |
| Mexican | 1,500 | 14.2% |
| Mexican American Indian | 7 | 0.1% |
| Navajo | 21 | 0.2% |
| Nicaraguan | 59 | 0.6% |
| Northern European | 9 | 0.1% |
| Norwegian | 46 | 0.4% |
| Panamanian | 42 | 0.4% |
| Peruvian | 56 | 0.5% |
| Polish | 158 | 1.5% |
| Portuguese | 167 | 1.6% |
| Puerto Rican | 221 | 2.1% |
| Russian | 87 | 0.8% |
| Salvadoran | 175 | 1.7% |
| Samoan | 11 | 0.1% |
| Scandinavian | 50 | 0.5% |
| Scotch-Irish | 147 | 1.4% |
| Scottish | 109 | 1.0% |
| Slavic | 36 | 0.3% |
| Slovene | 46 | 0.4% |
| South American | 89 | 0.8% |
| Spaniard | 119 | 1.1% |
| Spanish | 13 | 0.1% |
| Sri Lankan | 183 | 1.7% |
| Subsaharan African | 168 | 1.6% |
| Swedish | 47 | 0.4% |
| Thai | 898 | 8.5% |
| Ukrainian | 9 | 0.1% |
| Welsh | 12 | 0.1% | View All 73 Rows |
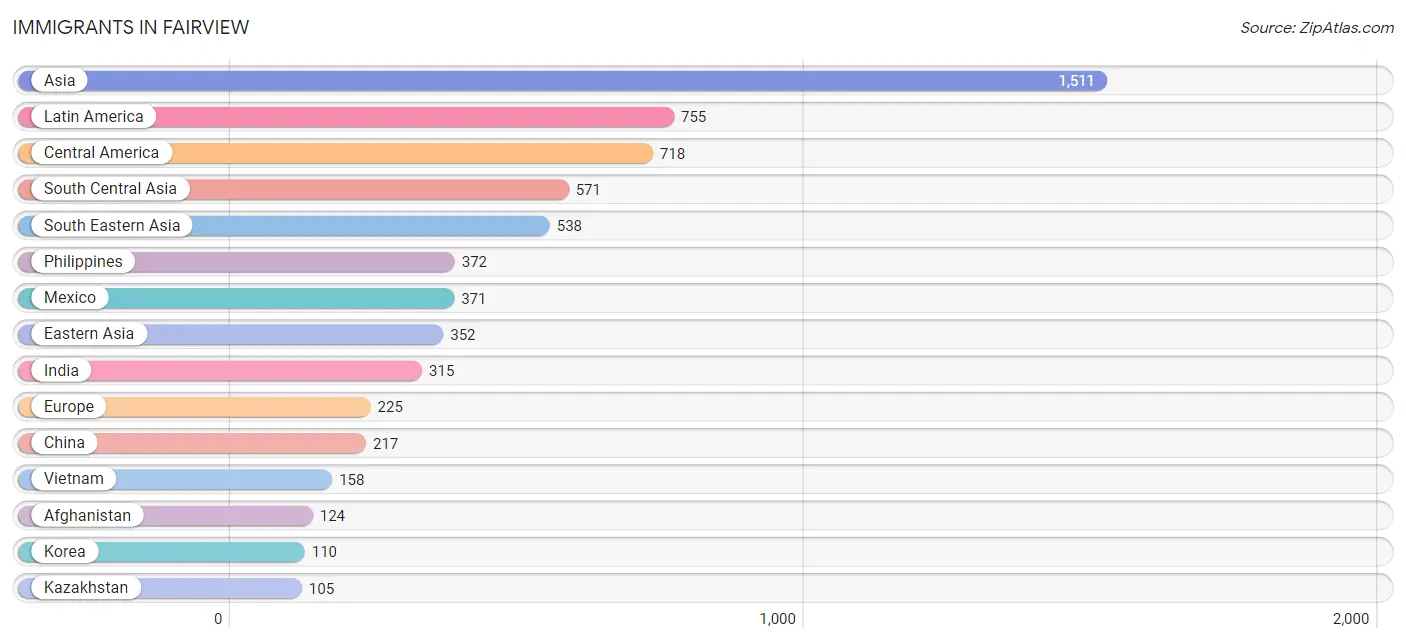
Immigrants in Fairview
The most numerous immigrant groups reported in Fairview came from Asia (1,511 | 14.3%), Latin America (755 | 7.1%), Central America (718 | 6.8%), South Central Asia (571 | 5.4%), and South Eastern Asia (538 | 5.1%), together accounting for 38.7% of all Fairview residents.
| Immigration Origin | # Population | % Population |
| Afghanistan | 124 | 1.2% |
| Africa | 59 | 0.6% |
| Asia | 1,511 | 14.3% |
| Belize | 96 | 0.9% |
| Canada | 22 | 0.2% |
| Caribbean | 6 | 0.1% |
| Central America | 718 | 6.8% |
| China | 217 | 2.1% |
| Dominican Republic | 6 | 0.1% |
| Eastern Africa | 59 | 0.6% |
| Eastern Asia | 352 | 3.3% |
| Eastern Europe | 71 | 0.7% |
| El Salvador | 102 | 1.0% |
| England | 57 | 0.5% |
| Ethiopia | 52 | 0.5% |
| Europe | 225 | 2.1% |
| Fiji | 69 | 0.6% |
| France | 5 | 0.1% |
| Germany | 15 | 0.1% |
| Guatemala | 103 | 1.0% |
| Guyana | 15 | 0.1% |
| Hong Kong | 96 | 0.9% |
| India | 315 | 3.0% |
| Israel | 36 | 0.3% |
| Italy | 32 | 0.3% |
| Japan | 17 | 0.2% |
| Kazakhstan | 105 | 1.0% |
| Korea | 110 | 1.0% |
| Latin America | 755 | 7.1% |
| Lebanon | 14 | 0.1% |
| Mexico | 371 | 3.5% |
| Nepal | 27 | 0.3% |
| Netherlands | 11 | 0.1% |
| Nicaragua | 46 | 0.4% |
| Northern Europe | 63 | 0.6% |
| Oceania | 69 | 0.6% |
| Peru | 16 | 0.2% |
| Philippines | 372 | 3.5% |
| Poland | 36 | 0.3% |
| Portugal | 16 | 0.2% |
| Russia | 23 | 0.2% |
| Scotland | 6 | 0.1% |
| Singapore | 8 | 0.1% |
| South America | 31 | 0.3% |
| South Central Asia | 571 | 5.4% |
| South Eastern Asia | 538 | 5.1% |
| Southern Europe | 60 | 0.6% |
| Spain | 12 | 0.1% |
| Taiwan | 6 | 0.1% |
| Vietnam | 158 | 1.5% |
| Western Asia | 50 | 0.5% |
| Western Europe | 31 | 0.3% | View All 52 Rows |
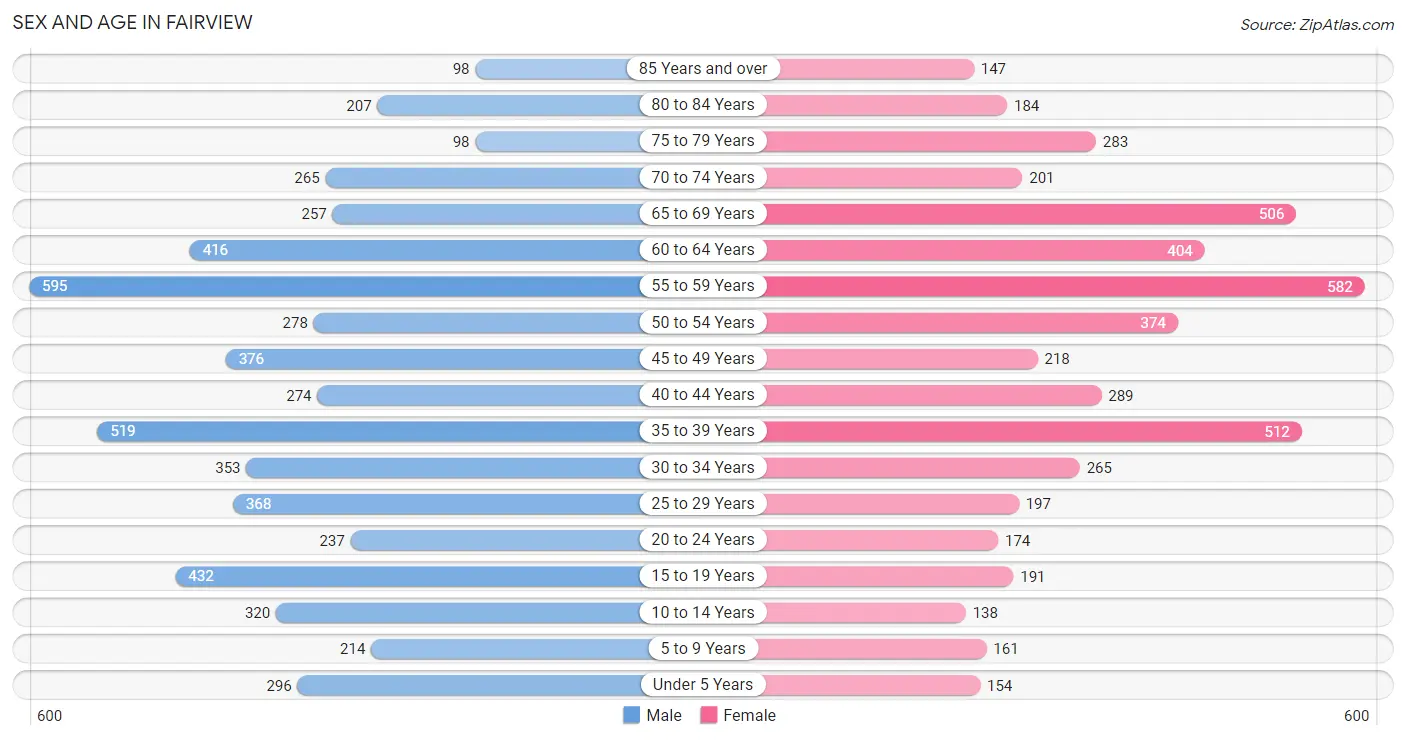
Sex and Age in Fairview
Sex and Age in Fairview
The most populous age groups in Fairview are 55 to 59 Years (595 | 10.6%) for men and 55 to 59 Years (582 | 11.7%) for women.
| Age Bracket | Male | Female |
| Under 5 Years | 296 (5.3%) | 154 (3.1%) |
| 5 to 9 Years | 214 (3.8%) | 161 (3.2%) |
| 10 to 14 Years | 320 (5.7%) | 138 (2.8%) |
| 15 to 19 Years | 432 (7.7%) | 191 (3.8%) |
| 20 to 24 Years | 237 (4.2%) | 174 (3.5%) |
| 25 to 29 Years | 368 (6.6%) | 197 (4.0%) |
| 30 to 34 Years | 353 (6.3%) | 265 (5.3%) |
| 35 to 39 Years | 519 (9.3%) | 512 (10.3%) |
| 40 to 44 Years | 274 (4.9%) | 289 (5.8%) |
| 45 to 49 Years | 376 (6.7%) | 218 (4.4%) |
| 50 to 54 Years | 278 (5.0%) | 374 (7.5%) |
| 55 to 59 Years | 595 (10.6%) | 582 (11.7%) |
| 60 to 64 Years | 416 (7.4%) | 404 (8.1%) |
| 65 to 69 Years | 257 (4.6%) | 506 (10.2%) |
| 70 to 74 Years | 265 (4.7%) | 201 (4.0%) |
| 75 to 79 Years | 98 (1.8%) | 283 (5.7%) |
| 80 to 84 Years | 207 (3.7%) | 184 (3.7%) |
| 85 Years and over | 98 (1.8%) | 147 (2.9%) |
| Total | 5,603 (100.0%) | 4,980 (100.0%) |
Families and Households in Fairview
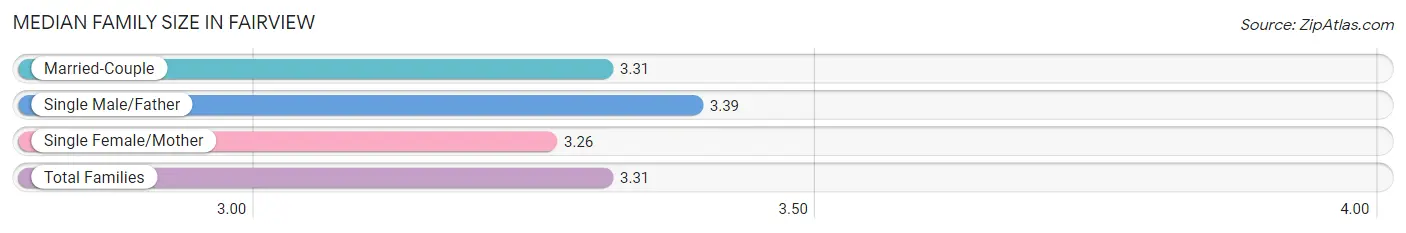
Median Family Size in Fairview
The median family size in Fairview is 3.31 persons per family, with single male/father families (200 | 7.1%) accounting for the largest median family size of 3.39 persons per family. On the other hand, single female/mother families (476 | 16.9%) represent the smallest median family size with 3.26 persons per family.
| Family Type | # Families | Family Size |
| Married-Couple | 2,138 (76.0%) | 3.31 |
| Single Male/Father | 200 (7.1%) | 3.39 |
| Single Female/Mother | 476 (16.9%) | 3.26 |
| Total Families | 2,814 (100.0%) | 3.31 |
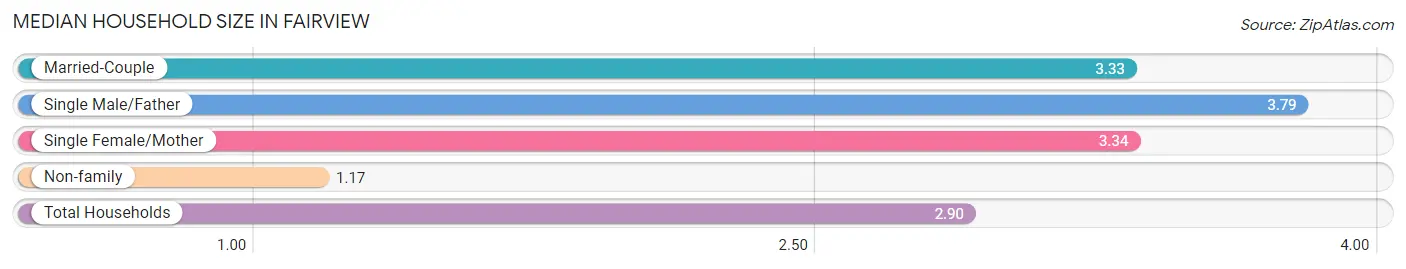
Median Household Size in Fairview
The median household size in Fairview is 2.90 persons per household, with single male/father households (200 | 5.6%) accounting for the largest median household size of 3.79 persons per household. non-family households (756 | 21.2%) represent the smallest median household size with 1.17 persons per household.
| Household Type | # Households | Household Size |
| Married-Couple | 2,138 (59.9%) | 3.33 |
| Single Male/Father | 200 (5.6%) | 3.79 |
| Single Female/Mother | 476 (13.3%) | 3.34 |
| Non-family | 756 (21.2%) | 1.17 |
| Total Households | 3,570 (100.0%) | 2.90 |
Household Size by Marriage Status in Fairview
Out of a total of 3,570 households in Fairview, 2,814 (78.8%) are family households, while 756 (21.2%) are nonfamily households. The most numerous type of family households are 2-person households, comprising 1,190, and the most common type of nonfamily households are 1-person households, comprising 649.
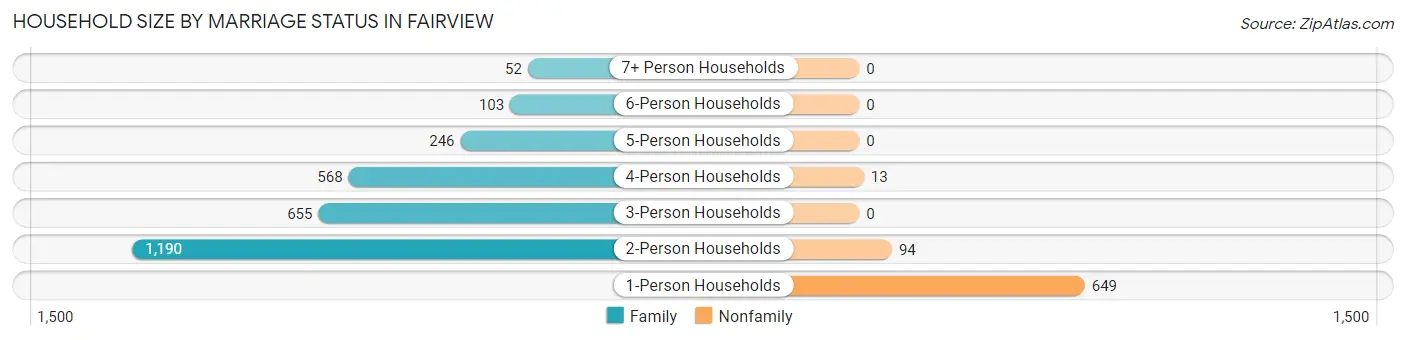
| Household Size | Family Households | Nonfamily Households |
| 1-Person Households | - | 649 (18.2%) |
| 2-Person Households | 1,190 (33.3%) | 94 (2.6%) |
| 3-Person Households | 655 (18.3%) | 0 (0.0%) |
| 4-Person Households | 568 (15.9%) | 13 (0.4%) |
| 5-Person Households | 246 (6.9%) | 0 (0.0%) |
| 6-Person Households | 103 (2.9%) | 0 (0.0%) |
| 7+ Person Households | 52 (1.5%) | 0 (0.0%) |
| Total | 2,814 (78.8%) | 756 (21.2%) |
Female Fertility in Fairview
Fertility by Age in Fairview
Average fertility rate in Fairview is 41.0 births per 1,000 women. Women in the age bracket of 20 to 34 years have the highest fertility rate with 121.0 births per 1,000 women. Women in the age bracket of 20 to 34 years acount for 100.0% of all women with births.
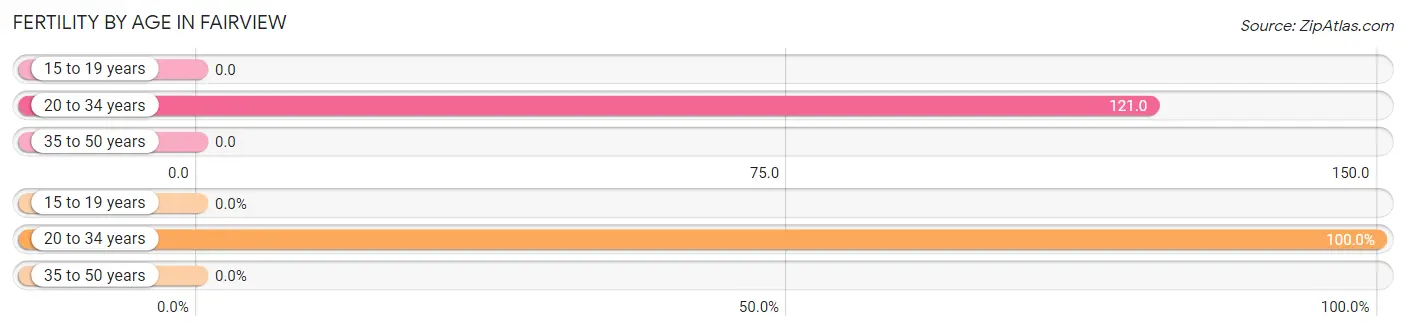
| Age Bracket | Women with Births | Births / 1,000 Women |
| 15 to 19 years | 0 (0.0%) | 0.0 |
| 20 to 34 years | 77 (100.0%) | 121.0 |
| 35 to 50 years | 0 (0.0%) | 0.0 |
| Total | 77 (100.0%) | 41.0 |
Fertility by Age by Marriage Status in Fairview
87.0% of women with births (77) in Fairview are married. The highest percentage of unmarried women with births falls into 20 to 34 years age bracket with 13.0% of them unmarried at the time of birth, while the lowest percentage of unmarried women with births belong to 20 to 34 years age bracket with 13.0% of them unmarried.
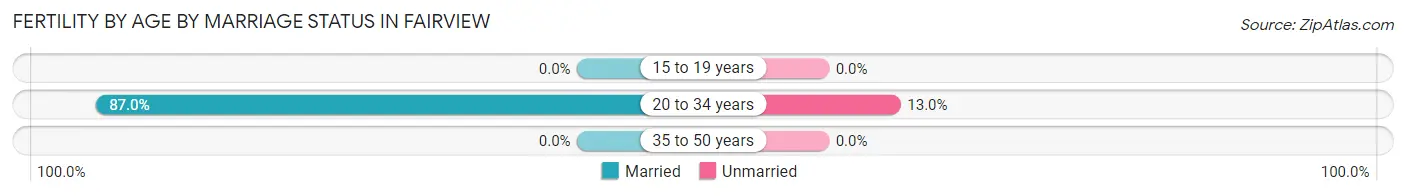
| Age Bracket | Married | Unmarried |
| 15 to 19 years | 0 (0.0%) | 0 (0.0%) |
| 20 to 34 years | 67 (87.0%) | 10 (13.0%) |
| 35 to 50 years | 0 (0.0%) | 0 (0.0%) |
| Total | 67 (87.0%) | 10 (13.0%) |
Fertility by Education in Fairview
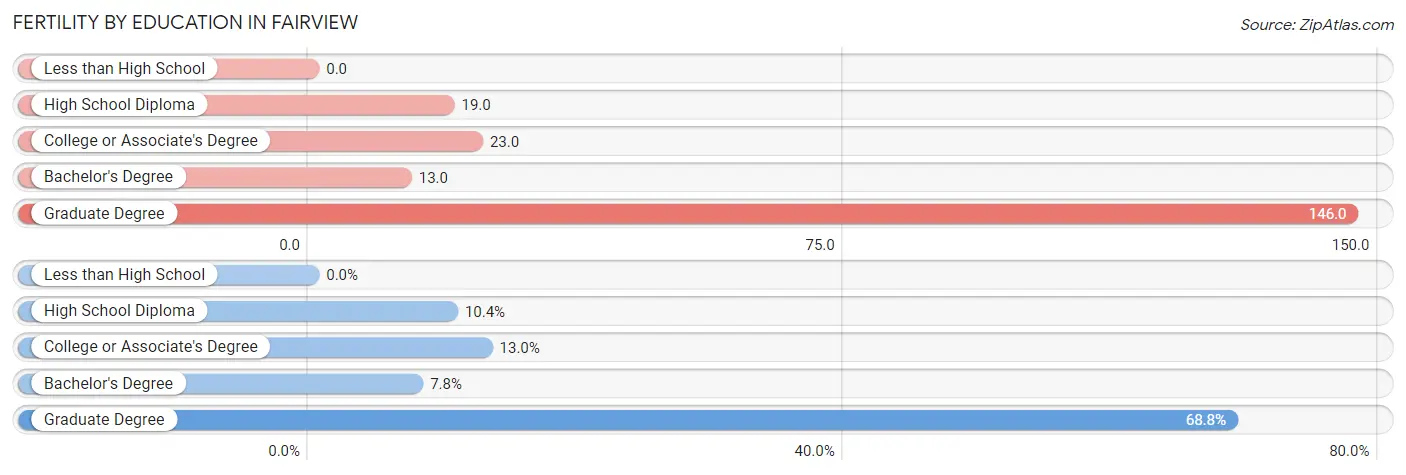
| Educational Attainment | Women with Births | Births / 1,000 Women |
| Less than High School | 0 (0.0%) | 0.0 |
| High School Diploma | 8 (10.4%) | 19.0 |
| College or Associate's Degree | 10 (13.0%) | 23.0 |
| Bachelor's Degree | 6 (7.8%) | 13.0 |
| Graduate Degree | 53 (68.8%) | 146.0 |
| Total | 77 (100.0%) | 41.0 |
Fertility by Education by Marriage Status in Fairview
13.0% of women with births in Fairview are unmarried. Women with the educational attainment of high school diploma are most likely to be married with 100.0% of them married at childbirth, while women with the educational attainment of college or associate's degree are least likely to be married with 100.0% of them unmarried at childbirth.
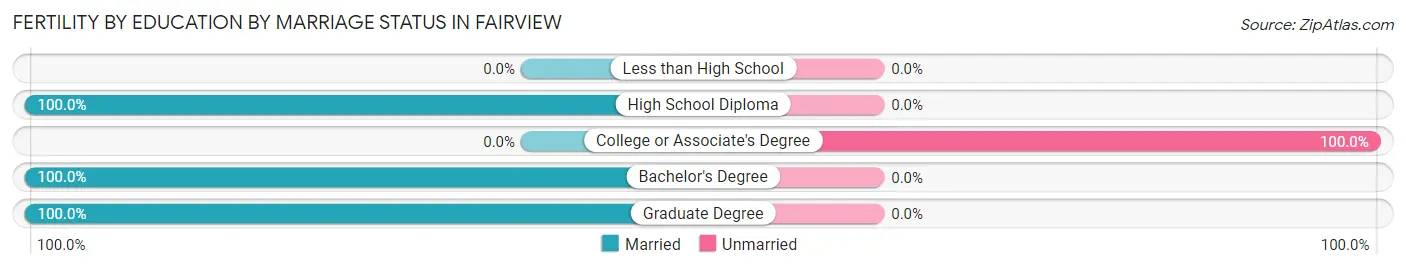
| Educational Attainment | Married | Unmarried |
| Less than High School | 0 (0.0%) | 0 (0.0%) |
| High School Diploma | 8 (100.0%) | 0 (0.0%) |
| College or Associate's Degree | 0 (0.0%) | 10 (100.0%) |
| Bachelor's Degree | 6 (100.0%) | 0 (0.0%) |
| Graduate Degree | 53 (100.0%) | 0 (0.0%) |
| Total | 67 (87.0%) | 10 (13.0%) |
Employment Characteristics in Fairview
Employment by Class of Employer in Fairview
Among the 5,142 employed individuals in Fairview, private company employees (3,227 | 62.8%), local government employees (565 | 11.0%), and not-for-profit organizations (468 | 9.1%) make up the most common classes of employment.
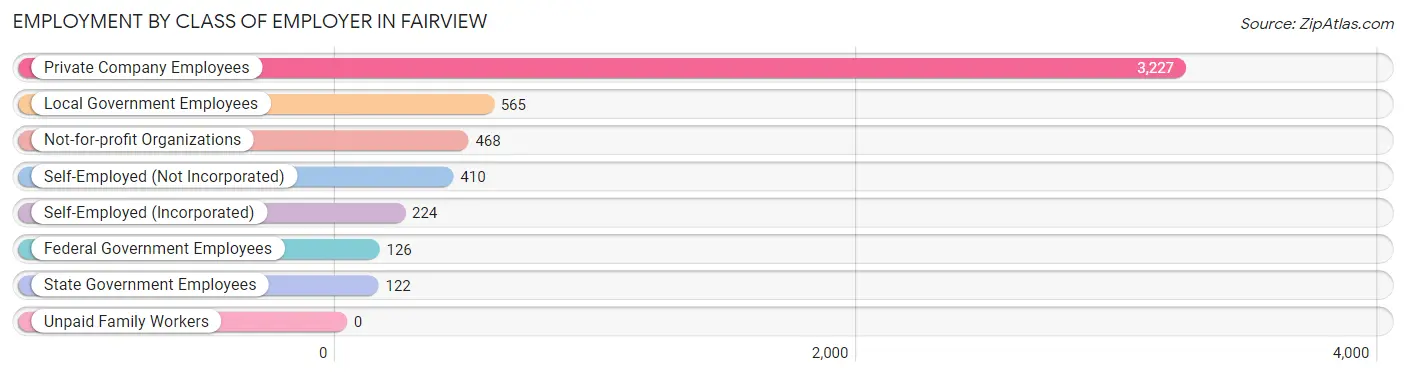
| Employer Class | # Employees | % Employees |
| Private Company Employees | 3,227 | 62.8% |
| Self-Employed (Incorporated) | 224 | 4.4% |
| Self-Employed (Not Incorporated) | 410 | 8.0% |
| Not-for-profit Organizations | 468 | 9.1% |
| Local Government Employees | 565 | 11.0% |
| State Government Employees | 122 | 2.4% |
| Federal Government Employees | 126 | 2.5% |
| Unpaid Family Workers | 0 | 0.0% |
| Total | 5,142 | 100.0% |
Employment Status by Age in Fairview
According to the labor force statistics for Fairview, out of the total population over 16 years of age (9,182), 63.1% or 5,794 individuals are in the labor force, with 4.9% or 284 of them unemployed. The age group with the highest labor force participation rate is 35 to 44 years, with 87.1% or 1,388 individuals in the labor force. Within the labor force, the 20 to 24 years age range has the highest percentage of unemployed individuals, with 15.0% or 39 of them being unemployed.
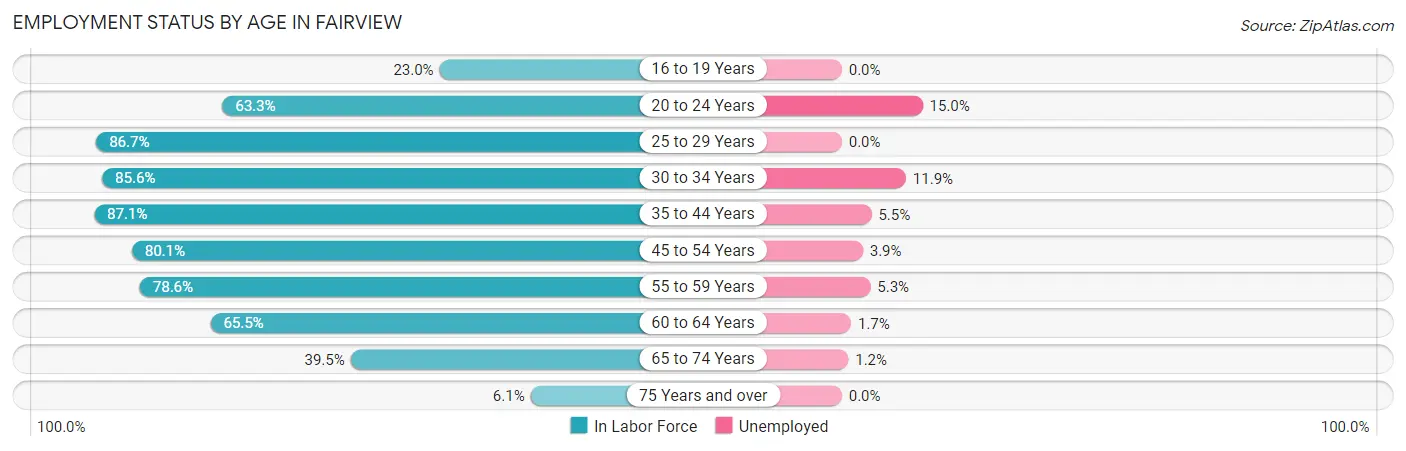
| Age Bracket | In Labor Force | Unemployed |
| 16 to 19 Years | 116 (23.0%) | 0 (0.0%) |
| 20 to 24 Years | 260 (63.3%) | 39 (15.0%) |
| 25 to 29 Years | 490 (86.7%) | 0 (0.0%) |
| 30 to 34 Years | 529 (85.6%) | 63 (11.9%) |
| 35 to 44 Years | 1,388 (87.1%) | 76 (5.5%) |
| 45 to 54 Years | 998 (80.1%) | 39 (3.9%) |
| 55 to 59 Years | 925 (78.6%) | 49 (5.3%) |
| 60 to 64 Years | 537 (65.5%) | 9 (1.7%) |
| 65 to 74 Years | 485 (39.5%) | 6 (1.2%) |
| 75 Years and over | 62 (6.1%) | 0 (0.0%) |
| Total | 5,794 (63.1%) | 284 (4.9%) |
Employment Status by Educational Attainment in Fairview
According to labor force statistics for Fairview, 80.8% of individuals (4,864) out of the total population between 25 and 64 years of age (6,020) are in the labor force, with 4.8% or 233 of them being unemployed. The group with the highest labor force participation rate are those with the educational attainment of bachelor's degree or higher, with 88.4% or 2,352 individuals in the labor force. Within the labor force, individuals with less than high school education have the highest percentage of unemployment, with 10.3% or 20 of them being unemployed.
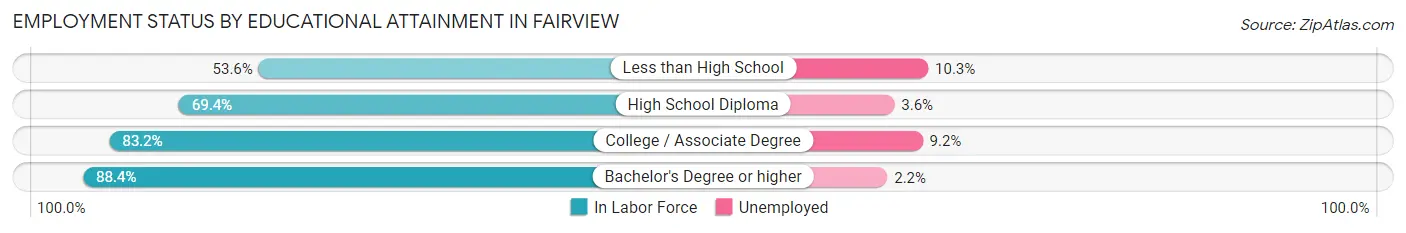
| Educational Attainment | In Labor Force | Unemployed |
| Less than High School | 194 (53.6%) | 37 (10.3%) |
| High School Diploma | 879 (69.4%) | 46 (3.6%) |
| College / Associate Degree | 1,440 (83.2%) | 159 (9.2%) |
| Bachelor's Degree or higher | 2,352 (88.4%) | 59 (2.2%) |
| Total | 4,864 (80.8%) | 289 (4.8%) |
Employment Occupations by Sex in Fairview
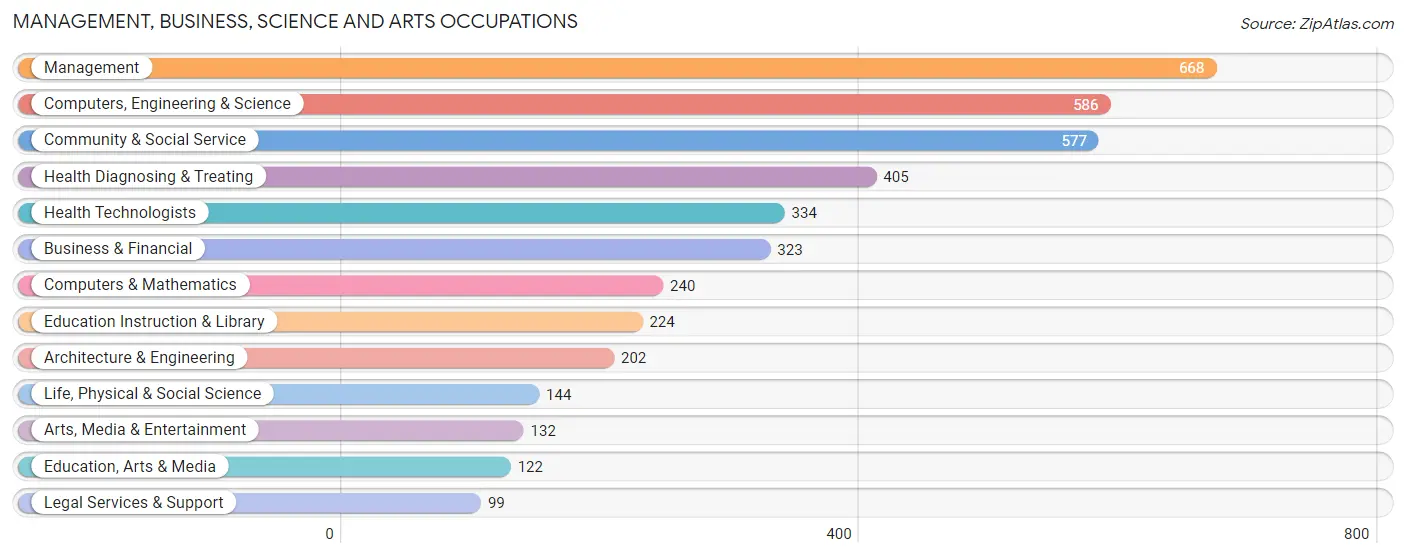
Management, Business, Science and Arts Occupations
The most common Management, Business, Science and Arts occupations in Fairview are Management (668 | 12.1%), Computers, Engineering & Science (586 | 10.6%), Community & Social Service (577 | 10.5%), Health Diagnosing & Treating (405 | 7.3%), and Health Technologists (334 | 6.1%).
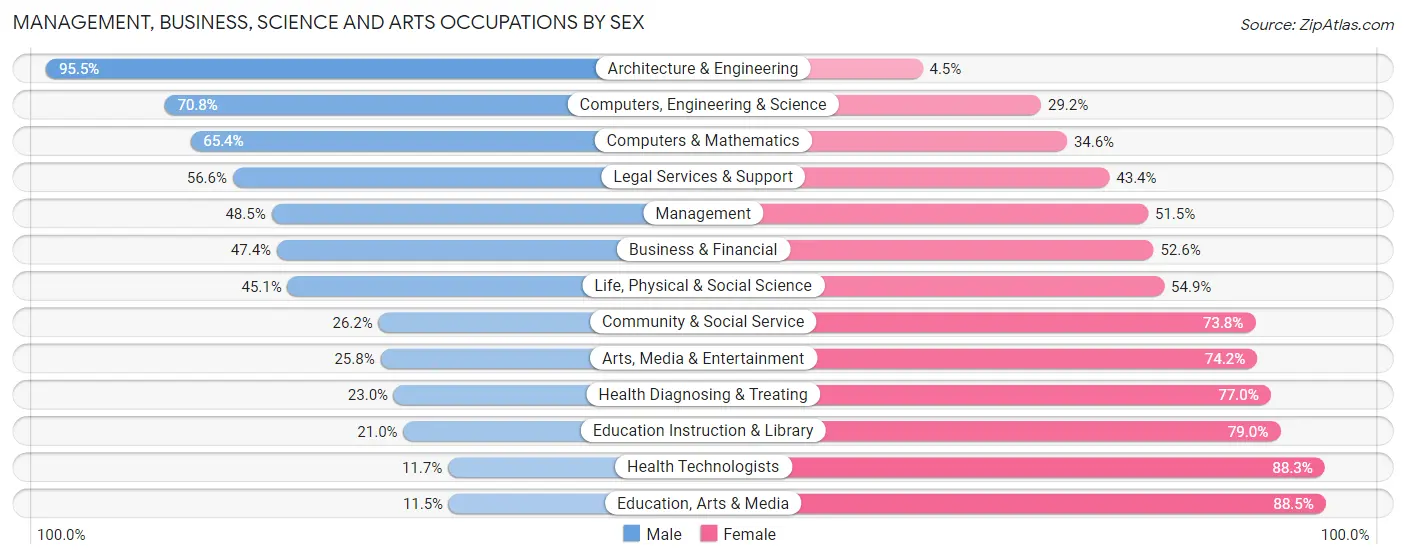
Management, Business, Science and Arts Occupations by Sex
Within the Management, Business, Science and Arts occupations in Fairview, the most male-oriented occupations are Architecture & Engineering (95.5%), Computers, Engineering & Science (70.8%), and Computers & Mathematics (65.4%), while the most female-oriented occupations are Education, Arts & Media (88.5%), Health Technologists (88.3%), and Education Instruction & Library (79.0%).
| Occupation | Male | Female |
| Management | 324 (48.5%) | 344 (51.5%) |
| Business & Financial | 153 (47.4%) | 170 (52.6%) |
| Computers, Engineering & Science | 415 (70.8%) | 171 (29.2%) |
| Computers & Mathematics | 157 (65.4%) | 83 (34.6%) |
| Architecture & Engineering | 193 (95.5%) | 9 (4.5%) |
| Life, Physical & Social Science | 65 (45.1%) | 79 (54.9%) |
| Community & Social Service | 151 (26.2%) | 426 (73.8%) |
| Education, Arts & Media | 14 (11.5%) | 108 (88.5%) |
| Legal Services & Support | 56 (56.6%) | 43 (43.4%) |
| Education Instruction & Library | 47 (21.0%) | 177 (79.0%) |
| Arts, Media & Entertainment | 34 (25.8%) | 98 (74.2%) |
| Health Diagnosing & Treating | 93 (23.0%) | 312 (77.0%) |
| Health Technologists | 39 (11.7%) | 295 (88.3%) |
| Total (Category) | 1,136 (44.4%) | 1,423 (55.6%) |
| Total (Overall) | 2,842 (51.6%) | 2,668 (48.4%) |
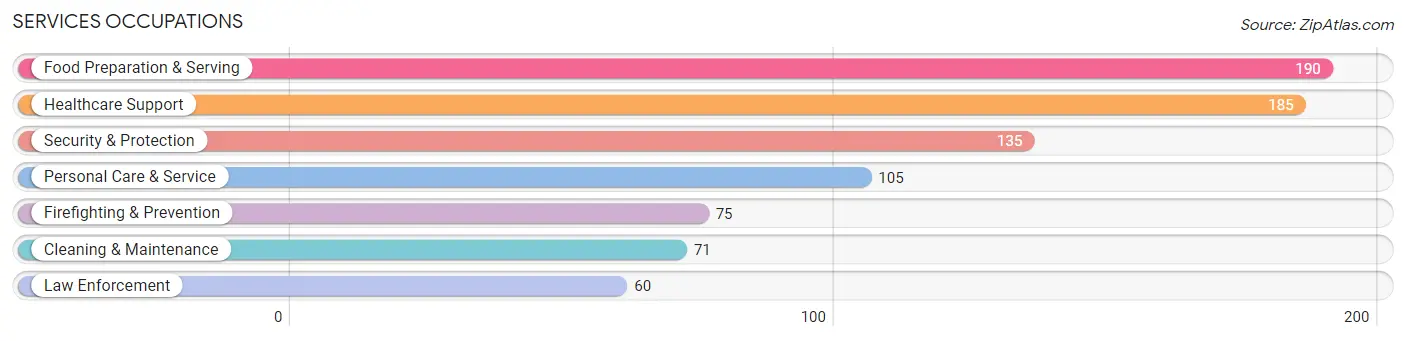
Services Occupations
The most common Services occupations in Fairview are Food Preparation & Serving (190 | 3.5%), Healthcare Support (185 | 3.4%), Security & Protection (135 | 2.5%), Personal Care & Service (105 | 1.9%), and Firefighting & Prevention (75 | 1.4%).
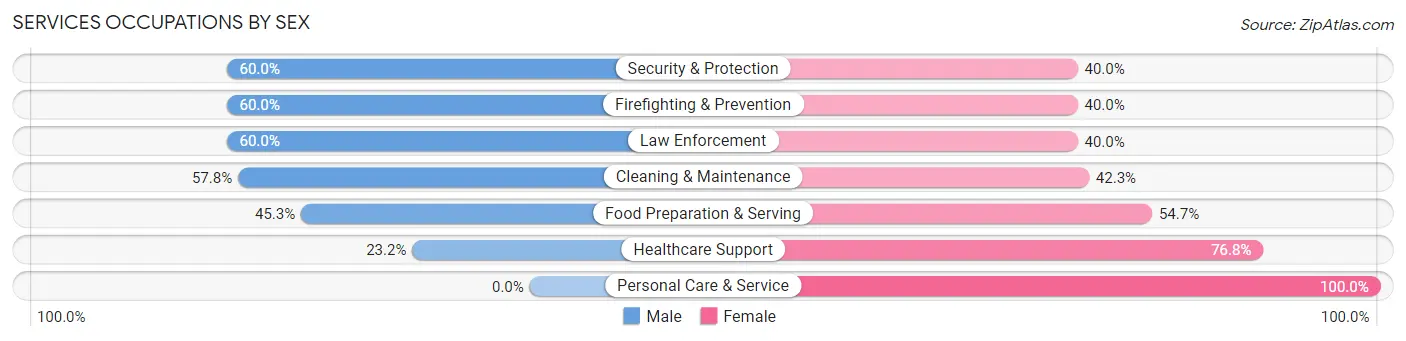
Services Occupations by Sex
Within the Services occupations in Fairview, the most male-oriented occupations are Security & Protection (60.0%), Firefighting & Prevention (60.0%), and Law Enforcement (60.0%), while the most female-oriented occupations are Personal Care & Service (100.0%), Healthcare Support (76.8%), and Food Preparation & Serving (54.7%).
| Occupation | Male | Female |
| Healthcare Support | 43 (23.2%) | 142 (76.8%) |
| Security & Protection | 81 (60.0%) | 54 (40.0%) |
| Firefighting & Prevention | 45 (60.0%) | 30 (40.0%) |
| Law Enforcement | 36 (60.0%) | 24 (40.0%) |
| Food Preparation & Serving | 86 (45.3%) | 104 (54.7%) |
| Cleaning & Maintenance | 41 (57.8%) | 30 (42.2%) |
| Personal Care & Service | 0 (0.0%) | 105 (100.0%) |
| Total (Category) | 251 (36.6%) | 435 (63.4%) |
| Total (Overall) | 2,842 (51.6%) | 2,668 (48.4%) |
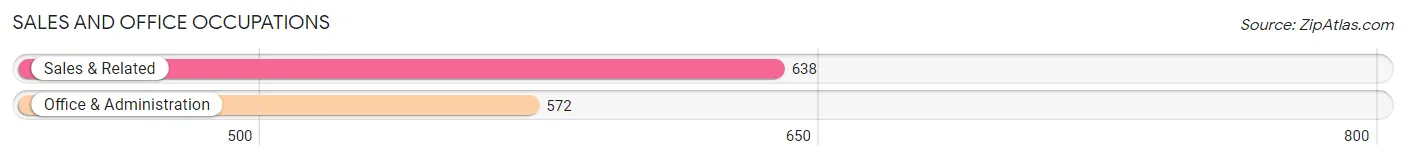
Sales and Office Occupations
The most common Sales and Office occupations in Fairview are Sales & Related (638 | 11.6%), and Office & Administration (572 | 10.4%).
Sales and Office Occupations by Sex
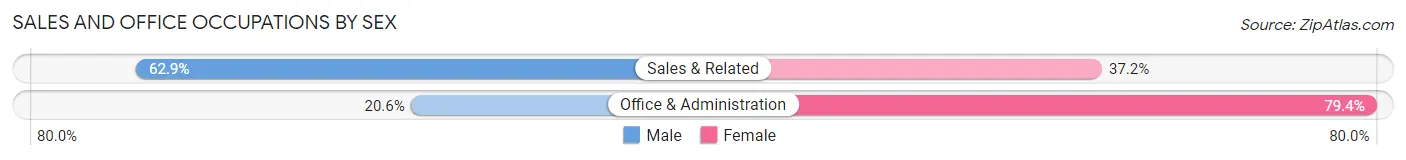
| Occupation | Male | Female |
| Sales & Related | 401 (62.8%) | 237 (37.1%) |
| Office & Administration | 118 (20.6%) | 454 (79.4%) |
| Total (Category) | 519 (42.9%) | 691 (57.1%) |
| Total (Overall) | 2,842 (51.6%) | 2,668 (48.4%) |
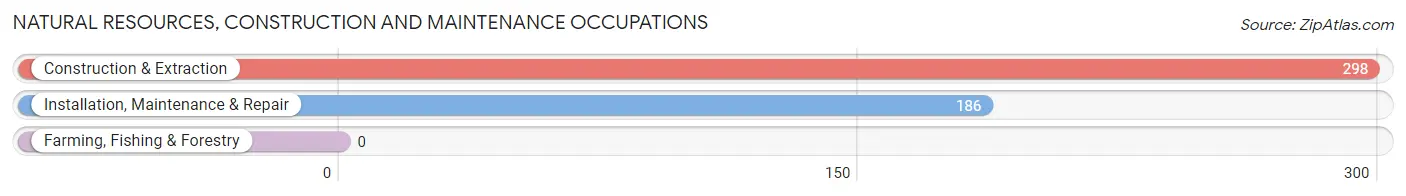
Natural Resources, Construction and Maintenance Occupations
The most common Natural Resources, Construction and Maintenance occupations in Fairview are Construction & Extraction (298 | 5.4%), and Installation, Maintenance & Repair (186 | 3.4%).
Natural Resources, Construction and Maintenance Occupations by Sex
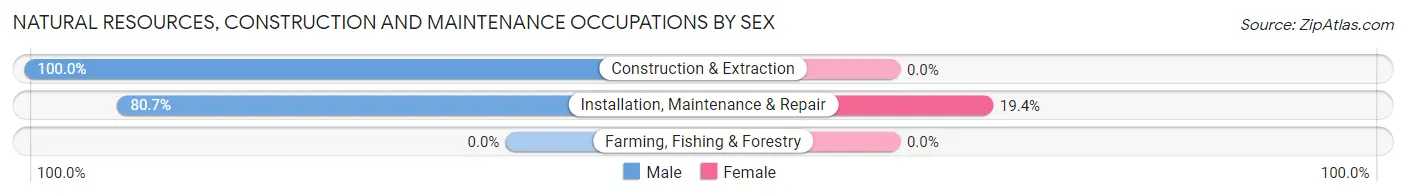
| Occupation | Male | Female |
| Farming, Fishing & Forestry | 0 (0.0%) | 0 (0.0%) |
| Construction & Extraction | 298 (100.0%) | 0 (0.0%) |
| Installation, Maintenance & Repair | 150 (80.6%) | 36 (19.4%) |
| Total (Category) | 448 (92.6%) | 36 (7.4%) |
| Total (Overall) | 2,842 (51.6%) | 2,668 (48.4%) |
Production, Transportation and Moving Occupations
The most common Production, Transportation and Moving occupations in Fairview are Production (251 | 4.6%), Transportation (244 | 4.4%), and Material Moving (76 | 1.4%).
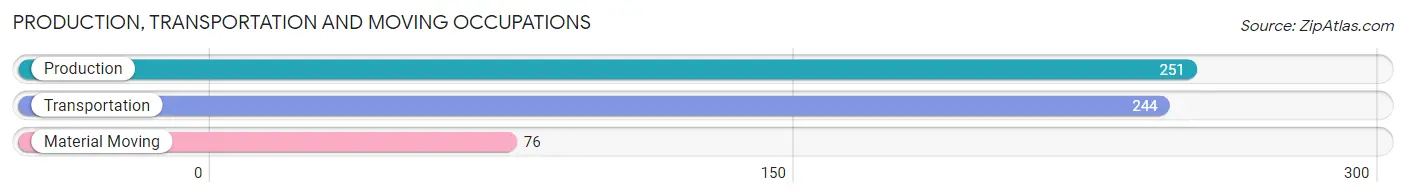
Production, Transportation and Moving Occupations by Sex
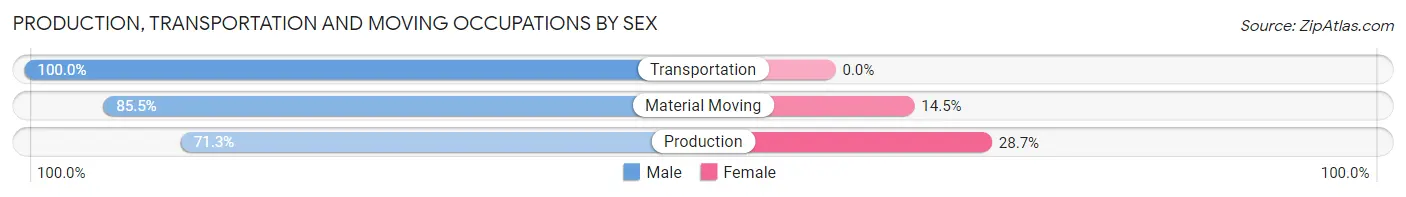
| Occupation | Male | Female |
| Production | 179 (71.3%) | 72 (28.7%) |
| Transportation | 244 (100.0%) | 0 (0.0%) |
| Material Moving | 65 (85.5%) | 11 (14.5%) |
| Total (Category) | 488 (85.5%) | 83 (14.5%) |
| Total (Overall) | 2,842 (51.6%) | 2,668 (48.4%) |
Employment Industries by Sex in Fairview
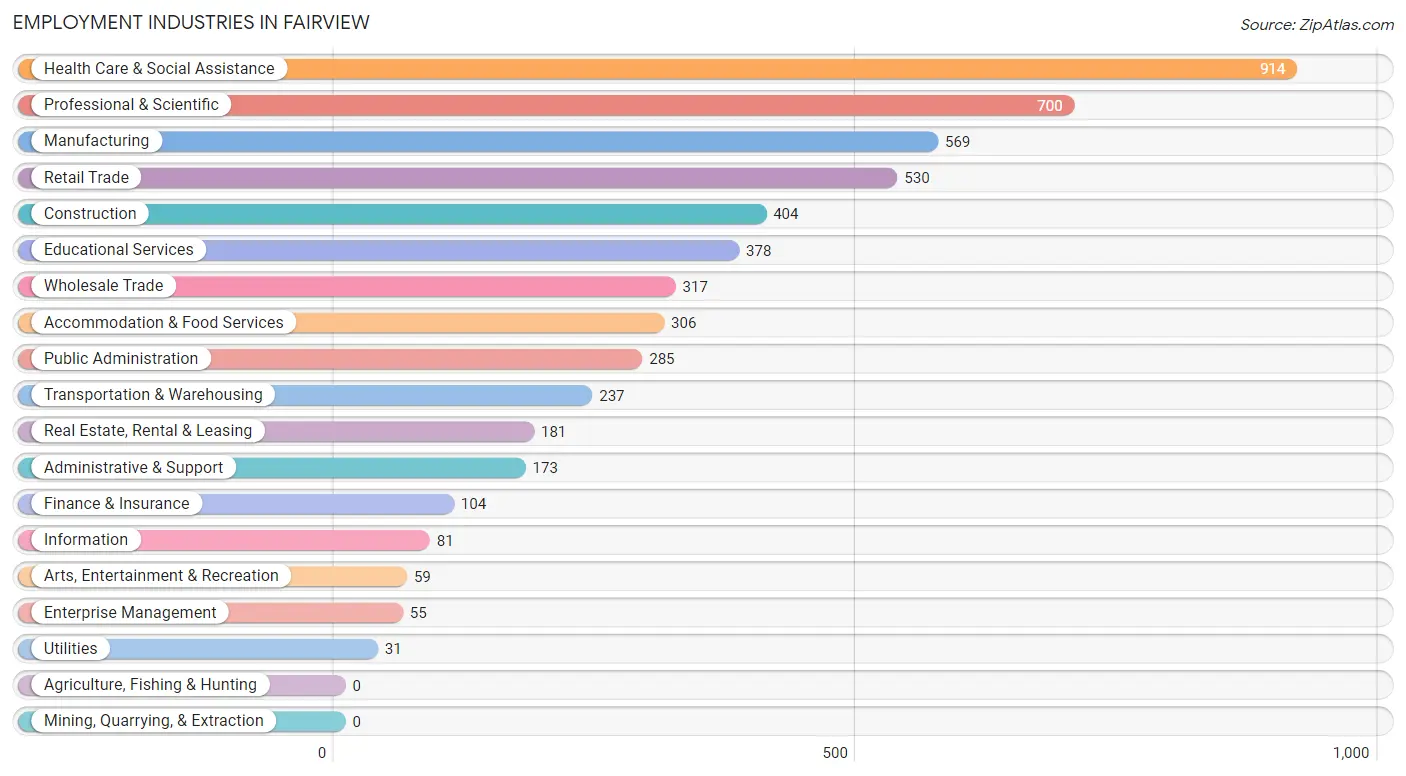
Employment Industries in Fairview
The major employment industries in Fairview include Health Care & Social Assistance (914 | 16.6%), Professional & Scientific (700 | 12.7%), Manufacturing (569 | 10.3%), Retail Trade (530 | 9.6%), and Construction (404 | 7.3%).
Employment Industries by Sex in Fairview
The Fairview industries that see more men than women are Enterprise Management (100.0%), Construction (87.9%), and Finance & Insurance (82.7%), whereas the industries that tend to have a higher number of women are Health Care & Social Assistance (76.0%), Educational Services (75.9%), and Utilities (67.7%).
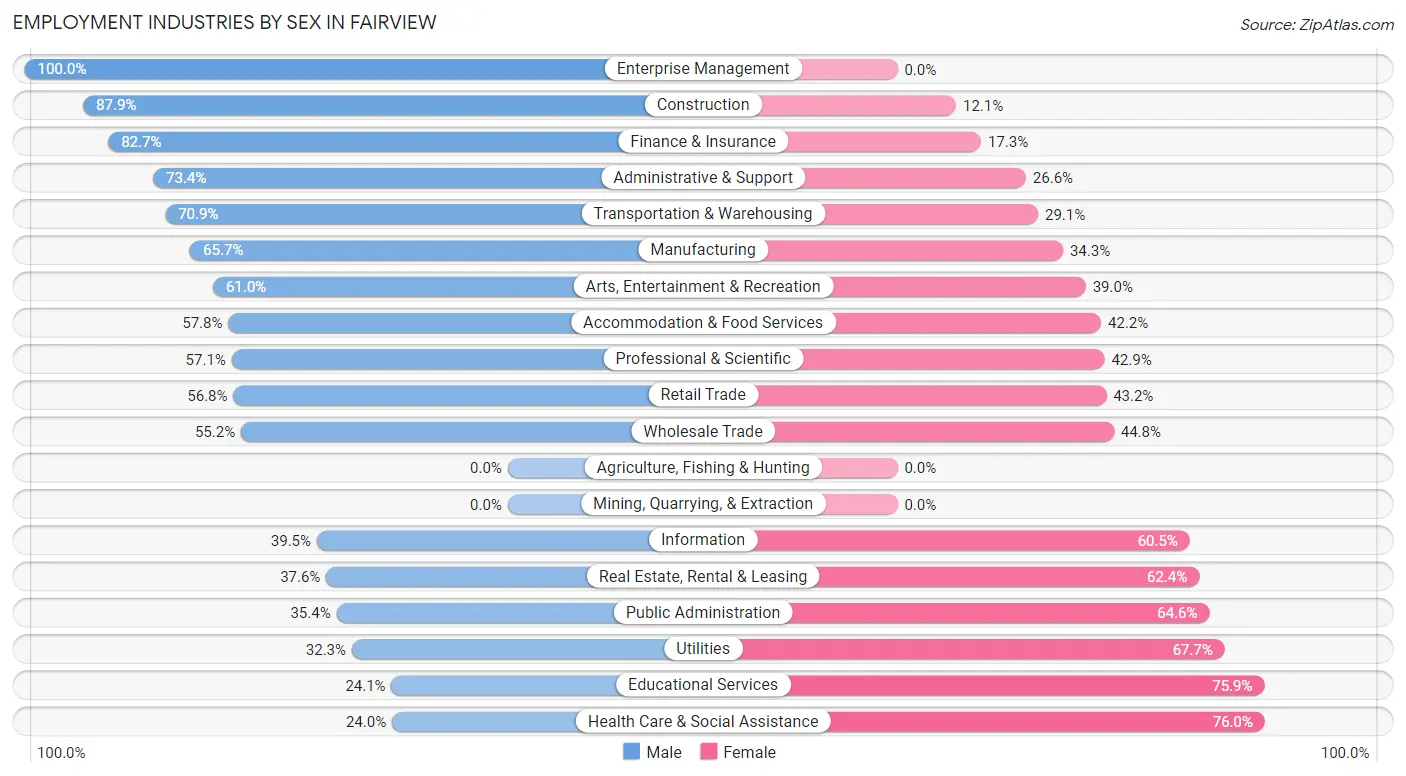
| Industry | Male | Female |
| Agriculture, Fishing & Hunting | 0 (0.0%) | 0 (0.0%) |
| Mining, Quarrying, & Extraction | 0 (0.0%) | 0 (0.0%) |
| Construction | 355 (87.9%) | 49 (12.1%) |
| Manufacturing | 374 (65.7%) | 195 (34.3%) |
| Wholesale Trade | 175 (55.2%) | 142 (44.8%) |
| Retail Trade | 301 (56.8%) | 229 (43.2%) |
| Transportation & Warehousing | 168 (70.9%) | 69 (29.1%) |
| Utilities | 10 (32.3%) | 21 (67.7%) |
| Information | 32 (39.5%) | 49 (60.5%) |
| Finance & Insurance | 86 (82.7%) | 18 (17.3%) |
| Real Estate, Rental & Leasing | 68 (37.6%) | 113 (62.4%) |
| Professional & Scientific | 400 (57.1%) | 300 (42.9%) |
| Enterprise Management | 55 (100.0%) | 0 (0.0%) |
| Administrative & Support | 127 (73.4%) | 46 (26.6%) |
| Educational Services | 91 (24.1%) | 287 (75.9%) |
| Health Care & Social Assistance | 219 (24.0%) | 695 (76.0%) |
| Arts, Entertainment & Recreation | 36 (61.0%) | 23 (39.0%) |
| Accommodation & Food Services | 177 (57.8%) | 129 (42.2%) |
| Public Administration | 101 (35.4%) | 184 (64.6%) |
| Total | 2,842 (51.6%) | 2,668 (48.4%) |
Education in Fairview
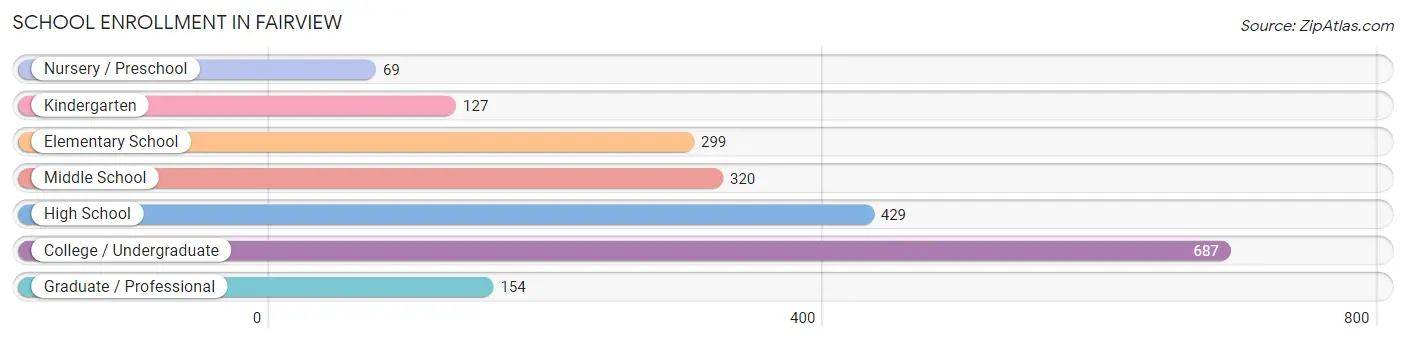
School Enrollment in Fairview
The most common levels of schooling among the 2,085 students in Fairview are college / undergraduate (687 | 33.0%), high school (429 | 20.6%), and middle school (320 | 15.3%).
| School Level | # Students | % Students |
| Nursery / Preschool | 69 | 3.3% |
| Kindergarten | 127 | 6.1% |
| Elementary School | 299 | 14.3% |
| Middle School | 320 | 15.3% |
| High School | 429 | 20.6% |
| College / Undergraduate | 687 | 33.0% |
| Graduate / Professional | 154 | 7.4% |
| Total | 2,085 | 100.0% |
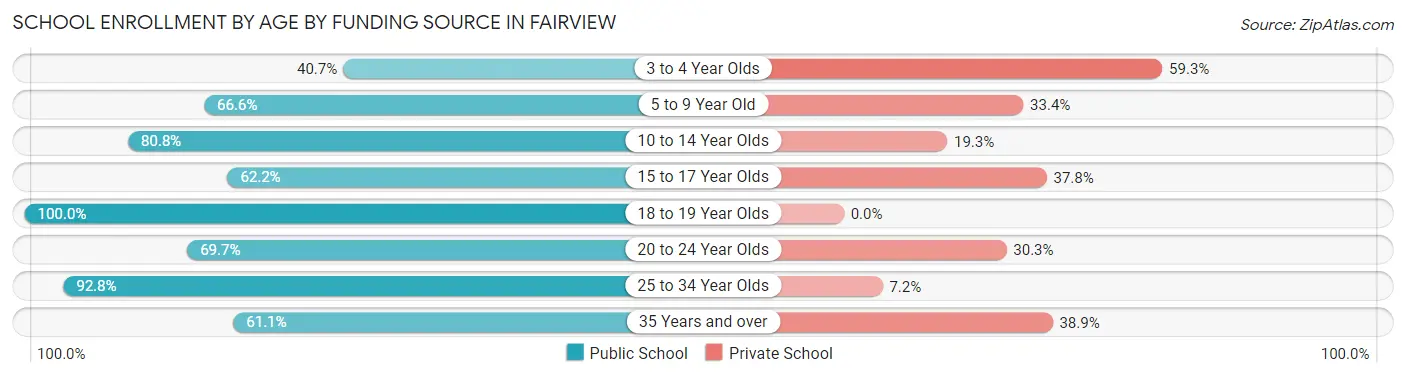
School Enrollment by Age by Funding Source in Fairview
Out of a total of 2,085 students who are enrolled in schools in Fairview, 600 (28.8%) attend a private institution, while the remaining 1,485 (71.2%) are enrolled in public schools. The age group of 3 to 4 year olds has the highest likelihood of being enrolled in private schools, with 35 (59.3% in the age bracket) enrolled. Conversely, the age group of 18 to 19 year olds has the lowest likelihood of being enrolled in a private school, with 167 (100.0% in the age bracket) attending a public institution.
| Age Bracket | Public School | Private School |
| 3 to 4 Year Olds | 24 (40.7%) | 35 (59.3%) |
| 5 to 9 Year Old | 237 (66.6%) | 119 (33.4%) |
| 10 to 14 Year Olds | 344 (80.7%) | 82 (19.3%) |
| 15 to 17 Year Olds | 242 (62.2%) | 147 (37.8%) |
| 18 to 19 Year Olds | 167 (100.0%) | 0 (0.0%) |
| 20 to 24 Year Olds | 161 (69.7%) | 70 (30.3%) |
| 25 to 34 Year Olds | 90 (92.8%) | 7 (7.2%) |
| 35 Years and over | 220 (61.1%) | 140 (38.9%) |
| Total | 1,485 (71.2%) | 600 (28.8%) |
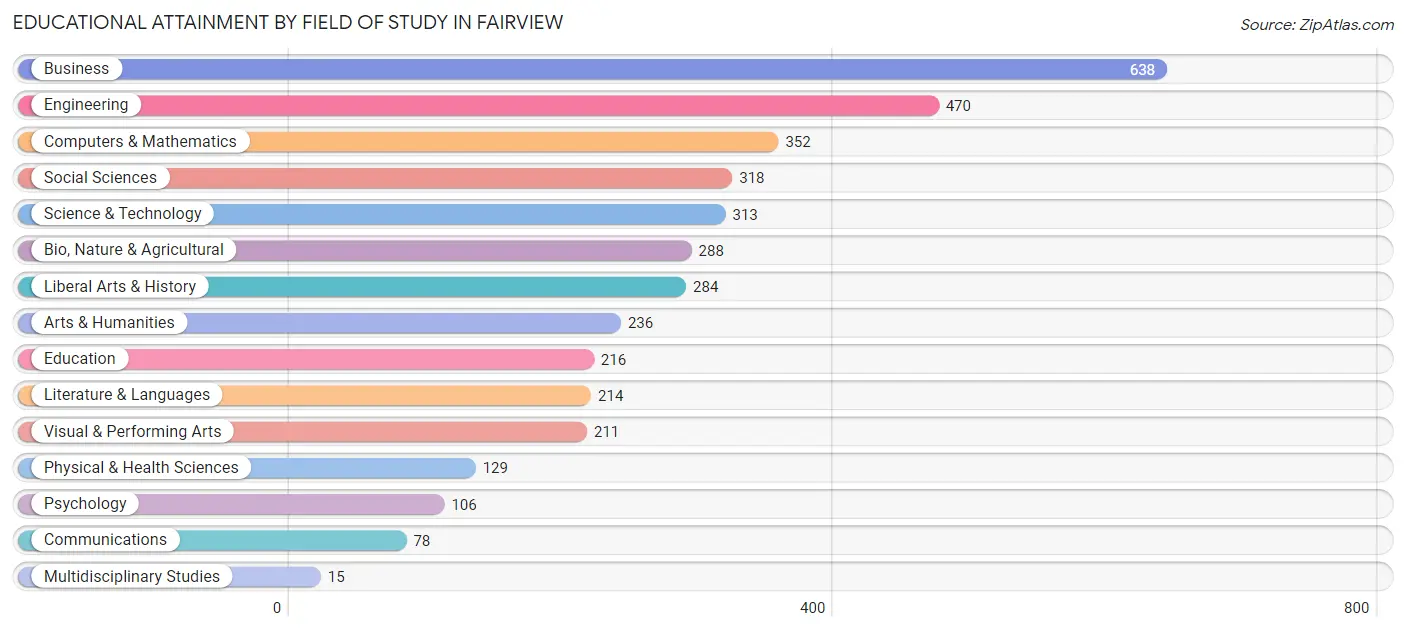
Educational Attainment by Field of Study in Fairview
Business (638 | 16.5%), engineering (470 | 12.1%), computers & mathematics (352 | 9.1%), social sciences (318 | 8.2%), and science & technology (313 | 8.1%) are the most common fields of study among 3,868 individuals in Fairview who have obtained a bachelor's degree or higher.
| Field of Study | # Graduates | % Graduates |
| Computers & Mathematics | 352 | 9.1% |
| Bio, Nature & Agricultural | 288 | 7.4% |
| Physical & Health Sciences | 129 | 3.3% |
| Psychology | 106 | 2.7% |
| Social Sciences | 318 | 8.2% |
| Engineering | 470 | 12.1% |
| Multidisciplinary Studies | 15 | 0.4% |
| Science & Technology | 313 | 8.1% |
| Business | 638 | 16.5% |
| Education | 216 | 5.6% |
| Literature & Languages | 214 | 5.5% |
| Liberal Arts & History | 284 | 7.3% |
| Visual & Performing Arts | 211 | 5.5% |
| Communications | 78 | 2.0% |
| Arts & Humanities | 236 | 6.1% |
| Total | 3,868 | 100.0% |
Transportation & Commute in Fairview
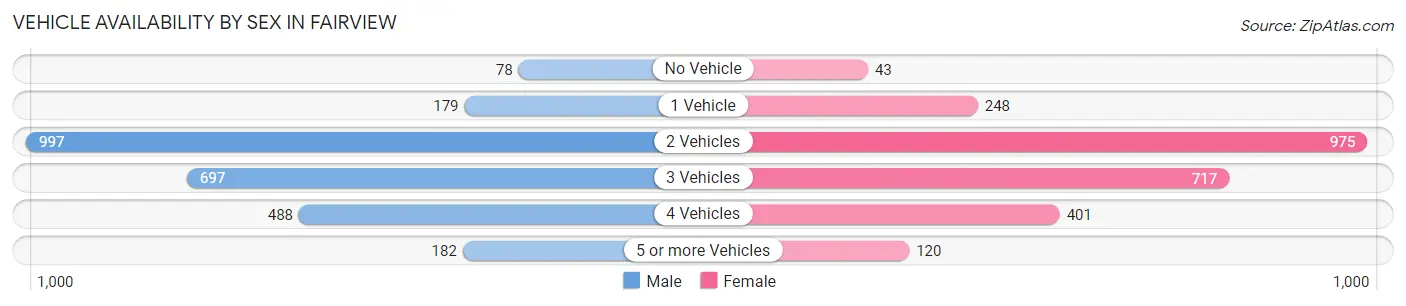
Vehicle Availability by Sex in Fairview
The most prevalent vehicle ownership categories in Fairview are males with 2 vehicles (997, accounting for 38.0%) and females with 2 vehicles (975, making up 39.8%).
| Vehicles Available | Male | Female |
| No Vehicle | 78 (3.0%) | 43 (1.7%) |
| 1 Vehicle | 179 (6.8%) | 248 (9.9%) |
| 2 Vehicles | 997 (38.0%) | 975 (38.9%) |
| 3 Vehicles | 697 (26.6%) | 717 (28.6%) |
| 4 Vehicles | 488 (18.6%) | 401 (16.0%) |
| 5 or more Vehicles | 182 (6.9%) | 120 (4.8%) |
| Total | 2,621 (100.0%) | 2,504 (100.0%) |
Commute Time in Fairview
The most frequently occuring commute durations in Fairview are 60 to 89 minutes (669 commuters, 15.6%), 20 to 24 minutes (622 commuters, 14.5%), and 15 to 19 minutes (621 commuters, 14.5%).
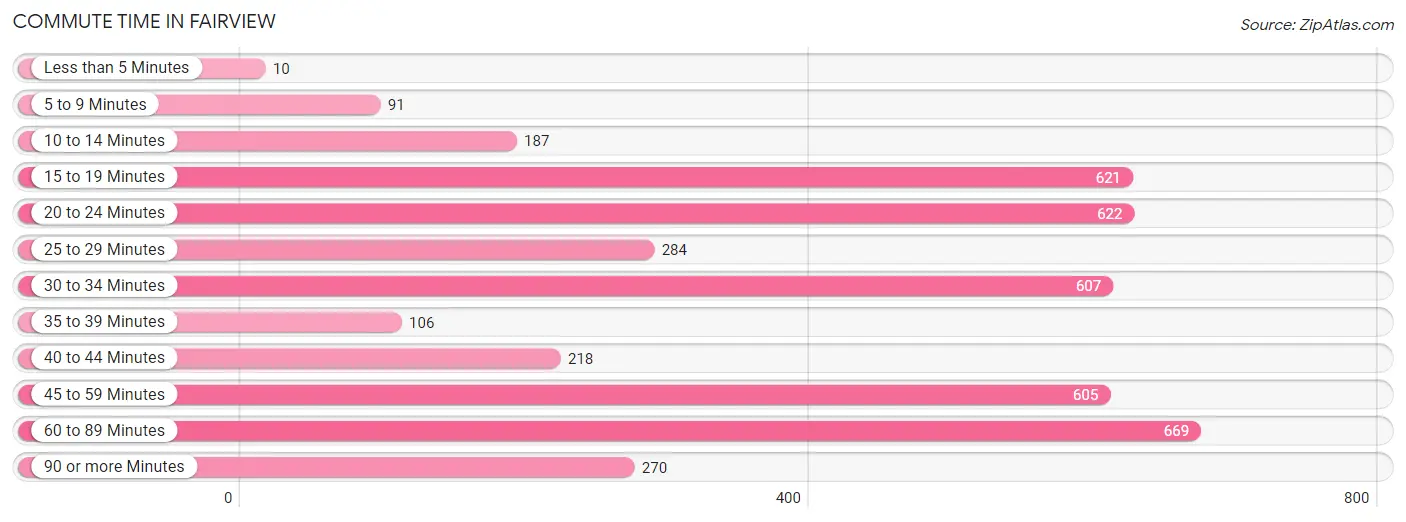
| Commute Time | # Commuters | % Commuters |
| Less than 5 Minutes | 10 | 0.2% |
| 5 to 9 Minutes | 91 | 2.1% |
| 10 to 14 Minutes | 187 | 4.4% |
| 15 to 19 Minutes | 621 | 14.5% |
| 20 to 24 Minutes | 622 | 14.5% |
| 25 to 29 Minutes | 284 | 6.6% |
| 30 to 34 Minutes | 607 | 14.1% |
| 35 to 39 Minutes | 106 | 2.5% |
| 40 to 44 Minutes | 218 | 5.1% |
| 45 to 59 Minutes | 605 | 14.1% |
| 60 to 89 Minutes | 669 | 15.6% |
| 90 or more Minutes | 270 | 6.3% |
Commute Time by Sex in Fairview
The most common commute times in Fairview are 60 to 89 minutes (420 commuters, 18.9%) for males and 30 to 34 minutes (416 commuters, 20.1%) for females.
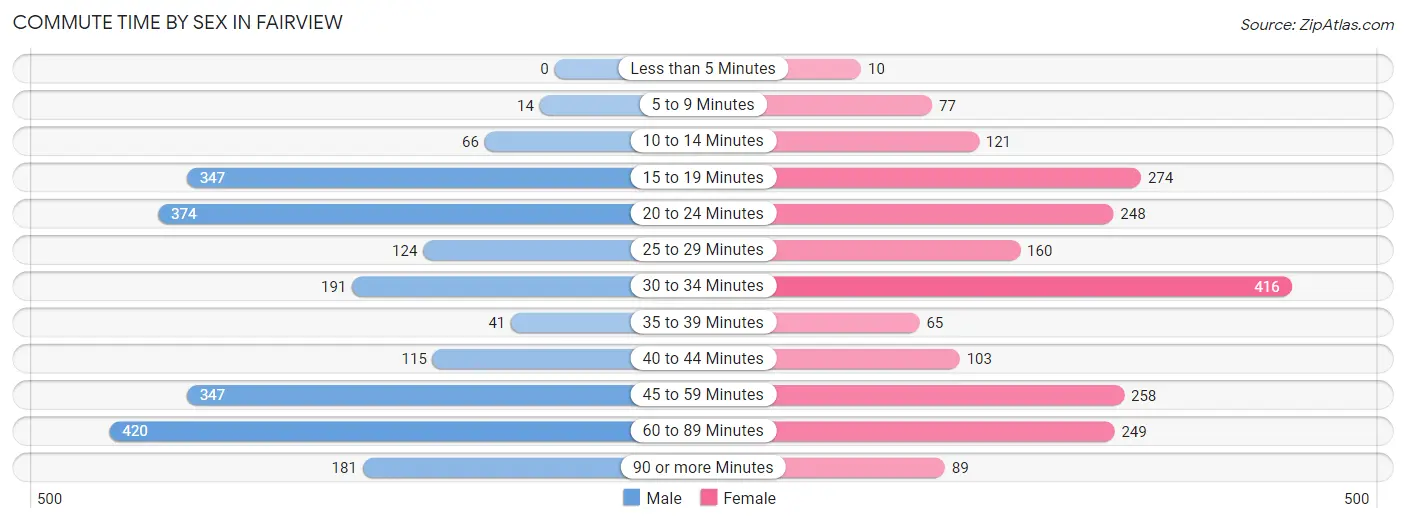
| Commute Time | Male | Female |
| Less than 5 Minutes | 0 (0.0%) | 10 (0.5%) |
| 5 to 9 Minutes | 14 (0.6%) | 77 (3.7%) |
| 10 to 14 Minutes | 66 (3.0%) | 121 (5.9%) |
| 15 to 19 Minutes | 347 (15.6%) | 274 (13.2%) |
| 20 to 24 Minutes | 374 (16.9%) | 248 (12.0%) |
| 25 to 29 Minutes | 124 (5.6%) | 160 (7.7%) |
| 30 to 34 Minutes | 191 (8.6%) | 416 (20.1%) |
| 35 to 39 Minutes | 41 (1.8%) | 65 (3.1%) |
| 40 to 44 Minutes | 115 (5.2%) | 103 (5.0%) |
| 45 to 59 Minutes | 347 (15.6%) | 258 (12.5%) |
| 60 to 89 Minutes | 420 (18.9%) | 249 (12.0%) |
| 90 or more Minutes | 181 (8.2%) | 89 (4.3%) |
Time of Departure to Work by Sex in Fairview
The most frequent times of departure to work in Fairview are 7:00 AM to 7:29 AM (450, 20.3%) for males and 7:00 AM to 7:29 AM (265, 12.8%) for females.
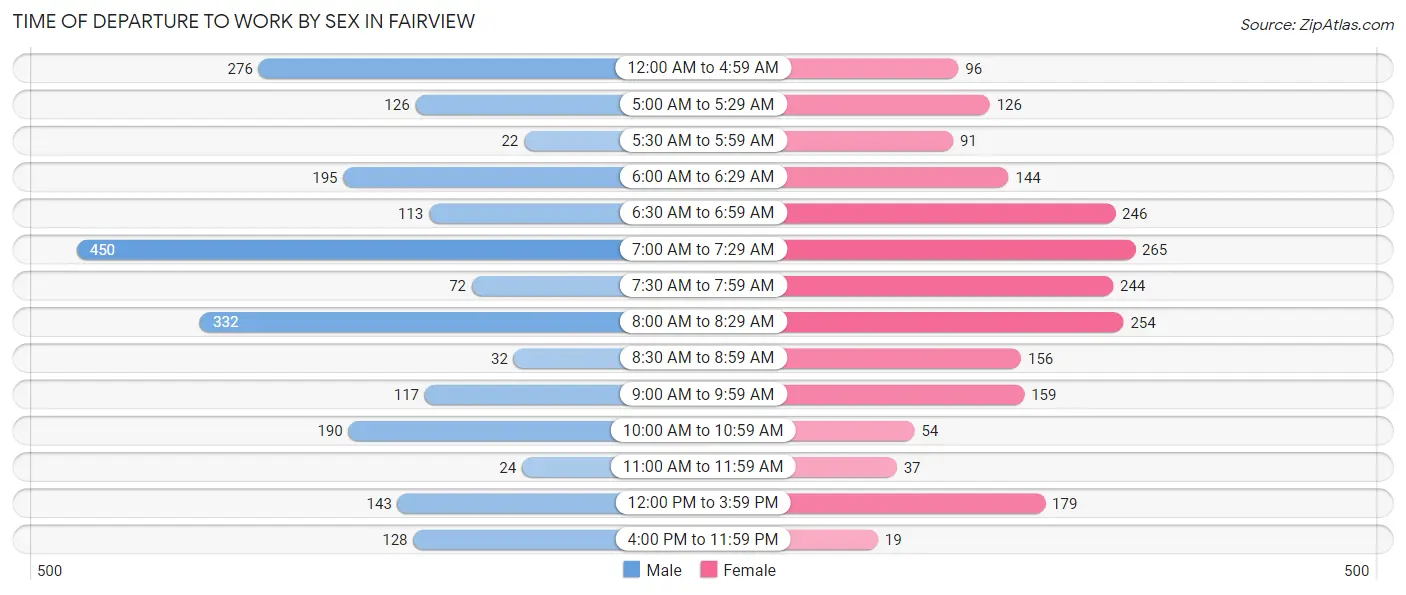
| Time of Departure | Male | Female |
| 12:00 AM to 4:59 AM | 276 (12.4%) | 96 (4.6%) |
| 5:00 AM to 5:29 AM | 126 (5.7%) | 126 (6.1%) |
| 5:30 AM to 5:59 AM | 22 (1.0%) | 91 (4.4%) |
| 6:00 AM to 6:29 AM | 195 (8.8%) | 144 (7.0%) |
| 6:30 AM to 6:59 AM | 113 (5.1%) | 246 (11.9%) |
| 7:00 AM to 7:29 AM | 450 (20.3%) | 265 (12.8%) |
| 7:30 AM to 7:59 AM | 72 (3.2%) | 244 (11.8%) |
| 8:00 AM to 8:29 AM | 332 (14.9%) | 254 (12.3%) |
| 8:30 AM to 8:59 AM | 32 (1.4%) | 156 (7.5%) |
| 9:00 AM to 9:59 AM | 117 (5.3%) | 159 (7.7%) |
| 10:00 AM to 10:59 AM | 190 (8.6%) | 54 (2.6%) |
| 11:00 AM to 11:59 AM | 24 (1.1%) | 37 (1.8%) |
| 12:00 PM to 3:59 PM | 143 (6.4%) | 179 (8.6%) |
| 4:00 PM to 11:59 PM | 128 (5.8%) | 19 (0.9%) |
| Total | 2,220 (100.0%) | 2,070 (100.0%) |
Housing Occupancy in Fairview
Occupancy by Ownership in Fairview
Of the total 3,570 dwellings in Fairview, owner-occupied units account for 2,945 (82.5%), while renter-occupied units make up 625 (17.5%).
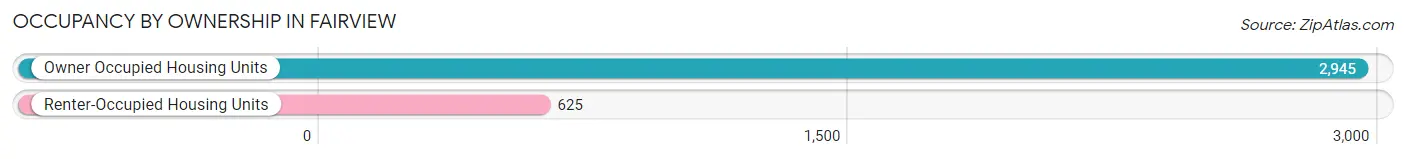
| Occupancy | # Housing Units | % Housing Units |
| Owner Occupied Housing Units | 2,945 | 82.5% |
| Renter-Occupied Housing Units | 625 | 17.5% |
| Total Occupied Housing Units | 3,570 | 100.0% |
Occupancy by Household Size in Fairview
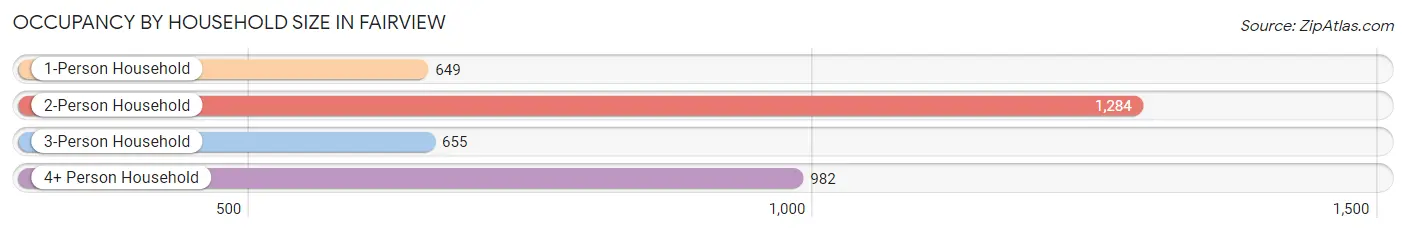
| Household Size | # Housing Units | % Housing Units |
| 1-Person Household | 649 | 18.2% |
| 2-Person Household | 1,284 | 36.0% |
| 3-Person Household | 655 | 18.3% |
| 4+ Person Household | 982 | 27.5% |
| Total Housing Units | 3,570 | 100.0% |
Occupancy by Ownership by Household Size in Fairview
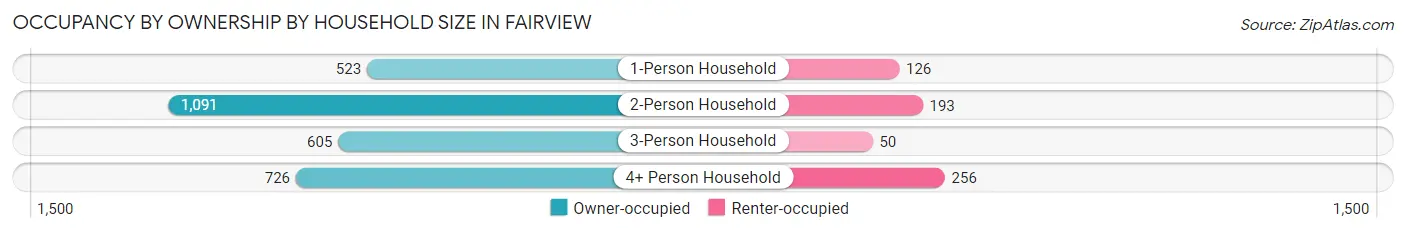
| Household Size | Owner-occupied | Renter-occupied |
| 1-Person Household | 523 (80.6%) | 126 (19.4%) |
| 2-Person Household | 1,091 (85.0%) | 193 (15.0%) |
| 3-Person Household | 605 (92.4%) | 50 (7.6%) |
| 4+ Person Household | 726 (73.9%) | 256 (26.1%) |
| Total Housing Units | 2,945 (82.5%) | 625 (17.5%) |
Occupancy by Educational Attainment in Fairview
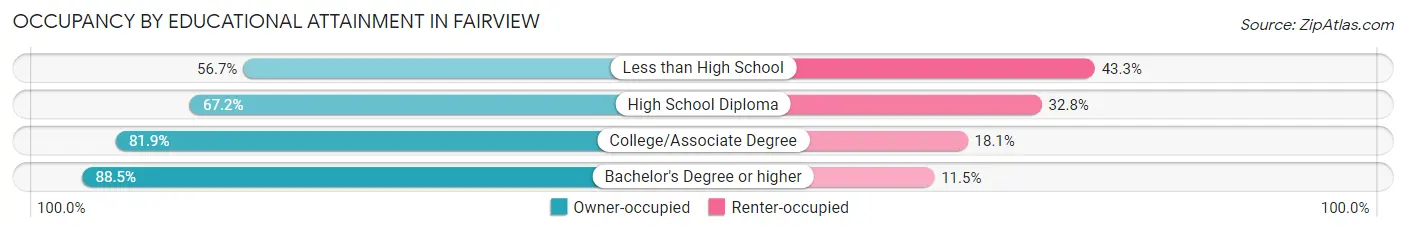
| Household Size | Owner-occupied | Renter-occupied |
| Less than High School | 85 (56.7%) | 65 (43.3%) |
| High School Diploma | 301 (67.2%) | 147 (32.8%) |
| College/Associate Degree | 876 (81.9%) | 194 (18.1%) |
| Bachelor's Degree or higher | 1,683 (88.5%) | 219 (11.5%) |
Occupancy by Age of Householder in Fairview
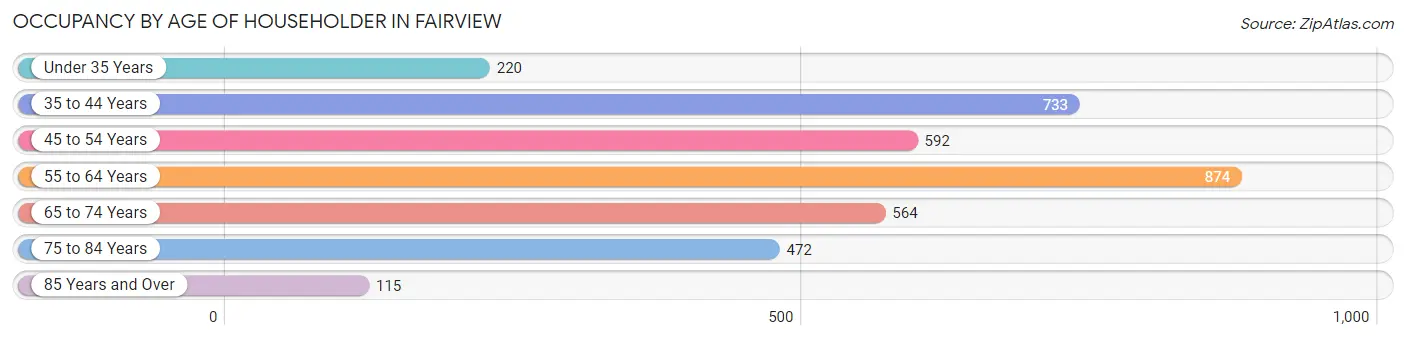
| Age Bracket | # Households | % Households |
| Under 35 Years | 220 | 6.2% |
| 35 to 44 Years | 733 | 20.5% |
| 45 to 54 Years | 592 | 16.6% |
| 55 to 64 Years | 874 | 24.5% |
| 65 to 74 Years | 564 | 15.8% |
| 75 to 84 Years | 472 | 13.2% |
| 85 Years and Over | 115 | 3.2% |
| Total | 3,570 | 100.0% |
Housing Finances in Fairview
Median Income by Occupancy in Fairview
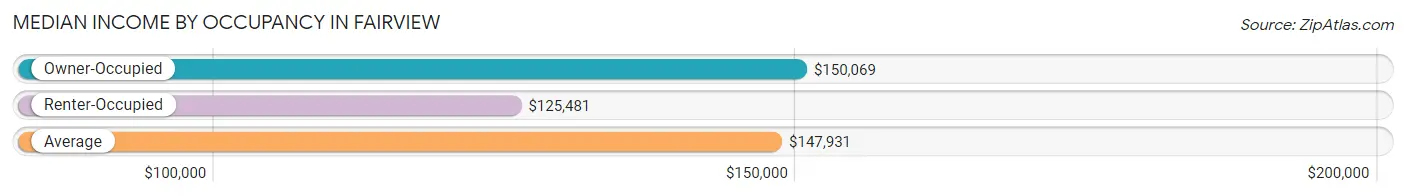
| Occupancy Type | # Households | Median Income |
| Owner-Occupied | 2,945 (82.5%) | $150,069 |
| Renter-Occupied | 625 (17.5%) | $125,481 |
| Average | 3,570 (100.0%) | $147,931 |
Occupancy by Householder Income Bracket in Fairview
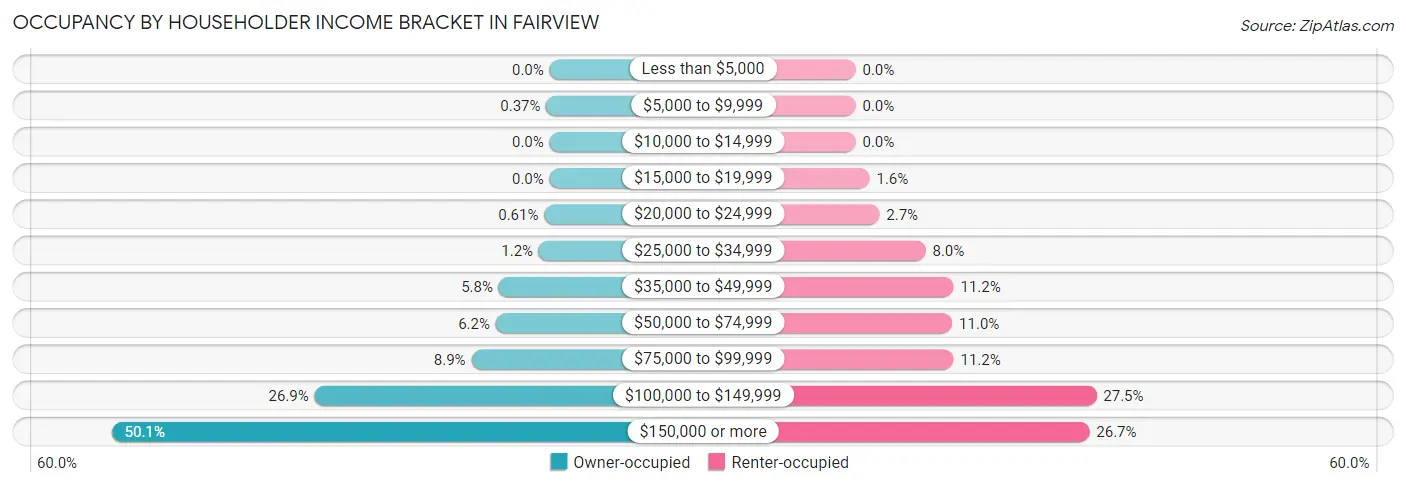
| Income Bracket | Owner-occupied | Renter-occupied |
| Less than $5,000 | 0 (0.0%) | 0 (0.0%) |
| $5,000 to $9,999 | 11 (0.4%) | 0 (0.0%) |
| $10,000 to $14,999 | 0 (0.0%) | 0 (0.0%) |
| $15,000 to $19,999 | 0 (0.0%) | 10 (1.6%) |
| $20,000 to $24,999 | 18 (0.6%) | 17 (2.7%) |
| $25,000 to $34,999 | 36 (1.2%) | 50 (8.0%) |
| $35,000 to $49,999 | 171 (5.8%) | 70 (11.2%) |
| $50,000 to $74,999 | 181 (6.1%) | 69 (11.0%) |
| $75,000 to $99,999 | 263 (8.9%) | 70 (11.2%) |
| $100,000 to $149,999 | 791 (26.9%) | 172 (27.5%) |
| $150,000 or more | 1,474 (50.0%) | 167 (26.7%) |
| Total | 2,945 (100.0%) | 625 (100.0%) |
Monthly Housing Cost Tiers in Fairview
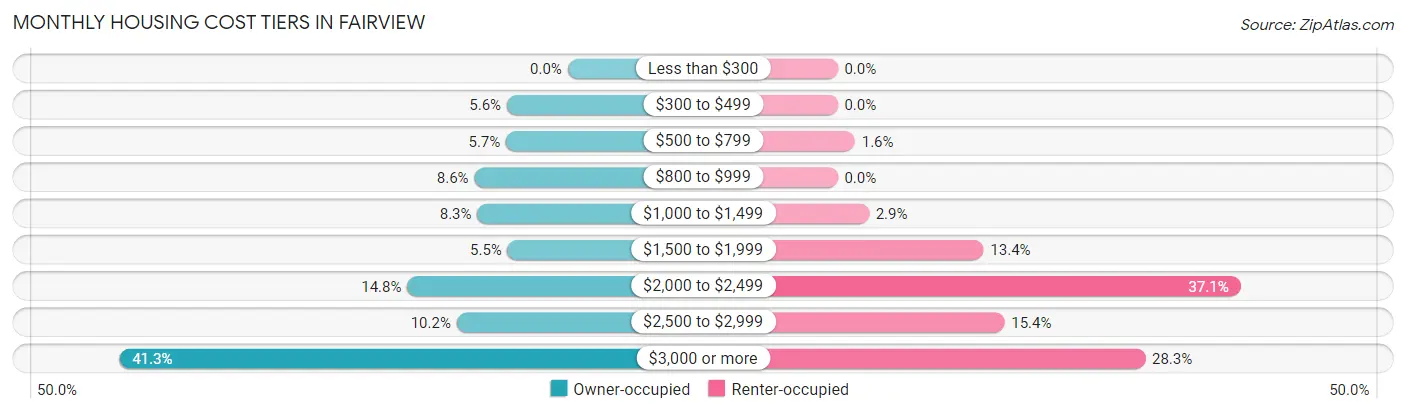
| Monthly Cost | Owner-occupied | Renter-occupied |
| Less than $300 | 0 (0.0%) | 0 (0.0%) |
| $300 to $499 | 165 (5.6%) | 0 (0.0%) |
| $500 to $799 | 167 (5.7%) | 10 (1.6%) |
| $800 to $999 | 253 (8.6%) | 0 (0.0%) |
| $1,000 to $1,499 | 245 (8.3%) | 18 (2.9%) |
| $1,500 to $1,999 | 163 (5.5%) | 84 (13.4%) |
| $2,000 to $2,499 | 435 (14.8%) | 232 (37.1%) |
| $2,500 to $2,999 | 301 (10.2%) | 96 (15.4%) |
| $3,000 or more | 1,216 (41.3%) | 177 (28.3%) |
| Total | 2,945 (100.0%) | 625 (100.0%) |
Physical Housing Characteristics in Fairview
Housing Structures in Fairview
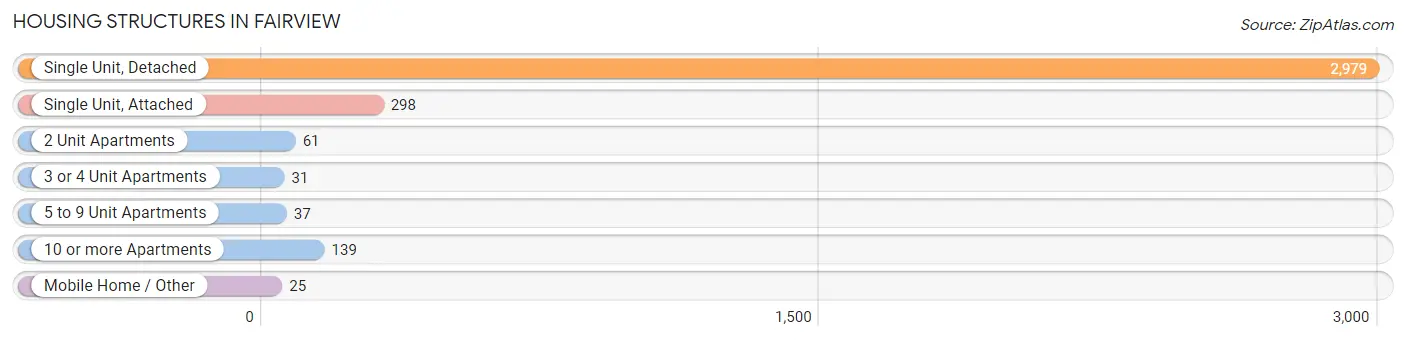
| Structure Type | # Housing Units | % Housing Units |
| Single Unit, Detached | 2,979 | 83.5% |
| Single Unit, Attached | 298 | 8.4% |
| 2 Unit Apartments | 61 | 1.7% |
| 3 or 4 Unit Apartments | 31 | 0.9% |
| 5 to 9 Unit Apartments | 37 | 1.0% |
| 10 or more Apartments | 139 | 3.9% |
| Mobile Home / Other | 25 | 0.7% |
| Total | 3,570 | 100.0% |
Housing Structures by Occupancy in Fairview
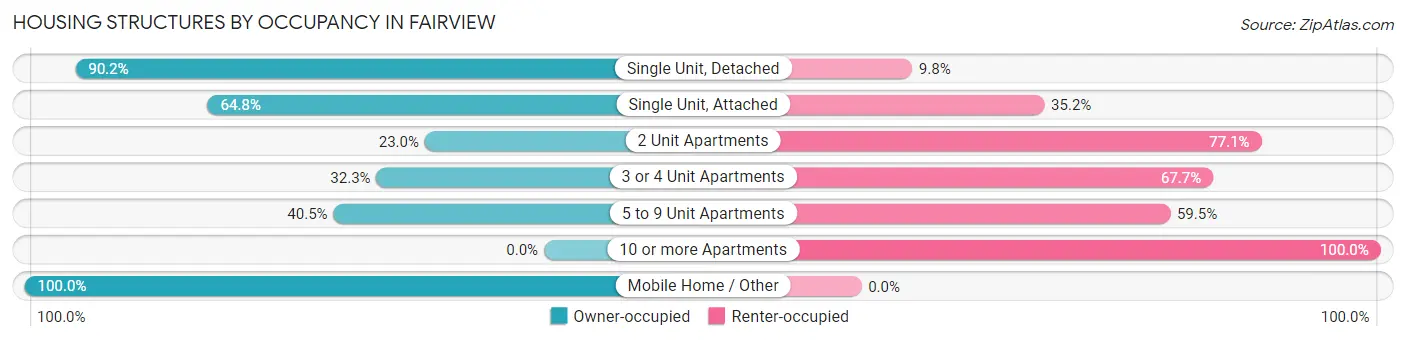
| Structure Type | Owner-occupied | Renter-occupied |
| Single Unit, Detached | 2,688 (90.2%) | 291 (9.8%) |
| Single Unit, Attached | 193 (64.8%) | 105 (35.2%) |
| 2 Unit Apartments | 14 (23.0%) | 47 (77.0%) |
| 3 or 4 Unit Apartments | 10 (32.3%) | 21 (67.7%) |
| 5 to 9 Unit Apartments | 15 (40.5%) | 22 (59.5%) |
| 10 or more Apartments | 0 (0.0%) | 139 (100.0%) |
| Mobile Home / Other | 25 (100.0%) | 0 (0.0%) |
| Total | 2,945 (82.5%) | 625 (17.5%) |
Housing Structures by Number of Rooms in Fairview
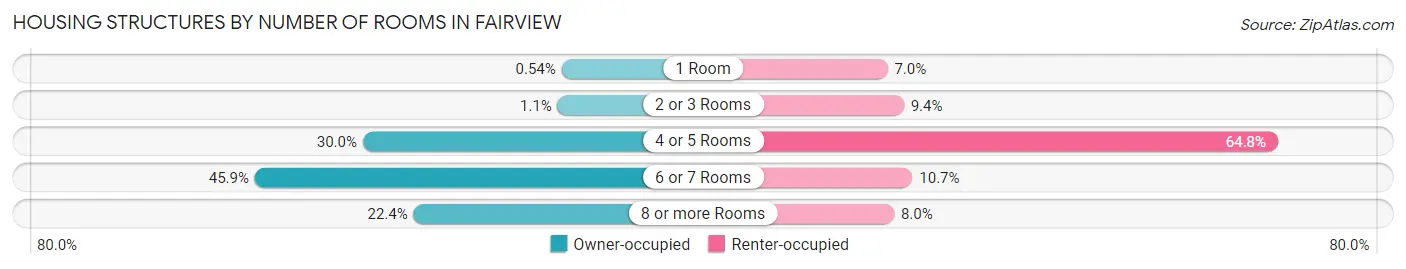
| Number of Rooms | Owner-occupied | Renter-occupied |
| 1 Room | 16 (0.5%) | 44 (7.0%) |
| 2 or 3 Rooms | 33 (1.1%) | 59 (9.4%) |
| 4 or 5 Rooms | 882 (29.9%) | 405 (64.8%) |
| 6 or 7 Rooms | 1,353 (45.9%) | 67 (10.7%) |
| 8 or more Rooms | 661 (22.4%) | 50 (8.0%) |
| Total | 2,945 (100.0%) | 625 (100.0%) |
Housing Structure by Heating Type in Fairview
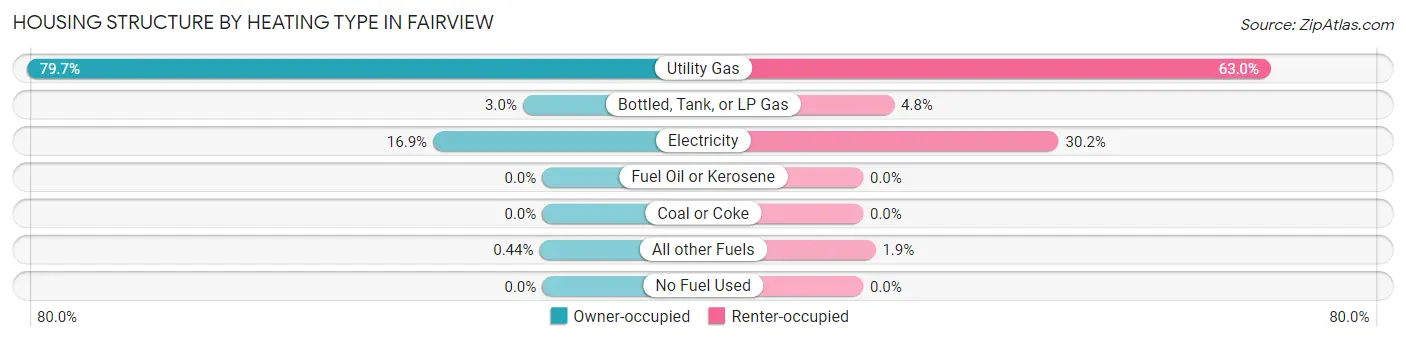
| Heating Type | Owner-occupied | Renter-occupied |
| Utility Gas | 2,347 (79.7%) | 394 (63.0%) |
| Bottled, Tank, or LP Gas | 88 (3.0%) | 30 (4.8%) |
| Electricity | 497 (16.9%) | 189 (30.2%) |
| Fuel Oil or Kerosene | 0 (0.0%) | 0 (0.0%) |
| Coal or Coke | 0 (0.0%) | 0 (0.0%) |
| All other Fuels | 13 (0.4%) | 12 (1.9%) |
| No Fuel Used | 0 (0.0%) | 0 (0.0%) |
| Total | 2,945 (100.0%) | 625 (100.0%) |
Household Vehicle Usage in Fairview
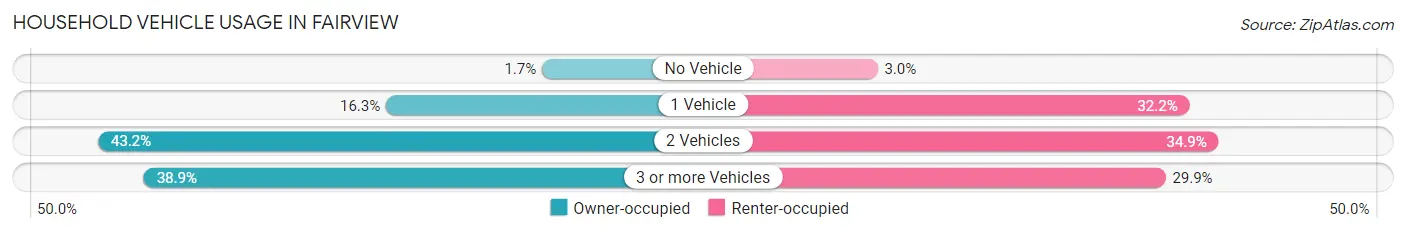
| Vehicles per Household | Owner-occupied | Renter-occupied |
| No Vehicle | 50 (1.7%) | 19 (3.0%) |
| 1 Vehicle | 479 (16.3%) | 201 (32.2%) |
| 2 Vehicles | 1,271 (43.2%) | 218 (34.9%) |
| 3 or more Vehicles | 1,145 (38.9%) | 187 (29.9%) |
| Total | 2,945 (100.0%) | 625 (100.0%) |
Real Estate & Mortgages in Fairview
Real Estate and Mortgage Overview in Fairview
| Characteristic | Without Mortgage | With Mortgage |
| Housing Units | 891 | 2,054 |
| Median Property Value | $855,600 | $940,300 |
| Median Household Income | $133,977 | $1,229 |
| Monthly Housing Costs | $917 | $1,190 |
| Real Estate Taxes | $5,951 | $0 |
Property Value by Mortgage Status in Fairview
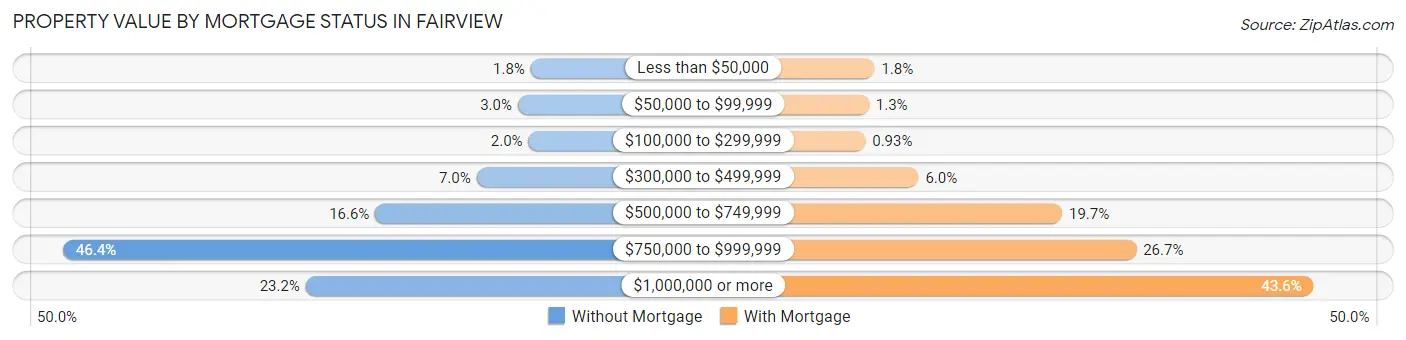
| Property Value | Without Mortgage | With Mortgage |
| Less than $50,000 | 16 (1.8%) | 37 (1.8%) |
| $50,000 to $99,999 | 27 (3.0%) | 26 (1.3%) |
| $100,000 to $299,999 | 18 (2.0%) | 19 (0.9%) |
| $300,000 to $499,999 | 62 (7.0%) | 123 (6.0%) |
| $500,000 to $749,999 | 148 (16.6%) | 404 (19.7%) |
| $750,000 to $999,999 | 413 (46.4%) | 549 (26.7%) |
| $1,000,000 or more | 207 (23.2%) | 896 (43.6%) |
| Total | 891 (100.0%) | 2,054 (100.0%) |
Household Income by Mortgage Status in Fairview
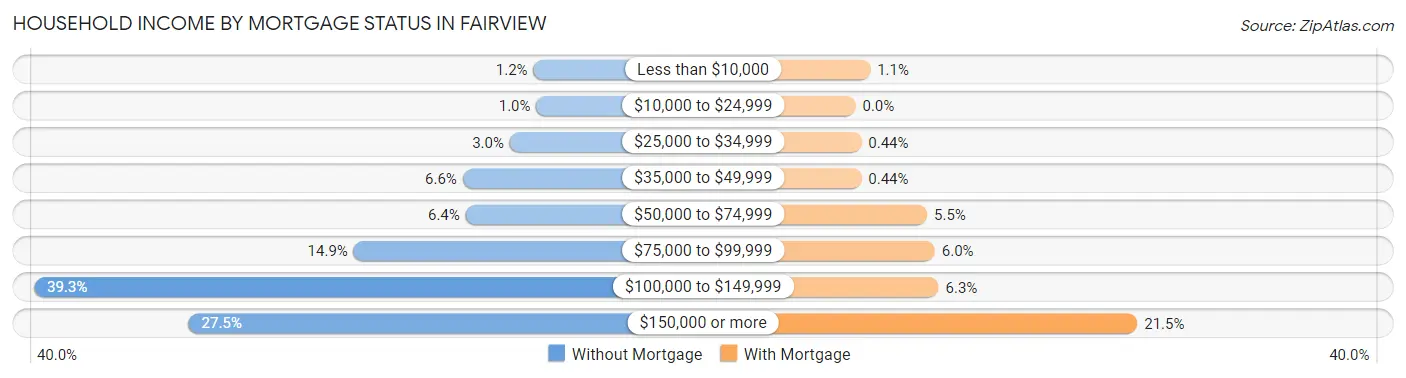
| Household Income | Without Mortgage | With Mortgage |
| Less than $10,000 | 11 (1.2%) | 23 (1.1%) |
| $10,000 to $24,999 | 9 (1.0%) | 0 (0.0%) |
| $25,000 to $34,999 | 27 (3.0%) | 9 (0.4%) |
| $35,000 to $49,999 | 59 (6.6%) | 9 (0.4%) |
| $50,000 to $74,999 | 57 (6.4%) | 112 (5.4%) |
| $75,000 to $99,999 | 133 (14.9%) | 124 (6.0%) |
| $100,000 to $149,999 | 350 (39.3%) | 130 (6.3%) |
| $150,000 or more | 245 (27.5%) | 441 (21.5%) |
| Total | 891 (100.0%) | 2,054 (100.0%) |
Property Value to Household Income Ratio in Fairview
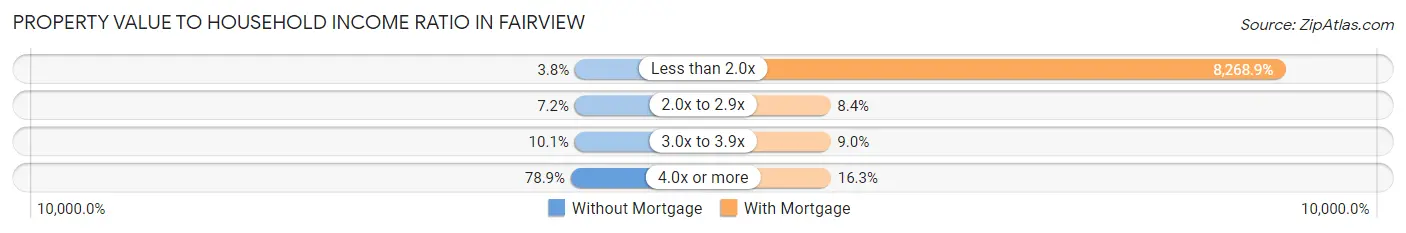
| Value-to-Income Ratio | Without Mortgage | With Mortgage |
| Less than 2.0x | 34 (3.8%) | 169,844 (8,268.9%) |
| 2.0x to 2.9x | 64 (7.2%) | 172 (8.4%) |
| 3.0x to 3.9x | 90 (10.1%) | 184 (9.0%) |
| 4.0x or more | 703 (78.9%) | 335 (16.3%) |
| Total | 891 (100.0%) | 2,054 (100.0%) |
Real Estate Taxes by Mortgage Status in Fairview
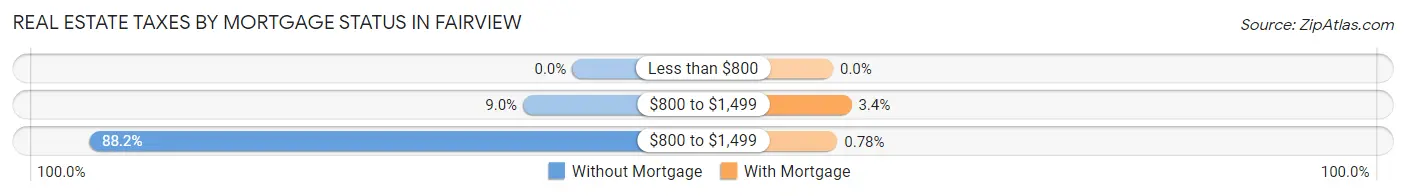
| Property Taxes | Without Mortgage | With Mortgage |
| Less than $800 | 0 (0.0%) | 0 (0.0%) |
| $800 to $1,499 | 80 (9.0%) | 69 (3.4%) |
| $800 to $1,499 | 786 (88.2%) | 16 (0.8%) |
| Total | 891 (100.0%) | 2,054 (100.0%) |
Health & Disability in Fairview
Health Insurance Coverage by Age in Fairview
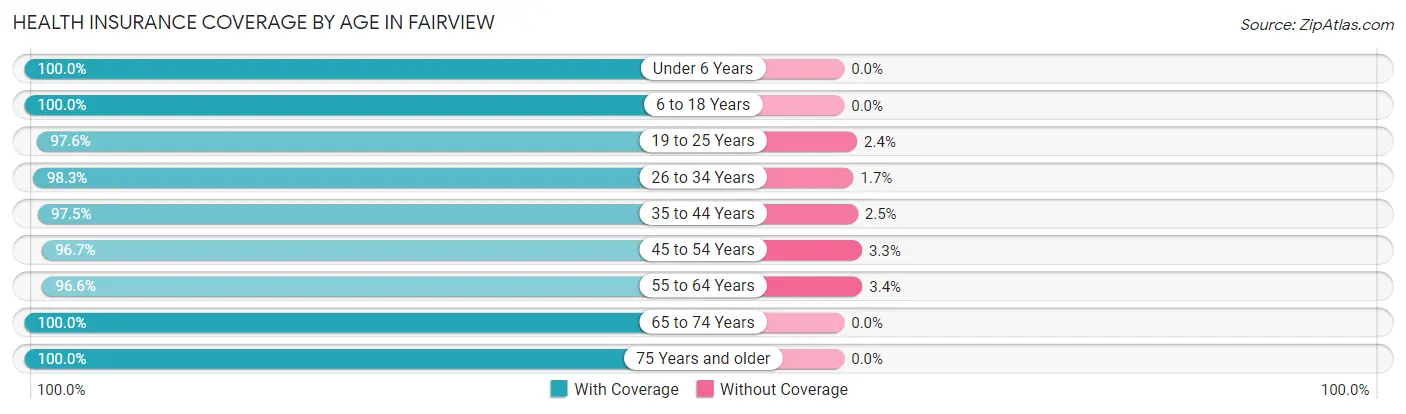
| Age Bracket | With Coverage | Without Coverage |
| Under 6 Years | 576 (100.0%) | 0 (0.0%) |
| 6 to 18 Years | 1,189 (100.0%) | 0 (0.0%) |
| 19 to 25 Years | 570 (97.6%) | 14 (2.4%) |
| 26 to 34 Years | 1,130 (98.3%) | 20 (1.7%) |
| 35 to 44 Years | 1,540 (97.5%) | 40 (2.5%) |
| 45 to 54 Years | 1,205 (96.7%) | 41 (3.3%) |
| 55 to 64 Years | 1,930 (96.6%) | 67 (3.4%) |
| 65 to 74 Years | 1,214 (100.0%) | 0 (0.0%) |
| 75 Years and older | 982 (100.0%) | 0 (0.0%) |
| Total | 10,336 (98.3%) | 182 (1.7%) |
Health Insurance Coverage by Citizenship Status in Fairview
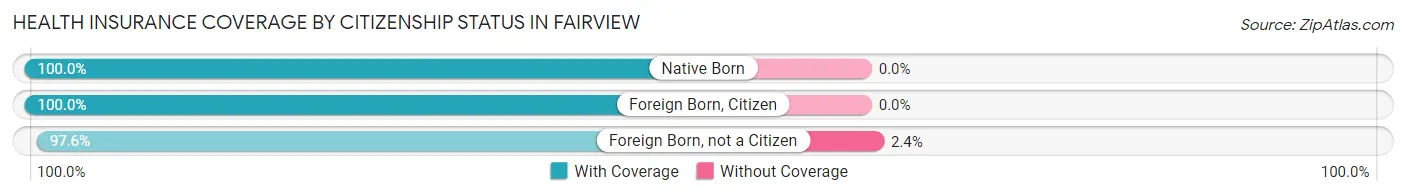
| Citizenship Status | With Coverage | Without Coverage |
| Native Born | 576 (100.0%) | 0 (0.0%) |
| Foreign Born, Citizen | 1,189 (100.0%) | 0 (0.0%) |
| Foreign Born, not a Citizen | 570 (97.6%) | 14 (2.4%) |
Health Insurance Coverage by Household Income in Fairview
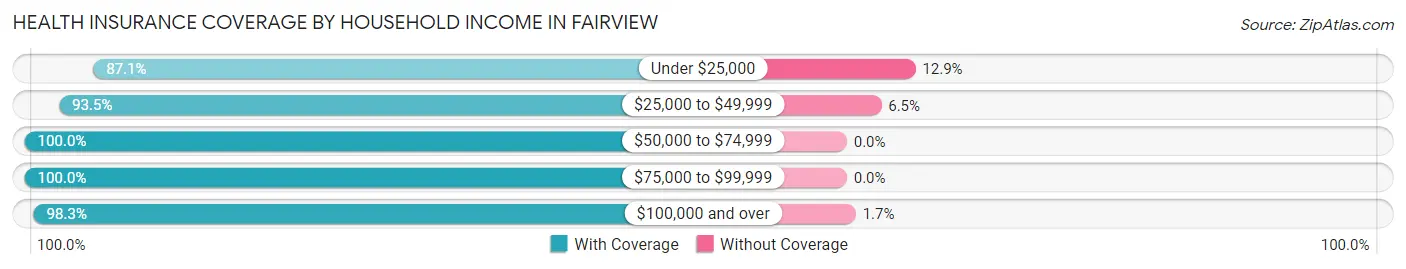
| Household Income | With Coverage | Without Coverage |
| Under $25,000 | 61 (87.1%) | 9 (12.9%) |
| $25,000 to $49,999 | 507 (93.5%) | 35 (6.5%) |
| $50,000 to $74,999 | 582 (100.0%) | 0 (0.0%) |
| $75,000 to $99,999 | 883 (100.0%) | 0 (0.0%) |
| $100,000 and over | 8,146 (98.3%) | 138 (1.7%) |
Public vs Private Health Insurance Coverage by Age in Fairview
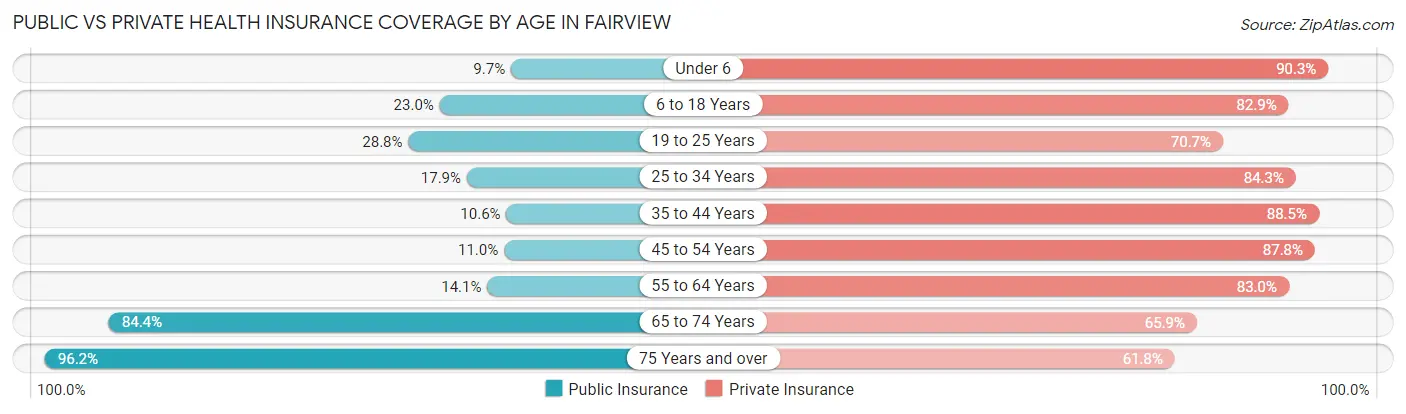
| Age Bracket | Public Insurance | Private Insurance |
| Under 6 | 56 (9.7%) | 520 (90.3%) |
| 6 to 18 Years | 273 (23.0%) | 986 (82.9%) |
| 19 to 25 Years | 168 (28.8%) | 413 (70.7%) |
| 25 to 34 Years | 206 (17.9%) | 969 (84.3%) |
| 35 to 44 Years | 167 (10.6%) | 1,399 (88.5%) |
| 45 to 54 Years | 137 (11.0%) | 1,094 (87.8%) |
| 55 to 64 Years | 282 (14.1%) | 1,657 (83.0%) |
| 65 to 74 Years | 1,024 (84.4%) | 800 (65.9%) |
| 75 Years and over | 945 (96.2%) | 607 (61.8%) |
| Total | 3,258 (31.0%) | 8,445 (80.3%) |
Disability Status by Sex by Age in Fairview
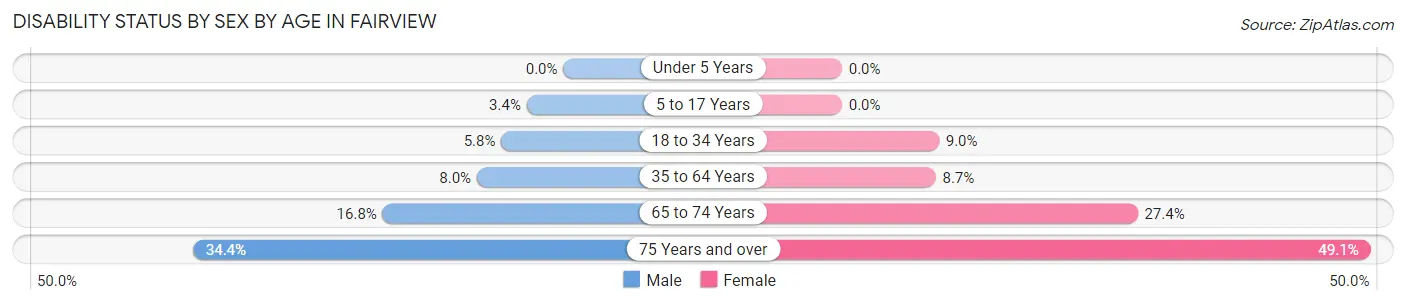
| Age Bracket | Male | Female |
| Under 5 Years | 0 (0.0%) | 0 (0.0%) |
| 5 to 17 Years | 27 (3.4%) | 0 (0.0%) |
| 18 to 34 Years | 65 (5.8%) | 63 (9.0%) |
| 35 to 64 Years | 196 (8.0%) | 207 (8.7%) |
| 65 to 74 Years | 85 (16.8%) | 194 (27.4%) |
| 75 Years and over | 131 (34.4%) | 295 (49.1%) |
Disability Class by Sex by Age in Fairview
Disability Class: Hearing Difficulty
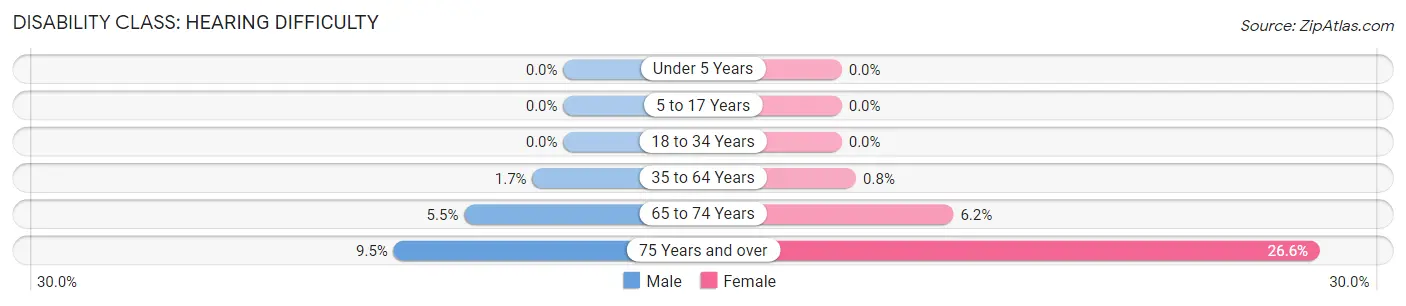
| Age Bracket | Male | Female |
| Under 5 Years | 0 (0.0%) | 0 (0.0%) |
| 5 to 17 Years | 0 (0.0%) | 0 (0.0%) |
| 18 to 34 Years | 0 (0.0%) | 0 (0.0%) |
| 35 to 64 Years | 42 (1.7%) | 19 (0.8%) |
| 65 to 74 Years | 28 (5.5%) | 44 (6.2%) |
| 75 Years and over | 36 (9.5%) | 160 (26.6%) |
Disability Class: Vision Difficulty
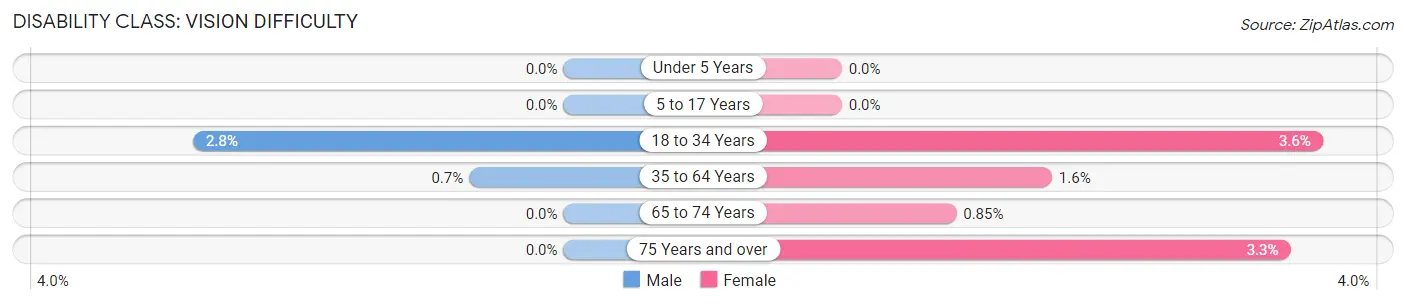
| Age Bracket | Male | Female |
| Under 5 Years | 0 (0.0%) | 0 (0.0%) |
| 5 to 17 Years | 0 (0.0%) | 0 (0.0%) |
| 18 to 34 Years | 31 (2.8%) | 25 (3.6%) |
| 35 to 64 Years | 17 (0.7%) | 37 (1.6%) |
| 65 to 74 Years | 0 (0.0%) | 6 (0.9%) |
| 75 Years and over | 0 (0.0%) | 20 (3.3%) |
Disability Class: Cognitive Difficulty
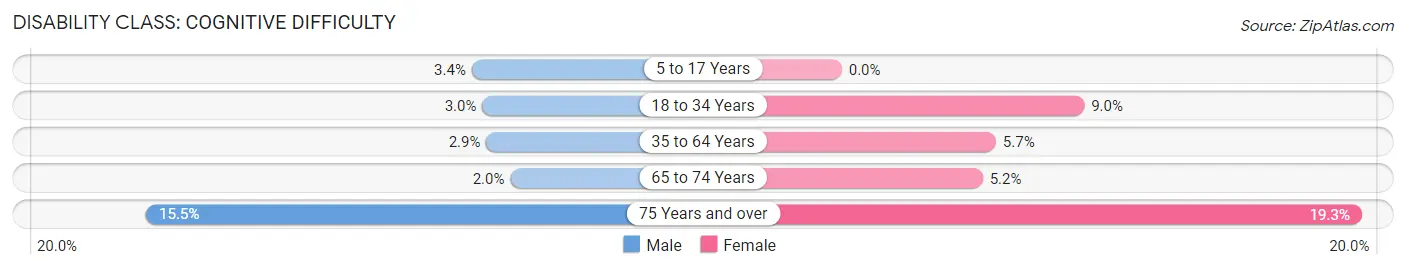
| Age Bracket | Male | Female |
| 5 to 17 Years | 27 (3.4%) | 0 (0.0%) |
| 18 to 34 Years | 34 (3.0%) | 63 (9.0%) |
| 35 to 64 Years | 70 (2.9%) | 136 (5.7%) |
| 65 to 74 Years | 10 (2.0%) | 37 (5.2%) |
| 75 Years and over | 59 (15.5%) | 116 (19.3%) |
Disability Class: Ambulatory Difficulty
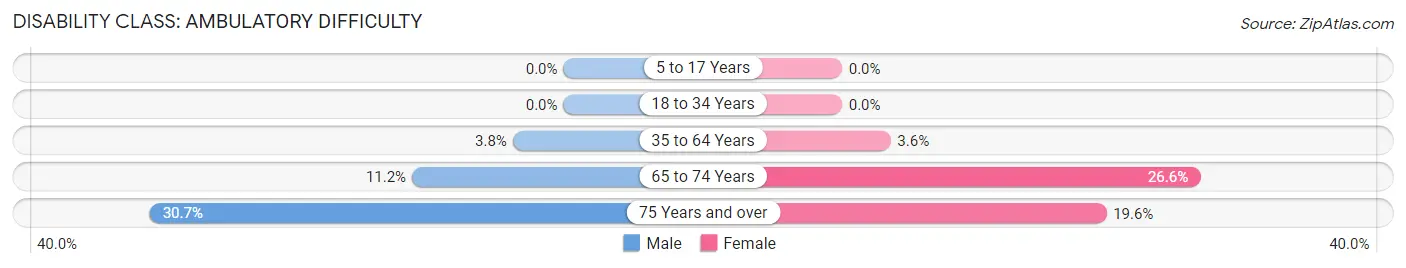
| Age Bracket | Male | Female |
| 5 to 17 Years | 0 (0.0%) | 0 (0.0%) |
| 18 to 34 Years | 0 (0.0%) | 0 (0.0%) |
| 35 to 64 Years | 92 (3.8%) | 86 (3.6%) |
| 65 to 74 Years | 57 (11.2%) | 188 (26.6%) |
| 75 Years and over | 117 (30.7%) | 118 (19.6%) |
Disability Class: Self-Care Difficulty
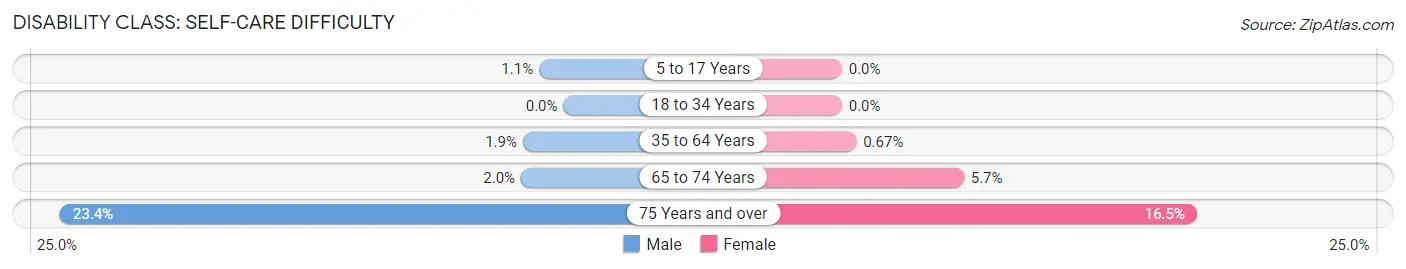
| Age Bracket | Male | Female |
| 5 to 17 Years | 9 (1.1%) | 0 (0.0%) |
| 18 to 34 Years | 0 (0.0%) | 0 (0.0%) |
| 35 to 64 Years | 46 (1.9%) | 16 (0.7%) |
| 65 to 74 Years | 10 (2.0%) | 40 (5.7%) |
| 75 Years and over | 89 (23.4%) | 99 (16.5%) |
Technology Access in Fairview
Computing Device Access in Fairview
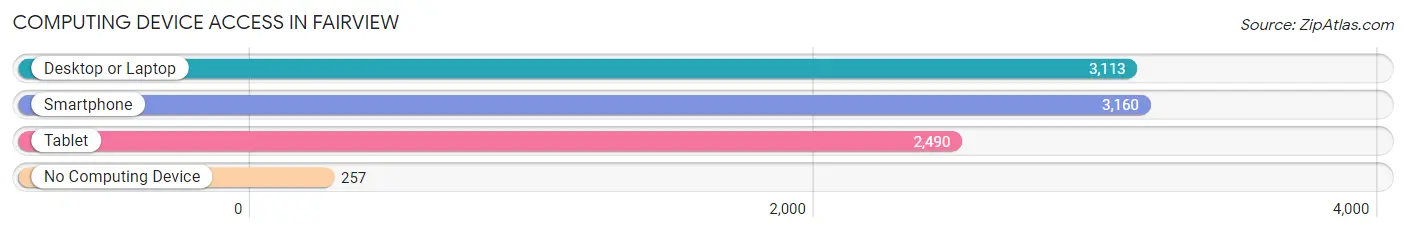
| Device Type | # Households | % Households |
| Desktop or Laptop | 3,113 | 87.2% |
| Smartphone | 3,160 | 88.5% |
| Tablet | 2,490 | 69.8% |
| No Computing Device | 257 | 7.2% |
| Total | 3,570 | 100.0% |
Internet Access in Fairview
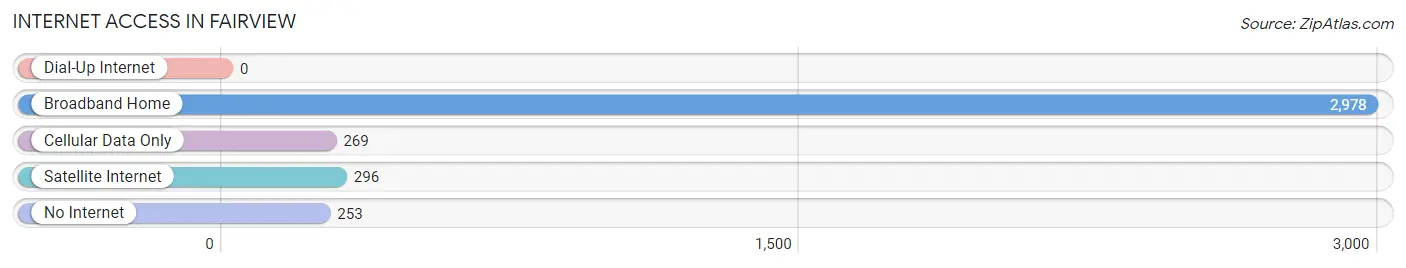
| Internet Type | # Households | % Households |
| Dial-Up Internet | 0 | 0.0% |
| Broadband Home | 2,978 | 83.4% |
| Cellular Data Only | 269 | 7.5% |
| Satellite Internet | 296 | 8.3% |
| No Internet | 253 | 7.1% |
| Total | 3,570 | 100.0% |
Fairview Summary
History
The small town of Fairview, California is located in the San Francisco Bay Area, in Alameda County. It is situated between Hayward and Oakland, and is bordered by the San Mateo County line to the south. The town was originally part of the Rancho San Lorenzo Mexican land grant, and was first settled in the mid-1800s. The town was officially incorporated in 1957, and has since grown to a population of over 10,000 people.
The town of Fairview has a rich history, and has been home to many different cultures over the years. The first settlers were Native Americans, who lived in the area for thousands of years before the arrival of Europeans. The Ohlone people were the first to inhabit the area, and they were followed by Spanish settlers in the late 1700s. The Spanish settlers established the Rancho San Lorenzo, which was later divided into smaller parcels of land.
In the mid-1800s, the area was settled by German and Italian immigrants, who established farms and orchards. The town was officially founded in 1876, and was named after the nearby Fairview Hotel. The hotel was built in 1875, and was a popular destination for travelers and tourists.
In the early 1900s, the town began to grow and develop. The first school was built in 1906, and the first post office opened in 1907. The town was also home to a number of businesses, including a blacksmith shop, a general store, and a saloon.
Geography
Fairview is located in the San Francisco Bay Area, in Alameda County. It is situated between Hayward and Oakland, and is bordered by the San Mateo County line to the south. The town is located on the eastern side of the San Francisco Bay, and is surrounded by hills and mountains. The town is located at an elevation of about 500 feet, and has a total area of 2.3 square miles.
The town is located in a temperate climate, with mild winters and warm summers. The average temperature in the summer is around 70 degrees Fahrenheit, and the average temperature in the winter is around 50 degrees Fahrenheit. The town receives an average of about 20 inches of rain per year.
Economy
The economy of Fairview is largely based on the service industry. The town is home to a number of restaurants, retail stores, and other businesses. The town is also home to a number of technology companies, including Oracle, Symantec, and Hewlett Packard.
The town is also home to a number of educational institutions, including the University of California, Berkeley, and the California College of the Arts. The town is also home to a number of parks and recreational facilities, including the Fairview Park and the Fairview Golf Course.
Demographics
As of the 2010 census, the population of Fairview was 10,003. The population is largely composed of white (63.3%), Asian (20.2%), and Hispanic (9.2%) residents. The median household income is $90,845, and the median age is 39.7 years.
The town is home to a number of religious institutions, including churches, synagogues, and mosques. The town is also home to a number of cultural institutions, including the Fairview Museum of Art and History, and the Fairview Historical Society.
Conclusion
Fairview, California is a small town located in the San Francisco Bay Area, in Alameda County. The town has a rich history, and has been home to many different cultures over the years. The town is largely based on the service industry, and is home to a number of technology companies, educational institutions, and recreational facilities. The population of Fairview is largely composed of white, Asian, and Hispanic residents, and the median household income is $90,845. The town is home to a number of religious and cultural institutions, and is a great place to live and work.
Common Questions
What is Per Capita Income in Fairview?
Per Capita income in Fairview is $68,669.
What is the Median Family Income in Fairview?
Median Family Income in Fairview is $153,315.
What is the Median Household income in Fairview?
Median Household Income in Fairview is $147,931.
What is Income or Wage Gap in Fairview?
Income or Wage Gap in Fairview is 6.4%.
Women in Fairview earn 93.6 cents for every dollar earned by a man.
What is Inequality or Gini Index in Fairview?
Inequality or Gini Index in Fairview is 0.42.
What is the Total Population of Fairview?
Total Population of Fairview is 10,583.
What is the Total Male Population of Fairview?
Total Male Population of Fairview is 5,603.
What is the Total Female Population of Fairview?
Total Female Population of Fairview is 4,980.
What is the Ratio of Males per 100 Females in Fairview?
There are 112.51 Males per 100 Females in Fairview.
What is the Ratio of Females per 100 Males in Fairview?
There are 88.88 Females per 100 Males in Fairview.
What is the Median Population Age in Fairview?
Median Population Age in Fairview is 46.5 Years.
What is the Average Family Size in Fairview
Average Family Size in Fairview is 3.3 People.
What is the Average Household Size in Fairview
Average Household Size in Fairview is 2.9 People.
How Large is the Labor Force in Fairview?
There are 5,794 People in the Labor Forcein in Fairview.
What is the Percentage of People in the Labor Force in Fairview?
63.1% of People are in the Labor Force in Fairview.
What is the Unemployment Rate in Fairview?
Unemployment Rate in Fairview is 4.9%.