Juneau, WI Map & Demographics
Juneau Map
Juneau Overview
$33,208
PER CAPITA INCOME
$100,526
AVG FAMILY INCOME
$76,467
AVG HOUSEHOLD INCOME
30.9%
WAGE / INCOME GAP [ % ]
69.1¢/ $1
WAGE / INCOME GAP [ $ ]
0.41
INEQUALITY / GINI INDEX
2,636
TOTAL POPULATION
1,394
MALE POPULATION
1,242
FEMALE POPULATION
112.24
MALES / 100 FEMALES
89.10
FEMALES / 100 MALES
41.9
MEDIAN AGE
3.4
AVG FAMILY SIZE
2.8
AVG HOUSEHOLD SIZE
1,306
LABOR FORCE [ PEOPLE ]
56.4%
PERCENT IN LABOR FORCE
4.7%
UNEMPLOYMENT RATE
Juneau Zip Codes
Juneau Area Codes
Income in Juneau
Income Overview in Juneau
Per Capita Income in Juneau is $33,208, while median incomes of families and households are $100,526 and $76,467 respectively.
| Characteristic | Number | Measure |
| Per Capita Income | 2,636 | $33,208 |
| Median Family Income | 476 | $100,526 |
| Mean Family Income | 476 | $116,675 |
| Median Household Income | 781 | $76,467 |
| Mean Household Income | 781 | $94,473 |
| Income Deficit | 476 | $0 |
| Wage / Income Gap (%) | 2,636 | 30.93% |
| Wage / Income Gap ($) | 2,636 | 69.07¢ per $1 |
| Gini / Inequality Index | 2,636 | 0.41 |
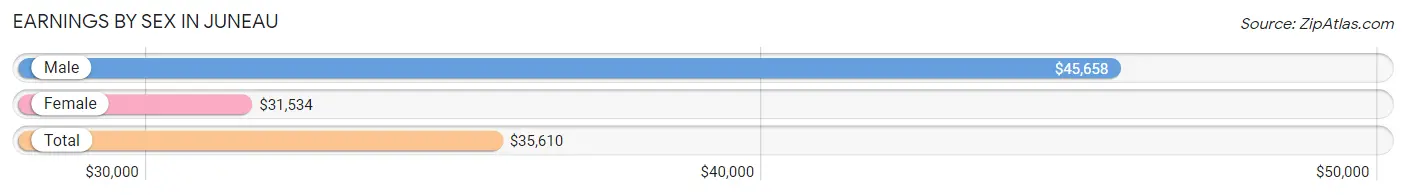
Earnings by Sex in Juneau
Average Earnings in Juneau are $35,610, $45,658 for men and $31,534 for women, a difference of 30.9%.
| Sex | Number | Average Earnings |
| Male | 754 (51.8%) | $45,658 |
| Female | 701 (48.2%) | $31,534 |
| Total | 1,455 (100.0%) | $35,610 |
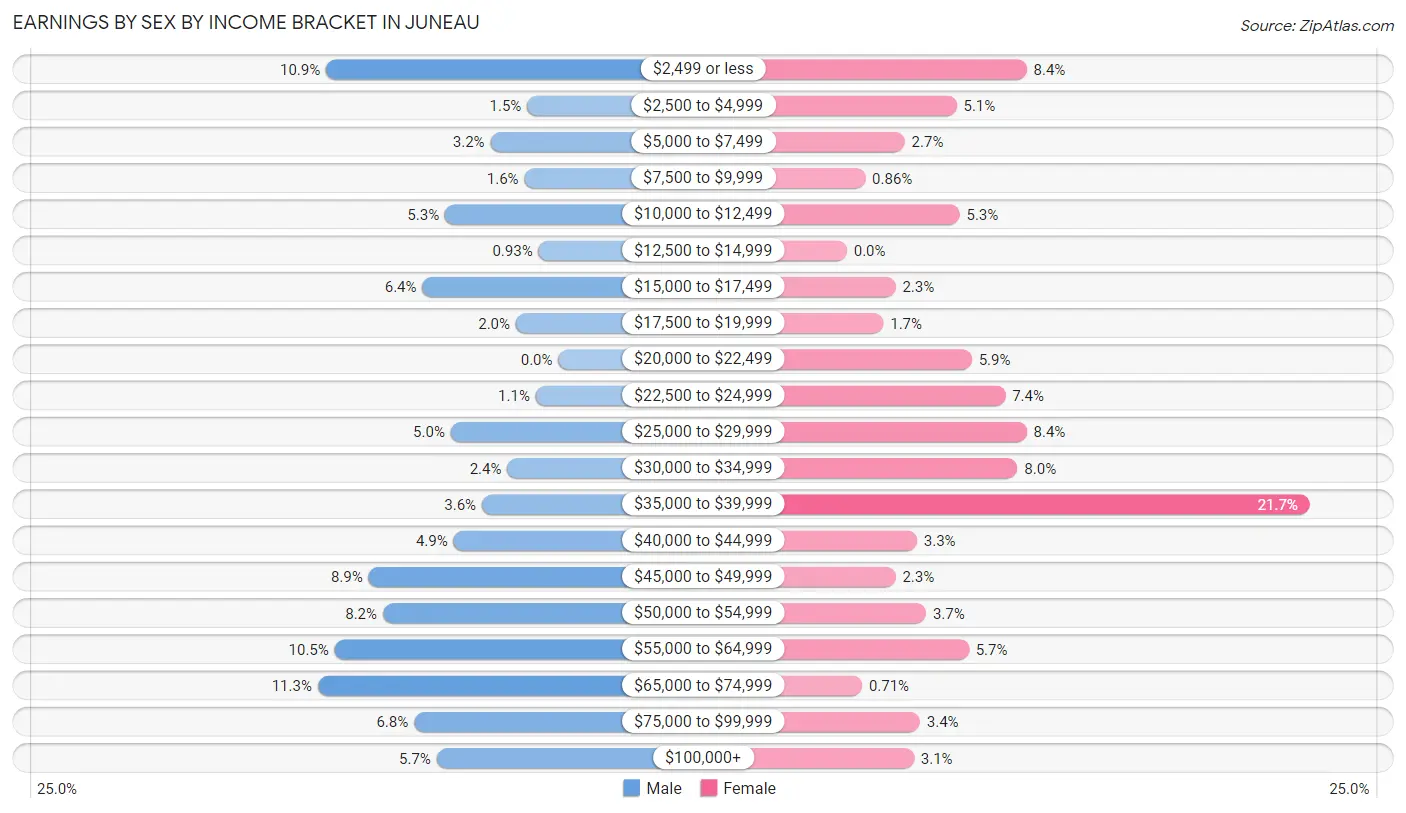
Earnings by Sex by Income Bracket in Juneau
The most common earnings brackets in Juneau are $65,000 to $74,999 for men (85 | 11.3%) and $35,000 to $39,999 for women (152 | 21.7%).
| Income | Male | Female |
| $2,499 or less | 82 (10.9%) | 59 (8.4%) |
| $2,500 to $4,999 | 11 (1.5%) | 36 (5.1%) |
| $5,000 to $7,499 | 24 (3.2%) | 19 (2.7%) |
| $7,500 to $9,999 | 12 (1.6%) | 6 (0.9%) |
| $10,000 to $12,499 | 40 (5.3%) | 37 (5.3%) |
| $12,500 to $14,999 | 7 (0.9%) | 0 (0.0%) |
| $15,000 to $17,499 | 48 (6.4%) | 16 (2.3%) |
| $17,500 to $19,999 | 15 (2.0%) | 12 (1.7%) |
| $20,000 to $22,499 | 0 (0.0%) | 41 (5.9%) |
| $22,500 to $24,999 | 8 (1.1%) | 52 (7.4%) |
| $25,000 to $29,999 | 38 (5.0%) | 59 (8.4%) |
| $30,000 to $34,999 | 18 (2.4%) | 56 (8.0%) |
| $35,000 to $39,999 | 27 (3.6%) | 152 (21.7%) |
| $40,000 to $44,999 | 37 (4.9%) | 23 (3.3%) |
| $45,000 to $49,999 | 67 (8.9%) | 16 (2.3%) |
| $50,000 to $54,999 | 62 (8.2%) | 26 (3.7%) |
| $55,000 to $64,999 | 79 (10.5%) | 40 (5.7%) |
| $65,000 to $74,999 | 85 (11.3%) | 5 (0.7%) |
| $75,000 to $99,999 | 51 (6.8%) | 24 (3.4%) |
| $100,000+ | 43 (5.7%) | 22 (3.1%) |
| Total | 754 (100.0%) | 701 (100.0%) |
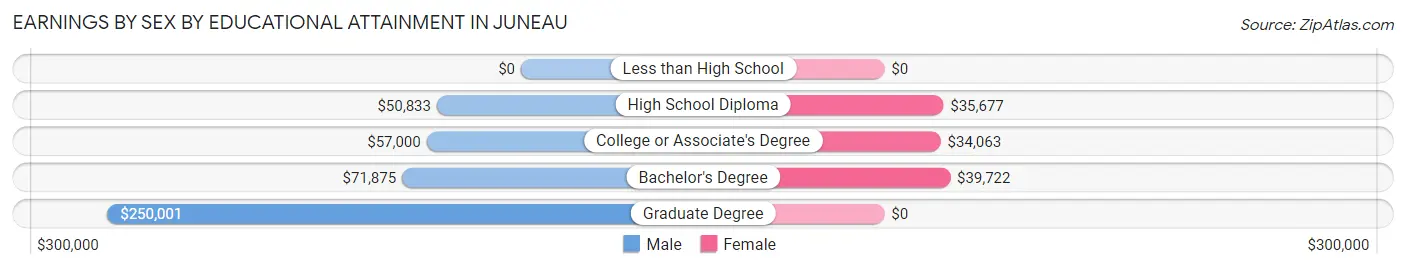
Earnings by Sex by Educational Attainment in Juneau
Average earnings in Juneau are $52,200 for men and $35,723 for women, a difference of 31.6%. Men with an educational attainment of graduate degree enjoy the highest average annual earnings of $250,001, while those with high school diploma education earn the least with $50,833. Women with an educational attainment of bachelor's degree earn the most with the average annual earnings of $39,722, while those with college or associate's degree education have the smallest earnings of $34,063.
| Educational Attainment | Male Income | Female Income |
| Less than High School | - | - |
| High School Diploma | $50,833 | $35,677 |
| College or Associate's Degree | $57,000 | $34,063 |
| Bachelor's Degree | $71,875 | $39,722 |
| Graduate Degree | $250,001 | $0 |
| Total | $52,200 | $35,723 |
Family Income in Juneau
Family Income Brackets in Juneau
According to the Juneau family income data, there are 172 families falling into the $100,000 to $149,999 income range, which is the most common income bracket and makes up 36.1% of all families.
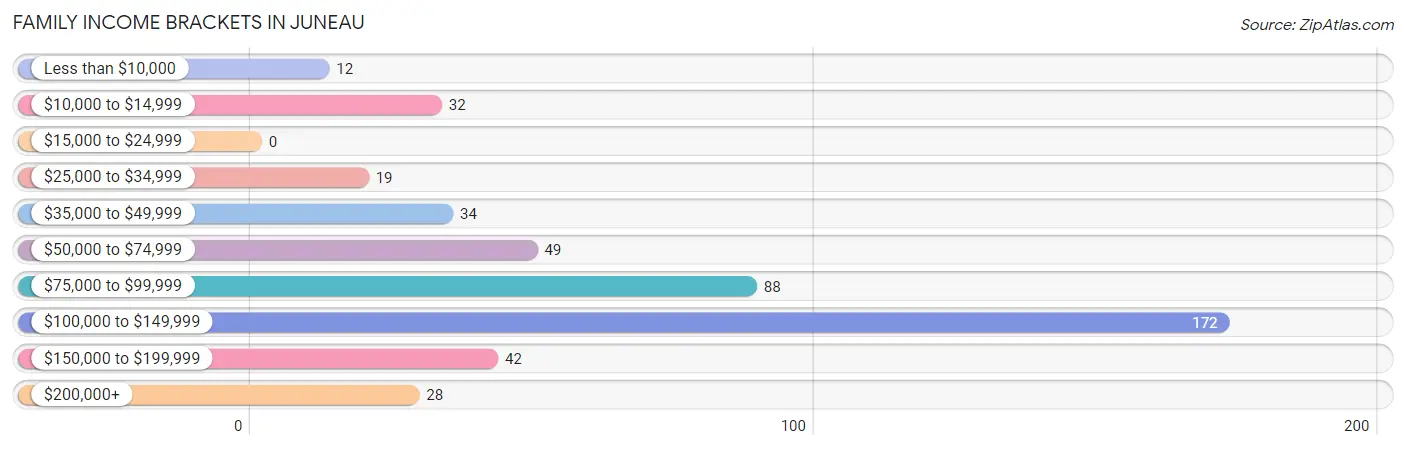
| Income Bracket | # Families | % Families |
| Less than $10,000 | 12 | 2.5% |
| $10,000 to $14,999 | 32 | 6.7% |
| $15,000 to $24,999 | 0 | 0.0% |
| $25,000 to $34,999 | 19 | 4.0% |
| $35,000 to $49,999 | 34 | 7.1% |
| $50,000 to $74,999 | 49 | 10.3% |
| $75,000 to $99,999 | 88 | 18.5% |
| $100,000 to $149,999 | 172 | 36.1% |
| $150,000 to $199,999 | 42 | 8.8% |
| $200,000+ | 28 | 5.9% |
Family Income by Famaliy Size in Juneau
5-person families (46 | 9.7%) account for the highest median family income in Juneau with $158,750 per family, while 2-person families (157 | 33.0%) have the highest median income of $48,282 per family member.
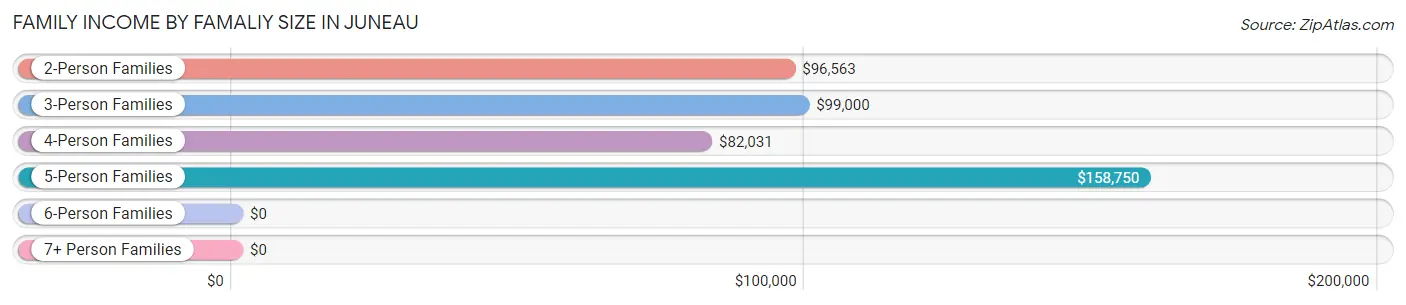
| Income Bracket | # Families | Median Income |
| 2-Person Families | 157 (33.0%) | $96,563 |
| 3-Person Families | 132 (27.7%) | $99,000 |
| 4-Person Families | 111 (23.3%) | $82,031 |
| 5-Person Families | 46 (9.7%) | $158,750 |
| 6-Person Families | 4 (0.8%) | $0 |
| 7+ Person Families | 26 (5.5%) | $0 |
| Total | 476 (100.0%) | $100,526 |
Family Income by Number of Earners in Juneau
The median family income in Juneau is $100,526, with families comprising 3+ earners (164) having the highest median family income of $135,385, while families with 1 earner (66) have the lowest median family income of $56,875, accounting for 34.4% and 13.9% of families, respectively.
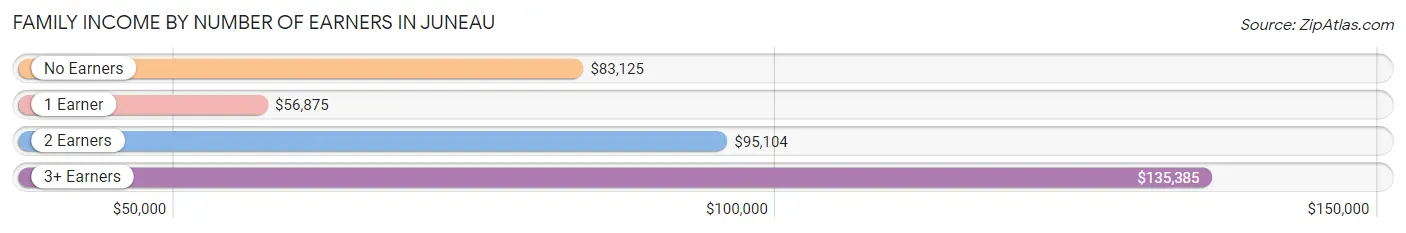
| Number of Earners | # Families | Median Income |
| No Earners | 95 (20.0%) | $83,125 |
| 1 Earner | 66 (13.9%) | $56,875 |
| 2 Earners | 151 (31.7%) | $95,104 |
| 3+ Earners | 164 (34.4%) | $135,385 |
| Total | 476 (100.0%) | $100,526 |
Household Income in Juneau
Household Income Brackets in Juneau
With 209 households falling in the category, the $100,000 to $149,999 income range is the most frequent in Juneau, accounting for 26.8% of all households. In contrast, only 6 households (0.8%) fall into the $10,000 to $14,999 income bracket, making it the least populous group.
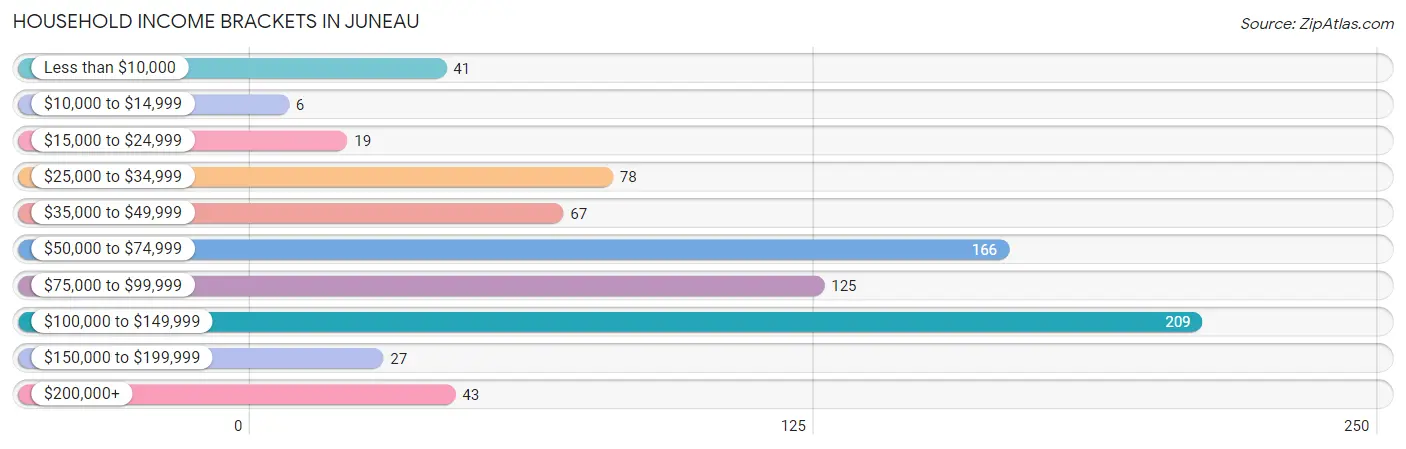
| Income Bracket | # Households | % Households |
| Less than $10,000 | 41 | 5.2% |
| $10,000 to $14,999 | 6 | 0.8% |
| $15,000 to $24,999 | 19 | 2.4% |
| $25,000 to $34,999 | 78 | 10.0% |
| $35,000 to $49,999 | 67 | 8.6% |
| $50,000 to $74,999 | 166 | 21.3% |
| $75,000 to $99,999 | 125 | 16.0% |
| $100,000 to $149,999 | 209 | 26.8% |
| $150,000 to $199,999 | 27 | 3.5% |
| $200,000+ | 43 | 5.5% |
Household Income by Householder Age in Juneau
The median household income in Juneau is $76,467, with the highest median household income of $99,205 found in the 45 to 64 years age bracket for the primary householder. A total of 315 households (40.3%) fall into this category. Meanwhile, the 15 to 24 years age bracket for the primary householder has the lowest median household income of $0, with 28 households (3.6%) in this group.
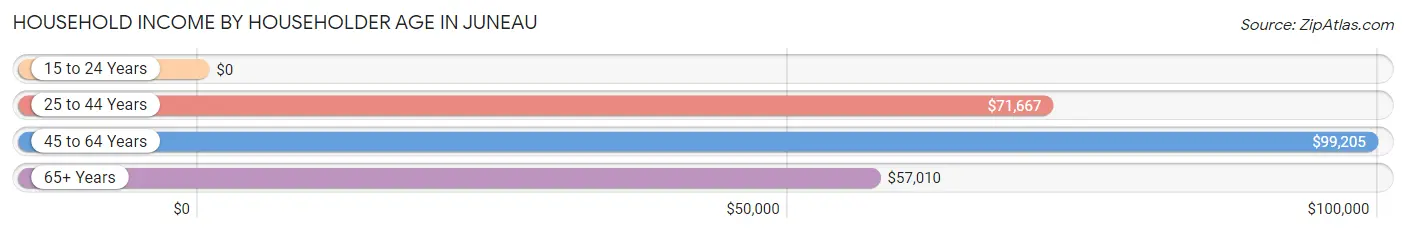
| Income Bracket | # Households | Median Income |
| 15 to 24 Years | 28 (3.6%) | $0 |
| 25 to 44 Years | 254 (32.5%) | $71,667 |
| 45 to 64 Years | 315 (40.3%) | $99,205 |
| 65+ Years | 184 (23.6%) | $57,010 |
| Total | 781 (100.0%) | $76,467 |
Poverty in Juneau
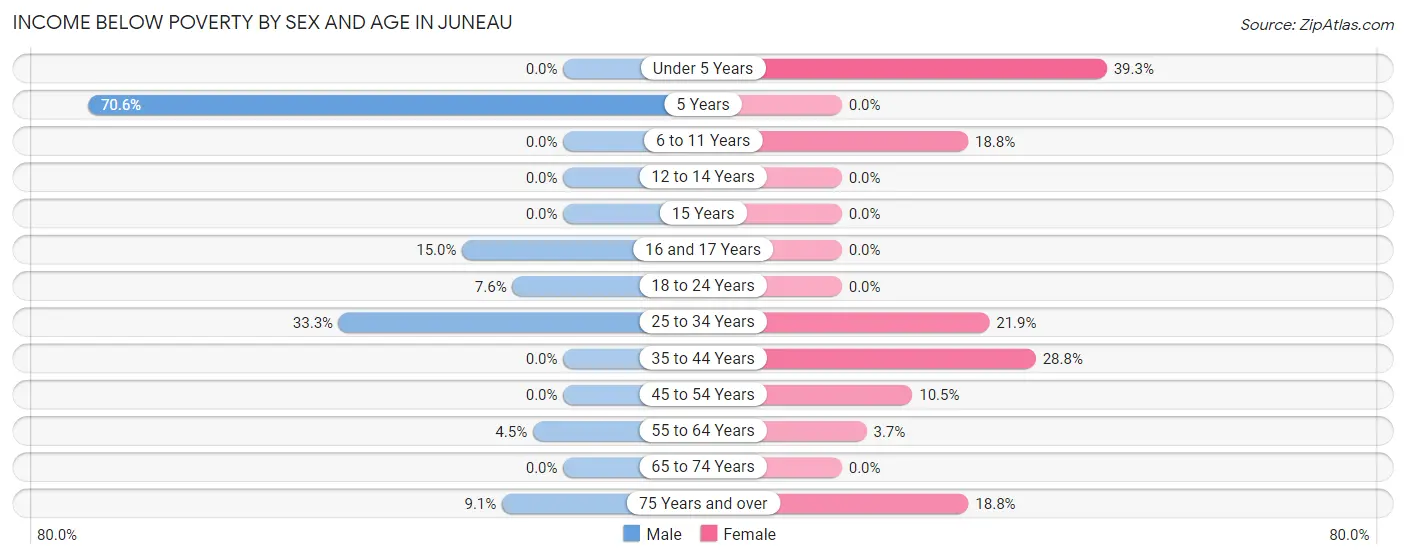
Income Below Poverty by Sex and Age in Juneau
With 9.3% poverty level for males and 12.7% for females among the residents of Juneau, 5 year old males and under 5 year old females are the most vulnerable to poverty, with 12 males (70.6%) and 24 females (39.3%) in their respective age groups living below the poverty level.
| Age Bracket | Male | Female |
| Under 5 Years | 0 (0.0%) | 24 (39.3%) |
| 5 Years | 12 (70.6%) | 0 (0.0%) |
| 6 to 11 Years | 0 (0.0%) | 9 (18.8%) |
| 12 to 14 Years | 0 (0.0%) | 0 (0.0%) |
| 15 Years | 0 (0.0%) | 0 (0.0%) |
| 16 and 17 Years | 6 (15.0%) | 0 (0.0%) |
| 18 to 24 Years | 12 (7.5%) | 0 (0.0%) |
| 25 to 34 Years | 57 (33.3%) | 30 (21.9%) |
| 35 to 44 Years | 0 (0.0%) | 36 (28.8%) |
| 45 to 54 Years | 0 (0.0%) | 18 (10.5%) |
| 55 to 64 Years | 6 (4.5%) | 8 (3.7%) |
| 65 to 74 Years | 0 (0.0%) | 0 (0.0%) |
| 75 Years and over | 4 (9.1%) | 22 (18.8%) |
| Total | 97 (9.3%) | 147 (12.7%) |
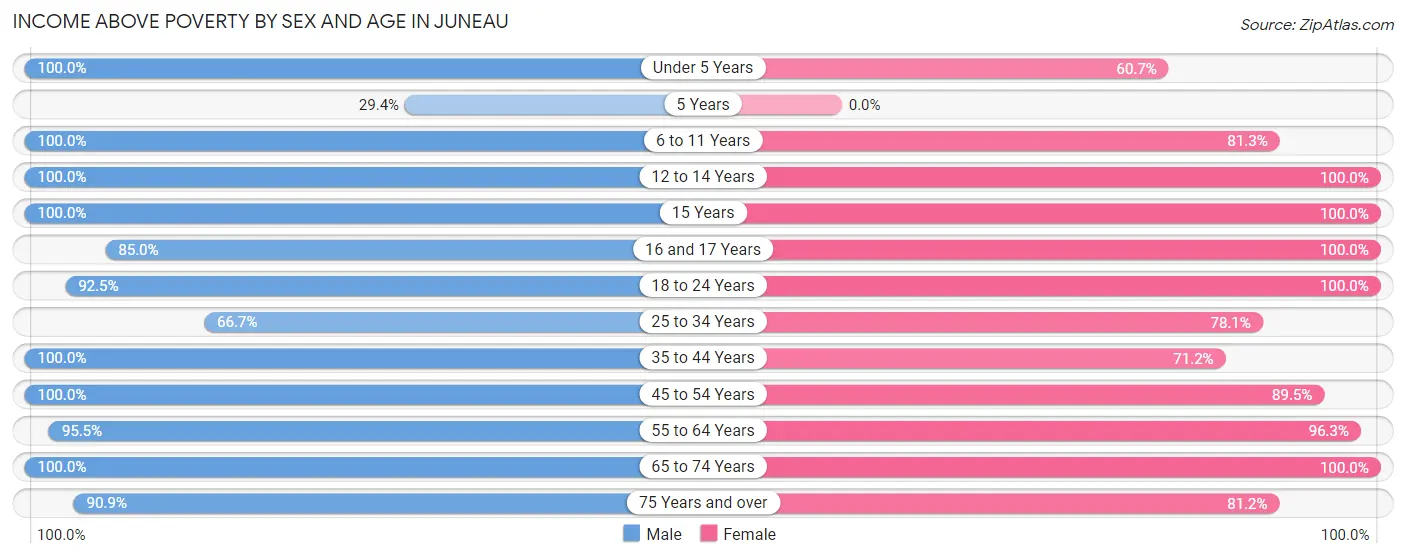
Income Above Poverty by Sex and Age in Juneau
According to the poverty statistics in Juneau, males aged under 5 years and females aged 12 to 14 years are the age groups that are most secure financially, with 100.0% of males and 100.0% of females in these age groups living above the poverty line.
| Age Bracket | Male | Female |
| Under 5 Years | 24 (100.0%) | 37 (60.7%) |
| 5 Years | 5 (29.4%) | 0 (0.0%) |
| 6 to 11 Years | 82 (100.0%) | 39 (81.2%) |
| 12 to 14 Years | 8 (100.0%) | 14 (100.0%) |
| 15 Years | 18 (100.0%) | 24 (100.0%) |
| 16 and 17 Years | 34 (85.0%) | 63 (100.0%) |
| 18 to 24 Years | 147 (92.4%) | 126 (100.0%) |
| 25 to 34 Years | 114 (66.7%) | 107 (78.1%) |
| 35 to 44 Years | 85 (100.0%) | 89 (71.2%) |
| 45 to 54 Years | 177 (100.0%) | 154 (89.5%) |
| 55 to 64 Years | 127 (95.5%) | 210 (96.3%) |
| 65 to 74 Years | 89 (100.0%) | 49 (100.0%) |
| 75 Years and over | 40 (90.9%) | 95 (81.2%) |
| Total | 950 (90.7%) | 1,007 (87.3%) |
Income Below Poverty Among Married-Couple Families in Juneau
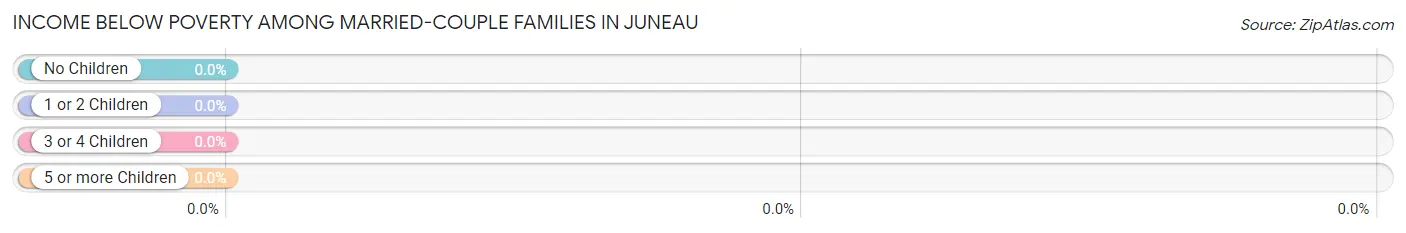
| Children | Above Poverty | Below Poverty |
| No Children | 216 (100.0%) | 0 (0.0%) |
| 1 or 2 Children | 136 (100.0%) | 0 (0.0%) |
| 3 or 4 Children | 40 (100.0%) | 0 (0.0%) |
| 5 or more Children | 0 (0.0%) | 0 (0.0%) |
| Total | 392 (100.0%) | 0 (0.0%) |
Income Below Poverty Among Single-Parent Households in Juneau
According to the poverty data in Juneau, 50.0% or 6 single-father households and 52.8% or 38 single-mother households are living below the poverty line. Among single-father households, those with 1 or 2 children have the highest poverty rate, with 6 households (75.0%) experiencing poverty. Likewise, among single-mother households, those with 1 or 2 children have the highest poverty rate, with 38 households (64.4%) falling below the poverty line.
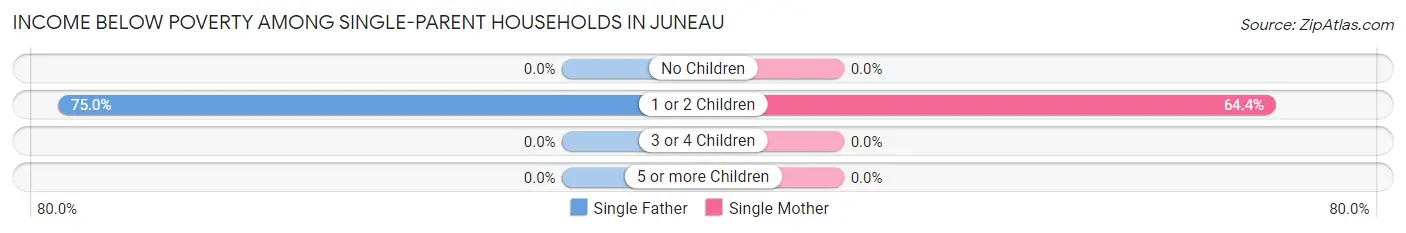
| Children | Single Father | Single Mother |
| No Children | 0 (0.0%) | 0 (0.0%) |
| 1 or 2 Children | 6 (75.0%) | 38 (64.4%) |
| 3 or 4 Children | 0 (0.0%) | 0 (0.0%) |
| 5 or more Children | 0 (0.0%) | 0 (0.0%) |
| Total | 6 (50.0%) | 38 (52.8%) |
Income Below Poverty Among Married-Couple vs Single-Parent Households in Juneau
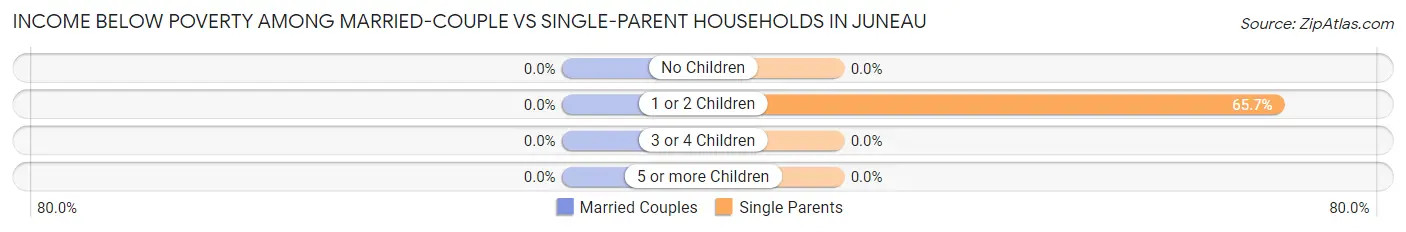
| Children | Married-Couple Families | Single-Parent Households |
| No Children | 0 (0.0%) | 0 (0.0%) |
| 1 or 2 Children | 0 (0.0%) | 44 (65.7%) |
| 3 or 4 Children | 0 (0.0%) | 0 (0.0%) |
| 5 or more Children | 0 (0.0%) | 0 (0.0%) |
| Total | 0 (0.0%) | 44 (52.4%) |
Race in Juneau
The most populous races in Juneau are White / Caucasian (2,321 | 88.0%), Hispanic or Latino (194 | 7.4%), and Two or more Races (166 | 6.3%).
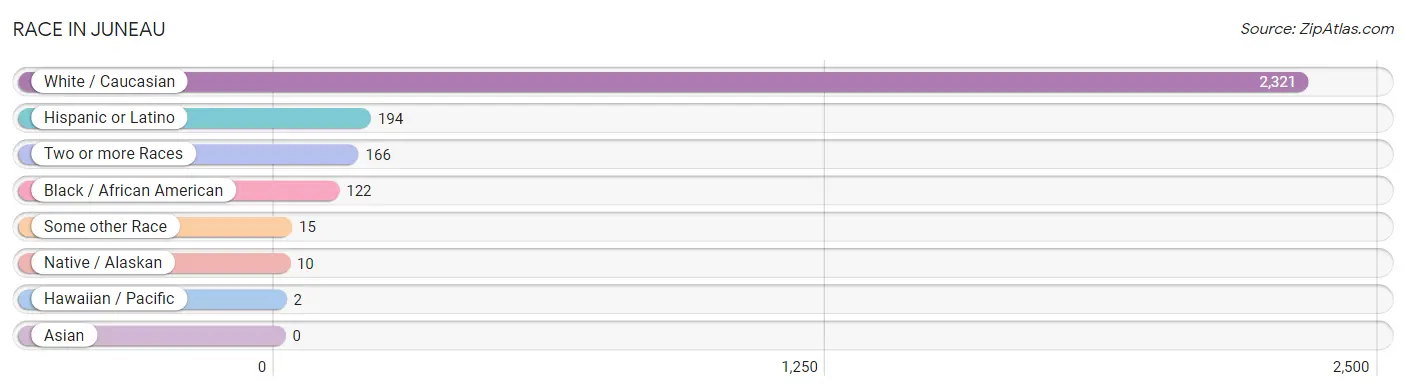
| Race | # Population | % Population |
| Asian | 0 | 0.0% |
| Black / African American | 122 | 4.6% |
| Hawaiian / Pacific | 2 | 0.1% |
| Hispanic or Latino | 194 | 7.4% |
| Native / Alaskan | 10 | 0.4% |
| White / Caucasian | 2,321 | 88.0% |
| Two or more Races | 166 | 6.3% |
| Some other Race | 15 | 0.6% |
| Total | 2,636 | 100.0% |
Ancestry in Juneau
The most populous ancestries reported in Juneau are German (1,163 | 44.1%), Irish (392 | 14.9%), Polish (210 | 8.0%), Central American (98 | 3.7%), and Nicaraguan (98 | 3.7%), together accounting for 74.4% of all Juneau residents.
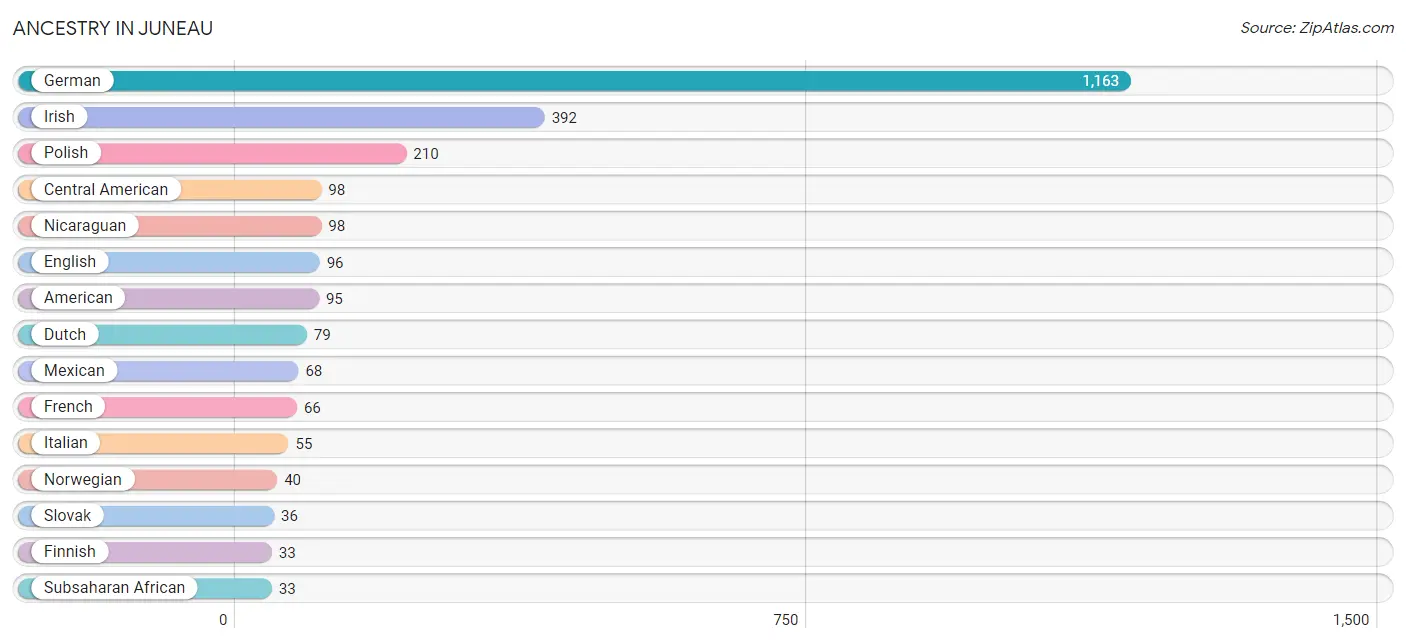
| Ancestry | # Population | % Population |
| African | 24 | 0.9% |
| Albanian | 26 | 1.0% |
| American | 95 | 3.6% |
| Central American | 98 | 3.7% |
| Chippewa | 5 | 0.2% |
| Cuban | 3 | 0.1% |
| Czech | 11 | 0.4% |
| Czechoslovakian | 6 | 0.2% |
| Danish | 13 | 0.5% |
| Dutch | 79 | 3.0% |
| English | 96 | 3.6% |
| European | 29 | 1.1% |
| Finnish | 33 | 1.3% |
| French | 66 | 2.5% |
| German | 1,163 | 44.1% |
| Hungarian | 17 | 0.6% |
| Irish | 392 | 14.9% |
| Italian | 55 | 2.1% |
| Lithuanian | 5 | 0.2% |
| Mexican | 68 | 2.6% |
| Native Hawaiian | 2 | 0.1% |
| Navajo | 9 | 0.3% |
| Nicaraguan | 98 | 3.7% |
| Nigerian | 9 | 0.3% |
| Norwegian | 40 | 1.5% |
| Polish | 210 | 8.0% |
| Russian | 11 | 0.4% |
| Scotch-Irish | 11 | 0.4% |
| Serbian | 7 | 0.3% |
| Slavic | 5 | 0.2% |
| Slovak | 36 | 1.4% |
| Slovene | 10 | 0.4% |
| Subsaharan African | 33 | 1.3% |
| Swedish | 5 | 0.2% |
| Swiss | 19 | 0.7% |
| Thai | 5 | 0.2% |
| Ukrainian | 10 | 0.4% |
| Welsh | 8 | 0.3% | View All 38 Rows |
Immigrants in Juneau
The most numerous immigrant groups reported in Juneau came from Latin America (110 | 4.2%), Central America (107 | 4.1%), Nicaragua (98 | 3.7%), Eastern Europe (36 | 1.4%), and Europe (36 | 1.4%), together accounting for 14.7% of all Juneau residents.
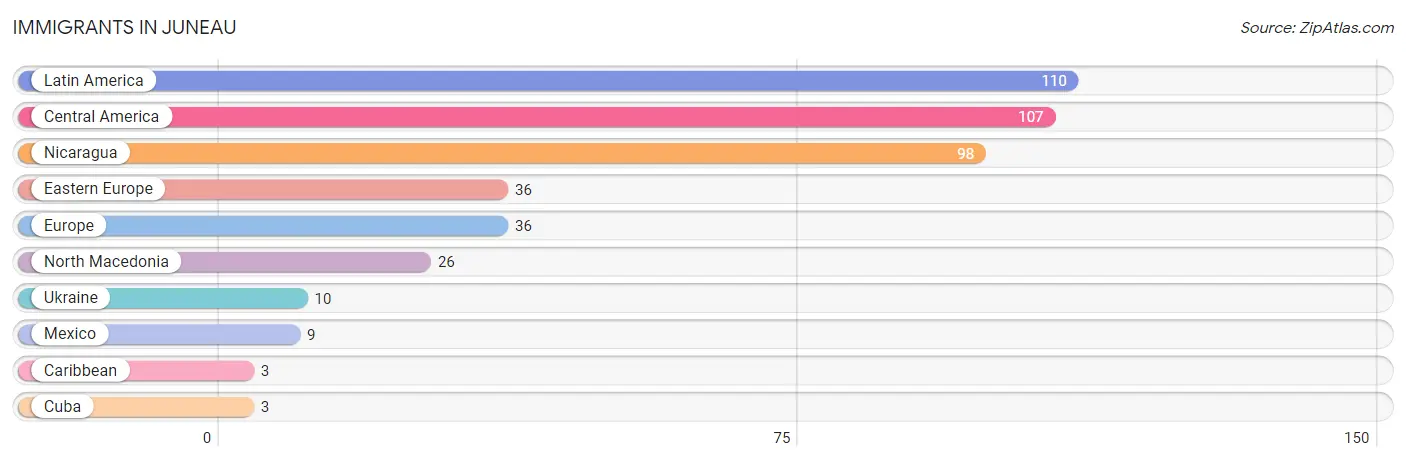
| Immigration Origin | # Population | % Population |
| Caribbean | 3 | 0.1% |
| Central America | 107 | 4.1% |
| Cuba | 3 | 0.1% |
| Eastern Europe | 36 | 1.4% |
| Europe | 36 | 1.4% |
| Latin America | 110 | 4.2% |
| Mexico | 9 | 0.3% |
| Nicaragua | 98 | 3.7% |
| North Macedonia | 26 | 1.0% |
| Ukraine | 10 | 0.4% | View All 10 Rows |
Sex and Age in Juneau
Sex and Age in Juneau
The most populous age groups in Juneau are 45 to 49 Years (131 | 9.4%) for men and 15 to 19 Years (154 | 12.4%) for women.
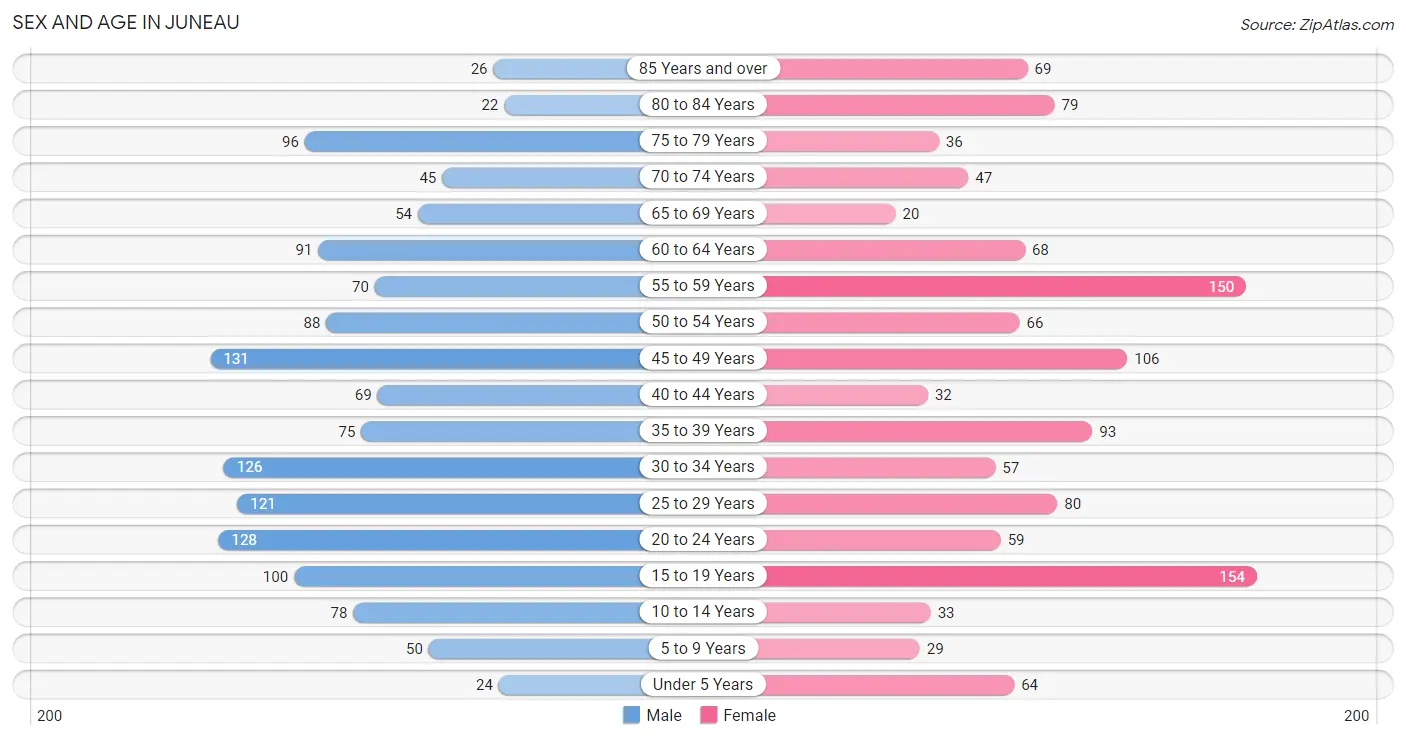
| Age Bracket | Male | Female |
| Under 5 Years | 24 (1.7%) | 64 (5.1%) |
| 5 to 9 Years | 50 (3.6%) | 29 (2.3%) |
| 10 to 14 Years | 78 (5.6%) | 33 (2.7%) |
| 15 to 19 Years | 100 (7.2%) | 154 (12.4%) |
| 20 to 24 Years | 128 (9.2%) | 59 (4.8%) |
| 25 to 29 Years | 121 (8.7%) | 80 (6.4%) |
| 30 to 34 Years | 126 (9.0%) | 57 (4.6%) |
| 35 to 39 Years | 75 (5.4%) | 93 (7.5%) |
| 40 to 44 Years | 69 (5.0%) | 32 (2.6%) |
| 45 to 49 Years | 131 (9.4%) | 106 (8.5%) |
| 50 to 54 Years | 88 (6.3%) | 66 (5.3%) |
| 55 to 59 Years | 70 (5.0%) | 150 (12.1%) |
| 60 to 64 Years | 91 (6.5%) | 68 (5.5%) |
| 65 to 69 Years | 54 (3.9%) | 20 (1.6%) |
| 70 to 74 Years | 45 (3.2%) | 47 (3.8%) |
| 75 to 79 Years | 96 (6.9%) | 36 (2.9%) |
| 80 to 84 Years | 22 (1.6%) | 79 (6.4%) |
| 85 Years and over | 26 (1.9%) | 69 (5.6%) |
| Total | 1,394 (100.0%) | 1,242 (100.0%) |
Families and Households in Juneau
Median Family Size in Juneau
The median family size in Juneau is 3.37 persons per family, with single male/father families (12 | 2.5%) accounting for the largest median family size of 4.92 persons per family. On the other hand, single female/mother families (72 | 15.1%) represent the smallest median family size with 2.83 persons per family.
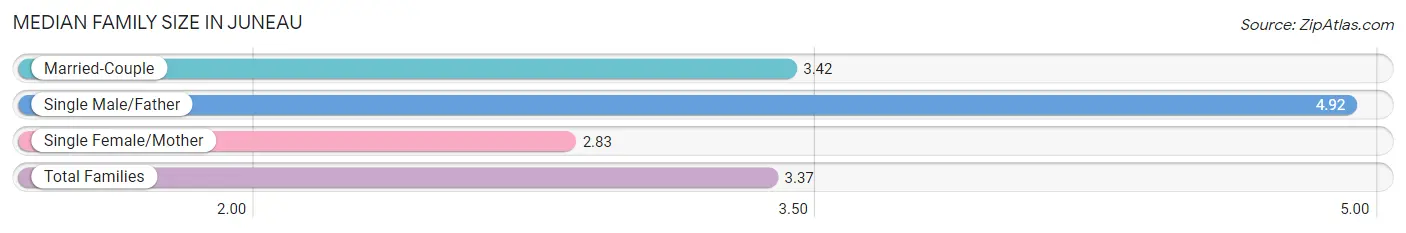
| Family Type | # Families | Family Size |
| Married-Couple | 392 (82.4%) | 3.42 |
| Single Male/Father | 12 (2.5%) | 4.92 |
| Single Female/Mother | 72 (15.1%) | 2.83 |
| Total Families | 476 (100.0%) | 3.37 |
Median Household Size in Juneau
The median household size in Juneau is 2.76 persons per household, with single male/father households (12 | 1.5%) accounting for the largest median household size of 4.92 persons per household. non-family households (305 | 39.1%) represent the smallest median household size with 1.58 persons per household.
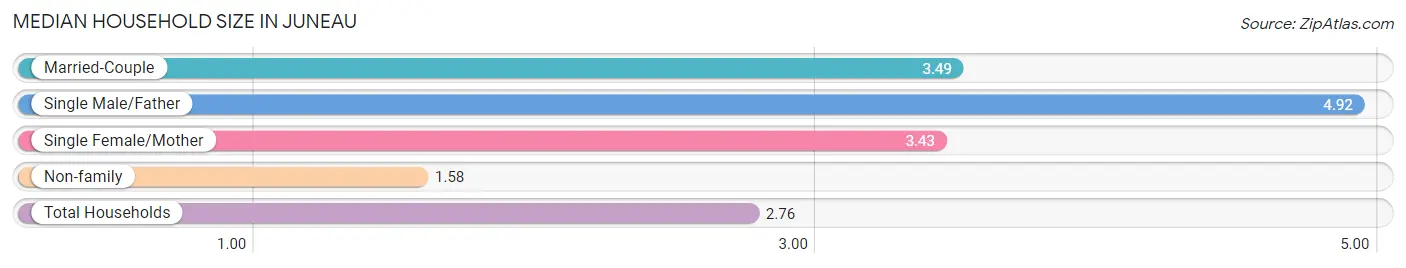
| Household Type | # Households | Household Size |
| Married-Couple | 392 (50.2%) | 3.49 |
| Single Male/Father | 12 (1.5%) | 4.92 |
| Single Female/Mother | 72 (9.2%) | 3.43 |
| Non-family | 305 (39.1%) | 1.58 |
| Total Households | 781 (100.0%) | 2.76 |
Household Size by Marriage Status in Juneau
Out of a total of 781 households in Juneau, 476 (61.0%) are family households, while 305 (39.1%) are nonfamily households. The most numerous type of family households are 2-person households, comprising 157, and the most common type of nonfamily households are 1-person households, comprising 245.
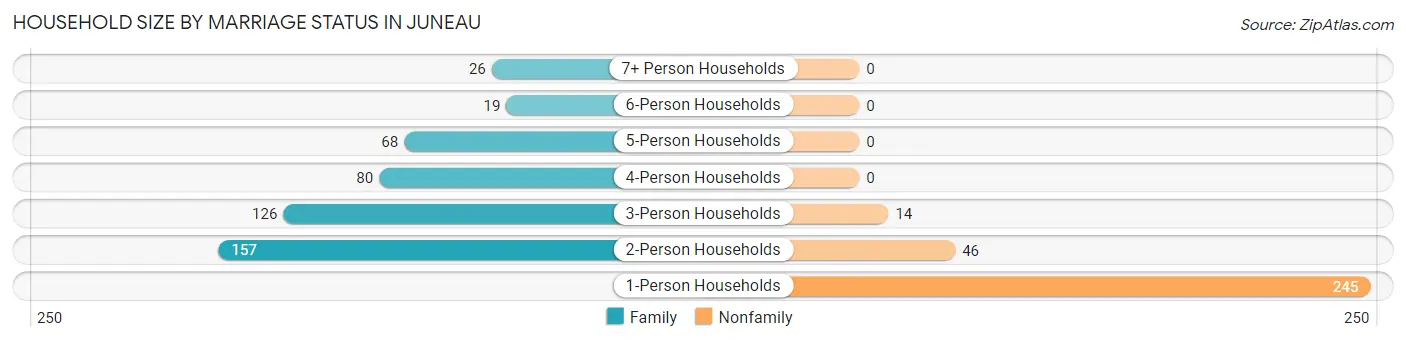
| Household Size | Family Households | Nonfamily Households |
| 1-Person Households | - | 245 (31.4%) |
| 2-Person Households | 157 (20.1%) | 46 (5.9%) |
| 3-Person Households | 126 (16.1%) | 14 (1.8%) |
| 4-Person Households | 80 (10.2%) | 0 (0.0%) |
| 5-Person Households | 68 (8.7%) | 0 (0.0%) |
| 6-Person Households | 19 (2.4%) | 0 (0.0%) |
| 7+ Person Households | 26 (3.3%) | 0 (0.0%) |
| Total | 476 (61.0%) | 305 (39.1%) |
Female Fertility in Juneau
Fertility by Age in Juneau
Average fertility rate in Juneau is 43.0 births per 1,000 women. Women in the age bracket of 20 to 34 years have the highest fertility rate with 133.0 births per 1,000 women. Women in the age bracket of 20 to 34 years acount for 100.0% of all women with births.
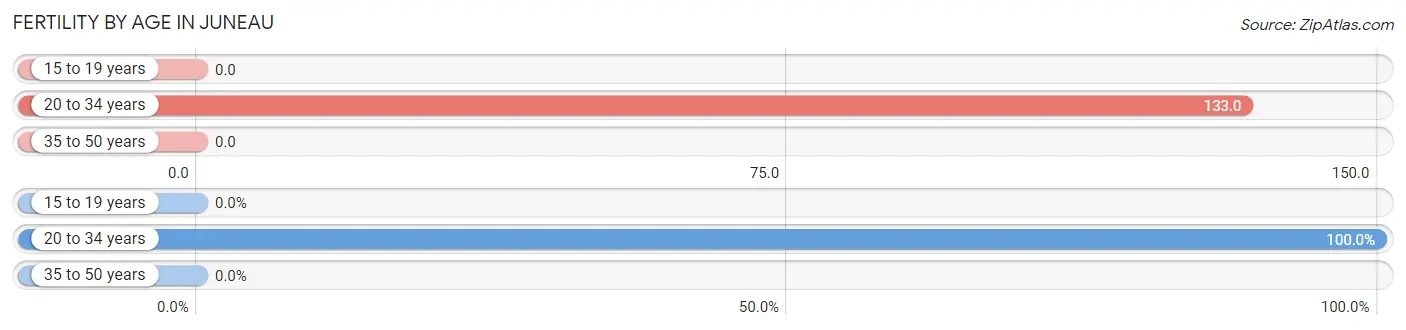
| Age Bracket | Women with Births | Births / 1,000 Women |
| 15 to 19 years | 0 (0.0%) | 0.0 |
| 20 to 34 years | 26 (100.0%) | 133.0 |
| 35 to 50 years | 0 (0.0%) | 0.0 |
| Total | 26 (100.0%) | 43.0 |
Fertility by Age by Marriage Status in Juneau
73.1% of women with births (26) in Juneau are married. The highest percentage of unmarried women with births falls into 20 to 34 years age bracket with 26.9% of them unmarried at the time of birth, while the lowest percentage of unmarried women with births belong to 20 to 34 years age bracket with 26.9% of them unmarried.
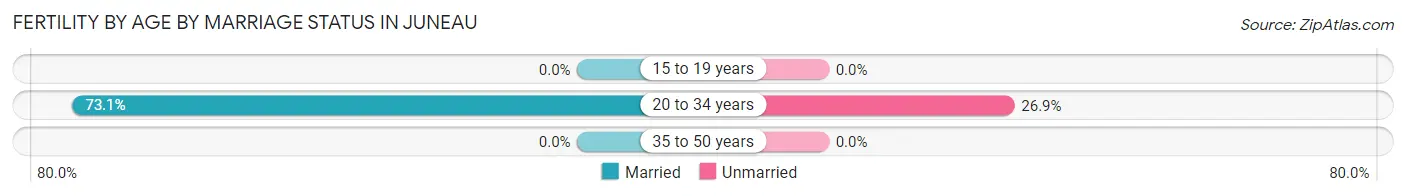
| Age Bracket | Married | Unmarried |
| 15 to 19 years | 0 (0.0%) | 0 (0.0%) |
| 20 to 34 years | 19 (73.1%) | 7 (26.9%) |
| 35 to 50 years | 0 (0.0%) | 0 (0.0%) |
| Total | 19 (73.1%) | 7 (26.9%) |
Fertility by Education in Juneau
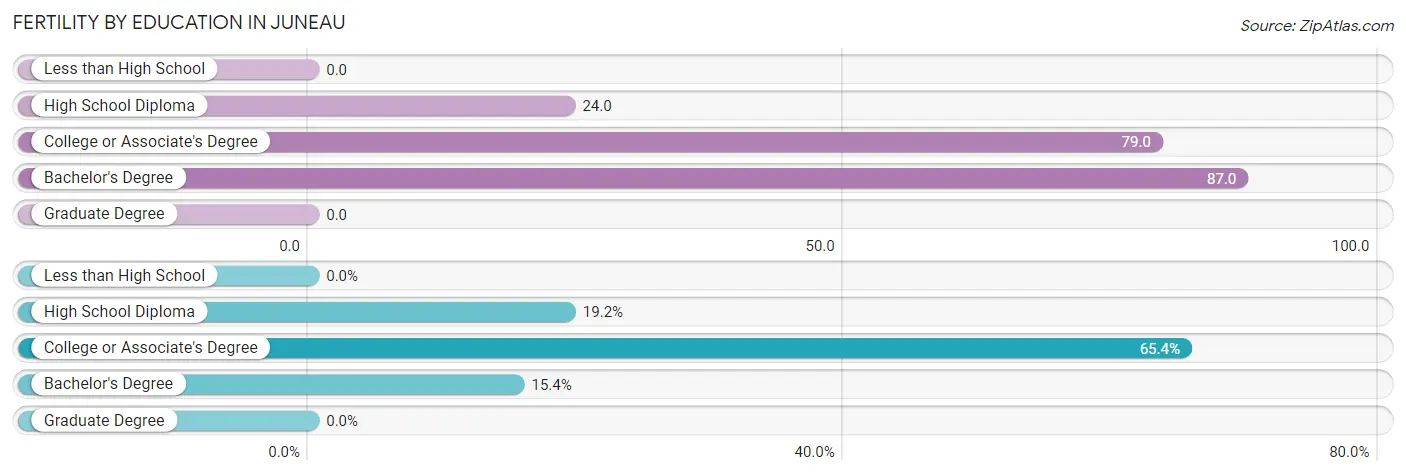
| Educational Attainment | Women with Births | Births / 1,000 Women |
| Less than High School | 0 (0.0%) | 0.0 |
| High School Diploma | 5 (19.2%) | 24.0 |
| College or Associate's Degree | 17 (65.4%) | 79.0 |
| Bachelor's Degree | 4 (15.4%) | 87.0 |
| Graduate Degree | 0 (0.0%) | 0.0 |
| Total | 26 (100.0%) | 43.0 |
Fertility by Education by Marriage Status in Juneau
26.9% of women with births in Juneau are unmarried. Women with the educational attainment of high school diploma are most likely to be married with 100.0% of them married at childbirth, while women with the educational attainment of college or associate's degree are least likely to be married with 41.2% of them unmarried at childbirth.
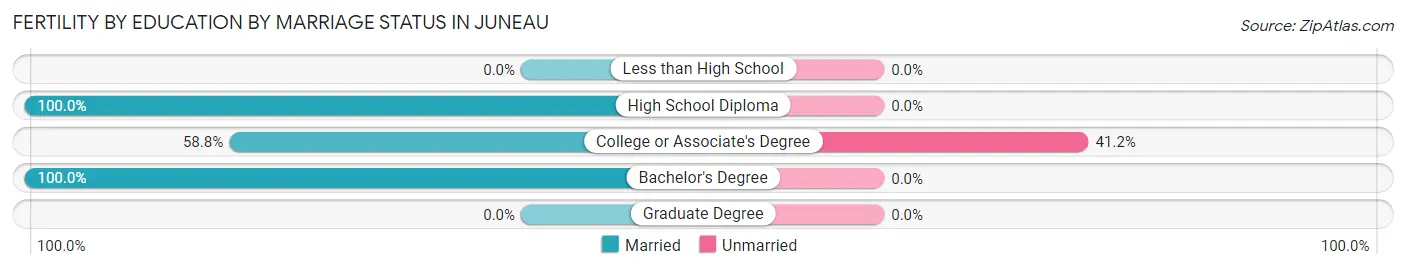
| Educational Attainment | Married | Unmarried |
| Less than High School | 0 (0.0%) | 0 (0.0%) |
| High School Diploma | 5 (100.0%) | 0 (0.0%) |
| College or Associate's Degree | 10 (58.8%) | 7 (41.2%) |
| Bachelor's Degree | 4 (100.0%) | 0 (0.0%) |
| Graduate Degree | 0 (0.0%) | 0 (0.0%) |
| Total | 19 (73.1%) | 7 (26.9%) |
Employment Characteristics in Juneau
Employment by Class of Employer in Juneau
Among the 1,236 employed individuals in Juneau, private company employees (1,041 | 84.2%), local government employees (88 | 7.1%), and not-for-profit organizations (53 | 4.3%) make up the most common classes of employment.
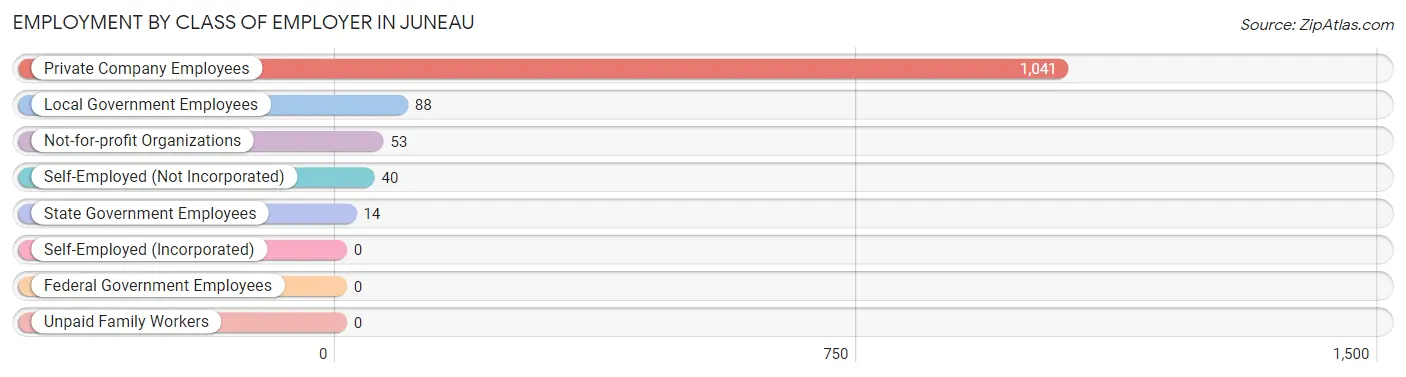
| Employer Class | # Employees | % Employees |
| Private Company Employees | 1,041 | 84.2% |
| Self-Employed (Incorporated) | 0 | 0.0% |
| Self-Employed (Not Incorporated) | 40 | 3.2% |
| Not-for-profit Organizations | 53 | 4.3% |
| Local Government Employees | 88 | 7.1% |
| State Government Employees | 14 | 1.1% |
| Federal Government Employees | 0 | 0.0% |
| Unpaid Family Workers | 0 | 0.0% |
| Total | 1,236 | 100.0% |
Employment Status by Age in Juneau
According to the labor force statistics for Juneau, out of the total population over 16 years of age (2,316), 56.4% or 1,306 individuals are in the labor force, with 4.7% or 61 of them unemployed. The age group with the highest labor force participation rate is 55 to 59 years, with 88.2% or 194 individuals in the labor force. Within the labor force, the 25 to 29 years age range has the highest percentage of unemployed individuals, with 19.1% or 27 of them being unemployed.
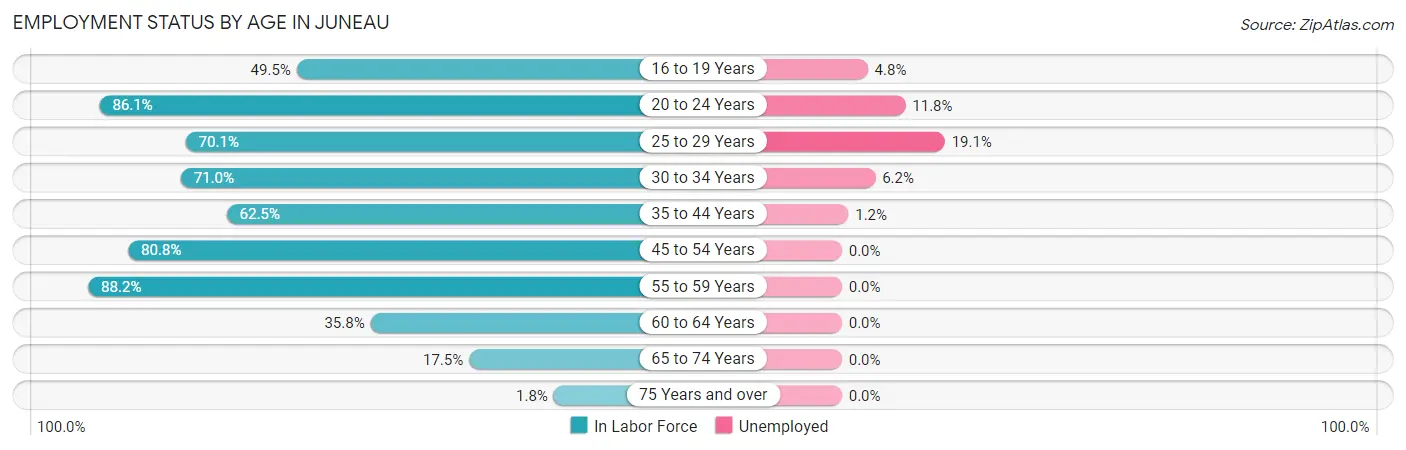
| Age Bracket | In Labor Force | Unemployed |
| 16 to 19 Years | 105 (49.5%) | 5 (4.8%) |
| 20 to 24 Years | 161 (86.1%) | 19 (11.8%) |
| 25 to 29 Years | 141 (70.1%) | 27 (19.1%) |
| 30 to 34 Years | 130 (71.0%) | 8 (6.2%) |
| 35 to 44 Years | 168 (62.5%) | 2 (1.2%) |
| 45 to 54 Years | 316 (80.8%) | 0 (0.0%) |
| 55 to 59 Years | 194 (88.2%) | 0 (0.0%) |
| 60 to 64 Years | 57 (35.8%) | 0 (0.0%) |
| 65 to 74 Years | 29 (17.5%) | 0 (0.0%) |
| 75 Years and over | 6 (1.8%) | 0 (0.0%) |
| Total | 1,306 (56.4%) | 61 (4.7%) |
Employment Status by Educational Attainment in Juneau
According to labor force statistics for Juneau, 70.7% of individuals (1,006) out of the total population between 25 and 64 years of age (1,423) are in the labor force, with 3.7% or 37 of them being unemployed. The group with the highest labor force participation rate are those with the educational attainment of high school diploma, with 75.9% or 459 individuals in the labor force. Within the labor force, individuals with less than high school education have the highest percentage of unemployment, with 22.9% or 27 of them being unemployed.
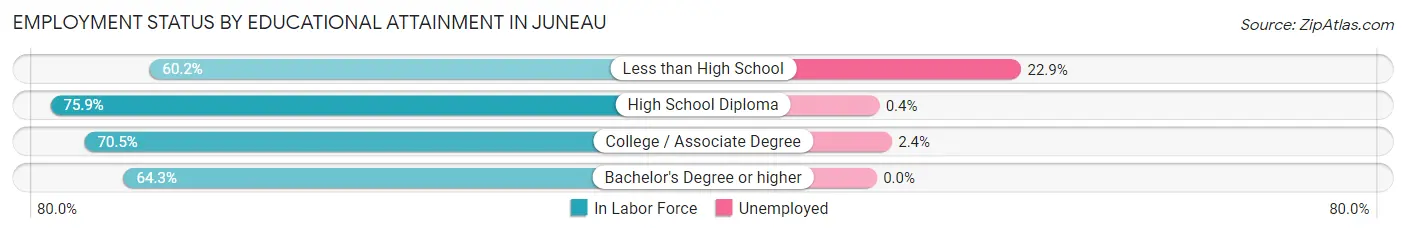
| Educational Attainment | In Labor Force | Unemployed |
| Less than High School | 118 (60.2%) | 45 (22.9%) |
| High School Diploma | 459 (75.9%) | 2 (0.4%) |
| College / Associate Degree | 328 (70.5%) | 11 (2.4%) |
| Bachelor's Degree or higher | 101 (64.3%) | 0 (0.0%) |
| Total | 1,006 (70.7%) | 53 (3.7%) |
Employment Occupations by Sex in Juneau
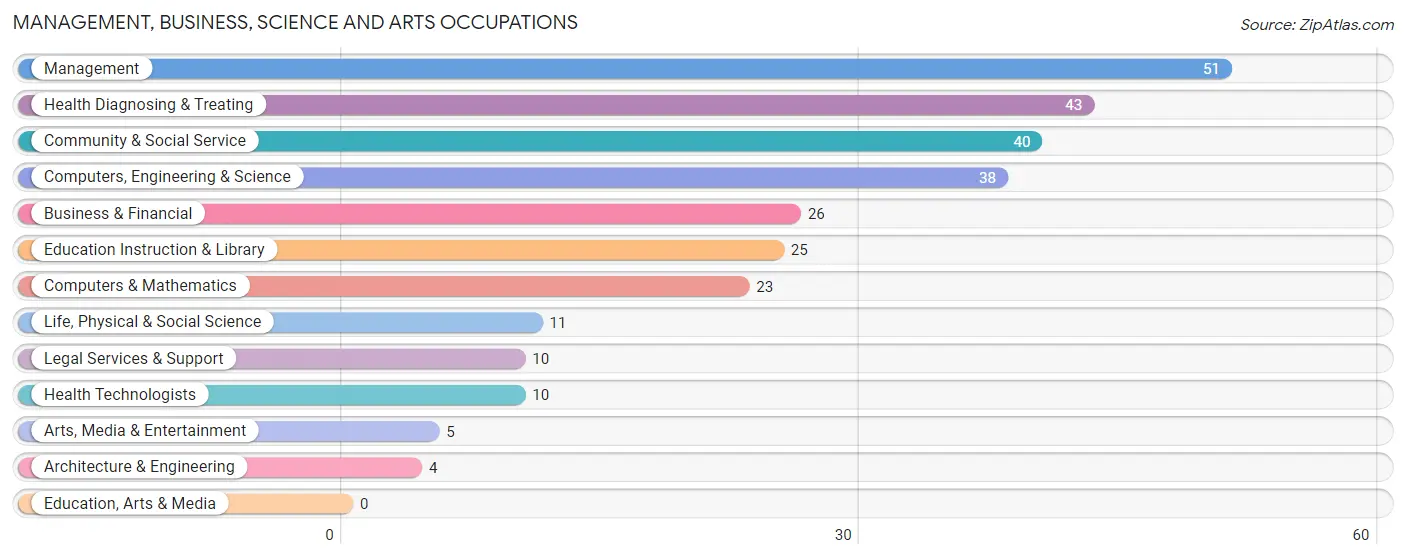
Management, Business, Science and Arts Occupations
The most common Management, Business, Science and Arts occupations in Juneau are Management (51 | 4.1%), Health Diagnosing & Treating (43 | 3.5%), Community & Social Service (40 | 3.2%), Computers, Engineering & Science (38 | 3.0%), and Business & Financial (26 | 2.1%).
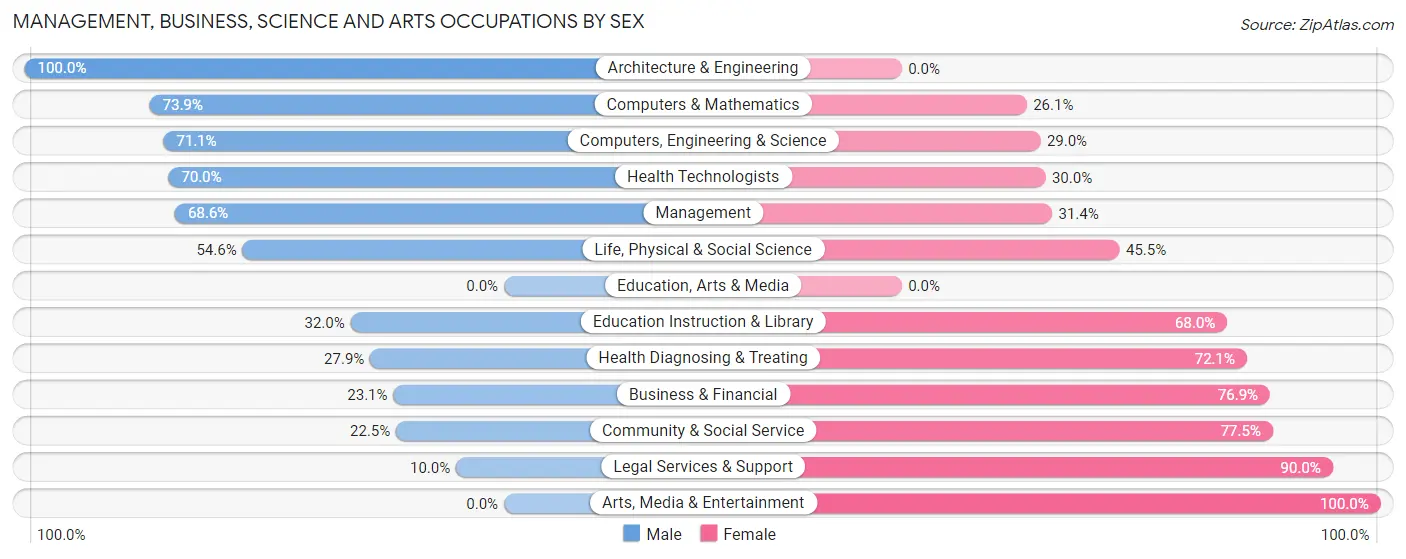
Management, Business, Science and Arts Occupations by Sex
Within the Management, Business, Science and Arts occupations in Juneau, the most male-oriented occupations are Architecture & Engineering (100.0%), Computers & Mathematics (73.9%), and Computers, Engineering & Science (71.1%), while the most female-oriented occupations are Arts, Media & Entertainment (100.0%), Legal Services & Support (90.0%), and Community & Social Service (77.5%).
| Occupation | Male | Female |
| Management | 35 (68.6%) | 16 (31.4%) |
| Business & Financial | 6 (23.1%) | 20 (76.9%) |
| Computers, Engineering & Science | 27 (71.1%) | 11 (28.9%) |
| Computers & Mathematics | 17 (73.9%) | 6 (26.1%) |
| Architecture & Engineering | 4 (100.0%) | 0 (0.0%) |
| Life, Physical & Social Science | 6 (54.5%) | 5 (45.5%) |
| Community & Social Service | 9 (22.5%) | 31 (77.5%) |
| Education, Arts & Media | 0 (0.0%) | 0 (0.0%) |
| Legal Services & Support | 1 (10.0%) | 9 (90.0%) |
| Education Instruction & Library | 8 (32.0%) | 17 (68.0%) |
| Arts, Media & Entertainment | 0 (0.0%) | 5 (100.0%) |
| Health Diagnosing & Treating | 12 (27.9%) | 31 (72.1%) |
| Health Technologists | 7 (70.0%) | 3 (30.0%) |
| Total (Category) | 89 (45.0%) | 109 (55.0%) |
| Total (Overall) | 624 (50.1%) | 622 (49.9%) |
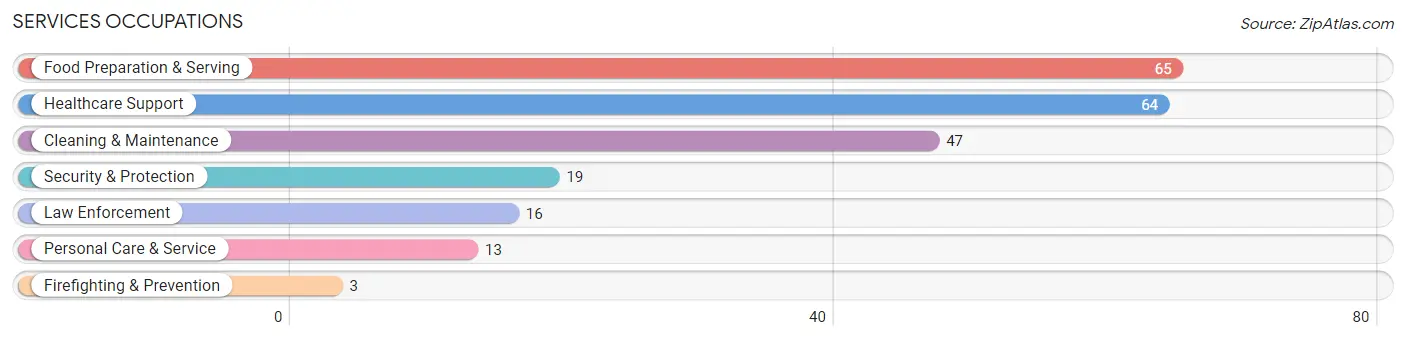
Services Occupations
The most common Services occupations in Juneau are Food Preparation & Serving (65 | 5.2%), Healthcare Support (64 | 5.1%), Cleaning & Maintenance (47 | 3.8%), Security & Protection (19 | 1.5%), and Law Enforcement (16 | 1.3%).
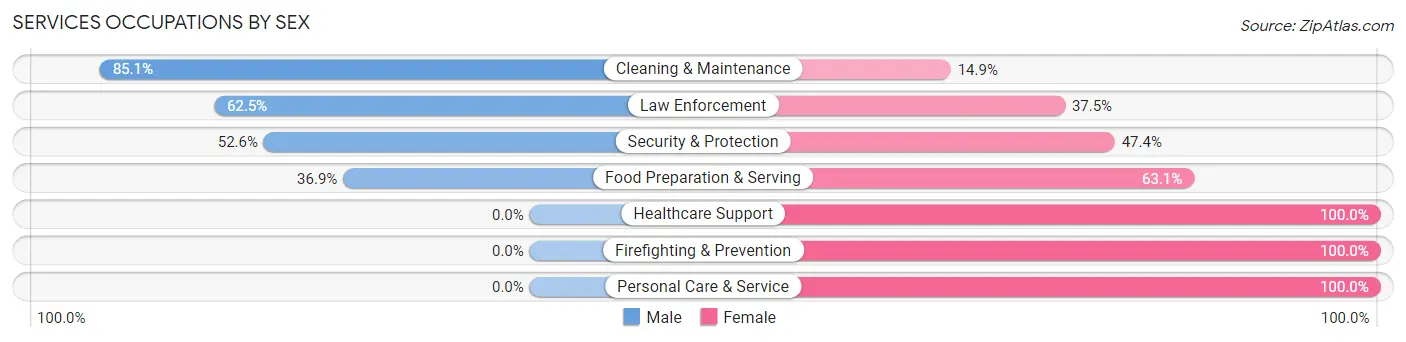
Services Occupations by Sex
Within the Services occupations in Juneau, the most male-oriented occupations are Cleaning & Maintenance (85.1%), Law Enforcement (62.5%), and Security & Protection (52.6%), while the most female-oriented occupations are Healthcare Support (100.0%), Firefighting & Prevention (100.0%), and Personal Care & Service (100.0%).
| Occupation | Male | Female |
| Healthcare Support | 0 (0.0%) | 64 (100.0%) |
| Security & Protection | 10 (52.6%) | 9 (47.4%) |
| Firefighting & Prevention | 0 (0.0%) | 3 (100.0%) |
| Law Enforcement | 10 (62.5%) | 6 (37.5%) |
| Food Preparation & Serving | 24 (36.9%) | 41 (63.1%) |
| Cleaning & Maintenance | 40 (85.1%) | 7 (14.9%) |
| Personal Care & Service | 0 (0.0%) | 13 (100.0%) |
| Total (Category) | 74 (35.6%) | 134 (64.4%) |
| Total (Overall) | 624 (50.1%) | 622 (49.9%) |
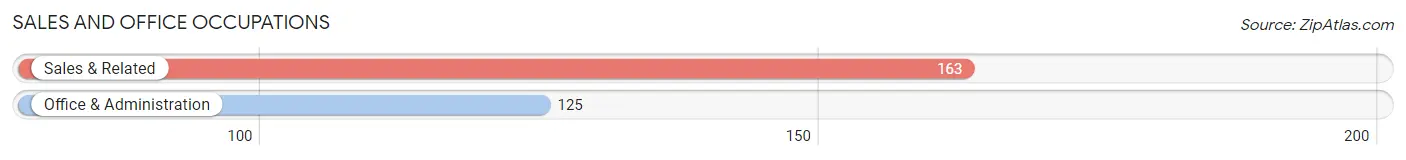
Sales and Office Occupations
The most common Sales and Office occupations in Juneau are Sales & Related (163 | 13.1%), and Office & Administration (125 | 10.0%).
Sales and Office Occupations by Sex
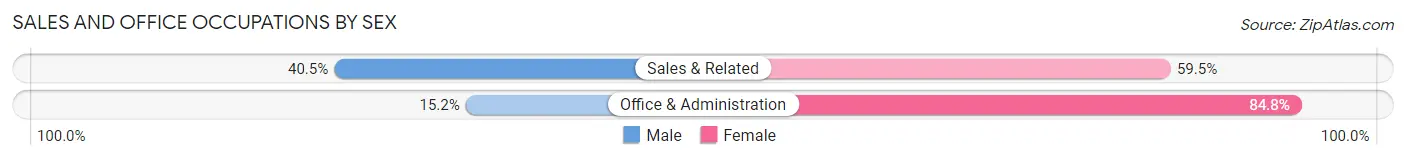
| Occupation | Male | Female |
| Sales & Related | 66 (40.5%) | 97 (59.5%) |
| Office & Administration | 19 (15.2%) | 106 (84.8%) |
| Total (Category) | 85 (29.5%) | 203 (70.5%) |
| Total (Overall) | 624 (50.1%) | 622 (49.9%) |
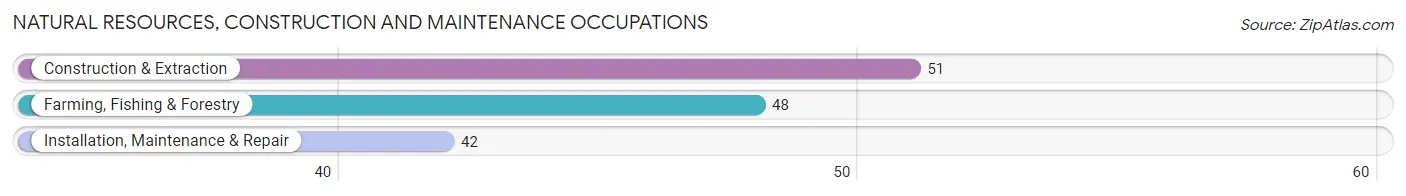
Natural Resources, Construction and Maintenance Occupations
The most common Natural Resources, Construction and Maintenance occupations in Juneau are Construction & Extraction (51 | 4.1%), Farming, Fishing & Forestry (48 | 3.8%), and Installation, Maintenance & Repair (42 | 3.4%).
Natural Resources, Construction and Maintenance Occupations by Sex
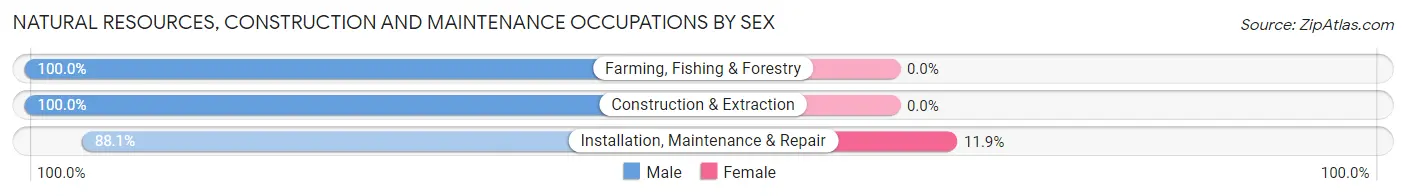
| Occupation | Male | Female |
| Farming, Fishing & Forestry | 48 (100.0%) | 0 (0.0%) |
| Construction & Extraction | 51 (100.0%) | 0 (0.0%) |
| Installation, Maintenance & Repair | 37 (88.1%) | 5 (11.9%) |
| Total (Category) | 136 (96.5%) | 5 (3.5%) |
| Total (Overall) | 624 (50.1%) | 622 (49.9%) |
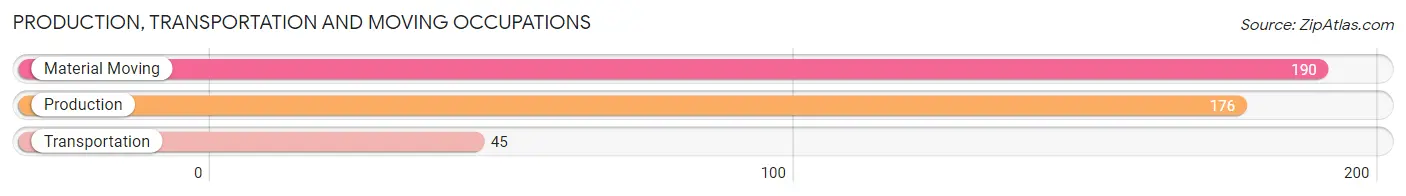
Production, Transportation and Moving Occupations
The most common Production, Transportation and Moving occupations in Juneau are Material Moving (190 | 15.2%), Production (176 | 14.1%), and Transportation (45 | 3.6%).
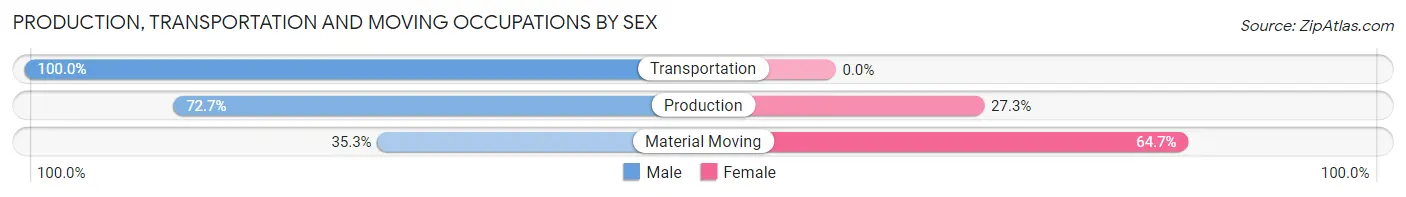
Production, Transportation and Moving Occupations by Sex
| Occupation | Male | Female |
| Production | 128 (72.7%) | 48 (27.3%) |
| Transportation | 45 (100.0%) | 0 (0.0%) |
| Material Moving | 67 (35.3%) | 123 (64.7%) |
| Total (Category) | 240 (58.4%) | 171 (41.6%) |
| Total (Overall) | 624 (50.1%) | 622 (49.9%) |
Employment Industries by Sex in Juneau
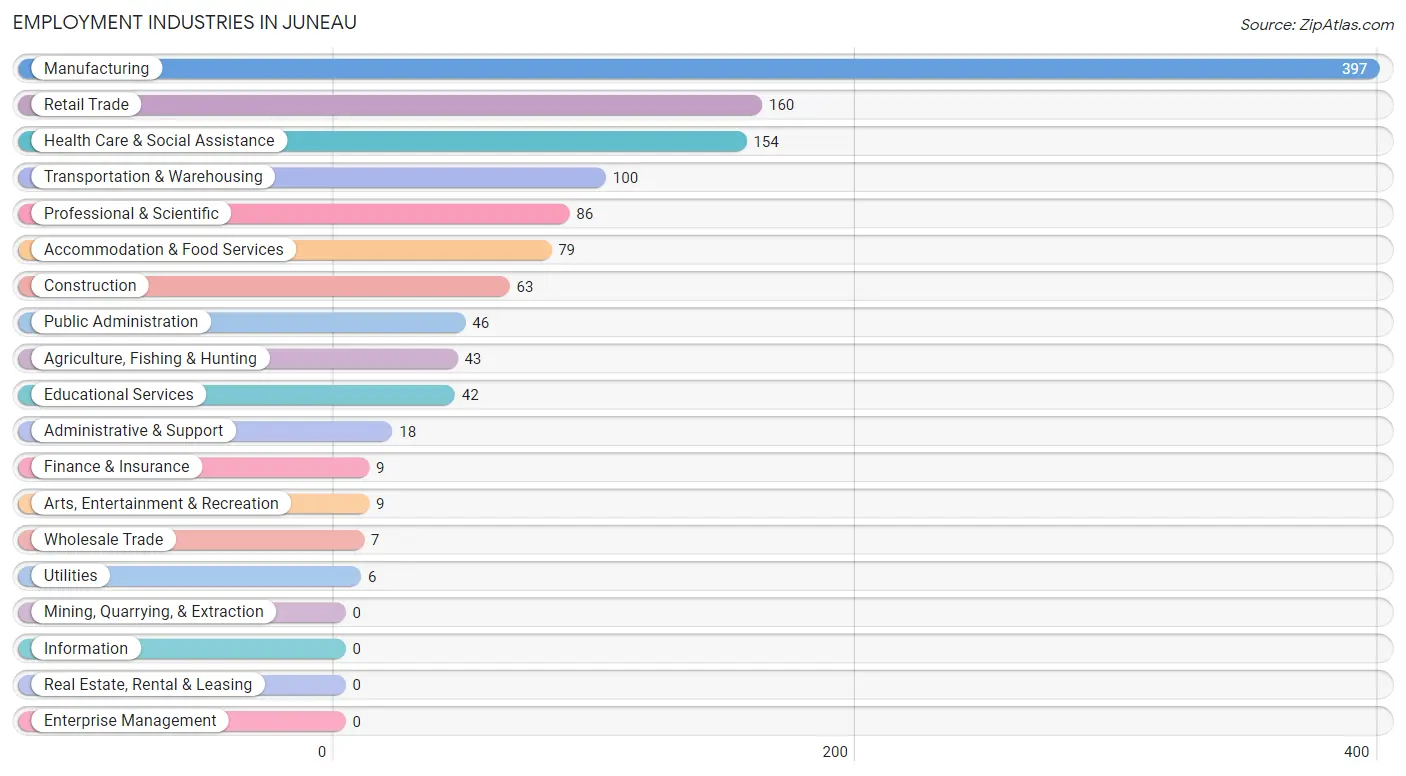
Employment Industries in Juneau
The major employment industries in Juneau include Manufacturing (397 | 31.9%), Retail Trade (160 | 12.8%), Health Care & Social Assistance (154 | 12.4%), Transportation & Warehousing (100 | 8.0%), and Professional & Scientific (86 | 6.9%).
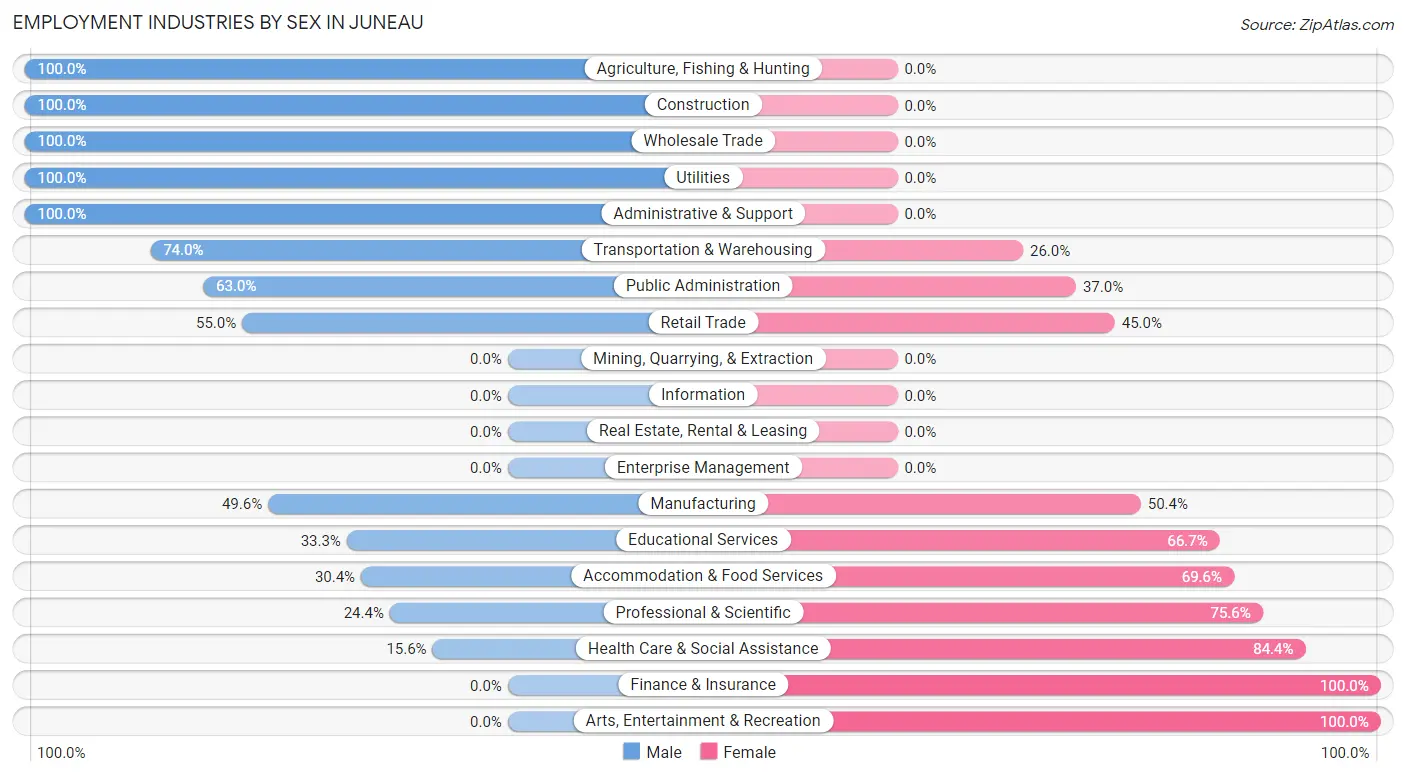
Employment Industries by Sex in Juneau
The Juneau industries that see more men than women are Agriculture, Fishing & Hunting (100.0%), Construction (100.0%), and Wholesale Trade (100.0%), whereas the industries that tend to have a higher number of women are Finance & Insurance (100.0%), Arts, Entertainment & Recreation (100.0%), and Health Care & Social Assistance (84.4%).
| Industry | Male | Female |
| Agriculture, Fishing & Hunting | 43 (100.0%) | 0 (0.0%) |
| Mining, Quarrying, & Extraction | 0 (0.0%) | 0 (0.0%) |
| Construction | 63 (100.0%) | 0 (0.0%) |
| Manufacturing | 197 (49.6%) | 200 (50.4%) |
| Wholesale Trade | 7 (100.0%) | 0 (0.0%) |
| Retail Trade | 88 (55.0%) | 72 (45.0%) |
| Transportation & Warehousing | 74 (74.0%) | 26 (26.0%) |
| Utilities | 6 (100.0%) | 0 (0.0%) |
| Information | 0 (0.0%) | 0 (0.0%) |
| Finance & Insurance | 0 (0.0%) | 9 (100.0%) |
| Real Estate, Rental & Leasing | 0 (0.0%) | 0 (0.0%) |
| Professional & Scientific | 21 (24.4%) | 65 (75.6%) |
| Enterprise Management | 0 (0.0%) | 0 (0.0%) |
| Administrative & Support | 18 (100.0%) | 0 (0.0%) |
| Educational Services | 14 (33.3%) | 28 (66.7%) |
| Health Care & Social Assistance | 24 (15.6%) | 130 (84.4%) |
| Arts, Entertainment & Recreation | 0 (0.0%) | 9 (100.0%) |
| Accommodation & Food Services | 24 (30.4%) | 55 (69.6%) |
| Public Administration | 29 (63.0%) | 17 (37.0%) |
| Total | 624 (50.1%) | 622 (49.9%) |
Education in Juneau
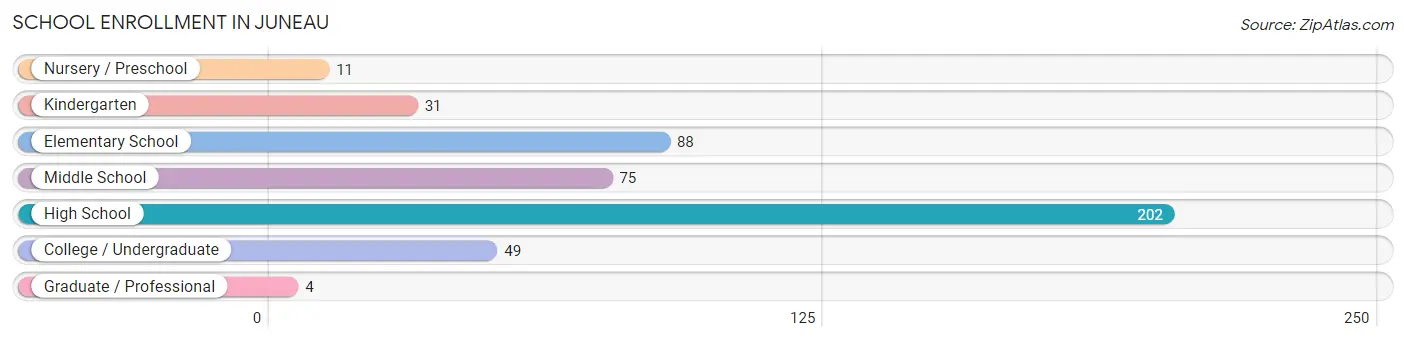
School Enrollment in Juneau
The most common levels of schooling among the 460 students in Juneau are high school (202 | 43.9%), elementary school (88 | 19.1%), and middle school (75 | 16.3%).
| School Level | # Students | % Students |
| Nursery / Preschool | 11 | 2.4% |
| Kindergarten | 31 | 6.7% |
| Elementary School | 88 | 19.1% |
| Middle School | 75 | 16.3% |
| High School | 202 | 43.9% |
| College / Undergraduate | 49 | 10.6% |
| Graduate / Professional | 4 | 0.9% |
| Total | 460 | 100.0% |
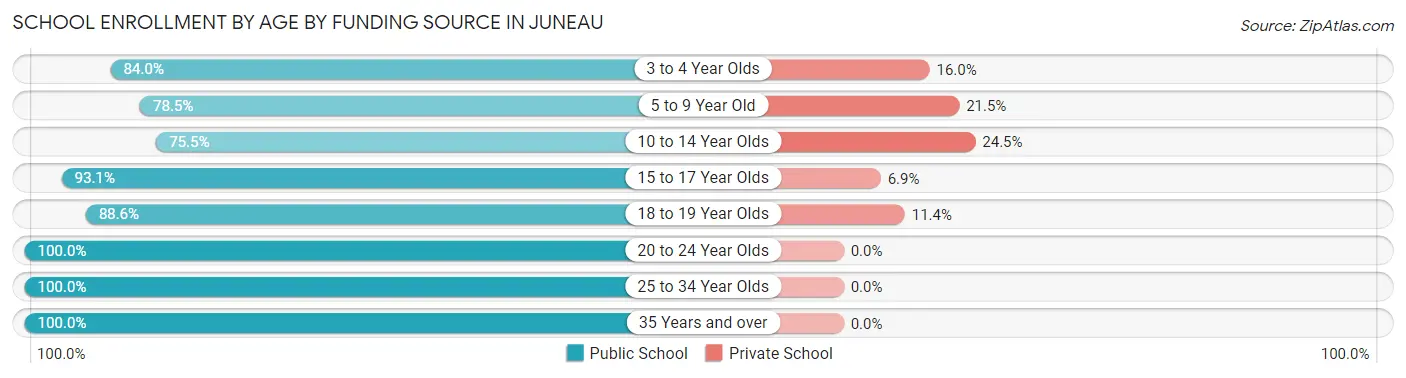
School Enrollment by Age by Funding Source in Juneau
Out of a total of 460 students who are enrolled in schools in Juneau, 66 (14.3%) attend a private institution, while the remaining 394 (85.7%) are enrolled in public schools. The age group of 10 to 14 year olds has the highest likelihood of being enrolled in private schools, with 26 (24.5% in the age bracket) enrolled. Conversely, the age group of 20 to 24 year olds has the lowest likelihood of being enrolled in a private school, with 8 (100.0% in the age bracket) attending a public institution.
| Age Bracket | Public School | Private School |
| 3 to 4 Year Olds | 21 (84.0%) | 4 (16.0%) |
| 5 to 9 Year Old | 62 (78.5%) | 17 (21.5%) |
| 10 to 14 Year Olds | 80 (75.5%) | 26 (24.5%) |
| 15 to 17 Year Olds | 135 (93.1%) | 10 (6.9%) |
| 18 to 19 Year Olds | 70 (88.6%) | 9 (11.4%) |
| 20 to 24 Year Olds | 8 (100.0%) | 0 (0.0%) |
| 25 to 34 Year Olds | 13 (100.0%) | 0 (0.0%) |
| 35 Years and over | 5 (100.0%) | 0 (0.0%) |
| Total | 394 (85.7%) | 66 (14.3%) |
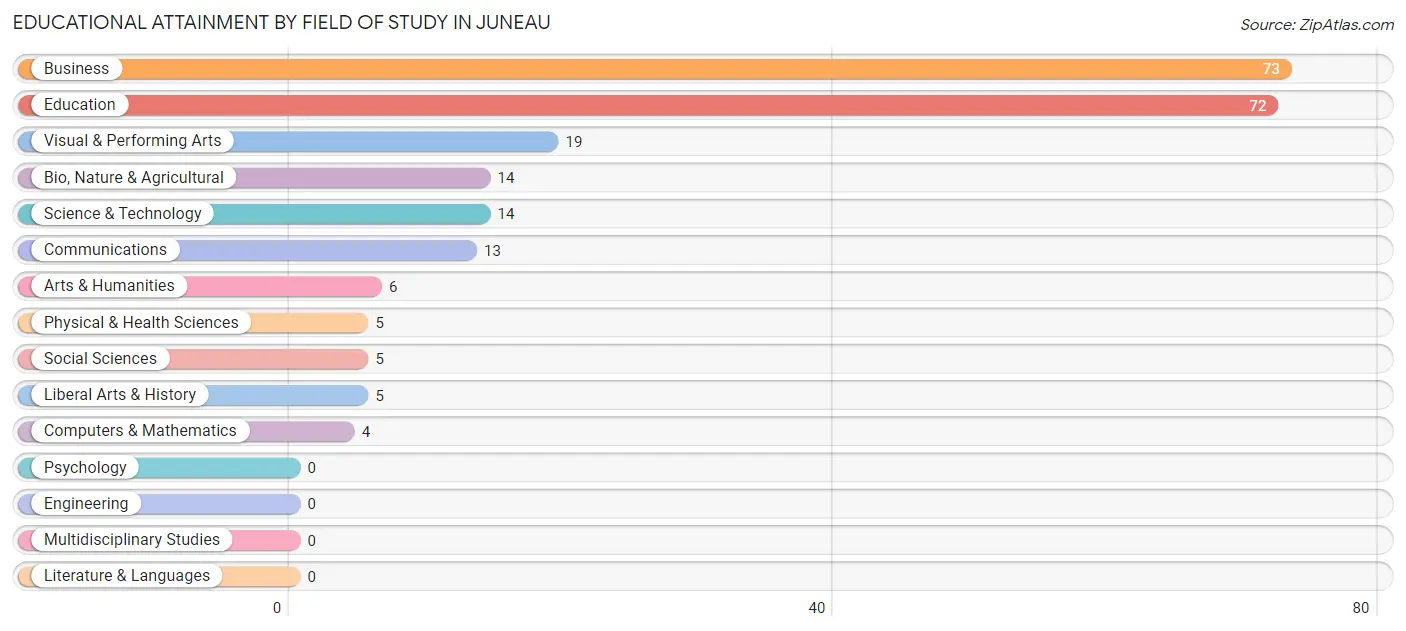
Educational Attainment by Field of Study in Juneau
Business (73 | 31.7%), education (72 | 31.3%), visual & performing arts (19 | 8.3%), bio, nature & agricultural (14 | 6.1%), and science & technology (14 | 6.1%) are the most common fields of study among 230 individuals in Juneau who have obtained a bachelor's degree or higher.
| Field of Study | # Graduates | % Graduates |
| Computers & Mathematics | 4 | 1.7% |
| Bio, Nature & Agricultural | 14 | 6.1% |
| Physical & Health Sciences | 5 | 2.2% |
| Psychology | 0 | 0.0% |
| Social Sciences | 5 | 2.2% |
| Engineering | 0 | 0.0% |
| Multidisciplinary Studies | 0 | 0.0% |
| Science & Technology | 14 | 6.1% |
| Business | 73 | 31.7% |
| Education | 72 | 31.3% |
| Literature & Languages | 0 | 0.0% |
| Liberal Arts & History | 5 | 2.2% |
| Visual & Performing Arts | 19 | 8.3% |
| Communications | 13 | 5.7% |
| Arts & Humanities | 6 | 2.6% |
| Total | 230 | 100.0% |
Transportation & Commute in Juneau
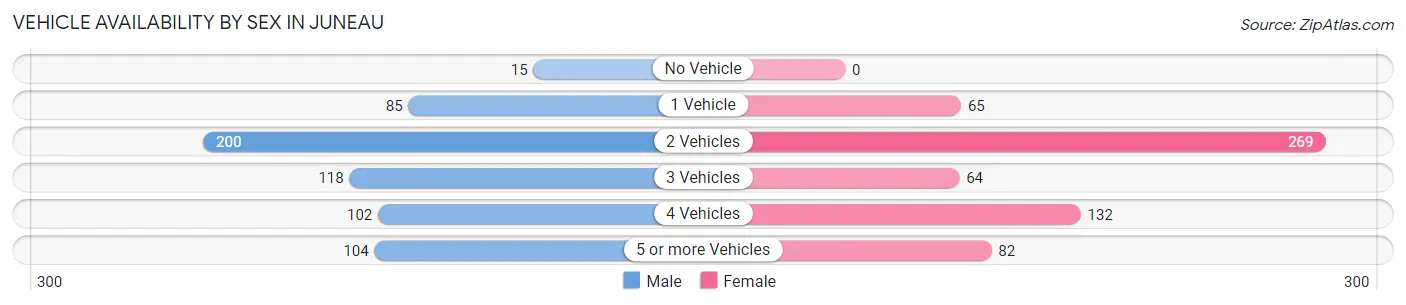
Vehicle Availability by Sex in Juneau
The most prevalent vehicle ownership categories in Juneau are males with 2 vehicles (200, accounting for 32.1%) and females with 2 vehicles (269, making up 32.7%).
| Vehicles Available | Male | Female |
| No Vehicle | 15 (2.4%) | 0 (0.0%) |
| 1 Vehicle | 85 (13.6%) | 65 (10.6%) |
| 2 Vehicles | 200 (32.1%) | 269 (44.0%) |
| 3 Vehicles | 118 (18.9%) | 64 (10.5%) |
| 4 Vehicles | 102 (16.4%) | 132 (21.6%) |
| 5 or more Vehicles | 104 (16.7%) | 82 (13.4%) |
| Total | 624 (100.0%) | 612 (100.0%) |
Commute Time in Juneau
The most frequently occuring commute durations in Juneau are 20 to 24 minutes (228 commuters, 18.8%), 30 to 34 minutes (228 commuters, 18.8%), and 5 to 9 minutes (193 commuters, 15.9%).
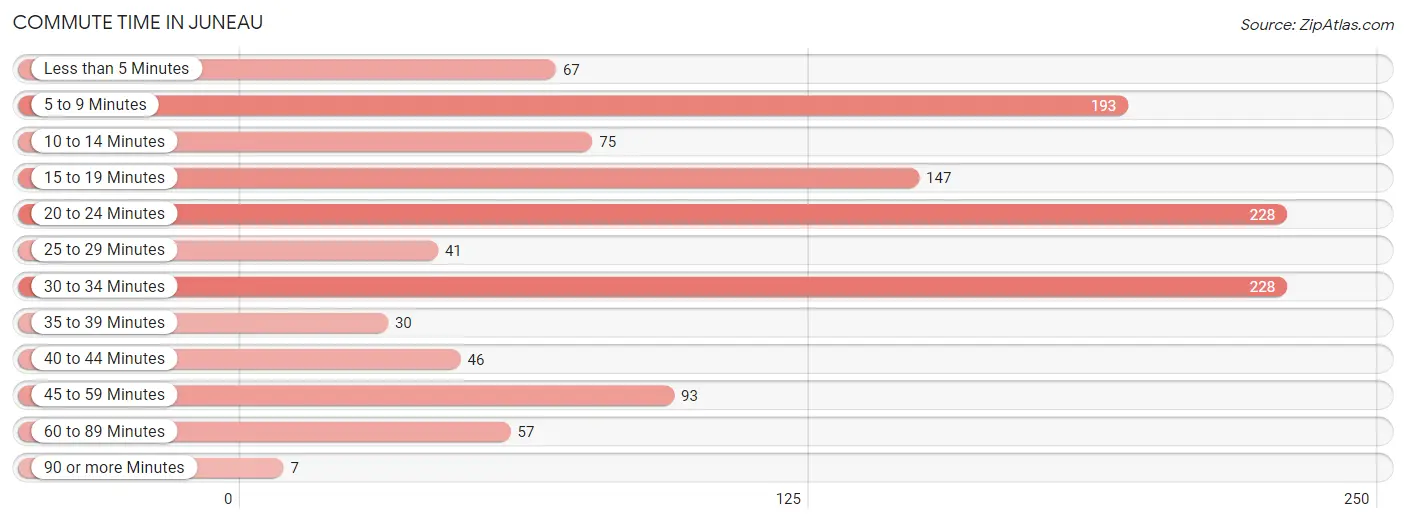
| Commute Time | # Commuters | % Commuters |
| Less than 5 Minutes | 67 | 5.5% |
| 5 to 9 Minutes | 193 | 15.9% |
| 10 to 14 Minutes | 75 | 6.2% |
| 15 to 19 Minutes | 147 | 12.1% |
| 20 to 24 Minutes | 228 | 18.8% |
| 25 to 29 Minutes | 41 | 3.4% |
| 30 to 34 Minutes | 228 | 18.8% |
| 35 to 39 Minutes | 30 | 2.5% |
| 40 to 44 Minutes | 46 | 3.8% |
| 45 to 59 Minutes | 93 | 7.7% |
| 60 to 89 Minutes | 57 | 4.7% |
| 90 or more Minutes | 7 | 0.6% |
Commute Time by Sex in Juneau
The most common commute times in Juneau are 20 to 24 minutes (106 commuters, 17.3%) for males and 30 to 34 minutes (158 commuters, 26.4%) for females.
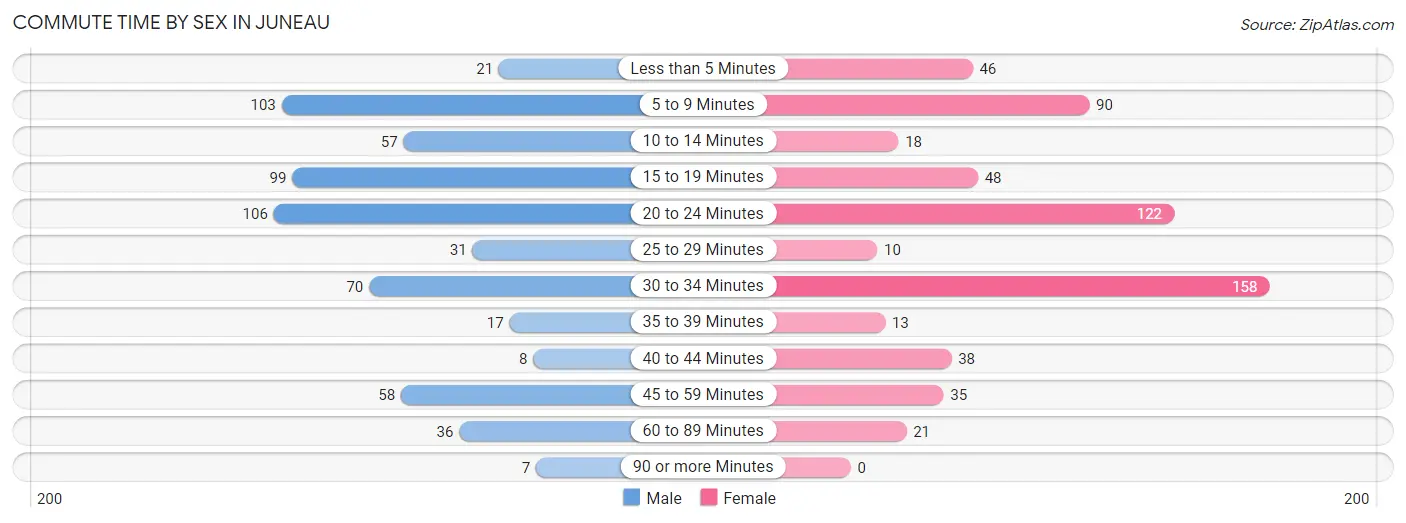
| Commute Time | Male | Female |
| Less than 5 Minutes | 21 (3.4%) | 46 (7.7%) |
| 5 to 9 Minutes | 103 (16.8%) | 90 (15.0%) |
| 10 to 14 Minutes | 57 (9.3%) | 18 (3.0%) |
| 15 to 19 Minutes | 99 (16.2%) | 48 (8.0%) |
| 20 to 24 Minutes | 106 (17.3%) | 122 (20.4%) |
| 25 to 29 Minutes | 31 (5.1%) | 10 (1.7%) |
| 30 to 34 Minutes | 70 (11.4%) | 158 (26.4%) |
| 35 to 39 Minutes | 17 (2.8%) | 13 (2.2%) |
| 40 to 44 Minutes | 8 (1.3%) | 38 (6.3%) |
| 45 to 59 Minutes | 58 (9.5%) | 35 (5.8%) |
| 60 to 89 Minutes | 36 (5.9%) | 21 (3.5%) |
| 90 or more Minutes | 7 (1.1%) | 0 (0.0%) |
Time of Departure to Work by Sex in Juneau
The most frequent times of departure to work in Juneau are 12:00 AM to 4:59 AM (155, 25.3%) for males and 6:00 AM to 6:29 AM (135, 22.5%) for females.
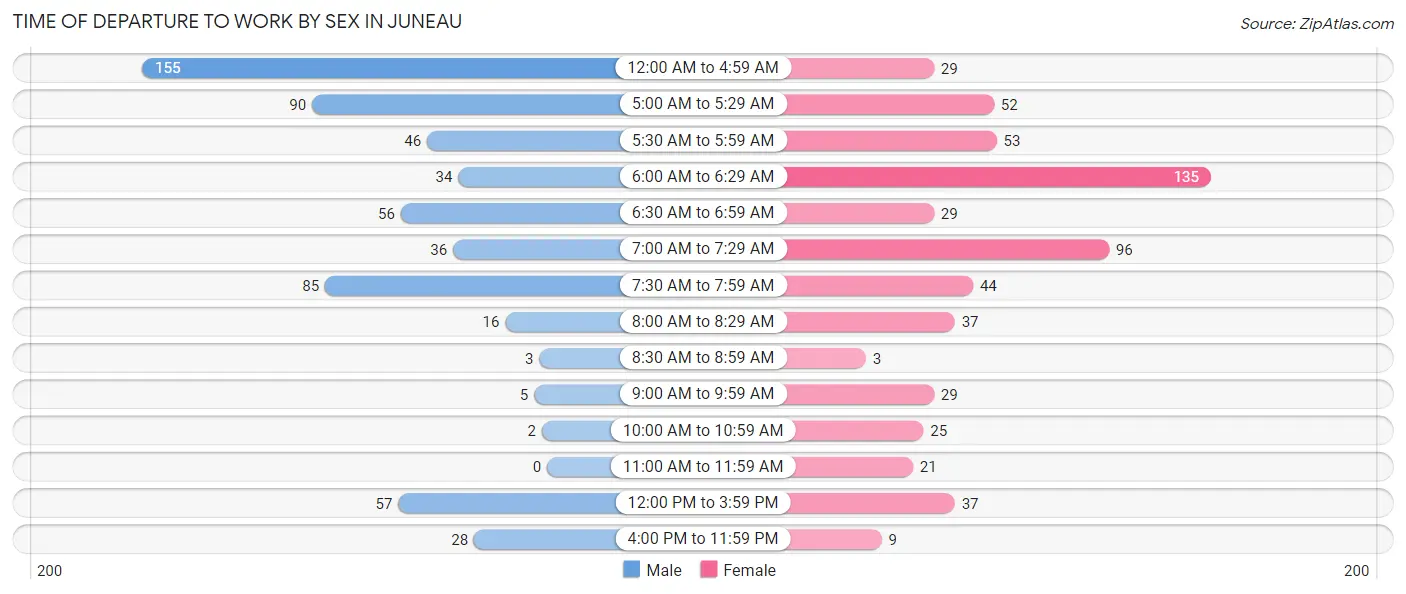
| Time of Departure | Male | Female |
| 12:00 AM to 4:59 AM | 155 (25.3%) | 29 (4.8%) |
| 5:00 AM to 5:29 AM | 90 (14.7%) | 52 (8.7%) |
| 5:30 AM to 5:59 AM | 46 (7.5%) | 53 (8.8%) |
| 6:00 AM to 6:29 AM | 34 (5.6%) | 135 (22.5%) |
| 6:30 AM to 6:59 AM | 56 (9.1%) | 29 (4.8%) |
| 7:00 AM to 7:29 AM | 36 (5.9%) | 96 (16.0%) |
| 7:30 AM to 7:59 AM | 85 (13.9%) | 44 (7.3%) |
| 8:00 AM to 8:29 AM | 16 (2.6%) | 37 (6.2%) |
| 8:30 AM to 8:59 AM | 3 (0.5%) | 3 (0.5%) |
| 9:00 AM to 9:59 AM | 5 (0.8%) | 29 (4.8%) |
| 10:00 AM to 10:59 AM | 2 (0.3%) | 25 (4.2%) |
| 11:00 AM to 11:59 AM | 0 (0.0%) | 21 (3.5%) |
| 12:00 PM to 3:59 PM | 57 (9.3%) | 37 (6.2%) |
| 4:00 PM to 11:59 PM | 28 (4.6%) | 9 (1.5%) |
| Total | 613 (100.0%) | 599 (100.0%) |
Housing Occupancy in Juneau
Occupancy by Ownership in Juneau
Of the total 781 dwellings in Juneau, owner-occupied units account for 515 (65.9%), while renter-occupied units make up 266 (34.1%).
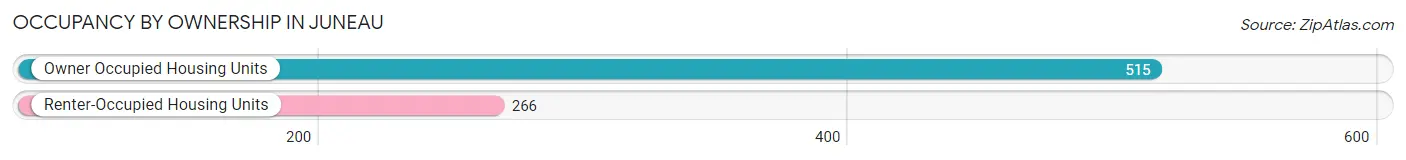
| Occupancy | # Housing Units | % Housing Units |
| Owner Occupied Housing Units | 515 | 65.9% |
| Renter-Occupied Housing Units | 266 | 34.1% |
| Total Occupied Housing Units | 781 | 100.0% |
Occupancy by Household Size in Juneau
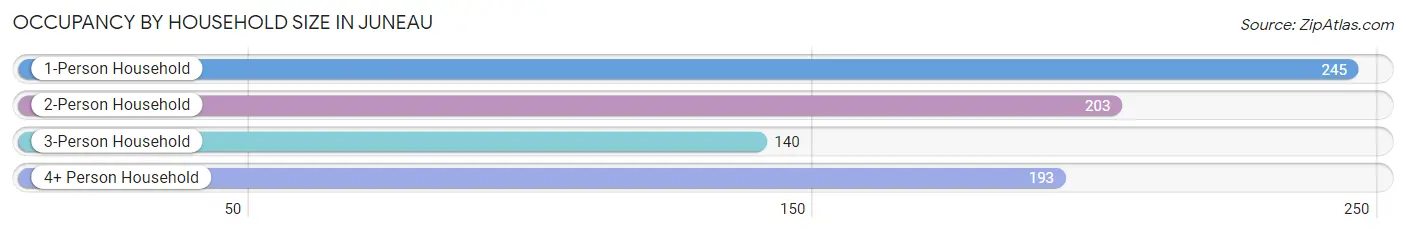
| Household Size | # Housing Units | % Housing Units |
| 1-Person Household | 245 | 31.4% |
| 2-Person Household | 203 | 26.0% |
| 3-Person Household | 140 | 17.9% |
| 4+ Person Household | 193 | 24.7% |
| Total Housing Units | 781 | 100.0% |
Occupancy by Ownership by Household Size in Juneau
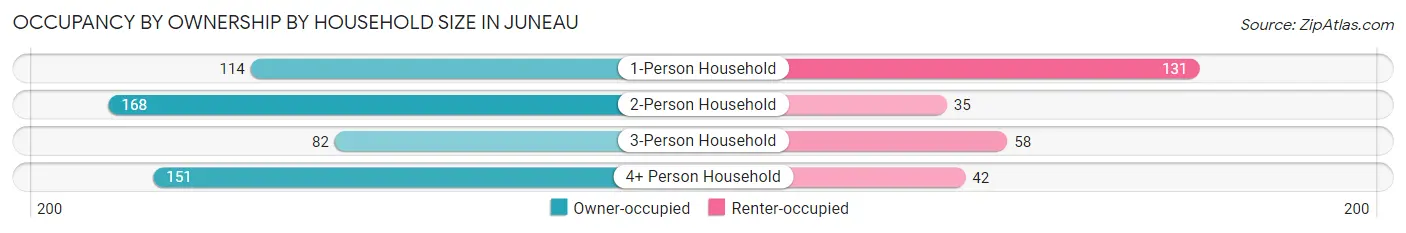
| Household Size | Owner-occupied | Renter-occupied |
| 1-Person Household | 114 (46.5%) | 131 (53.5%) |
| 2-Person Household | 168 (82.8%) | 35 (17.2%) |
| 3-Person Household | 82 (58.6%) | 58 (41.4%) |
| 4+ Person Household | 151 (78.2%) | 42 (21.8%) |
| Total Housing Units | 515 (65.9%) | 266 (34.1%) |
Occupancy by Educational Attainment in Juneau
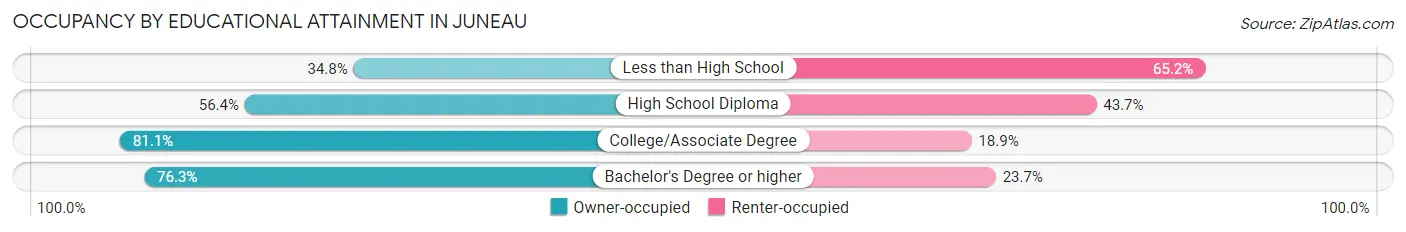
| Household Size | Owner-occupied | Renter-occupied |
| Less than High School | 24 (34.8%) | 45 (65.2%) |
| High School Diploma | 182 (56.4%) | 141 (43.6%) |
| College/Associate Degree | 206 (81.1%) | 48 (18.9%) |
| Bachelor's Degree or higher | 103 (76.3%) | 32 (23.7%) |
Occupancy by Age of Householder in Juneau
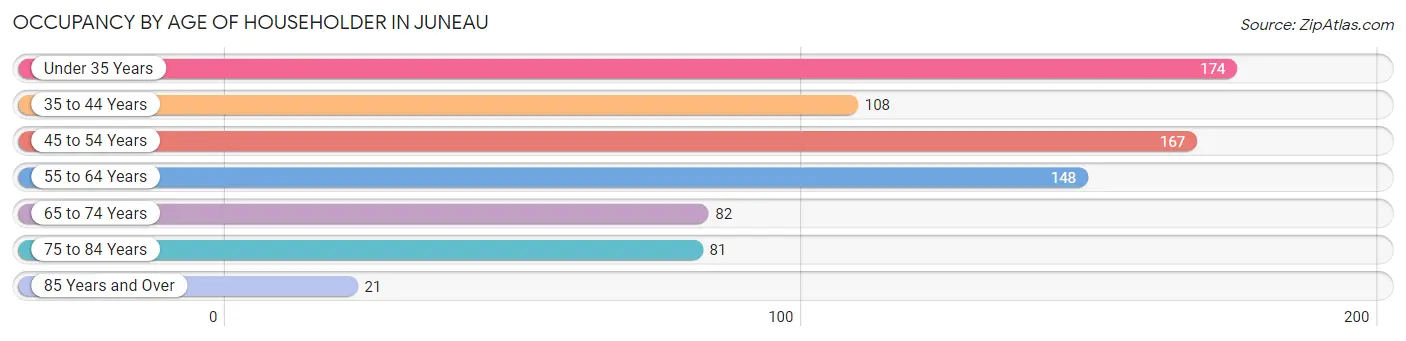
| Age Bracket | # Households | % Households |
| Under 35 Years | 174 | 22.3% |
| 35 to 44 Years | 108 | 13.8% |
| 45 to 54 Years | 167 | 21.4% |
| 55 to 64 Years | 148 | 19.0% |
| 65 to 74 Years | 82 | 10.5% |
| 75 to 84 Years | 81 | 10.4% |
| 85 Years and Over | 21 | 2.7% |
| Total | 781 | 100.0% |
Housing Finances in Juneau
Median Income by Occupancy in Juneau
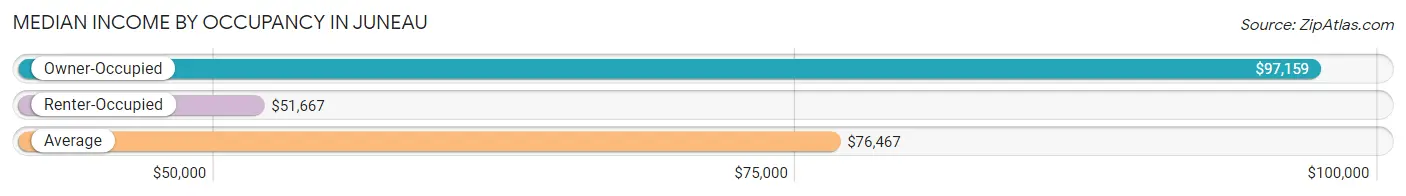
| Occupancy Type | # Households | Median Income |
| Owner-Occupied | 515 (65.9%) | $97,159 |
| Renter-Occupied | 266 (34.1%) | $51,667 |
| Average | 781 (100.0%) | $76,467 |
Occupancy by Householder Income Bracket in Juneau
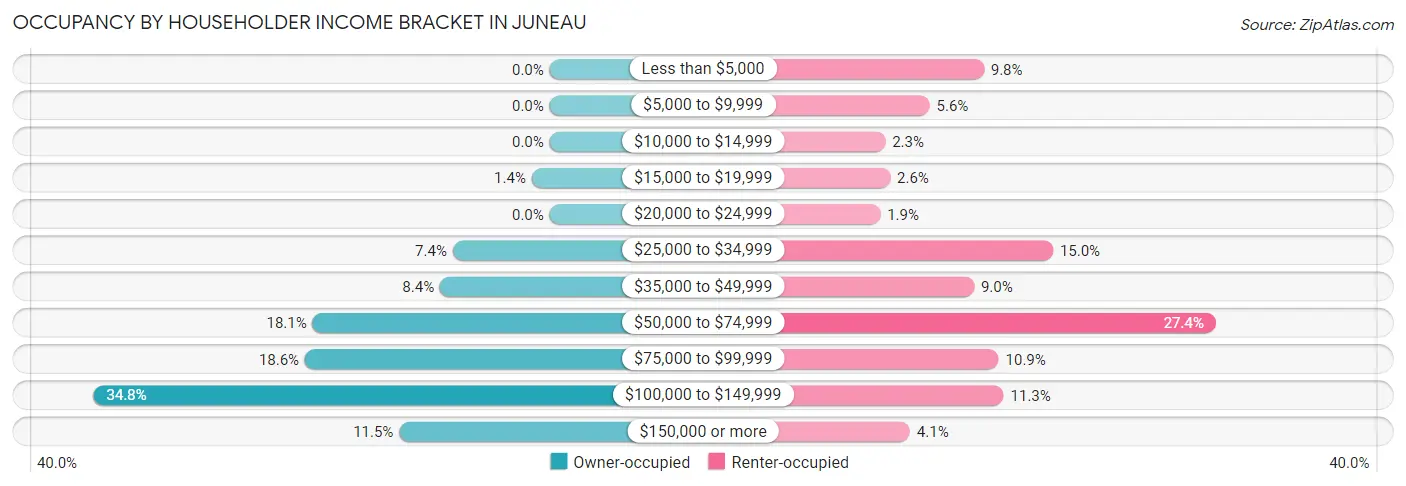
| Income Bracket | Owner-occupied | Renter-occupied |
| Less than $5,000 | 0 (0.0%) | 26 (9.8%) |
| $5,000 to $9,999 | 0 (0.0%) | 15 (5.6%) |
| $10,000 to $14,999 | 0 (0.0%) | 6 (2.3%) |
| $15,000 to $19,999 | 7 (1.4%) | 7 (2.6%) |
| $20,000 to $24,999 | 0 (0.0%) | 5 (1.9%) |
| $25,000 to $34,999 | 38 (7.4%) | 40 (15.0%) |
| $35,000 to $49,999 | 43 (8.4%) | 24 (9.0%) |
| $50,000 to $74,999 | 93 (18.1%) | 73 (27.4%) |
| $75,000 to $99,999 | 96 (18.6%) | 29 (10.9%) |
| $100,000 to $149,999 | 179 (34.8%) | 30 (11.3%) |
| $150,000 or more | 59 (11.5%) | 11 (4.1%) |
| Total | 515 (100.0%) | 266 (100.0%) |
Monthly Housing Cost Tiers in Juneau
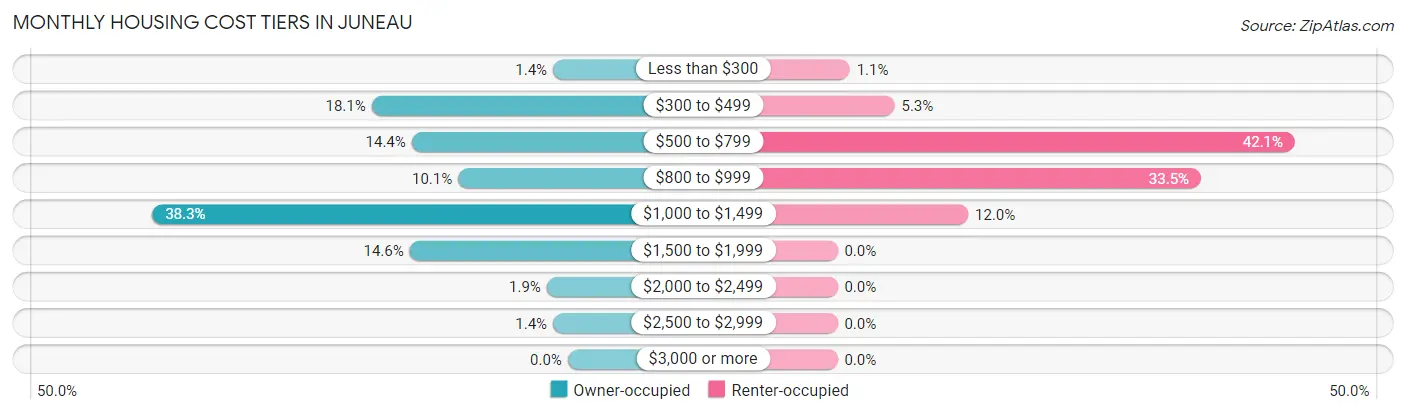
| Monthly Cost | Owner-occupied | Renter-occupied |
| Less than $300 | 7 (1.4%) | 3 (1.1%) |
| $300 to $499 | 93 (18.1%) | 14 (5.3%) |
| $500 to $799 | 74 (14.4%) | 112 (42.1%) |
| $800 to $999 | 52 (10.1%) | 89 (33.5%) |
| $1,000 to $1,499 | 197 (38.3%) | 32 (12.0%) |
| $1,500 to $1,999 | 75 (14.6%) | 0 (0.0%) |
| $2,000 to $2,499 | 10 (1.9%) | 0 (0.0%) |
| $2,500 to $2,999 | 7 (1.4%) | 0 (0.0%) |
| $3,000 or more | 0 (0.0%) | 0 (0.0%) |
| Total | 515 (100.0%) | 266 (100.0%) |
Physical Housing Characteristics in Juneau
Housing Structures in Juneau
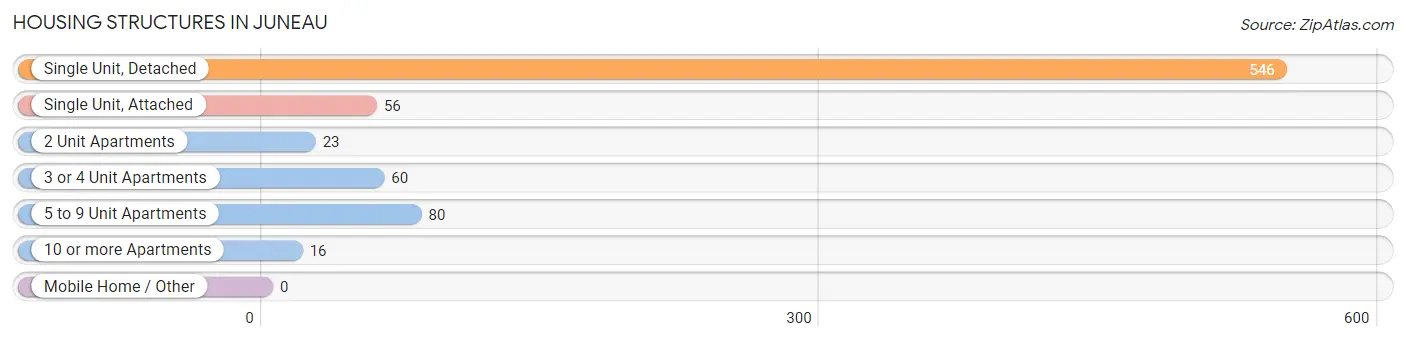
| Structure Type | # Housing Units | % Housing Units |
| Single Unit, Detached | 546 | 69.9% |
| Single Unit, Attached | 56 | 7.2% |
| 2 Unit Apartments | 23 | 2.9% |
| 3 or 4 Unit Apartments | 60 | 7.7% |
| 5 to 9 Unit Apartments | 80 | 10.2% |
| 10 or more Apartments | 16 | 2.1% |
| Mobile Home / Other | 0 | 0.0% |
| Total | 781 | 100.0% |
Housing Structures by Occupancy in Juneau
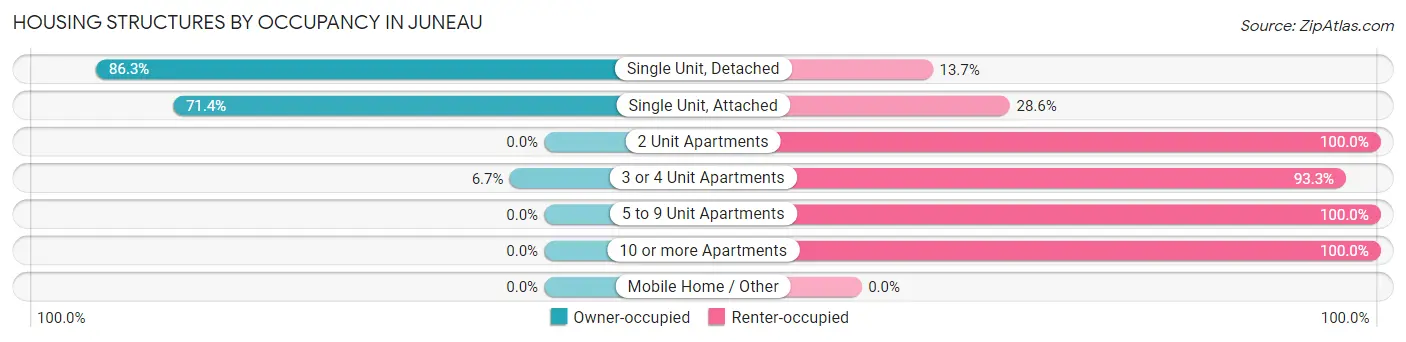
| Structure Type | Owner-occupied | Renter-occupied |
| Single Unit, Detached | 471 (86.3%) | 75 (13.7%) |
| Single Unit, Attached | 40 (71.4%) | 16 (28.6%) |
| 2 Unit Apartments | 0 (0.0%) | 23 (100.0%) |
| 3 or 4 Unit Apartments | 4 (6.7%) | 56 (93.3%) |
| 5 to 9 Unit Apartments | 0 (0.0%) | 80 (100.0%) |
| 10 or more Apartments | 0 (0.0%) | 16 (100.0%) |
| Mobile Home / Other | 0 (0.0%) | 0 (0.0%) |
| Total | 515 (65.9%) | 266 (34.1%) |
Housing Structures by Number of Rooms in Juneau
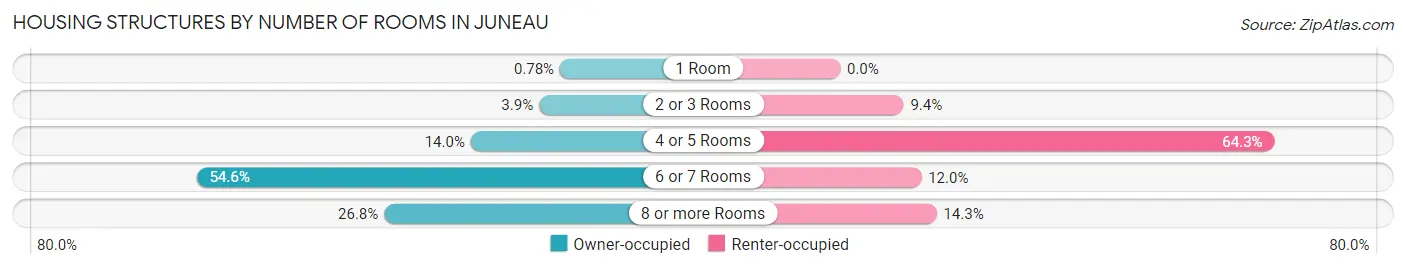
| Number of Rooms | Owner-occupied | Renter-occupied |
| 1 Room | 4 (0.8%) | 0 (0.0%) |
| 2 or 3 Rooms | 20 (3.9%) | 25 (9.4%) |
| 4 or 5 Rooms | 72 (14.0%) | 171 (64.3%) |
| 6 or 7 Rooms | 281 (54.6%) | 32 (12.0%) |
| 8 or more Rooms | 138 (26.8%) | 38 (14.3%) |
| Total | 515 (100.0%) | 266 (100.0%) |
Housing Structure by Heating Type in Juneau
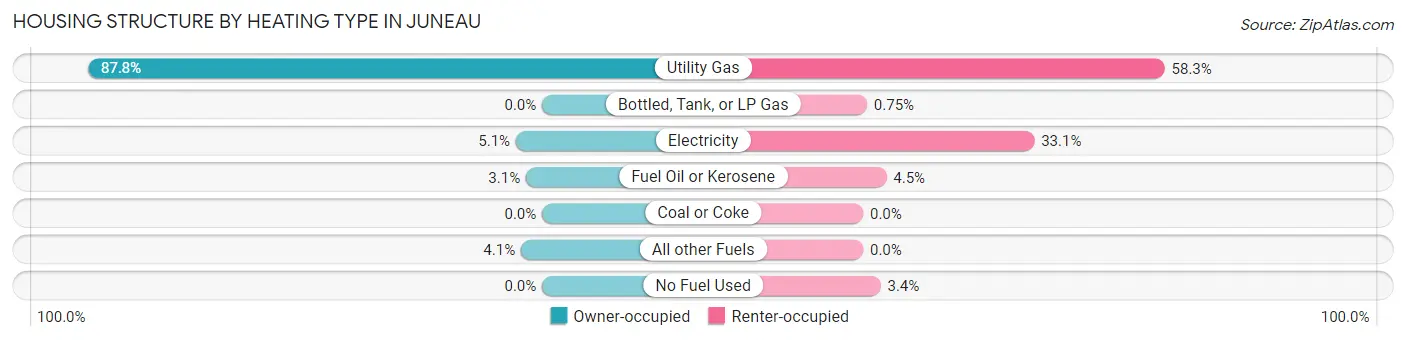
| Heating Type | Owner-occupied | Renter-occupied |
| Utility Gas | 452 (87.8%) | 155 (58.3%) |
| Bottled, Tank, or LP Gas | 0 (0.0%) | 2 (0.7%) |
| Electricity | 26 (5.1%) | 88 (33.1%) |
| Fuel Oil or Kerosene | 16 (3.1%) | 12 (4.5%) |
| Coal or Coke | 0 (0.0%) | 0 (0.0%) |
| All other Fuels | 21 (4.1%) | 0 (0.0%) |
| No Fuel Used | 0 (0.0%) | 9 (3.4%) |
| Total | 515 (100.0%) | 266 (100.0%) |
Household Vehicle Usage in Juneau
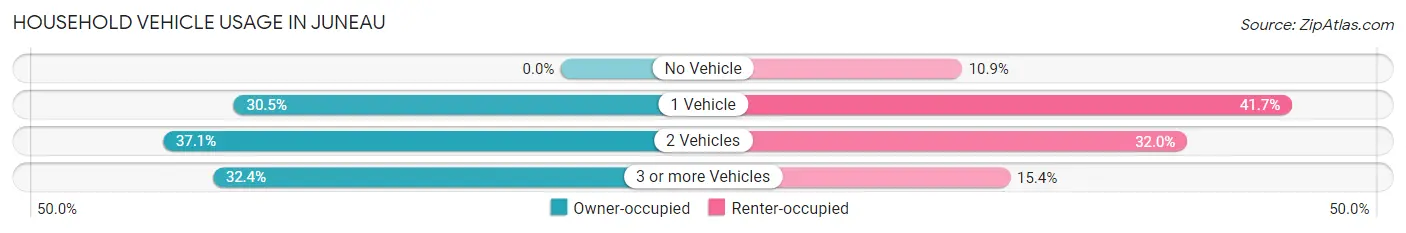
| Vehicles per Household | Owner-occupied | Renter-occupied |
| No Vehicle | 0 (0.0%) | 29 (10.9%) |
| 1 Vehicle | 157 (30.5%) | 111 (41.7%) |
| 2 Vehicles | 191 (37.1%) | 85 (32.0%) |
| 3 or more Vehicles | 167 (32.4%) | 41 (15.4%) |
| Total | 515 (100.0%) | 266 (100.0%) |
Real Estate & Mortgages in Juneau
Real Estate and Mortgage Overview in Juneau
| Characteristic | Without Mortgage | With Mortgage |
| Housing Units | 183 | 332 |
| Median Property Value | $163,300 | $159,700 |
| Median Household Income | $83,125 | $28 |
| Monthly Housing Costs | $498 | $0 |
| Real Estate Taxes | $3,307 | $0 |
Property Value by Mortgage Status in Juneau
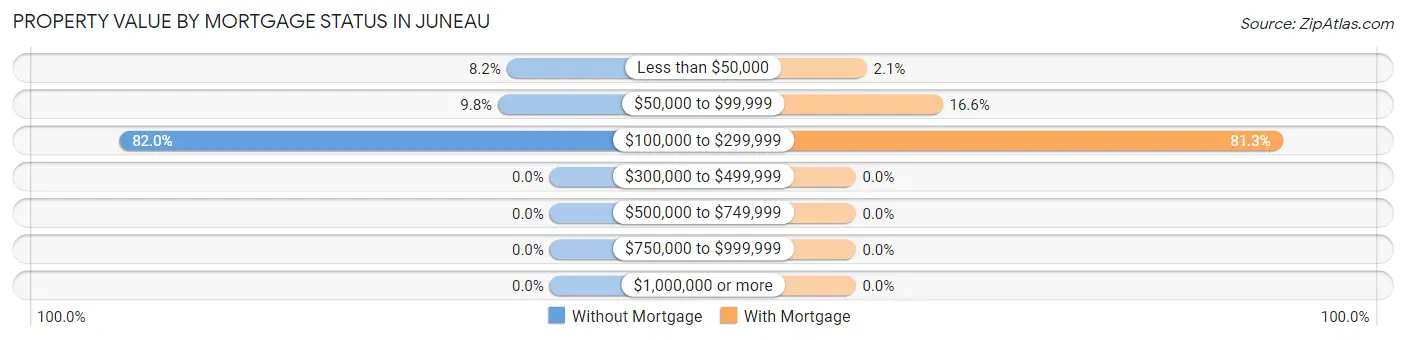
| Property Value | Without Mortgage | With Mortgage |
| Less than $50,000 | 15 (8.2%) | 7 (2.1%) |
| $50,000 to $99,999 | 18 (9.8%) | 55 (16.6%) |
| $100,000 to $299,999 | 150 (82.0%) | 270 (81.3%) |
| $300,000 to $499,999 | 0 (0.0%) | 0 (0.0%) |
| $500,000 to $749,999 | 0 (0.0%) | 0 (0.0%) |
| $750,000 to $999,999 | 0 (0.0%) | 0 (0.0%) |
| $1,000,000 or more | 0 (0.0%) | 0 (0.0%) |
| Total | 183 (100.0%) | 332 (100.0%) |
Household Income by Mortgage Status in Juneau
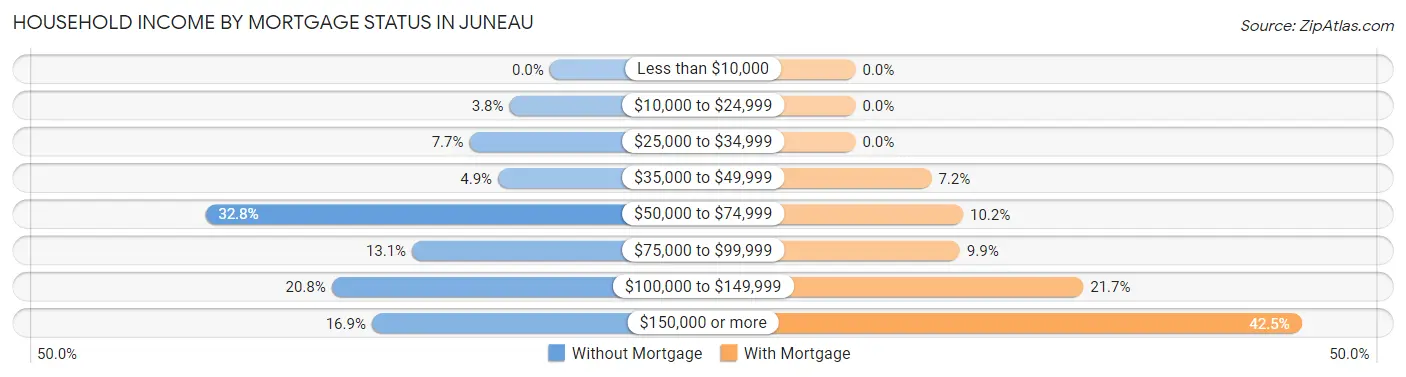
| Household Income | Without Mortgage | With Mortgage |
| Less than $10,000 | 0 (0.0%) | 0 (0.0%) |
| $10,000 to $24,999 | 7 (3.8%) | 0 (0.0%) |
| $25,000 to $34,999 | 14 (7.6%) | 0 (0.0%) |
| $35,000 to $49,999 | 9 (4.9%) | 24 (7.2%) |
| $50,000 to $74,999 | 60 (32.8%) | 34 (10.2%) |
| $75,000 to $99,999 | 24 (13.1%) | 33 (9.9%) |
| $100,000 to $149,999 | 38 (20.8%) | 72 (21.7%) |
| $150,000 or more | 31 (16.9%) | 141 (42.5%) |
| Total | 183 (100.0%) | 332 (100.0%) |
Property Value to Household Income Ratio in Juneau
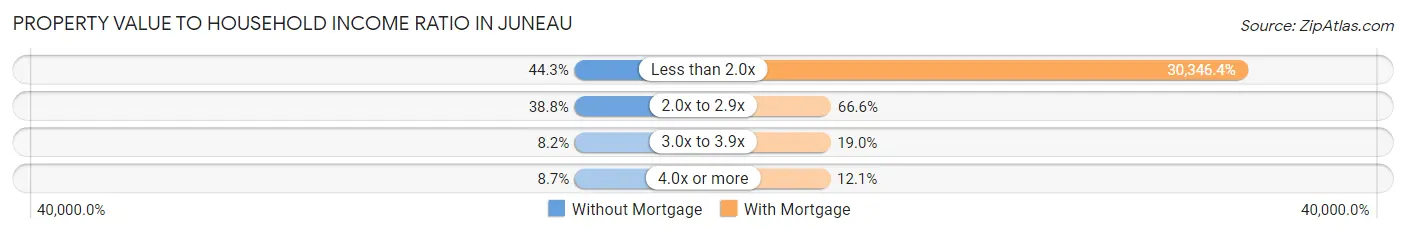
| Value-to-Income Ratio | Without Mortgage | With Mortgage |
| Less than 2.0x | 81 (44.3%) | 100,750 (30,346.4%) |
| 2.0x to 2.9x | 71 (38.8%) | 221 (66.6%) |
| 3.0x to 3.9x | 15 (8.2%) | 63 (19.0%) |
| 4.0x or more | 16 (8.7%) | 40 (12.0%) |
| Total | 183 (100.0%) | 332 (100.0%) |
Real Estate Taxes by Mortgage Status in Juneau
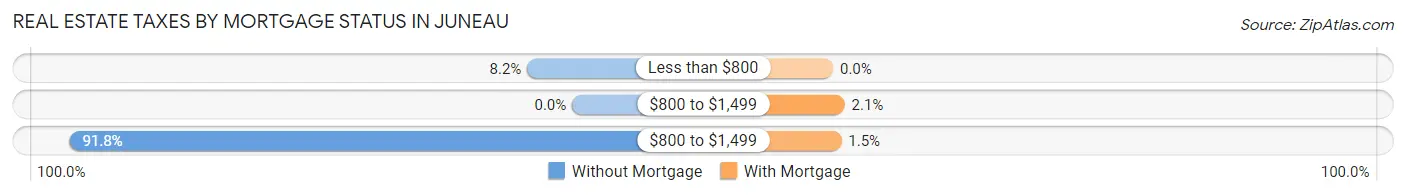
| Property Taxes | Without Mortgage | With Mortgage |
| Less than $800 | 15 (8.2%) | 0 (0.0%) |
| $800 to $1,499 | 0 (0.0%) | 7 (2.1%) |
| $800 to $1,499 | 168 (91.8%) | 5 (1.5%) |
| Total | 183 (100.0%) | 332 (100.0%) |
Health & Disability in Juneau
Health Insurance Coverage by Age in Juneau
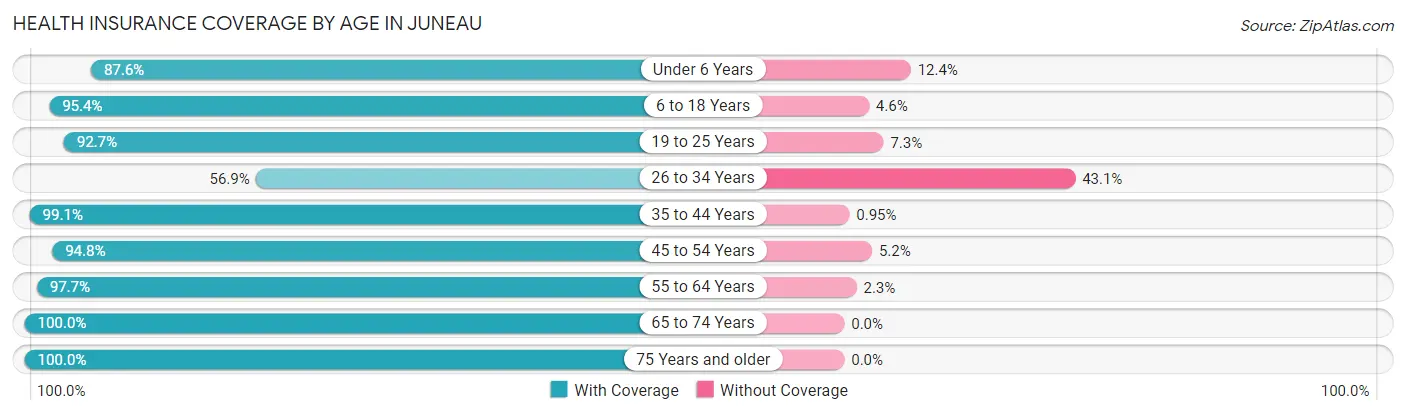
| Age Bracket | With Coverage | Without Coverage |
| Under 6 Years | 92 (87.6%) | 13 (12.4%) |
| 6 to 18 Years | 353 (95.4%) | 17 (4.6%) |
| 19 to 25 Years | 241 (92.7%) | 19 (7.3%) |
| 26 to 34 Years | 160 (56.9%) | 121 (43.1%) |
| 35 to 44 Years | 208 (99.1%) | 2 (0.9%) |
| 45 to 54 Years | 331 (94.8%) | 18 (5.2%) |
| 55 to 64 Years | 343 (97.7%) | 8 (2.3%) |
| 65 to 74 Years | 138 (100.0%) | 0 (0.0%) |
| 75 Years and older | 161 (100.0%) | 0 (0.0%) |
| Total | 2,027 (91.1%) | 198 (8.9%) |
Health Insurance Coverage by Citizenship Status in Juneau
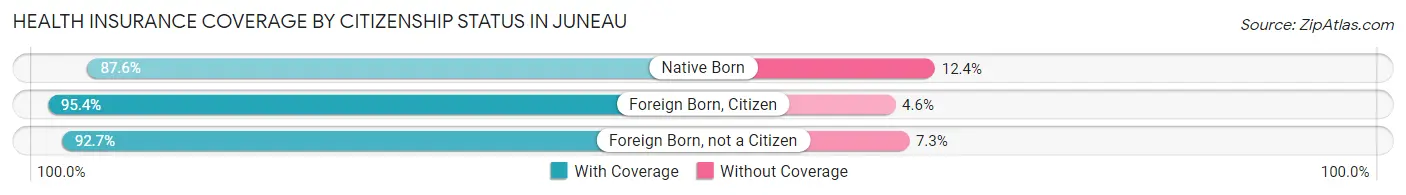
| Citizenship Status | With Coverage | Without Coverage |
| Native Born | 92 (87.6%) | 13 (12.4%) |
| Foreign Born, Citizen | 353 (95.4%) | 17 (4.6%) |
| Foreign Born, not a Citizen | 241 (92.7%) | 19 (7.3%) |
Health Insurance Coverage by Household Income in Juneau
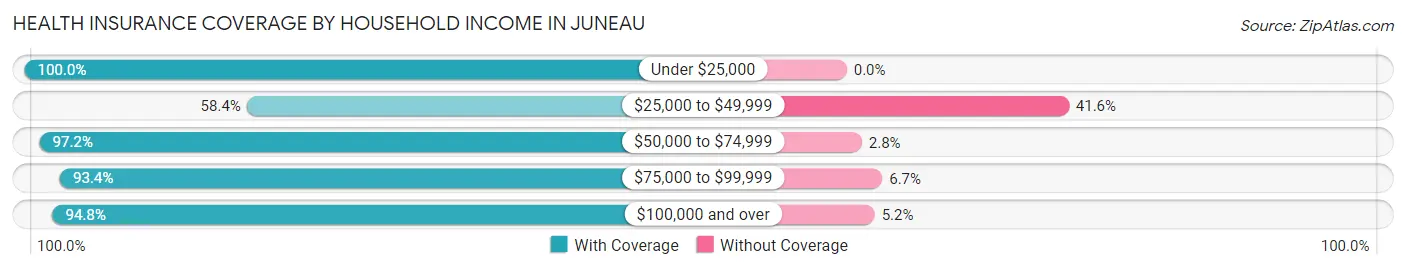
| Household Income | With Coverage | Without Coverage |
| Under $25,000 | 95 (100.0%) | 0 (0.0%) |
| $25,000 to $49,999 | 153 (58.4%) | 109 (41.6%) |
| $50,000 to $74,999 | 413 (97.2%) | 12 (2.8%) |
| $75,000 to $99,999 | 337 (93.3%) | 24 (6.7%) |
| $100,000 and over | 959 (94.8%) | 53 (5.2%) |
Public vs Private Health Insurance Coverage by Age in Juneau
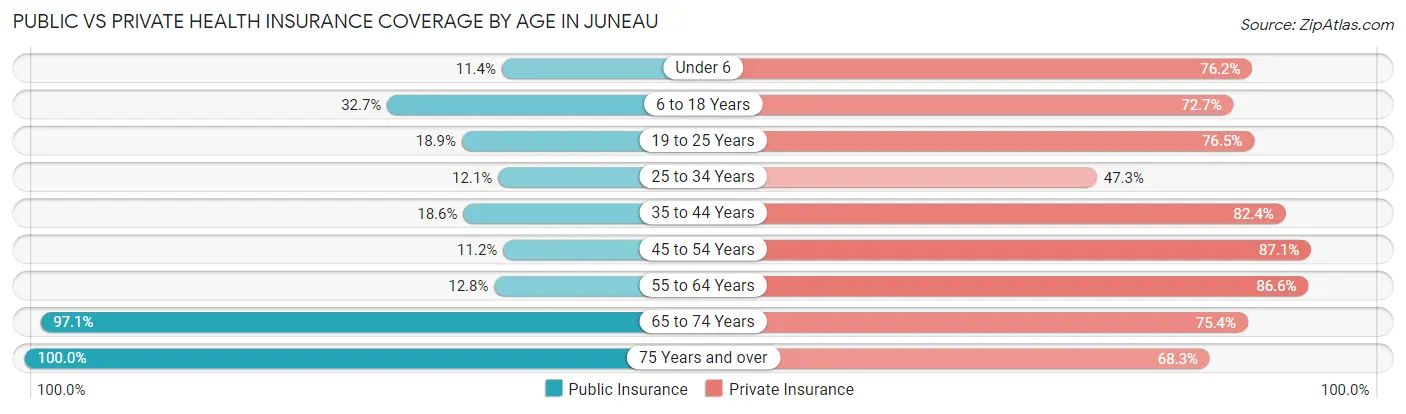
| Age Bracket | Public Insurance | Private Insurance |
| Under 6 | 12 (11.4%) | 80 (76.2%) |
| 6 to 18 Years | 121 (32.7%) | 269 (72.7%) |
| 19 to 25 Years | 49 (18.9%) | 199 (76.5%) |
| 25 to 34 Years | 34 (12.1%) | 133 (47.3%) |
| 35 to 44 Years | 39 (18.6%) | 173 (82.4%) |
| 45 to 54 Years | 39 (11.2%) | 304 (87.1%) |
| 55 to 64 Years | 45 (12.8%) | 304 (86.6%) |
| 65 to 74 Years | 134 (97.1%) | 104 (75.4%) |
| 75 Years and over | 161 (100.0%) | 110 (68.3%) |
| Total | 634 (28.5%) | 1,676 (75.3%) |
Disability Status by Sex by Age in Juneau
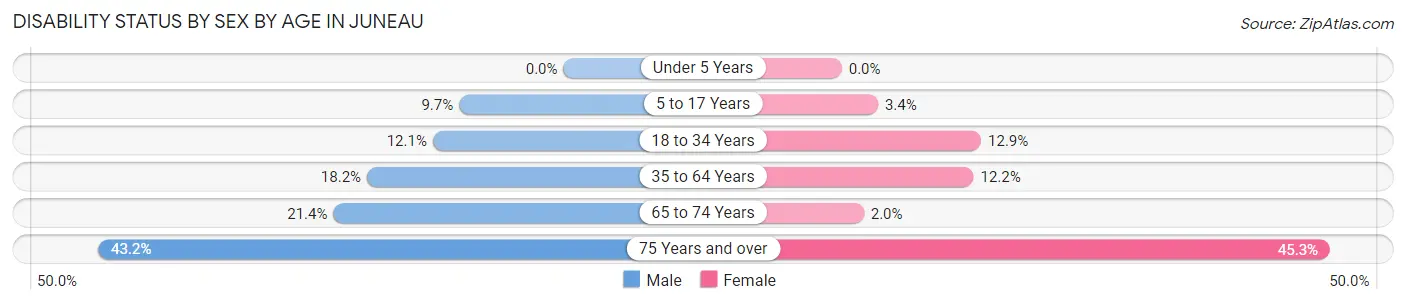
| Age Bracket | Male | Female |
| Under 5 Years | 0 (0.0%) | 0 (0.0%) |
| 5 to 17 Years | 18 (9.7%) | 5 (3.4%) |
| 18 to 34 Years | 40 (12.1%) | 34 (12.9%) |
| 35 to 64 Years | 72 (18.2%) | 63 (12.2%) |
| 65 to 74 Years | 19 (21.3%) | 1 (2.0%) |
| 75 Years and over | 19 (43.2%) | 53 (45.3%) |
Disability Class by Sex by Age in Juneau
Disability Class: Hearing Difficulty
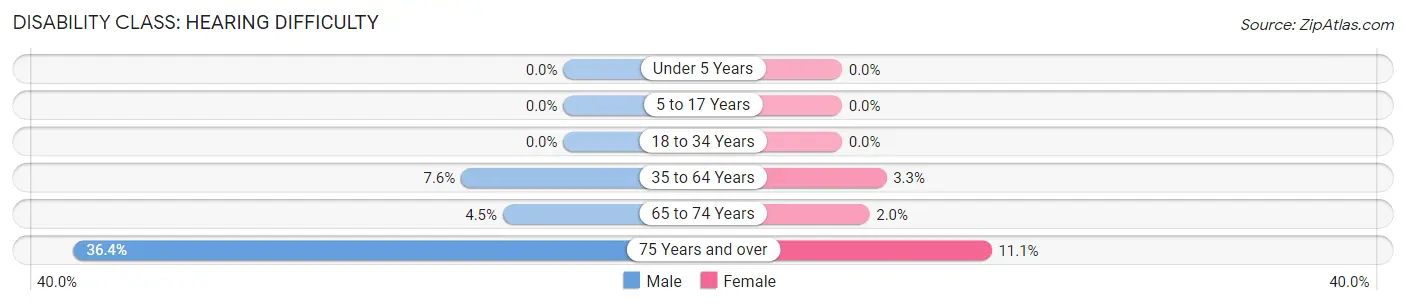
| Age Bracket | Male | Female |
| Under 5 Years | 0 (0.0%) | 0 (0.0%) |
| 5 to 17 Years | 0 (0.0%) | 0 (0.0%) |
| 18 to 34 Years | 0 (0.0%) | 0 (0.0%) |
| 35 to 64 Years | 30 (7.6%) | 17 (3.3%) |
| 65 to 74 Years | 4 (4.5%) | 1 (2.0%) |
| 75 Years and over | 16 (36.4%) | 13 (11.1%) |
Disability Class: Vision Difficulty
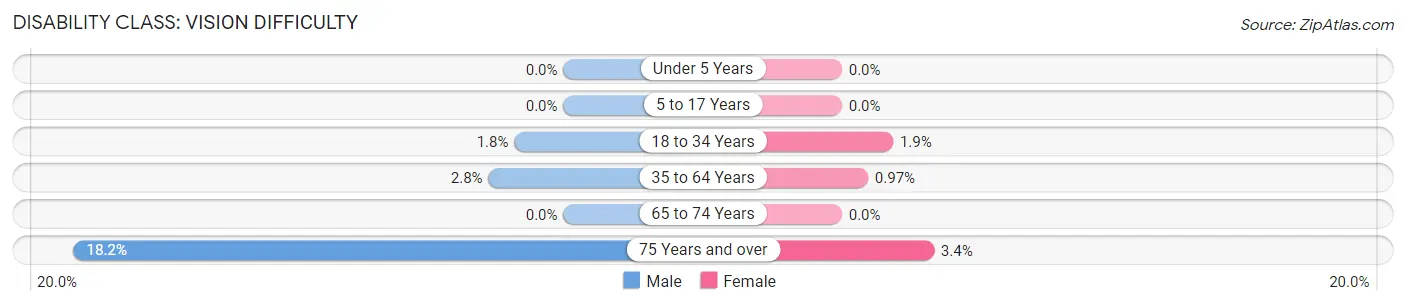
| Age Bracket | Male | Female |
| Under 5 Years | 0 (0.0%) | 0 (0.0%) |
| 5 to 17 Years | 0 (0.0%) | 0 (0.0%) |
| 18 to 34 Years | 6 (1.8%) | 5 (1.9%) |
| 35 to 64 Years | 11 (2.8%) | 5 (1.0%) |
| 65 to 74 Years | 0 (0.0%) | 0 (0.0%) |
| 75 Years and over | 8 (18.2%) | 4 (3.4%) |
Disability Class: Cognitive Difficulty
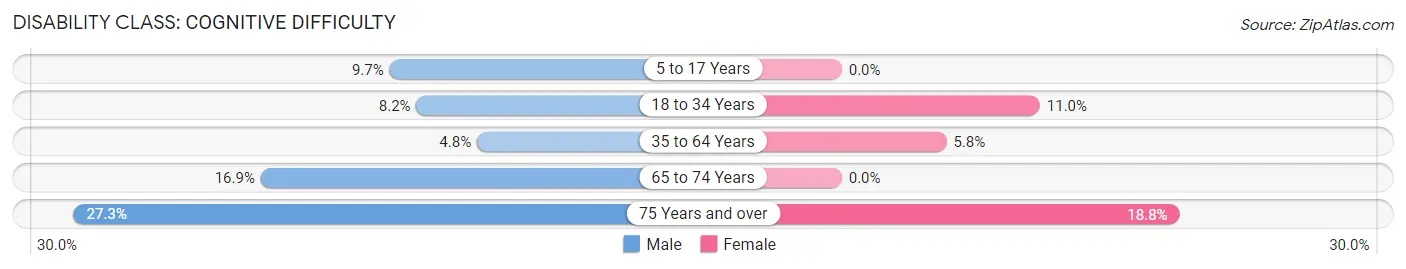
| Age Bracket | Male | Female |
| 5 to 17 Years | 18 (9.7%) | 0 (0.0%) |
| 18 to 34 Years | 27 (8.2%) | 29 (11.0%) |
| 35 to 64 Years | 19 (4.8%) | 30 (5.8%) |
| 65 to 74 Years | 15 (16.9%) | 0 (0.0%) |
| 75 Years and over | 12 (27.3%) | 22 (18.8%) |
Disability Class: Ambulatory Difficulty
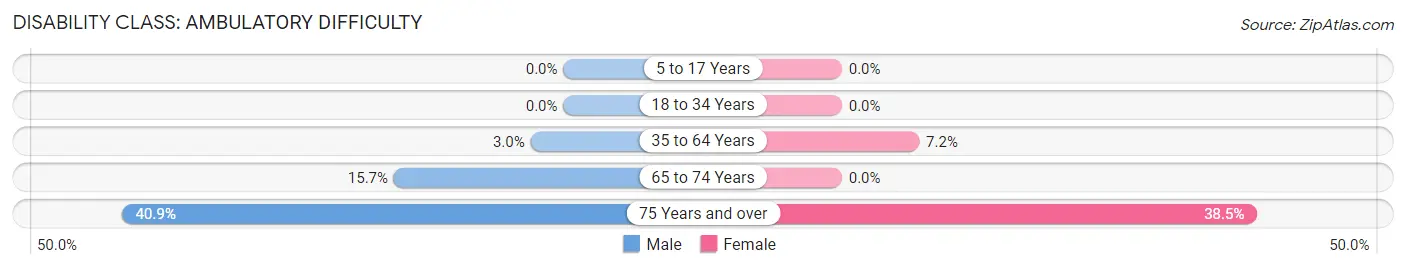
| Age Bracket | Male | Female |
| 5 to 17 Years | 0 (0.0%) | 0 (0.0%) |
| 18 to 34 Years | 0 (0.0%) | 0 (0.0%) |
| 35 to 64 Years | 12 (3.0%) | 37 (7.2%) |
| 65 to 74 Years | 14 (15.7%) | 0 (0.0%) |
| 75 Years and over | 18 (40.9%) | 45 (38.5%) |
Disability Class: Self-Care Difficulty
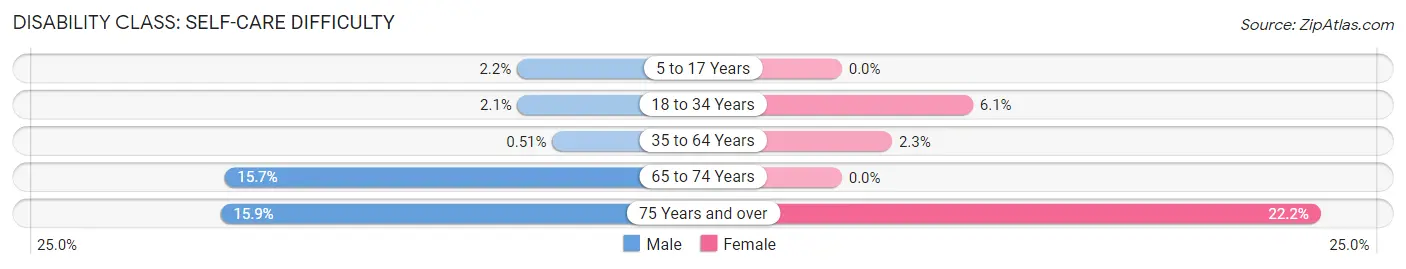
| Age Bracket | Male | Female |
| 5 to 17 Years | 4 (2.1%) | 0 (0.0%) |
| 18 to 34 Years | 7 (2.1%) | 16 (6.1%) |
| 35 to 64 Years | 2 (0.5%) | 12 (2.3%) |
| 65 to 74 Years | 14 (15.7%) | 0 (0.0%) |
| 75 Years and over | 7 (15.9%) | 26 (22.2%) |
Technology Access in Juneau
Computing Device Access in Juneau
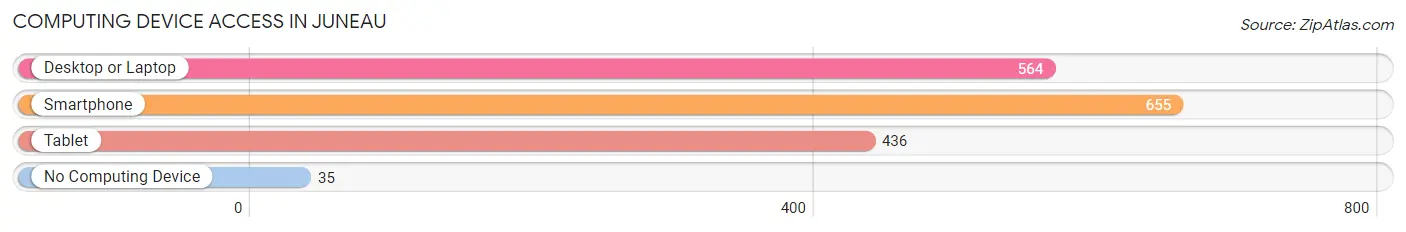
| Device Type | # Households | % Households |
| Desktop or Laptop | 564 | 72.2% |
| Smartphone | 655 | 83.9% |
| Tablet | 436 | 55.8% |
| No Computing Device | 35 | 4.5% |
| Total | 781 | 100.0% |
Internet Access in Juneau
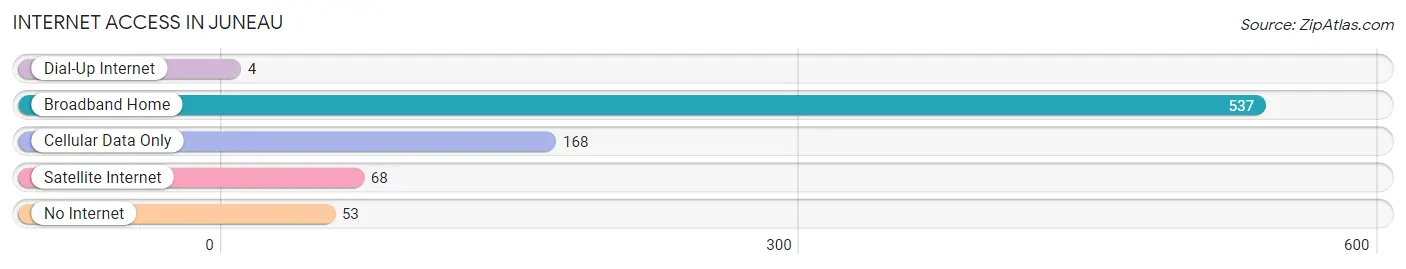
| Internet Type | # Households | % Households |
| Dial-Up Internet | 4 | 0.5% |
| Broadband Home | 537 | 68.8% |
| Cellular Data Only | 168 | 21.5% |
| Satellite Internet | 68 | 8.7% |
| No Internet | 53 | 6.8% |
| Total | 781 | 100.0% |
Juneau Summary
Juneau, Wisconsin is a small city located in Dodge County, Wisconsin. It is situated on the banks of the Rock River, and is part of the Fox Cities metropolitan area. The city has a population of approximately 5,000 people, and is the county seat of Dodge County.
History
Juneau was founded in 1845 by a group of settlers from New York. The city was named after the explorer, John Juneau, who had explored the area in the early 1800s. The city was incorporated in 1856, and was the first city in Dodge County.
In the late 1800s, Juneau was a thriving industrial center, with several factories and mills located in the city. The city was also home to a number of businesses, including a brewery, a tannery, and a brickyard.
In the early 1900s, the city experienced a period of growth and prosperity. The city was home to several banks, a hospital, and a number of churches. The city also had a number of schools, including a high school, a business college, and a normal school.
Geography
Juneau is located in the Fox Cities metropolitan area, which is located in the northeastern part of Wisconsin. The city is situated on the banks of the Rock River, and is surrounded by rolling hills and farmland. The city is located approximately 30 miles north of Milwaukee, and is about an hour and a half drive from Madison.
The city has a total area of 4.2 square miles, and has a population density of 1,200 people per square mile. The city is located at an elevation of 830 feet above sea level.
Economy
Juneau’s economy is largely based on manufacturing and agriculture. The city is home to several factories and mills, including a paper mill, a furniture factory, and a printing plant. The city is also home to a number of businesses, including a grocery store, a hardware store, and a number of restaurants.
The city is also home to a number of agricultural businesses, including dairy farms, vegetable farms, and fruit orchards. The city is also home to a number of wineries, and is a popular destination for wine tours.
Demographics
As of the 2010 census, the population of Juneau was 5,000 people. The city has a median household income of $45,000, and a median family income of $50,000. The city has a poverty rate of 11.3%, and a median age of 38.
The city is predominantly white, with a population that is 94.3% white. The city also has a small Hispanic population, which makes up 2.3% of the population. The city also has a small African American population, which makes up 1.2% of the population.
Conclusion
Juneau, Wisconsin is a small city located in Dodge County, Wisconsin. It is situated on the banks of the Rock River, and is part of the Fox Cities metropolitan area. The city has a population of approximately 5,000 people, and is the county seat of Dodge County. The city has a largely manufacturing and agricultural based economy, and has a predominantly white population. The city has a median household income of $45,000, and a median family income of $50,000.
Common Questions
What is Per Capita Income in Juneau?
Per Capita income in Juneau is $33,208.
What is the Median Family Income in Juneau?
Median Family Income in Juneau is $100,526.
What is the Median Household income in Juneau?
Median Household Income in Juneau is $76,467.
What is Income or Wage Gap in Juneau?
Income or Wage Gap in Juneau is 30.9%.
Women in Juneau earn 69.1 cents for every dollar earned by a man.
What is Inequality or Gini Index in Juneau?
Inequality or Gini Index in Juneau is 0.41.
What is the Total Population of Juneau?
Total Population of Juneau is 2,636.
What is the Total Male Population of Juneau?
Total Male Population of Juneau is 1,394.
What is the Total Female Population of Juneau?
Total Female Population of Juneau is 1,242.
What is the Ratio of Males per 100 Females in Juneau?
There are 112.24 Males per 100 Females in Juneau.
What is the Ratio of Females per 100 Males in Juneau?
There are 89.10 Females per 100 Males in Juneau.
What is the Median Population Age in Juneau?
Median Population Age in Juneau is 41.9 Years.
What is the Average Family Size in Juneau
Average Family Size in Juneau is 3.4 People.
What is the Average Household Size in Juneau
Average Household Size in Juneau is 2.8 People.
How Large is the Labor Force in Juneau?
There are 1,306 People in the Labor Forcein in Juneau.
What is the Percentage of People in the Labor Force in Juneau?
56.4% of People are in the Labor Force in Juneau.
What is the Unemployment Rate in Juneau?
Unemployment Rate in Juneau is 4.7%.