Linden, WI
Linden Map
Linden Overview
557
TOTAL POPULATION
287
MALE POPULATION
270
FEMALE POPULATION
106.30
MALES / 100 FEMALES
94.08
FEMALES / 100 MALES
34.3
MEDIAN AGE
3.1
AVG FAMILY SIZE
2.3
AVG HOUSEHOLD SIZE
$31,671
PER CAPITA INCOME
$85,208
AVG FAMILY INCOME
$54,803
AVG HOUSEHOLD INCOME
58.6%
WAGE / INCOME GAP [ % ]
41.4¢/ $1
WAGE / INCOME GAP [ $ ]
0.44
INEQUALITY / GINI INDEX
253
LABOR FORCE [ PEOPLE ]
60.0%
PERCENT IN LABOR FORCE
2.4%
UNEMPLOYMENT RATE
Linden Zip Codes
Linden Area Codes
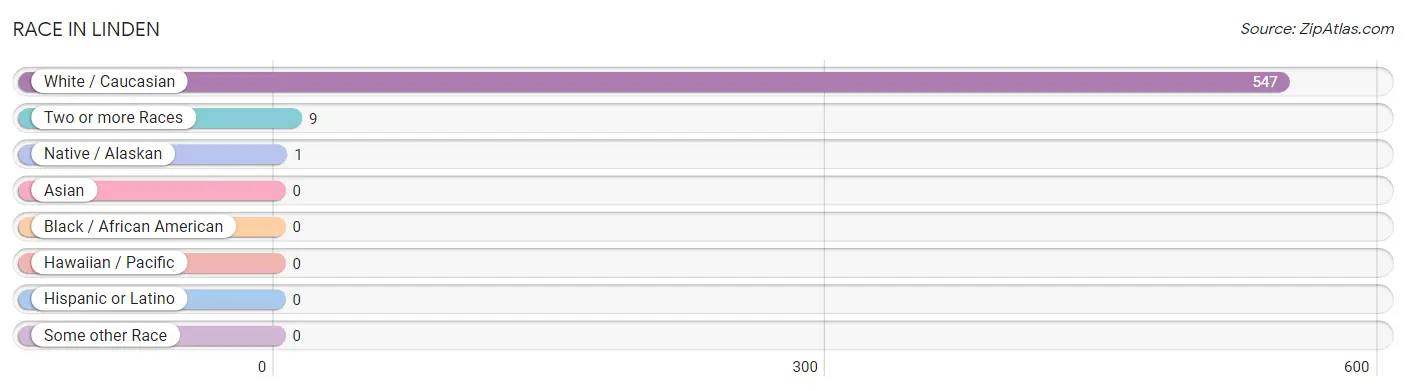
Race in Linden
The most populous races in Linden are White / Caucasian (547 | 98.2%), Two or more Races (9 | 1.6%), and Native / Alaskan (1 | 0.2%).
| Race | # Population | % Population |
| Asian | 0 | 0.0% |
| Black / African American | 0 | 0.0% |
| Hawaiian / Pacific | 0 | 0.0% |
| Hispanic or Latino | 0 | 0.0% |
| Native / Alaskan | 1 | 0.2% |
| White / Caucasian | 547 | 98.2% |
| Two or more Races | 9 | 1.6% |
| Some other Race | 0 | 0.0% |
| Total | 557 | 100.0% |
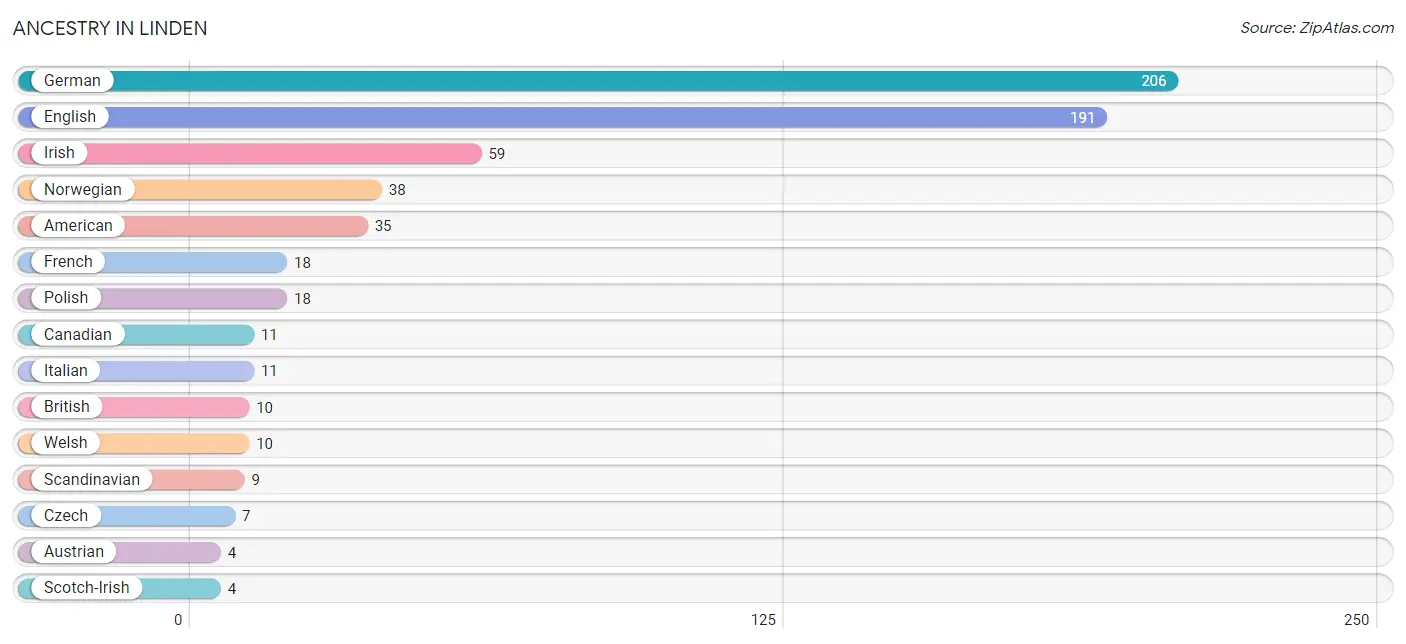
Ancestry in Linden
The most populous ancestries reported in Linden are German (206 | 37.0%), English (191 | 34.3%), Irish (59 | 10.6%), Norwegian (38 | 6.8%), and American (35 | 6.3%), together accounting for 95.0% of all Linden residents.
| Ancestry | # Population | % Population |
| American | 35 | 6.3% |
| Austrian | 4 | 0.7% |
| British | 10 | 1.8% |
| Canadian | 11 | 2.0% |
| Chippewa | 1 | 0.2% |
| Czech | 7 | 1.3% |
| English | 191 | 34.3% |
| French | 18 | 3.2% |
| German | 206 | 37.0% |
| Greek | 2 | 0.4% |
| Indian (Asian) | 3 | 0.5% |
| Irish | 59 | 10.6% |
| Italian | 11 | 2.0% |
| Luxembourger | 3 | 0.5% |
| Macedonian | 2 | 0.4% |
| Native Hawaiian | 3 | 0.5% |
| Norwegian | 38 | 6.8% |
| Polish | 18 | 3.2% |
| Scandinavian | 9 | 1.6% |
| Scotch-Irish | 4 | 0.7% |
| Scottish | 1 | 0.2% |
| Swiss | 3 | 0.5% |
| Welsh | 10 | 1.8% | View All 23 Rows |
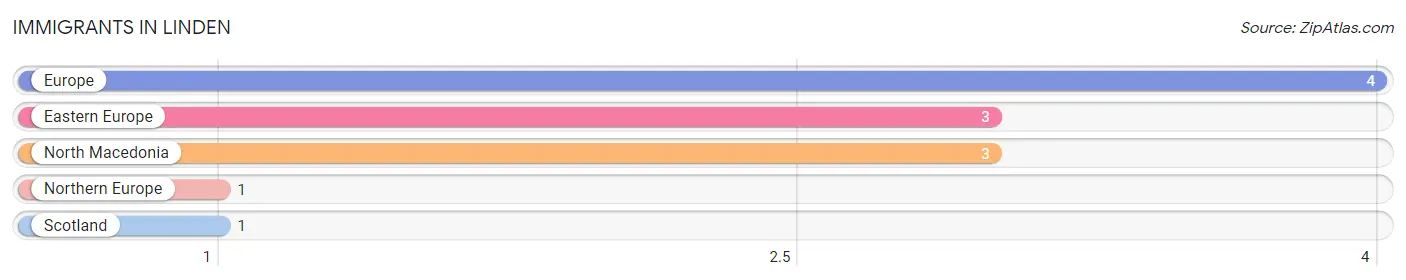
Immigrants in Linden
The most numerous immigrant groups reported in Linden came from Europe (4 | 0.7%), Eastern Europe (3 | 0.5%), North Macedonia (3 | 0.5%), Northern Europe (1 | 0.2%), and Scotland (1 | 0.2%), together accounting for 2.2% of all Linden residents.
| Immigration Origin | # Population | % Population |
| Eastern Europe | 3 | 0.5% |
| Europe | 4 | 0.7% |
| North Macedonia | 3 | 0.5% |
| Northern Europe | 1 | 0.2% |
| Scotland | 1 | 0.2% | View All 5 Rows |
Sex and Age in Linden
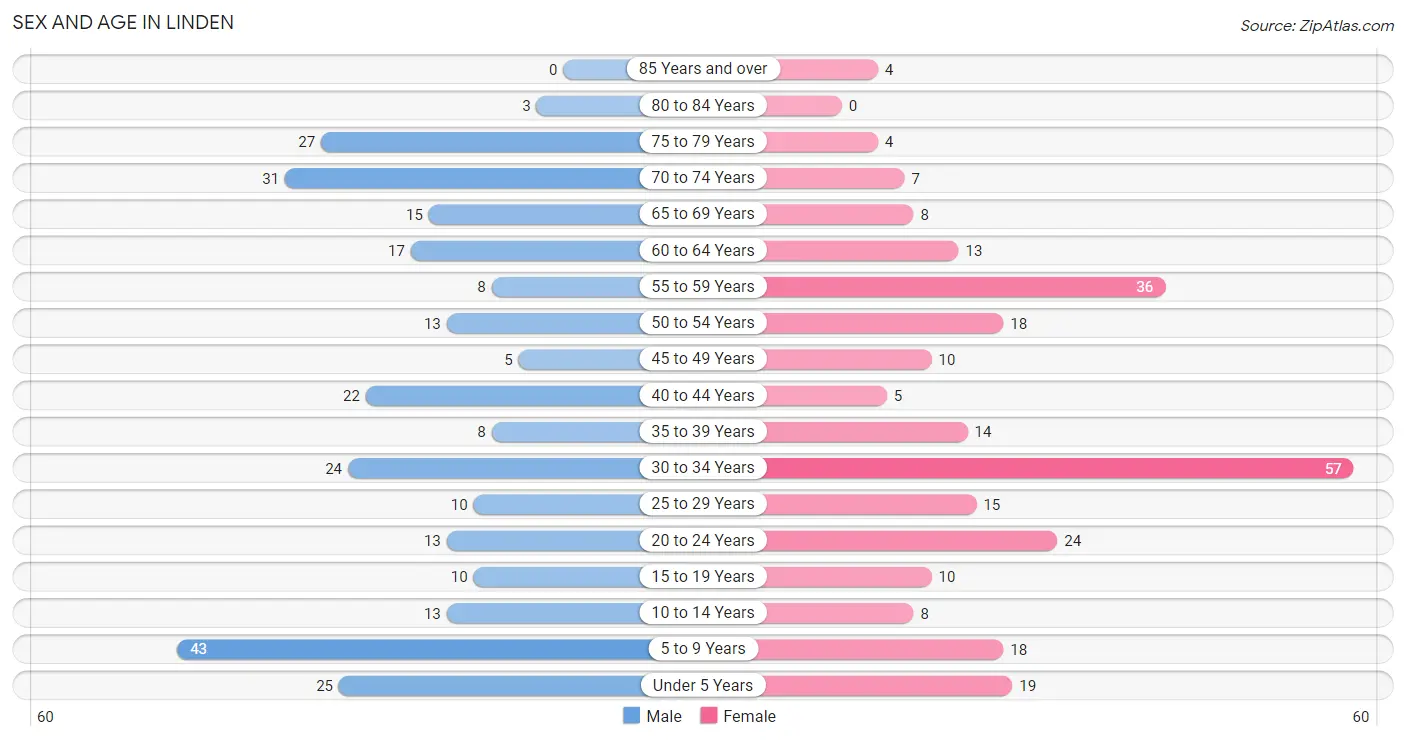
Sex and Age in Linden
The most populous age groups in Linden are 5 to 9 Years (43 | 15.0%) for men and 30 to 34 Years (57 | 21.1%) for women.
| Age Bracket | Male | Female |
| Under 5 Years | 25 (8.7%) | 19 (7.0%) |
| 5 to 9 Years | 43 (15.0%) | 18 (6.7%) |
| 10 to 14 Years | 13 (4.5%) | 8 (3.0%) |
| 15 to 19 Years | 10 (3.5%) | 10 (3.7%) |
| 20 to 24 Years | 13 (4.5%) | 24 (8.9%) |
| 25 to 29 Years | 10 (3.5%) | 15 (5.6%) |
| 30 to 34 Years | 24 (8.4%) | 57 (21.1%) |
| 35 to 39 Years | 8 (2.8%) | 14 (5.2%) |
| 40 to 44 Years | 22 (7.7%) | 5 (1.8%) |
| 45 to 49 Years | 5 (1.7%) | 10 (3.7%) |
| 50 to 54 Years | 13 (4.5%) | 18 (6.7%) |
| 55 to 59 Years | 8 (2.8%) | 36 (13.3%) |
| 60 to 64 Years | 17 (5.9%) | 13 (4.8%) |
| 65 to 69 Years | 15 (5.2%) | 8 (3.0%) |
| 70 to 74 Years | 31 (10.8%) | 7 (2.6%) |
| 75 to 79 Years | 27 (9.4%) | 4 (1.5%) |
| 80 to 84 Years | 3 (1.1%) | 0 (0.0%) |
| 85 Years and over | 0 (0.0%) | 4 (1.5%) |
| Total | 287 (100.0%) | 270 (100.0%) |
Families and Households in Linden
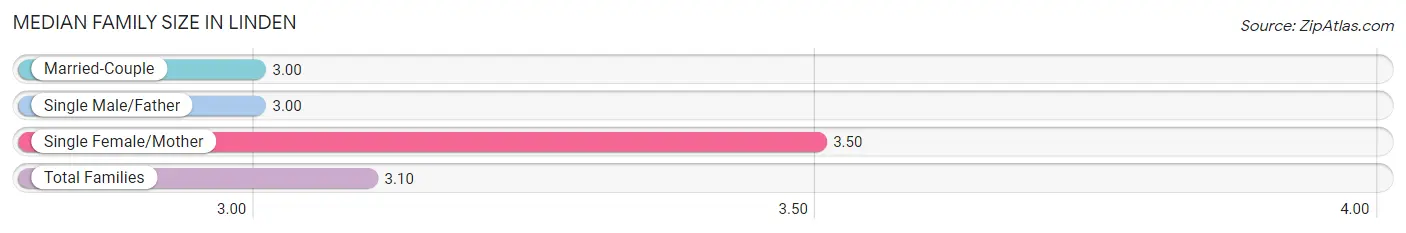
Median Family Size in Linden
The median family size in Linden is 3.10 persons per family, with single female/mother families (30 | 20.8%) accounting for the largest median family size of 3.5 persons per family. On the other hand, married-couple families (104 | 72.2%) represent the smallest median family size with 3.00 persons per family.
| Family Type | # Families | Family Size |
| Married-Couple | 104 (72.2%) | 3.00 |
| Single Male/Father | 10 (6.9%) | 3.00 |
| Single Female/Mother | 30 (20.8%) | 3.50 |
| Total Families | 144 (100.0%) | 3.10 |
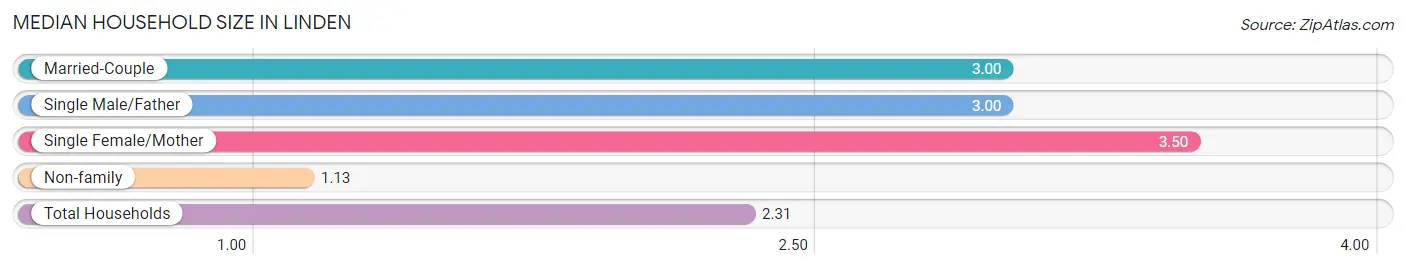
Median Household Size in Linden
The median household size in Linden is 2.31 persons per household, with single female/mother households (30 | 12.4%) accounting for the largest median household size of 3.5 persons per household. non-family households (97 | 40.3%) represent the smallest median household size with 1.13 persons per household.
| Household Type | # Households | Household Size |
| Married-Couple | 104 (43.1%) | 3.00 |
| Single Male/Father | 10 (4.2%) | 3.00 |
| Single Female/Mother | 30 (12.4%) | 3.50 |
| Non-family | 97 (40.3%) | 1.13 |
| Total Households | 241 (100.0%) | 2.31 |
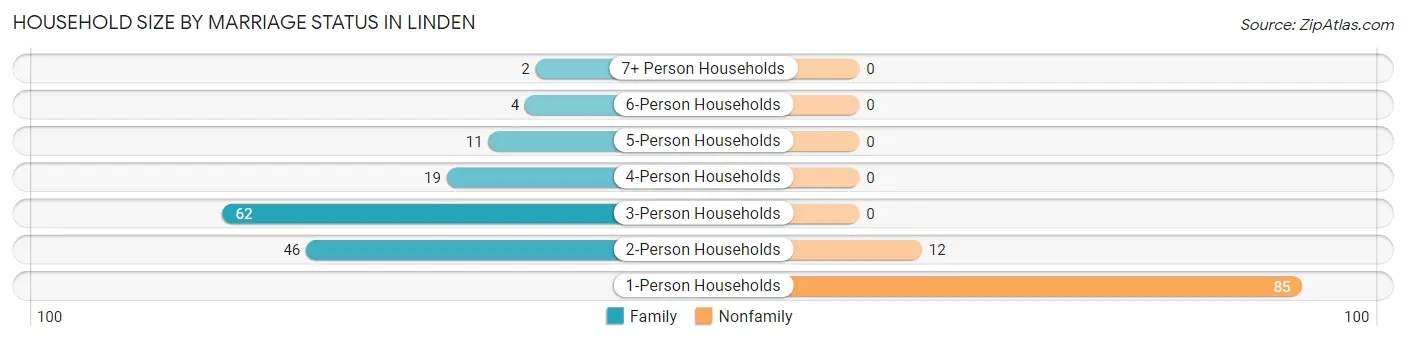
Household Size by Marriage Status in Linden
Out of a total of 241 households in Linden, 144 (59.8%) are family households, while 97 (40.3%) are nonfamily households. The most numerous type of family households are 3-person households, comprising 62, and the most common type of nonfamily households are 1-person households, comprising 85.
| Household Size | Family Households | Nonfamily Households |
| 1-Person Households | - | 85 (35.3%) |
| 2-Person Households | 46 (19.1%) | 12 (5.0%) |
| 3-Person Households | 62 (25.7%) | 0 (0.0%) |
| 4-Person Households | 19 (7.9%) | 0 (0.0%) |
| 5-Person Households | 11 (4.6%) | 0 (0.0%) |
| 6-Person Households | 4 (1.7%) | 0 (0.0%) |
| 7+ Person Households | 2 (0.8%) | 0 (0.0%) |
| Total | 144 (59.8%) | 97 (40.3%) |
Female Fertility in Linden
Fertility by Age in Linden
Average fertility rate in Linden is 42.0 births per 1,000 women. Women in the age bracket of 20 to 34 years have the highest fertility rate with 63.0 births per 1,000 women. Women in the age bracket of 20 to 34 years acount for 100.0% of all women with births.
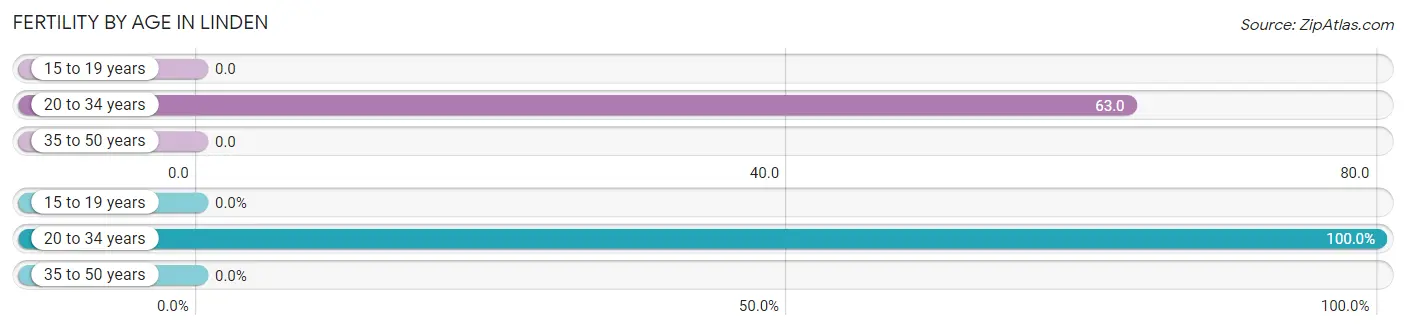
| Age Bracket | Women with Births | Births / 1,000 Women |
| 15 to 19 years | 0 (0.0%) | 0.0 |
| 20 to 34 years | 6 (100.0%) | 63.0 |
| 35 to 50 years | 0 (0.0%) | 0.0 |
| Total | 6 (100.0%) | 42.0 |
Fertility by Age by Marriage Status in Linden
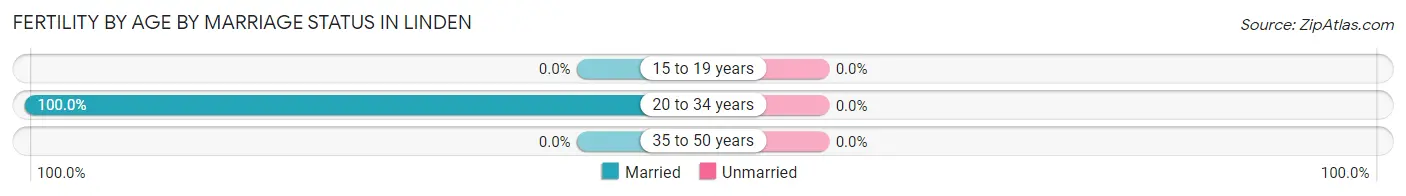
| Age Bracket | Married | Unmarried |
| 15 to 19 years | 0 (0.0%) | 0 (0.0%) |
| 20 to 34 years | 6 (100.0%) | 0 (0.0%) |
| 35 to 50 years | 0 (0.0%) | 0 (0.0%) |
| Total | 6 (100.0%) | 0 (0.0%) |
Fertility by Education in Linden
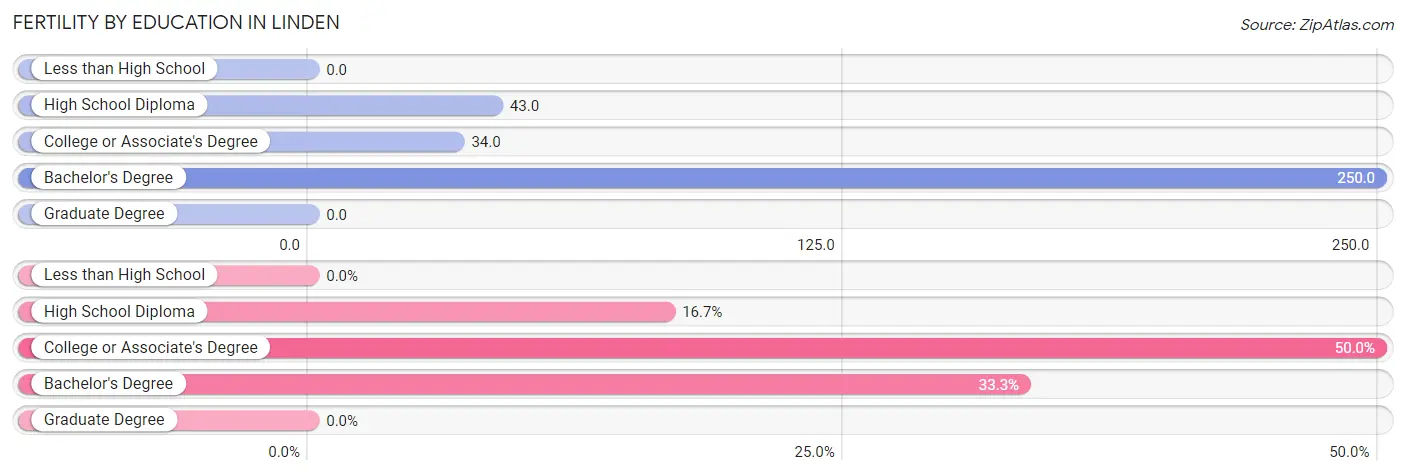
| Educational Attainment | Women with Births | Births / 1,000 Women |
| Less than High School | 0 (0.0%) | 0.0 |
| High School Diploma | 1 (16.7%) | 43.0 |
| College or Associate's Degree | 3 (50.0%) | 34.0 |
| Bachelor's Degree | 2 (33.3%) | 250.0 |
| Graduate Degree | 0 (0.0%) | 0.0 |
| Total | 6 (100.0%) | 42.0 |
Fertility by Education by Marriage Status in Linden
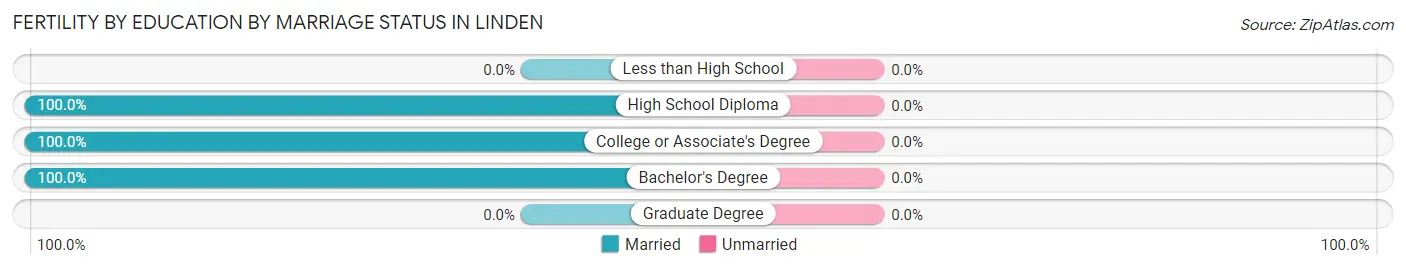
| Educational Attainment | Married | Unmarried |
| Less than High School | 0 (0.0%) | 0 (0.0%) |
| High School Diploma | 1 (100.0%) | 0 (0.0%) |
| College or Associate's Degree | 3 (100.0%) | 0 (0.0%) |
| Bachelor's Degree | 2 (100.0%) | 0 (0.0%) |
| Graduate Degree | 0 (0.0%) | 0 (0.0%) |
| Total | 6 (100.0%) | 0 (0.0%) |
Income in Linden
Income Overview in Linden
Per Capita Income in Linden is $31,671, while median incomes of families and households are $85,208 and $54,803 respectively.
| Characteristic | Number | Measure |
| Per Capita Income | 557 | $31,671 |
| Median Family Income | 144 | $85,208 |
| Mean Family Income | 144 | $100,279 |
| Median Household Income | 241 | $54,803 |
| Mean Household Income | 241 | $74,532 |
| Income Deficit | 144 | $0 |
| Wage / Income Gap (%) | 557 | 58.57% |
| Wage / Income Gap ($) | 557 | 41.43¢ per $1 |
| Gini / Inequality Index | 557 | 0.44 |
Earnings by Sex in Linden
Average Earnings in Linden are $38,750, $60,341 for men and $25,000 for women, a difference of 58.6%.
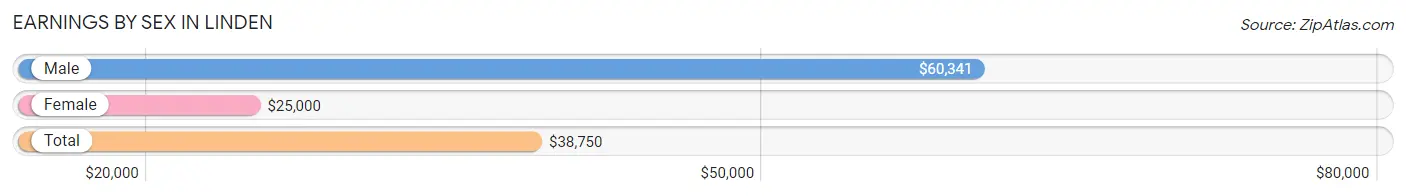
| Sex | Number | Average Earnings |
| Male | 117 (37.6%) | $60,341 |
| Female | 194 (62.4%) | $25,000 |
| Total | 311 (100.0%) | $38,750 |
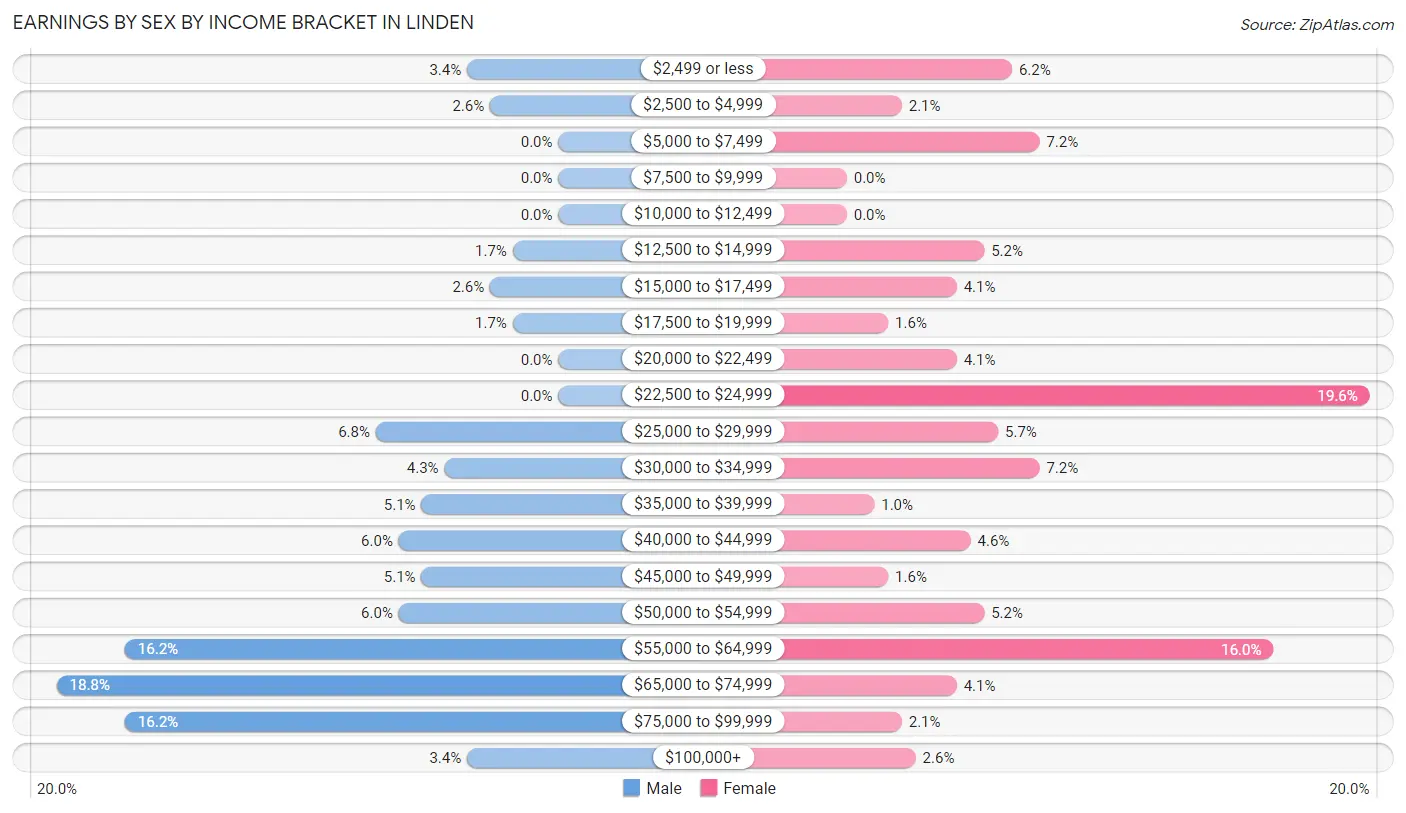
Earnings by Sex by Income Bracket in Linden
The most common earnings brackets in Linden are $65,000 to $74,999 for men (22 | 18.8%) and $22,500 to $24,999 for women (38 | 19.6%).
| Income | Male | Female |
| $2,499 or less | 4 (3.4%) | 12 (6.2%) |
| $2,500 to $4,999 | 3 (2.6%) | 4 (2.1%) |
| $5,000 to $7,499 | 0 (0.0%) | 14 (7.2%) |
| $7,500 to $9,999 | 0 (0.0%) | 0 (0.0%) |
| $10,000 to $12,499 | 0 (0.0%) | 0 (0.0%) |
| $12,500 to $14,999 | 2 (1.7%) | 10 (5.1%) |
| $15,000 to $17,499 | 3 (2.6%) | 8 (4.1%) |
| $17,500 to $19,999 | 2 (1.7%) | 3 (1.5%) |
| $20,000 to $22,499 | 0 (0.0%) | 8 (4.1%) |
| $22,500 to $24,999 | 0 (0.0%) | 38 (19.6%) |
| $25,000 to $29,999 | 8 (6.8%) | 11 (5.7%) |
| $30,000 to $34,999 | 5 (4.3%) | 14 (7.2%) |
| $35,000 to $39,999 | 6 (5.1%) | 2 (1.0%) |
| $40,000 to $44,999 | 7 (6.0%) | 9 (4.6%) |
| $45,000 to $49,999 | 6 (5.1%) | 3 (1.5%) |
| $50,000 to $54,999 | 7 (6.0%) | 10 (5.1%) |
| $55,000 to $64,999 | 19 (16.2%) | 31 (16.0%) |
| $65,000 to $74,999 | 22 (18.8%) | 8 (4.1%) |
| $75,000 to $99,999 | 19 (16.2%) | 4 (2.1%) |
| $100,000+ | 4 (3.4%) | 5 (2.6%) |
| Total | 117 (100.0%) | 194 (100.0%) |
Earnings by Sex by Educational Attainment in Linden
Average earnings in Linden are $61,818 for men and $33,036 for women, a difference of 46.6%. Men with an educational attainment of college or associate's degree enjoy the highest average annual earnings of $66,250, while those with high school diploma education earn the least with $55,625. Women with an educational attainment of high school diploma earn the most with the average annual earnings of $35,000, while those with college or associate's degree education have the smallest earnings of $25,500.
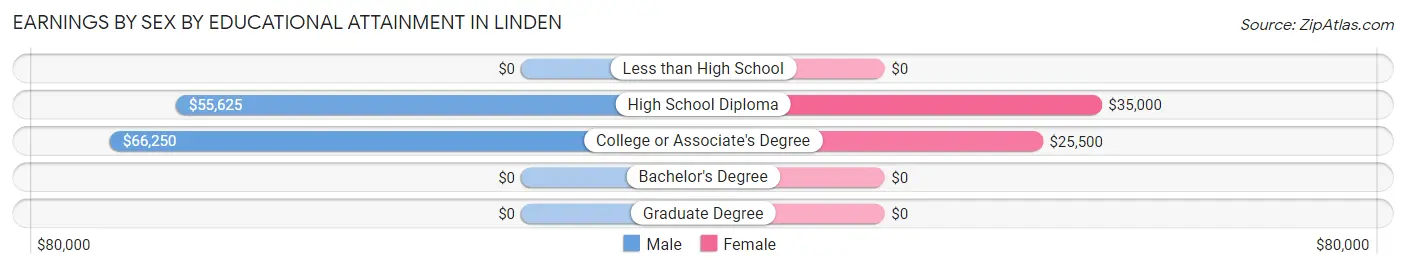
| Educational Attainment | Male Income | Female Income |
| Less than High School | - | - |
| High School Diploma | $55,625 | $35,000 |
| College or Associate's Degree | $66,250 | $25,500 |
| Bachelor's Degree | - | - |
| Graduate Degree | - | - |
| Total | $61,818 | $33,036 |
Family Income in Linden
Family Income Brackets in Linden
According to the Linden family income data, there are 36 families falling into the $75,000 to $99,999 income range, which is the most common income bracket and makes up 25.0% of all families.
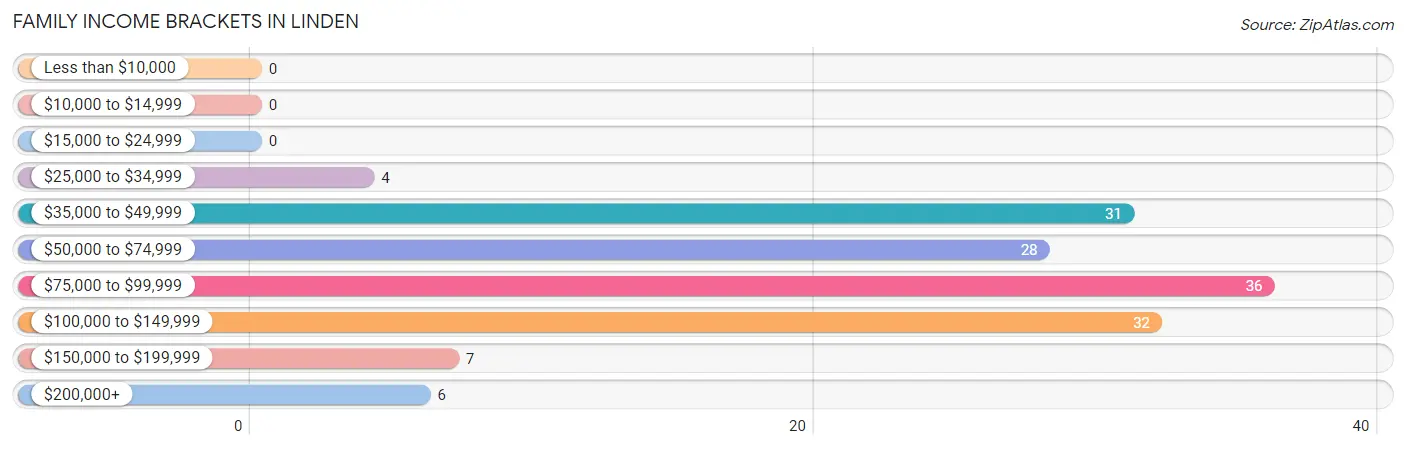
| Income Bracket | # Families | % Families |
| Less than $10,000 | 0 | 0.0% |
| $10,000 to $14,999 | 0 | 0.0% |
| $15,000 to $24,999 | 0 | 0.0% |
| $25,000 to $34,999 | 4 | 2.8% |
| $35,000 to $49,999 | 31 | 21.5% |
| $50,000 to $74,999 | 28 | 19.4% |
| $75,000 to $99,999 | 36 | 25.0% |
| $100,000 to $149,999 | 32 | 22.2% |
| $150,000 to $199,999 | 7 | 4.9% |
| $200,000+ | 6 | 4.2% |
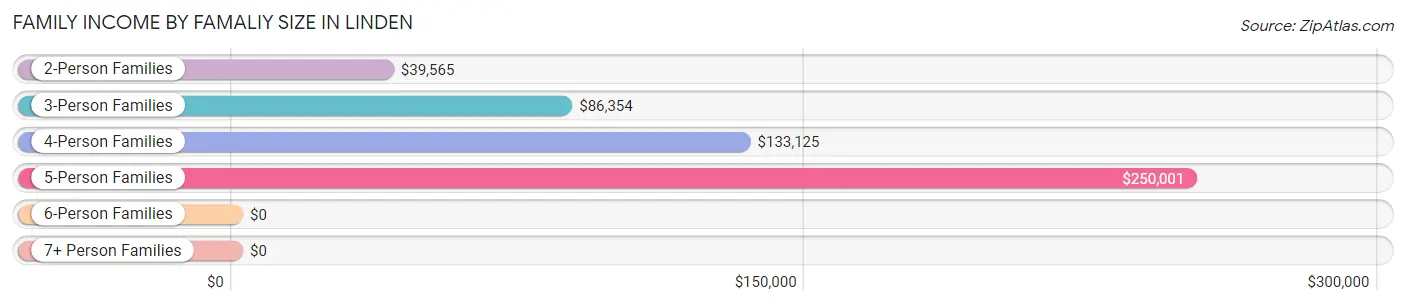
Family Income by Famaliy Size in Linden
5-person families (11 | 7.6%) account for the highest median family income in Linden with $250,001 per family, while 5-person families (11 | 7.6%) have the highest median income of $50,000 per family member.
| Income Bracket | # Families | Median Income |
| 2-Person Families | 46 (31.9%) | $39,565 |
| 3-Person Families | 62 (43.1%) | $86,354 |
| 4-Person Families | 19 (13.2%) | $133,125 |
| 5-Person Families | 11 (7.6%) | $250,001 |
| 6-Person Families | 4 (2.8%) | $0 |
| 7+ Person Families | 2 (1.4%) | $0 |
| Total | 144 (100.0%) | $85,208 |
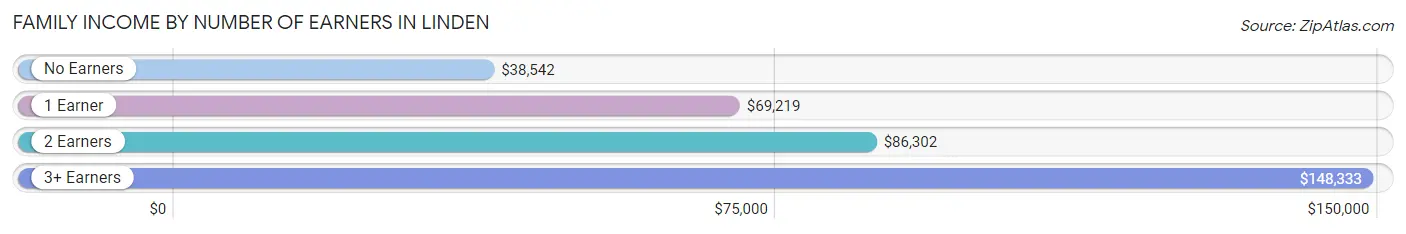
Family Income by Number of Earners in Linden
The median family income in Linden is $85,208, with families comprising 3+ earners (18) having the highest median family income of $148,333, while families with no earners (28) have the lowest median family income of $38,542, accounting for 12.5% and 19.4% of families, respectively.
| Number of Earners | # Families | Median Income |
| No Earners | 28 (19.4%) | $38,542 |
| 1 Earner | 19 (13.2%) | $69,219 |
| 2 Earners | 79 (54.9%) | $86,302 |
| 3+ Earners | 18 (12.5%) | $148,333 |
| Total | 144 (100.0%) | $85,208 |
Household Income in Linden
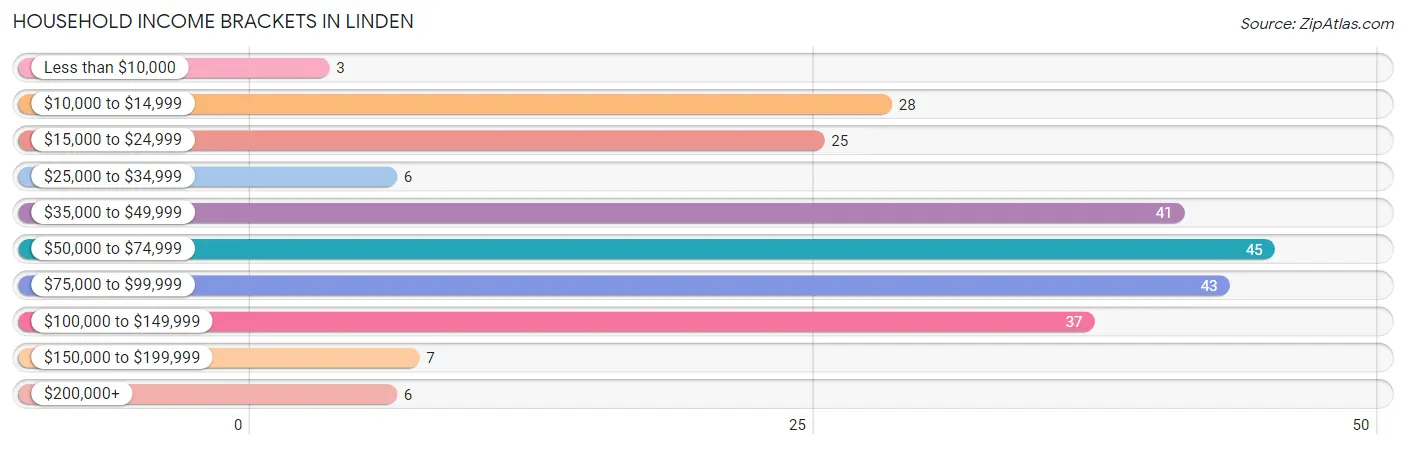
Household Income Brackets in Linden
With 45 households falling in the category, the $50,000 to $74,999 income range is the most frequent in Linden, accounting for 18.7% of all households. In contrast, only 3 households (1.2%) fall into the less than $10,000 income bracket, making it the least populous group.
| Income Bracket | # Households | % Households |
| Less than $10,000 | 3 | 1.2% |
| $10,000 to $14,999 | 28 | 11.6% |
| $15,000 to $24,999 | 25 | 10.4% |
| $25,000 to $34,999 | 6 | 2.5% |
| $35,000 to $49,999 | 41 | 17.0% |
| $50,000 to $74,999 | 45 | 18.7% |
| $75,000 to $99,999 | 43 | 17.8% |
| $100,000 to $149,999 | 37 | 15.4% |
| $150,000 to $199,999 | 7 | 2.9% |
| $200,000+ | 6 | 2.5% |
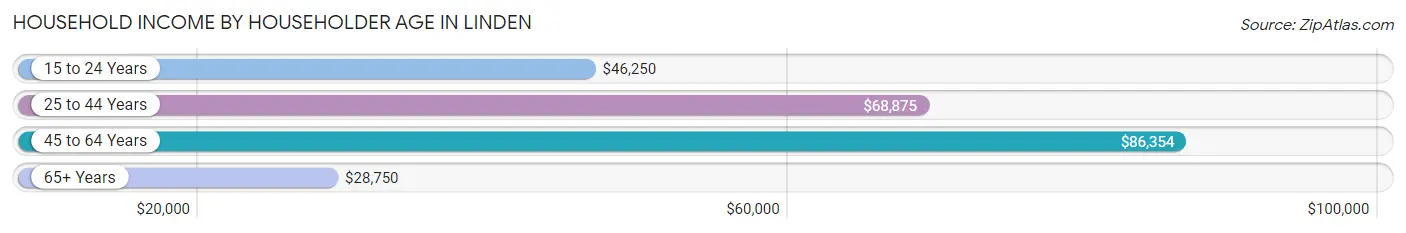
Household Income by Householder Age in Linden
The median household income in Linden is $54,803, with the highest median household income of $86,354 found in the 45 to 64 years age bracket for the primary householder. A total of 84 households (34.8%) fall into this category. Meanwhile, the 65+ years age bracket for the primary householder has the lowest median household income of $28,750, with 86 households (35.7%) in this group.
| Income Bracket | # Households | Median Income |
| 15 to 24 Years | 6 (2.5%) | $46,250 |
| 25 to 44 Years | 65 (27.0%) | $68,875 |
| 45 to 64 Years | 84 (34.8%) | $86,354 |
| 65+ Years | 86 (35.7%) | $28,750 |
| Total | 241 (100.0%) | $54,803 |
Poverty in Linden
Income Below Poverty by Sex and Age in Linden
With 11.5% poverty level for males and 4.1% for females among the residents of Linden, 65 to 74 year old males and 15 year old females are the most vulnerable to poverty, with 26 males (56.5%) and 2 females (100.0%) in their respective age groups living below the poverty level.
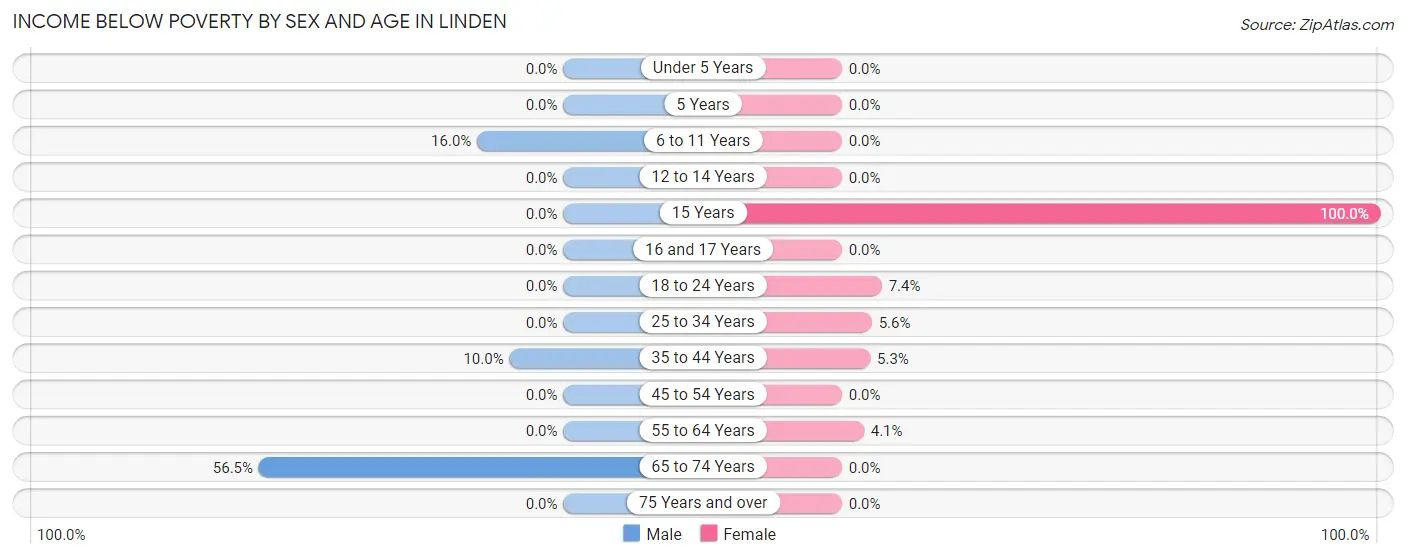
| Age Bracket | Male | Female |
| Under 5 Years | 0 (0.0%) | 0 (0.0%) |
| 5 Years | 0 (0.0%) | 0 (0.0%) |
| 6 to 11 Years | 4 (16.0%) | 0 (0.0%) |
| 12 to 14 Years | 0 (0.0%) | 0 (0.0%) |
| 15 Years | 0 (0.0%) | 2 (100.0%) |
| 16 and 17 Years | 0 (0.0%) | 0 (0.0%) |
| 18 to 24 Years | 0 (0.0%) | 2 (7.4%) |
| 25 to 34 Years | 0 (0.0%) | 4 (5.6%) |
| 35 to 44 Years | 3 (10.0%) | 1 (5.3%) |
| 45 to 54 Years | 0 (0.0%) | 0 (0.0%) |
| 55 to 64 Years | 0 (0.0%) | 2 (4.1%) |
| 65 to 74 Years | 26 (56.5%) | 0 (0.0%) |
| 75 Years and over | 0 (0.0%) | 0 (0.0%) |
| Total | 33 (11.5%) | 11 (4.1%) |
Income Above Poverty by Sex and Age in Linden
According to the poverty statistics in Linden, males aged under 5 years and females aged under 5 years are the age groups that are most secure financially, with 100.0% of males and 100.0% of females in these age groups living above the poverty line.
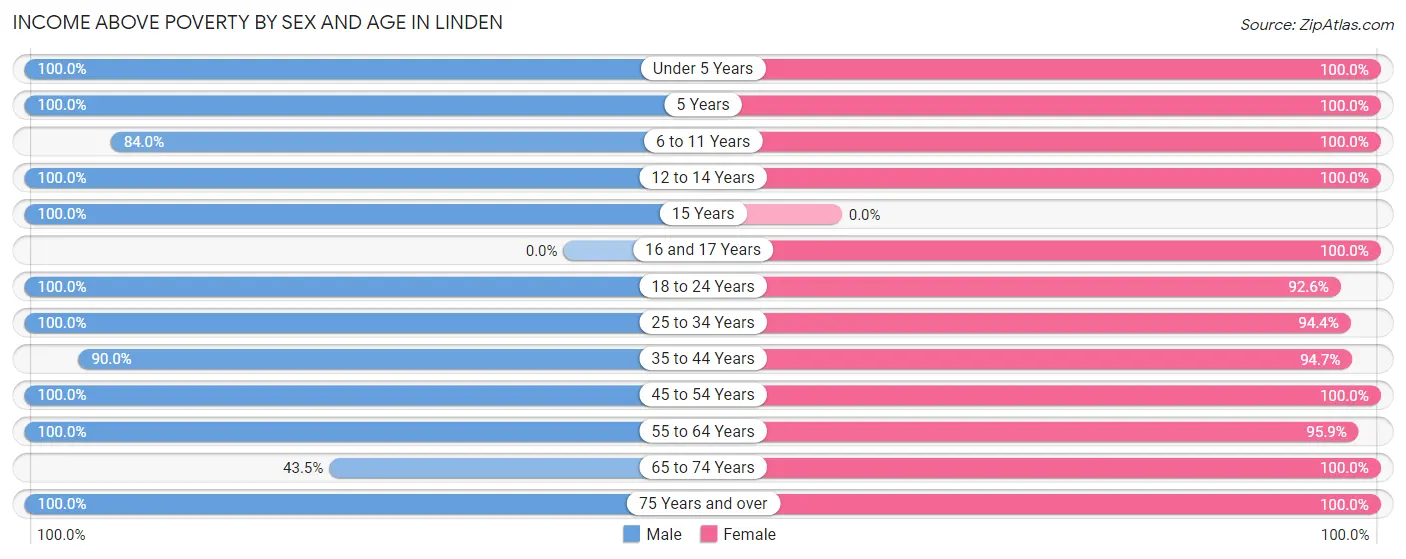
| Age Bracket | Male | Female |
| Under 5 Years | 25 (100.0%) | 19 (100.0%) |
| 5 Years | 25 (100.0%) | 7 (100.0%) |
| 6 to 11 Years | 21 (84.0%) | 11 (100.0%) |
| 12 to 14 Years | 6 (100.0%) | 8 (100.0%) |
| 15 Years | 7 (100.0%) | 0 (0.0%) |
| 16 and 17 Years | 0 (0.0%) | 5 (100.0%) |
| 18 to 24 Years | 16 (100.0%) | 25 (92.6%) |
| 25 to 34 Years | 34 (100.0%) | 68 (94.4%) |
| 35 to 44 Years | 27 (90.0%) | 18 (94.7%) |
| 45 to 54 Years | 18 (100.0%) | 28 (100.0%) |
| 55 to 64 Years | 25 (100.0%) | 47 (95.9%) |
| 65 to 74 Years | 20 (43.5%) | 15 (100.0%) |
| 75 Years and over | 30 (100.0%) | 8 (100.0%) |
| Total | 254 (88.5%) | 259 (95.9%) |
Income Below Poverty Among Married-Couple Families in Linden
The poverty statistics for married-couple families in Linden show that 1.9% or 2 of the total 104 families live below the poverty line. Families with 3 or 4 children have the highest poverty rate of 13.3%, comprising of 2 families. On the other hand, families with no children have the lowest poverty rate of 0.0%, which includes 0 families.
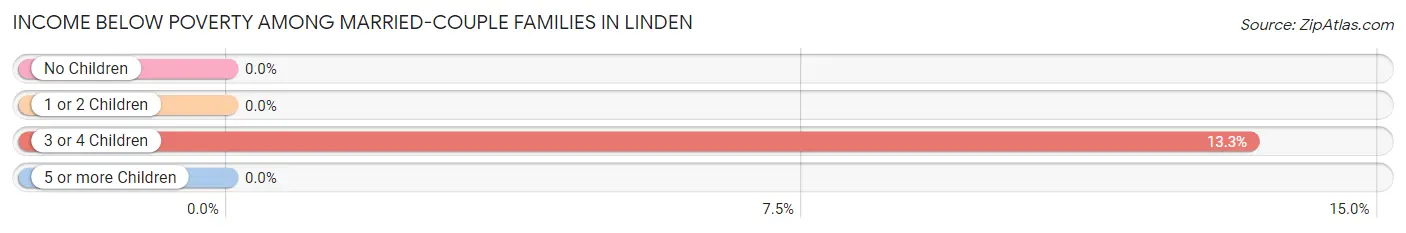
| Children | Above Poverty | Below Poverty |
| No Children | 58 (100.0%) | 0 (0.0%) |
| 1 or 2 Children | 29 (100.0%) | 0 (0.0%) |
| 3 or 4 Children | 13 (86.7%) | 2 (13.3%) |
| 5 or more Children | 2 (100.0%) | 0 (0.0%) |
| Total | 102 (98.1%) | 2 (1.9%) |
Income Below Poverty Among Single-Parent Households in Linden
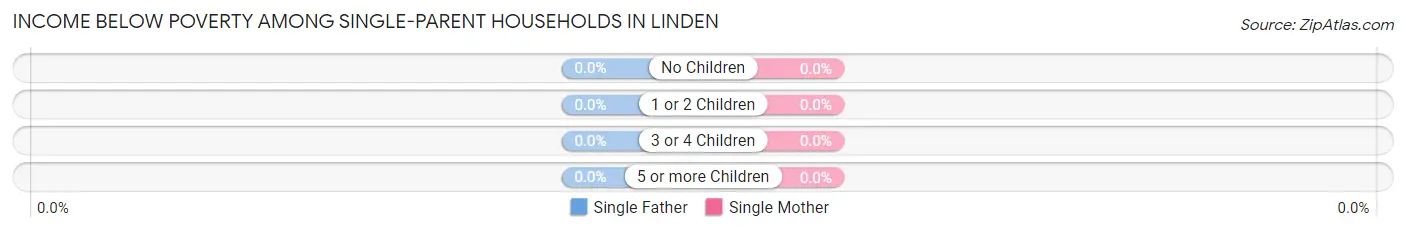
| Children | Single Father | Single Mother |
| No Children | 0 (0.0%) | 0 (0.0%) |
| 1 or 2 Children | 0 (0.0%) | 0 (0.0%) |
| 3 or 4 Children | 0 (0.0%) | 0 (0.0%) |
| 5 or more Children | 0 (0.0%) | 0 (0.0%) |
| Total | 0 (0.0%) | 0 (0.0%) |
Income Below Poverty Among Married-Couple vs Single-Parent Households in Linden
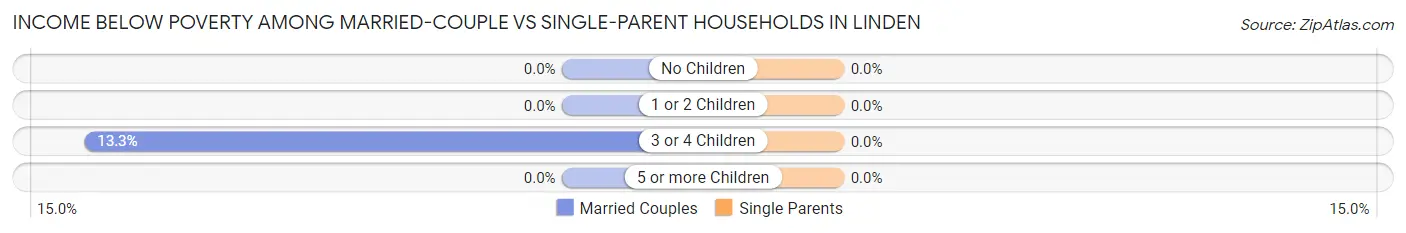
| Children | Married-Couple Families | Single-Parent Households |
| No Children | 0 (0.0%) | 0 (0.0%) |
| 1 or 2 Children | 0 (0.0%) | 0 (0.0%) |
| 3 or 4 Children | 2 (13.3%) | 0 (0.0%) |
| 5 or more Children | 0 (0.0%) | 0 (0.0%) |
| Total | 2 (1.9%) | 0 (0.0%) |
Employment Characteristics in Linden
Employment by Class of Employer in Linden
Among the 245 employed individuals in Linden, private company employees (182 | 74.3%), not-for-profit organizations (17 | 6.9%), and self-employed (not incorporated) (13 | 5.3%) make up the most common classes of employment.
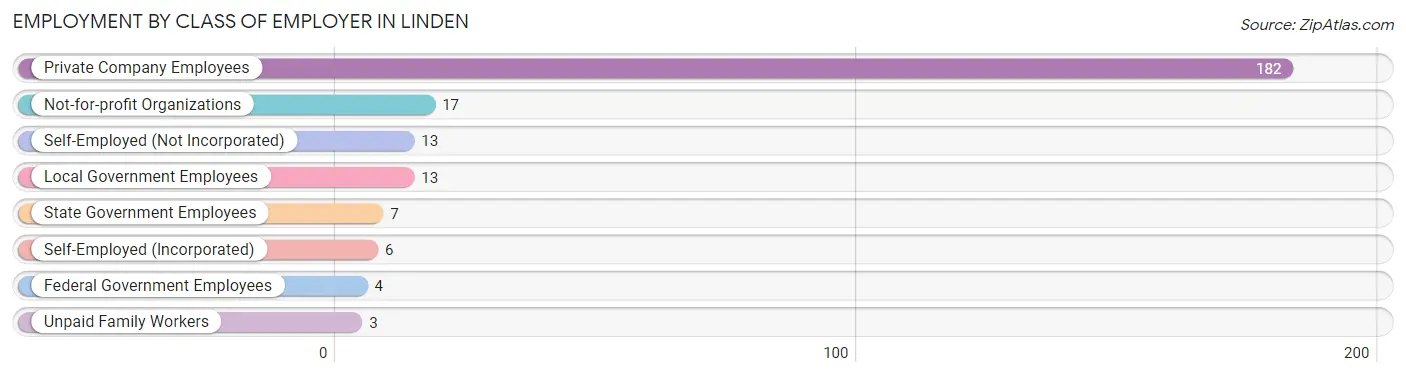
| Employer Class | # Employees | % Employees |
| Private Company Employees | 182 | 74.3% |
| Self-Employed (Incorporated) | 6 | 2.5% |
| Self-Employed (Not Incorporated) | 13 | 5.3% |
| Not-for-profit Organizations | 17 | 6.9% |
| Local Government Employees | 13 | 5.3% |
| State Government Employees | 7 | 2.9% |
| Federal Government Employees | 4 | 1.6% |
| Unpaid Family Workers | 3 | 1.2% |
| Total | 245 | 100.0% |
Employment Status by Age in Linden
According to the labor force statistics for Linden, out of the total population over 16 years of age (422), 60.0% or 253 individuals are in the labor force, with 2.4% or 6 of them unemployed. The age group with the highest labor force participation rate is 20 to 24 years, with 100.0% or 37 individuals in the labor force. Within the labor force, the 20 to 24 years age range has the highest percentage of unemployed individuals, with 8.1% or 3 of them being unemployed.
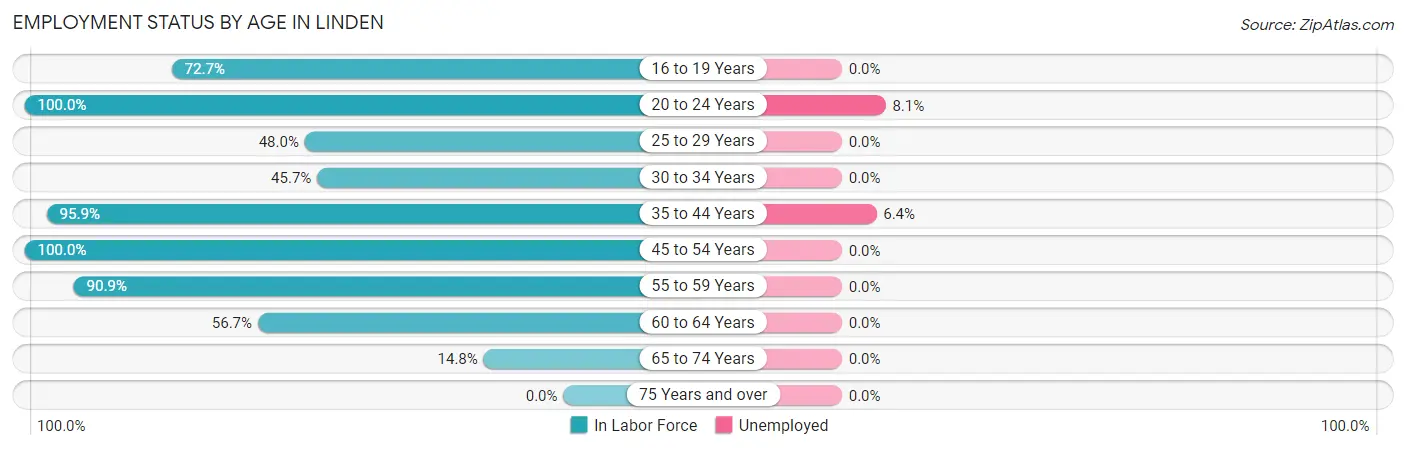
| Age Bracket | In Labor Force | Unemployed |
| 16 to 19 Years | 8 (72.7%) | 0 (0.0%) |
| 20 to 24 Years | 37 (100.0%) | 3 (8.1%) |
| 25 to 29 Years | 12 (48.0%) | 0 (0.0%) |
| 30 to 34 Years | 37 (45.7%) | 0 (0.0%) |
| 35 to 44 Years | 47 (95.9%) | 3 (6.4%) |
| 45 to 54 Years | 46 (100.0%) | 0 (0.0%) |
| 55 to 59 Years | 40 (90.9%) | 0 (0.0%) |
| 60 to 64 Years | 17 (56.7%) | 0 (0.0%) |
| 65 to 74 Years | 9 (14.8%) | 0 (0.0%) |
| 75 Years and over | 0 (0.0%) | 0 (0.0%) |
| Total | 253 (60.0%) | 6 (2.4%) |
Employment Status by Educational Attainment in Linden
According to labor force statistics for Linden, 72.4% of individuals (199) out of the total population between 25 and 64 years of age (275) are in the labor force, with 1.5% or 3 of them being unemployed. The group with the highest labor force participation rate are those with the educational attainment of bachelor's degree or higher, with 91.3% or 21 individuals in the labor force. Within the labor force, individuals with less than high school education have the highest percentage of unemployment, with 16.7% or 1 of them being unemployed.
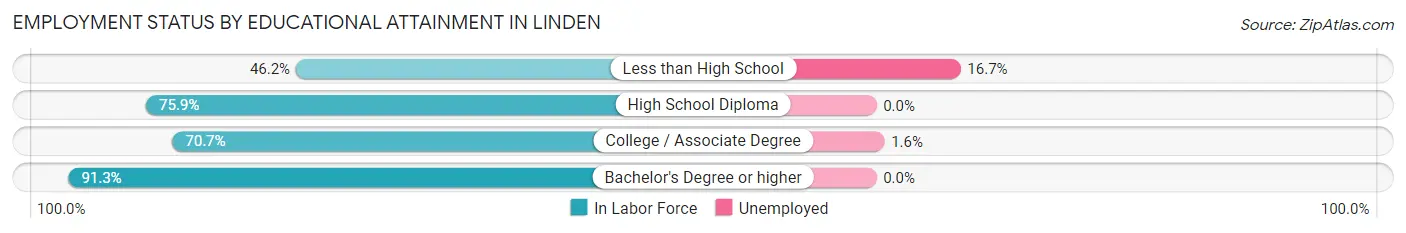
| Educational Attainment | In Labor Force | Unemployed |
| Less than High School | 6 (46.2%) | 2 (16.7%) |
| High School Diploma | 44 (75.9%) | 0 (0.0%) |
| College / Associate Degree | 128 (70.7%) | 3 (1.6%) |
| Bachelor's Degree or higher | 21 (91.3%) | 0 (0.0%) |
| Total | 199 (72.4%) | 4 (1.5%) |
Employment Occupations by Sex in Linden
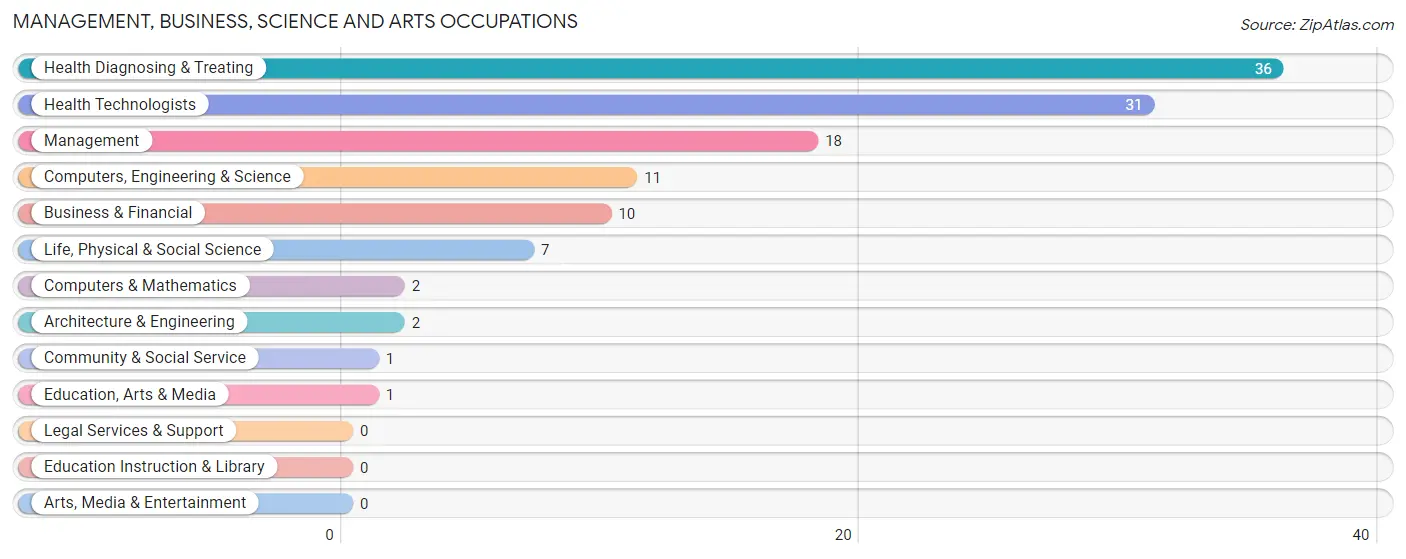
Management, Business, Science and Arts Occupations
The most common Management, Business, Science and Arts occupations in Linden are Health Diagnosing & Treating (36 | 14.6%), Health Technologists (31 | 12.6%), Management (18 | 7.3%), Computers, Engineering & Science (11 | 4.4%), and Business & Financial (10 | 4.1%).
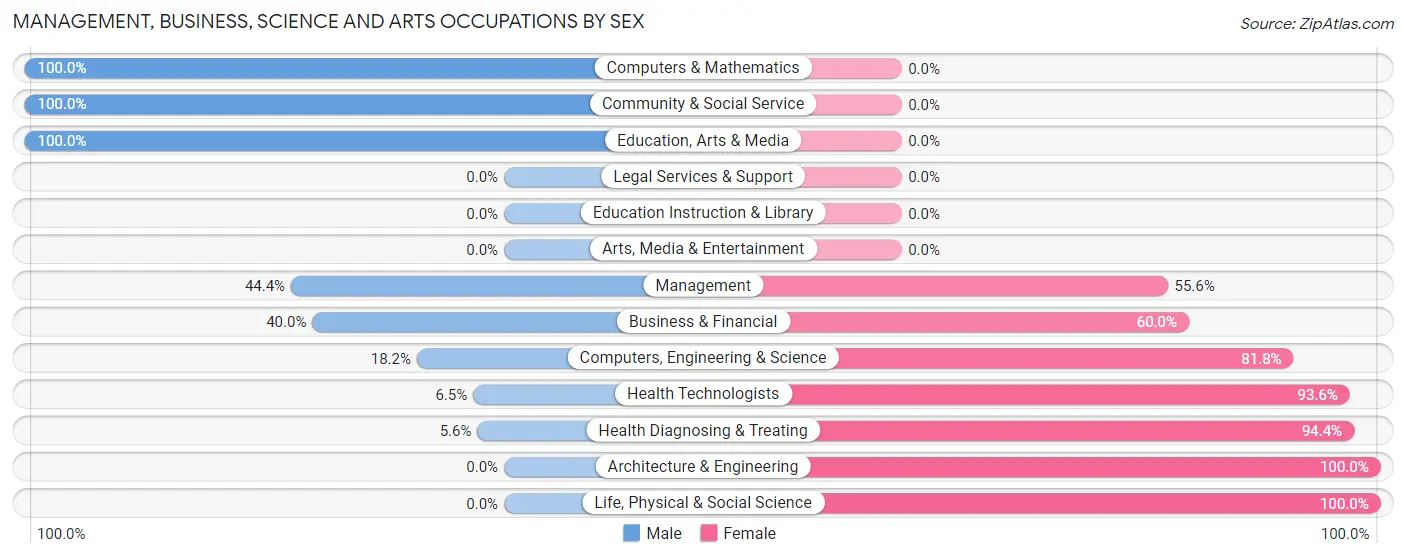
Management, Business, Science and Arts Occupations by Sex
Within the Management, Business, Science and Arts occupations in Linden, the most male-oriented occupations are Computers & Mathematics (100.0%), Community & Social Service (100.0%), and Education, Arts & Media (100.0%), while the most female-oriented occupations are Architecture & Engineering (100.0%), Life, Physical & Social Science (100.0%), and Health Diagnosing & Treating (94.4%).
| Occupation | Male | Female |
| Management | 8 (44.4%) | 10 (55.6%) |
| Business & Financial | 4 (40.0%) | 6 (60.0%) |
| Computers, Engineering & Science | 2 (18.2%) | 9 (81.8%) |
| Computers & Mathematics | 2 (100.0%) | 0 (0.0%) |
| Architecture & Engineering | 0 (0.0%) | 2 (100.0%) |
| Life, Physical & Social Science | 0 (0.0%) | 7 (100.0%) |
| Community & Social Service | 1 (100.0%) | 0 (0.0%) |
| Education, Arts & Media | 1 (100.0%) | 0 (0.0%) |
| Legal Services & Support | 0 (0.0%) | 0 (0.0%) |
| Education Instruction & Library | 0 (0.0%) | 0 (0.0%) |
| Arts, Media & Entertainment | 0 (0.0%) | 0 (0.0%) |
| Health Diagnosing & Treating | 2 (5.6%) | 34 (94.4%) |
| Health Technologists | 2 (6.5%) | 29 (93.5%) |
| Total (Category) | 17 (22.4%) | 59 (77.6%) |
| Total (Overall) | 107 (43.3%) | 140 (56.7%) |
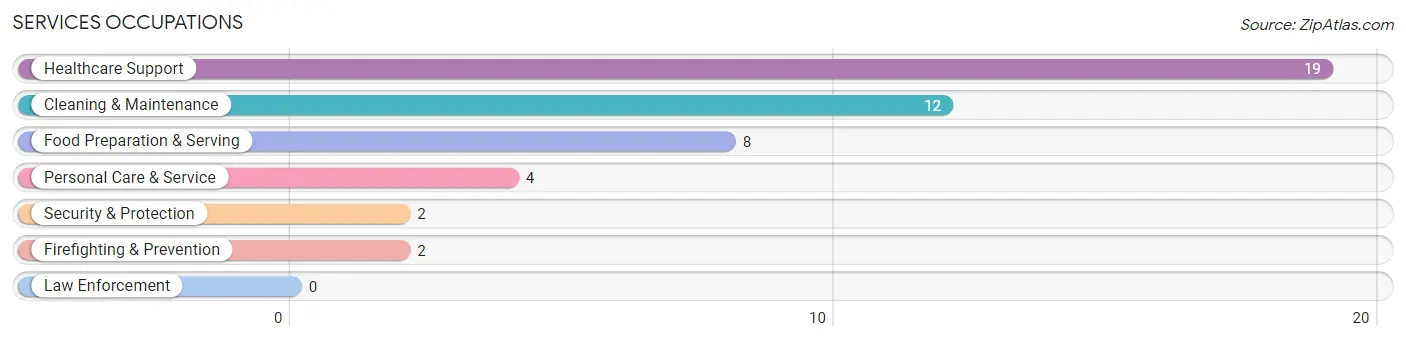
Services Occupations
The most common Services occupations in Linden are Healthcare Support (19 | 7.7%), Cleaning & Maintenance (12 | 4.9%), Food Preparation & Serving (8 | 3.2%), Personal Care & Service (4 | 1.6%), and Security & Protection (2 | 0.8%).
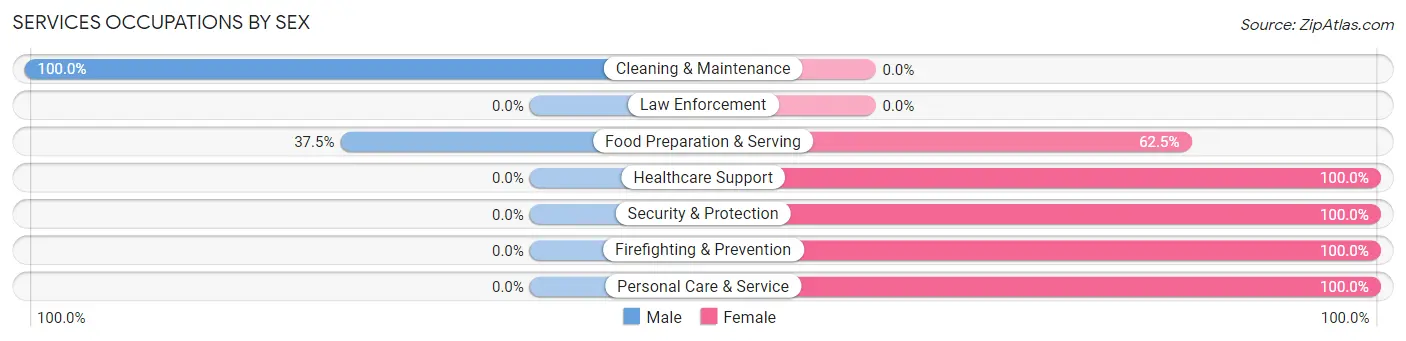
Services Occupations by Sex
Within the Services occupations in Linden, the most male-oriented occupations are Cleaning & Maintenance (100.0%), and Food Preparation & Serving (37.5%), while the most female-oriented occupations are Healthcare Support (100.0%), Security & Protection (100.0%), and Firefighting & Prevention (100.0%).
| Occupation | Male | Female |
| Healthcare Support | 0 (0.0%) | 19 (100.0%) |
| Security & Protection | 0 (0.0%) | 2 (100.0%) |
| Firefighting & Prevention | 0 (0.0%) | 2 (100.0%) |
| Law Enforcement | 0 (0.0%) | 0 (0.0%) |
| Food Preparation & Serving | 3 (37.5%) | 5 (62.5%) |
| Cleaning & Maintenance | 12 (100.0%) | 0 (0.0%) |
| Personal Care & Service | 0 (0.0%) | 4 (100.0%) |
| Total (Category) | 15 (33.3%) | 30 (66.7%) |
| Total (Overall) | 107 (43.3%) | 140 (56.7%) |
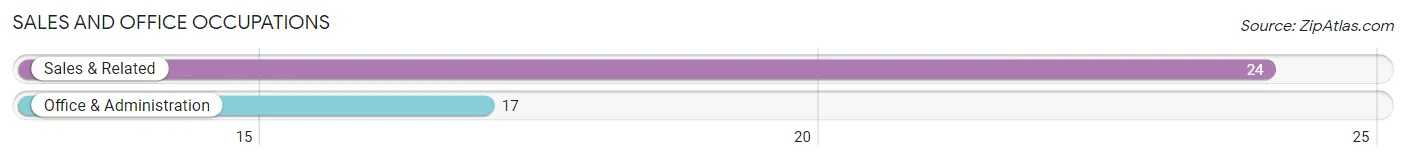
Sales and Office Occupations
The most common Sales and Office occupations in Linden are Sales & Related (24 | 9.7%), and Office & Administration (17 | 6.9%).
Sales and Office Occupations by Sex
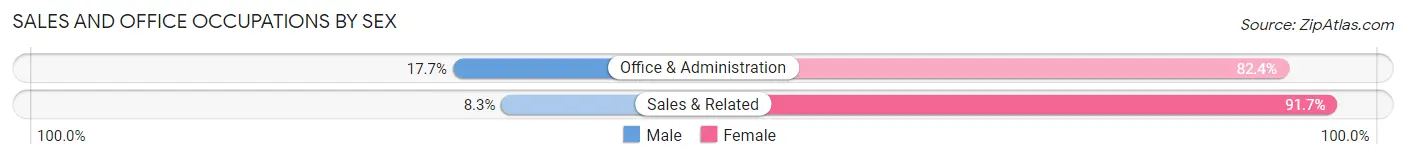
| Occupation | Male | Female |
| Sales & Related | 2 (8.3%) | 22 (91.7%) |
| Office & Administration | 3 (17.6%) | 14 (82.4%) |
| Total (Category) | 5 (12.2%) | 36 (87.8%) |
| Total (Overall) | 107 (43.3%) | 140 (56.7%) |
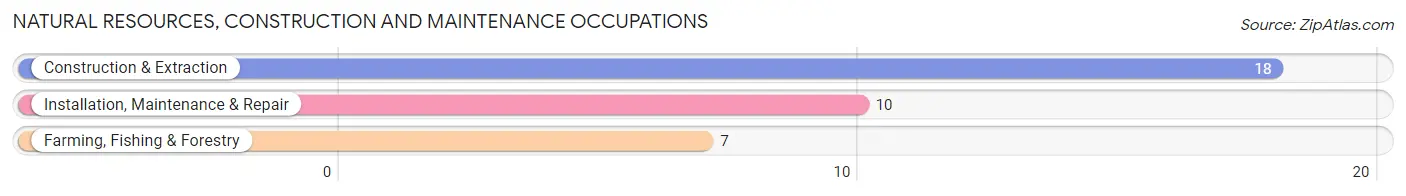
Natural Resources, Construction and Maintenance Occupations
The most common Natural Resources, Construction and Maintenance occupations in Linden are Construction & Extraction (18 | 7.3%), Installation, Maintenance & Repair (10 | 4.1%), and Farming, Fishing & Forestry (7 | 2.8%).
Natural Resources, Construction and Maintenance Occupations by Sex
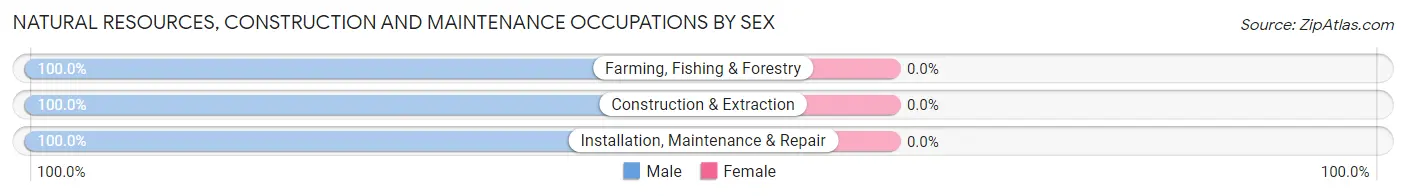
| Occupation | Male | Female |
| Farming, Fishing & Forestry | 7 (100.0%) | 0 (0.0%) |
| Construction & Extraction | 18 (100.0%) | 0 (0.0%) |
| Installation, Maintenance & Repair | 10 (100.0%) | 0 (0.0%) |
| Total (Category) | 35 (100.0%) | 0 (0.0%) |
| Total (Overall) | 107 (43.3%) | 140 (56.7%) |
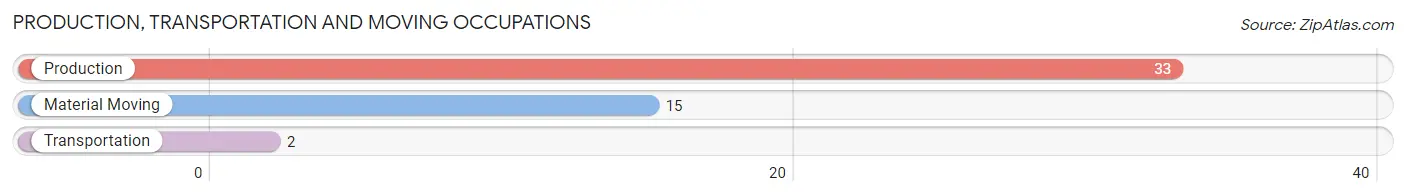
Production, Transportation and Moving Occupations
The most common Production, Transportation and Moving occupations in Linden are Production (33 | 13.4%), Material Moving (15 | 6.1%), and Transportation (2 | 0.8%).
Production, Transportation and Moving Occupations by Sex
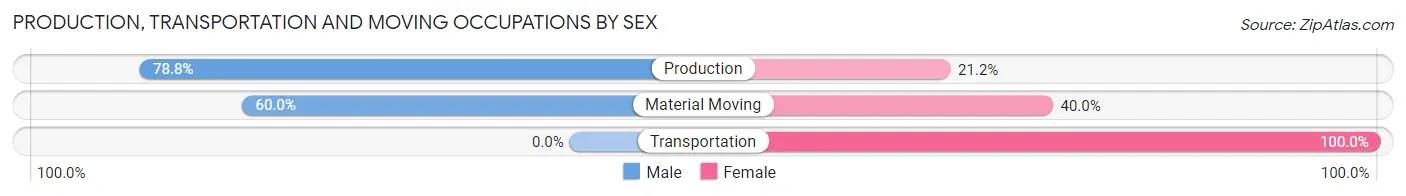
| Occupation | Male | Female |
| Production | 26 (78.8%) | 7 (21.2%) |
| Transportation | 0 (0.0%) | 2 (100.0%) |
| Material Moving | 9 (60.0%) | 6 (40.0%) |
| Total (Category) | 35 (70.0%) | 15 (30.0%) |
| Total (Overall) | 107 (43.3%) | 140 (56.7%) |
Employment Industries by Sex in Linden
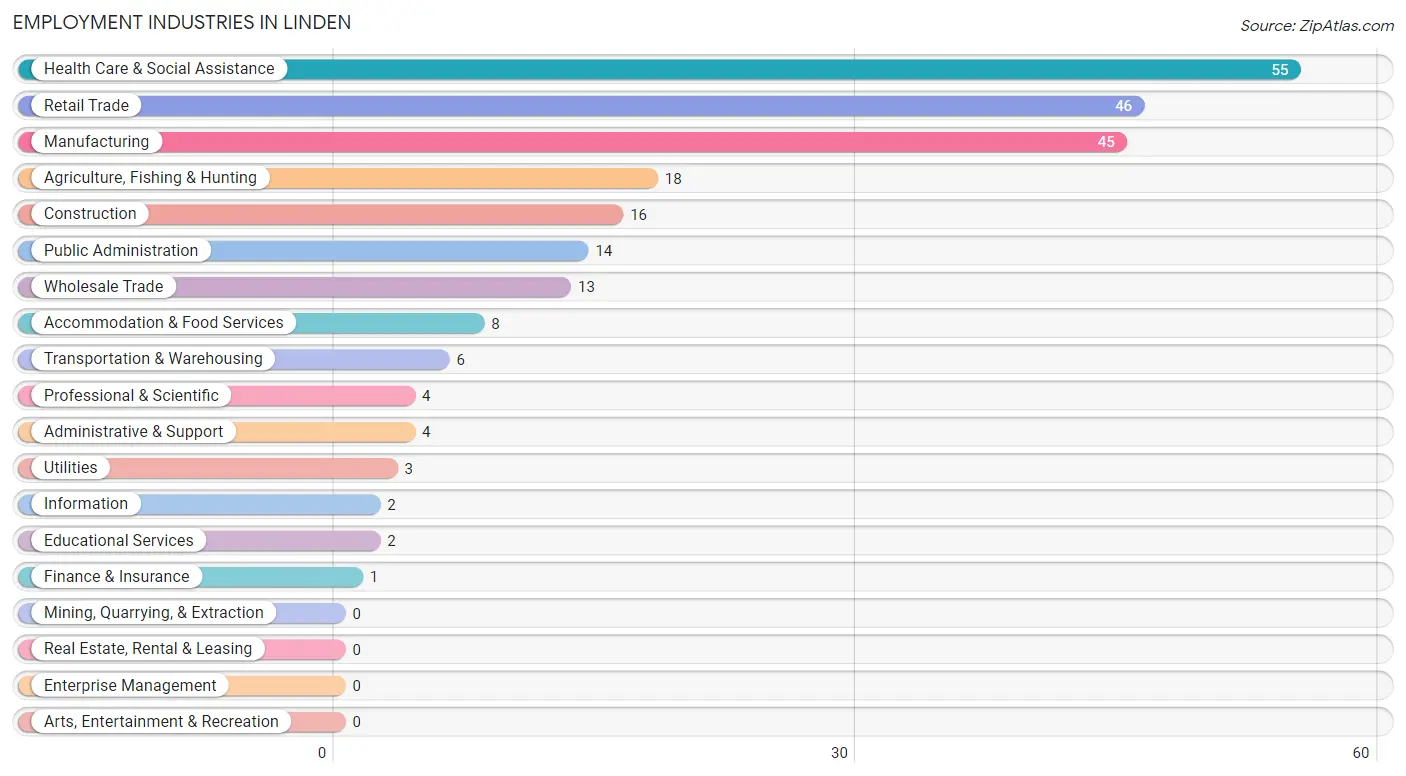
Employment Industries in Linden
The major employment industries in Linden include Health Care & Social Assistance (55 | 22.3%), Retail Trade (46 | 18.6%), Manufacturing (45 | 18.2%), Agriculture, Fishing & Hunting (18 | 7.3%), and Construction (16 | 6.5%).
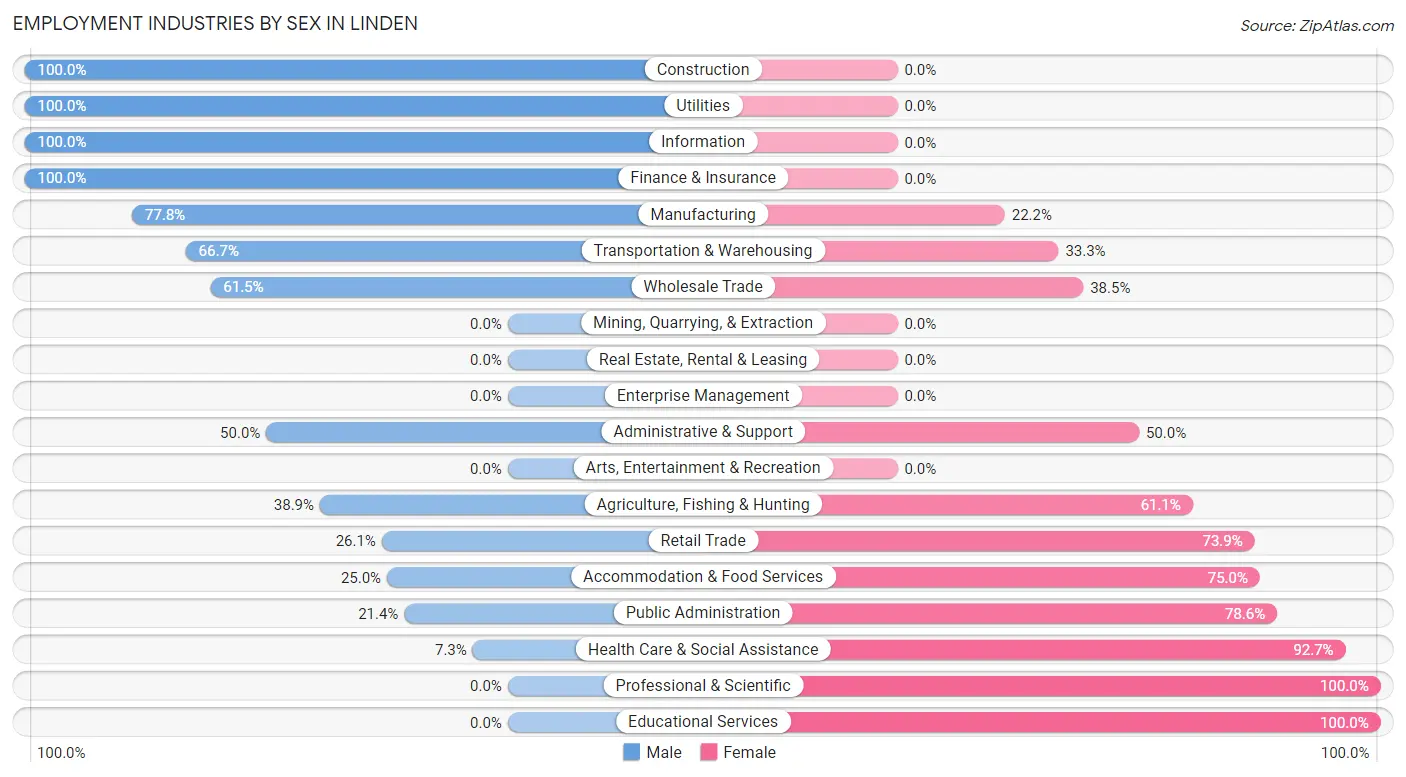
Employment Industries by Sex in Linden
The Linden industries that see more men than women are Construction (100.0%), Utilities (100.0%), and Information (100.0%), whereas the industries that tend to have a higher number of women are Professional & Scientific (100.0%), Educational Services (100.0%), and Health Care & Social Assistance (92.7%).
| Industry | Male | Female |
| Agriculture, Fishing & Hunting | 7 (38.9%) | 11 (61.1%) |
| Mining, Quarrying, & Extraction | 0 (0.0%) | 0 (0.0%) |
| Construction | 16 (100.0%) | 0 (0.0%) |
| Manufacturing | 35 (77.8%) | 10 (22.2%) |
| Wholesale Trade | 8 (61.5%) | 5 (38.5%) |
| Retail Trade | 12 (26.1%) | 34 (73.9%) |
| Transportation & Warehousing | 4 (66.7%) | 2 (33.3%) |
| Utilities | 3 (100.0%) | 0 (0.0%) |
| Information | 2 (100.0%) | 0 (0.0%) |
| Finance & Insurance | 1 (100.0%) | 0 (0.0%) |
| Real Estate, Rental & Leasing | 0 (0.0%) | 0 (0.0%) |
| Professional & Scientific | 0 (0.0%) | 4 (100.0%) |
| Enterprise Management | 0 (0.0%) | 0 (0.0%) |
| Administrative & Support | 2 (50.0%) | 2 (50.0%) |
| Educational Services | 0 (0.0%) | 2 (100.0%) |
| Health Care & Social Assistance | 4 (7.3%) | 51 (92.7%) |
| Arts, Entertainment & Recreation | 0 (0.0%) | 0 (0.0%) |
| Accommodation & Food Services | 2 (25.0%) | 6 (75.0%) |
| Public Administration | 3 (21.4%) | 11 (78.6%) |
| Total | 107 (43.3%) | 140 (56.7%) |
Education in Linden
School Enrollment in Linden
The most common levels of schooling among the 117 students in Linden are elementary school (27 | 23.1%), nursery / preschool (25 | 21.4%), and high school (22 | 18.8%).
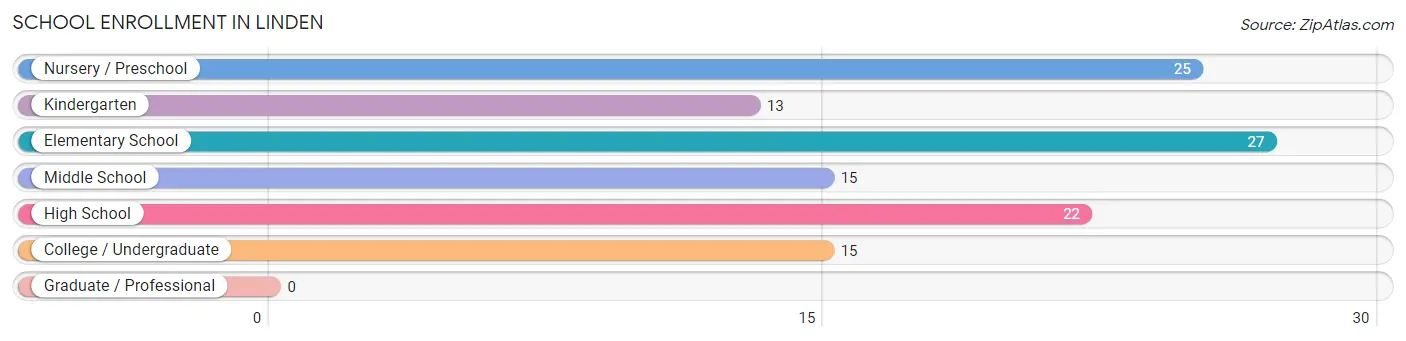
| School Level | # Students | % Students |
| Nursery / Preschool | 25 | 21.4% |
| Kindergarten | 13 | 11.1% |
| Elementary School | 27 | 23.1% |
| Middle School | 15 | 12.8% |
| High School | 22 | 18.8% |
| College / Undergraduate | 15 | 12.8% |
| Graduate / Professional | 0 | 0.0% |
| Total | 117 | 100.0% |
School Enrollment by Age by Funding Source in Linden
Out of a total of 117 students who are enrolled in schools in Linden, 9 (7.7%) attend a private institution, while the remaining 108 (92.3%) are enrolled in public schools. The age group of 5 to 9 year old has the highest likelihood of being enrolled in private schools, with 7 (11.5% in the age bracket) enrolled. Conversely, the age group of 15 to 17 year olds has the lowest likelihood of being enrolled in a private school, with 14 (100.0% in the age bracket) attending a public institution.
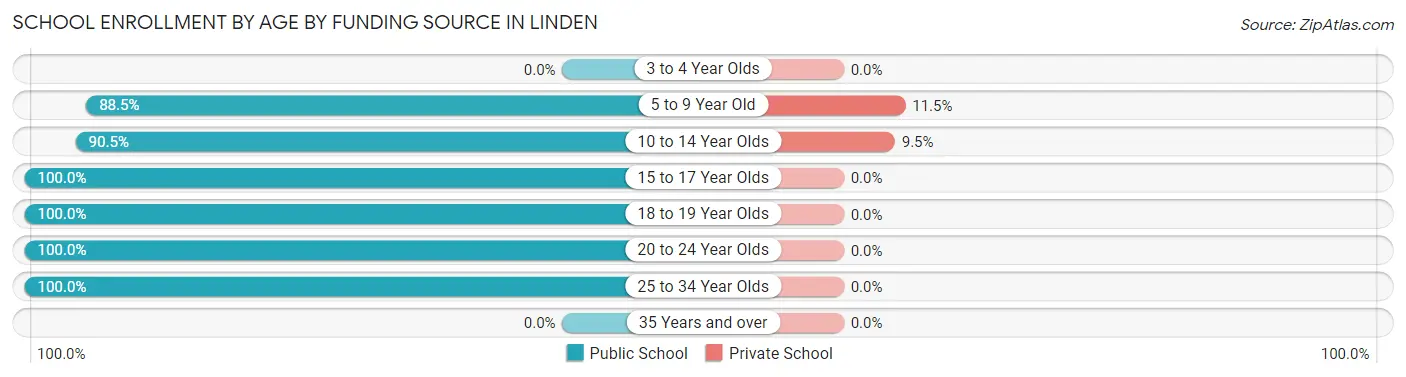
| Age Bracket | Public School | Private School |
| 3 to 4 Year Olds | 0 (0.0%) | 0 (0.0%) |
| 5 to 9 Year Old | 54 (88.5%) | 7 (11.5%) |
| 10 to 14 Year Olds | 19 (90.5%) | 2 (9.5%) |
| 15 to 17 Year Olds | 14 (100.0%) | 0 (0.0%) |
| 18 to 19 Year Olds | 3 (100.0%) | 0 (0.0%) |
| 20 to 24 Year Olds | 14 (100.0%) | 0 (0.0%) |
| 25 to 34 Year Olds | 4 (100.0%) | 0 (0.0%) |
| 35 Years and over | 0 (0.0%) | 0 (0.0%) |
| Total | 108 (92.3%) | 9 (7.7%) |
Educational Attainment by Field of Study in Linden
Bio, nature & agricultural (12 | 36.4%), science & technology (7 | 21.2%), education (5 | 15.1%), physical & health sciences (3 | 9.1%), and engineering (2 | 6.1%) are the most common fields of study among 33 individuals in Linden who have obtained a bachelor's degree or higher.
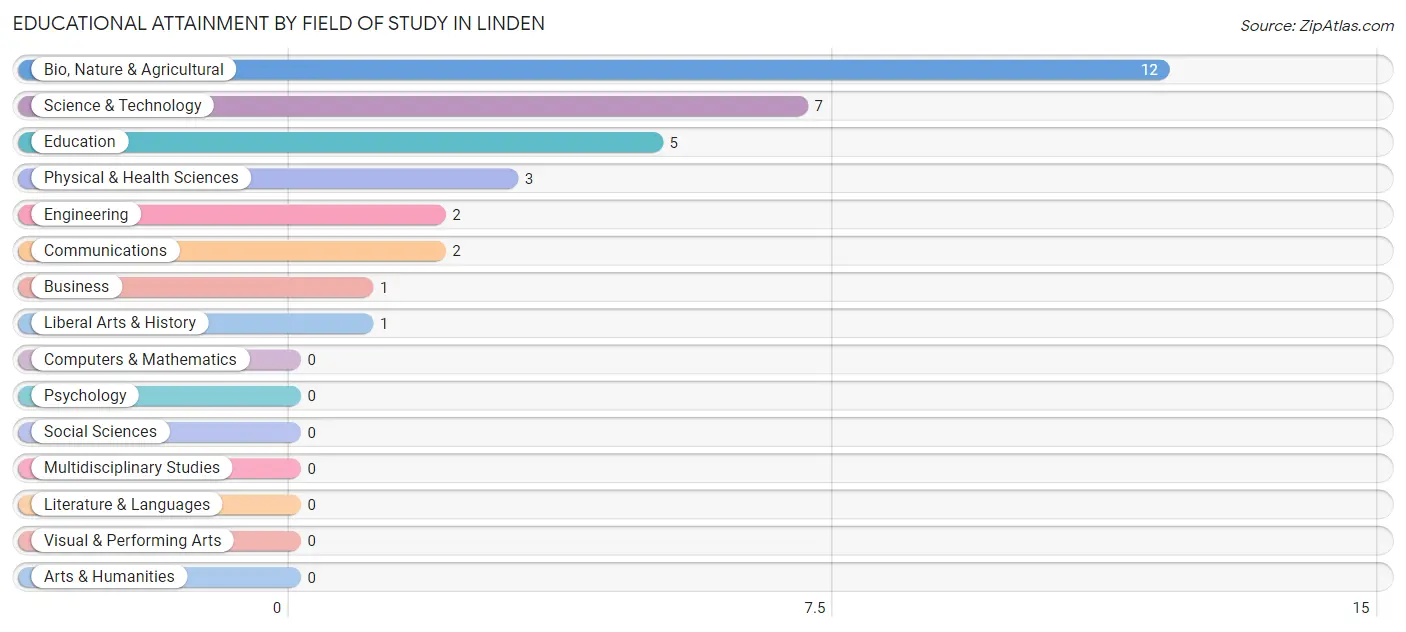
| Field of Study | # Graduates | % Graduates |
| Computers & Mathematics | 0 | 0.0% |
| Bio, Nature & Agricultural | 12 | 36.4% |
| Physical & Health Sciences | 3 | 9.1% |
| Psychology | 0 | 0.0% |
| Social Sciences | 0 | 0.0% |
| Engineering | 2 | 6.1% |
| Multidisciplinary Studies | 0 | 0.0% |
| Science & Technology | 7 | 21.2% |
| Business | 1 | 3.0% |
| Education | 5 | 15.1% |
| Literature & Languages | 0 | 0.0% |
| Liberal Arts & History | 1 | 3.0% |
| Visual & Performing Arts | 0 | 0.0% |
| Communications | 2 | 6.1% |
| Arts & Humanities | 0 | 0.0% |
| Total | 33 | 100.0% |
Transportation & Commute in Linden
Vehicle Availability by Sex in Linden
The most prevalent vehicle ownership categories in Linden are males with 2 vehicles (56, accounting for 52.3%) and females with 2 vehicles (38, making up 40.6%).
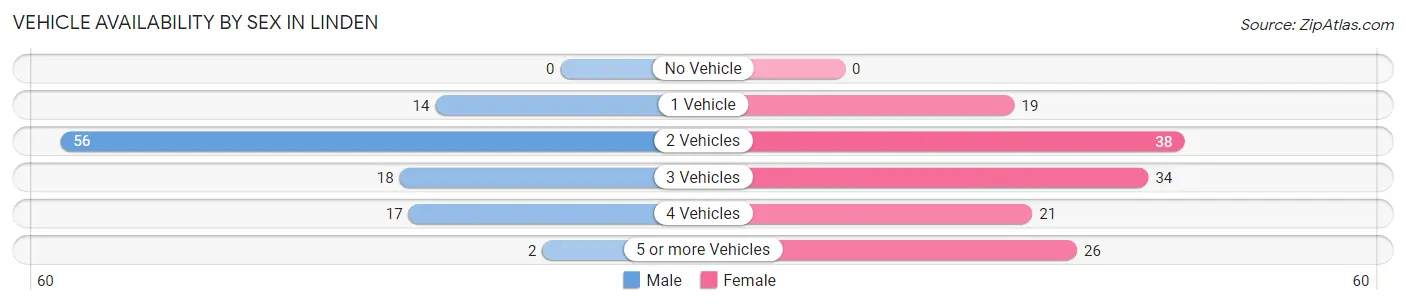
| Vehicles Available | Male | Female |
| No Vehicle | 0 (0.0%) | 0 (0.0%) |
| 1 Vehicle | 14 (13.1%) | 19 (13.8%) |
| 2 Vehicles | 56 (52.3%) | 38 (27.5%) |
| 3 Vehicles | 18 (16.8%) | 34 (24.6%) |
| 4 Vehicles | 17 (15.9%) | 21 (15.2%) |
| 5 or more Vehicles | 2 (1.9%) | 26 (18.8%) |
| Total | 107 (100.0%) | 138 (100.0%) |
Commute Time in Linden
The most frequently occuring commute durations in Linden are 15 to 19 minutes (56 commuters, 23.8%), 10 to 14 minutes (41 commuters, 17.4%), and 30 to 34 minutes (35 commuters, 14.9%).
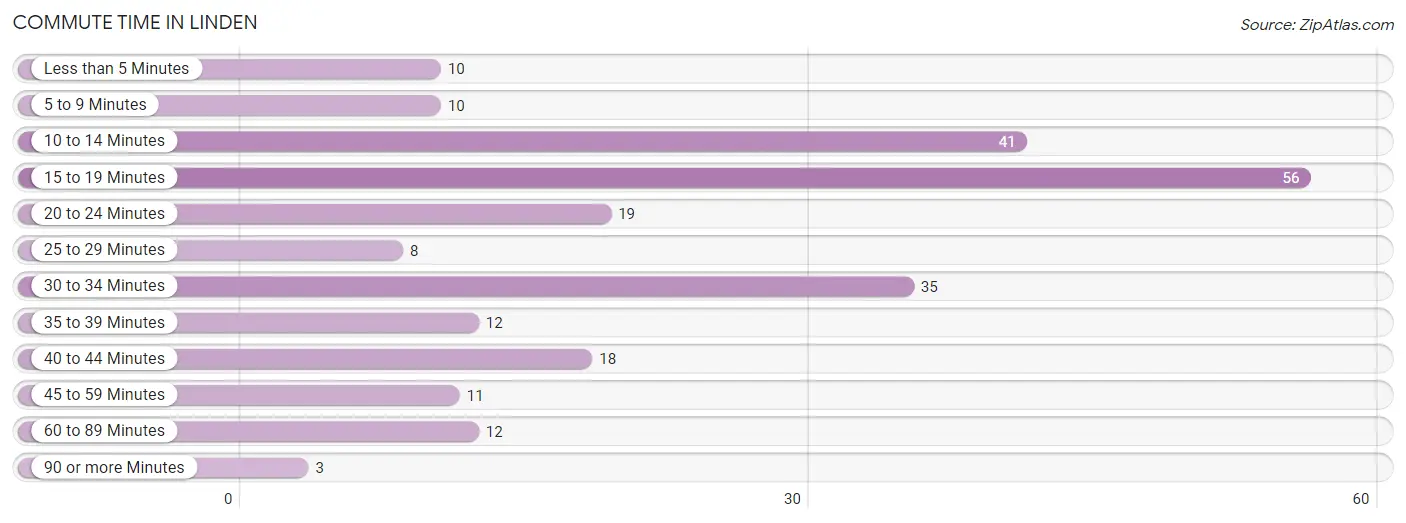
| Commute Time | # Commuters | % Commuters |
| Less than 5 Minutes | 10 | 4.3% |
| 5 to 9 Minutes | 10 | 4.3% |
| 10 to 14 Minutes | 41 | 17.4% |
| 15 to 19 Minutes | 56 | 23.8% |
| 20 to 24 Minutes | 19 | 8.1% |
| 25 to 29 Minutes | 8 | 3.4% |
| 30 to 34 Minutes | 35 | 14.9% |
| 35 to 39 Minutes | 12 | 5.1% |
| 40 to 44 Minutes | 18 | 7.7% |
| 45 to 59 Minutes | 11 | 4.7% |
| 60 to 89 Minutes | 12 | 5.1% |
| 90 or more Minutes | 3 | 1.3% |
Commute Time by Sex in Linden
The most common commute times in Linden are 10 to 14 minutes (31 commuters, 29.8%) for males and 15 to 19 minutes (36 commuters, 27.5%) for females.
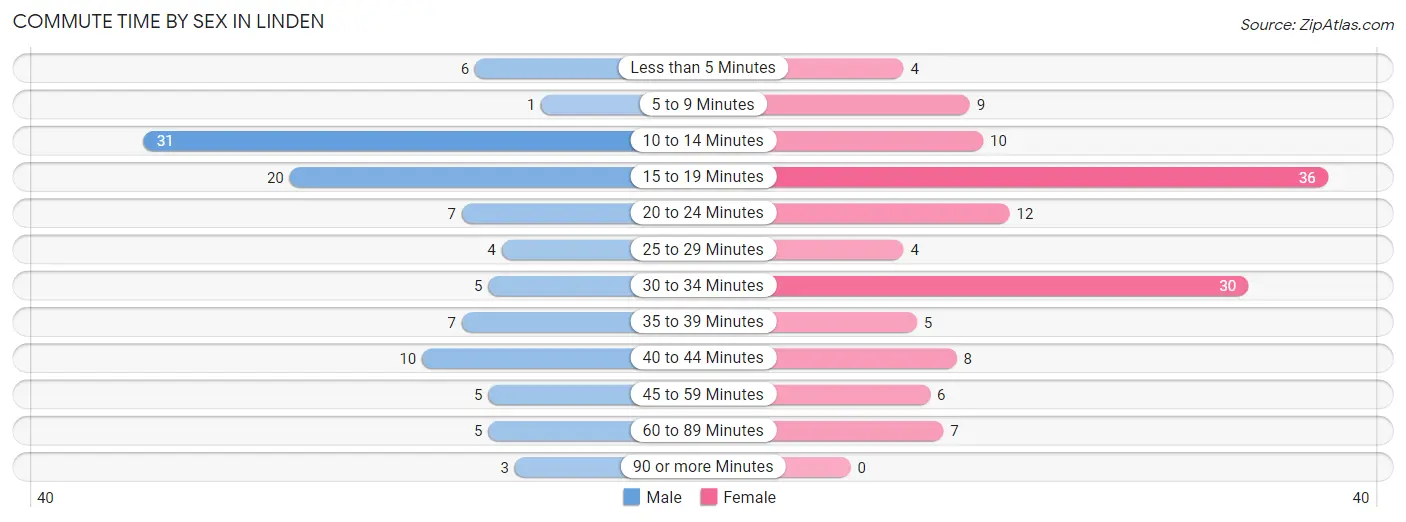
| Commute Time | Male | Female |
| Less than 5 Minutes | 6 (5.8%) | 4 (3.0%) |
| 5 to 9 Minutes | 1 (1.0%) | 9 (6.9%) |
| 10 to 14 Minutes | 31 (29.8%) | 10 (7.6%) |
| 15 to 19 Minutes | 20 (19.2%) | 36 (27.5%) |
| 20 to 24 Minutes | 7 (6.7%) | 12 (9.2%) |
| 25 to 29 Minutes | 4 (3.8%) | 4 (3.0%) |
| 30 to 34 Minutes | 5 (4.8%) | 30 (22.9%) |
| 35 to 39 Minutes | 7 (6.7%) | 5 (3.8%) |
| 40 to 44 Minutes | 10 (9.6%) | 8 (6.1%) |
| 45 to 59 Minutes | 5 (4.8%) | 6 (4.6%) |
| 60 to 89 Minutes | 5 (4.8%) | 7 (5.3%) |
| 90 or more Minutes | 3 (2.9%) | 0 (0.0%) |
Time of Departure to Work by Sex in Linden
The most frequent times of departure to work in Linden are 6:30 AM to 6:59 AM (25, 24.0%) for males and 4:00 PM to 11:59 PM (30, 22.9%) for females.
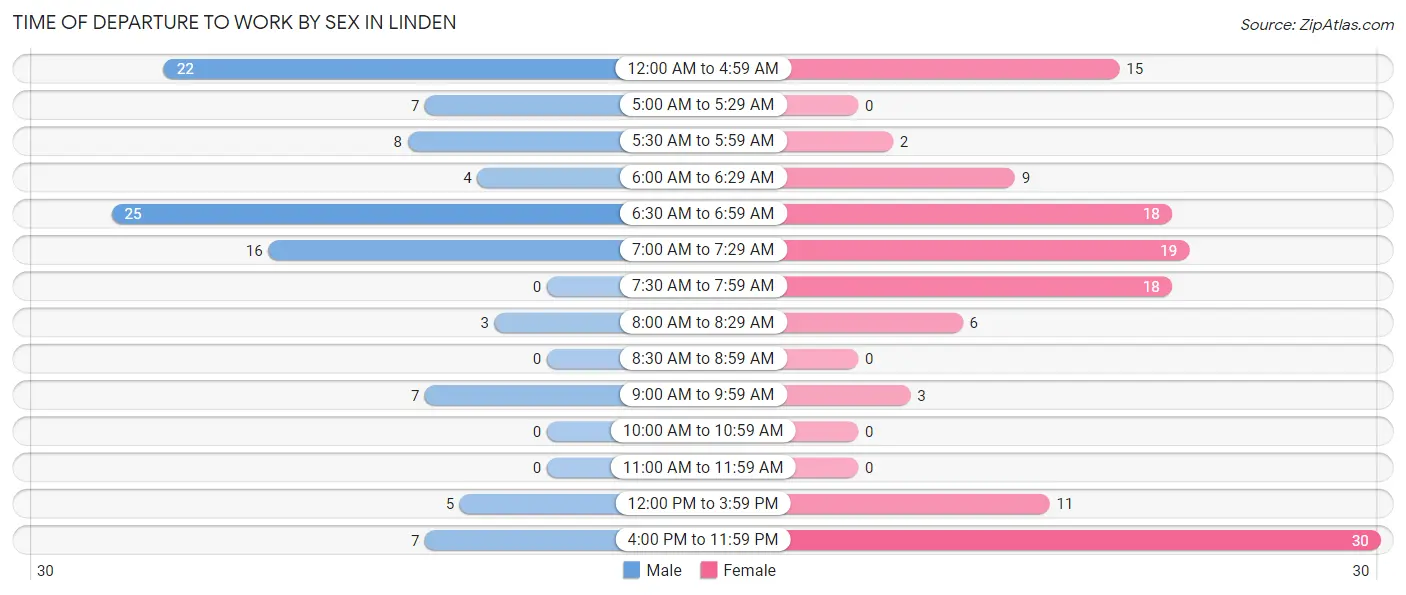
| Time of Departure | Male | Female |
| 12:00 AM to 4:59 AM | 22 (21.1%) | 15 (11.5%) |
| 5:00 AM to 5:29 AM | 7 (6.7%) | 0 (0.0%) |
| 5:30 AM to 5:59 AM | 8 (7.7%) | 2 (1.5%) |
| 6:00 AM to 6:29 AM | 4 (3.8%) | 9 (6.9%) |
| 6:30 AM to 6:59 AM | 25 (24.0%) | 18 (13.7%) |
| 7:00 AM to 7:29 AM | 16 (15.4%) | 19 (14.5%) |
| 7:30 AM to 7:59 AM | 0 (0.0%) | 18 (13.7%) |
| 8:00 AM to 8:29 AM | 3 (2.9%) | 6 (4.6%) |
| 8:30 AM to 8:59 AM | 0 (0.0%) | 0 (0.0%) |
| 9:00 AM to 9:59 AM | 7 (6.7%) | 3 (2.3%) |
| 10:00 AM to 10:59 AM | 0 (0.0%) | 0 (0.0%) |
| 11:00 AM to 11:59 AM | 0 (0.0%) | 0 (0.0%) |
| 12:00 PM to 3:59 PM | 5 (4.8%) | 11 (8.4%) |
| 4:00 PM to 11:59 PM | 7 (6.7%) | 30 (22.9%) |
| Total | 104 (100.0%) | 131 (100.0%) |
Housing Occupancy in Linden
Occupancy by Ownership in Linden
Of the total 241 dwellings in Linden, owner-occupied units account for 205 (85.1%), while renter-occupied units make up 36 (14.9%).
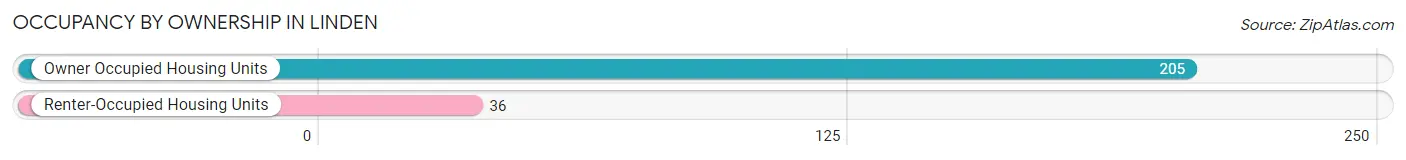
| Occupancy | # Housing Units | % Housing Units |
| Owner Occupied Housing Units | 205 | 85.1% |
| Renter-Occupied Housing Units | 36 | 14.9% |
| Total Occupied Housing Units | 241 | 100.0% |
Occupancy by Household Size in Linden
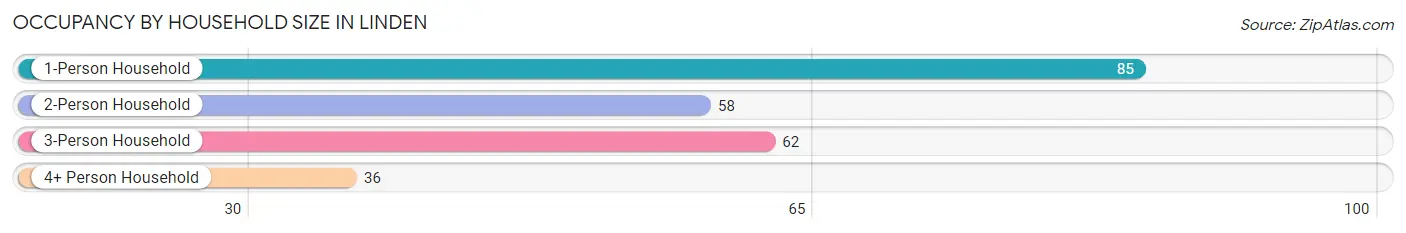
| Household Size | # Housing Units | % Housing Units |
| 1-Person Household | 85 | 35.3% |
| 2-Person Household | 58 | 24.1% |
| 3-Person Household | 62 | 25.7% |
| 4+ Person Household | 36 | 14.9% |
| Total Housing Units | 241 | 100.0% |
Occupancy by Ownership by Household Size in Linden
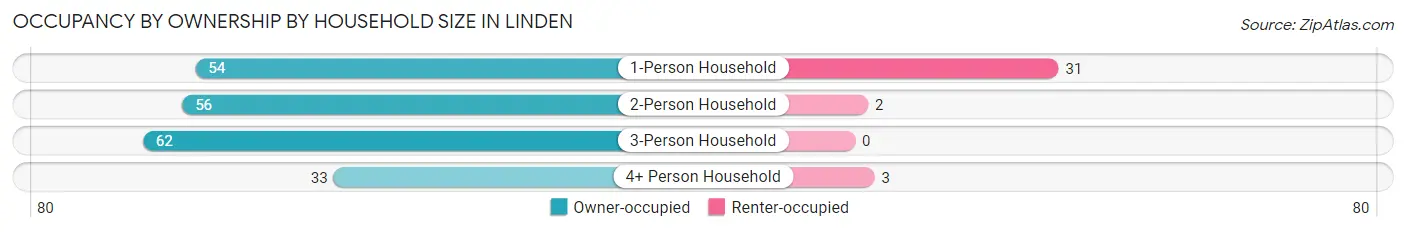
| Household Size | Owner-occupied | Renter-occupied |
| 1-Person Household | 54 (63.5%) | 31 (36.5%) |
| 2-Person Household | 56 (96.6%) | 2 (3.5%) |
| 3-Person Household | 62 (100.0%) | 0 (0.0%) |
| 4+ Person Household | 33 (91.7%) | 3 (8.3%) |
| Total Housing Units | 205 (85.1%) | 36 (14.9%) |
Occupancy by Educational Attainment in Linden
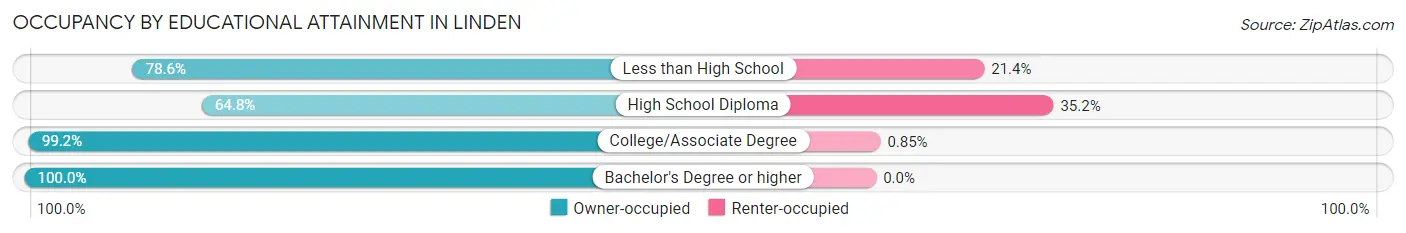
| Household Size | Owner-occupied | Renter-occupied |
| Less than High School | 11 (78.6%) | 3 (21.4%) |
| High School Diploma | 59 (64.8%) | 32 (35.2%) |
| College/Associate Degree | 116 (99.2%) | 1 (0.9%) |
| Bachelor's Degree or higher | 19 (100.0%) | 0 (0.0%) |
Occupancy by Age of Householder in Linden
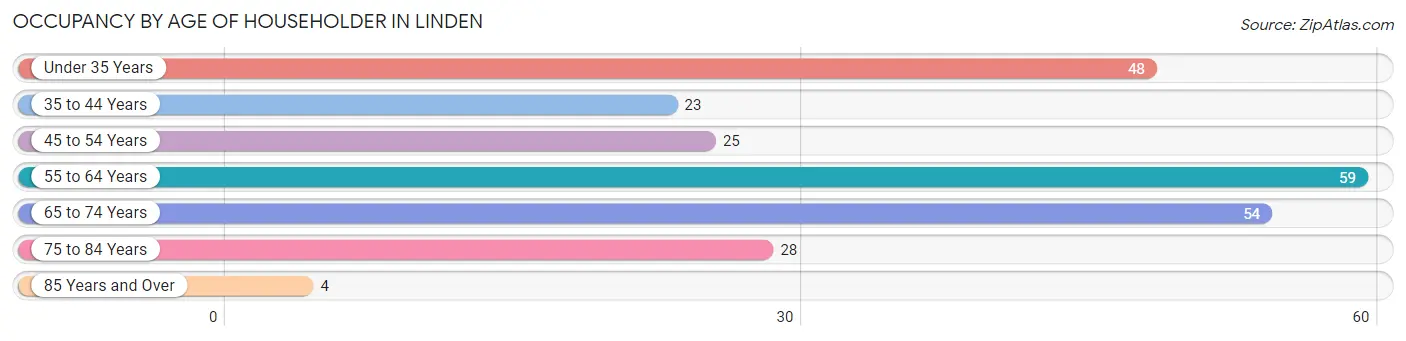
| Age Bracket | # Households | % Households |
| Under 35 Years | 48 | 19.9% |
| 35 to 44 Years | 23 | 9.5% |
| 45 to 54 Years | 25 | 10.4% |
| 55 to 64 Years | 59 | 24.5% |
| 65 to 74 Years | 54 | 22.4% |
| 75 to 84 Years | 28 | 11.6% |
| 85 Years and Over | 4 | 1.7% |
| Total | 241 | 100.0% |
Housing Finances in Linden
Median Income by Occupancy in Linden
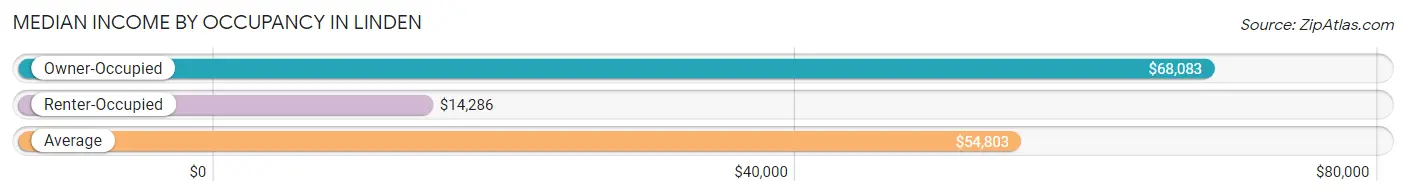
| Occupancy Type | # Households | Median Income |
| Owner-Occupied | 205 (85.1%) | $68,083 |
| Renter-Occupied | 36 (14.9%) | $14,286 |
| Average | 241 (100.0%) | $54,803 |
Occupancy by Householder Income Bracket in Linden
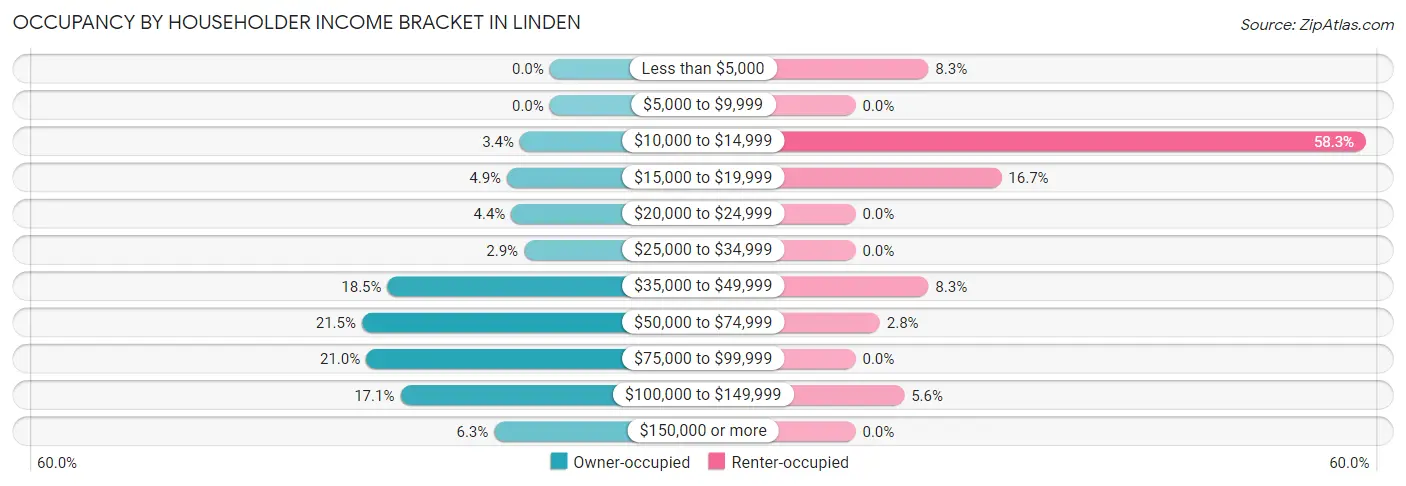
| Income Bracket | Owner-occupied | Renter-occupied |
| Less than $5,000 | 0 (0.0%) | 3 (8.3%) |
| $5,000 to $9,999 | 0 (0.0%) | 0 (0.0%) |
| $10,000 to $14,999 | 7 (3.4%) | 21 (58.3%) |
| $15,000 to $19,999 | 10 (4.9%) | 6 (16.7%) |
| $20,000 to $24,999 | 9 (4.4%) | 0 (0.0%) |
| $25,000 to $34,999 | 6 (2.9%) | 0 (0.0%) |
| $35,000 to $49,999 | 38 (18.5%) | 3 (8.3%) |
| $50,000 to $74,999 | 44 (21.5%) | 1 (2.8%) |
| $75,000 to $99,999 | 43 (21.0%) | 0 (0.0%) |
| $100,000 to $149,999 | 35 (17.1%) | 2 (5.6%) |
| $150,000 or more | 13 (6.3%) | 0 (0.0%) |
| Total | 205 (100.0%) | 36 (100.0%) |
Monthly Housing Cost Tiers in Linden
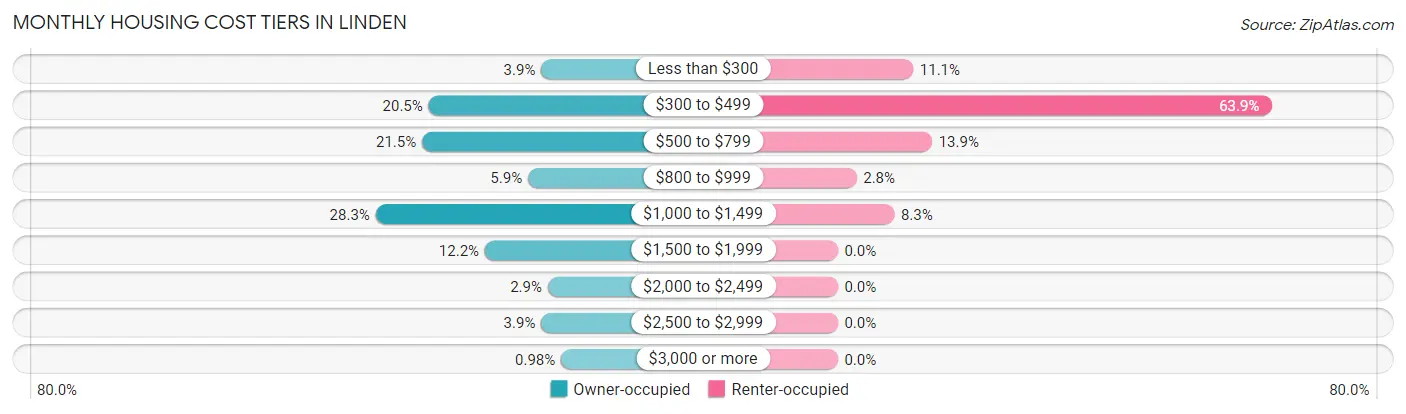
| Monthly Cost | Owner-occupied | Renter-occupied |
| Less than $300 | 8 (3.9%) | 4 (11.1%) |
| $300 to $499 | 42 (20.5%) | 23 (63.9%) |
| $500 to $799 | 44 (21.5%) | 5 (13.9%) |
| $800 to $999 | 12 (5.9%) | 1 (2.8%) |
| $1,000 to $1,499 | 58 (28.3%) | 3 (8.3%) |
| $1,500 to $1,999 | 25 (12.2%) | 0 (0.0%) |
| $2,000 to $2,499 | 6 (2.9%) | 0 (0.0%) |
| $2,500 to $2,999 | 8 (3.9%) | 0 (0.0%) |
| $3,000 or more | 2 (1.0%) | 0 (0.0%) |
| Total | 205 (100.0%) | 36 (100.0%) |
Physical Housing Characteristics in Linden
Housing Structures in Linden
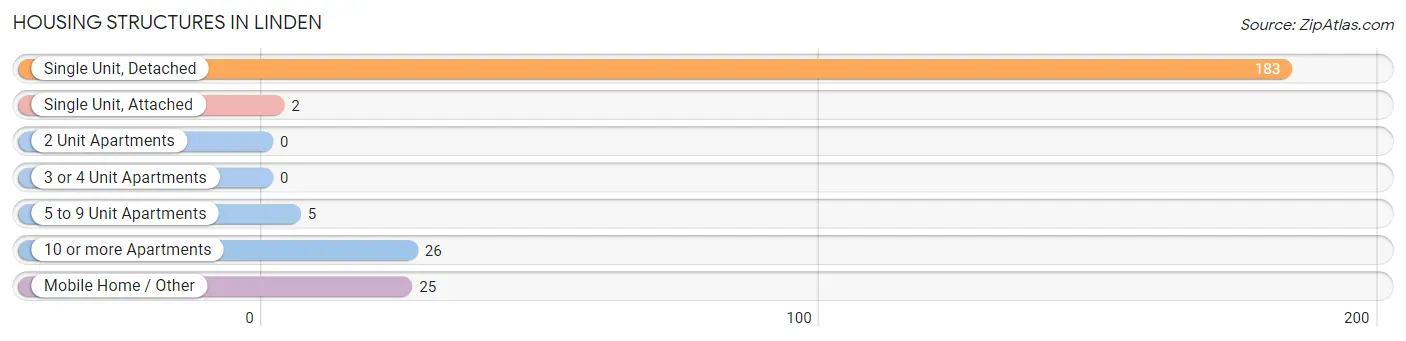
| Structure Type | # Housing Units | % Housing Units |
| Single Unit, Detached | 183 | 75.9% |
| Single Unit, Attached | 2 | 0.8% |
| 2 Unit Apartments | 0 | 0.0% |
| 3 or 4 Unit Apartments | 0 | 0.0% |
| 5 to 9 Unit Apartments | 5 | 2.1% |
| 10 or more Apartments | 26 | 10.8% |
| Mobile Home / Other | 25 | 10.4% |
| Total | 241 | 100.0% |
Housing Structures by Occupancy in Linden
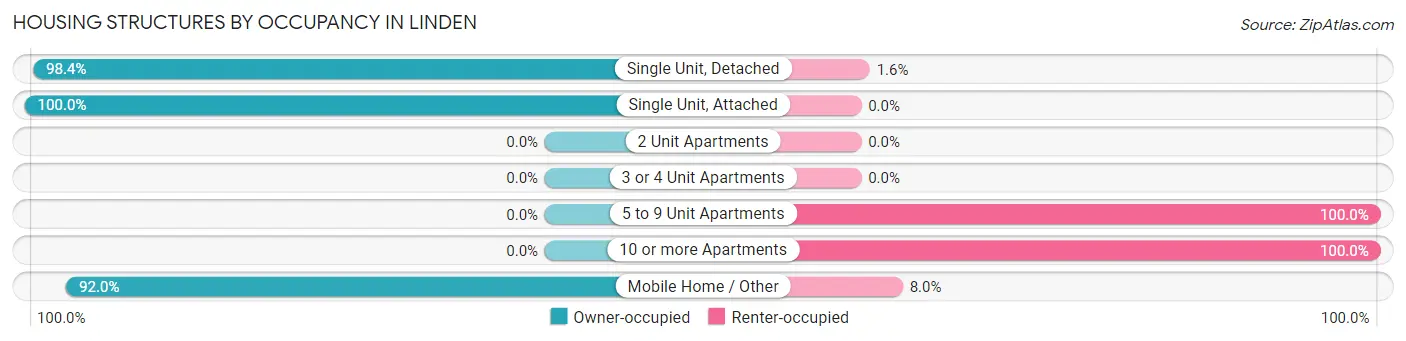
| Structure Type | Owner-occupied | Renter-occupied |
| Single Unit, Detached | 180 (98.4%) | 3 (1.6%) |
| Single Unit, Attached | 2 (100.0%) | 0 (0.0%) |
| 2 Unit Apartments | 0 (0.0%) | 0 (0.0%) |
| 3 or 4 Unit Apartments | 0 (0.0%) | 0 (0.0%) |
| 5 to 9 Unit Apartments | 0 (0.0%) | 5 (100.0%) |
| 10 or more Apartments | 0 (0.0%) | 26 (100.0%) |
| Mobile Home / Other | 23 (92.0%) | 2 (8.0%) |
| Total | 205 (85.1%) | 36 (14.9%) |
Housing Structures by Number of Rooms in Linden
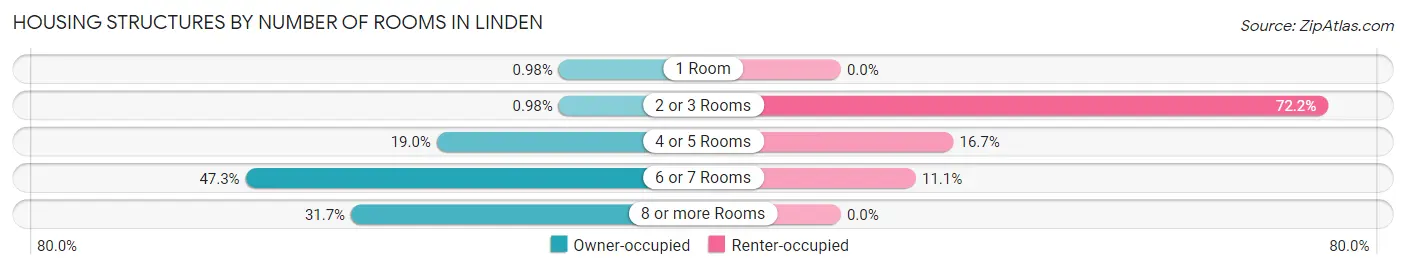
| Number of Rooms | Owner-occupied | Renter-occupied |
| 1 Room | 2 (1.0%) | 0 (0.0%) |
| 2 or 3 Rooms | 2 (1.0%) | 26 (72.2%) |
| 4 or 5 Rooms | 39 (19.0%) | 6 (16.7%) |
| 6 or 7 Rooms | 97 (47.3%) | 4 (11.1%) |
| 8 or more Rooms | 65 (31.7%) | 0 (0.0%) |
| Total | 205 (100.0%) | 36 (100.0%) |
Housing Structure by Heating Type in Linden
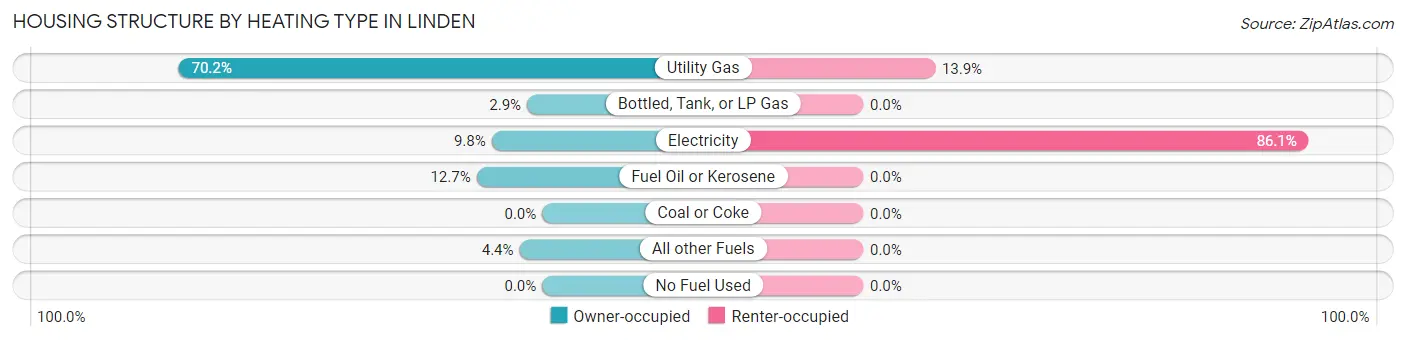
| Heating Type | Owner-occupied | Renter-occupied |
| Utility Gas | 144 (70.2%) | 5 (13.9%) |
| Bottled, Tank, or LP Gas | 6 (2.9%) | 0 (0.0%) |
| Electricity | 20 (9.8%) | 31 (86.1%) |
| Fuel Oil or Kerosene | 26 (12.7%) | 0 (0.0%) |
| Coal or Coke | 0 (0.0%) | 0 (0.0%) |
| All other Fuels | 9 (4.4%) | 0 (0.0%) |
| No Fuel Used | 0 (0.0%) | 0 (0.0%) |
| Total | 205 (100.0%) | 36 (100.0%) |
Household Vehicle Usage in Linden
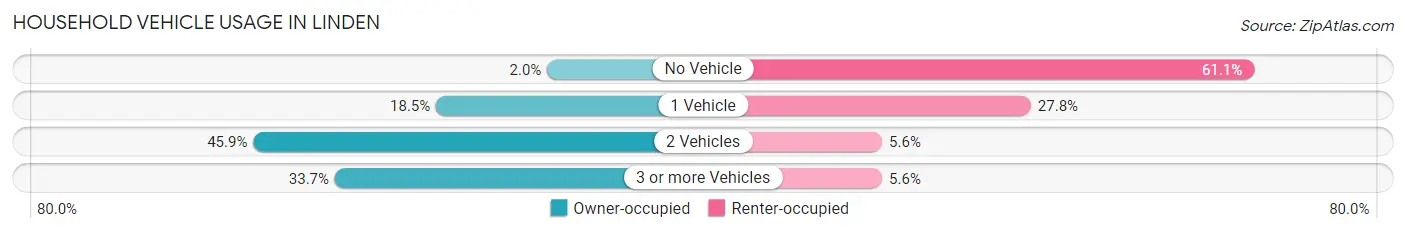
| Vehicles per Household | Owner-occupied | Renter-occupied |
| No Vehicle | 4 (1.9%) | 22 (61.1%) |
| 1 Vehicle | 38 (18.5%) | 10 (27.8%) |
| 2 Vehicles | 94 (45.9%) | 2 (5.6%) |
| 3 or more Vehicles | 69 (33.7%) | 2 (5.6%) |
| Total | 205 (100.0%) | 36 (100.0%) |
Real Estate & Mortgages in Linden
Real Estate and Mortgage Overview in Linden
| Characteristic | Without Mortgage | With Mortgage |
| Housing Units | 96 | 109 |
| Median Property Value | $140,700 | $158,100 |
| Median Household Income | - | - |
| Monthly Housing Costs | $494 | $2 |
| Real Estate Taxes | $1,911 | $2 |
Property Value by Mortgage Status in Linden
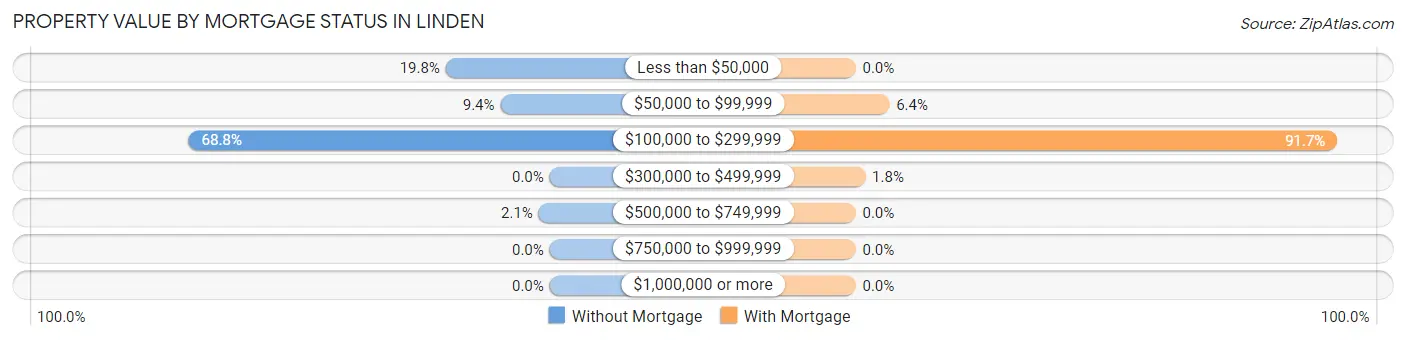
| Property Value | Without Mortgage | With Mortgage |
| Less than $50,000 | 19 (19.8%) | 0 (0.0%) |
| $50,000 to $99,999 | 9 (9.4%) | 7 (6.4%) |
| $100,000 to $299,999 | 66 (68.8%) | 100 (91.7%) |
| $300,000 to $499,999 | 0 (0.0%) | 2 (1.8%) |
| $500,000 to $749,999 | 2 (2.1%) | 0 (0.0%) |
| $750,000 to $999,999 | 0 (0.0%) | 0 (0.0%) |
| $1,000,000 or more | 0 (0.0%) | 0 (0.0%) |
| Total | 96 (100.0%) | 109 (100.0%) |
Household Income by Mortgage Status in Linden
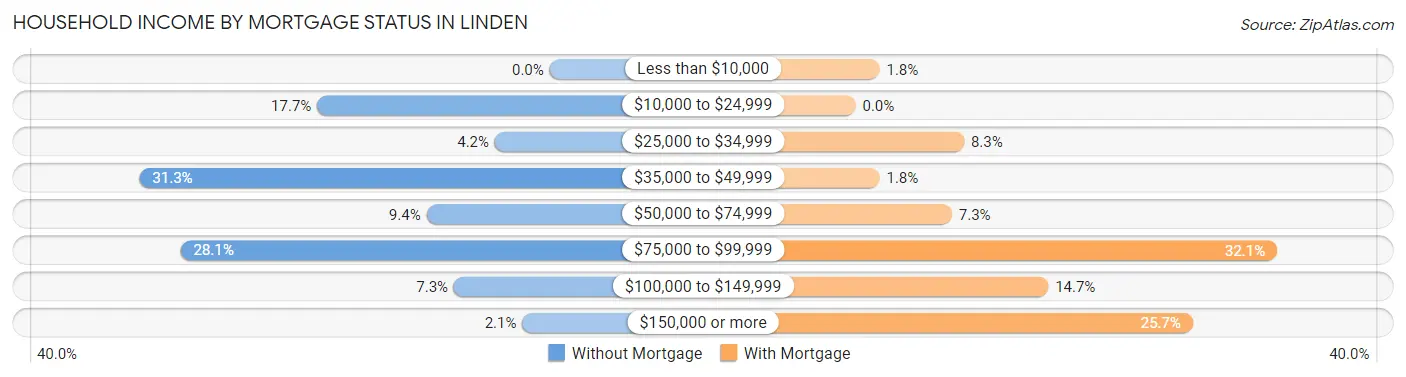
| Household Income | Without Mortgage | With Mortgage |
| Less than $10,000 | 0 (0.0%) | 2 (1.8%) |
| $10,000 to $24,999 | 17 (17.7%) | 0 (0.0%) |
| $25,000 to $34,999 | 4 (4.2%) | 9 (8.3%) |
| $35,000 to $49,999 | 30 (31.2%) | 2 (1.8%) |
| $50,000 to $74,999 | 9 (9.4%) | 8 (7.3%) |
| $75,000 to $99,999 | 27 (28.1%) | 35 (32.1%) |
| $100,000 to $149,999 | 7 (7.3%) | 16 (14.7%) |
| $150,000 or more | 2 (2.1%) | 28 (25.7%) |
| Total | 96 (100.0%) | 109 (100.0%) |
Property Value to Household Income Ratio in Linden
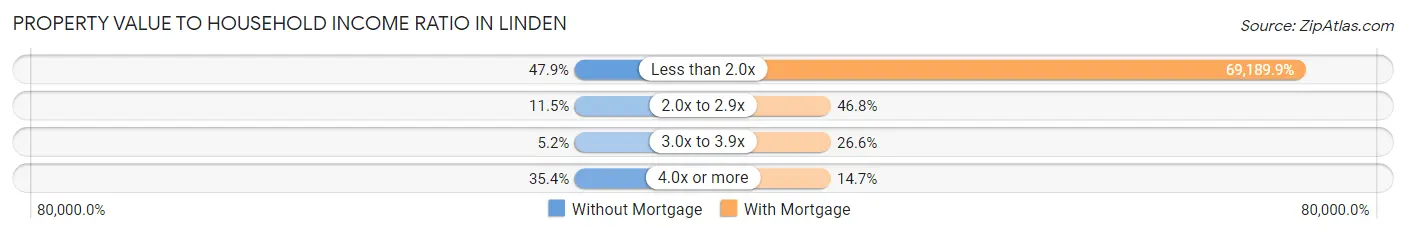
| Value-to-Income Ratio | Without Mortgage | With Mortgage |
| Less than 2.0x | 46 (47.9%) | 75,417 (69,189.9%) |
| 2.0x to 2.9x | 11 (11.5%) | 51 (46.8%) |
| 3.0x to 3.9x | 5 (5.2%) | 29 (26.6%) |
| 4.0x or more | 34 (35.4%) | 16 (14.7%) |
| Total | 96 (100.0%) | 109 (100.0%) |
Real Estate Taxes by Mortgage Status in Linden
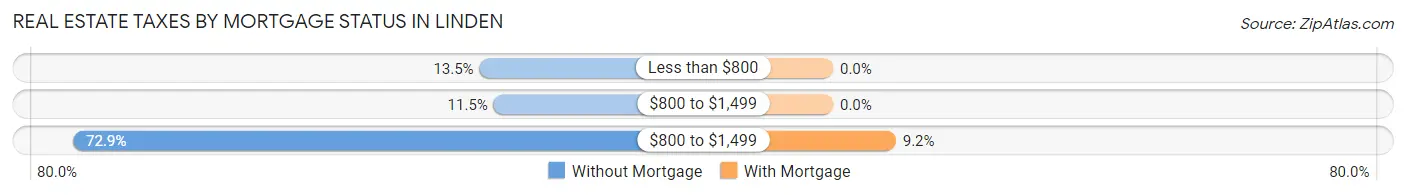
| Property Taxes | Without Mortgage | With Mortgage |
| Less than $800 | 13 (13.5%) | 0 (0.0%) |
| $800 to $1,499 | 11 (11.5%) | 0 (0.0%) |
| $800 to $1,499 | 70 (72.9%) | 10 (9.2%) |
| Total | 96 (100.0%) | 109 (100.0%) |
Health & Disability in Linden
Health Insurance Coverage by Age in Linden
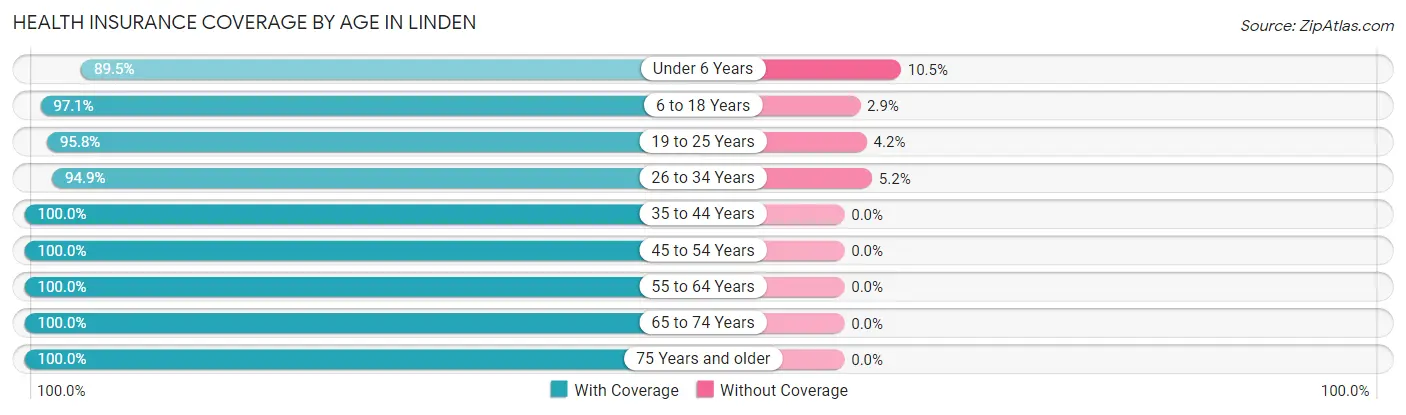
| Age Bracket | With Coverage | Without Coverage |
| Under 6 Years | 68 (89.5%) | 8 (10.5%) |
| 6 to 18 Years | 66 (97.1%) | 2 (2.9%) |
| 19 to 25 Years | 46 (95.8%) | 2 (4.2%) |
| 26 to 34 Years | 92 (94.9%) | 5 (5.1%) |
| 35 to 44 Years | 49 (100.0%) | 0 (0.0%) |
| 45 to 54 Years | 46 (100.0%) | 0 (0.0%) |
| 55 to 64 Years | 74 (100.0%) | 0 (0.0%) |
| 65 to 74 Years | 61 (100.0%) | 0 (0.0%) |
| 75 Years and older | 38 (100.0%) | 0 (0.0%) |
| Total | 540 (97.0%) | 17 (3.0%) |
Health Insurance Coverage by Citizenship Status in Linden
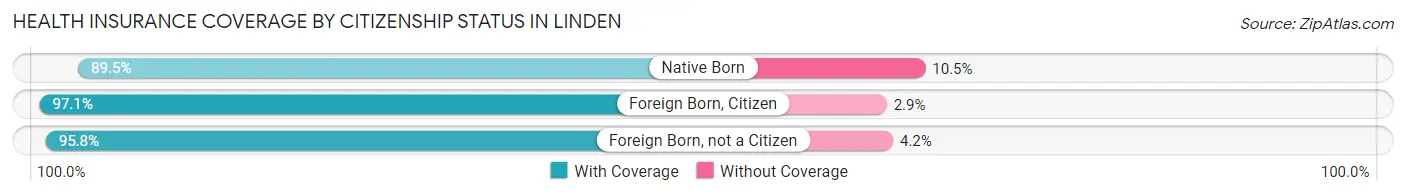
| Citizenship Status | With Coverage | Without Coverage |
| Native Born | 68 (89.5%) | 8 (10.5%) |
| Foreign Born, Citizen | 66 (97.1%) | 2 (2.9%) |
| Foreign Born, not a Citizen | 46 (95.8%) | 2 (4.2%) |
Health Insurance Coverage by Household Income in Linden
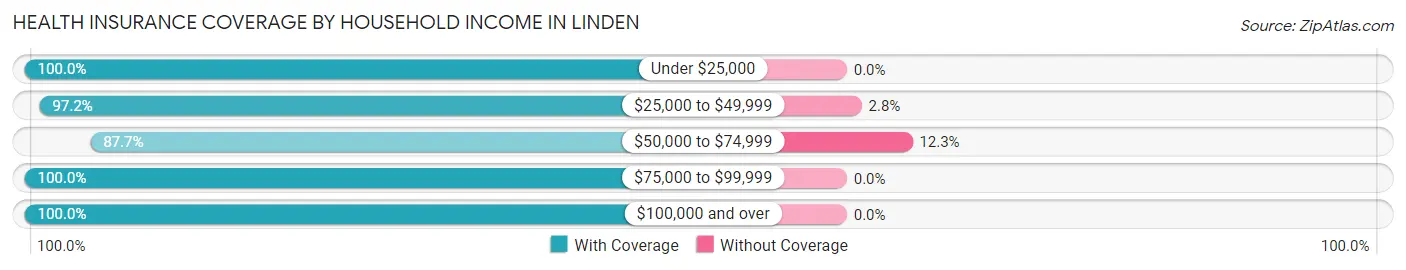
| Household Income | With Coverage | Without Coverage |
| Under $25,000 | 59 (100.0%) | 0 (0.0%) |
| $25,000 to $49,999 | 70 (97.2%) | 2 (2.8%) |
| $50,000 to $74,999 | 107 (87.7%) | 15 (12.3%) |
| $75,000 to $99,999 | 126 (100.0%) | 0 (0.0%) |
| $100,000 and over | 178 (100.0%) | 0 (0.0%) |
Public vs Private Health Insurance Coverage by Age in Linden
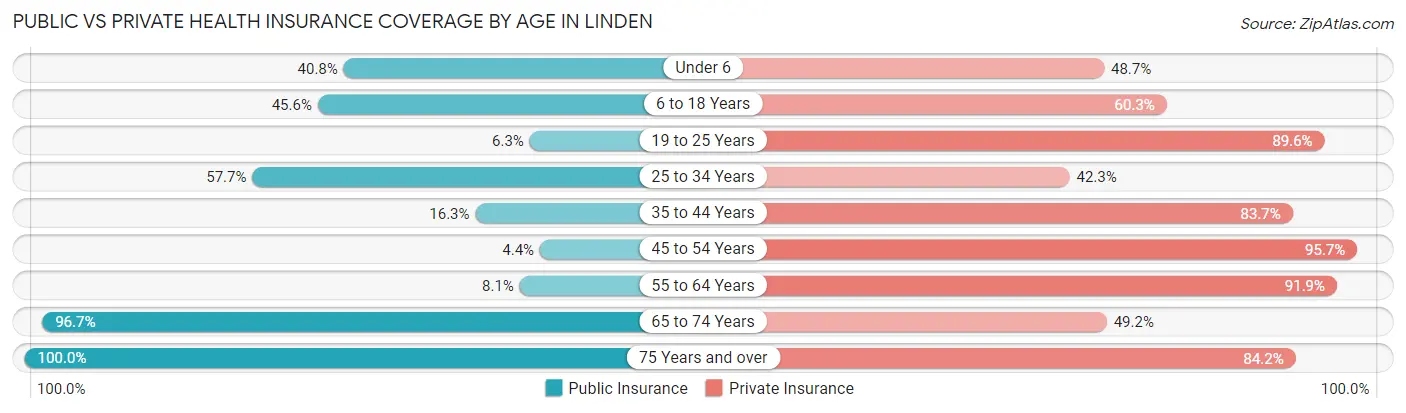
| Age Bracket | Public Insurance | Private Insurance |
| Under 6 | 31 (40.8%) | 37 (48.7%) |
| 6 to 18 Years | 31 (45.6%) | 41 (60.3%) |
| 19 to 25 Years | 3 (6.2%) | 43 (89.6%) |
| 25 to 34 Years | 56 (57.7%) | 41 (42.3%) |
| 35 to 44 Years | 8 (16.3%) | 41 (83.7%) |
| 45 to 54 Years | 2 (4.3%) | 44 (95.7%) |
| 55 to 64 Years | 6 (8.1%) | 68 (91.9%) |
| 65 to 74 Years | 59 (96.7%) | 30 (49.2%) |
| 75 Years and over | 38 (100.0%) | 32 (84.2%) |
| Total | 234 (42.0%) | 377 (67.7%) |
Disability Status by Sex by Age in Linden
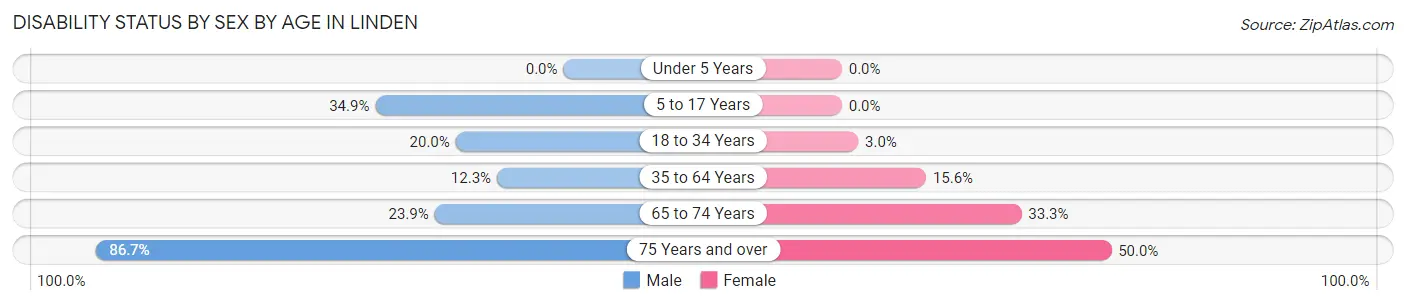
| Age Bracket | Male | Female |
| Under 5 Years | 0 (0.0%) | 0 (0.0%) |
| 5 to 17 Years | 22 (34.9%) | 0 (0.0%) |
| 18 to 34 Years | 10 (20.0%) | 3 (3.0%) |
| 35 to 64 Years | 9 (12.3%) | 15 (15.6%) |
| 65 to 74 Years | 11 (23.9%) | 5 (33.3%) |
| 75 Years and over | 26 (86.7%) | 4 (50.0%) |
Disability Class by Sex by Age in Linden
Disability Class: Hearing Difficulty
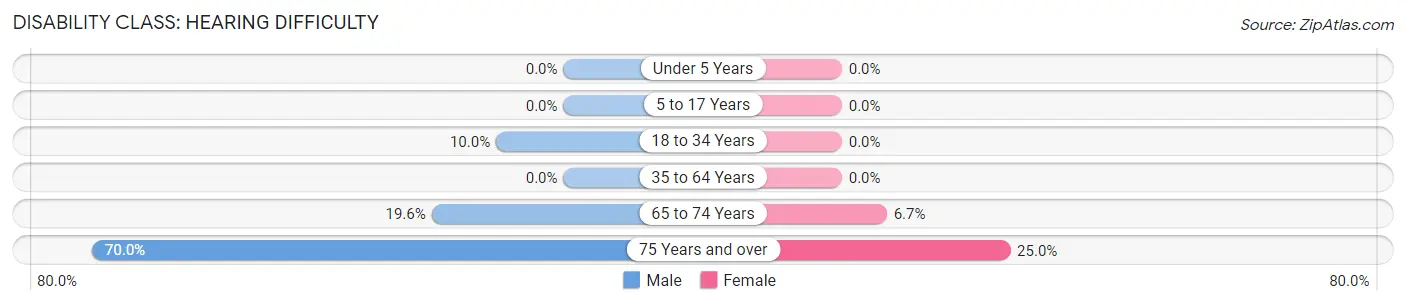
| Age Bracket | Male | Female |
| Under 5 Years | 0 (0.0%) | 0 (0.0%) |
| 5 to 17 Years | 0 (0.0%) | 0 (0.0%) |
| 18 to 34 Years | 5 (10.0%) | 0 (0.0%) |
| 35 to 64 Years | 0 (0.0%) | 0 (0.0%) |
| 65 to 74 Years | 9 (19.6%) | 1 (6.7%) |
| 75 Years and over | 21 (70.0%) | 2 (25.0%) |
Disability Class: Vision Difficulty
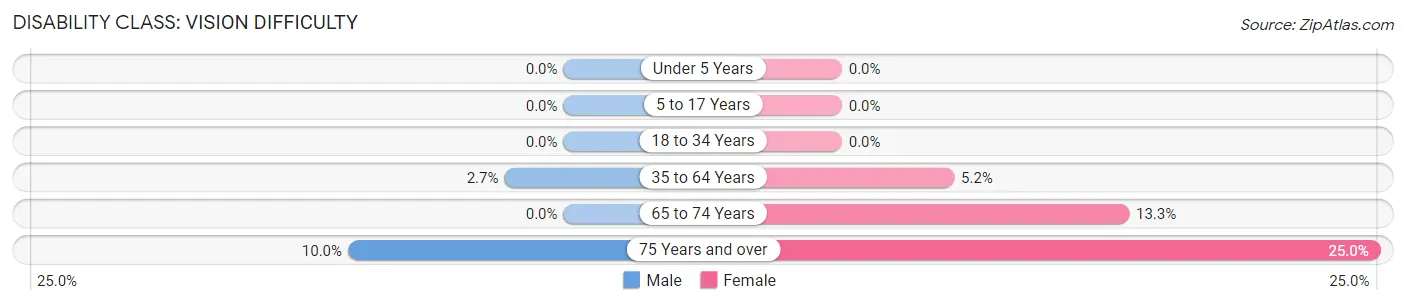
| Age Bracket | Male | Female |
| Under 5 Years | 0 (0.0%) | 0 (0.0%) |
| 5 to 17 Years | 0 (0.0%) | 0 (0.0%) |
| 18 to 34 Years | 0 (0.0%) | 0 (0.0%) |
| 35 to 64 Years | 2 (2.7%) | 5 (5.2%) |
| 65 to 74 Years | 0 (0.0%) | 2 (13.3%) |
| 75 Years and over | 3 (10.0%) | 2 (25.0%) |
Disability Class: Cognitive Difficulty
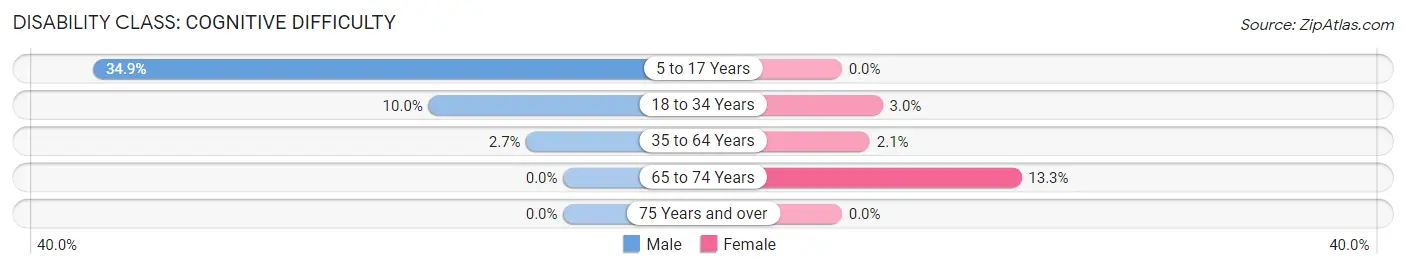
| Age Bracket | Male | Female |
| 5 to 17 Years | 22 (34.9%) | 0 (0.0%) |
| 18 to 34 Years | 5 (10.0%) | 3 (3.0%) |
| 35 to 64 Years | 2 (2.7%) | 2 (2.1%) |
| 65 to 74 Years | 0 (0.0%) | 2 (13.3%) |
| 75 Years and over | 0 (0.0%) | 0 (0.0%) |
Disability Class: Ambulatory Difficulty
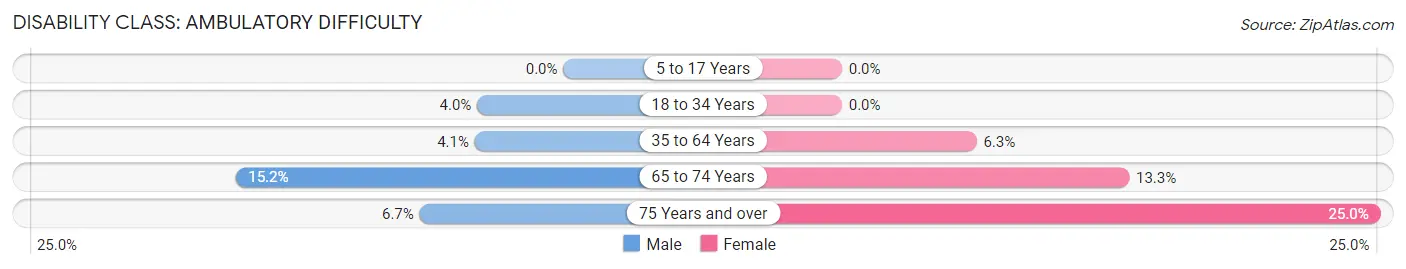
| Age Bracket | Male | Female |
| 5 to 17 Years | 0 (0.0%) | 0 (0.0%) |
| 18 to 34 Years | 2 (4.0%) | 0 (0.0%) |
| 35 to 64 Years | 3 (4.1%) | 6 (6.2%) |
| 65 to 74 Years | 7 (15.2%) | 2 (13.3%) |
| 75 Years and over | 2 (6.7%) | 2 (25.0%) |
Disability Class: Self-Care Difficulty
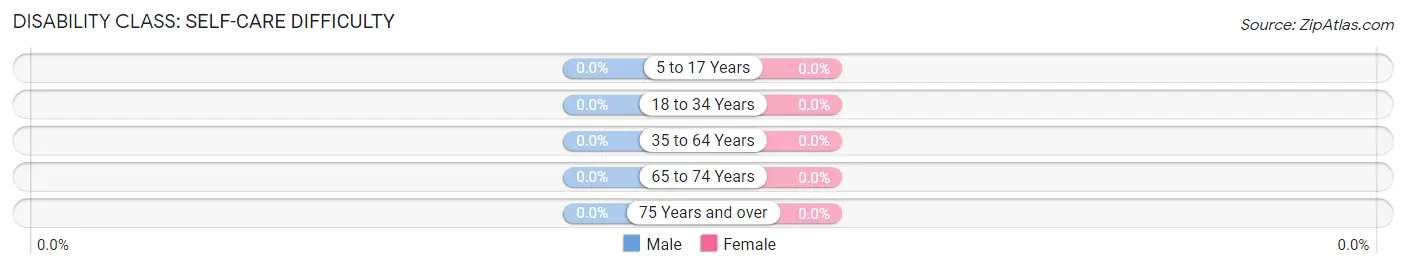
| Age Bracket | Male | Female |
| 5 to 17 Years | 0 (0.0%) | 0 (0.0%) |
| 18 to 34 Years | 0 (0.0%) | 0 (0.0%) |
| 35 to 64 Years | 0 (0.0%) | 0 (0.0%) |
| 65 to 74 Years | 0 (0.0%) | 0 (0.0%) |
| 75 Years and over | 0 (0.0%) | 0 (0.0%) |
Technology Access in Linden
Computing Device Access in Linden
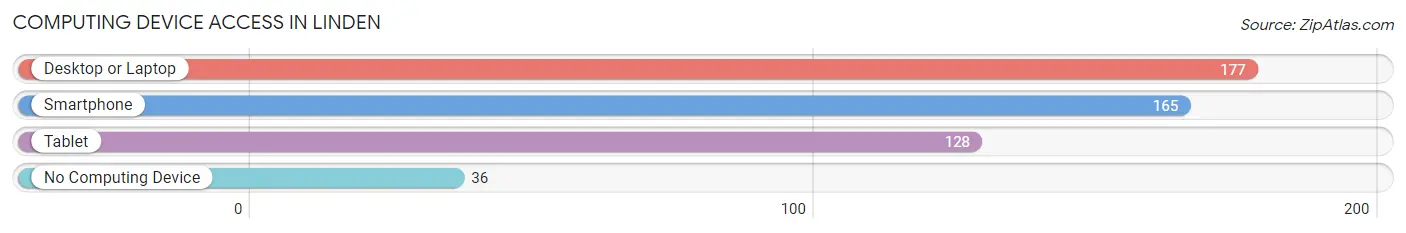
| Device Type | # Households | % Households |
| Desktop or Laptop | 177 | 73.4% |
| Smartphone | 165 | 68.5% |
| Tablet | 128 | 53.1% |
| No Computing Device | 36 | 14.9% |
| Total | 241 | 100.0% |
Internet Access in Linden
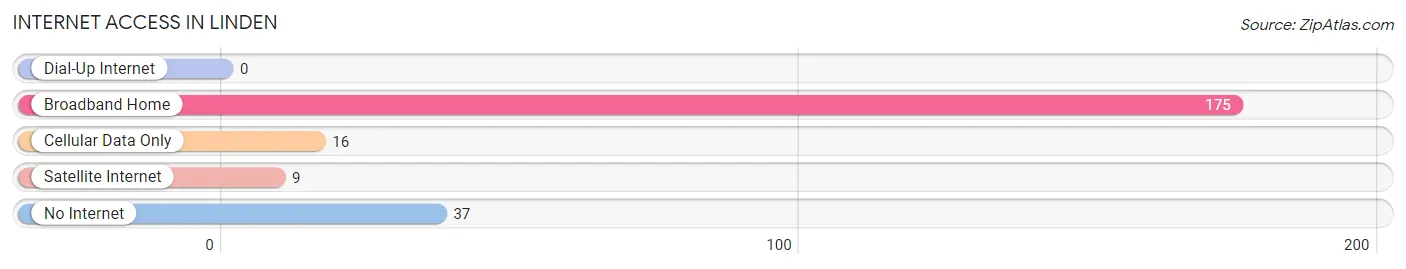
| Internet Type | # Households | % Households |
| Dial-Up Internet | 0 | 0.0% |
| Broadband Home | 175 | 72.6% |
| Cellular Data Only | 16 | 6.6% |
| Satellite Internet | 9 | 3.7% |
| No Internet | 37 | 15.3% |
| Total | 241 | 100.0% |
Linden Summary
Linden, Wisconsin is a small village located in Fond du Lac County, Wisconsin. It is situated on the western shore of Lake Winnebago, approximately 25 miles northwest of the city of Fond du Lac. The village has a population of approximately 1,000 people and covers an area of 0.7 square miles.
History
The area that is now Linden was first settled in the early 1840s by German immigrants. The village was originally known as “New Berlin” and was later renamed “Linden” after the linden trees that grew in the area. The village was officially incorporated in 1891.
In the early 1900s, Linden was a thriving agricultural community. The village was home to several dairy farms, as well as a cheese factory and a creamery. The village also had a sawmill, a grist mill, and a brickyard.
In the 1950s, the village began to experience a decline in population as many of its residents moved away in search of better job opportunities. However, in recent years, the village has seen a resurgence in population as people have moved back to the area in search of a more rural lifestyle.
Geography
Linden is located in the western part of Fond du Lac County, Wisconsin. It is situated on the western shore of Lake Winnebago, approximately 25 miles northwest of the city of Fond du Lac. The village covers an area of 0.7 square miles and is bordered by the towns of Oakfield to the north, Byron to the east, and Taycheedah to the south.
The terrain of the village is mostly flat, with some rolling hills in the northern part of the village. The village is located in the Central Plain region of Wisconsin, which is characterized by flat, fertile farmland.
Economy
The economy of Linden is largely based on agriculture. The village is home to several dairy farms, as well as a cheese factory and a creamery. The village also has a sawmill, a grist mill, and a brickyard.
In addition to agriculture, the village also has a few small businesses, including a grocery store, a hardware store, and a few restaurants. The village also has a few small manufacturing companies, including a furniture manufacturer and a plastics manufacturer.
Demographics
As of the 2010 census, the population of Linden was 1,000 people. The racial makeup of the village was 97.2% White, 0.7% African American, 0.3% Native American, 0.3% Asian, and 1.5% from other races.
The median household income in Linden was $50,000, and the median family income was $54,000. The per capita income in the village was $20,000. Approximately 8.5% of the population was below the poverty line.
The village is served by the Fond du Lac School District. The village has one elementary school, one middle school, and one high school. The village also has a public library and a few churches.
Common Questions
What is the Total Population of Linden?
Total Population of Linden is 557.
What is the Total Male Population of Linden?
Total Male Population of Linden is 287.
What is the Total Female Population of Linden?
Total Female Population of Linden is 270.
What is the Ratio of Males per 100 Females in Linden?
There are 106.30 Males per 100 Females in Linden.
What is the Ratio of Females per 100 Males in Linden?
There are 94.08 Females per 100 Males in Linden.
What is the Median Population Age in Linden?
Median Population Age in Linden is 34.3 Years.
What is the Average Family Size in Linden
Average Family Size in Linden is 3.1 People.
What is the Average Household Size in Linden
Average Household Size in Linden is 2.3 People.
What is Per Capita Income in Linden?
Per Capita income in Linden is $31,671.
What is the Median Family Income in Linden?
Median Family Income in Linden is $85,208.
What is the Median Household income in Linden?
Median Household Income in Linden is $54,803.
What is Income or Wage Gap in Linden?
Income or Wage Gap in Linden is 58.6%.
Women in Linden earn 41.4 cents for every dollar earned by a man.
What is Inequality or Gini Index in Linden?
Inequality or Gini Index in Linden is 0.44.
How Large is the Labor Force in Linden?
There are 253 People in the Labor Forcein in Linden.
What is the Percentage of People in the Labor Force in Linden?
60.0% of People are in the Labor Force in Linden.
What is the Unemployment Rate in Linden?
Unemployment Rate in Linden is 2.4%.