Whitewater, WI Map & Demographics
Whitewater Map
Whitewater Overview
$21,633
PER CAPITA INCOME
$77,819
AVG FAMILY INCOME
$46,135
AVG HOUSEHOLD INCOME
3.6%
WAGE / INCOME GAP [ % ]
96.4¢/ $1
WAGE / INCOME GAP [ $ ]
0.47
INEQUALITY / GINI INDEX
15,725
TOTAL POPULATION
8,101
MALE POPULATION
7,624
FEMALE POPULATION
106.26
MALES / 100 FEMALES
94.11
FEMALES / 100 MALES
21.7
MEDIAN AGE
3.0
AVG FAMILY SIZE
2.4
AVG HOUSEHOLD SIZE
9,219
LABOR FORCE [ PEOPLE ]
65.2%
PERCENT IN LABOR FORCE
3.5%
UNEMPLOYMENT RATE
Whitewater Zip Codes
Income in Whitewater
Income Overview in Whitewater
Per Capita Income in Whitewater is $21,633, while median incomes of families and households are $77,819 and $46,135 respectively.
| Characteristic | Number | Measure |
| Per Capita Income | 15,725 | $21,633 |
| Median Family Income | 1,981 | $77,819 |
| Mean Family Income | 1,981 | $88,627 |
| Median Household Income | 5,021 | $46,135 |
| Mean Household Income | 5,021 | $60,459 |
| Income Deficit | 1,981 | $0 |
| Wage / Income Gap (%) | 15,725 | 3.62% |
| Wage / Income Gap ($) | 15,725 | 96.38¢ per $1 |
| Gini / Inequality Index | 15,725 | 0.47 |
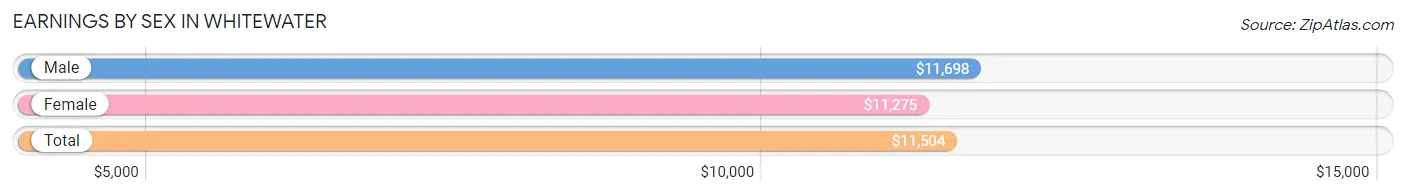
Earnings by Sex in Whitewater
Average Earnings in Whitewater are $11,504, $11,698 for men and $11,275 for women, a difference of 3.6%.
| Sex | Number | Average Earnings |
| Male | 5,985 (52.5%) | $11,698 |
| Female | 5,416 (47.5%) | $11,275 |
| Total | 11,401 (100.0%) | $11,504 |
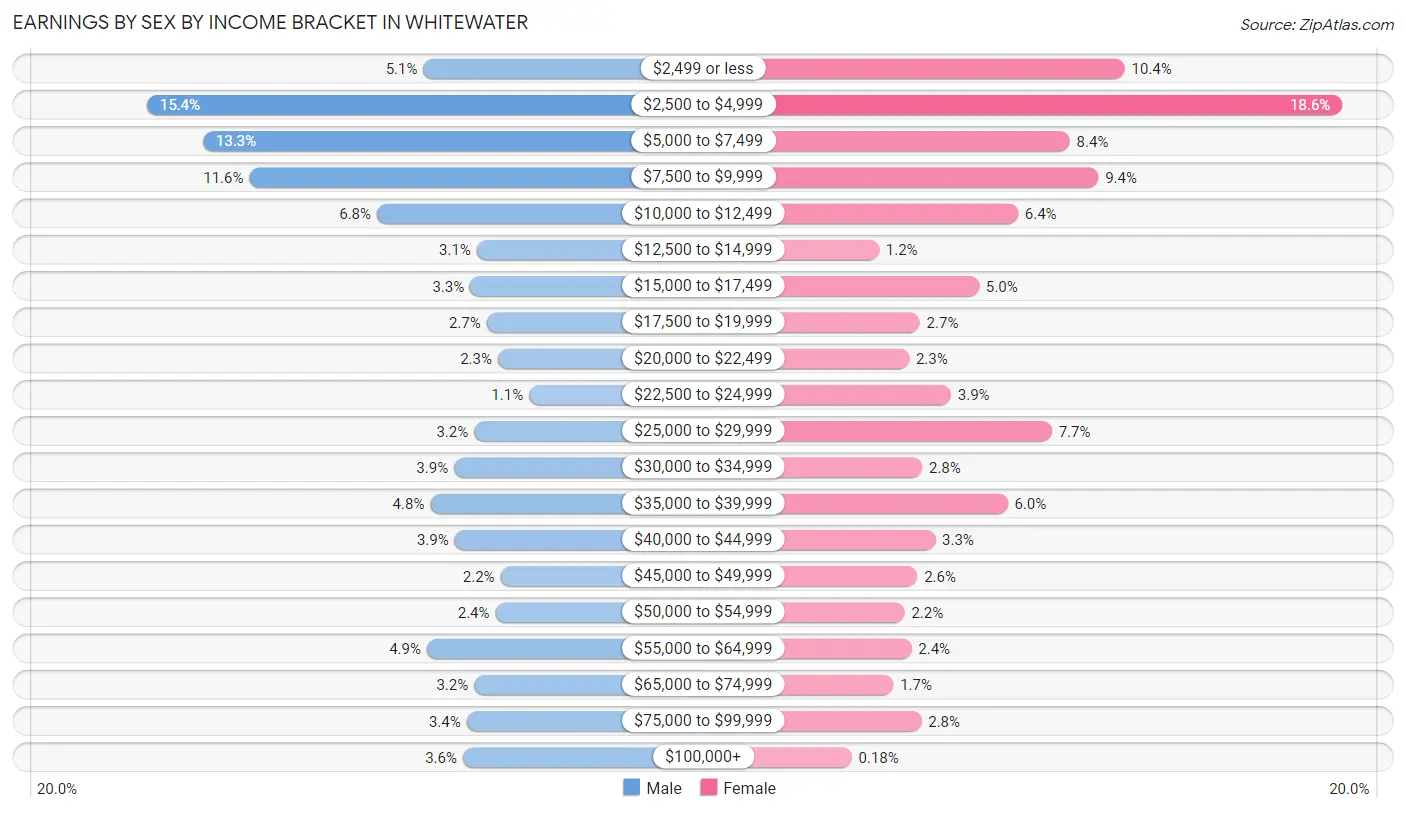
Earnings by Sex by Income Bracket in Whitewater
The most common earnings brackets in Whitewater are $2,500 to $4,999 for men (923 | 15.4%) and $2,500 to $4,999 for women (1,005 | 18.6%).
| Income | Male | Female |
| $2,499 or less | 303 (5.1%) | 564 (10.4%) |
| $2,500 to $4,999 | 923 (15.4%) | 1,005 (18.6%) |
| $5,000 to $7,499 | 797 (13.3%) | 452 (8.4%) |
| $7,500 to $9,999 | 693 (11.6%) | 510 (9.4%) |
| $10,000 to $12,499 | 407 (6.8%) | 347 (6.4%) |
| $12,500 to $14,999 | 183 (3.1%) | 65 (1.2%) |
| $15,000 to $17,499 | 198 (3.3%) | 268 (5.0%) |
| $17,500 to $19,999 | 161 (2.7%) | 148 (2.7%) |
| $20,000 to $22,499 | 136 (2.3%) | 126 (2.3%) |
| $22,500 to $24,999 | 66 (1.1%) | 211 (3.9%) |
| $25,000 to $29,999 | 189 (3.2%) | 416 (7.7%) |
| $30,000 to $34,999 | 234 (3.9%) | 153 (2.8%) |
| $35,000 to $39,999 | 287 (4.8%) | 326 (6.0%) |
| $40,000 to $44,999 | 233 (3.9%) | 179 (3.3%) |
| $45,000 to $49,999 | 130 (2.2%) | 143 (2.6%) |
| $50,000 to $54,999 | 141 (2.4%) | 117 (2.2%) |
| $55,000 to $64,999 | 295 (4.9%) | 131 (2.4%) |
| $65,000 to $74,999 | 189 (3.2%) | 94 (1.7%) |
| $75,000 to $99,999 | 206 (3.4%) | 151 (2.8%) |
| $100,000+ | 214 (3.6%) | 10 (0.2%) |
| Total | 5,985 (100.0%) | 5,416 (100.0%) |
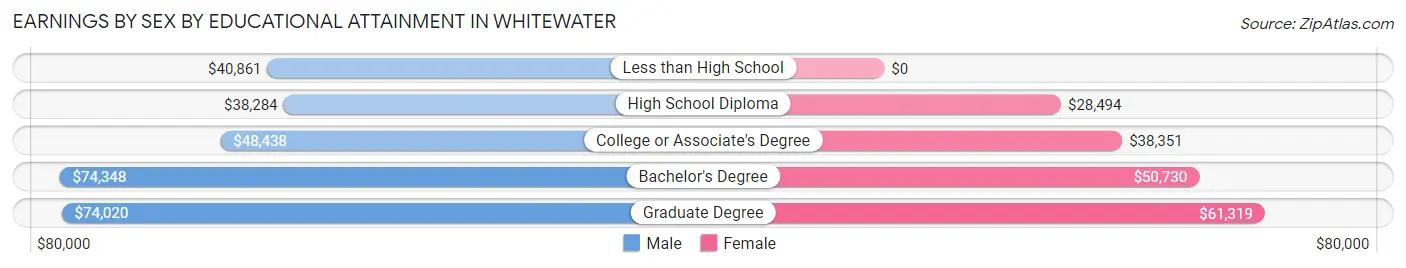
Earnings by Sex by Educational Attainment in Whitewater
Average earnings in Whitewater are $46,563 for men and $38,993 for women, a difference of 16.3%. Men with an educational attainment of bachelor's degree enjoy the highest average annual earnings of $74,348, while those with high school diploma education earn the least with $38,284. Women with an educational attainment of graduate degree earn the most with the average annual earnings of $61,319, while those with high school diploma education have the smallest earnings of $28,494.
| Educational Attainment | Male Income | Female Income |
| Less than High School | $40,861 | $0 |
| High School Diploma | $38,284 | $28,494 |
| College or Associate's Degree | $48,438 | $38,351 |
| Bachelor's Degree | $74,348 | $50,730 |
| Graduate Degree | $74,020 | $61,319 |
| Total | $46,563 | $38,993 |
Family Income in Whitewater
Family Income Brackets in Whitewater
According to the Whitewater family income data, there are 503 families falling into the $100,000 to $149,999 income range, which is the most common income bracket and makes up 25.4% of all families. Conversely, the $15,000 to $24,999 income bracket is the least frequent group with only 65 families (3.3%) belonging to this category.
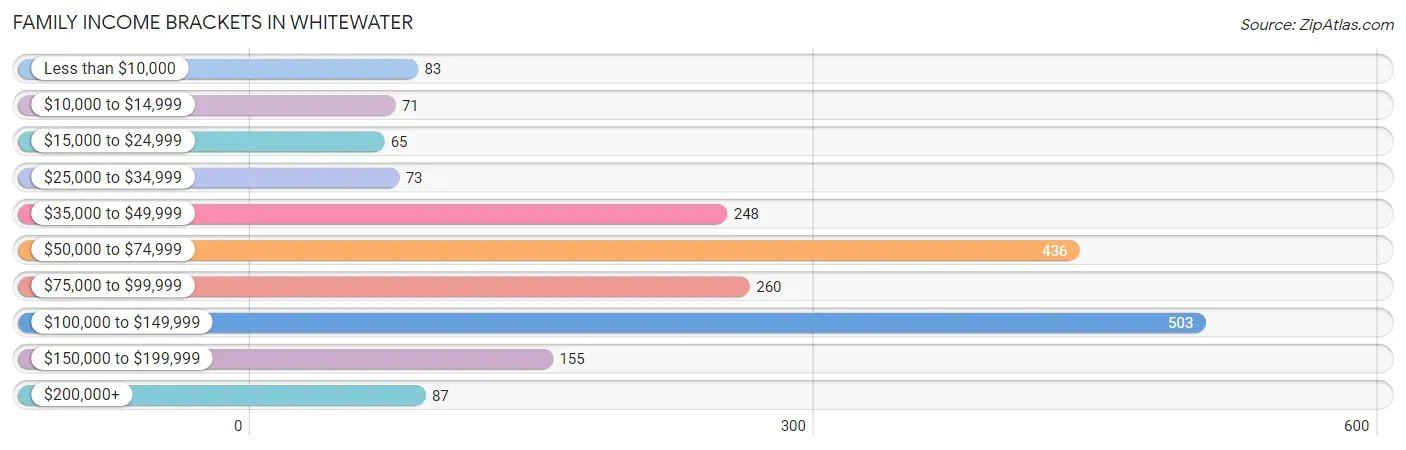
| Income Bracket | # Families | % Families |
| Less than $10,000 | 83 | 4.2% |
| $10,000 to $14,999 | 71 | 3.6% |
| $15,000 to $24,999 | 65 | 3.3% |
| $25,000 to $34,999 | 73 | 3.7% |
| $35,000 to $49,999 | 248 | 12.5% |
| $50,000 to $74,999 | 436 | 22.0% |
| $75,000 to $99,999 | 260 | 13.1% |
| $100,000 to $149,999 | 503 | 25.4% |
| $150,000 to $199,999 | 155 | 7.8% |
| $200,000+ | 87 | 4.4% |
Family Income by Famaliy Size in Whitewater
4-person families (319 | 16.1%) account for the highest median family income in Whitewater with $108,523 per family, while 3-person families (482 | 24.3%) have the highest median income of $31,218 per family member.
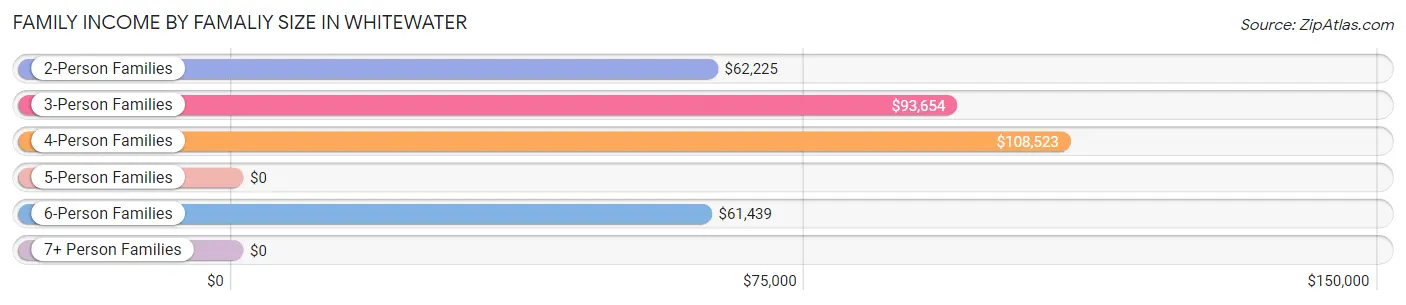
| Income Bracket | # Families | Median Income |
| 2-Person Families | 923 (46.6%) | $62,225 |
| 3-Person Families | 482 (24.3%) | $93,654 |
| 4-Person Families | 319 (16.1%) | $108,523 |
| 5-Person Families | 182 (9.2%) | $0 |
| 6-Person Families | 64 (3.2%) | $61,439 |
| 7+ Person Families | 11 (0.6%) | $0 |
| Total | 1,981 (100.0%) | $77,819 |
Family Income by Number of Earners in Whitewater
The median family income in Whitewater is $77,819, with families comprising 3+ earners (261) having the highest median family income of $123,893, while families with 1 earner (567) have the lowest median family income of $52,092, accounting for 13.2% and 28.6% of families, respectively.
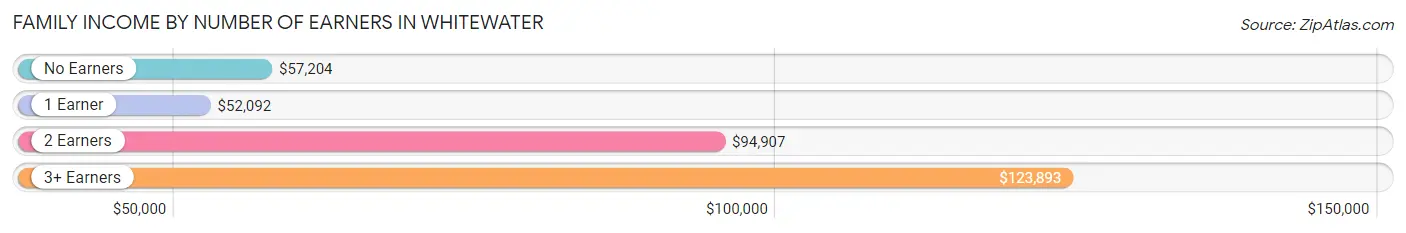
| Number of Earners | # Families | Median Income |
| No Earners | 325 (16.4%) | $57,204 |
| 1 Earner | 567 (28.6%) | $52,092 |
| 2 Earners | 828 (41.8%) | $94,907 |
| 3+ Earners | 261 (13.2%) | $123,893 |
| Total | 1,981 (100.0%) | $77,819 |
Household Income in Whitewater
Household Income Brackets in Whitewater
With 974 households falling in the category, the $50,000 to $74,999 income range is the most frequent in Whitewater, accounting for 19.4% of all households. In contrast, only 90 households (1.8%) fall into the $200,000+ income bracket, making it the least populous group.
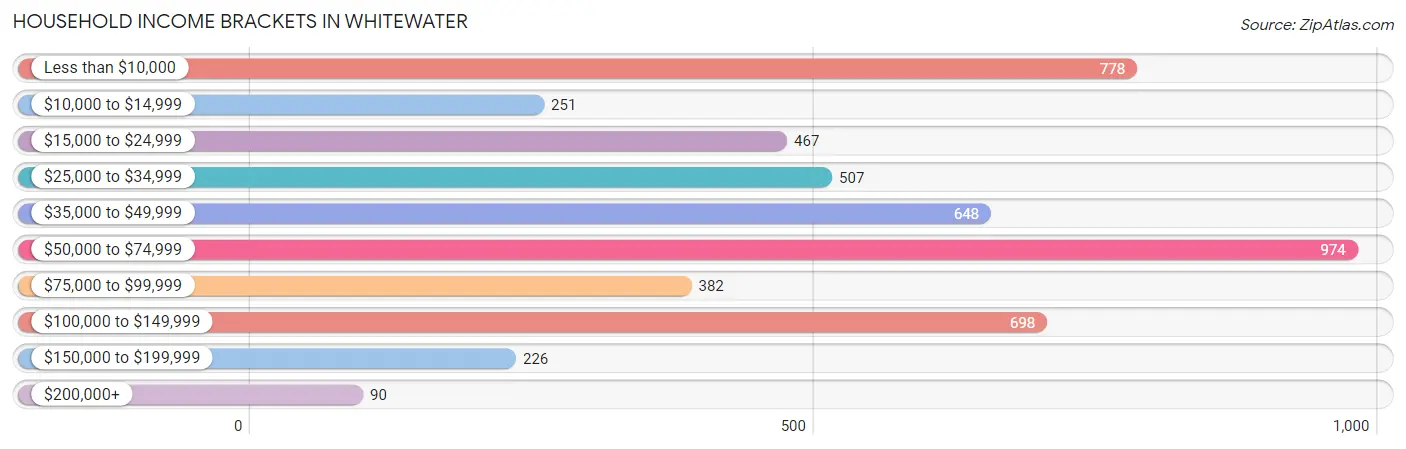
| Income Bracket | # Households | % Households |
| Less than $10,000 | 778 | 15.5% |
| $10,000 to $14,999 | 251 | 5.0% |
| $15,000 to $24,999 | 467 | 9.3% |
| $25,000 to $34,999 | 507 | 10.1% |
| $35,000 to $49,999 | 648 | 12.9% |
| $50,000 to $74,999 | 974 | 19.4% |
| $75,000 to $99,999 | 382 | 7.6% |
| $100,000 to $149,999 | 698 | 13.9% |
| $150,000 to $199,999 | 226 | 4.5% |
| $200,000+ | 90 | 1.8% |
Household Income by Householder Age in Whitewater
The median household income in Whitewater is $46,135, with the highest median household income of $81,250 found in the 45 to 64 years age bracket for the primary householder. A total of 956 households (19.0%) fall into this category. Meanwhile, the 15 to 24 years age bracket for the primary householder has the lowest median household income of $23,442, with 2,063 households (41.1%) in this group.
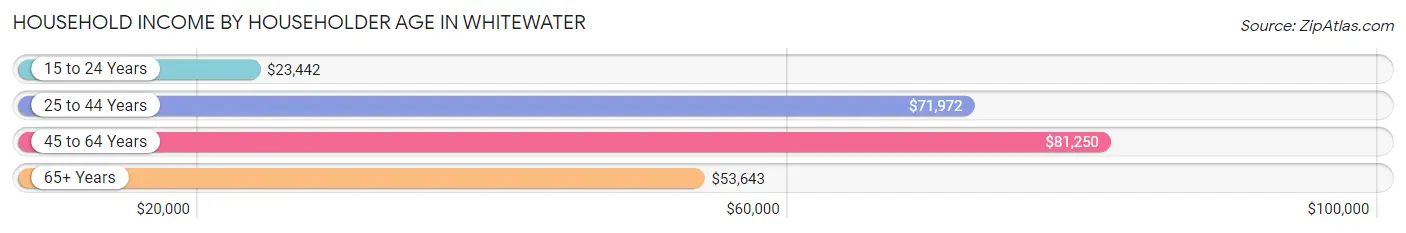
| Income Bracket | # Households | Median Income |
| 15 to 24 Years | 2,063 (41.1%) | $23,442 |
| 25 to 44 Years | 1,196 (23.8%) | $71,972 |
| 45 to 64 Years | 956 (19.0%) | $81,250 |
| 65+ Years | 806 (16.1%) | $53,643 |
| Total | 5,021 (100.0%) | $46,135 |
Poverty in Whitewater
Income Below Poverty by Sex and Age in Whitewater
With 34.0% poverty level for males and 30.7% for females among the residents of Whitewater, 18 to 24 year old males and 18 to 24 year old females are the most vulnerable to poverty, with 1,780 males (66.9%) and 1,244 females (59.0%) in their respective age groups living below the poverty level.
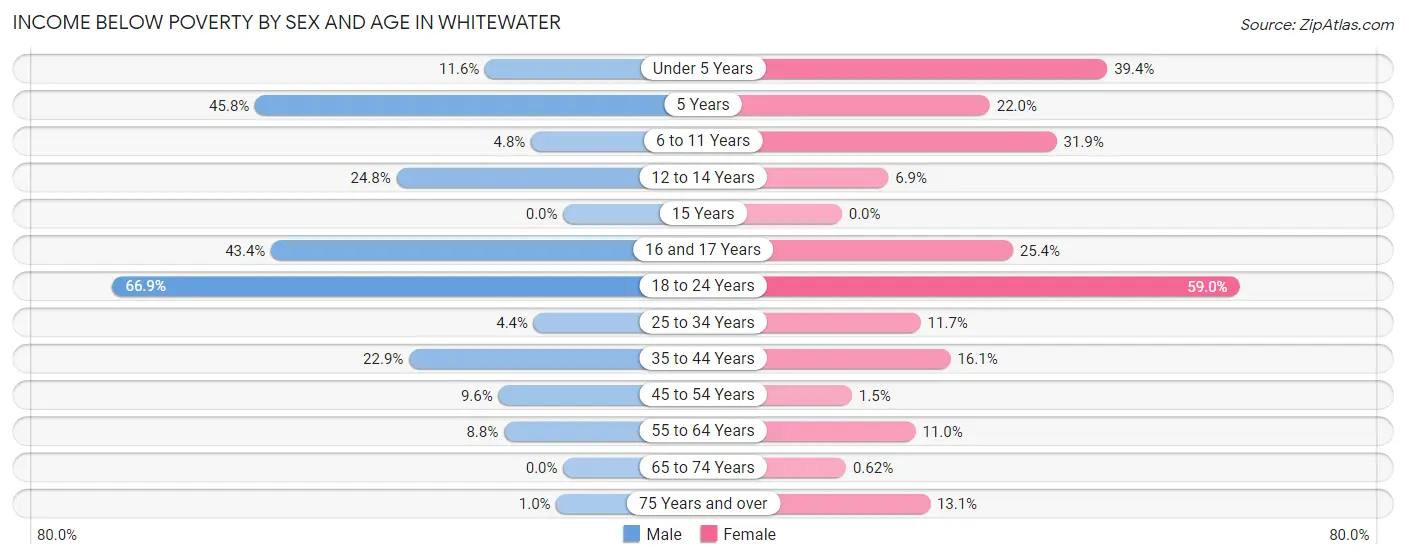
| Age Bracket | Male | Female |
| Under 5 Years | 36 (11.6%) | 67 (39.4%) |
| 5 Years | 27 (45.8%) | 20 (22.0%) |
| 6 to 11 Years | 17 (4.8%) | 96 (31.9%) |
| 12 to 14 Years | 27 (24.8%) | 6 (6.9%) |
| 15 Years | 0 (0.0%) | 0 (0.0%) |
| 16 and 17 Years | 59 (43.4%) | 16 (25.4%) |
| 18 to 24 Years | 1,780 (66.9%) | 1,244 (59.0%) |
| 25 to 34 Years | 40 (4.4%) | 69 (11.7%) |
| 35 to 44 Years | 117 (22.9%) | 67 (16.1%) |
| 45 to 54 Years | 35 (9.6%) | 7 (1.5%) |
| 55 to 64 Years | 38 (8.8%) | 46 (11.0%) |
| 65 to 74 Years | 0 (0.0%) | 2 (0.6%) |
| 75 Years and over | 3 (1.0%) | 61 (13.1%) |
| Total | 2,179 (34.0%) | 1,701 (30.7%) |
Income Above Poverty by Sex and Age in Whitewater
According to the poverty statistics in Whitewater, males aged 15 years and females aged 15 years are the age groups that are most secure financially, with 100.0% of males and 100.0% of females in these age groups living above the poverty line.
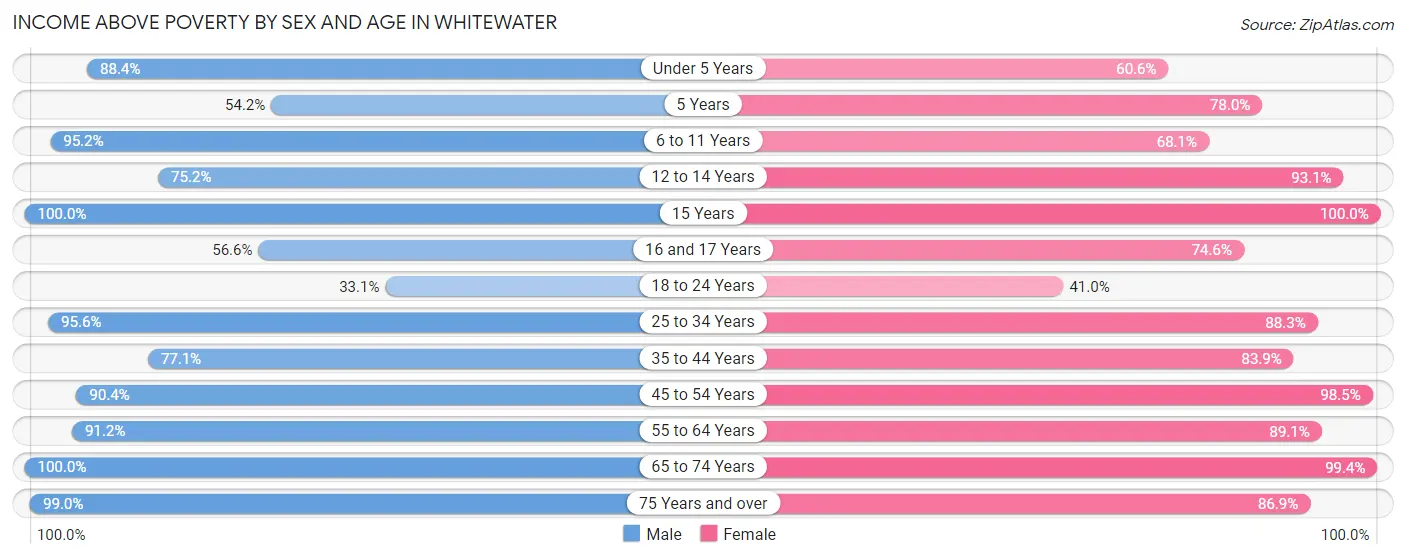
| Age Bracket | Male | Female |
| Under 5 Years | 274 (88.4%) | 103 (60.6%) |
| 5 Years | 32 (54.2%) | 71 (78.0%) |
| 6 to 11 Years | 339 (95.2%) | 205 (68.1%) |
| 12 to 14 Years | 82 (75.2%) | 81 (93.1%) |
| 15 Years | 40 (100.0%) | 41 (100.0%) |
| 16 and 17 Years | 77 (56.6%) | 47 (74.6%) |
| 18 to 24 Years | 879 (33.1%) | 863 (41.0%) |
| 25 to 34 Years | 874 (95.6%) | 520 (88.3%) |
| 35 to 44 Years | 394 (77.1%) | 348 (83.9%) |
| 45 to 54 Years | 329 (90.4%) | 460 (98.5%) |
| 55 to 64 Years | 394 (91.2%) | 374 (89.0%) |
| 65 to 74 Years | 230 (100.0%) | 322 (99.4%) |
| 75 Years and over | 287 (99.0%) | 405 (86.9%) |
| Total | 4,231 (66.0%) | 3,840 (69.3%) |
Income Below Poverty Among Married-Couple Families in Whitewater
The poverty statistics for married-couple families in Whitewater show that 1.8% or 25 of the total 1,376 families live below the poverty line. Families with 3 or 4 children have the highest poverty rate of 15.3%, comprising of 13 families. On the other hand, families with no children have the lowest poverty rate of 0.0%, which includes 0 families.
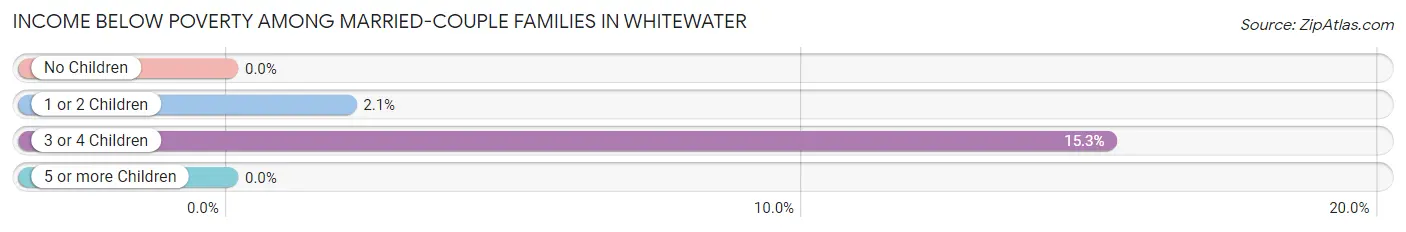
| Children | Above Poverty | Below Poverty |
| No Children | 709 (100.0%) | 0 (0.0%) |
| 1 or 2 Children | 570 (97.9%) | 12 (2.1%) |
| 3 or 4 Children | 72 (84.7%) | 13 (15.3%) |
| 5 or more Children | 0 (0.0%) | 0 (0.0%) |
| Total | 1,351 (98.2%) | 25 (1.8%) |
Income Below Poverty Among Single-Parent Households in Whitewater
According to the poverty data in Whitewater, 11.3% or 14 single-father households and 36.2% or 174 single-mother households are living below the poverty line. Among single-father households, those with no children have the highest poverty rate, with 14 households (13.0%) experiencing poverty. Likewise, among single-mother households, those with 5 or more children have the highest poverty rate, with 11 households (100.0%) falling below the poverty line.
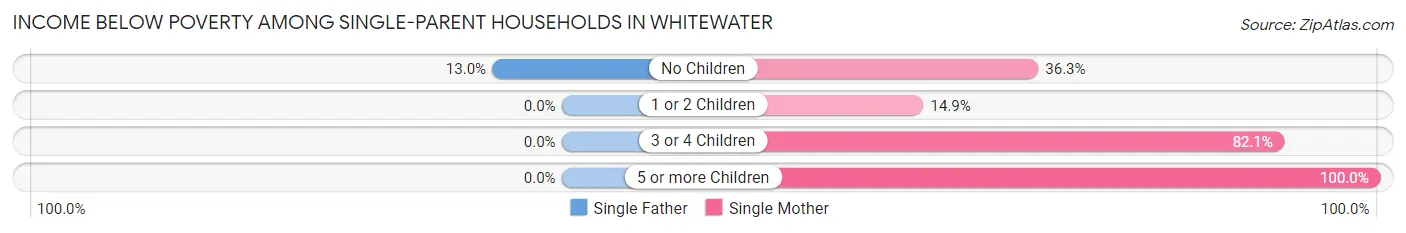
| Children | Single Father | Single Mother |
| No Children | 14 (13.0%) | 62 (36.3%) |
| 1 or 2 Children | 0 (0.0%) | 32 (14.9%) |
| 3 or 4 Children | 0 (0.0%) | 69 (82.1%) |
| 5 or more Children | 0 (0.0%) | 11 (100.0%) |
| Total | 14 (11.3%) | 174 (36.2%) |
Income Below Poverty Among Married-Couple vs Single-Parent Households in Whitewater
The poverty data for Whitewater shows that 25 of the married-couple family households (1.8%) and 188 of the single-parent households (31.1%) are living below the poverty level. Within the married-couple family households, those with 3 or 4 children have the highest poverty rate, with 13 households (15.3%) falling below the poverty line. Among the single-parent households, those with 5 or more children have the highest poverty rate, with 11 household (100.0%) living below poverty.
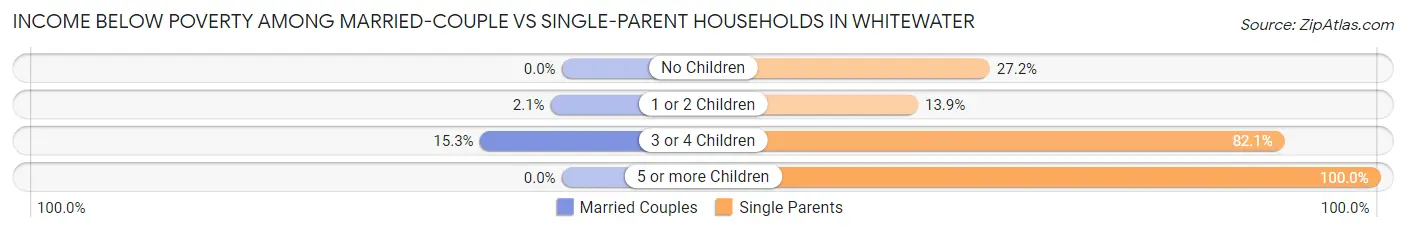
| Children | Married-Couple Families | Single-Parent Households |
| No Children | 0 (0.0%) | 76 (27.2%) |
| 1 or 2 Children | 12 (2.1%) | 32 (13.9%) |
| 3 or 4 Children | 13 (15.3%) | 69 (82.1%) |
| 5 or more Children | 0 (0.0%) | 11 (100.0%) |
| Total | 25 (1.8%) | 188 (31.1%) |
Race in Whitewater
The most populous races in Whitewater are White / Caucasian (13,309 | 84.6%), Hispanic or Latino (1,543 | 9.8%), and Two or more Races (836 | 5.3%).
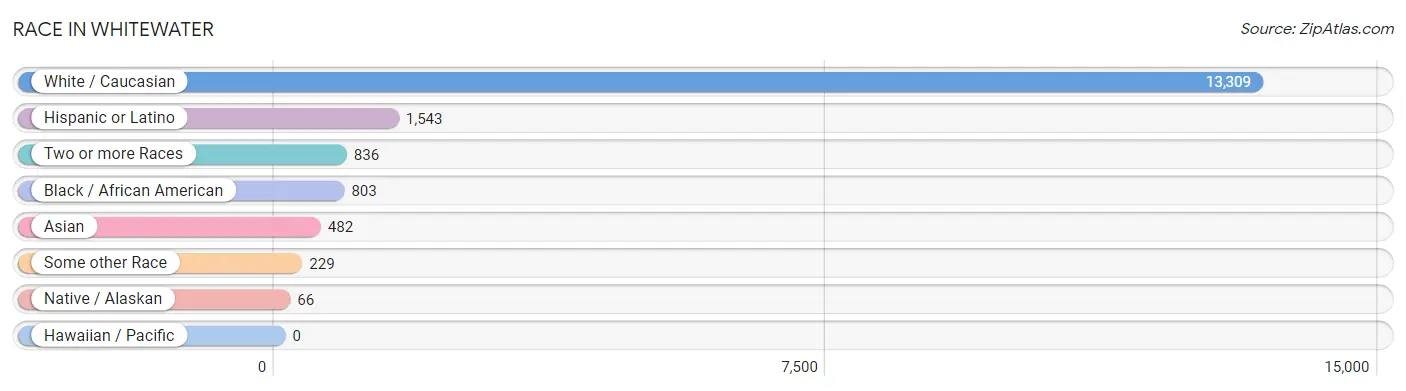
| Race | # Population | % Population |
| Asian | 482 | 3.1% |
| Black / African American | 803 | 5.1% |
| Hawaiian / Pacific | 0 | 0.0% |
| Hispanic or Latino | 1,543 | 9.8% |
| Native / Alaskan | 66 | 0.4% |
| White / Caucasian | 13,309 | 84.6% |
| Two or more Races | 836 | 5.3% |
| Some other Race | 229 | 1.5% |
| Total | 15,725 | 100.0% |
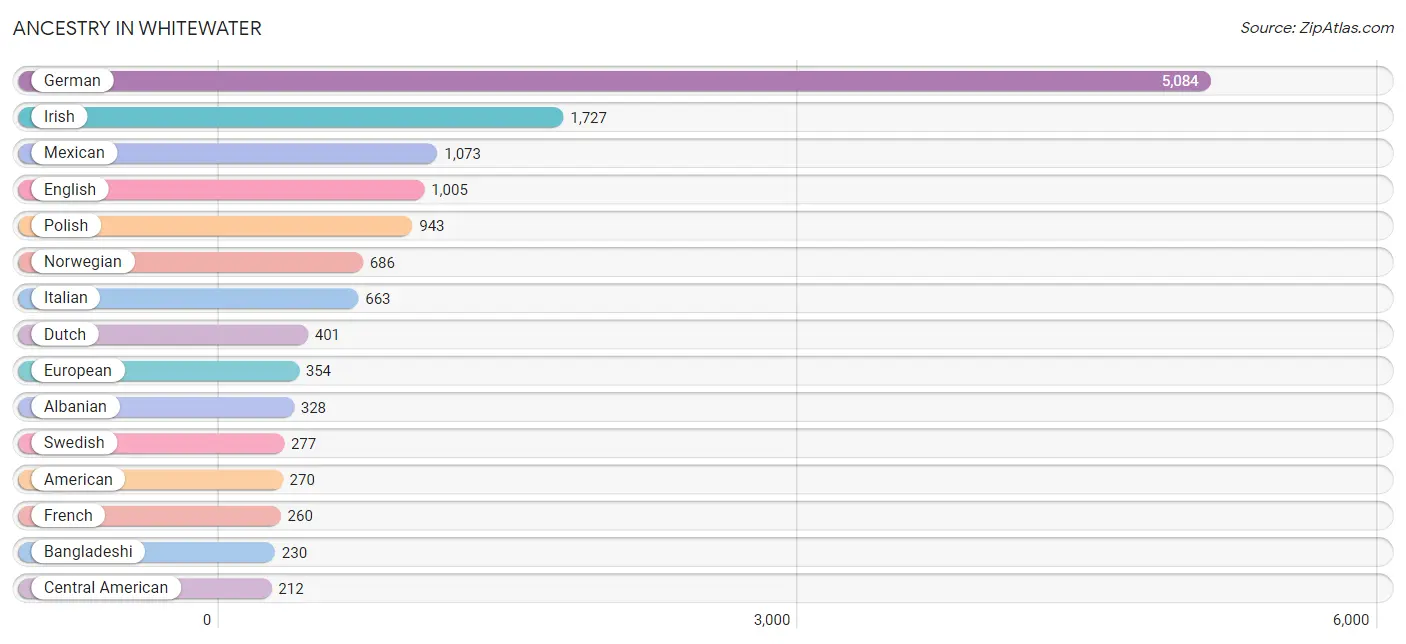
Ancestry in Whitewater
The most populous ancestries reported in Whitewater are German (5,084 | 32.3%), Irish (1,727 | 11.0%), Mexican (1,073 | 6.8%), English (1,005 | 6.4%), and Polish (943 | 6.0%), together accounting for 62.5% of all Whitewater residents.
| Ancestry | # Population | % Population |
| African | 18 | 0.1% |
| Albanian | 328 | 2.1% |
| American | 270 | 1.7% |
| Arab | 64 | 0.4% |
| Argentinean | 9 | 0.1% |
| Armenian | 22 | 0.1% |
| Austrian | 57 | 0.4% |
| Bangladeshi | 230 | 1.5% |
| Belgian | 32 | 0.2% |
| Bhutanese | 40 | 0.3% |
| British | 4 | 0.0% |
| Burmese | 57 | 0.4% |
| Canadian | 10 | 0.1% |
| Central American | 212 | 1.3% |
| Cherokee | 6 | 0.0% |
| Chippewa | 7 | 0.0% |
| Colombian | 12 | 0.1% |
| Costa Rican | 19 | 0.1% |
| Creek | 7 | 0.0% |
| Croatian | 9 | 0.1% |
| Cuban | 10 | 0.1% |
| Czech | 80 | 0.5% |
| Czechoslovakian | 31 | 0.2% |
| Danish | 38 | 0.2% |
| Dominican | 10 | 0.1% |
| Dutch | 401 | 2.5% |
| Eastern European | 20 | 0.1% |
| Ecuadorian | 4 | 0.0% |
| English | 1,005 | 6.4% |
| European | 354 | 2.2% |
| Filipino | 3 | 0.0% |
| Finnish | 18 | 0.1% |
| French | 260 | 1.7% |
| French Canadian | 80 | 0.5% |
| German | 5,084 | 32.3% |
| Greek | 86 | 0.5% |
| Honduran | 40 | 0.3% |
| Hungarian | 73 | 0.5% |
| Indian (Asian) | 89 | 0.6% |
| Irish | 1,727 | 11.0% |
| Iroquois | 17 | 0.1% |
| Italian | 663 | 4.2% |
| Korean | 91 | 0.6% |
| Lebanese | 44 | 0.3% |
| Liberian | 23 | 0.2% |
| Macedonian | 5 | 0.0% |
| Menominee | 31 | 0.2% |
| Mexican | 1,073 | 6.8% |
| Nicaraguan | 149 | 0.9% |
| Nigerian | 4 | 0.0% |
| Northern European | 3 | 0.0% |
| Norwegian | 686 | 4.4% |
| Pakistani | 5 | 0.0% |
| Palestinian | 20 | 0.1% |
| Panamanian | 4 | 0.0% |
| Peruvian | 8 | 0.1% |
| Polish | 943 | 6.0% |
| Portuguese | 8 | 0.1% |
| Puerto Rican | 91 | 0.6% |
| Russian | 166 | 1.1% |
| Scandinavian | 20 | 0.1% |
| Scotch-Irish | 27 | 0.2% |
| Scottish | 119 | 0.8% |
| Serbian | 12 | 0.1% |
| Slavic | 89 | 0.6% |
| Slovak | 11 | 0.1% |
| South American | 42 | 0.3% |
| Sri Lankan | 137 | 0.9% |
| Subsaharan African | 45 | 0.3% |
| Swedish | 277 | 1.8% |
| Swiss | 188 | 1.2% |
| Thai | 2 | 0.0% |
| Tohono O'Odham | 28 | 0.2% |
| Uruguayan | 9 | 0.1% |
| Vietnamese | 22 | 0.1% |
| Welsh | 54 | 0.3% | View All 76 Rows |
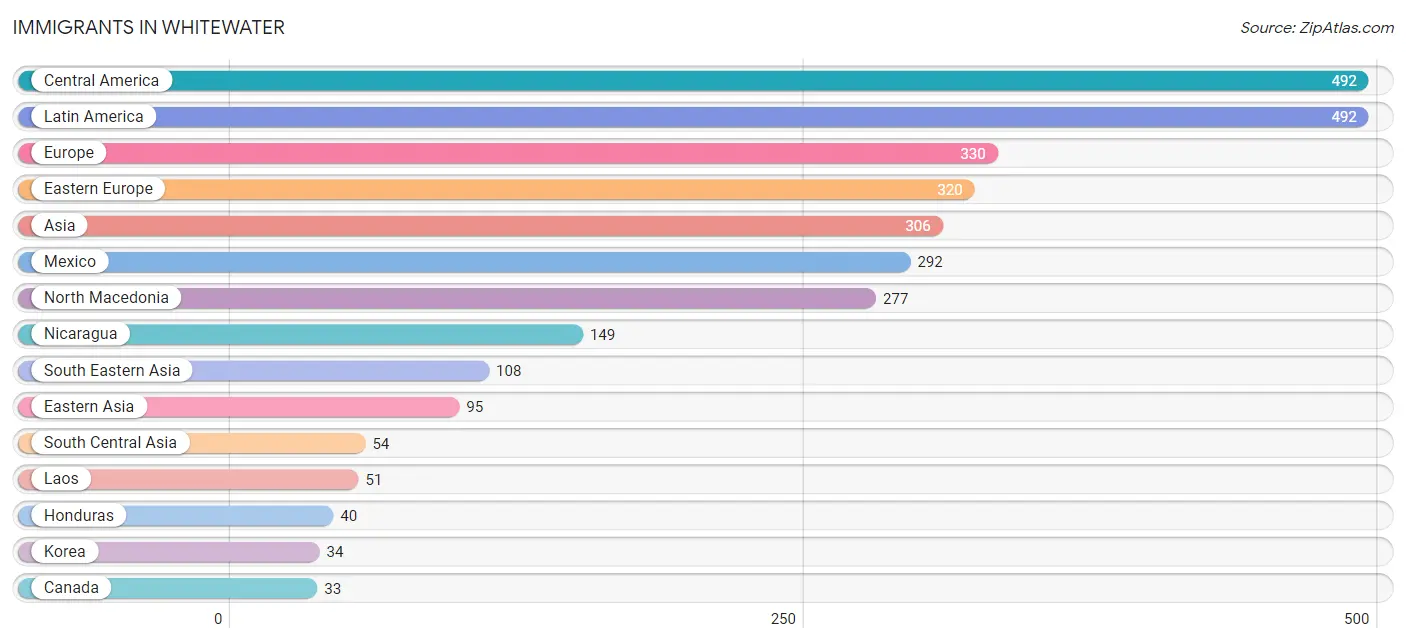
Immigrants in Whitewater
The most numerous immigrant groups reported in Whitewater came from Central America (492 | 3.1%), Latin America (492 | 3.1%), Europe (330 | 2.1%), Eastern Europe (320 | 2.0%), and Asia (306 | 1.9%), together accounting for 12.3% of all Whitewater residents.
| Immigration Origin | # Population | % Population |
| Africa | 18 | 0.1% |
| Asia | 306 | 1.9% |
| Bangladesh | 22 | 0.1% |
| Canada | 33 | 0.2% |
| Central America | 492 | 3.1% |
| China | 31 | 0.2% |
| Costa Rica | 11 | 0.1% |
| Eastern Africa | 18 | 0.1% |
| Eastern Asia | 95 | 0.6% |
| Eastern Europe | 320 | 2.0% |
| Europe | 330 | 2.1% |
| Germany | 10 | 0.1% |
| Honduras | 40 | 0.3% |
| India | 2 | 0.0% |
| Israel | 5 | 0.0% |
| Japan | 30 | 0.2% |
| Kenya | 18 | 0.1% |
| Korea | 34 | 0.2% |
| Laos | 51 | 0.3% |
| Latin America | 492 | 3.1% |
| Lebanon | 24 | 0.2% |
| Mexico | 292 | 1.9% |
| Nepal | 30 | 0.2% |
| Nicaragua | 149 | 0.9% |
| North Macedonia | 277 | 1.8% |
| Philippines | 27 | 0.2% |
| South Central Asia | 54 | 0.3% |
| South Eastern Asia | 108 | 0.7% |
| Taiwan | 3 | 0.0% |
| Vietnam | 30 | 0.2% |
| Western Asia | 29 | 0.2% |
| Western Europe | 10 | 0.1% | View All 32 Rows |
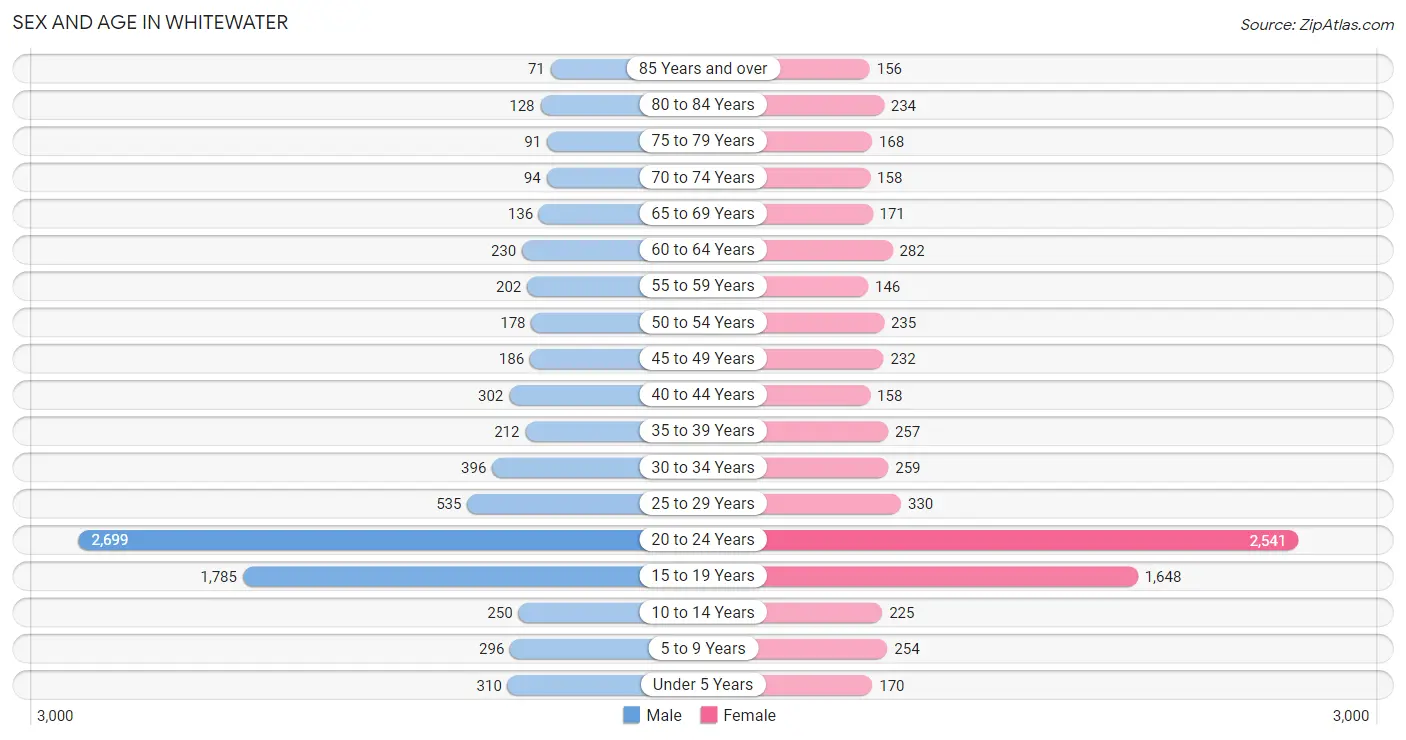
Sex and Age in Whitewater
Sex and Age in Whitewater
The most populous age groups in Whitewater are 20 to 24 Years (2,699 | 33.3%) for men and 20 to 24 Years (2,541 | 33.3%) for women.
| Age Bracket | Male | Female |
| Under 5 Years | 310 (3.8%) | 170 (2.2%) |
| 5 to 9 Years | 296 (3.6%) | 254 (3.3%) |
| 10 to 14 Years | 250 (3.1%) | 225 (2.9%) |
| 15 to 19 Years | 1,785 (22.0%) | 1,648 (21.6%) |
| 20 to 24 Years | 2,699 (33.3%) | 2,541 (33.3%) |
| 25 to 29 Years | 535 (6.6%) | 330 (4.3%) |
| 30 to 34 Years | 396 (4.9%) | 259 (3.4%) |
| 35 to 39 Years | 212 (2.6%) | 257 (3.4%) |
| 40 to 44 Years | 302 (3.7%) | 158 (2.1%) |
| 45 to 49 Years | 186 (2.3%) | 232 (3.0%) |
| 50 to 54 Years | 178 (2.2%) | 235 (3.1%) |
| 55 to 59 Years | 202 (2.5%) | 146 (1.9%) |
| 60 to 64 Years | 230 (2.8%) | 282 (3.7%) |
| 65 to 69 Years | 136 (1.7%) | 171 (2.2%) |
| 70 to 74 Years | 94 (1.2%) | 158 (2.1%) |
| 75 to 79 Years | 91 (1.1%) | 168 (2.2%) |
| 80 to 84 Years | 128 (1.6%) | 234 (3.1%) |
| 85 Years and over | 71 (0.9%) | 156 (2.1%) |
| Total | 8,101 (100.0%) | 7,624 (100.0%) |
Families and Households in Whitewater
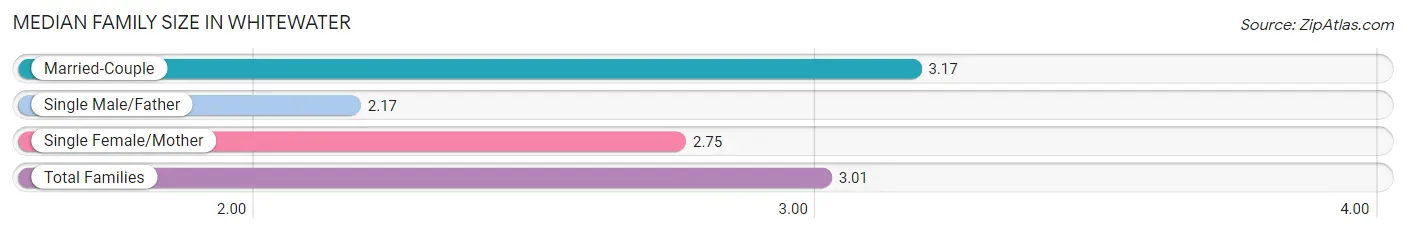
Median Family Size in Whitewater
The median family size in Whitewater is 3.01 persons per family, with married-couple families (1,376 | 69.5%) accounting for the largest median family size of 3.17 persons per family. On the other hand, single male/father families (124 | 6.3%) represent the smallest median family size with 2.17 persons per family.
| Family Type | # Families | Family Size |
| Married-Couple | 1,376 (69.5%) | 3.17 |
| Single Male/Father | 124 (6.3%) | 2.17 |
| Single Female/Mother | 481 (24.3%) | 2.75 |
| Total Families | 1,981 (100.0%) | 3.01 |
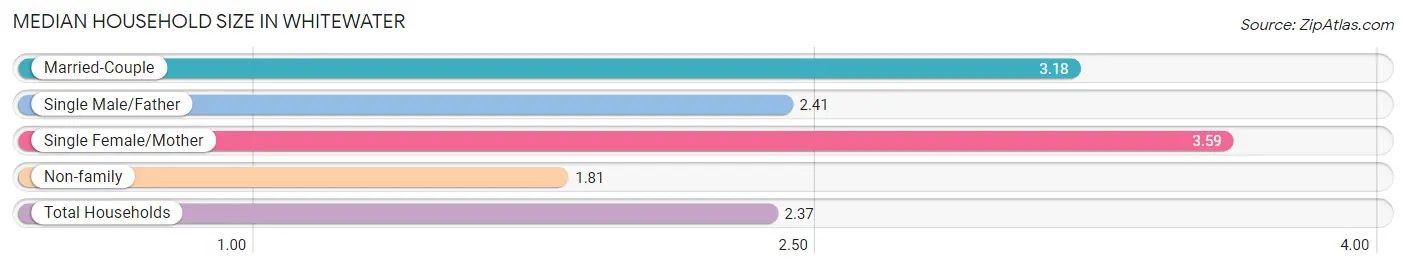
Median Household Size in Whitewater
The median household size in Whitewater is 2.37 persons per household, with single female/mother households (481 | 9.6%) accounting for the largest median household size of 3.59 persons per household. non-family households (3,040 | 60.6%) represent the smallest median household size with 1.81 persons per household.
| Household Type | # Households | Household Size |
| Married-Couple | 1,376 (27.4%) | 3.18 |
| Single Male/Father | 124 (2.5%) | 2.41 |
| Single Female/Mother | 481 (9.6%) | 3.59 |
| Non-family | 3,040 (60.6%) | 1.81 |
| Total Households | 5,021 (100.0%) | 2.37 |
Household Size by Marriage Status in Whitewater
Out of a total of 5,021 households in Whitewater, 1,981 (39.5%) are family households, while 3,040 (60.6%) are nonfamily households. The most numerous type of family households are 2-person households, comprising 730, and the most common type of nonfamily households are 1-person households, comprising 1,783.
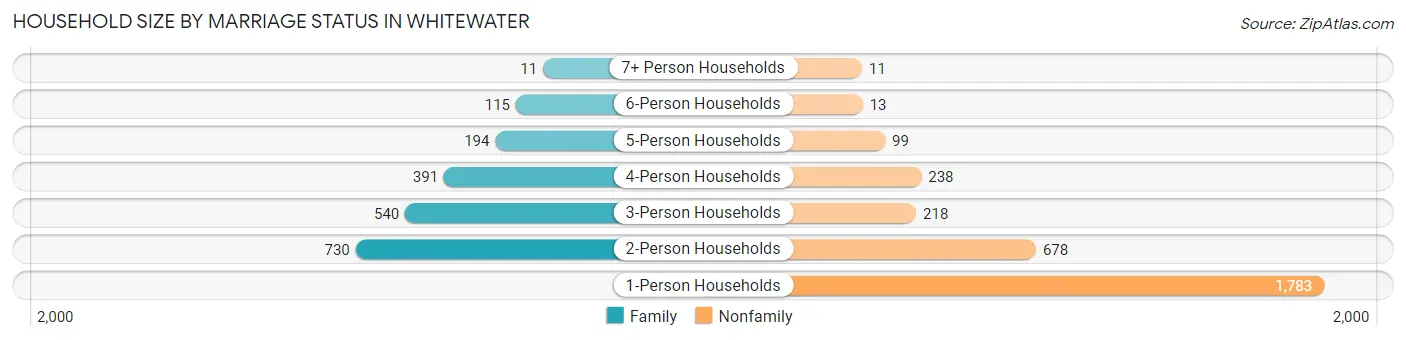
| Household Size | Family Households | Nonfamily Households |
| 1-Person Households | - | 1,783 (35.5%) |
| 2-Person Households | 730 (14.5%) | 678 (13.5%) |
| 3-Person Households | 540 (10.7%) | 218 (4.3%) |
| 4-Person Households | 391 (7.8%) | 238 (4.7%) |
| 5-Person Households | 194 (3.9%) | 99 (2.0%) |
| 6-Person Households | 115 (2.3%) | 13 (0.3%) |
| 7+ Person Households | 11 (0.2%) | 11 (0.2%) |
| Total | 1,981 (39.5%) | 3,040 (60.6%) |
Female Fertility in Whitewater
Fertility by Age in Whitewater
Average fertility rate in Whitewater is 35.0 births per 1,000 women. Women in the age bracket of 35 to 50 years have the highest fertility rate with 90.0 births per 1,000 women. Women in the age bracket of 20 to 34 years acount for 64.9% of all women with births.
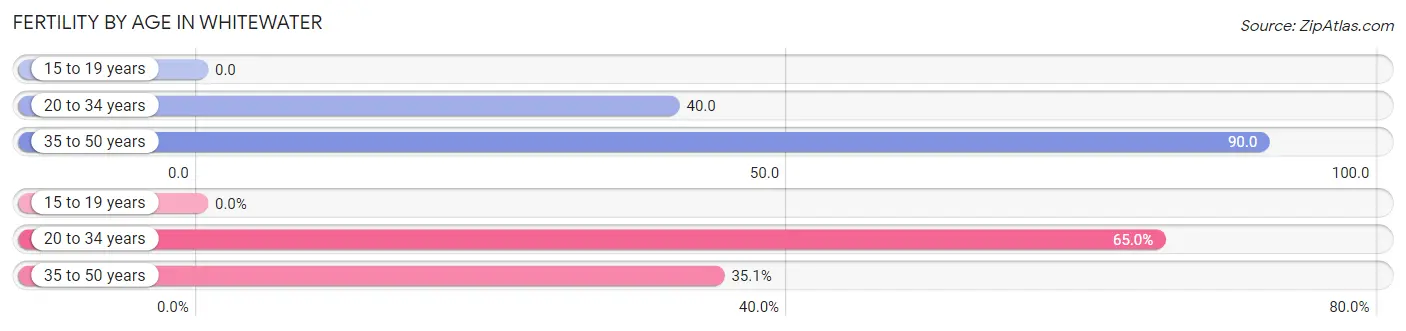
| Age Bracket | Women with Births | Births / 1,000 Women |
| 15 to 19 years | 0 (0.0%) | 0.0 |
| 20 to 34 years | 126 (64.9%) | 40.0 |
| 35 to 50 years | 68 (35.0%) | 90.0 |
| Total | 194 (100.0%) | 35.0 |
Fertility by Age by Marriage Status in Whitewater
41.2% of women with births (194) in Whitewater are married. The highest percentage of unmarried women with births falls into 35 to 50 years age bracket with 75.0% of them unmarried at the time of birth, while the lowest percentage of unmarried women with births belong to 20 to 34 years age bracket with 50.0% of them unmarried.
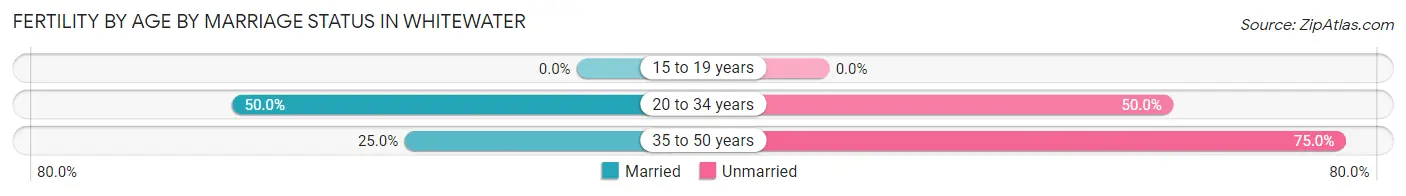
| Age Bracket | Married | Unmarried |
| 15 to 19 years | 0 (0.0%) | 0 (0.0%) |
| 20 to 34 years | 63 (50.0%) | 63 (50.0%) |
| 35 to 50 years | 17 (25.0%) | 51 (75.0%) |
| Total | 80 (41.2%) | 114 (58.8%) |
Fertility by Education in Whitewater
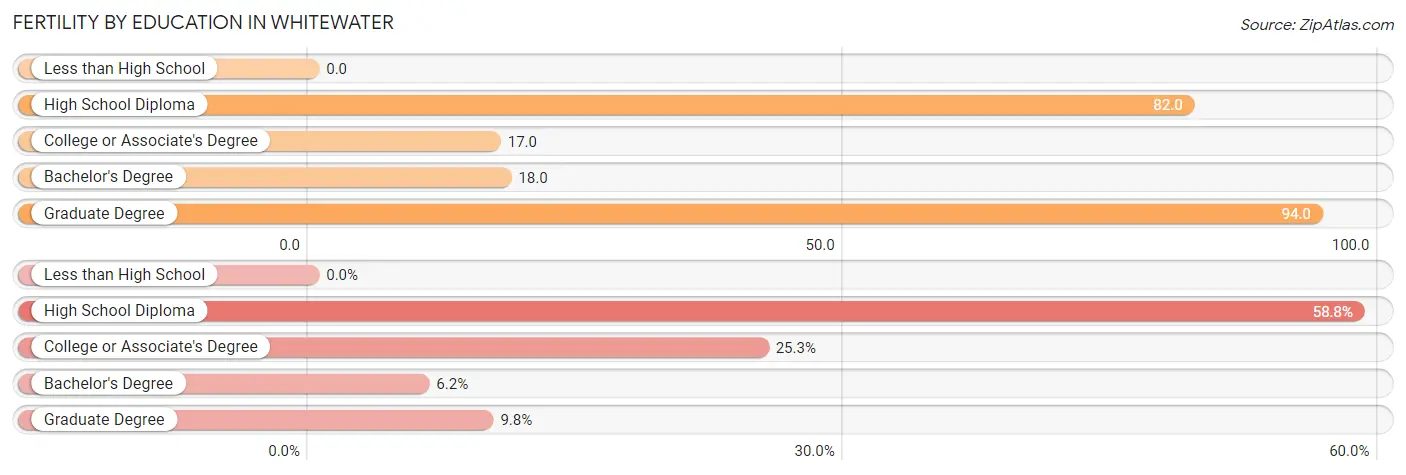
| Educational Attainment | Women with Births | Births / 1,000 Women |
| Less than High School | 0 (0.0%) | 0.0 |
| High School Diploma | 114 (58.8%) | 82.0 |
| College or Associate's Degree | 49 (25.3%) | 17.0 |
| Bachelor's Degree | 12 (6.2%) | 18.0 |
| Graduate Degree | 19 (9.8%) | 94.0 |
| Total | 194 (100.0%) | 35.0 |
Fertility by Education by Marriage Status in Whitewater
58.8% of women with births in Whitewater are unmarried. Women with the educational attainment of college or associate's degree are most likely to be married with 100.0% of them married at childbirth, while women with the educational attainment of high school diploma are least likely to be married with 100.0% of them unmarried at childbirth.
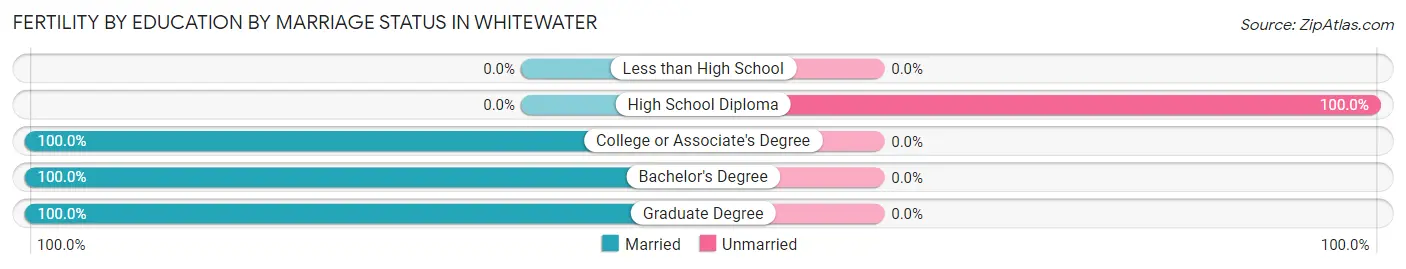
| Educational Attainment | Married | Unmarried |
| Less than High School | 0 (0.0%) | 0 (0.0%) |
| High School Diploma | 0 (0.0%) | 114 (100.0%) |
| College or Associate's Degree | 49 (100.0%) | 0 (0.0%) |
| Bachelor's Degree | 12 (100.0%) | 0 (0.0%) |
| Graduate Degree | 19 (100.0%) | 0 (0.0%) |
| Total | 80 (41.2%) | 114 (58.8%) |
Employment Characteristics in Whitewater
Employment by Class of Employer in Whitewater
Among the 8,394 employed individuals in Whitewater, private company employees (5,868 | 69.9%), state government employees (807 | 9.6%), and local government employees (621 | 7.4%) make up the most common classes of employment.
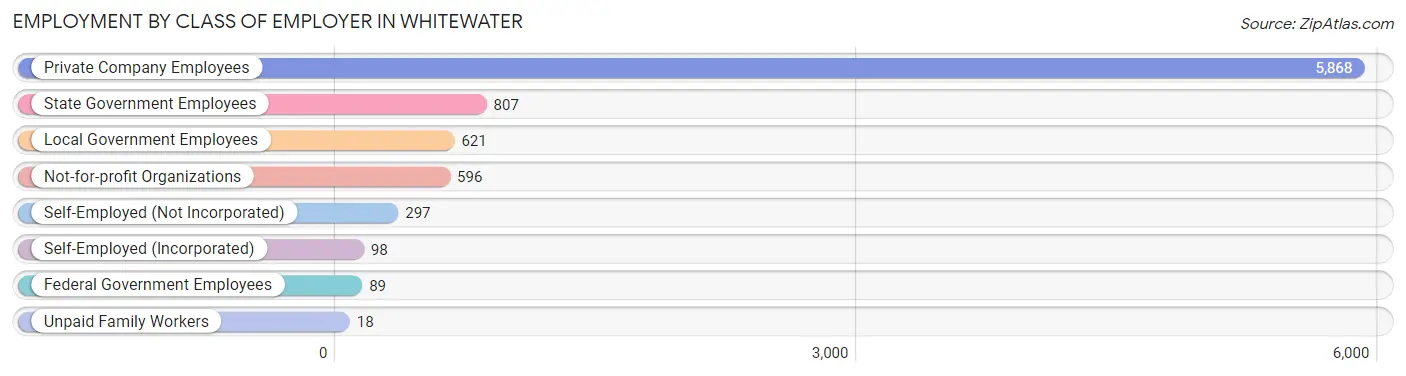
| Employer Class | # Employees | % Employees |
| Private Company Employees | 5,868 | 69.9% |
| Self-Employed (Incorporated) | 98 | 1.2% |
| Self-Employed (Not Incorporated) | 297 | 3.5% |
| Not-for-profit Organizations | 596 | 7.1% |
| Local Government Employees | 621 | 7.4% |
| State Government Employees | 807 | 9.6% |
| Federal Government Employees | 89 | 1.1% |
| Unpaid Family Workers | 18 | 0.2% |
| Total | 8,394 | 100.0% |
Employment Status by Age in Whitewater
According to the labor force statistics for Whitewater, out of the total population over 16 years of age (14,139), 65.2% or 9,219 individuals are in the labor force, with 3.5% or 323 of them unemployed. The age group with the highest labor force participation rate is 30 to 34 years, with 93.9% or 615 individuals in the labor force. Within the labor force, the 55 to 59 years age range has the highest percentage of unemployed individuals, with 11.1% or 36 of them being unemployed.
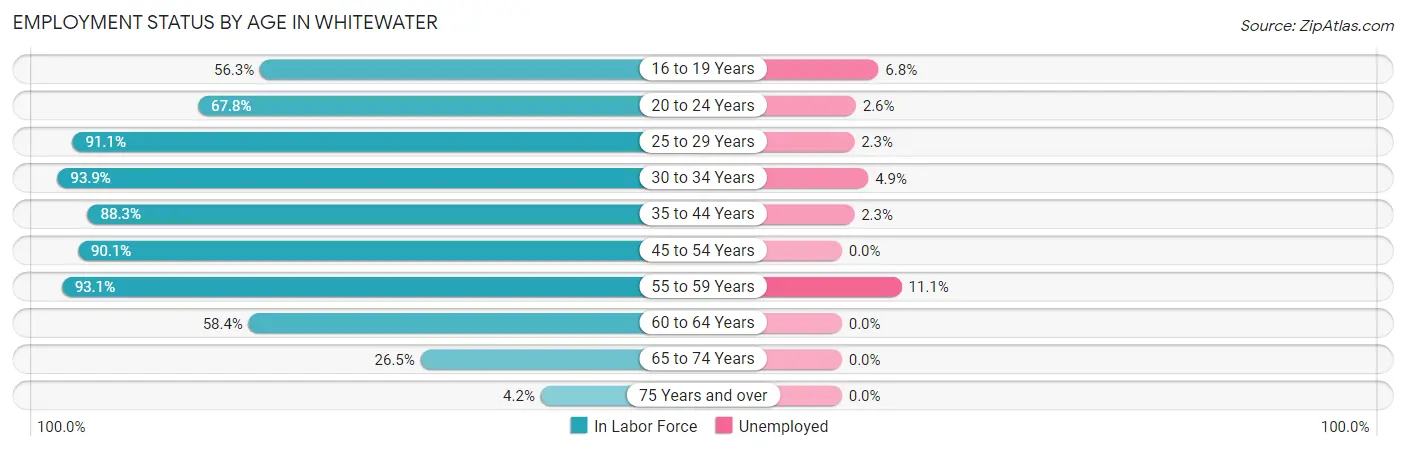
| Age Bracket | In Labor Force | Unemployed |
| 16 to 19 Years | 1,887 (56.3%) | 128 (6.8%) |
| 20 to 24 Years | 3,553 (67.8%) | 92 (2.6%) |
| 25 to 29 Years | 788 (91.1%) | 18 (2.3%) |
| 30 to 34 Years | 615 (93.9%) | 30 (4.9%) |
| 35 to 44 Years | 820 (88.3%) | 19 (2.3%) |
| 45 to 54 Years | 749 (90.1%) | 0 (0.0%) |
| 55 to 59 Years | 324 (93.1%) | 36 (11.1%) |
| 60 to 64 Years | 299 (58.4%) | 0 (0.0%) |
| 65 to 74 Years | 148 (26.5%) | 0 (0.0%) |
| 75 Years and over | 36 (4.2%) | 0 (0.0%) |
| Total | 9,219 (65.2%) | 323 (3.5%) |
Employment Status by Educational Attainment in Whitewater
According to labor force statistics for Whitewater, 86.8% of individuals (3,594) out of the total population between 25 and 64 years of age (4,140) are in the labor force, with 2.9% or 104 of them being unemployed. The group with the highest labor force participation rate are those with the educational attainment of college / associate degree, with 92.7% or 1,224 individuals in the labor force. Within the labor force, individuals with less than high school education have the highest percentage of unemployment, with 5.3% or 17 of them being unemployed.
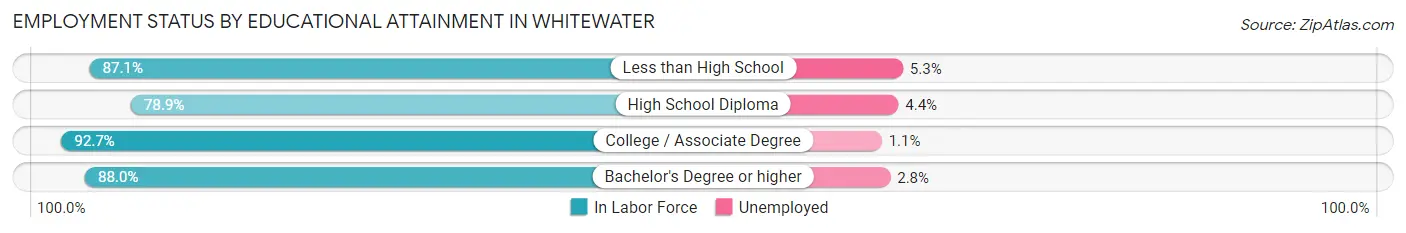
| Educational Attainment | In Labor Force | Unemployed |
| Less than High School | 323 (87.1%) | 20 (5.3%) |
| High School Diploma | 925 (78.9%) | 52 (4.4%) |
| College / Associate Degree | 1,224 (92.7%) | 15 (1.1%) |
| Bachelor's Degree or higher | 1,123 (88.0%) | 36 (2.8%) |
| Total | 3,594 (86.8%) | 120 (2.9%) |
Employment Occupations by Sex in Whitewater
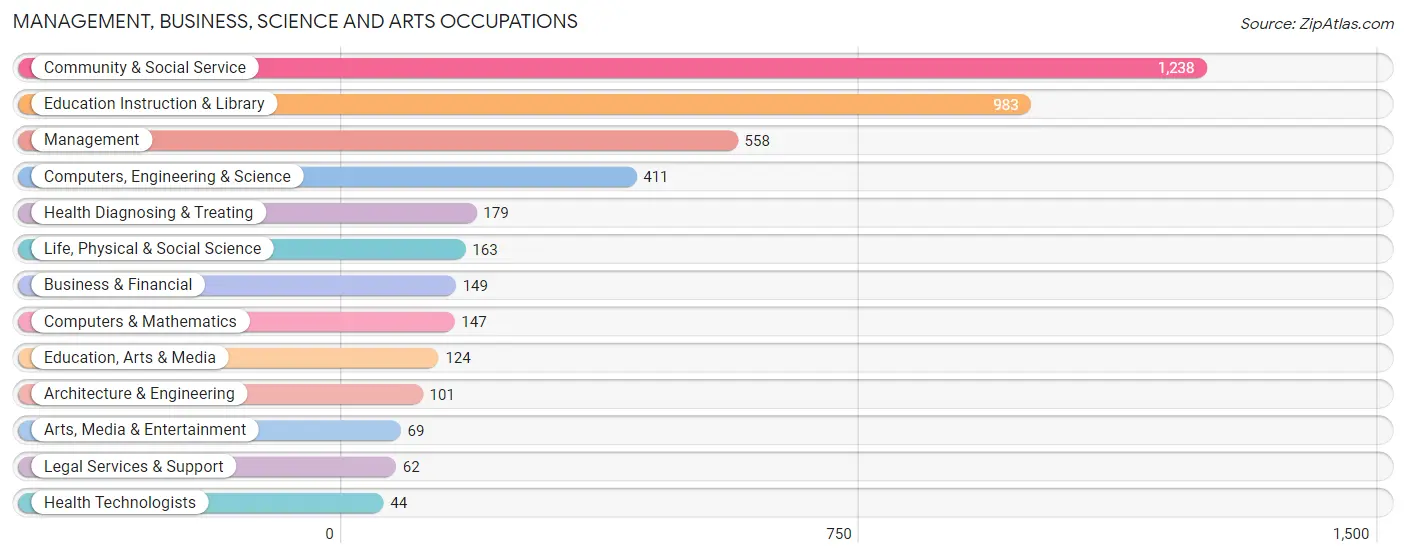
Management, Business, Science and Arts Occupations
The most common Management, Business, Science and Arts occupations in Whitewater are Community & Social Service (1,238 | 13.9%), Education Instruction & Library (983 | 11.1%), Management (558 | 6.3%), Computers, Engineering & Science (411 | 4.6%), and Health Diagnosing & Treating (179 | 2.0%).
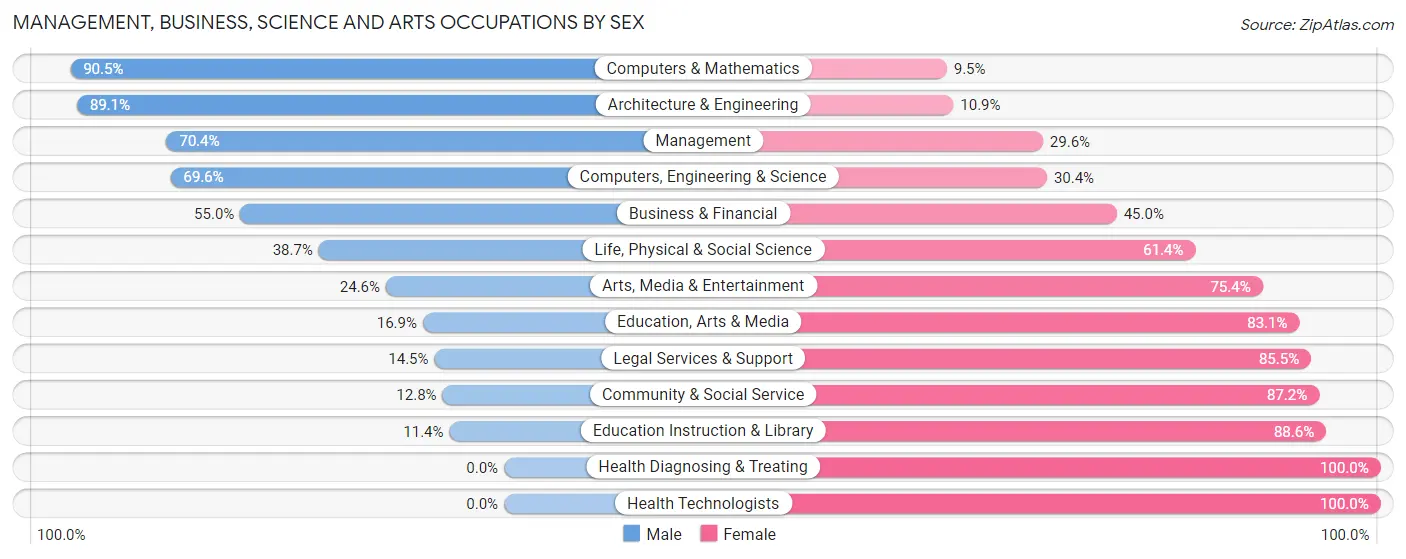
Management, Business, Science and Arts Occupations by Sex
Within the Management, Business, Science and Arts occupations in Whitewater, the most male-oriented occupations are Computers & Mathematics (90.5%), Architecture & Engineering (89.1%), and Management (70.4%), while the most female-oriented occupations are Health Diagnosing & Treating (100.0%), Health Technologists (100.0%), and Education Instruction & Library (88.6%).
| Occupation | Male | Female |
| Management | 393 (70.4%) | 165 (29.6%) |
| Business & Financial | 82 (55.0%) | 67 (45.0%) |
| Computers, Engineering & Science | 286 (69.6%) | 125 (30.4%) |
| Computers & Mathematics | 133 (90.5%) | 14 (9.5%) |
| Architecture & Engineering | 90 (89.1%) | 11 (10.9%) |
| Life, Physical & Social Science | 63 (38.7%) | 100 (61.4%) |
| Community & Social Service | 159 (12.8%) | 1,079 (87.2%) |
| Education, Arts & Media | 21 (16.9%) | 103 (83.1%) |
| Legal Services & Support | 9 (14.5%) | 53 (85.5%) |
| Education Instruction & Library | 112 (11.4%) | 871 (88.6%) |
| Arts, Media & Entertainment | 17 (24.6%) | 52 (75.4%) |
| Health Diagnosing & Treating | 0 (0.0%) | 179 (100.0%) |
| Health Technologists | 0 (0.0%) | 44 (100.0%) |
| Total (Category) | 920 (36.3%) | 1,615 (63.7%) |
| Total (Overall) | 4,389 (49.4%) | 4,500 (50.6%) |
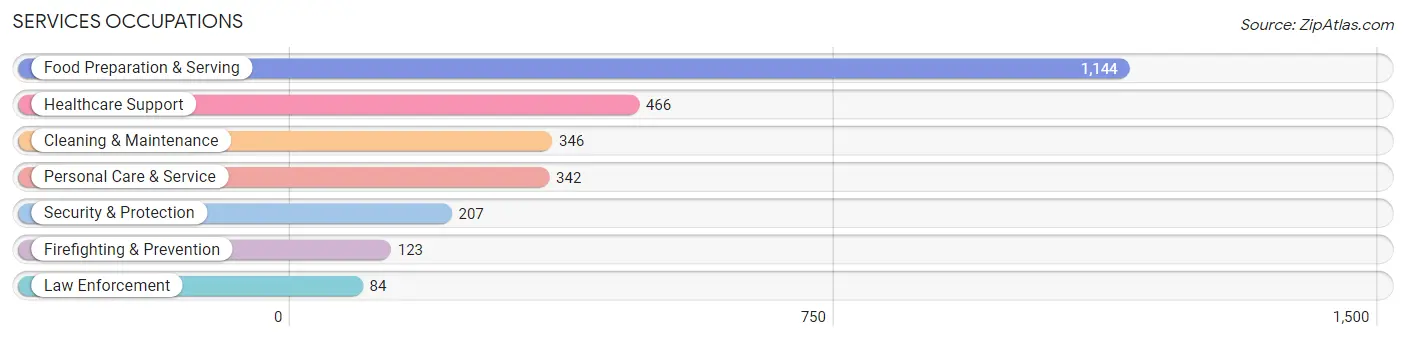
Services Occupations
The most common Services occupations in Whitewater are Food Preparation & Serving (1,144 | 12.9%), Healthcare Support (466 | 5.2%), Cleaning & Maintenance (346 | 3.9%), Personal Care & Service (342 | 3.8%), and Security & Protection (207 | 2.3%).
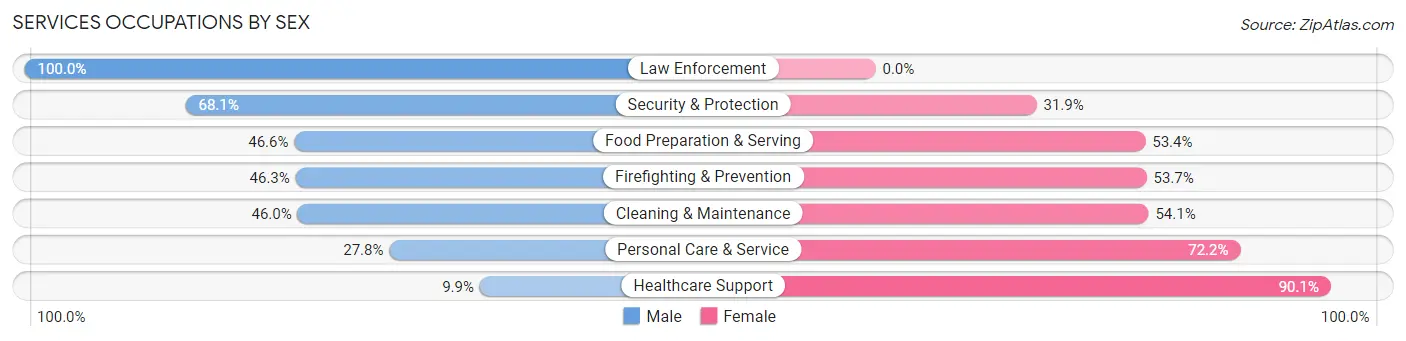
Services Occupations by Sex
Within the Services occupations in Whitewater, the most male-oriented occupations are Law Enforcement (100.0%), Security & Protection (68.1%), and Food Preparation & Serving (46.6%), while the most female-oriented occupations are Healthcare Support (90.1%), Personal Care & Service (72.2%), and Cleaning & Maintenance (54.0%).
| Occupation | Male | Female |
| Healthcare Support | 46 (9.9%) | 420 (90.1%) |
| Security & Protection | 141 (68.1%) | 66 (31.9%) |
| Firefighting & Prevention | 57 (46.3%) | 66 (53.7%) |
| Law Enforcement | 84 (100.0%) | 0 (0.0%) |
| Food Preparation & Serving | 533 (46.6%) | 611 (53.4%) |
| Cleaning & Maintenance | 159 (46.0%) | 187 (54.0%) |
| Personal Care & Service | 95 (27.8%) | 247 (72.2%) |
| Total (Category) | 974 (38.9%) | 1,531 (61.1%) |
| Total (Overall) | 4,389 (49.4%) | 4,500 (50.6%) |
Sales and Office Occupations
The most common Sales and Office occupations in Whitewater are Office & Administration (984 | 11.1%), and Sales & Related (810 | 9.1%).
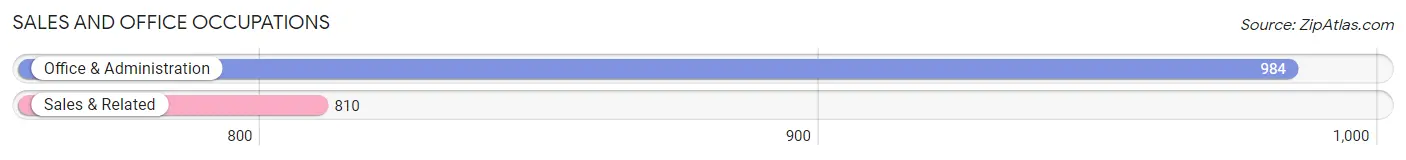
Sales and Office Occupations by Sex
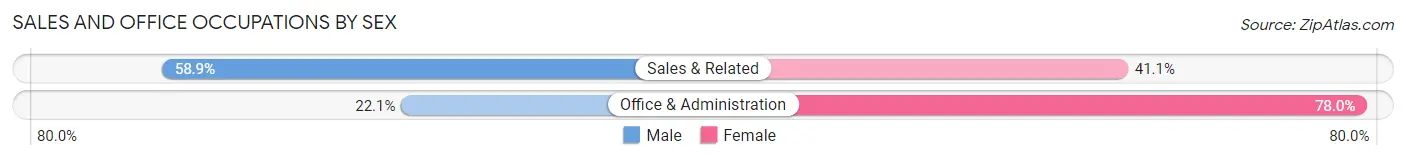
| Occupation | Male | Female |
| Sales & Related | 477 (58.9%) | 333 (41.1%) |
| Office & Administration | 217 (22.1%) | 767 (77.9%) |
| Total (Category) | 694 (38.7%) | 1,100 (61.3%) |
| Total (Overall) | 4,389 (49.4%) | 4,500 (50.6%) |
Natural Resources, Construction and Maintenance Occupations
The most common Natural Resources, Construction and Maintenance occupations in Whitewater are Installation, Maintenance & Repair (153 | 1.7%), Construction & Extraction (118 | 1.3%), and Farming, Fishing & Forestry (31 | 0.4%).
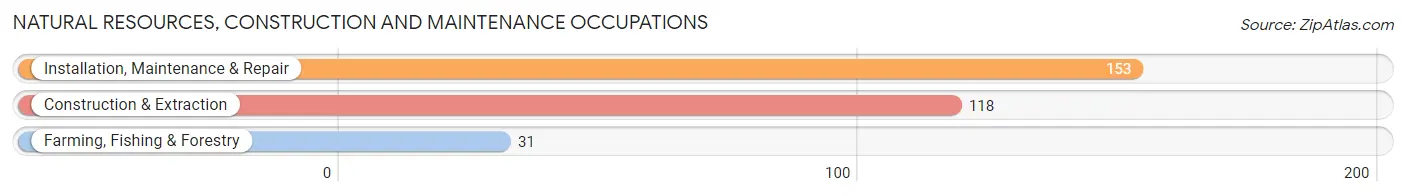
Natural Resources, Construction and Maintenance Occupations by Sex
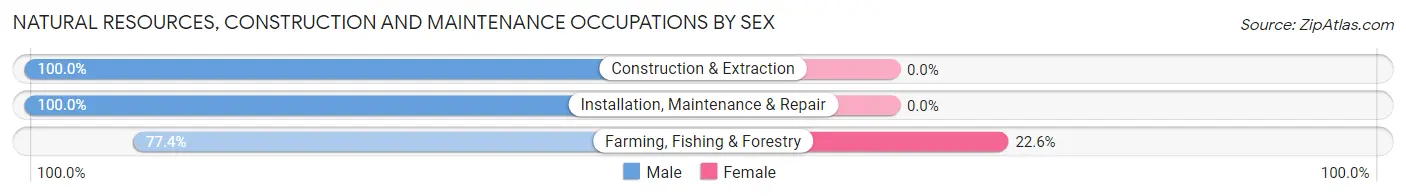
| Occupation | Male | Female |
| Farming, Fishing & Forestry | 24 (77.4%) | 7 (22.6%) |
| Construction & Extraction | 118 (100.0%) | 0 (0.0%) |
| Installation, Maintenance & Repair | 153 (100.0%) | 0 (0.0%) |
| Total (Category) | 295 (97.7%) | 7 (2.3%) |
| Total (Overall) | 4,389 (49.4%) | 4,500 (50.6%) |
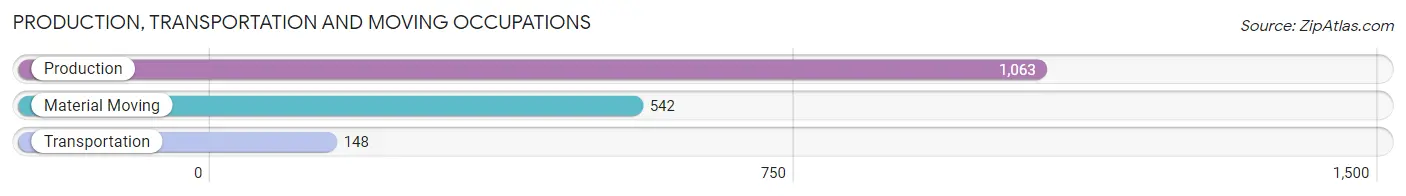
Production, Transportation and Moving Occupations
The most common Production, Transportation and Moving occupations in Whitewater are Production (1,063 | 12.0%), Material Moving (542 | 6.1%), and Transportation (148 | 1.7%).
Production, Transportation and Moving Occupations by Sex
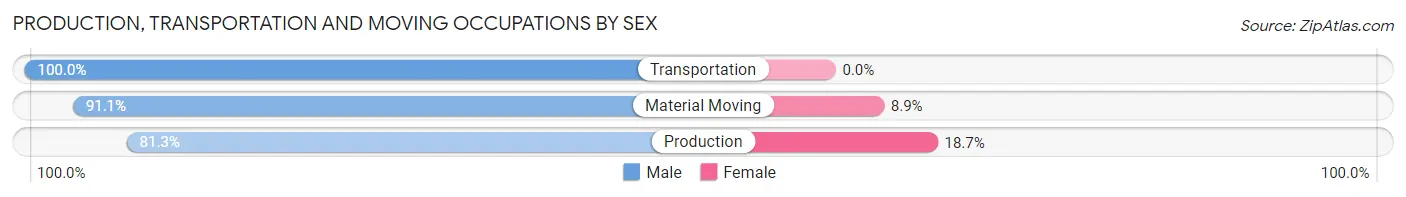
| Occupation | Male | Female |
| Production | 864 (81.3%) | 199 (18.7%) |
| Transportation | 148 (100.0%) | 0 (0.0%) |
| Material Moving | 494 (91.1%) | 48 (8.9%) |
| Total (Category) | 1,506 (85.9%) | 247 (14.1%) |
| Total (Overall) | 4,389 (49.4%) | 4,500 (50.6%) |
Employment Industries by Sex in Whitewater
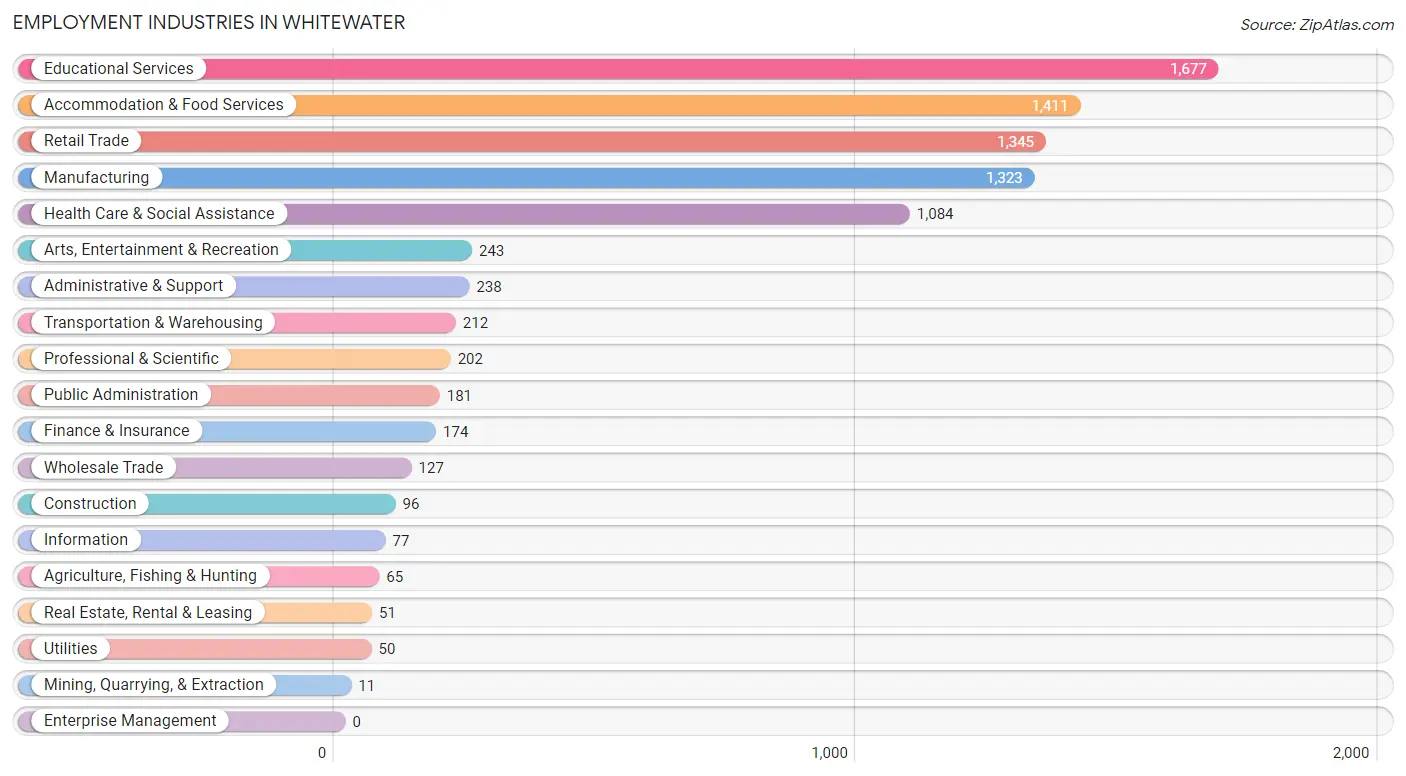
Employment Industries in Whitewater
The major employment industries in Whitewater include Educational Services (1,677 | 18.9%), Accommodation & Food Services (1,411 | 15.9%), Retail Trade (1,345 | 15.1%), Manufacturing (1,323 | 14.9%), and Health Care & Social Assistance (1,084 | 12.2%).
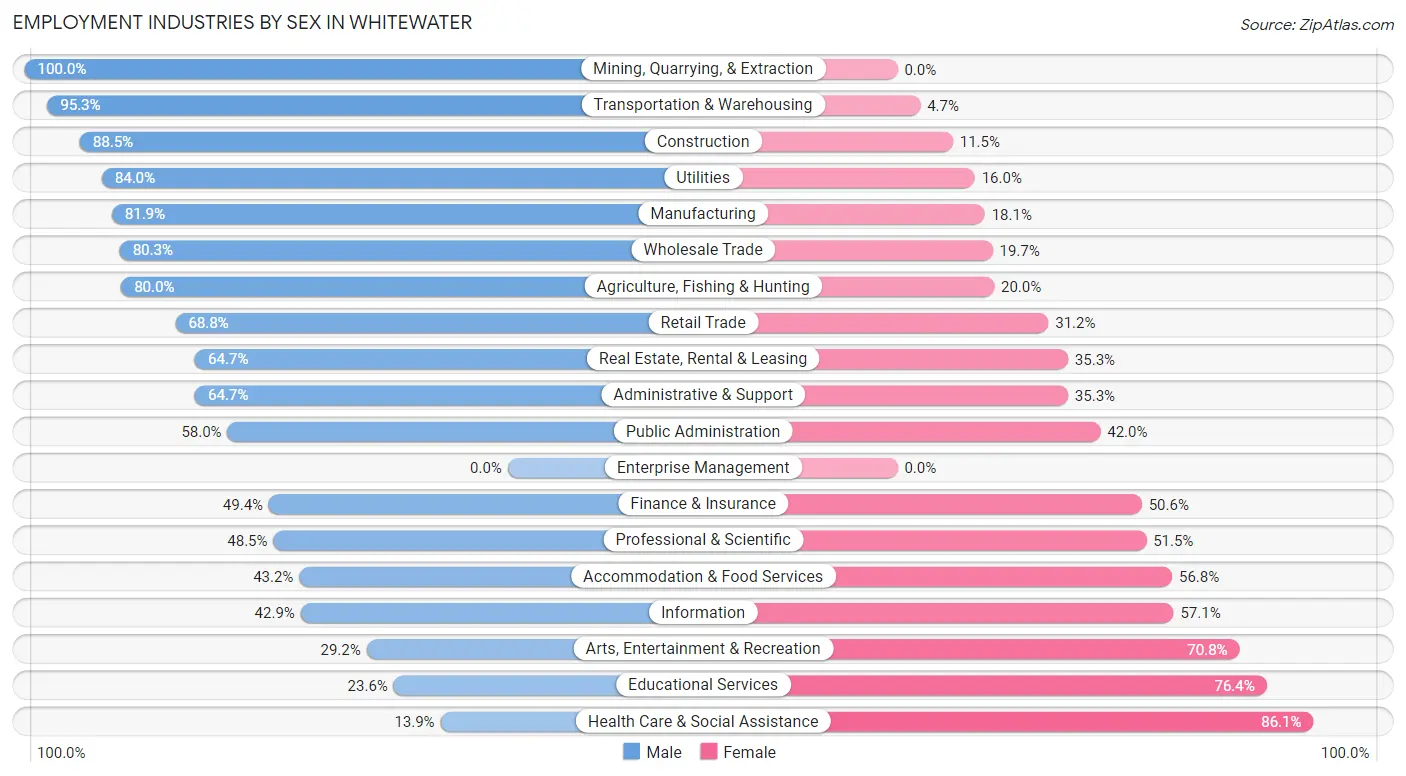
Employment Industries by Sex in Whitewater
The Whitewater industries that see more men than women are Mining, Quarrying, & Extraction (100.0%), Transportation & Warehousing (95.3%), and Construction (88.5%), whereas the industries that tend to have a higher number of women are Health Care & Social Assistance (86.1%), Educational Services (76.4%), and Arts, Entertainment & Recreation (70.8%).
| Industry | Male | Female |
| Agriculture, Fishing & Hunting | 52 (80.0%) | 13 (20.0%) |
| Mining, Quarrying, & Extraction | 11 (100.0%) | 0 (0.0%) |
| Construction | 85 (88.5%) | 11 (11.5%) |
| Manufacturing | 1,084 (81.9%) | 239 (18.1%) |
| Wholesale Trade | 102 (80.3%) | 25 (19.7%) |
| Retail Trade | 925 (68.8%) | 420 (31.2%) |
| Transportation & Warehousing | 202 (95.3%) | 10 (4.7%) |
| Utilities | 42 (84.0%) | 8 (16.0%) |
| Information | 33 (42.9%) | 44 (57.1%) |
| Finance & Insurance | 86 (49.4%) | 88 (50.6%) |
| Real Estate, Rental & Leasing | 33 (64.7%) | 18 (35.3%) |
| Professional & Scientific | 98 (48.5%) | 104 (51.5%) |
| Enterprise Management | 0 (0.0%) | 0 (0.0%) |
| Administrative & Support | 154 (64.7%) | 84 (35.3%) |
| Educational Services | 396 (23.6%) | 1,281 (76.4%) |
| Health Care & Social Assistance | 151 (13.9%) | 933 (86.1%) |
| Arts, Entertainment & Recreation | 71 (29.2%) | 172 (70.8%) |
| Accommodation & Food Services | 609 (43.2%) | 802 (56.8%) |
| Public Administration | 105 (58.0%) | 76 (42.0%) |
| Total | 4,389 (49.4%) | 4,500 (50.6%) |
Education in Whitewater
School Enrollment in Whitewater
The most common levels of schooling among the 8,775 students in Whitewater are college / undergraduate (7,340 | 83.7%), middle school (430 | 4.9%), and high school (401 | 4.6%).
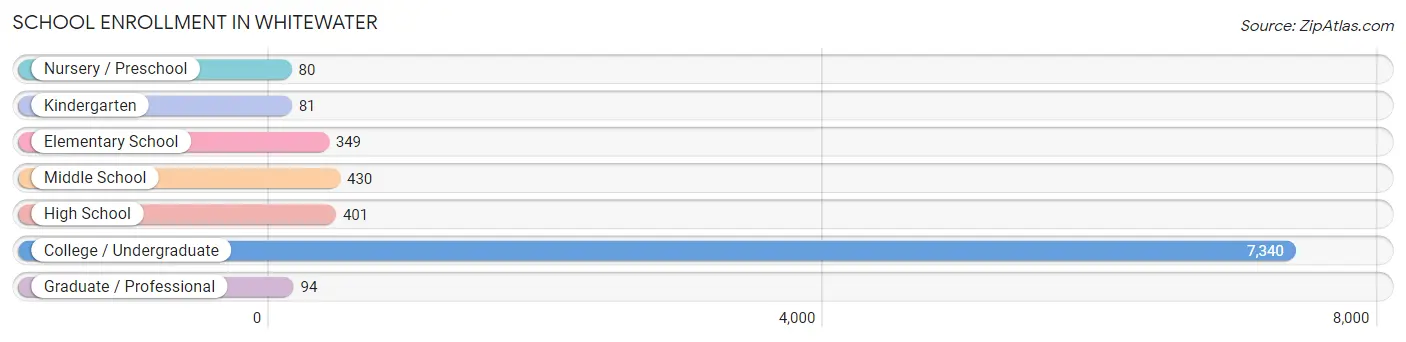
| School Level | # Students | % Students |
| Nursery / Preschool | 80 | 0.9% |
| Kindergarten | 81 | 0.9% |
| Elementary School | 349 | 4.0% |
| Middle School | 430 | 4.9% |
| High School | 401 | 4.6% |
| College / Undergraduate | 7,340 | 83.7% |
| Graduate / Professional | 94 | 1.1% |
| Total | 8,775 | 100.0% |
School Enrollment by Age by Funding Source in Whitewater
Out of a total of 8,775 students who are enrolled in schools in Whitewater, 456 (5.2%) attend a private institution, while the remaining 8,319 (94.8%) are enrolled in public schools. The age group of 15 to 17 year olds has the highest likelihood of being enrolled in private schools, with 36 (12.7% in the age bracket) enrolled. Conversely, the age group of 3 to 4 year olds has the lowest likelihood of being enrolled in a private school, with 36 (100.0% in the age bracket) attending a public institution.
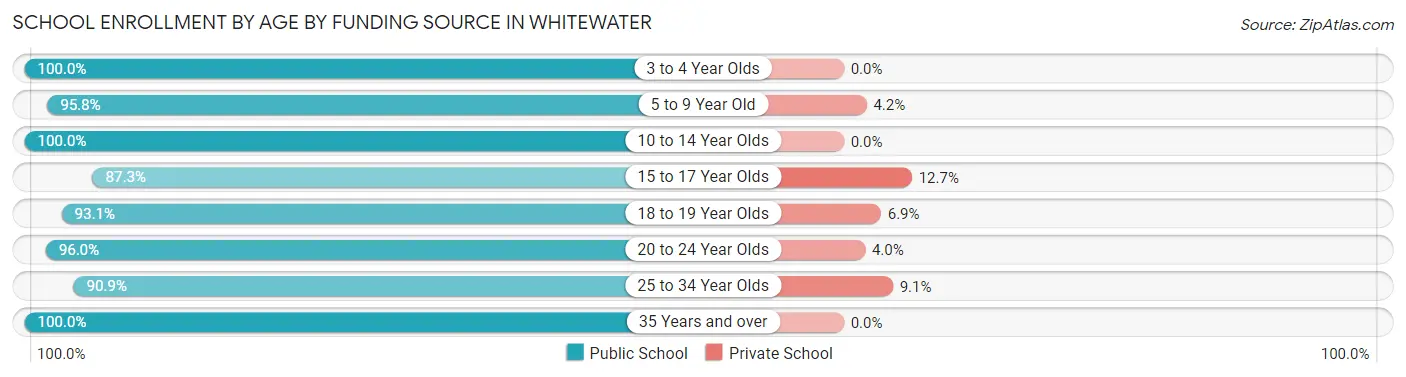
| Age Bracket | Public School | Private School |
| 3 to 4 Year Olds | 36 (100.0%) | 0 (0.0%) |
| 5 to 9 Year Old | 429 (95.8%) | 19 (4.2%) |
| 10 to 14 Year Olds | 475 (100.0%) | 0 (0.0%) |
| 15 to 17 Year Olds | 248 (87.3%) | 36 (12.7%) |
| 18 to 19 Year Olds | 2,827 (93.1%) | 210 (6.9%) |
| 20 to 24 Year Olds | 4,091 (96.0%) | 169 (4.0%) |
| 25 to 34 Year Olds | 199 (90.9%) | 20 (9.1%) |
| 35 Years and over | 16 (100.0%) | 0 (0.0%) |
| Total | 8,319 (94.8%) | 456 (5.2%) |
Educational Attainment by Field of Study in Whitewater
Education (542 | 27.5%), business (352 | 17.8%), bio, nature & agricultural (174 | 8.8%), science & technology (131 | 6.6%), and arts & humanities (128 | 6.5%) are the most common fields of study among 1,974 individuals in Whitewater who have obtained a bachelor's degree or higher.
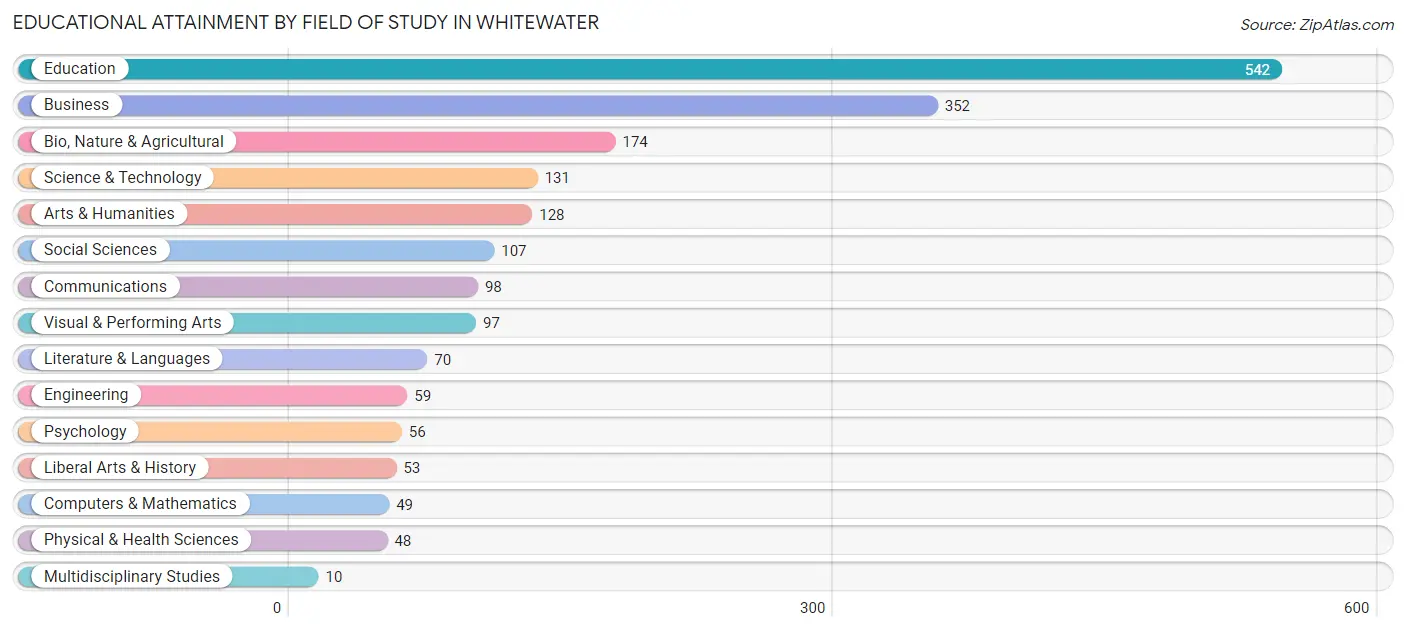
| Field of Study | # Graduates | % Graduates |
| Computers & Mathematics | 49 | 2.5% |
| Bio, Nature & Agricultural | 174 | 8.8% |
| Physical & Health Sciences | 48 | 2.4% |
| Psychology | 56 | 2.8% |
| Social Sciences | 107 | 5.4% |
| Engineering | 59 | 3.0% |
| Multidisciplinary Studies | 10 | 0.5% |
| Science & Technology | 131 | 6.6% |
| Business | 352 | 17.8% |
| Education | 542 | 27.5% |
| Literature & Languages | 70 | 3.5% |
| Liberal Arts & History | 53 | 2.7% |
| Visual & Performing Arts | 97 | 4.9% |
| Communications | 98 | 5.0% |
| Arts & Humanities | 128 | 6.5% |
| Total | 1,974 | 100.0% |
Transportation & Commute in Whitewater
Vehicle Availability by Sex in Whitewater
The most prevalent vehicle ownership categories in Whitewater are males with 2 vehicles (1,460, accounting for 40.7%) and females with 2 vehicles (1,610, making up 46.4%).
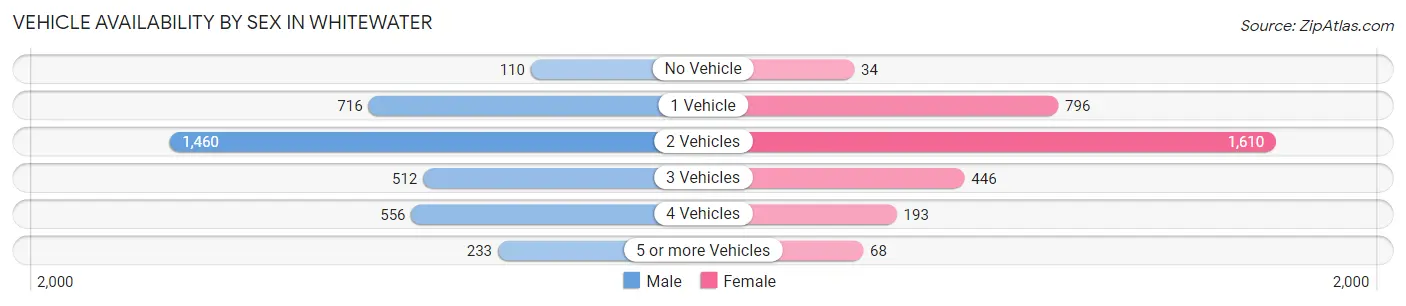
| Vehicles Available | Male | Female |
| No Vehicle | 110 (3.1%) | 34 (1.1%) |
| 1 Vehicle | 716 (20.0%) | 796 (25.3%) |
| 2 Vehicles | 1,460 (40.7%) | 1,610 (51.2%) |
| 3 Vehicles | 512 (14.3%) | 446 (14.2%) |
| 4 Vehicles | 556 (15.5%) | 193 (6.1%) |
| 5 or more Vehicles | 233 (6.5%) | 68 (2.2%) |
| Total | 3,587 (100.0%) | 3,147 (100.0%) |
Commute Time in Whitewater
The most frequently occuring commute durations in Whitewater are 5 to 9 minutes (2,280 commuters, 29.3%), 10 to 14 minutes (1,224 commuters, 15.7%), and 15 to 19 minutes (1,118 commuters, 14.4%).
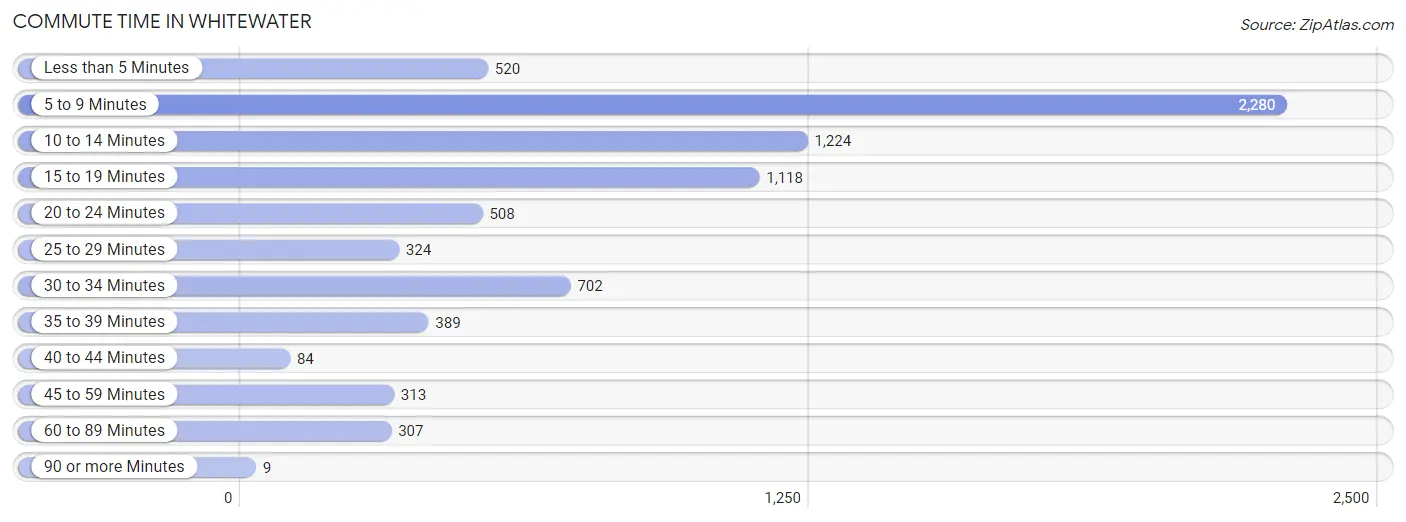
| Commute Time | # Commuters | % Commuters |
| Less than 5 Minutes | 520 | 6.7% |
| 5 to 9 Minutes | 2,280 | 29.3% |
| 10 to 14 Minutes | 1,224 | 15.7% |
| 15 to 19 Minutes | 1,118 | 14.4% |
| 20 to 24 Minutes | 508 | 6.5% |
| 25 to 29 Minutes | 324 | 4.2% |
| 30 to 34 Minutes | 702 | 9.0% |
| 35 to 39 Minutes | 389 | 5.0% |
| 40 to 44 Minutes | 84 | 1.1% |
| 45 to 59 Minutes | 313 | 4.0% |
| 60 to 89 Minutes | 307 | 4.0% |
| 90 or more Minutes | 9 | 0.1% |
Commute Time by Sex in Whitewater
The most common commute times in Whitewater are 5 to 9 minutes (1,189 commuters, 29.9%) for males and 5 to 9 minutes (1,091 commuters, 28.7%) for females.
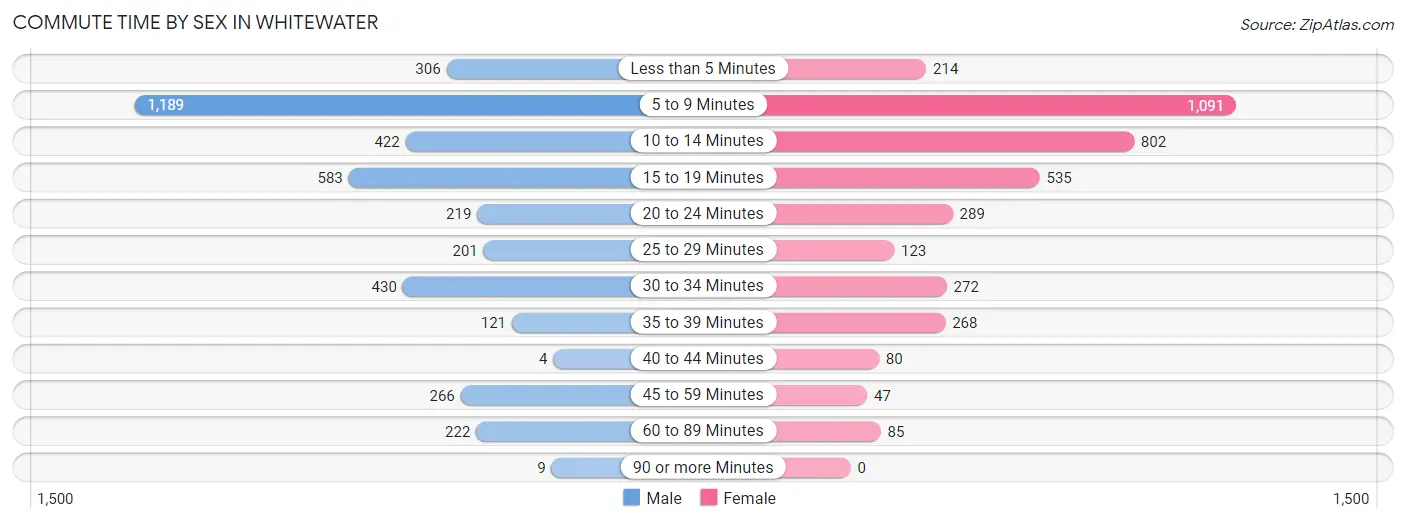
| Commute Time | Male | Female |
| Less than 5 Minutes | 306 (7.7%) | 214 (5.6%) |
| 5 to 9 Minutes | 1,189 (29.9%) | 1,091 (28.7%) |
| 10 to 14 Minutes | 422 (10.6%) | 802 (21.1%) |
| 15 to 19 Minutes | 583 (14.7%) | 535 (14.1%) |
| 20 to 24 Minutes | 219 (5.5%) | 289 (7.6%) |
| 25 to 29 Minutes | 201 (5.1%) | 123 (3.2%) |
| 30 to 34 Minutes | 430 (10.8%) | 272 (7.1%) |
| 35 to 39 Minutes | 121 (3.0%) | 268 (7.0%) |
| 40 to 44 Minutes | 4 (0.1%) | 80 (2.1%) |
| 45 to 59 Minutes | 266 (6.7%) | 47 (1.2%) |
| 60 to 89 Minutes | 222 (5.6%) | 85 (2.2%) |
| 90 or more Minutes | 9 (0.2%) | 0 (0.0%) |
Time of Departure to Work by Sex in Whitewater
The most frequent times of departure to work in Whitewater are 12:00 PM to 3:59 PM (951, 23.9%) for males and 12:00 PM to 3:59 PM (823, 21.6%) for females.
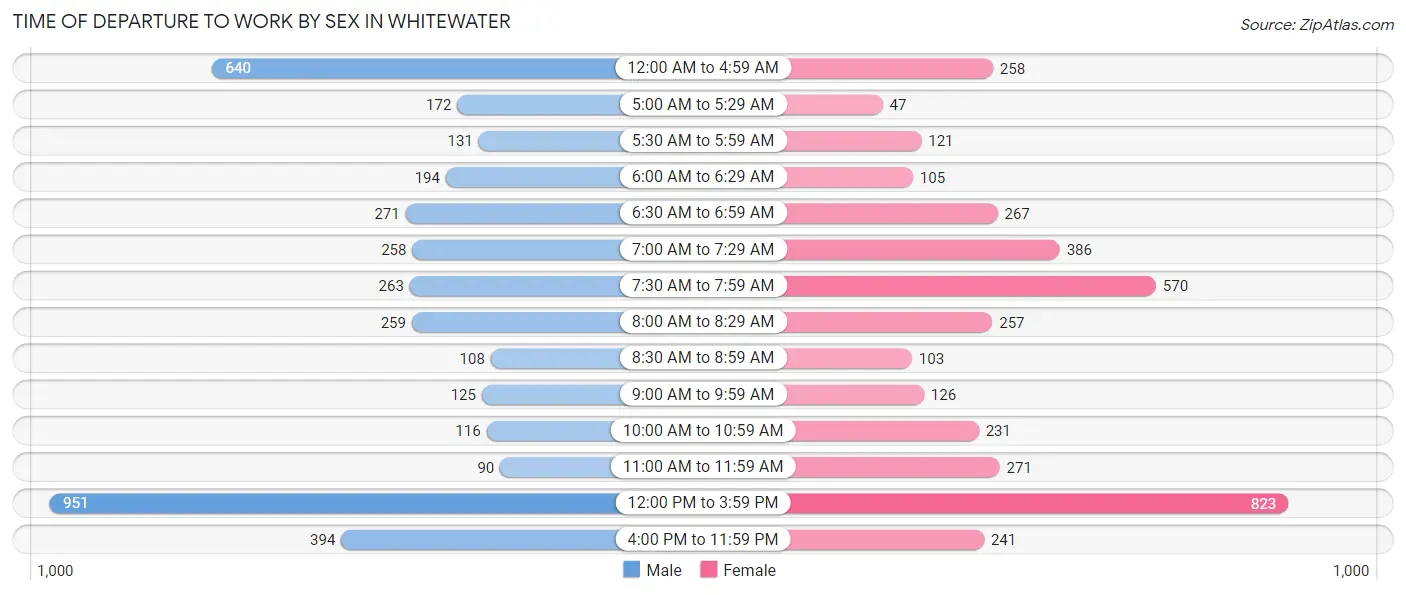
| Time of Departure | Male | Female |
| 12:00 AM to 4:59 AM | 640 (16.1%) | 258 (6.8%) |
| 5:00 AM to 5:29 AM | 172 (4.3%) | 47 (1.2%) |
| 5:30 AM to 5:59 AM | 131 (3.3%) | 121 (3.2%) |
| 6:00 AM to 6:29 AM | 194 (4.9%) | 105 (2.8%) |
| 6:30 AM to 6:59 AM | 271 (6.8%) | 267 (7.0%) |
| 7:00 AM to 7:29 AM | 258 (6.5%) | 386 (10.1%) |
| 7:30 AM to 7:59 AM | 263 (6.6%) | 570 (15.0%) |
| 8:00 AM to 8:29 AM | 259 (6.5%) | 257 (6.8%) |
| 8:30 AM to 8:59 AM | 108 (2.7%) | 103 (2.7%) |
| 9:00 AM to 9:59 AM | 125 (3.2%) | 126 (3.3%) |
| 10:00 AM to 10:59 AM | 116 (2.9%) | 231 (6.1%) |
| 11:00 AM to 11:59 AM | 90 (2.3%) | 271 (7.1%) |
| 12:00 PM to 3:59 PM | 951 (23.9%) | 823 (21.6%) |
| 4:00 PM to 11:59 PM | 394 (9.9%) | 241 (6.3%) |
| Total | 3,972 (100.0%) | 3,806 (100.0%) |
Housing Occupancy in Whitewater
Occupancy by Ownership in Whitewater
Of the total 5,021 dwellings in Whitewater, owner-occupied units account for 1,482 (29.5%), while renter-occupied units make up 3,539 (70.5%).
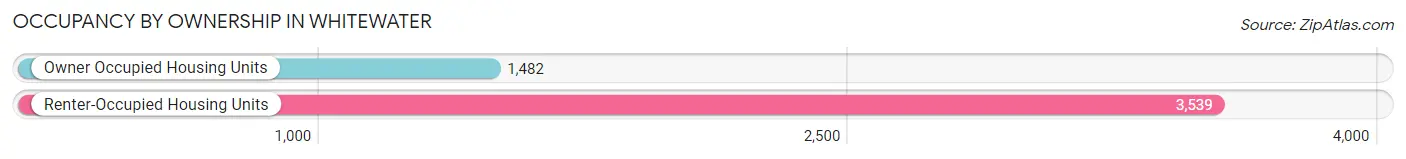
| Occupancy | # Housing Units | % Housing Units |
| Owner Occupied Housing Units | 1,482 | 29.5% |
| Renter-Occupied Housing Units | 3,539 | 70.5% |
| Total Occupied Housing Units | 5,021 | 100.0% |
Occupancy by Household Size in Whitewater
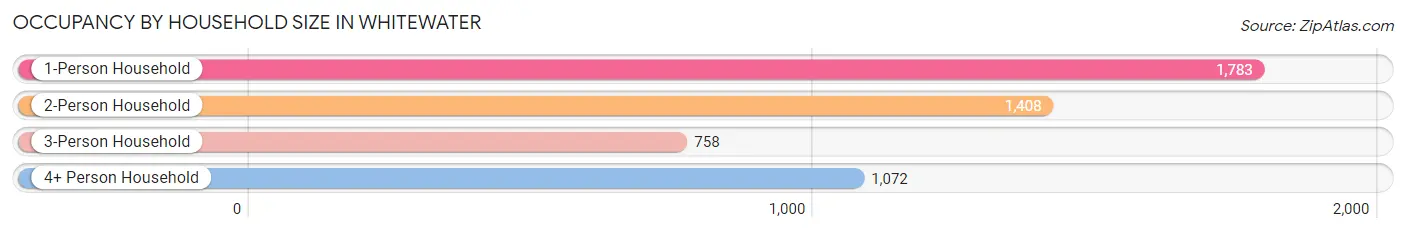
| Household Size | # Housing Units | % Housing Units |
| 1-Person Household | 1,783 | 35.5% |
| 2-Person Household | 1,408 | 28.0% |
| 3-Person Household | 758 | 15.1% |
| 4+ Person Household | 1,072 | 21.3% |
| Total Housing Units | 5,021 | 100.0% |
Occupancy by Ownership by Household Size in Whitewater
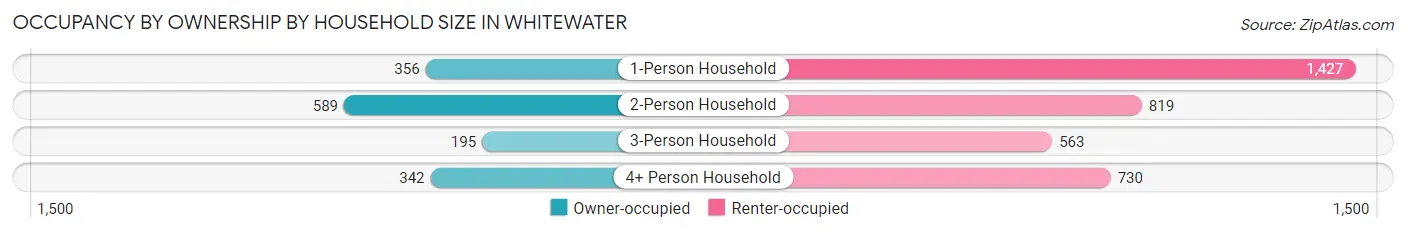
| Household Size | Owner-occupied | Renter-occupied |
| 1-Person Household | 356 (20.0%) | 1,427 (80.0%) |
| 2-Person Household | 589 (41.8%) | 819 (58.2%) |
| 3-Person Household | 195 (25.7%) | 563 (74.3%) |
| 4+ Person Household | 342 (31.9%) | 730 (68.1%) |
| Total Housing Units | 1,482 (29.5%) | 3,539 (70.5%) |
Occupancy by Educational Attainment in Whitewater
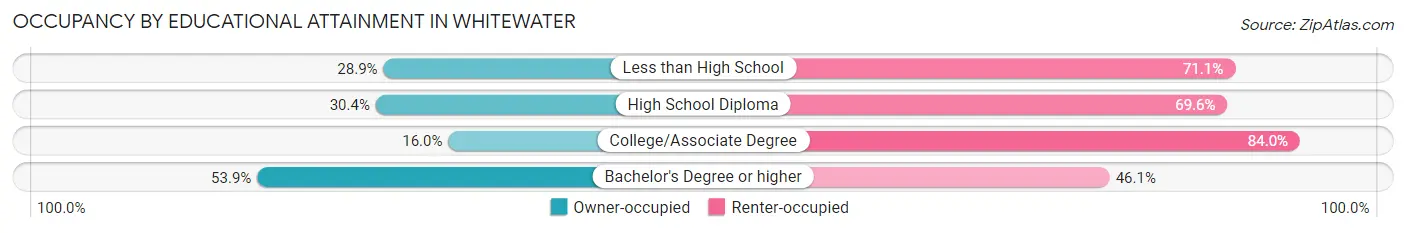
| Household Size | Owner-occupied | Renter-occupied |
| Less than High School | 58 (28.9%) | 143 (71.1%) |
| High School Diploma | 288 (30.4%) | 660 (69.6%) |
| College/Associate Degree | 401 (16.0%) | 2,107 (84.0%) |
| Bachelor's Degree or higher | 735 (53.9%) | 629 (46.1%) |
Occupancy by Age of Householder in Whitewater
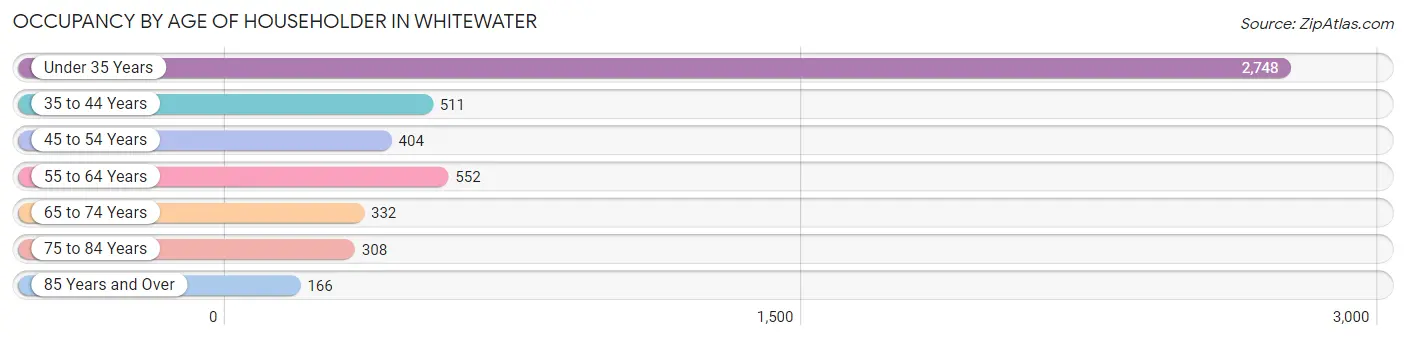
| Age Bracket | # Households | % Households |
| Under 35 Years | 2,748 | 54.7% |
| 35 to 44 Years | 511 | 10.2% |
| 45 to 54 Years | 404 | 8.1% |
| 55 to 64 Years | 552 | 11.0% |
| 65 to 74 Years | 332 | 6.6% |
| 75 to 84 Years | 308 | 6.1% |
| 85 Years and Over | 166 | 3.3% |
| Total | 5,021 | 100.0% |
Housing Finances in Whitewater
Median Income by Occupancy in Whitewater
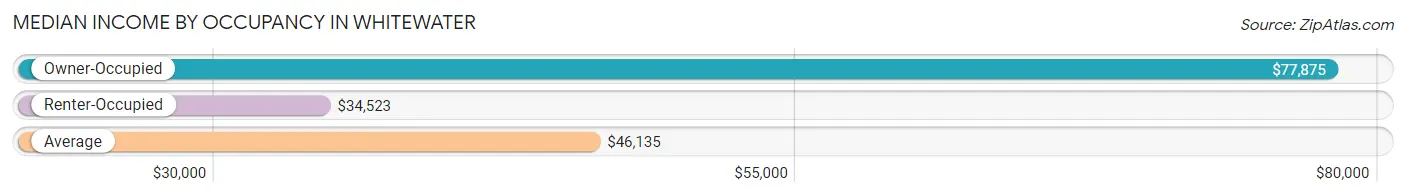
| Occupancy Type | # Households | Median Income |
| Owner-Occupied | 1,482 (29.5%) | $77,875 |
| Renter-Occupied | 3,539 (70.5%) | $34,523 |
| Average | 5,021 (100.0%) | $46,135 |
Occupancy by Householder Income Bracket in Whitewater
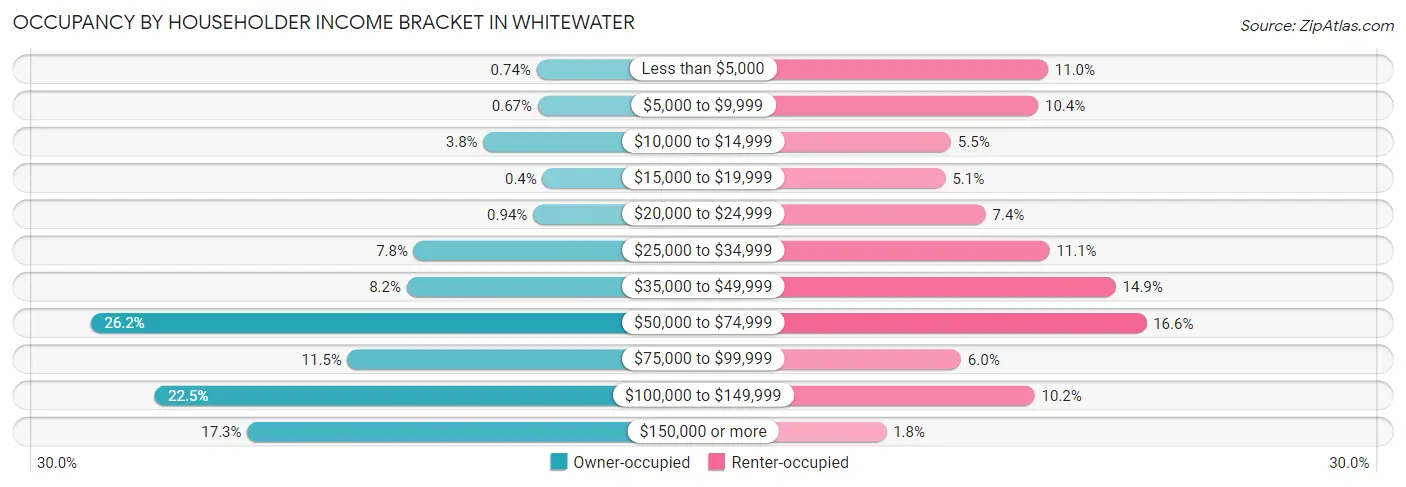
| Income Bracket | Owner-occupied | Renter-occupied |
| Less than $5,000 | 11 (0.7%) | 389 (11.0%) |
| $5,000 to $9,999 | 10 (0.7%) | 369 (10.4%) |
| $10,000 to $14,999 | 56 (3.8%) | 193 (5.4%) |
| $15,000 to $19,999 | 6 (0.4%) | 182 (5.1%) |
| $20,000 to $24,999 | 14 (0.9%) | 263 (7.4%) |
| $25,000 to $34,999 | 115 (7.8%) | 392 (11.1%) |
| $35,000 to $49,999 | 121 (8.2%) | 526 (14.9%) |
| $50,000 to $74,999 | 388 (26.2%) | 588 (16.6%) |
| $75,000 to $99,999 | 171 (11.5%) | 213 (6.0%) |
| $100,000 to $149,999 | 334 (22.5%) | 362 (10.2%) |
| $150,000 or more | 256 (17.3%) | 62 (1.8%) |
| Total | 1,482 (100.0%) | 3,539 (100.0%) |
Monthly Housing Cost Tiers in Whitewater
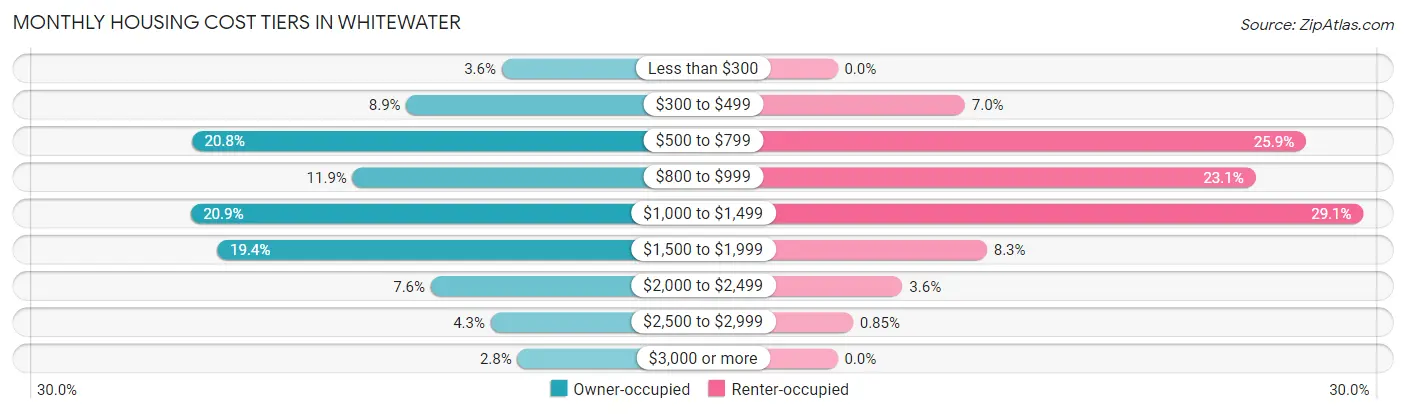
| Monthly Cost | Owner-occupied | Renter-occupied |
| Less than $300 | 54 (3.6%) | 0 (0.0%) |
| $300 to $499 | 132 (8.9%) | 249 (7.0%) |
| $500 to $799 | 308 (20.8%) | 916 (25.9%) |
| $800 to $999 | 176 (11.9%) | 817 (23.1%) |
| $1,000 to $1,499 | 309 (20.8%) | 1,028 (29.0%) |
| $1,500 to $1,999 | 287 (19.4%) | 292 (8.3%) |
| $2,000 to $2,499 | 112 (7.6%) | 127 (3.6%) |
| $2,500 to $2,999 | 63 (4.3%) | 30 (0.9%) |
| $3,000 or more | 41 (2.8%) | 0 (0.0%) |
| Total | 1,482 (100.0%) | 3,539 (100.0%) |
Physical Housing Characteristics in Whitewater
Housing Structures in Whitewater
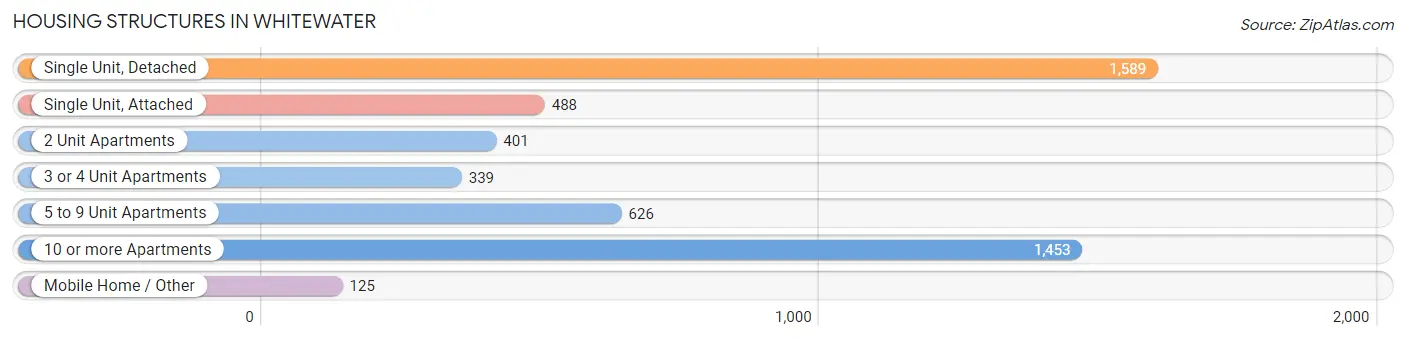
| Structure Type | # Housing Units | % Housing Units |
| Single Unit, Detached | 1,589 | 31.7% |
| Single Unit, Attached | 488 | 9.7% |
| 2 Unit Apartments | 401 | 8.0% |
| 3 or 4 Unit Apartments | 339 | 6.8% |
| 5 to 9 Unit Apartments | 626 | 12.5% |
| 10 or more Apartments | 1,453 | 28.9% |
| Mobile Home / Other | 125 | 2.5% |
| Total | 5,021 | 100.0% |
Housing Structures by Occupancy in Whitewater
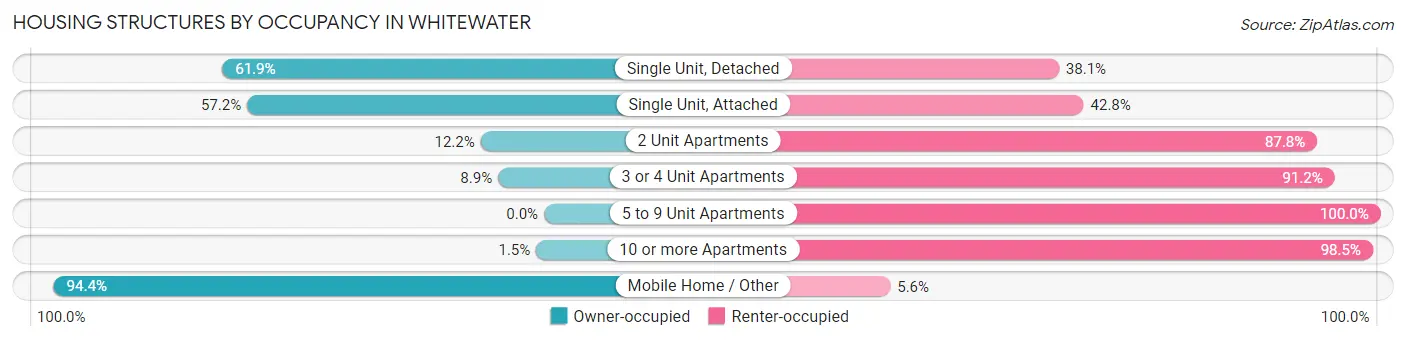
| Structure Type | Owner-occupied | Renter-occupied |
| Single Unit, Detached | 984 (61.9%) | 605 (38.1%) |
| Single Unit, Attached | 279 (57.2%) | 209 (42.8%) |
| 2 Unit Apartments | 49 (12.2%) | 352 (87.8%) |
| 3 or 4 Unit Apartments | 30 (8.8%) | 309 (91.1%) |
| 5 to 9 Unit Apartments | 0 (0.0%) | 626 (100.0%) |
| 10 or more Apartments | 22 (1.5%) | 1,431 (98.5%) |
| Mobile Home / Other | 118 (94.4%) | 7 (5.6%) |
| Total | 1,482 (29.5%) | 3,539 (70.5%) |
Housing Structures by Number of Rooms in Whitewater
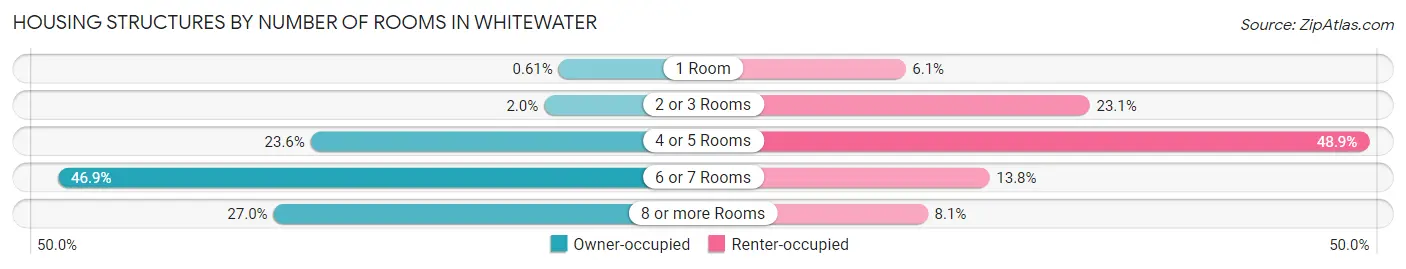
| Number of Rooms | Owner-occupied | Renter-occupied |
| 1 Room | 9 (0.6%) | 214 (6.0%) |
| 2 or 3 Rooms | 29 (2.0%) | 817 (23.1%) |
| 4 or 5 Rooms | 349 (23.5%) | 1,732 (48.9%) |
| 6 or 7 Rooms | 695 (46.9%) | 489 (13.8%) |
| 8 or more Rooms | 400 (27.0%) | 287 (8.1%) |
| Total | 1,482 (100.0%) | 3,539 (100.0%) |
Housing Structure by Heating Type in Whitewater
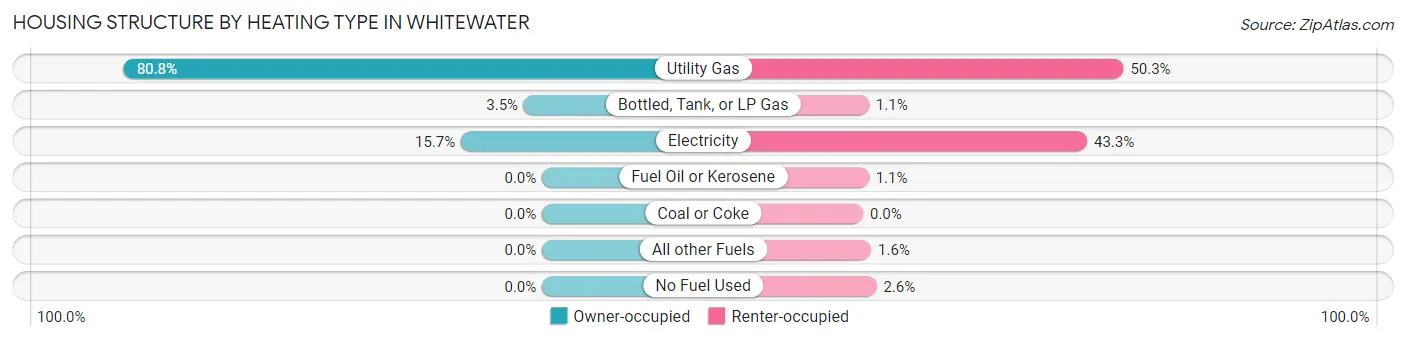
| Heating Type | Owner-occupied | Renter-occupied |
| Utility Gas | 1,198 (80.8%) | 1,781 (50.3%) |
| Bottled, Tank, or LP Gas | 52 (3.5%) | 40 (1.1%) |
| Electricity | 232 (15.7%) | 1,532 (43.3%) |
| Fuel Oil or Kerosene | 0 (0.0%) | 39 (1.1%) |
| Coal or Coke | 0 (0.0%) | 0 (0.0%) |
| All other Fuels | 0 (0.0%) | 55 (1.5%) |
| No Fuel Used | 0 (0.0%) | 92 (2.6%) |
| Total | 1,482 (100.0%) | 3,539 (100.0%) |
Household Vehicle Usage in Whitewater
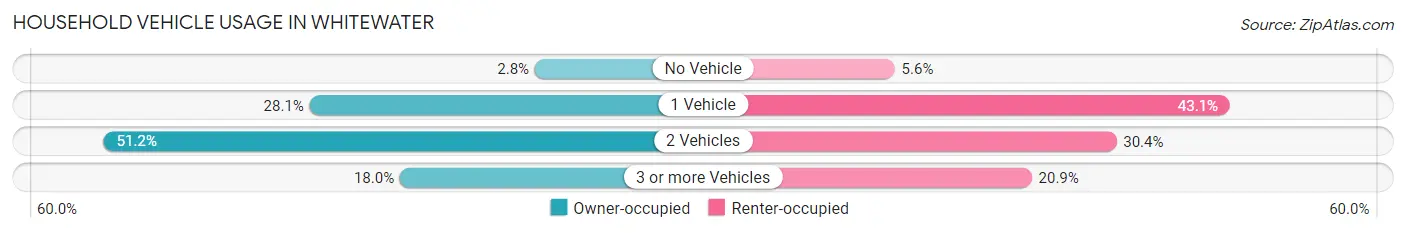
| Vehicles per Household | Owner-occupied | Renter-occupied |
| No Vehicle | 42 (2.8%) | 197 (5.6%) |
| 1 Vehicle | 416 (28.1%) | 1,526 (43.1%) |
| 2 Vehicles | 758 (51.1%) | 1,076 (30.4%) |
| 3 or more Vehicles | 266 (17.9%) | 740 (20.9%) |
| Total | 1,482 (100.0%) | 3,539 (100.0%) |
Real Estate & Mortgages in Whitewater
Real Estate and Mortgage Overview in Whitewater
| Characteristic | Without Mortgage | With Mortgage |
| Housing Units | 657 | 825 |
| Median Property Value | $186,900 | $217,300 |
| Median Household Income | $60,099 | $177 |
| Monthly Housing Costs | $659 | $41 |
| Real Estate Taxes | $3,495 | $0 |
Property Value by Mortgage Status in Whitewater
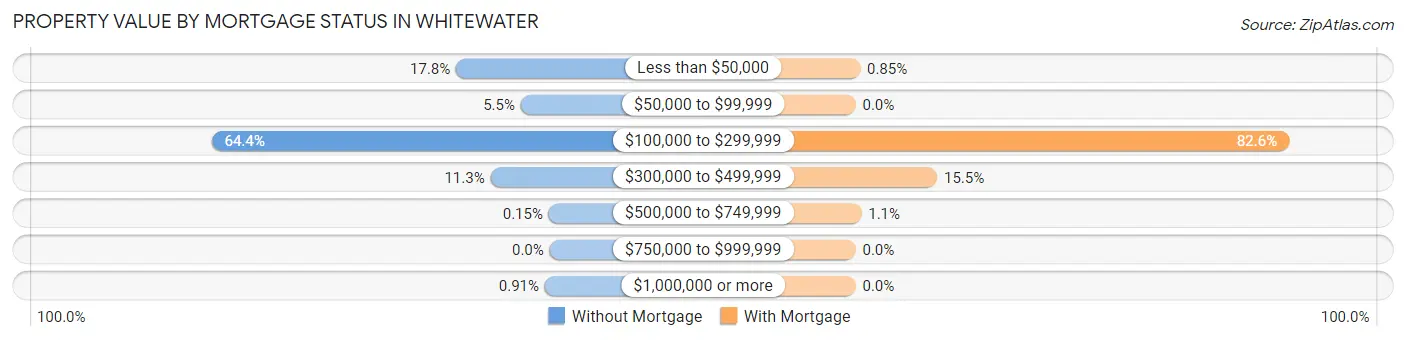
| Property Value | Without Mortgage | With Mortgage |
| Less than $50,000 | 117 (17.8%) | 7 (0.9%) |
| $50,000 to $99,999 | 36 (5.5%) | 0 (0.0%) |
| $100,000 to $299,999 | 423 (64.4%) | 681 (82.6%) |
| $300,000 to $499,999 | 74 (11.3%) | 128 (15.5%) |
| $500,000 to $749,999 | 1 (0.2%) | 9 (1.1%) |
| $750,000 to $999,999 | 0 (0.0%) | 0 (0.0%) |
| $1,000,000 or more | 6 (0.9%) | 0 (0.0%) |
| Total | 657 (100.0%) | 825 (100.0%) |
Household Income by Mortgage Status in Whitewater
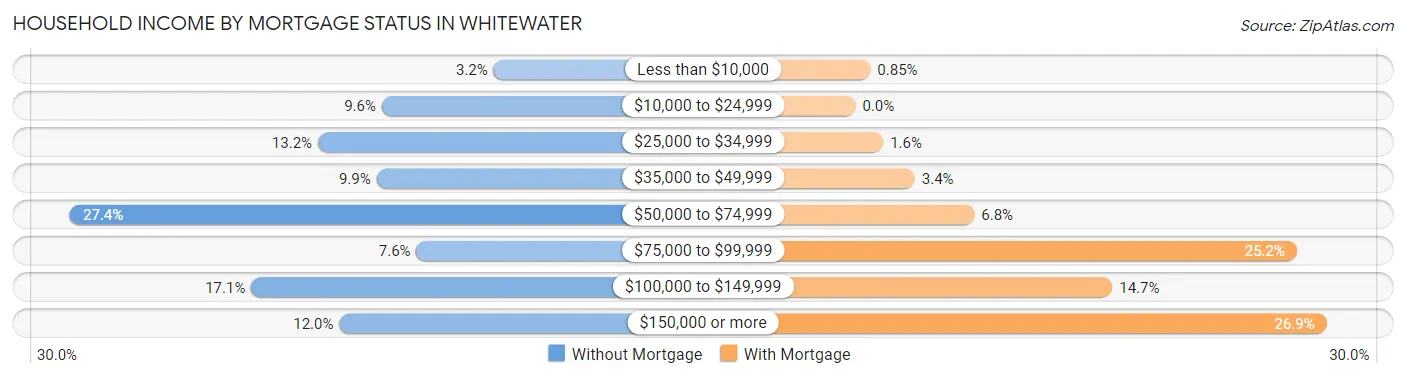
| Household Income | Without Mortgage | With Mortgage |
| Less than $10,000 | 21 (3.2%) | 7 (0.9%) |
| $10,000 to $24,999 | 63 (9.6%) | 0 (0.0%) |
| $25,000 to $34,999 | 87 (13.2%) | 13 (1.6%) |
| $35,000 to $49,999 | 65 (9.9%) | 28 (3.4%) |
| $50,000 to $74,999 | 180 (27.4%) | 56 (6.8%) |
| $75,000 to $99,999 | 50 (7.6%) | 208 (25.2%) |
| $100,000 to $149,999 | 112 (17.1%) | 121 (14.7%) |
| $150,000 or more | 79 (12.0%) | 222 (26.9%) |
| Total | 657 (100.0%) | 825 (100.0%) |
Property Value to Household Income Ratio in Whitewater
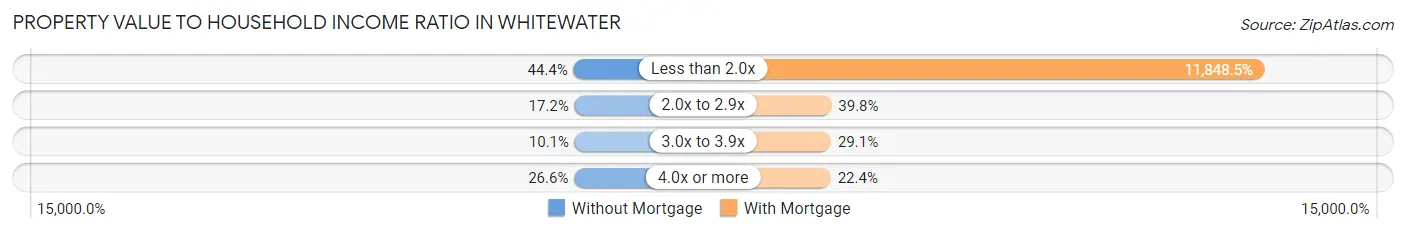
| Value-to-Income Ratio | Without Mortgage | With Mortgage |
| Less than 2.0x | 292 (44.4%) | 97,750 (11,848.5%) |
| 2.0x to 2.9x | 113 (17.2%) | 328 (39.8%) |
| 3.0x to 3.9x | 66 (10.1%) | 240 (29.1%) |
| 4.0x or more | 175 (26.6%) | 185 (22.4%) |
| Total | 657 (100.0%) | 825 (100.0%) |
Real Estate Taxes by Mortgage Status in Whitewater
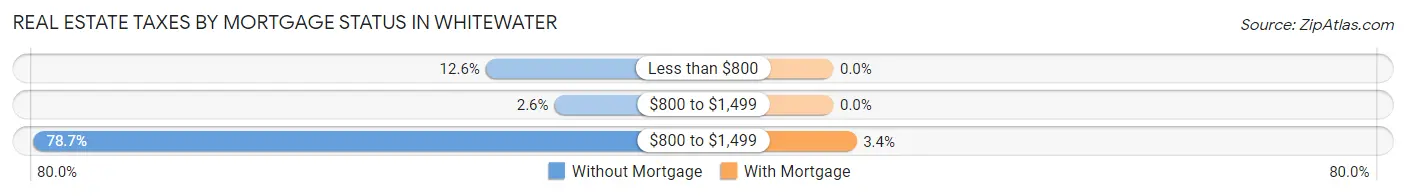
| Property Taxes | Without Mortgage | With Mortgage |
| Less than $800 | 83 (12.6%) | 0 (0.0%) |
| $800 to $1,499 | 17 (2.6%) | 0 (0.0%) |
| $800 to $1,499 | 517 (78.7%) | 28 (3.4%) |
| Total | 657 (100.0%) | 825 (100.0%) |
Health & Disability in Whitewater
Health Insurance Coverage by Age in Whitewater
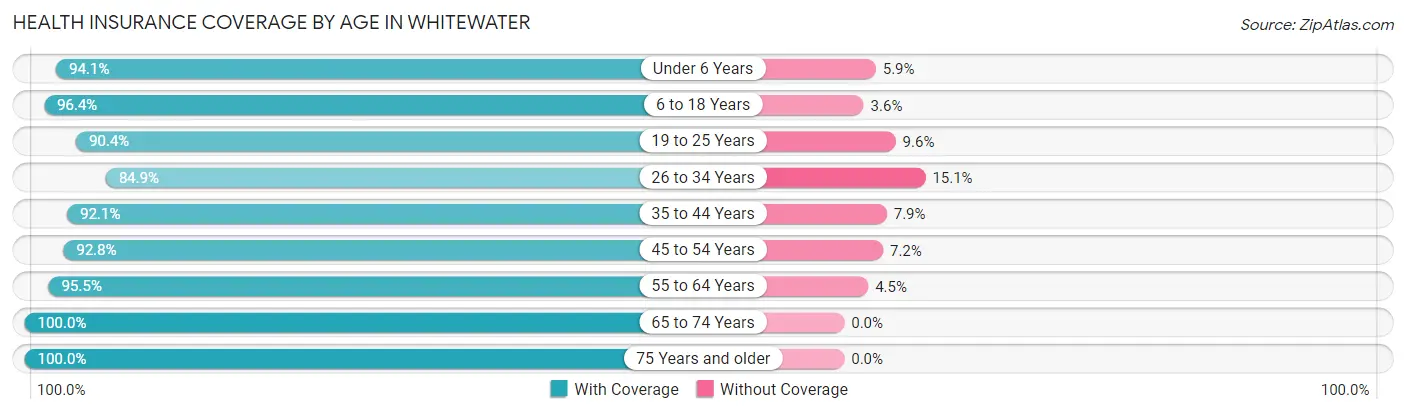
| Age Bracket | With Coverage | Without Coverage |
| Under 6 Years | 593 (94.1%) | 37 (5.9%) |
| 6 to 18 Years | 2,616 (96.4%) | 98 (3.6%) |
| 19 to 25 Years | 6,340 (90.4%) | 672 (9.6%) |
| 26 to 34 Years | 1,139 (84.9%) | 203 (15.1%) |
| 35 to 44 Years | 849 (92.1%) | 73 (7.9%) |
| 45 to 54 Years | 771 (92.8%) | 60 (7.2%) |
| 55 to 64 Years | 814 (95.5%) | 38 (4.5%) |
| 65 to 74 Years | 554 (100.0%) | 0 (0.0%) |
| 75 Years and older | 756 (100.0%) | 0 (0.0%) |
| Total | 14,432 (92.4%) | 1,181 (7.6%) |
Health Insurance Coverage by Citizenship Status in Whitewater
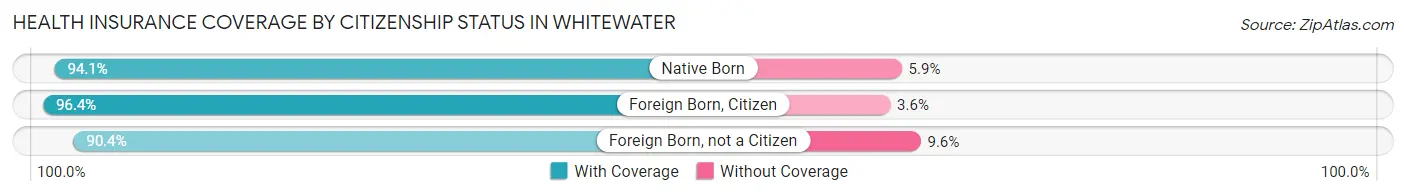
| Citizenship Status | With Coverage | Without Coverage |
| Native Born | 593 (94.1%) | 37 (5.9%) |
| Foreign Born, Citizen | 2,616 (96.4%) | 98 (3.6%) |
| Foreign Born, not a Citizen | 6,340 (90.4%) | 672 (9.6%) |
Health Insurance Coverage by Household Income in Whitewater
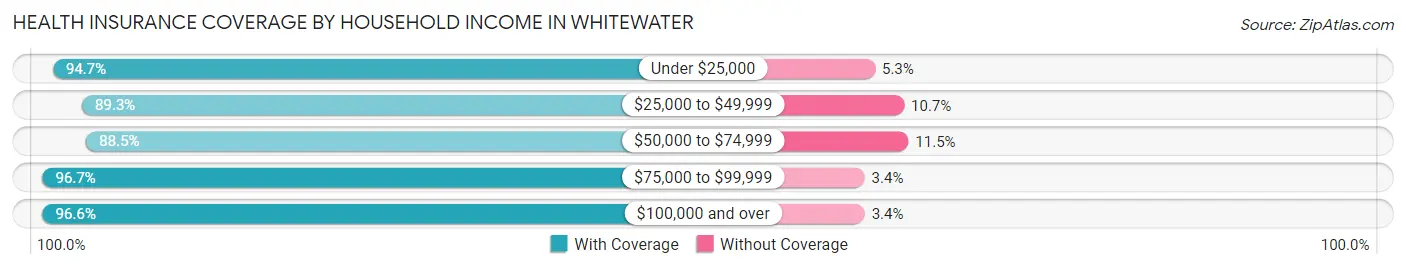
| Household Income | With Coverage | Without Coverage |
| Under $25,000 | 2,184 (94.7%) | 122 (5.3%) |
| $25,000 to $49,999 | 2,486 (89.3%) | 299 (10.7%) |
| $50,000 to $74,999 | 2,331 (88.5%) | 304 (11.5%) |
| $75,000 to $99,999 | 893 (96.7%) | 31 (3.4%) |
| $100,000 and over | 3,136 (96.6%) | 109 (3.4%) |
Public vs Private Health Insurance Coverage by Age in Whitewater
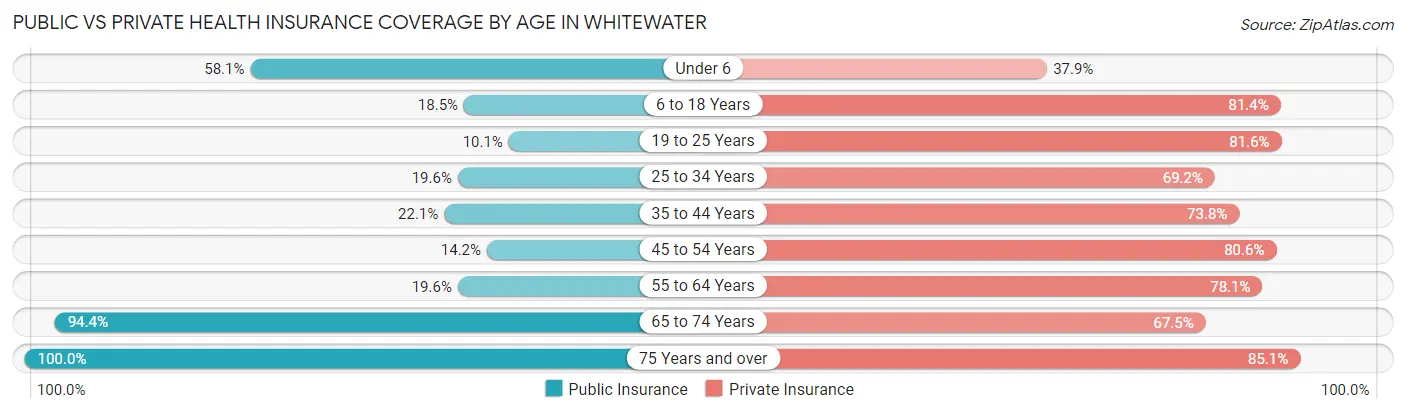
| Age Bracket | Public Insurance | Private Insurance |
| Under 6 | 366 (58.1%) | 239 (37.9%) |
| 6 to 18 Years | 501 (18.5%) | 2,210 (81.4%) |
| 19 to 25 Years | 711 (10.1%) | 5,721 (81.6%) |
| 25 to 34 Years | 263 (19.6%) | 929 (69.2%) |
| 35 to 44 Years | 204 (22.1%) | 680 (73.8%) |
| 45 to 54 Years | 118 (14.2%) | 670 (80.6%) |
| 55 to 64 Years | 167 (19.6%) | 665 (78.0%) |
| 65 to 74 Years | 523 (94.4%) | 374 (67.5%) |
| 75 Years and over | 756 (100.0%) | 643 (85.1%) |
| Total | 3,609 (23.1%) | 12,131 (77.7%) |
Disability Status by Sex by Age in Whitewater
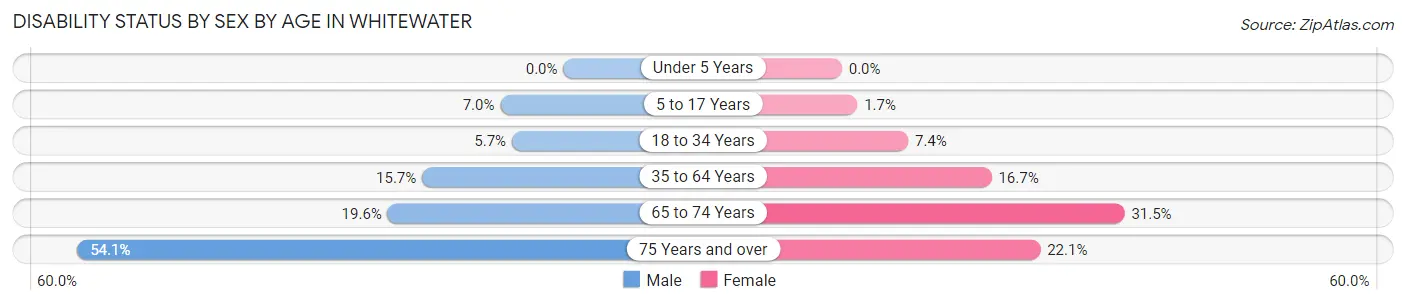
| Age Bracket | Male | Female |
| Under 5 Years | 0 (0.0%) | 0 (0.0%) |
| 5 to 17 Years | 51 (7.0%) | 10 (1.7%) |
| 18 to 34 Years | 300 (5.7%) | 345 (7.4%) |
| 35 to 64 Years | 205 (15.7%) | 217 (16.7%) |
| 65 to 74 Years | 45 (19.6%) | 102 (31.5%) |
| 75 Years and over | 157 (54.1%) | 103 (22.1%) |
Disability Class by Sex by Age in Whitewater
Disability Class: Hearing Difficulty
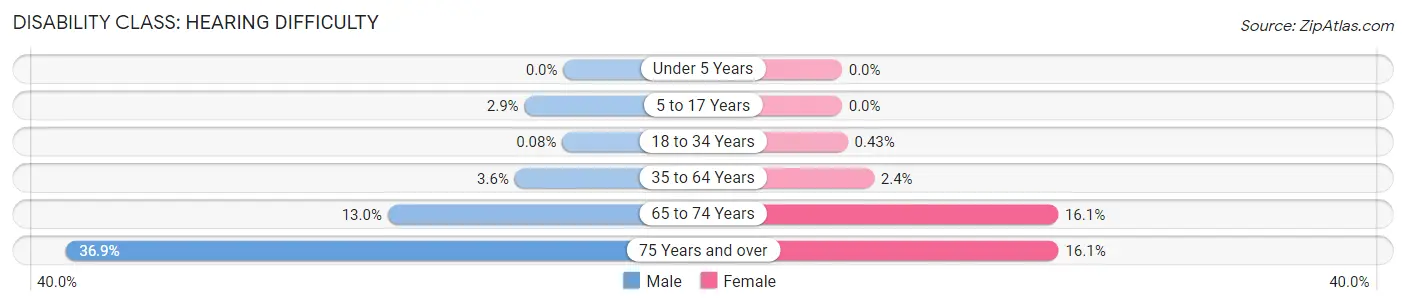
| Age Bracket | Male | Female |
| Under 5 Years | 0 (0.0%) | 0 (0.0%) |
| 5 to 17 Years | 21 (2.9%) | 0 (0.0%) |
| 18 to 34 Years | 4 (0.1%) | 20 (0.4%) |
| 35 to 64 Years | 47 (3.6%) | 31 (2.4%) |
| 65 to 74 Years | 30 (13.0%) | 52 (16.1%) |
| 75 Years and over | 107 (36.9%) | 75 (16.1%) |
Disability Class: Vision Difficulty
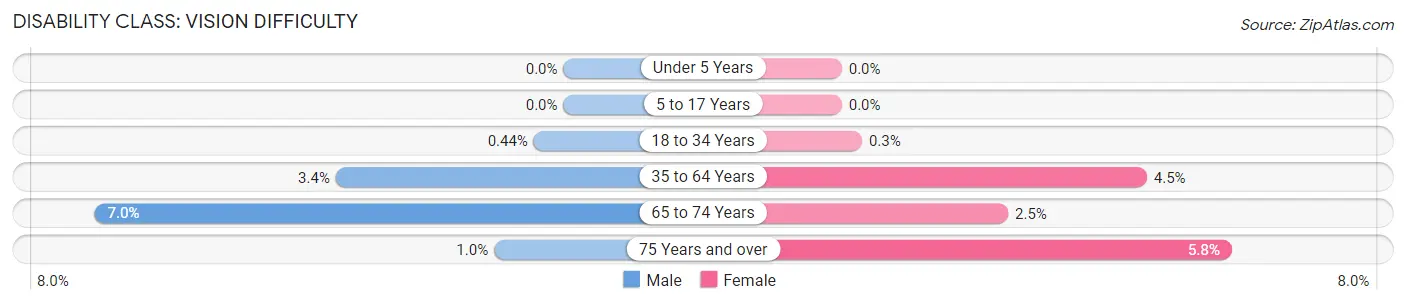
| Age Bracket | Male | Female |
| Under 5 Years | 0 (0.0%) | 0 (0.0%) |
| 5 to 17 Years | 0 (0.0%) | 0 (0.0%) |
| 18 to 34 Years | 23 (0.4%) | 14 (0.3%) |
| 35 to 64 Years | 44 (3.4%) | 59 (4.5%) |
| 65 to 74 Years | 16 (7.0%) | 8 (2.5%) |
| 75 Years and over | 3 (1.0%) | 27 (5.8%) |
Disability Class: Cognitive Difficulty
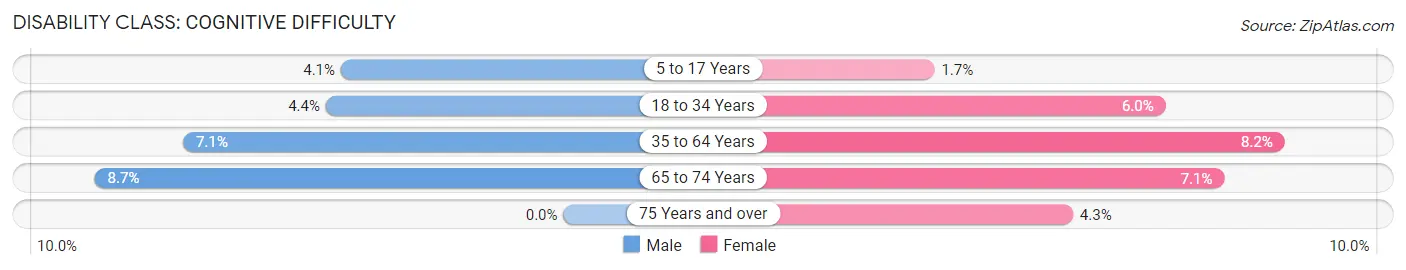
| Age Bracket | Male | Female |
| 5 to 17 Years | 30 (4.1%) | 10 (1.7%) |
| 18 to 34 Years | 231 (4.4%) | 281 (6.0%) |
| 35 to 64 Years | 92 (7.1%) | 107 (8.2%) |
| 65 to 74 Years | 20 (8.7%) | 23 (7.1%) |
| 75 Years and over | 0 (0.0%) | 20 (4.3%) |
Disability Class: Ambulatory Difficulty
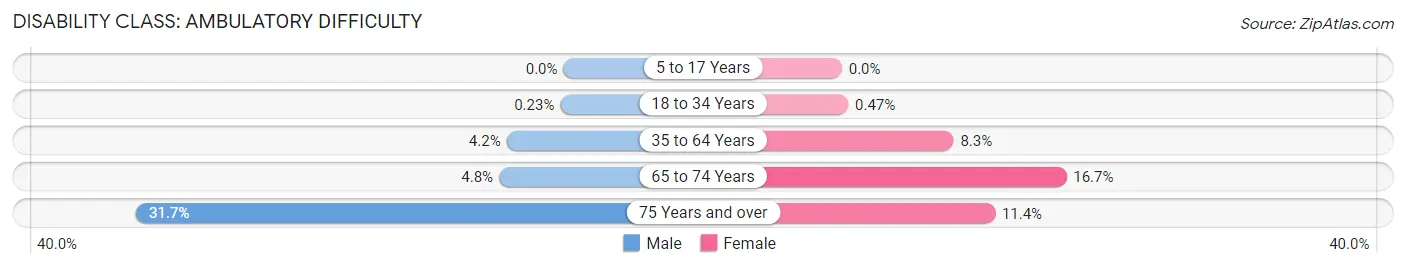
| Age Bracket | Male | Female |
| 5 to 17 Years | 0 (0.0%) | 0 (0.0%) |
| 18 to 34 Years | 12 (0.2%) | 22 (0.5%) |
| 35 to 64 Years | 55 (4.2%) | 108 (8.3%) |
| 65 to 74 Years | 11 (4.8%) | 54 (16.7%) |
| 75 Years and over | 92 (31.7%) | 53 (11.4%) |
Disability Class: Self-Care Difficulty
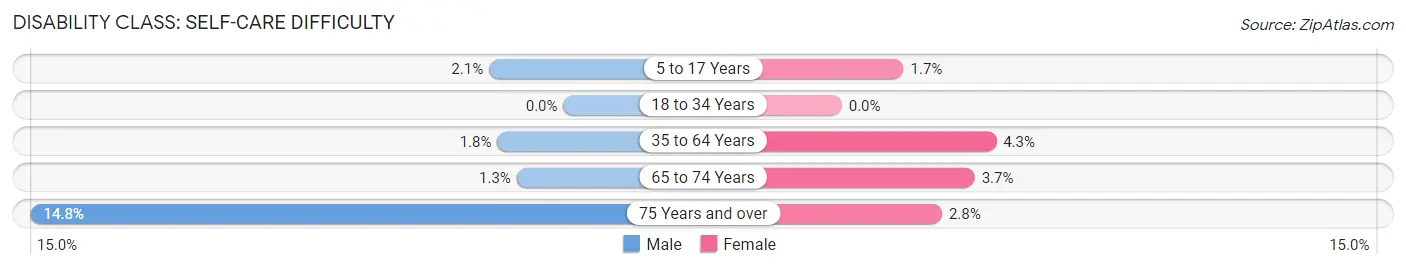
| Age Bracket | Male | Female |
| 5 to 17 Years | 15 (2.1%) | 10 (1.7%) |
| 18 to 34 Years | 0 (0.0%) | 0 (0.0%) |
| 35 to 64 Years | 24 (1.8%) | 56 (4.3%) |
| 65 to 74 Years | 3 (1.3%) | 12 (3.7%) |
| 75 Years and over | 43 (14.8%) | 13 (2.8%) |
Technology Access in Whitewater
Computing Device Access in Whitewater
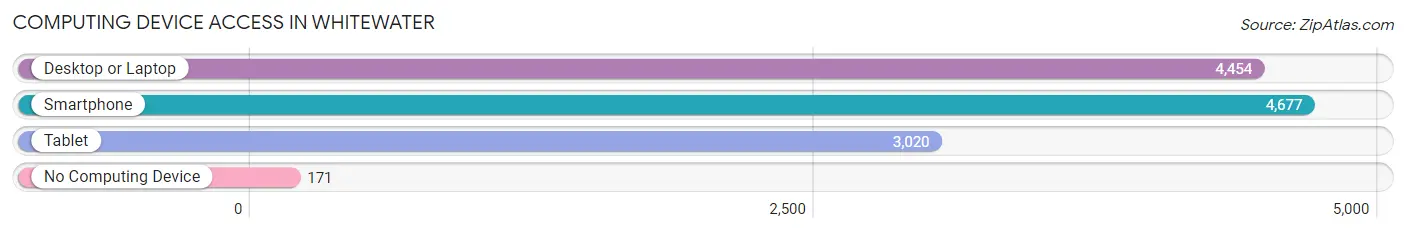
| Device Type | # Households | % Households |
| Desktop or Laptop | 4,454 | 88.7% |
| Smartphone | 4,677 | 93.1% |
| Tablet | 3,020 | 60.2% |
| No Computing Device | 171 | 3.4% |
| Total | 5,021 | 100.0% |
Internet Access in Whitewater
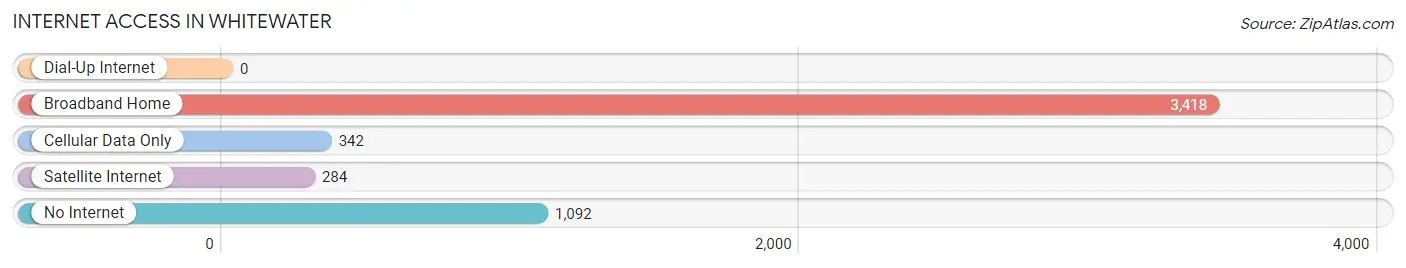
| Internet Type | # Households | % Households |
| Dial-Up Internet | 0 | 0.0% |
| Broadband Home | 3,418 | 68.1% |
| Cellular Data Only | 342 | 6.8% |
| Satellite Internet | 284 | 5.7% |
| No Internet | 1,092 | 21.7% |
| Total | 5,021 | 100.0% |
Whitewater Summary
Whitewater, Wisconsin is a city located in Walworth County, Wisconsin, United States. It is situated on the banks of the Crawfish River, approximately 45 miles southwest of Milwaukee and 60 miles northeast of Madison. The city is home to the University of Wisconsin-Whitewater, which is part of the University of Wisconsin System. As of the 2010 census, the city had a population of 14,390.
History
The area that is now Whitewater was first settled in 1837 by a group of settlers from New York. The settlers named the area Whitewater after the nearby river. The city was officially incorporated in 1868.
In the late 19th century, Whitewater was a popular tourist destination due to its natural beauty and proximity to Milwaukee. The city was home to several resorts, including the Whitewater Hotel, which was built in 1871.
In the early 20th century, the city began to grow rapidly due to the presence of the University of Wisconsin-Whitewater, which was founded in 1868. The university has since become one of the largest employers in the city.
Geography
Whitewater is located at 42°51'N 88°47'W (42.851, -88.769). According to the United States Census Bureau, the city has a total area of 8.2 square miles (21.2 km2), of which 8.1 square miles (21.0 km2) is land and 0.1 square miles (0.2 km2) is water.
The city is located in the Kettle Moraine region of Wisconsin, which is characterized by rolling hills and glacial lakes. The Crawfish River runs through the city, and there are several small lakes in the area, including Lake LaGrange and Lake Como.
Economy
The economy of Whitewater is largely driven by the University of Wisconsin-Whitewater, which is the city's largest employer. Other major employers in the city include the Whitewater Unified School District, the City of Whitewater, and the Whitewater Medical Center.
The city is also home to several small businesses, including restaurants, retail stores, and service providers. The city is also home to several manufacturing companies, including the Whitewater Manufacturing Company, which produces plastic products.
Demographics
As of the 2010 census, there were 14,390 people, 5,845 households, and 2,945 families residing in the city. The population density was 1,769.3 people per square mile (683.3/km2). There were 6,093 housing units at an average density of 751.3 per square mile (290.2/km2). The racial makeup of the city was 92.2% White, 2.7% African American, 0.3% Native American, 2.2% Asian, 0.7% from other races, and 2.0% from two or more races. Hispanic or Latino of any race were 2.7% of the population.
There were 5,845 households, out of which 19.2% had children under the age of 18 living with them, 37.2% were married couples living together, 8.3% had a female householder with no husband present, and 51.2% were non-families. 36.2% of all households were made up of individuals, and 11.2% had someone living alone who was 65 years of age or older. The average household size was 2.17 and the average family size was 2.86.
In the city, the population was spread out, with 16.2% under the age of 18, 33.2% from 18 to 24, 22.2% from 25 to 44, 17.2% from 45 to 64, and 11.2% who were 65 years of age or older. The median age was 24 years. For every 100 females, there were 91.2 males. For every 100 females age 18 and over, there were 88.7 males.
The median income for a household in the city was $37,917, and the median income for a family was $50,917. Males had a median income of $35,917 versus $25,917 for females. The per capita income for the city was $17,917. About 8.2% of families and 16.2% of the population were below the poverty line, including 14.2% of those under age 18 and 8.2% of those age 65 or over.
Common Questions
What is Per Capita Income in Whitewater?
Per Capita income in Whitewater is $21,633.
What is the Median Family Income in Whitewater?
Median Family Income in Whitewater is $77,819.
What is the Median Household income in Whitewater?
Median Household Income in Whitewater is $46,135.
What is Income or Wage Gap in Whitewater?
Income or Wage Gap in Whitewater is 3.6%.
Women in Whitewater earn 96.4 cents for every dollar earned by a man.
What is Inequality or Gini Index in Whitewater?
Inequality or Gini Index in Whitewater is 0.47.
What is the Total Population of Whitewater?
Total Population of Whitewater is 15,725.
What is the Total Male Population of Whitewater?
Total Male Population of Whitewater is 8,101.
What is the Total Female Population of Whitewater?
Total Female Population of Whitewater is 7,624.
What is the Ratio of Males per 100 Females in Whitewater?
There are 106.26 Males per 100 Females in Whitewater.
What is the Ratio of Females per 100 Males in Whitewater?
There are 94.11 Females per 100 Males in Whitewater.
What is the Median Population Age in Whitewater?
Median Population Age in Whitewater is 21.7 Years.
What is the Average Family Size in Whitewater
Average Family Size in Whitewater is 3.0 People.
What is the Average Household Size in Whitewater
Average Household Size in Whitewater is 2.4 People.
How Large is the Labor Force in Whitewater?
There are 9,219 People in the Labor Forcein in Whitewater.
What is the Percentage of People in the Labor Force in Whitewater?
65.2% of People are in the Labor Force in Whitewater.
What is the Unemployment Rate in Whitewater?
Unemployment Rate in Whitewater is 3.5%.