Birmingham, MI Map & Demographics
Birmingham Map
Birmingham Overview
$101,884
PER CAPITA INCOME
$233,988
AVG FAMILY INCOME
$151,556
AVG HOUSEHOLD INCOME
50.0%
WAGE / INCOME GAP [ % ]
50.0¢/ $1
WAGE / INCOME GAP [ $ ]
$12,972
FAMILY INCOME DEFICIT
0.52
INEQUALITY / GINI INDEX
21,738
TOTAL POPULATION
10,655
MALE POPULATION
11,083
FEMALE POPULATION
96.14
MALES / 100 FEMALES
104.02
FEMALES / 100 MALES
42.0
MEDIAN AGE
3.1
AVG FAMILY SIZE
2.3
AVG HOUSEHOLD SIZE
11,743
LABOR FORCE [ PEOPLE ]
69.5%
PERCENT IN LABOR FORCE
4.2%
UNEMPLOYMENT RATE
Birmingham Zip Codes
Income in Birmingham
Income Overview in Birmingham
Per Capita Income in Birmingham is $101,884, while median incomes of families and households are $233,988 and $151,556 respectively.
| Characteristic | Number | Measure |
| Per Capita Income | 21,738 | $101,884 |
| Median Family Income | 5,537 | $233,988 |
| Mean Family Income | 5,537 | $319,608 |
| Median Household Income | 9,383 | $151,556 |
| Mean Household Income | 9,383 | $234,600 |
| Income Deficit | 5,537 | $12,972 |
| Wage / Income Gap (%) | 21,738 | 49.95% |
| Wage / Income Gap ($) | 21,738 | 50.05¢ per $1 |
| Gini / Inequality Index | 21,738 | 0.52 |
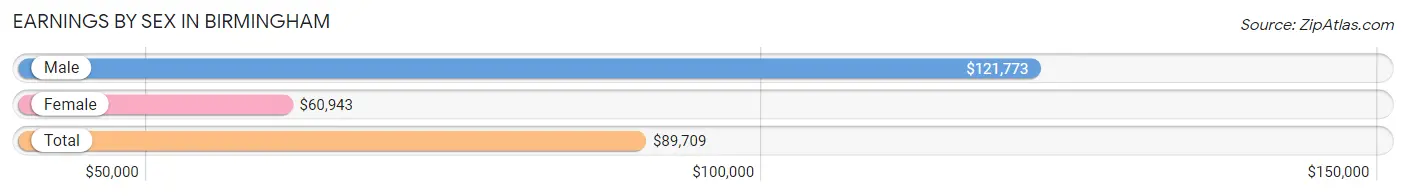
Earnings by Sex in Birmingham
Average Earnings in Birmingham are $89,709, $121,773 for men and $60,943 for women, a difference of 49.9%.
| Sex | Number | Average Earnings |
| Male | 6,657 (53.7%) | $121,773 |
| Female | 5,728 (46.3%) | $60,943 |
| Total | 12,385 (100.0%) | $89,709 |
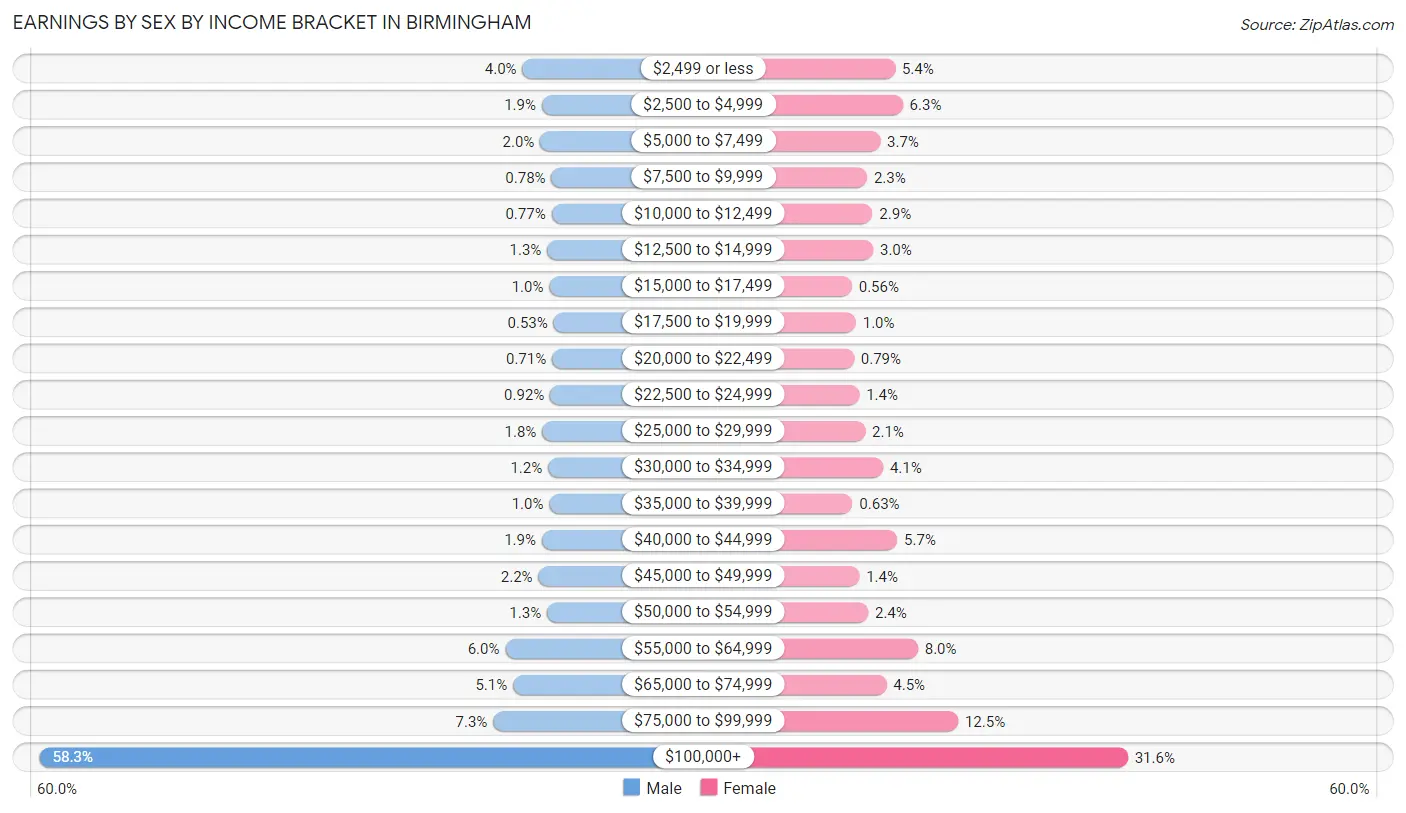
Earnings by Sex by Income Bracket in Birmingham
The most common earnings brackets in Birmingham are $100,000+ for men (3,882 | 58.3%) and $100,000+ for women (1,809 | 31.6%).
| Income | Male | Female |
| $2,499 or less | 269 (4.0%) | 310 (5.4%) |
| $2,500 to $4,999 | 124 (1.9%) | 360 (6.3%) |
| $5,000 to $7,499 | 136 (2.0%) | 214 (3.7%) |
| $7,500 to $9,999 | 52 (0.8%) | 130 (2.3%) |
| $10,000 to $12,499 | 51 (0.8%) | 165 (2.9%) |
| $12,500 to $14,999 | 84 (1.3%) | 169 (2.9%) |
| $15,000 to $17,499 | 68 (1.0%) | 32 (0.6%) |
| $17,500 to $19,999 | 35 (0.5%) | 58 (1.0%) |
| $20,000 to $22,499 | 47 (0.7%) | 45 (0.8%) |
| $22,500 to $24,999 | 61 (0.9%) | 80 (1.4%) |
| $25,000 to $29,999 | 121 (1.8%) | 118 (2.1%) |
| $30,000 to $34,999 | 77 (1.2%) | 233 (4.1%) |
| $35,000 to $39,999 | 68 (1.0%) | 36 (0.6%) |
| $40,000 to $44,999 | 124 (1.9%) | 324 (5.7%) |
| $45,000 to $49,999 | 149 (2.2%) | 80 (1.4%) |
| $50,000 to $54,999 | 85 (1.3%) | 137 (2.4%) |
| $55,000 to $64,999 | 397 (6.0%) | 457 (8.0%) |
| $65,000 to $74,999 | 339 (5.1%) | 255 (4.4%) |
| $75,000 to $99,999 | 488 (7.3%) | 716 (12.5%) |
| $100,000+ | 3,882 (58.3%) | 1,809 (31.6%) |
| Total | 6,657 (100.0%) | 5,728 (100.0%) |
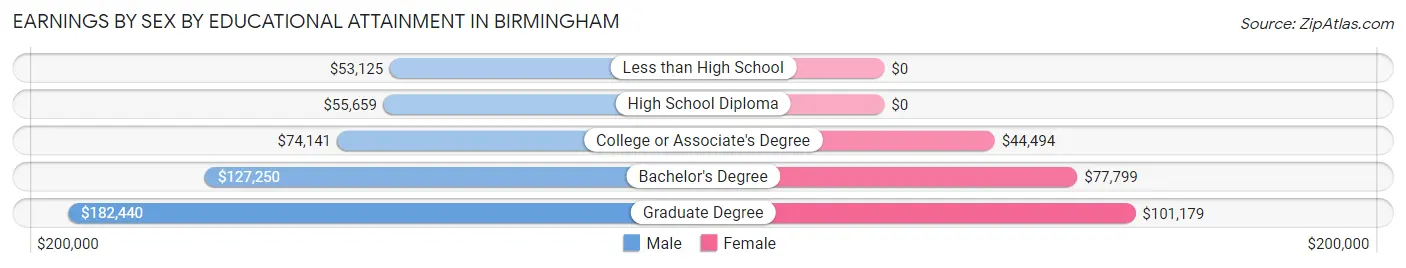
Earnings by Sex by Educational Attainment in Birmingham
Average earnings in Birmingham are $134,200 for men and $73,125 for women, a difference of 45.5%. Men with an educational attainment of graduate degree enjoy the highest average annual earnings of $182,440, while those with less than high school education earn the least with $53,125. Women with an educational attainment of graduate degree earn the most with the average annual earnings of $101,179, while those with college or associate's degree education have the smallest earnings of $44,494.
| Educational Attainment | Male Income | Female Income |
| Less than High School | $53,125 | $0 |
| High School Diploma | $55,659 | $0 |
| College or Associate's Degree | $74,141 | $44,494 |
| Bachelor's Degree | $127,250 | $77,799 |
| Graduate Degree | $182,440 | $101,179 |
| Total | $134,200 | $73,125 |
Family Income in Birmingham
Family Income Brackets in Birmingham
According to the Birmingham family income data, there are 3,134 families falling into the $200,000+ income range, which is the most common income bracket and makes up 56.6% of all families. Conversely, the $10,000 to $14,999 income bracket is the least frequent group with only 44 families (0.8%) belonging to this category.
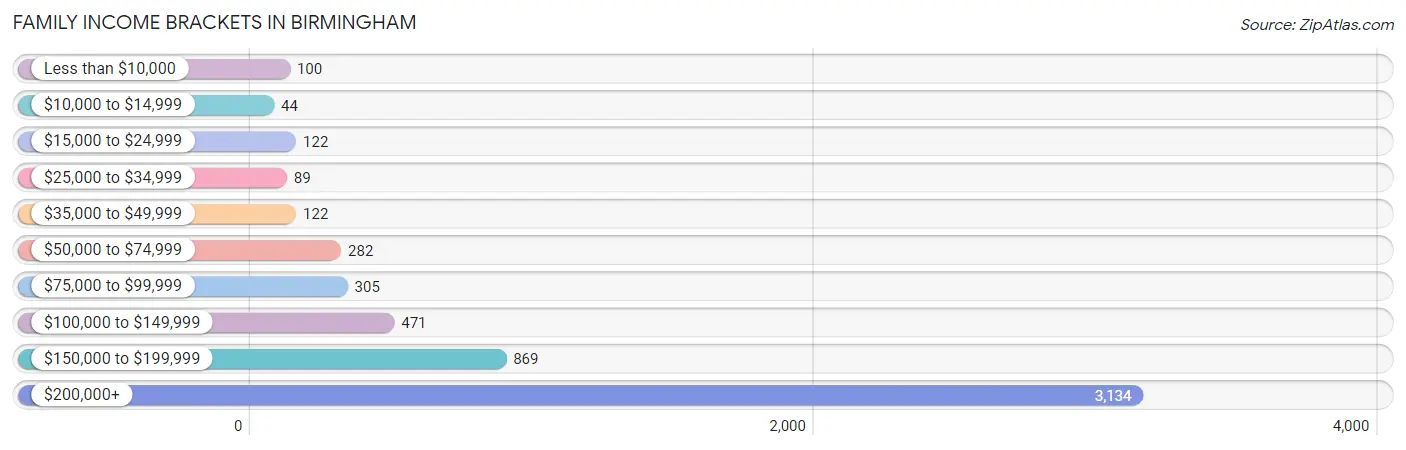
| Income Bracket | # Families | % Families |
| Less than $10,000 | 100 | 1.8% |
| $10,000 to $14,999 | 44 | 0.8% |
| $15,000 to $24,999 | 122 | 2.2% |
| $25,000 to $34,999 | 89 | 1.6% |
| $35,000 to $49,999 | 122 | 2.2% |
| $50,000 to $74,999 | 282 | 5.1% |
| $75,000 to $99,999 | 305 | 5.5% |
| $100,000 to $149,999 | 471 | 8.5% |
| $150,000 to $199,999 | 869 | 15.7% |
| $200,000+ | 3,134 | 56.6% |
Family Income by Famaliy Size in Birmingham
4-person families (1,463 | 26.4%) account for the highest median family income in Birmingham with $250,001 per family, while 2-person families (2,457 | 44.4%) have the highest median income of $101,164 per family member.
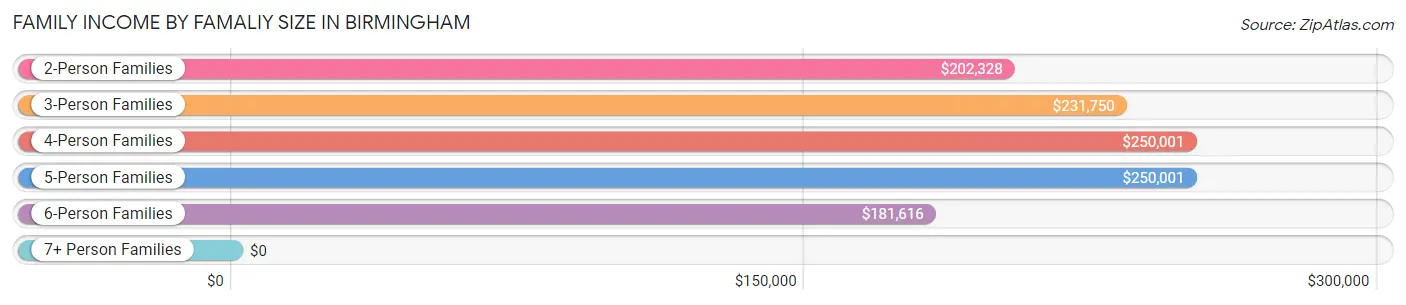
| Income Bracket | # Families | Median Income |
| 2-Person Families | 2,457 (44.4%) | $202,328 |
| 3-Person Families | 975 (17.6%) | $231,750 |
| 4-Person Families | 1,463 (26.4%) | $250,001 |
| 5-Person Families | 425 (7.7%) | $250,001 |
| 6-Person Families | 217 (3.9%) | $181,616 |
| 7+ Person Families | 0 (0.0%) | $0 |
| Total | 5,537 (100.0%) | $233,988 |
Family Income by Number of Earners in Birmingham
The median family income in Birmingham is $233,988, with families comprising 2 earners (2,772) having the highest median family income of $250,001, while families with no earners (397) have the lowest median family income of $97,344, accounting for 50.1% and 7.2% of families, respectively.
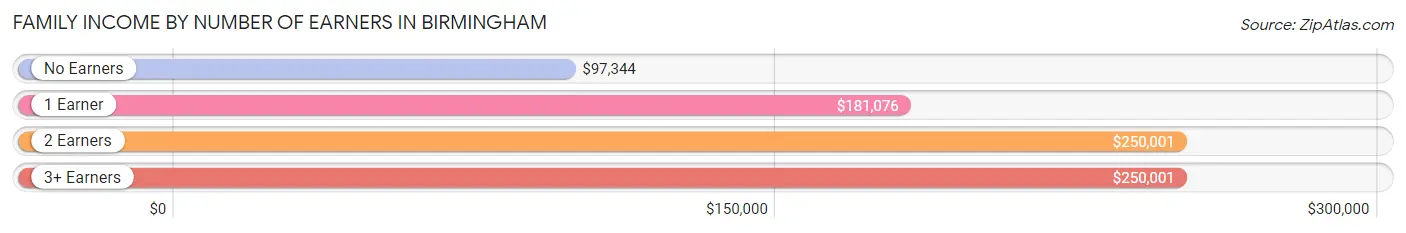
| Number of Earners | # Families | Median Income |
| No Earners | 397 (7.2%) | $97,344 |
| 1 Earner | 1,765 (31.9%) | $181,076 |
| 2 Earners | 2,772 (50.1%) | $250,001 |
| 3+ Earners | 603 (10.9%) | $250,001 |
| Total | 5,537 (100.0%) | $233,988 |
Household Income in Birmingham
Household Income Brackets in Birmingham
With 3,641 households falling in the category, the $200,000+ income range is the most frequent in Birmingham, accounting for 38.8% of all households. In contrast, only 169 households (1.8%) fall into the $10,000 to $14,999 income bracket, making it the least populous group.
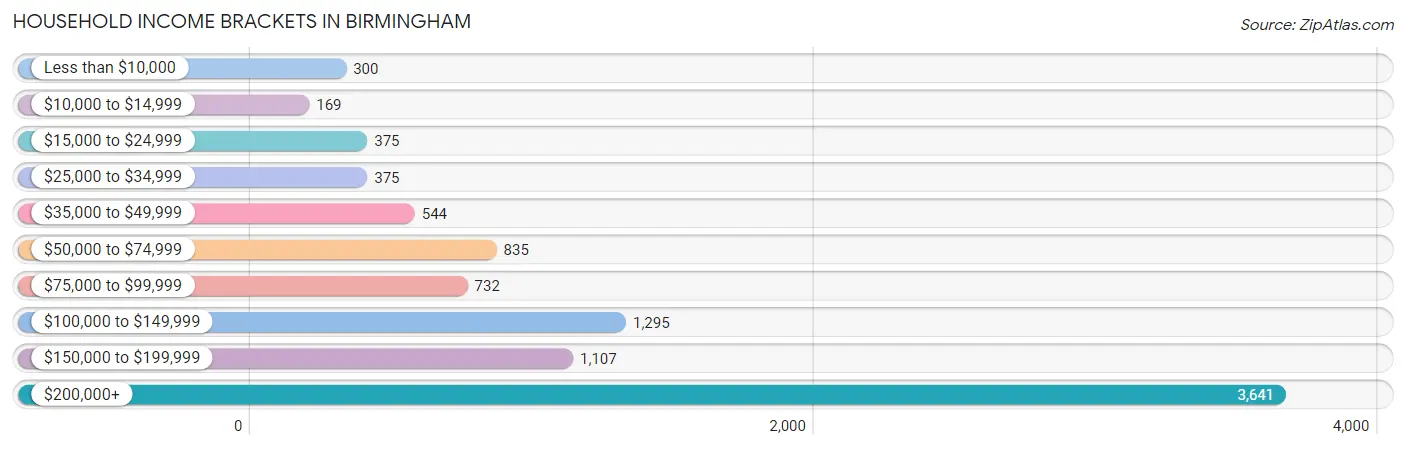
| Income Bracket | # Households | % Households |
| Less than $10,000 | 300 | 3.2% |
| $10,000 to $14,999 | 169 | 1.8% |
| $15,000 to $24,999 | 375 | 4.0% |
| $25,000 to $34,999 | 375 | 4.0% |
| $35,000 to $49,999 | 544 | 5.8% |
| $50,000 to $74,999 | 835 | 8.9% |
| $75,000 to $99,999 | 732 | 7.8% |
| $100,000 to $149,999 | 1,295 | 13.8% |
| $150,000 to $199,999 | 1,107 | 11.8% |
| $200,000+ | 3,641 | 38.8% |
Household Income by Householder Age in Birmingham
The median household income in Birmingham is $151,556, with the highest median household income of $201,836 found in the 45 to 64 years age bracket for the primary householder. A total of 3,725 households (39.7%) fall into this category. Meanwhile, the 15 to 24 years age bracket for the primary householder has the lowest median household income of $0, with 192 households (2.1%) in this group.
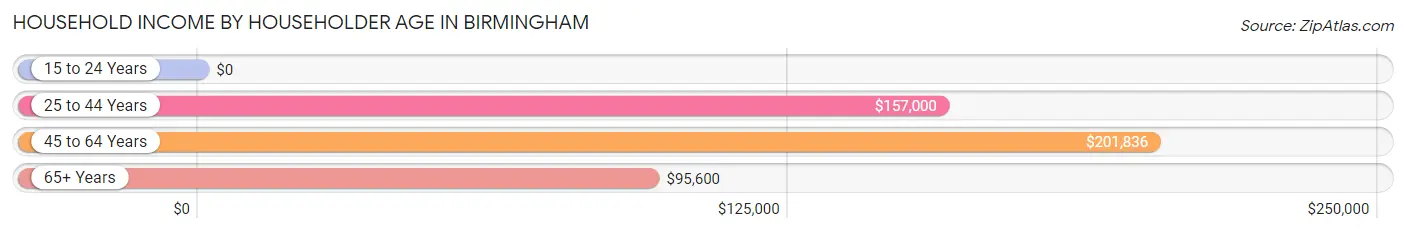
| Income Bracket | # Households | Median Income |
| 15 to 24 Years | 192 (2.1%) | $0 |
| 25 to 44 Years | 2,856 (30.4%) | $157,000 |
| 45 to 64 Years | 3,725 (39.7%) | $201,836 |
| 65+ Years | 2,610 (27.8%) | $95,600 |
| Total | 9,383 (100.0%) | $151,556 |
Poverty in Birmingham
Income Below Poverty by Sex and Age in Birmingham
With 4.0% poverty level for males and 6.9% for females among the residents of Birmingham, 16 and 17 year old males and 16 and 17 year old females are the most vulnerable to poverty, with 58 males (15.6%) and 150 females (29.6%) in their respective age groups living below the poverty level.
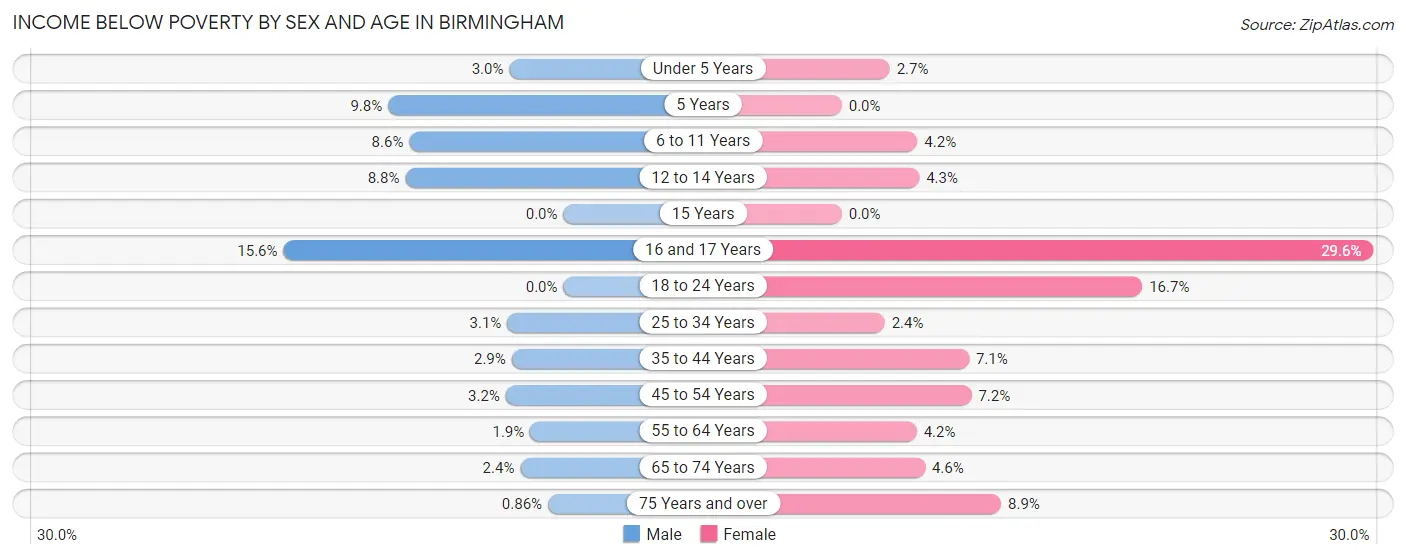
| Age Bracket | Male | Female |
| Under 5 Years | 21 (3.0%) | 20 (2.7%) |
| 5 Years | 12 (9.8%) | 0 (0.0%) |
| 6 to 11 Years | 94 (8.6%) | 34 (4.2%) |
| 12 to 14 Years | 52 (8.8%) | 17 (4.3%) |
| 15 Years | 0 (0.0%) | 0 (0.0%) |
| 16 and 17 Years | 58 (15.6%) | 150 (29.6%) |
| 18 to 24 Years | 0 (0.0%) | 93 (16.7%) |
| 25 to 34 Years | 35 (3.1%) | 22 (2.4%) |
| 35 to 44 Years | 43 (2.9%) | 114 (7.1%) |
| 45 to 54 Years | 54 (3.2%) | 109 (7.2%) |
| 55 to 64 Years | 25 (1.8%) | 70 (4.2%) |
| 65 to 74 Years | 26 (2.4%) | 55 (4.6%) |
| 75 Years and over | 5 (0.9%) | 78 (8.9%) |
| Total | 425 (4.0%) | 762 (6.9%) |
Income Above Poverty by Sex and Age in Birmingham
According to the poverty statistics in Birmingham, males aged 15 years and females aged 5 years are the age groups that are most secure financially, with 100.0% of males and 100.0% of females in these age groups living above the poverty line.
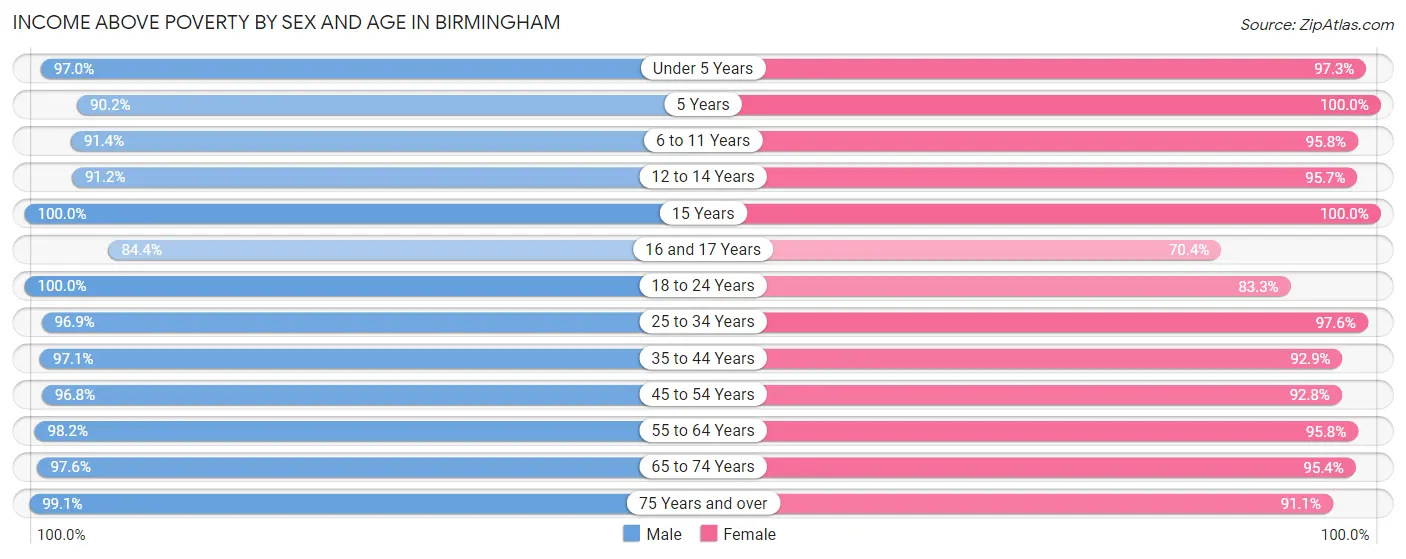
| Age Bracket | Male | Female |
| Under 5 Years | 677 (97.0%) | 728 (97.3%) |
| 5 Years | 111 (90.2%) | 118 (100.0%) |
| 6 to 11 Years | 1,002 (91.4%) | 774 (95.8%) |
| 12 to 14 Years | 539 (91.2%) | 377 (95.7%) |
| 15 Years | 99 (100.0%) | 166 (100.0%) |
| 16 and 17 Years | 314 (84.4%) | 357 (70.4%) |
| 18 to 24 Years | 367 (100.0%) | 463 (83.3%) |
| 25 to 34 Years | 1,082 (96.9%) | 899 (97.6%) |
| 35 to 44 Years | 1,450 (97.1%) | 1,496 (92.9%) |
| 45 to 54 Years | 1,626 (96.8%) | 1,400 (92.8%) |
| 55 to 64 Years | 1,330 (98.2%) | 1,609 (95.8%) |
| 65 to 74 Years | 1,059 (97.6%) | 1,133 (95.4%) |
| 75 Years and over | 574 (99.1%) | 801 (91.1%) |
| Total | 10,230 (96.0%) | 10,321 (93.1%) |
Income Below Poverty Among Married-Couple Families in Birmingham
The poverty statistics for married-couple families in Birmingham show that 1.6% or 75 of the total 4,771 families live below the poverty line. Families with 1 or 2 children have the highest poverty rate of 1.8%, comprising of 34 families. On the other hand, families with 3 or 4 children have the lowest poverty rate of 0.6%, which includes 3 families.
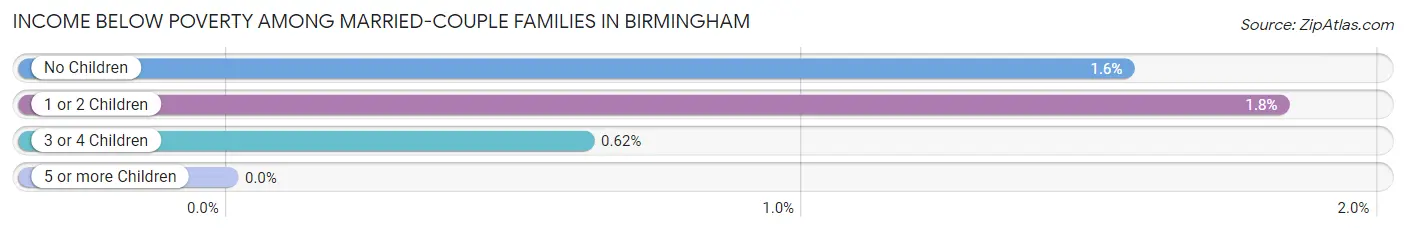
| Children | Above Poverty | Below Poverty |
| No Children | 2,391 (98.4%) | 38 (1.6%) |
| 1 or 2 Children | 1,825 (98.2%) | 34 (1.8%) |
| 3 or 4 Children | 480 (99.4%) | 3 (0.6%) |
| 5 or more Children | 0 (0.0%) | 0 (0.0%) |
| Total | 4,696 (98.4%) | 75 (1.6%) |
Income Below Poverty Among Single-Parent Households in Birmingham
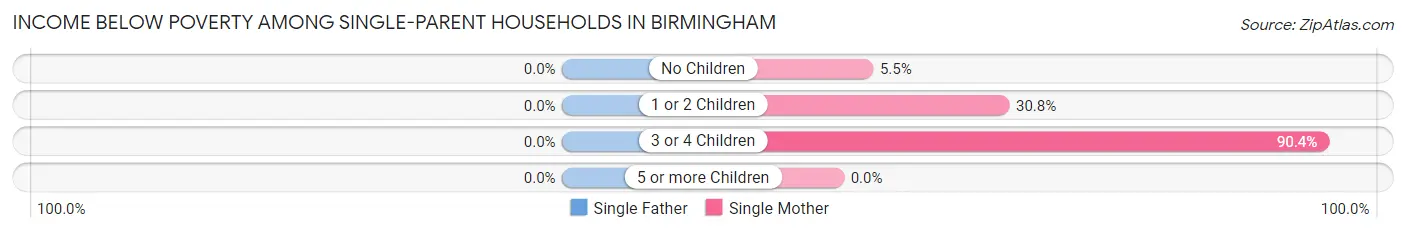
| Children | Single Father | Single Mother |
| No Children | 0 (0.0%) | 10 (5.5%) |
| 1 or 2 Children | 0 (0.0%) | 89 (30.8%) |
| 3 or 4 Children | 0 (0.0%) | 66 (90.4%) |
| 5 or more Children | 0 (0.0%) | 0 (0.0%) |
| Total | 0 (0.0%) | 165 (30.3%) |
Income Below Poverty Among Married-Couple vs Single-Parent Households in Birmingham
The poverty data for Birmingham shows that 75 of the married-couple family households (1.6%) and 165 of the single-parent households (21.5%) are living below the poverty level. Within the married-couple family households, those with 1 or 2 children have the highest poverty rate, with 34 households (1.8%) falling below the poverty line. Among the single-parent households, those with 3 or 4 children have the highest poverty rate, with 66 household (47.1%) living below poverty.
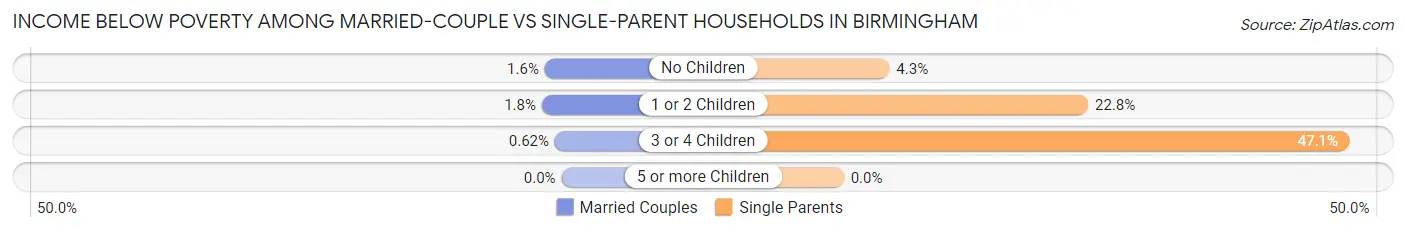
| Children | Married-Couple Families | Single-Parent Households |
| No Children | 38 (1.6%) | 10 (4.3%) |
| 1 or 2 Children | 34 (1.8%) | 89 (22.8%) |
| 3 or 4 Children | 3 (0.6%) | 66 (47.1%) |
| 5 or more Children | 0 (0.0%) | 0 (0.0%) |
| Total | 75 (1.6%) | 165 (21.5%) |
Race in Birmingham
The most populous races in Birmingham are White / Caucasian (18,860 | 86.8%), Two or more Races (1,089 | 5.0%), and Asian (1,030 | 4.7%).
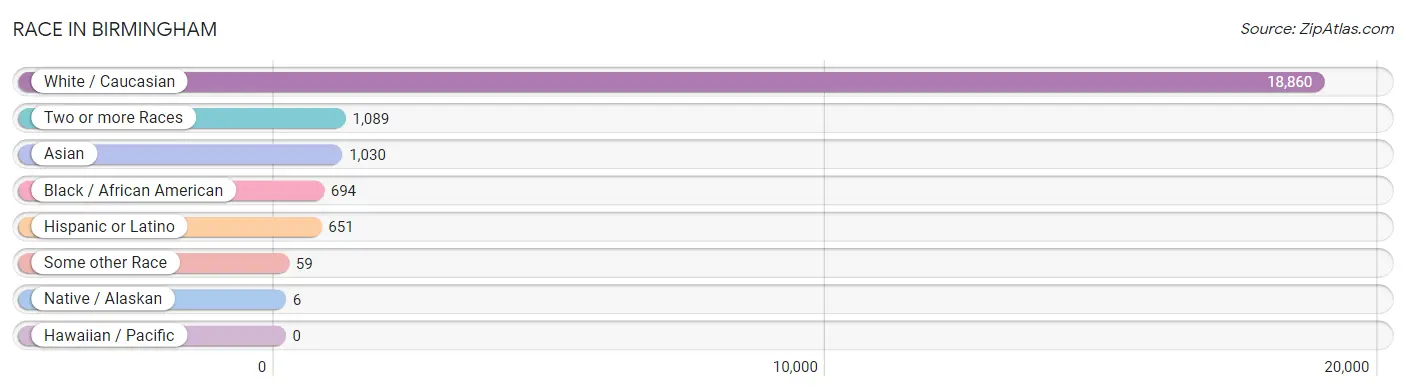
| Race | # Population | % Population |
| Asian | 1,030 | 4.7% |
| Black / African American | 694 | 3.2% |
| Hawaiian / Pacific | 0 | 0.0% |
| Hispanic or Latino | 651 | 3.0% |
| Native / Alaskan | 6 | 0.0% |
| White / Caucasian | 18,860 | 86.8% |
| Two or more Races | 1,089 | 5.0% |
| Some other Race | 59 | 0.3% |
| Total | 21,738 | 100.0% |
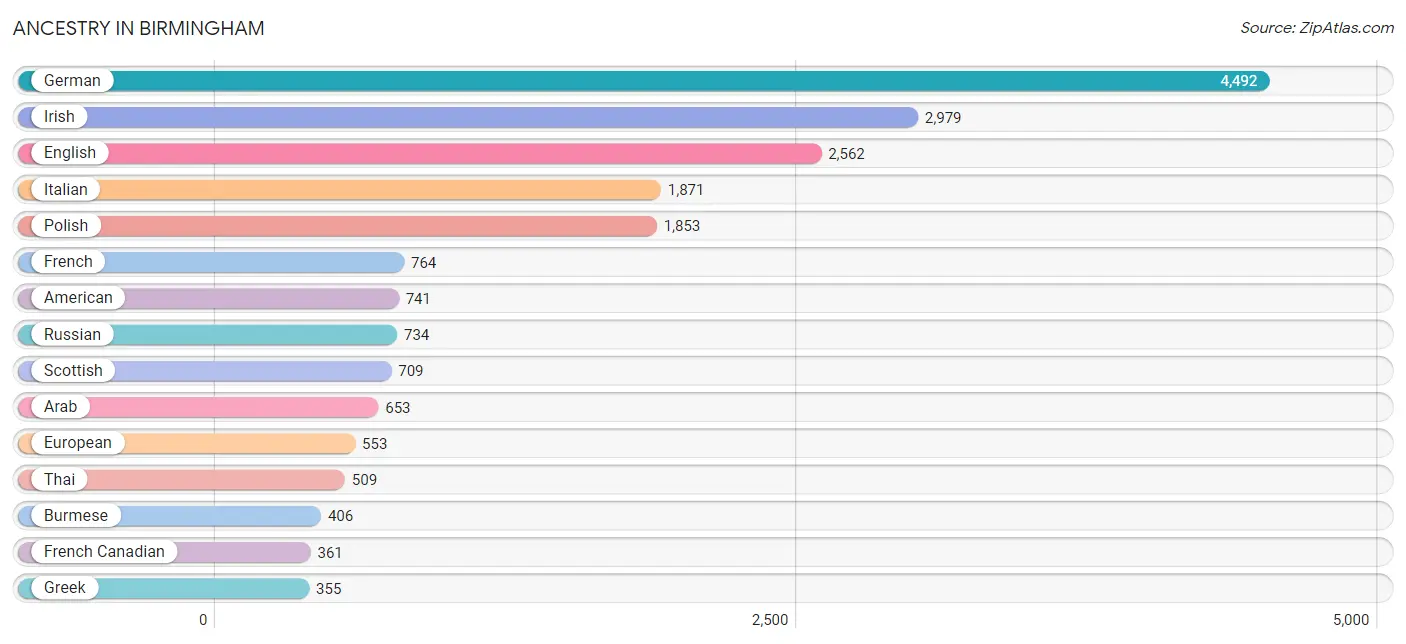
Ancestry in Birmingham
The most populous ancestries reported in Birmingham are German (4,492 | 20.7%), Irish (2,979 | 13.7%), English (2,562 | 11.8%), Italian (1,871 | 8.6%), and Polish (1,853 | 8.5%), together accounting for 63.3% of all Birmingham residents.
| Ancestry | # Population | % Population |
| African | 63 | 0.3% |
| Alaska Native | 6 | 0.0% |
| Albanian | 117 | 0.5% |
| American | 741 | 3.4% |
| Arab | 653 | 3.0% |
| Argentinean | 11 | 0.1% |
| Armenian | 172 | 0.8% |
| Assyrian / Chaldean / Syriac | 56 | 0.3% |
| Austrian | 76 | 0.4% |
| Belgian | 24 | 0.1% |
| Bhutanese | 35 | 0.2% |
| Brazilian | 134 | 0.6% |
| British | 305 | 1.4% |
| Burmese | 406 | 1.9% |
| Canadian | 149 | 0.7% |
| Central American | 14 | 0.1% |
| Cherokee | 33 | 0.2% |
| Chippewa | 7 | 0.0% |
| Choctaw | 23 | 0.1% |
| Colombian | 16 | 0.1% |
| Croatian | 204 | 0.9% |
| Czech | 128 | 0.6% |
| Czechoslovakian | 49 | 0.2% |
| Danish | 95 | 0.4% |
| Dutch | 317 | 1.5% |
| Eastern European | 272 | 1.3% |
| Ecuadorian | 5 | 0.0% |
| Egyptian | 35 | 0.2% |
| English | 2,562 | 11.8% |
| European | 553 | 2.5% |
| Filipino | 6 | 0.0% |
| Finnish | 113 | 0.5% |
| French | 764 | 3.5% |
| French Canadian | 361 | 1.7% |
| German | 4,492 | 20.7% |
| Greek | 355 | 1.6% |
| Guatemalan | 14 | 0.1% |
| Hungarian | 222 | 1.0% |
| Indian (Asian) | 156 | 0.7% |
| Iranian | 39 | 0.2% |
| Iraqi | 58 | 0.3% |
| Irish | 2,979 | 13.7% |
| Israeli | 26 | 0.1% |
| Italian | 1,871 | 8.6% |
| Jamaican | 8 | 0.0% |
| Korean | 118 | 0.5% |
| Lebanese | 278 | 1.3% |
| Lithuanian | 84 | 0.4% |
| Maltese | 10 | 0.1% |
| Mexican | 325 | 1.5% |
| Mongolian | 14 | 0.1% |
| Northern European | 80 | 0.4% |
| Norwegian | 158 | 0.7% |
| Peruvian | 53 | 0.2% |
| Polish | 1,853 | 8.5% |
| Portuguese | 105 | 0.5% |
| Puerto Rican | 30 | 0.1% |
| Romanian | 99 | 0.5% |
| Russian | 734 | 3.4% |
| Scandinavian | 91 | 0.4% |
| Scotch-Irish | 159 | 0.7% |
| Scottish | 709 | 3.3% |
| Serbian | 50 | 0.2% |
| Slovak | 62 | 0.3% |
| Slovene | 13 | 0.1% |
| South American | 128 | 0.6% |
| South American Indian | 41 | 0.2% |
| Spaniard | 66 | 0.3% |
| Spanish | 83 | 0.4% |
| Subsaharan African | 63 | 0.3% |
| Swedish | 329 | 1.5% |
| Swiss | 134 | 0.6% |
| Syrian | 50 | 0.2% |
| Thai | 509 | 2.3% |
| Ukrainian | 231 | 1.1% |
| Venezuelan | 43 | 0.2% |
| Welsh | 176 | 0.8% |
| Yugoslavian | 29 | 0.1% | View All 78 Rows |
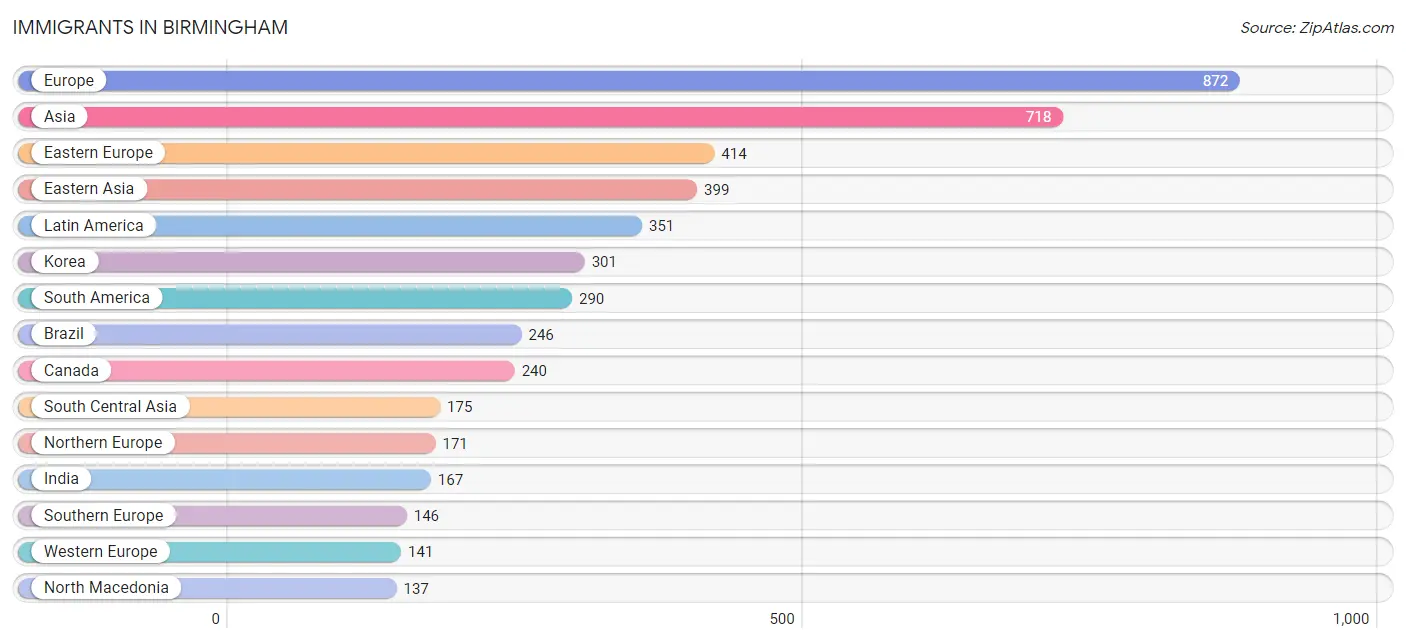
Immigrants in Birmingham
The most numerous immigrant groups reported in Birmingham came from Europe (872 | 4.0%), Asia (718 | 3.3%), Eastern Europe (414 | 1.9%), Eastern Asia (399 | 1.8%), and Latin America (351 | 1.6%), together accounting for 12.7% of all Birmingham residents.
| Immigration Origin | # Population | % Population |
| Africa | 68 | 0.3% |
| Albania | 46 | 0.2% |
| Argentina | 16 | 0.1% |
| Asia | 718 | 3.3% |
| Australia | 66 | 0.3% |
| Brazil | 246 | 1.1% |
| Cambodia | 24 | 0.1% |
| Canada | 240 | 1.1% |
| Central America | 61 | 0.3% |
| China | 81 | 0.4% |
| Colombia | 4 | 0.0% |
| Czechoslovakia | 30 | 0.1% |
| Eastern Africa | 32 | 0.2% |
| Eastern Asia | 399 | 1.8% |
| Eastern Europe | 414 | 1.9% |
| England | 45 | 0.2% |
| Ethiopia | 18 | 0.1% |
| Europe | 872 | 4.0% |
| France | 51 | 0.2% |
| Germany | 90 | 0.4% |
| Greece | 53 | 0.2% |
| Hungary | 4 | 0.0% |
| India | 167 | 0.8% |
| Iran | 8 | 0.0% |
| Iraq | 17 | 0.1% |
| Ireland | 11 | 0.1% |
| Israel | 25 | 0.1% |
| Italy | 70 | 0.3% |
| Japan | 17 | 0.1% |
| Korea | 301 | 1.4% |
| Latin America | 351 | 1.6% |
| Lebanon | 32 | 0.2% |
| Lithuania | 8 | 0.0% |
| Mexico | 61 | 0.3% |
| North Macedonia | 137 | 0.6% |
| Northern Africa | 16 | 0.1% |
| Northern Europe | 171 | 0.8% |
| Oceania | 91 | 0.4% |
| Peru | 24 | 0.1% |
| Philippines | 14 | 0.1% |
| Poland | 57 | 0.3% |
| Romania | 35 | 0.2% |
| Russia | 52 | 0.2% |
| Scotland | 4 | 0.0% |
| South Africa | 20 | 0.1% |
| South America | 290 | 1.3% |
| South Central Asia | 175 | 0.8% |
| South Eastern Asia | 38 | 0.2% |
| Southern Europe | 146 | 0.7% |
| Spain | 23 | 0.1% |
| Sweden | 7 | 0.0% |
| Syria | 32 | 0.2% |
| Taiwan | 35 | 0.2% |
| Ukraine | 4 | 0.0% |
| Western Asia | 106 | 0.5% |
| Western Europe | 141 | 0.6% | View All 56 Rows |
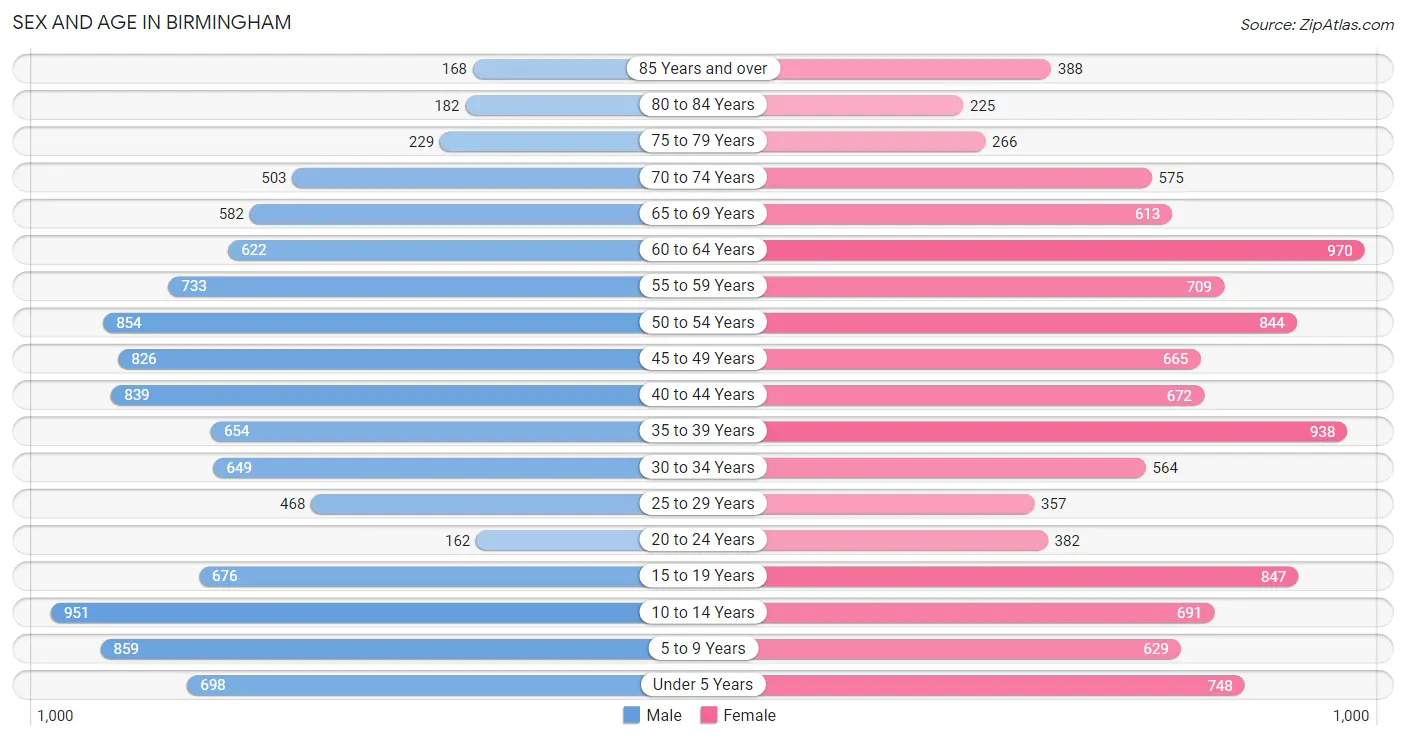
Sex and Age in Birmingham
Sex and Age in Birmingham
The most populous age groups in Birmingham are 10 to 14 Years (951 | 8.9%) for men and 60 to 64 Years (970 | 8.7%) for women.
| Age Bracket | Male | Female |
| Under 5 Years | 698 (6.6%) | 748 (6.8%) |
| 5 to 9 Years | 859 (8.1%) | 629 (5.7%) |
| 10 to 14 Years | 951 (8.9%) | 691 (6.2%) |
| 15 to 19 Years | 676 (6.3%) | 847 (7.6%) |
| 20 to 24 Years | 162 (1.5%) | 382 (3.5%) |
| 25 to 29 Years | 468 (4.4%) | 357 (3.2%) |
| 30 to 34 Years | 649 (6.1%) | 564 (5.1%) |
| 35 to 39 Years | 654 (6.1%) | 938 (8.5%) |
| 40 to 44 Years | 839 (7.9%) | 672 (6.1%) |
| 45 to 49 Years | 826 (7.7%) | 665 (6.0%) |
| 50 to 54 Years | 854 (8.0%) | 844 (7.6%) |
| 55 to 59 Years | 733 (6.9%) | 709 (6.4%) |
| 60 to 64 Years | 622 (5.8%) | 970 (8.7%) |
| 65 to 69 Years | 582 (5.5%) | 613 (5.5%) |
| 70 to 74 Years | 503 (4.7%) | 575 (5.2%) |
| 75 to 79 Years | 229 (2.1%) | 266 (2.4%) |
| 80 to 84 Years | 182 (1.7%) | 225 (2.0%) |
| 85 Years and over | 168 (1.6%) | 388 (3.5%) |
| Total | 10,655 (100.0%) | 11,083 (100.0%) |
Families and Households in Birmingham
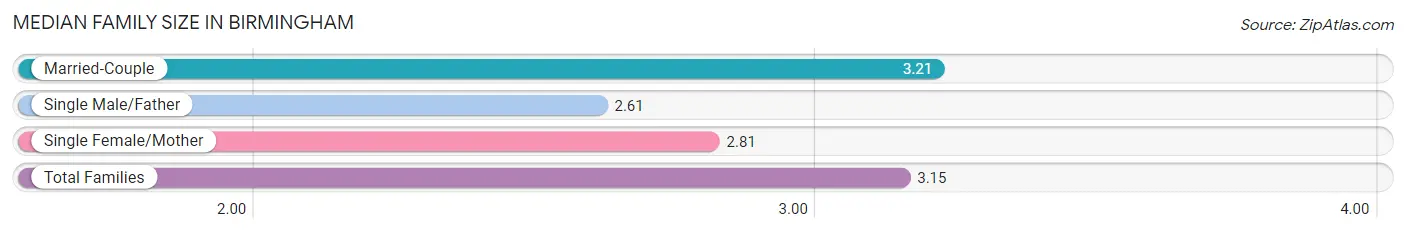
Median Family Size in Birmingham
The median family size in Birmingham is 3.15 persons per family, with married-couple families (4,771 | 86.2%) accounting for the largest median family size of 3.21 persons per family. On the other hand, single male/father families (221 | 4.0%) represent the smallest median family size with 2.61 persons per family.
| Family Type | # Families | Family Size |
| Married-Couple | 4,771 (86.2%) | 3.21 |
| Single Male/Father | 221 (4.0%) | 2.61 |
| Single Female/Mother | 545 (9.8%) | 2.81 |
| Total Families | 5,537 (100.0%) | 3.15 |
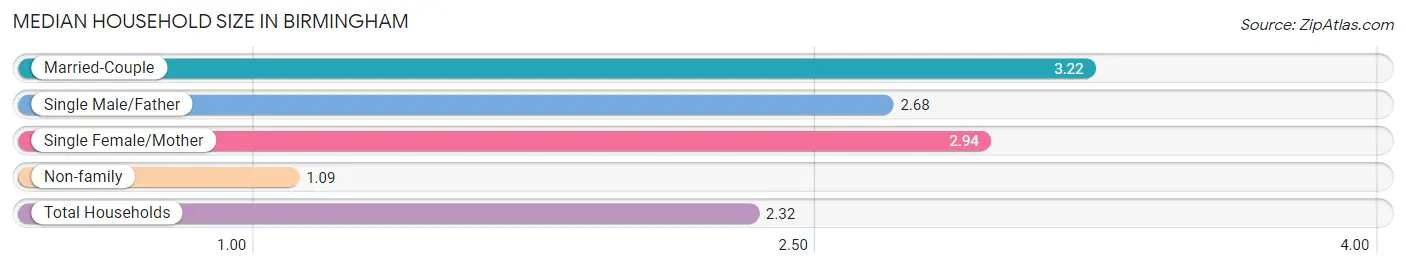
Median Household Size in Birmingham
The median household size in Birmingham is 2.32 persons per household, with married-couple households (4,771 | 50.8%) accounting for the largest median household size of 3.22 persons per household. non-family households (3,846 | 41.0%) represent the smallest median household size with 1.09 persons per household.
| Household Type | # Households | Household Size |
| Married-Couple | 4,771 (50.8%) | 3.22 |
| Single Male/Father | 221 (2.4%) | 2.68 |
| Single Female/Mother | 545 (5.8%) | 2.94 |
| Non-family | 3,846 (41.0%) | 1.09 |
| Total Households | 9,383 (100.0%) | 2.32 |
Household Size by Marriage Status in Birmingham
Out of a total of 9,383 households in Birmingham, 5,537 (59.0%) are family households, while 3,846 (41.0%) are nonfamily households. The most numerous type of family households are 2-person households, comprising 2,417, and the most common type of nonfamily households are 1-person households, comprising 3,453.
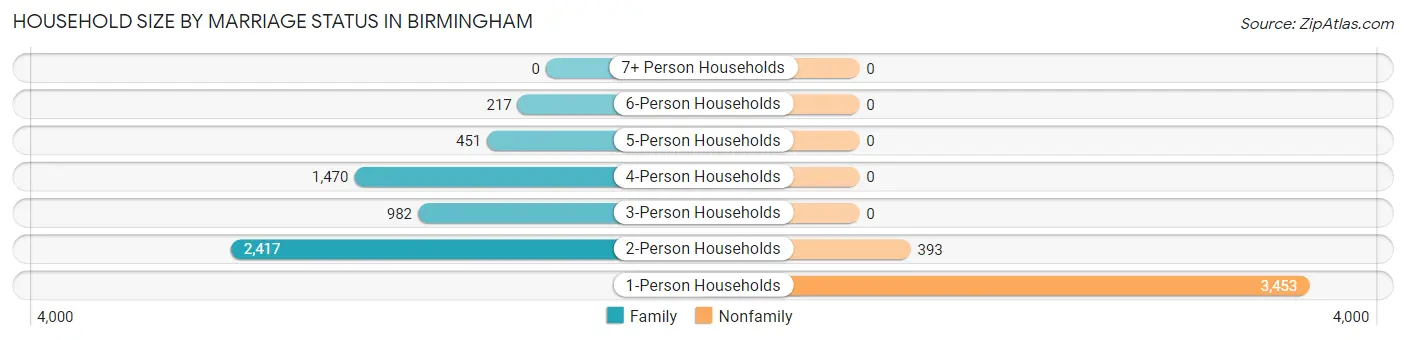
| Household Size | Family Households | Nonfamily Households |
| 1-Person Households | - | 3,453 (36.8%) |
| 2-Person Households | 2,417 (25.8%) | 393 (4.2%) |
| 3-Person Households | 982 (10.5%) | 0 (0.0%) |
| 4-Person Households | 1,470 (15.7%) | 0 (0.0%) |
| 5-Person Households | 451 (4.8%) | 0 (0.0%) |
| 6-Person Households | 217 (2.3%) | 0 (0.0%) |
| 7+ Person Households | 0 (0.0%) | 0 (0.0%) |
| Total | 5,537 (59.0%) | 3,846 (41.0%) |
Female Fertility in Birmingham
Fertility by Age in Birmingham
Average fertility rate in Birmingham is 31.0 births per 1,000 women. Women in the age bracket of 20 to 34 years have the highest fertility rate with 48.0 births per 1,000 women. Women in the age bracket of 35 to 50 years acount for 56.0% of all women with births.
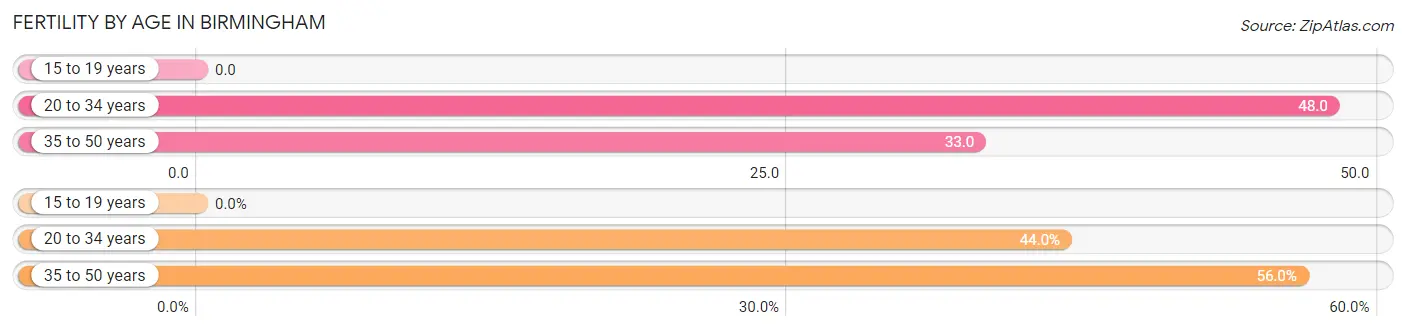
| Age Bracket | Women with Births | Births / 1,000 Women |
| 15 to 19 years | 0 (0.0%) | 0.0 |
| 20 to 34 years | 62 (44.0%) | 48.0 |
| 35 to 50 years | 79 (56.0%) | 33.0 |
| Total | 141 (100.0%) | 31.0 |
Fertility by Age by Marriage Status in Birmingham
91.5% of women with births (141) in Birmingham are married. The highest percentage of unmarried women with births falls into 35 to 50 years age bracket with 11.4% of them unmarried at the time of birth, while the lowest percentage of unmarried women with births belong to 20 to 34 years age bracket with 4.8% of them unmarried.
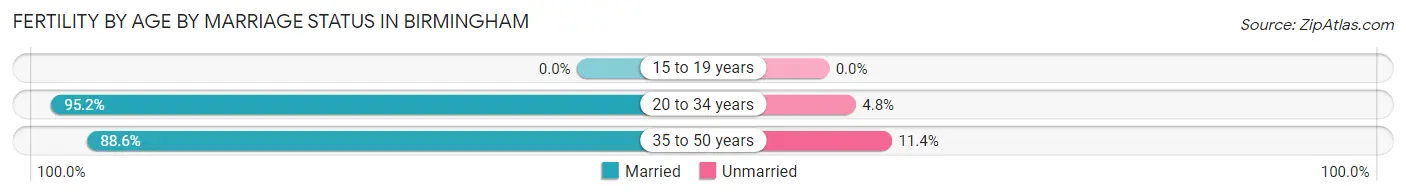
| Age Bracket | Married | Unmarried |
| 15 to 19 years | 0 (0.0%) | 0 (0.0%) |
| 20 to 34 years | 59 (95.2%) | 3 (4.8%) |
| 35 to 50 years | 70 (88.6%) | 9 (11.4%) |
| Total | 129 (91.5%) | 12 (8.5%) |
Fertility by Education in Birmingham
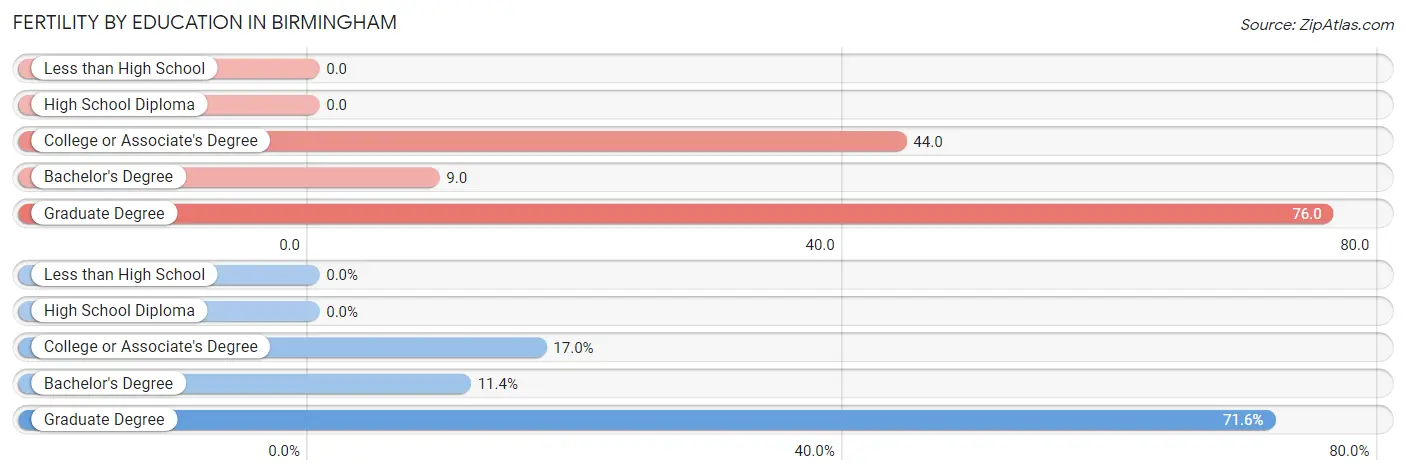
| Educational Attainment | Women with Births | Births / 1,000 Women |
| Less than High School | 0 (0.0%) | 0.0 |
| High School Diploma | 0 (0.0%) | 0.0 |
| College or Associate's Degree | 24 (17.0%) | 44.0 |
| Bachelor's Degree | 16 (11.4%) | 9.0 |
| Graduate Degree | 101 (71.6%) | 76.0 |
| Total | 141 (100.0%) | 31.0 |
Fertility by Education by Marriage Status in Birmingham
8.5% of women with births in Birmingham are unmarried. Women with the educational attainment of bachelor's degree are most likely to be married with 100.0% of them married at childbirth, while women with the educational attainment of college or associate's degree are least likely to be married with 37.5% of them unmarried at childbirth.
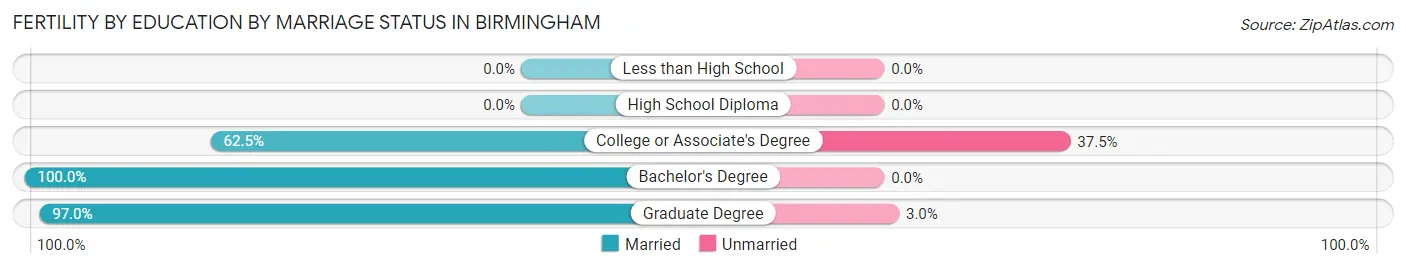
| Educational Attainment | Married | Unmarried |
| Less than High School | 0 (0.0%) | 0 (0.0%) |
| High School Diploma | 0 (0.0%) | 0 (0.0%) |
| College or Associate's Degree | 15 (62.5%) | 9 (37.5%) |
| Bachelor's Degree | 16 (100.0%) | 0 (0.0%) |
| Graduate Degree | 98 (97.0%) | 3 (3.0%) |
| Total | 129 (91.5%) | 12 (8.5%) |
Employment Characteristics in Birmingham
Employment by Class of Employer in Birmingham
Among the 11,161 employed individuals in Birmingham, private company employees (7,693 | 68.9%), not-for-profit organizations (1,029 | 9.2%), and self-employed (incorporated) (1,003 | 9.0%) make up the most common classes of employment.
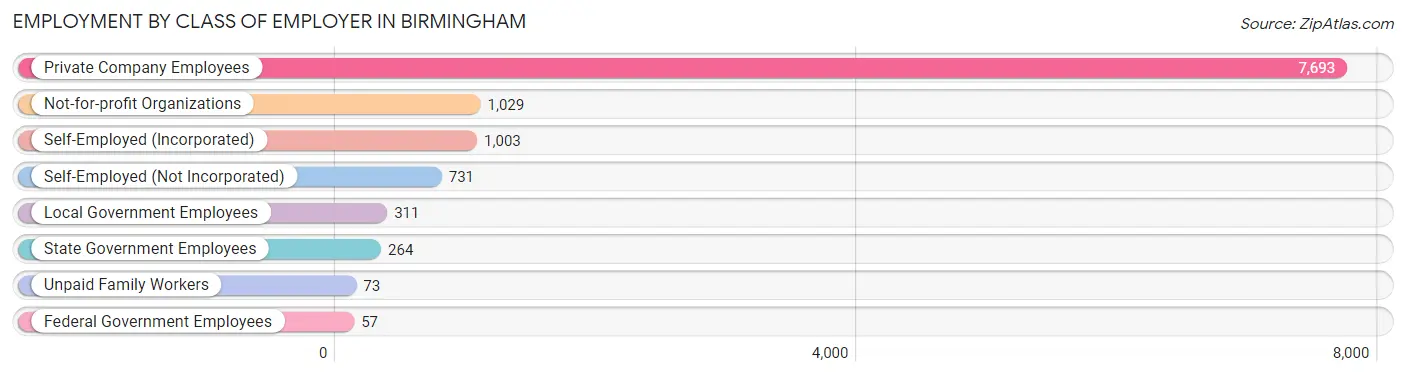
| Employer Class | # Employees | % Employees |
| Private Company Employees | 7,693 | 68.9% |
| Self-Employed (Incorporated) | 1,003 | 9.0% |
| Self-Employed (Not Incorporated) | 731 | 6.6% |
| Not-for-profit Organizations | 1,029 | 9.2% |
| Local Government Employees | 311 | 2.8% |
| State Government Employees | 264 | 2.4% |
| Federal Government Employees | 57 | 0.5% |
| Unpaid Family Workers | 73 | 0.6% |
| Total | 11,161 | 100.0% |
Employment Status by Age in Birmingham
According to the labor force statistics for Birmingham, out of the total population over 16 years of age (16,897), 69.5% or 11,743 individuals are in the labor force, with 4.2% or 493 of them unemployed. The age group with the highest labor force participation rate is 25 to 29 years, with 96.8% or 799 individuals in the labor force. Within the labor force, the 20 to 24 years age range has the highest percentage of unemployed individuals, with 21.1% or 88 of them being unemployed.
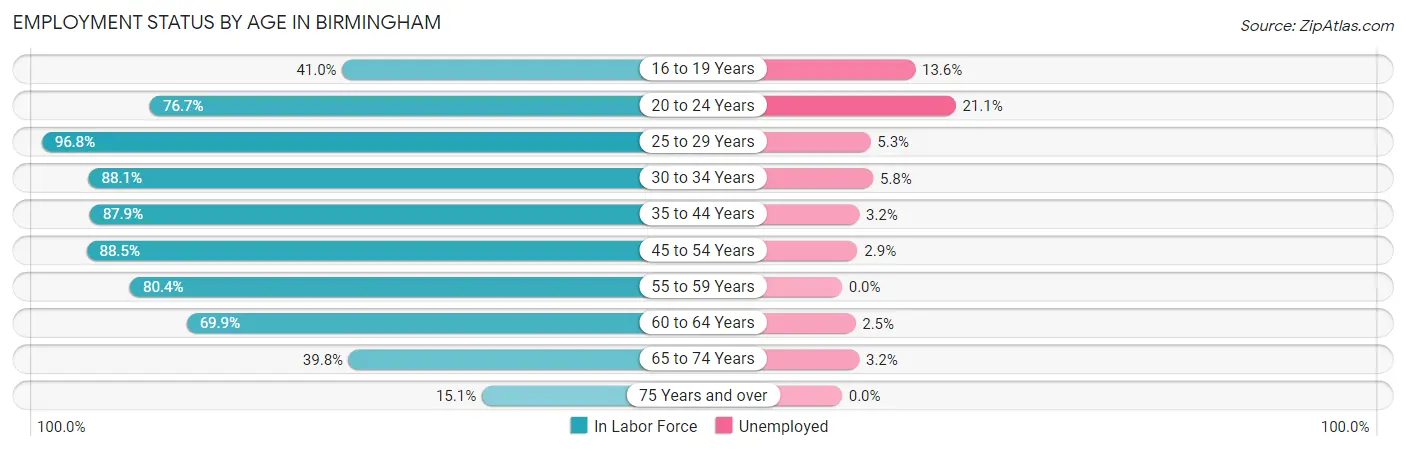
| Age Bracket | In Labor Force | Unemployed |
| 16 to 19 Years | 516 (41.0%) | 70 (13.6%) |
| 20 to 24 Years | 417 (76.7%) | 88 (21.1%) |
| 25 to 29 Years | 799 (96.8%) | 42 (5.3%) |
| 30 to 34 Years | 1,069 (88.1%) | 62 (5.8%) |
| 35 to 44 Years | 2,728 (87.9%) | 87 (3.2%) |
| 45 to 54 Years | 2,822 (88.5%) | 82 (2.9%) |
| 55 to 59 Years | 1,159 (80.4%) | 0 (0.0%) |
| 60 to 64 Years | 1,113 (69.9%) | 28 (2.5%) |
| 65 to 74 Years | 905 (39.8%) | 29 (3.2%) |
| 75 Years and over | 220 (15.1%) | 0 (0.0%) |
| Total | 11,743 (69.5%) | 493 (4.2%) |
Employment Status by Educational Attainment in Birmingham
According to labor force statistics for Birmingham, 85.3% of individuals (9,693) out of the total population between 25 and 64 years of age (11,364) are in the labor force, with 3.1% or 300 of them being unemployed. The group with the highest labor force participation rate are those with the educational attainment of less than high school, with 86.7% or 91 individuals in the labor force. Within the labor force, individuals with less than high school education have the highest percentage of unemployment, with 17.6% or 16 of them being unemployed.
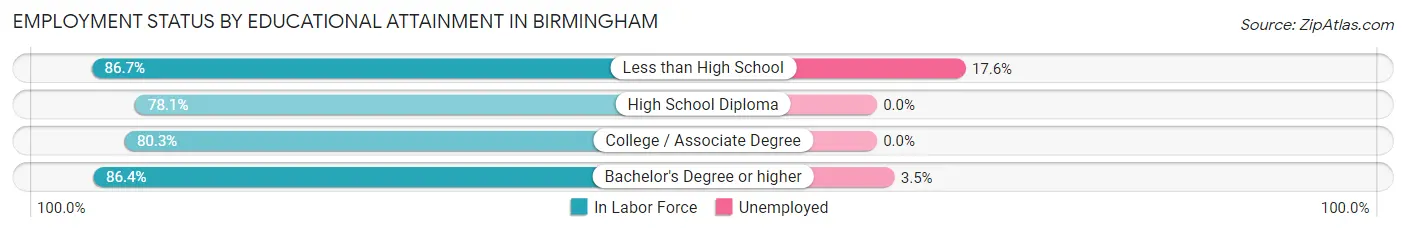
| Educational Attainment | In Labor Force | Unemployed |
| Less than High School | 91 (86.7%) | 18 (17.6%) |
| High School Diploma | 367 (78.1%) | 0 (0.0%) |
| College / Associate Degree | 1,192 (80.3%) | 0 (0.0%) |
| Bachelor's Degree or higher | 8,039 (86.4%) | 326 (3.5%) |
| Total | 9,693 (85.3%) | 352 (3.1%) |
Employment Occupations by Sex in Birmingham
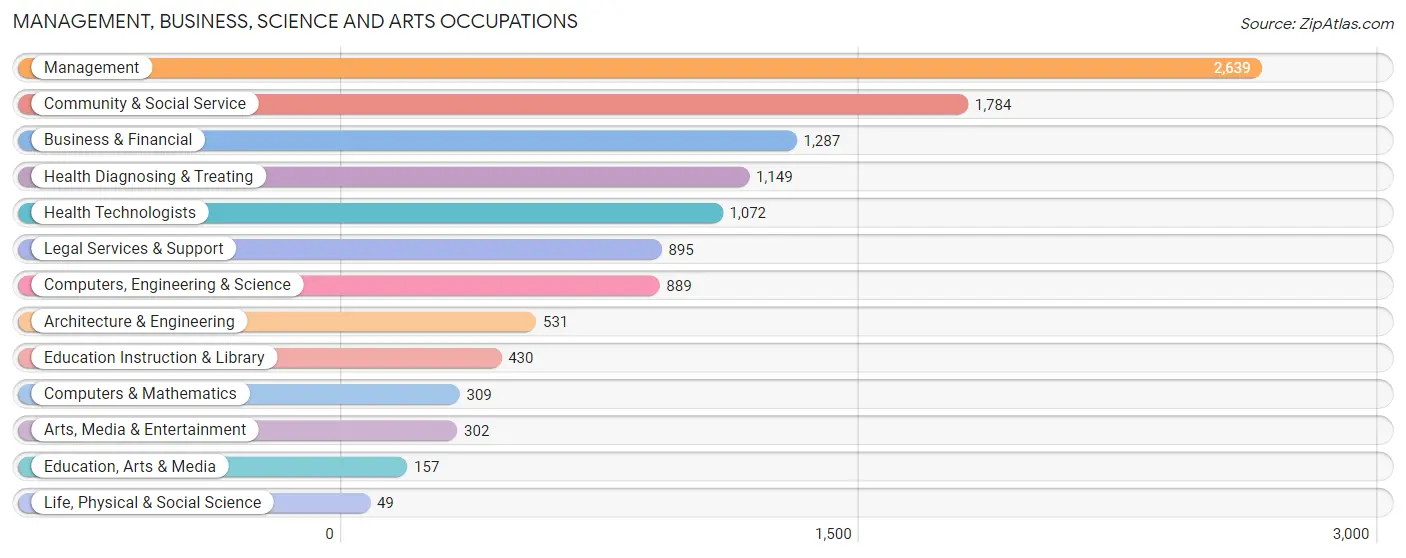
Management, Business, Science and Arts Occupations
The most common Management, Business, Science and Arts occupations in Birmingham are Management (2,639 | 23.5%), Community & Social Service (1,784 | 15.9%), Business & Financial (1,287 | 11.5%), Health Diagnosing & Treating (1,149 | 10.2%), and Health Technologists (1,072 | 9.5%).
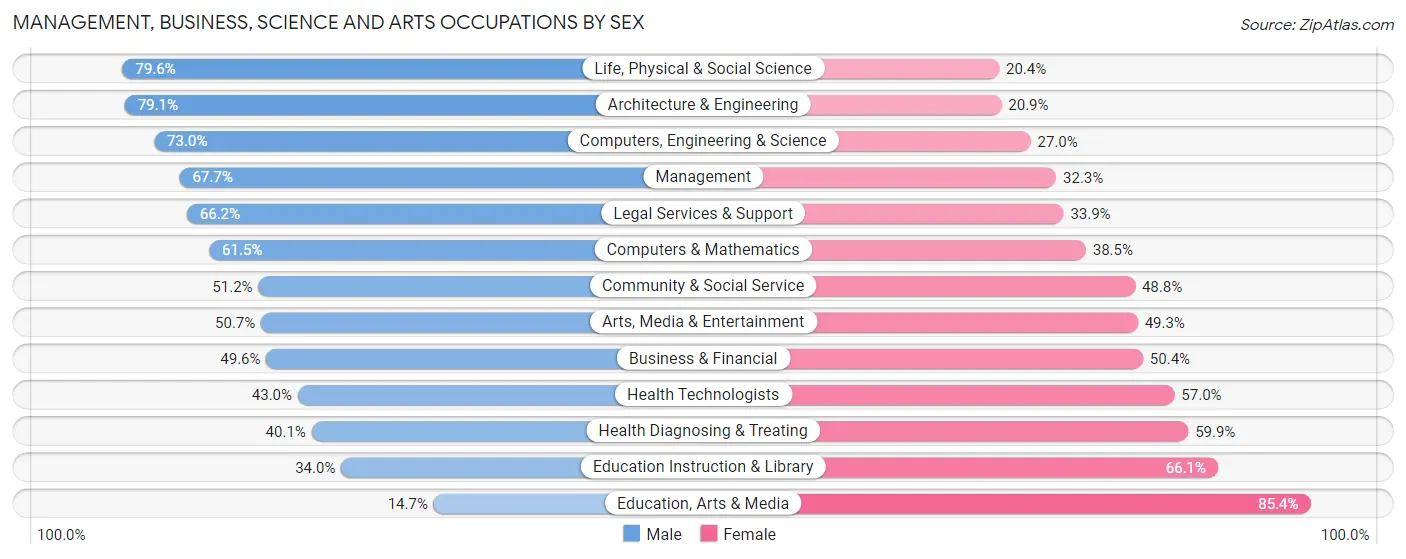
Management, Business, Science and Arts Occupations by Sex
Within the Management, Business, Science and Arts occupations in Birmingham, the most male-oriented occupations are Life, Physical & Social Science (79.6%), Architecture & Engineering (79.1%), and Computers, Engineering & Science (73.0%), while the most female-oriented occupations are Education, Arts & Media (85.4%), Education Instruction & Library (66.0%), and Health Diagnosing & Treating (59.9%).
| Occupation | Male | Female |
| Management | 1,786 (67.7%) | 853 (32.3%) |
| Business & Financial | 638 (49.6%) | 649 (50.4%) |
| Computers, Engineering & Science | 649 (73.0%) | 240 (27.0%) |
| Computers & Mathematics | 190 (61.5%) | 119 (38.5%) |
| Architecture & Engineering | 420 (79.1%) | 111 (20.9%) |
| Life, Physical & Social Science | 39 (79.6%) | 10 (20.4%) |
| Community & Social Service | 914 (51.2%) | 870 (48.8%) |
| Education, Arts & Media | 23 (14.6%) | 134 (85.4%) |
| Legal Services & Support | 592 (66.1%) | 303 (33.9%) |
| Education Instruction & Library | 146 (34.0%) | 284 (66.0%) |
| Arts, Media & Entertainment | 153 (50.7%) | 149 (49.3%) |
| Health Diagnosing & Treating | 461 (40.1%) | 688 (59.9%) |
| Health Technologists | 461 (43.0%) | 611 (57.0%) |
| Total (Category) | 4,448 (57.4%) | 3,300 (42.6%) |
| Total (Overall) | 6,225 (55.4%) | 5,018 (44.6%) |
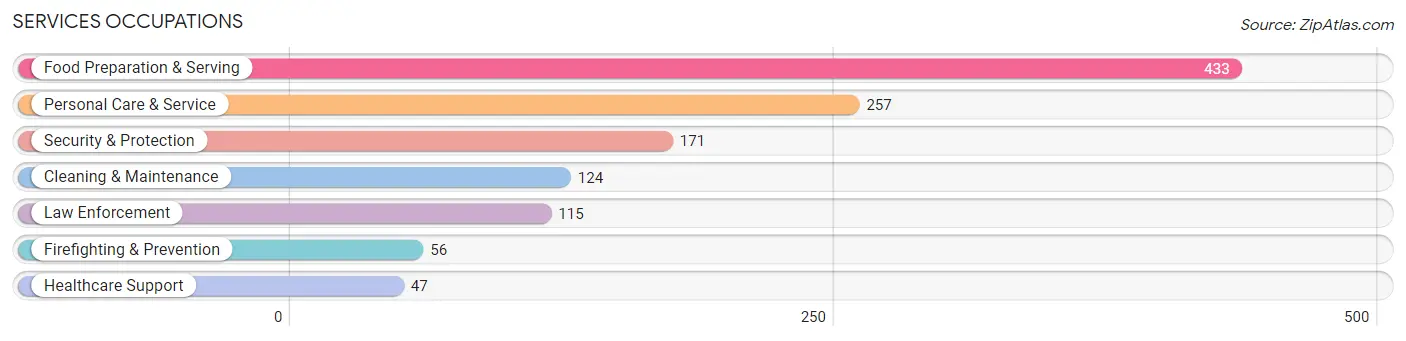
Services Occupations
The most common Services occupations in Birmingham are Food Preparation & Serving (433 | 3.8%), Personal Care & Service (257 | 2.3%), Security & Protection (171 | 1.5%), Cleaning & Maintenance (124 | 1.1%), and Law Enforcement (115 | 1.0%).
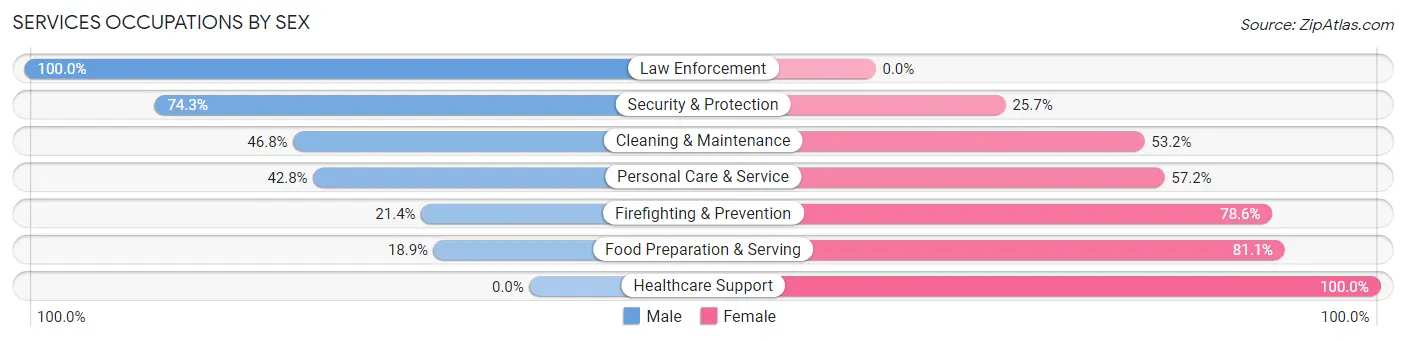
Services Occupations by Sex
Within the Services occupations in Birmingham, the most male-oriented occupations are Law Enforcement (100.0%), Security & Protection (74.3%), and Cleaning & Maintenance (46.8%), while the most female-oriented occupations are Healthcare Support (100.0%), Food Preparation & Serving (81.1%), and Firefighting & Prevention (78.6%).
| Occupation | Male | Female |
| Healthcare Support | 0 (0.0%) | 47 (100.0%) |
| Security & Protection | 127 (74.3%) | 44 (25.7%) |
| Firefighting & Prevention | 12 (21.4%) | 44 (78.6%) |
| Law Enforcement | 115 (100.0%) | 0 (0.0%) |
| Food Preparation & Serving | 82 (18.9%) | 351 (81.1%) |
| Cleaning & Maintenance | 58 (46.8%) | 66 (53.2%) |
| Personal Care & Service | 110 (42.8%) | 147 (57.2%) |
| Total (Category) | 377 (36.5%) | 655 (63.5%) |
| Total (Overall) | 6,225 (55.4%) | 5,018 (44.6%) |
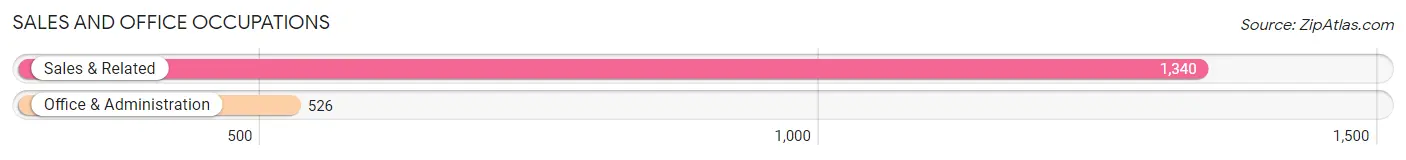
Sales and Office Occupations
The most common Sales and Office occupations in Birmingham are Sales & Related (1,340 | 11.9%), and Office & Administration (526 | 4.7%).
Sales and Office Occupations by Sex
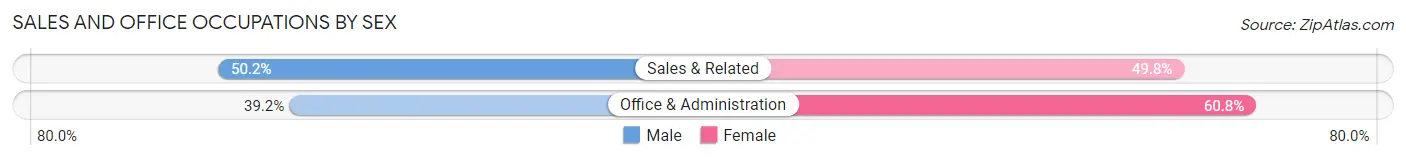
| Occupation | Male | Female |
| Sales & Related | 673 (50.2%) | 667 (49.8%) |
| Office & Administration | 206 (39.2%) | 320 (60.8%) |
| Total (Category) | 879 (47.1%) | 987 (52.9%) |
| Total (Overall) | 6,225 (55.4%) | 5,018 (44.6%) |
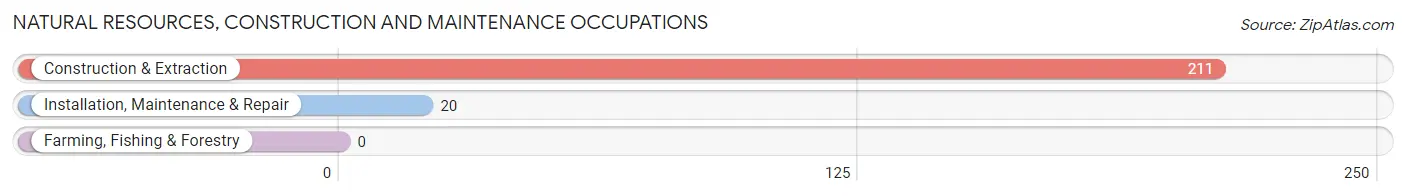
Natural Resources, Construction and Maintenance Occupations
The most common Natural Resources, Construction and Maintenance occupations in Birmingham are Construction & Extraction (211 | 1.9%), and Installation, Maintenance & Repair (20 | 0.2%).
Natural Resources, Construction and Maintenance Occupations by Sex
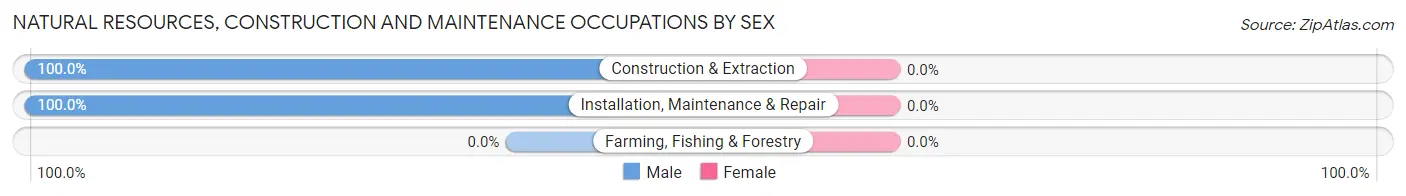
| Occupation | Male | Female |
| Farming, Fishing & Forestry | 0 (0.0%) | 0 (0.0%) |
| Construction & Extraction | 211 (100.0%) | 0 (0.0%) |
| Installation, Maintenance & Repair | 20 (100.0%) | 0 (0.0%) |
| Total (Category) | 231 (100.0%) | 0 (0.0%) |
| Total (Overall) | 6,225 (55.4%) | 5,018 (44.6%) |
Production, Transportation and Moving Occupations
The most common Production, Transportation and Moving occupations in Birmingham are Production (166 | 1.5%), Transportation (105 | 0.9%), and Material Moving (95 | 0.8%).
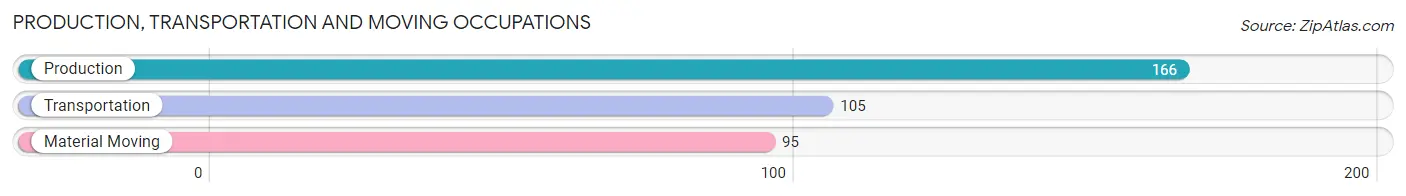
Production, Transportation and Moving Occupations by Sex
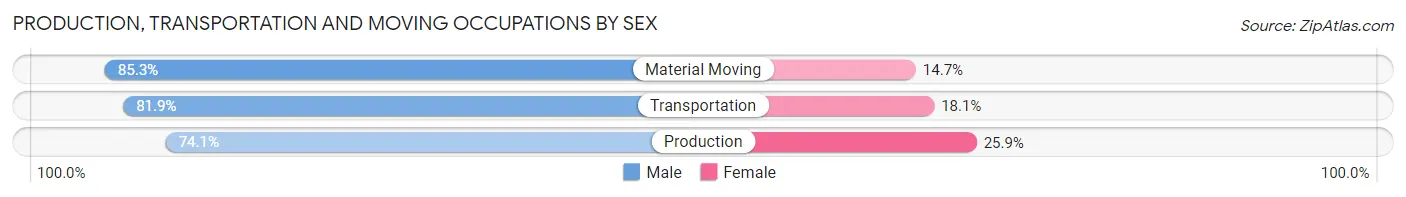
| Occupation | Male | Female |
| Production | 123 (74.1%) | 43 (25.9%) |
| Transportation | 86 (81.9%) | 19 (18.1%) |
| Material Moving | 81 (85.3%) | 14 (14.7%) |
| Total (Category) | 290 (79.2%) | 76 (20.8%) |
| Total (Overall) | 6,225 (55.4%) | 5,018 (44.6%) |
Employment Industries by Sex in Birmingham
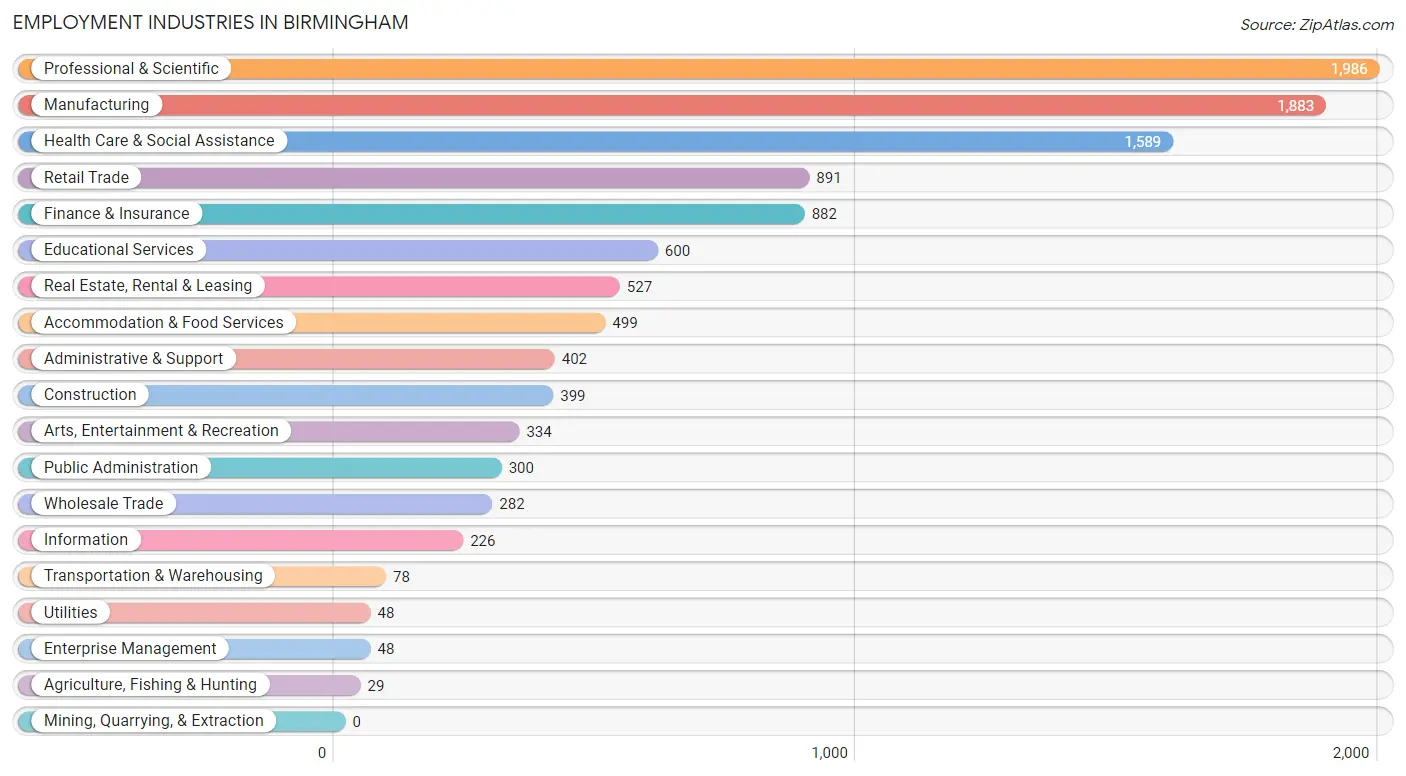
Employment Industries in Birmingham
The major employment industries in Birmingham include Professional & Scientific (1,986 | 17.7%), Manufacturing (1,883 | 16.8%), Health Care & Social Assistance (1,589 | 14.1%), Retail Trade (891 | 7.9%), and Finance & Insurance (882 | 7.8%).
Employment Industries by Sex in Birmingham
The Birmingham industries that see more men than women are Agriculture, Fishing & Hunting (100.0%), Construction (79.4%), and Finance & Insurance (68.4%), whereas the industries that tend to have a higher number of women are Educational Services (72.2%), Accommodation & Food Services (62.1%), and Administrative & Support (56.7%).
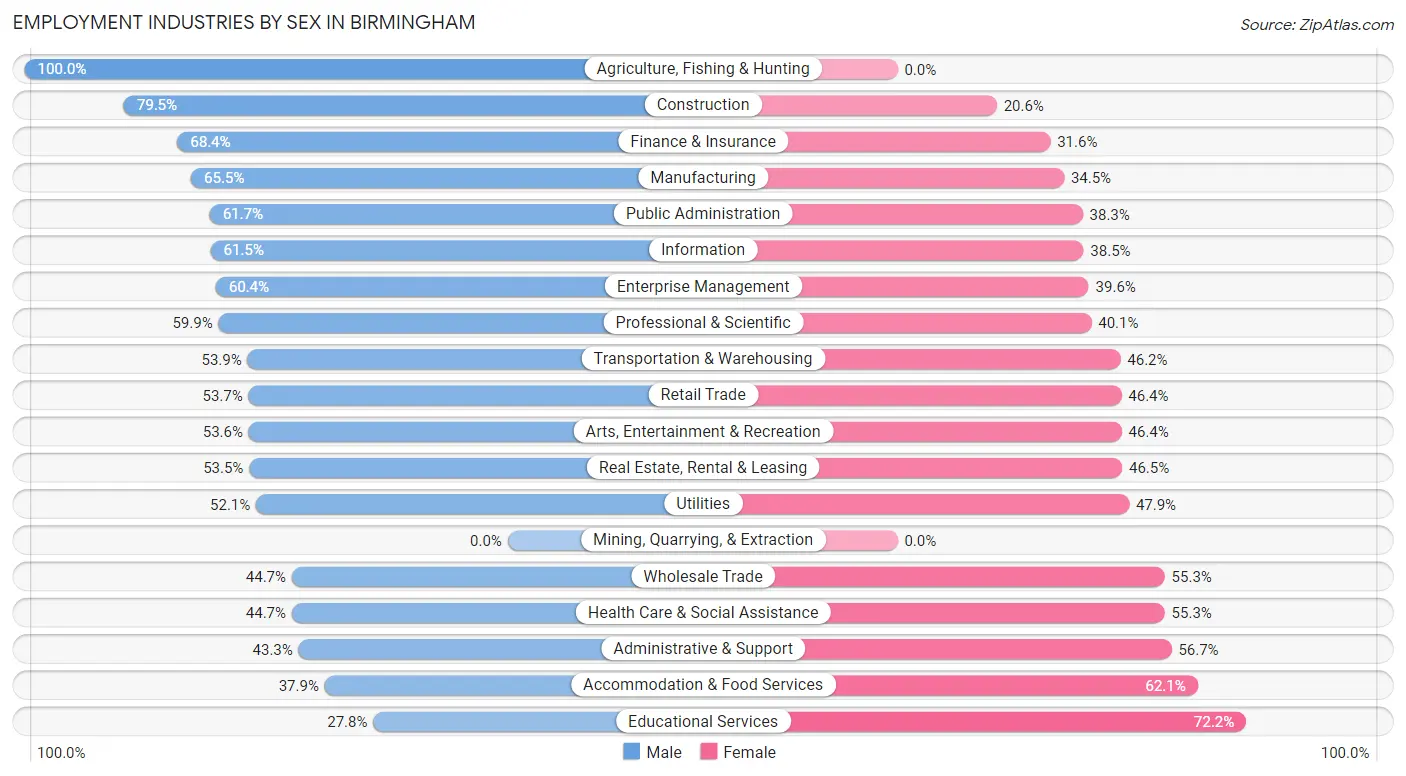
| Industry | Male | Female |
| Agriculture, Fishing & Hunting | 29 (100.0%) | 0 (0.0%) |
| Mining, Quarrying, & Extraction | 0 (0.0%) | 0 (0.0%) |
| Construction | 317 (79.4%) | 82 (20.5%) |
| Manufacturing | 1,234 (65.5%) | 649 (34.5%) |
| Wholesale Trade | 126 (44.7%) | 156 (55.3%) |
| Retail Trade | 478 (53.6%) | 413 (46.4%) |
| Transportation & Warehousing | 42 (53.8%) | 36 (46.2%) |
| Utilities | 25 (52.1%) | 23 (47.9%) |
| Information | 139 (61.5%) | 87 (38.5%) |
| Finance & Insurance | 603 (68.4%) | 279 (31.6%) |
| Real Estate, Rental & Leasing | 282 (53.5%) | 245 (46.5%) |
| Professional & Scientific | 1,189 (59.9%) | 797 (40.1%) |
| Enterprise Management | 29 (60.4%) | 19 (39.6%) |
| Administrative & Support | 174 (43.3%) | 228 (56.7%) |
| Educational Services | 167 (27.8%) | 433 (72.2%) |
| Health Care & Social Assistance | 710 (44.7%) | 879 (55.3%) |
| Arts, Entertainment & Recreation | 179 (53.6%) | 155 (46.4%) |
| Accommodation & Food Services | 189 (37.9%) | 310 (62.1%) |
| Public Administration | 185 (61.7%) | 115 (38.3%) |
| Total | 6,225 (55.4%) | 5,018 (44.6%) |
Education in Birmingham
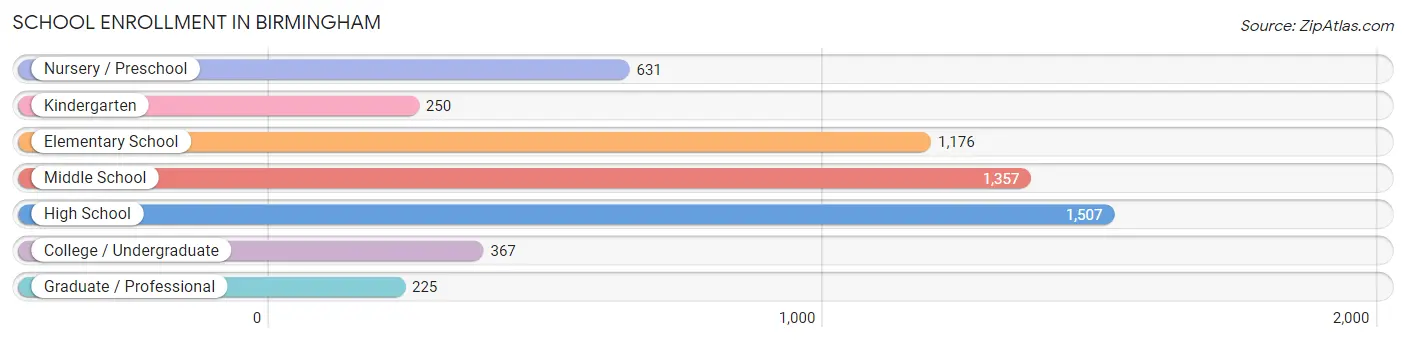
School Enrollment in Birmingham
The most common levels of schooling among the 5,513 students in Birmingham are high school (1,507 | 27.3%), middle school (1,357 | 24.6%), and elementary school (1,176 | 21.3%).
| School Level | # Students | % Students |
| Nursery / Preschool | 631 | 11.5% |
| Kindergarten | 250 | 4.5% |
| Elementary School | 1,176 | 21.3% |
| Middle School | 1,357 | 24.6% |
| High School | 1,507 | 27.3% |
| College / Undergraduate | 367 | 6.7% |
| Graduate / Professional | 225 | 4.1% |
| Total | 5,513 | 100.0% |
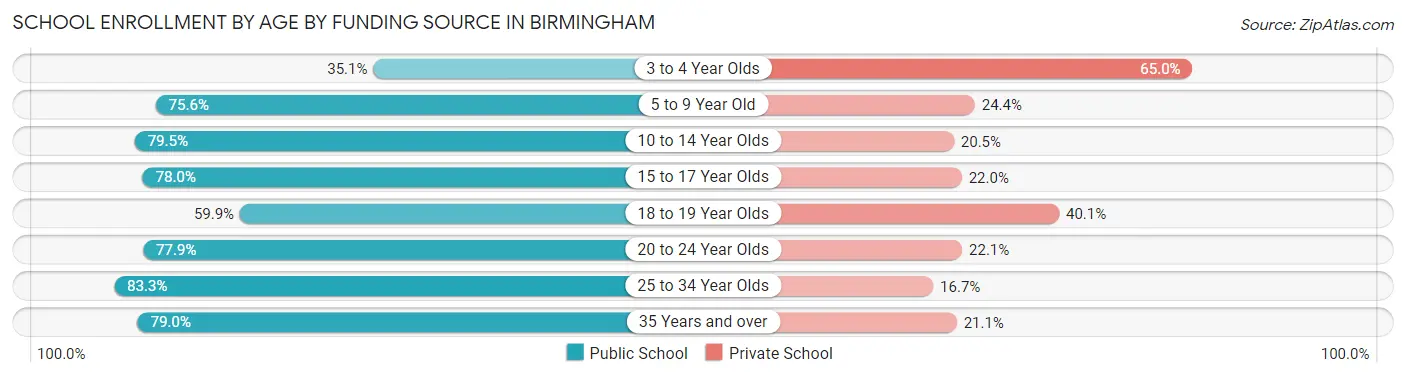
School Enrollment by Age by Funding Source in Birmingham
Out of a total of 5,513 students who are enrolled in schools in Birmingham, 1,494 (27.1%) attend a private institution, while the remaining 4,019 (72.9%) are enrolled in public schools. The age group of 3 to 4 year olds has the highest likelihood of being enrolled in private schools, with 328 (64.9% in the age bracket) enrolled. Conversely, the age group of 25 to 34 year olds has the lowest likelihood of being enrolled in a private school, with 105 (83.3% in the age bracket) attending a public institution.
| Age Bracket | Public School | Private School |
| 3 to 4 Year Olds | 177 (35.0%) | 328 (64.9%) |
| 5 to 9 Year Old | 1,074 (75.6%) | 347 (24.4%) |
| 10 to 14 Year Olds | 1,305 (79.5%) | 337 (20.5%) |
| 15 to 17 Year Olds | 869 (78.0%) | 245 (22.0%) |
| 18 to 19 Year Olds | 209 (59.9%) | 140 (40.1%) |
| 20 to 24 Year Olds | 159 (77.9%) | 45 (22.1%) |
| 25 to 34 Year Olds | 105 (83.3%) | 21 (16.7%) |
| 35 Years and over | 120 (78.9%) | 32 (21.0%) |
| Total | 4,019 (72.9%) | 1,494 (27.1%) |
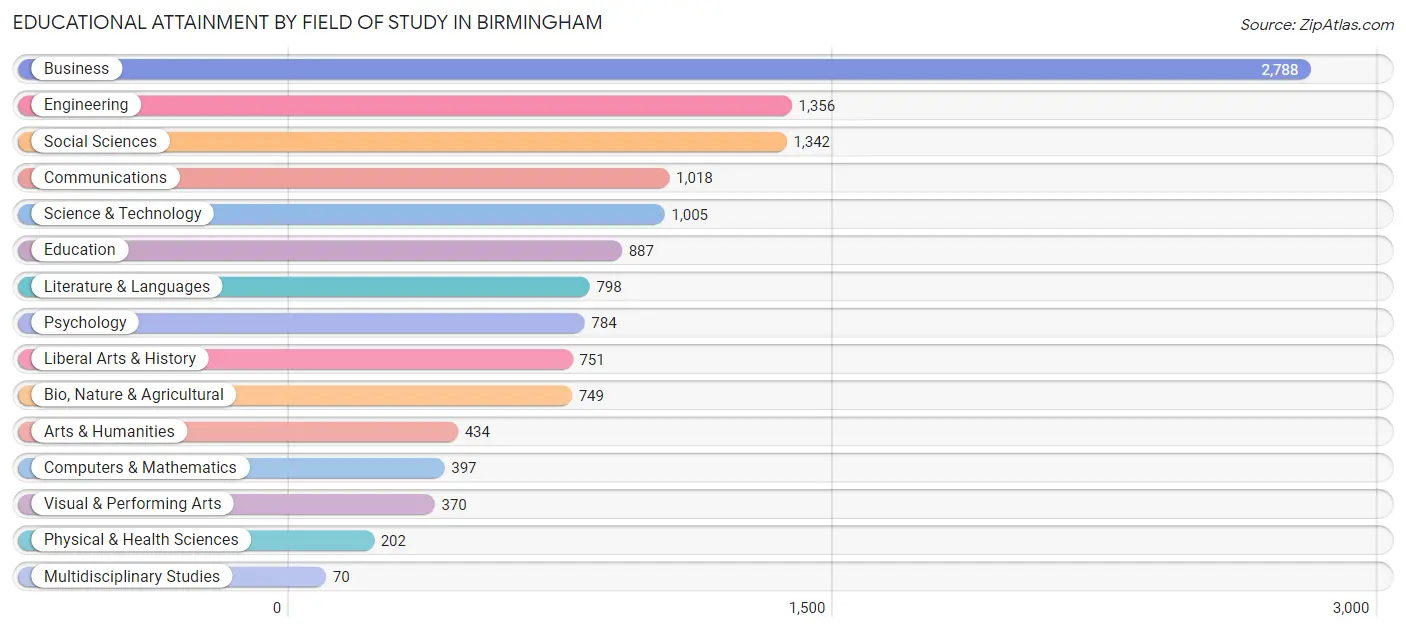
Educational Attainment by Field of Study in Birmingham
Business (2,788 | 21.5%), engineering (1,356 | 10.5%), social sciences (1,342 | 10.4%), communications (1,018 | 7.9%), and science & technology (1,005 | 7.8%) are the most common fields of study among 12,951 individuals in Birmingham who have obtained a bachelor's degree or higher.
| Field of Study | # Graduates | % Graduates |
| Computers & Mathematics | 397 | 3.1% |
| Bio, Nature & Agricultural | 749 | 5.8% |
| Physical & Health Sciences | 202 | 1.6% |
| Psychology | 784 | 6.0% |
| Social Sciences | 1,342 | 10.4% |
| Engineering | 1,356 | 10.5% |
| Multidisciplinary Studies | 70 | 0.5% |
| Science & Technology | 1,005 | 7.8% |
| Business | 2,788 | 21.5% |
| Education | 887 | 6.9% |
| Literature & Languages | 798 | 6.2% |
| Liberal Arts & History | 751 | 5.8% |
| Visual & Performing Arts | 370 | 2.9% |
| Communications | 1,018 | 7.9% |
| Arts & Humanities | 434 | 3.4% |
| Total | 12,951 | 100.0% |
Transportation & Commute in Birmingham
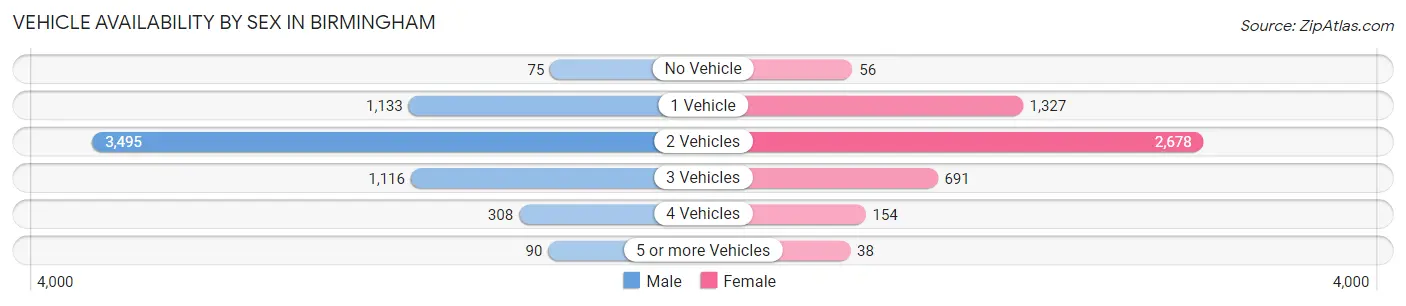
Vehicle Availability by Sex in Birmingham
The most prevalent vehicle ownership categories in Birmingham are males with 2 vehicles (3,495, accounting for 56.2%) and females with 2 vehicles (2,678, making up 70.7%).
| Vehicles Available | Male | Female |
| No Vehicle | 75 (1.2%) | 56 (1.1%) |
| 1 Vehicle | 1,133 (18.2%) | 1,327 (26.8%) |
| 2 Vehicles | 3,495 (56.2%) | 2,678 (54.2%) |
| 3 Vehicles | 1,116 (17.9%) | 691 (14.0%) |
| 4 Vehicles | 308 (5.0%) | 154 (3.1%) |
| 5 or more Vehicles | 90 (1.5%) | 38 (0.8%) |
| Total | 6,217 (100.0%) | 4,944 (100.0%) |
Commute Time in Birmingham
The most frequently occuring commute durations in Birmingham are 15 to 19 minutes (1,485 commuters, 17.2%), 20 to 24 minutes (1,313 commuters, 15.2%), and 5 to 9 minutes (1,232 commuters, 14.3%).
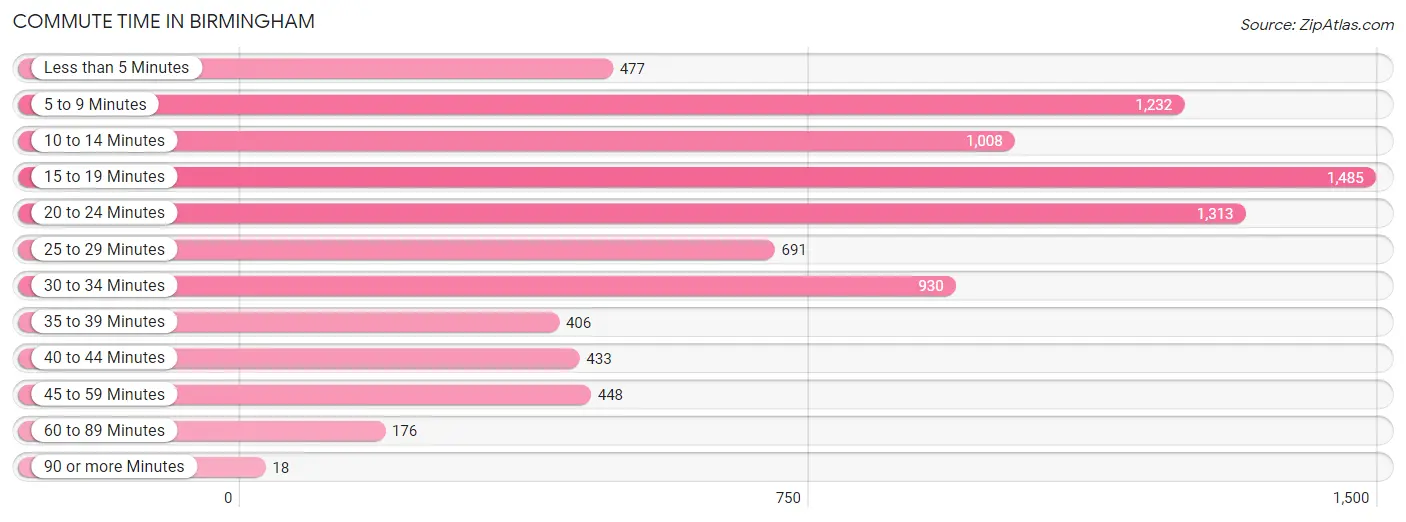
| Commute Time | # Commuters | % Commuters |
| Less than 5 Minutes | 477 | 5.5% |
| 5 to 9 Minutes | 1,232 | 14.3% |
| 10 to 14 Minutes | 1,008 | 11.7% |
| 15 to 19 Minutes | 1,485 | 17.2% |
| 20 to 24 Minutes | 1,313 | 15.2% |
| 25 to 29 Minutes | 691 | 8.0% |
| 30 to 34 Minutes | 930 | 10.8% |
| 35 to 39 Minutes | 406 | 4.7% |
| 40 to 44 Minutes | 433 | 5.0% |
| 45 to 59 Minutes | 448 | 5.2% |
| 60 to 89 Minutes | 176 | 2.0% |
| 90 or more Minutes | 18 | 0.2% |
Commute Time by Sex in Birmingham
The most common commute times in Birmingham are 20 to 24 minutes (834 commuters, 17.2%) for males and 15 to 19 minutes (713 commuters, 18.9%) for females.
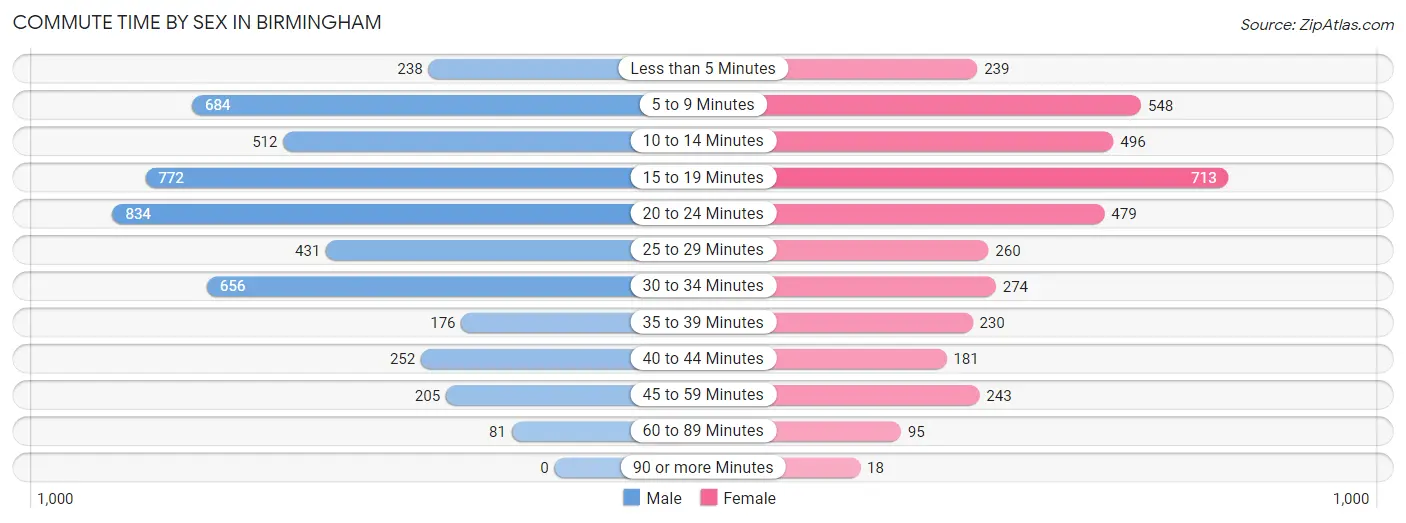
| Commute Time | Male | Female |
| Less than 5 Minutes | 238 (4.9%) | 239 (6.3%) |
| 5 to 9 Minutes | 684 (14.1%) | 548 (14.5%) |
| 10 to 14 Minutes | 512 (10.6%) | 496 (13.1%) |
| 15 to 19 Minutes | 772 (16.0%) | 713 (18.9%) |
| 20 to 24 Minutes | 834 (17.2%) | 479 (12.7%) |
| 25 to 29 Minutes | 431 (8.9%) | 260 (6.9%) |
| 30 to 34 Minutes | 656 (13.6%) | 274 (7.3%) |
| 35 to 39 Minutes | 176 (3.6%) | 230 (6.1%) |
| 40 to 44 Minutes | 252 (5.2%) | 181 (4.8%) |
| 45 to 59 Minutes | 205 (4.2%) | 243 (6.4%) |
| 60 to 89 Minutes | 81 (1.7%) | 95 (2.5%) |
| 90 or more Minutes | 0 (0.0%) | 18 (0.5%) |
Time of Departure to Work by Sex in Birmingham
The most frequent times of departure to work in Birmingham are 7:30 AM to 7:59 AM (977, 20.2%) for males and 8:00 AM to 8:29 AM (901, 23.9%) for females.
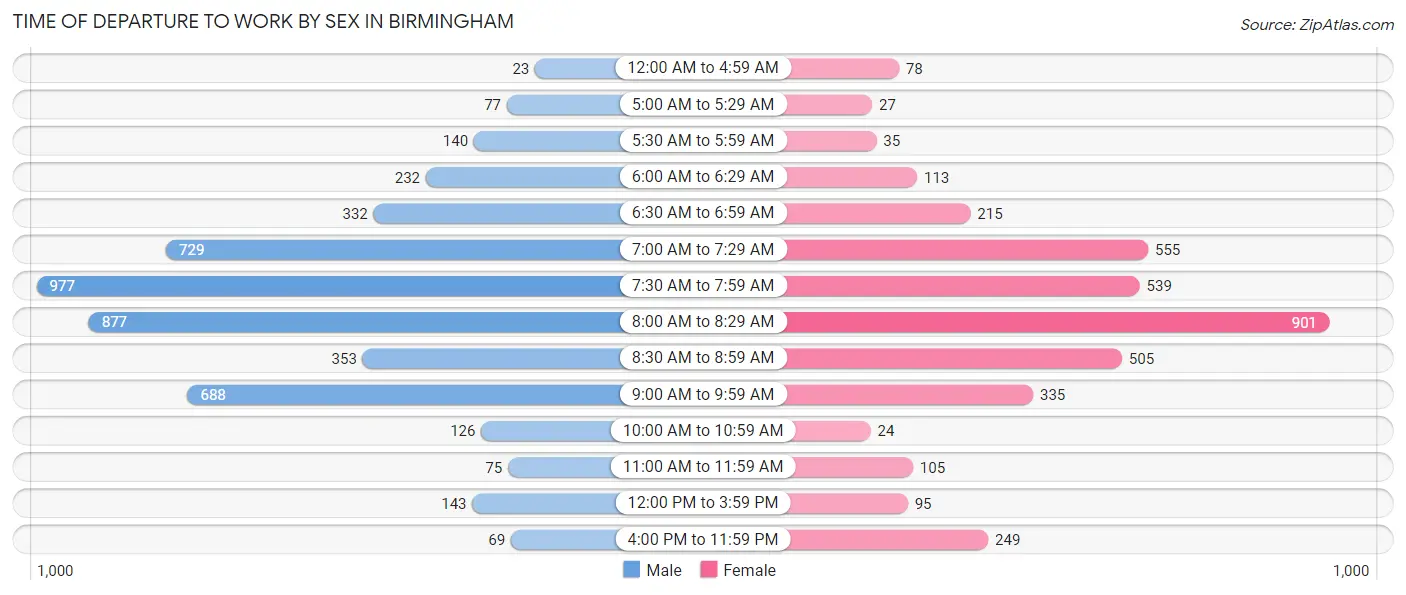
| Time of Departure | Male | Female |
| 12:00 AM to 4:59 AM | 23 (0.5%) | 78 (2.1%) |
| 5:00 AM to 5:29 AM | 77 (1.6%) | 27 (0.7%) |
| 5:30 AM to 5:59 AM | 140 (2.9%) | 35 (0.9%) |
| 6:00 AM to 6:29 AM | 232 (4.8%) | 113 (3.0%) |
| 6:30 AM to 6:59 AM | 332 (6.9%) | 215 (5.7%) |
| 7:00 AM to 7:29 AM | 729 (15.1%) | 555 (14.7%) |
| 7:30 AM to 7:59 AM | 977 (20.2%) | 539 (14.3%) |
| 8:00 AM to 8:29 AM | 877 (18.1%) | 901 (23.9%) |
| 8:30 AM to 8:59 AM | 353 (7.3%) | 505 (13.4%) |
| 9:00 AM to 9:59 AM | 688 (14.2%) | 335 (8.9%) |
| 10:00 AM to 10:59 AM | 126 (2.6%) | 24 (0.6%) |
| 11:00 AM to 11:59 AM | 75 (1.5%) | 105 (2.8%) |
| 12:00 PM to 3:59 PM | 143 (2.9%) | 95 (2.5%) |
| 4:00 PM to 11:59 PM | 69 (1.4%) | 249 (6.6%) |
| Total | 4,841 (100.0%) | 3,776 (100.0%) |
Housing Occupancy in Birmingham
Occupancy by Ownership in Birmingham
Of the total 9,383 dwellings in Birmingham, owner-occupied units account for 7,162 (76.3%), while renter-occupied units make up 2,221 (23.7%).
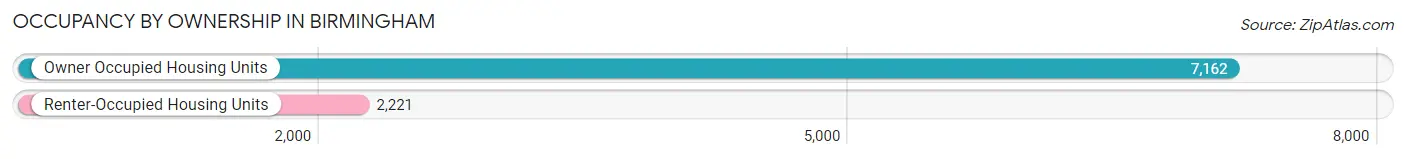
| Occupancy | # Housing Units | % Housing Units |
| Owner Occupied Housing Units | 7,162 | 76.3% |
| Renter-Occupied Housing Units | 2,221 | 23.7% |
| Total Occupied Housing Units | 9,383 | 100.0% |
Occupancy by Household Size in Birmingham
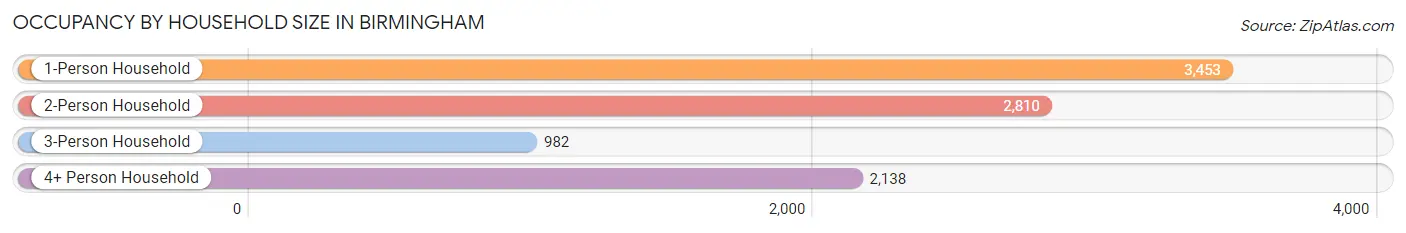
| Household Size | # Housing Units | % Housing Units |
| 1-Person Household | 3,453 | 36.8% |
| 2-Person Household | 2,810 | 29.9% |
| 3-Person Household | 982 | 10.5% |
| 4+ Person Household | 2,138 | 22.8% |
| Total Housing Units | 9,383 | 100.0% |
Occupancy by Ownership by Household Size in Birmingham
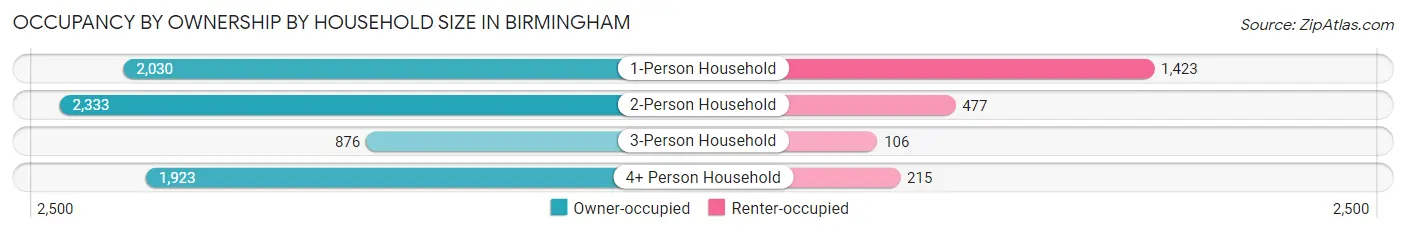
| Household Size | Owner-occupied | Renter-occupied |
| 1-Person Household | 2,030 (58.8%) | 1,423 (41.2%) |
| 2-Person Household | 2,333 (83.0%) | 477 (17.0%) |
| 3-Person Household | 876 (89.2%) | 106 (10.8%) |
| 4+ Person Household | 1,923 (89.9%) | 215 (10.1%) |
| Total Housing Units | 7,162 (76.3%) | 2,221 (23.7%) |
Occupancy by Educational Attainment in Birmingham
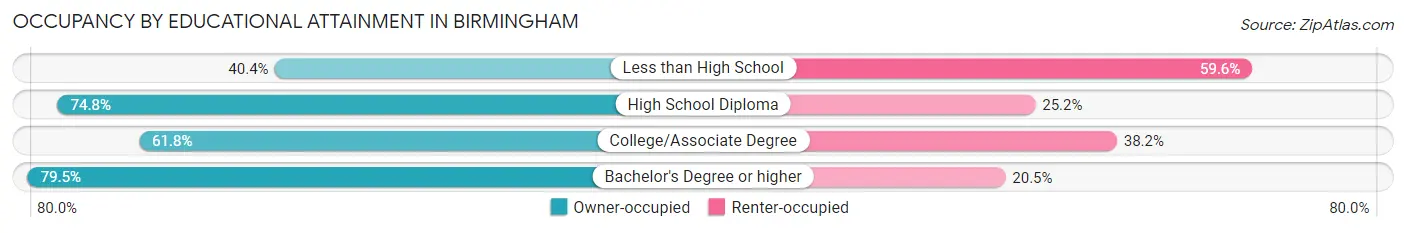
| Household Size | Owner-occupied | Renter-occupied |
| Less than High School | 21 (40.4%) | 31 (59.6%) |
| High School Diploma | 385 (74.8%) | 130 (25.2%) |
| College/Associate Degree | 888 (61.8%) | 548 (38.2%) |
| Bachelor's Degree or higher | 5,868 (79.5%) | 1,512 (20.5%) |
Occupancy by Age of Householder in Birmingham
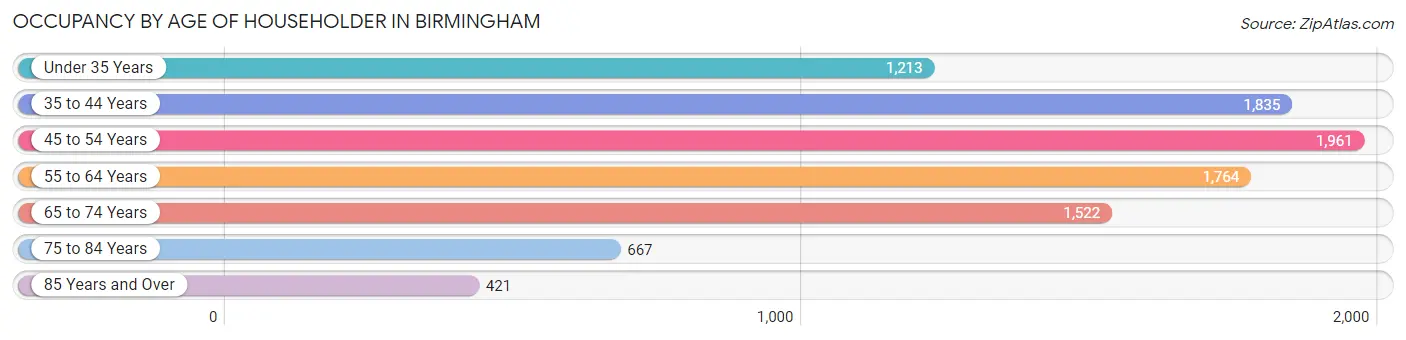
| Age Bracket | # Households | % Households |
| Under 35 Years | 1,213 | 12.9% |
| 35 to 44 Years | 1,835 | 19.6% |
| 45 to 54 Years | 1,961 | 20.9% |
| 55 to 64 Years | 1,764 | 18.8% |
| 65 to 74 Years | 1,522 | 16.2% |
| 75 to 84 Years | 667 | 7.1% |
| 85 Years and Over | 421 | 4.5% |
| Total | 9,383 | 100.0% |
Housing Finances in Birmingham
Median Income by Occupancy in Birmingham
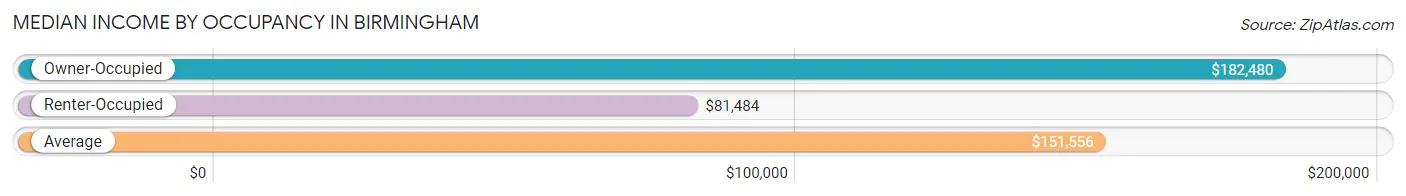
| Occupancy Type | # Households | Median Income |
| Owner-Occupied | 7,162 (76.3%) | $182,480 |
| Renter-Occupied | 2,221 (23.7%) | $81,484 |
| Average | 9,383 (100.0%) | $151,556 |
Occupancy by Householder Income Bracket in Birmingham
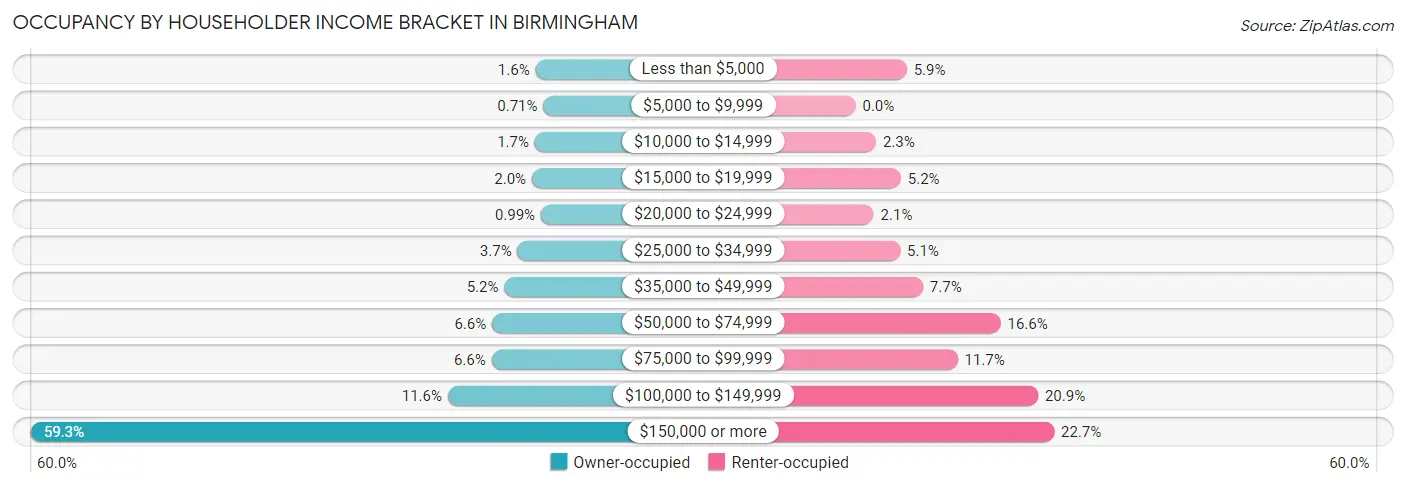
| Income Bracket | Owner-occupied | Renter-occupied |
| Less than $5,000 | 115 (1.6%) | 130 (5.9%) |
| $5,000 to $9,999 | 51 (0.7%) | 0 (0.0%) |
| $10,000 to $14,999 | 121 (1.7%) | 52 (2.3%) |
| $15,000 to $19,999 | 145 (2.0%) | 115 (5.2%) |
| $20,000 to $24,999 | 71 (1.0%) | 46 (2.1%) |
| $25,000 to $34,999 | 263 (3.7%) | 113 (5.1%) |
| $35,000 to $49,999 | 371 (5.2%) | 171 (7.7%) |
| $50,000 to $74,999 | 471 (6.6%) | 368 (16.6%) |
| $75,000 to $99,999 | 475 (6.6%) | 259 (11.7%) |
| $100,000 to $149,999 | 833 (11.6%) | 463 (20.8%) |
| $150,000 or more | 4,246 (59.3%) | 504 (22.7%) |
| Total | 7,162 (100.0%) | 2,221 (100.0%) |
Monthly Housing Cost Tiers in Birmingham
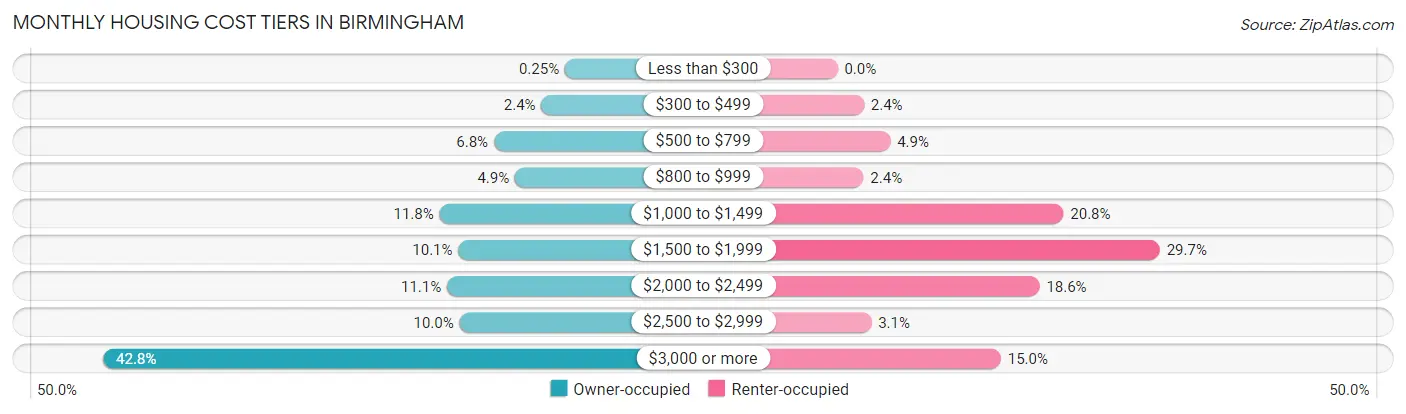
| Monthly Cost | Owner-occupied | Renter-occupied |
| Less than $300 | 18 (0.3%) | 0 (0.0%) |
| $300 to $499 | 173 (2.4%) | 54 (2.4%) |
| $500 to $799 | 486 (6.8%) | 108 (4.9%) |
| $800 to $999 | 347 (4.9%) | 53 (2.4%) |
| $1,000 to $1,499 | 845 (11.8%) | 462 (20.8%) |
| $1,500 to $1,999 | 721 (10.1%) | 659 (29.7%) |
| $2,000 to $2,499 | 796 (11.1%) | 413 (18.6%) |
| $2,500 to $2,999 | 713 (10.0%) | 69 (3.1%) |
| $3,000 or more | 3,063 (42.8%) | 334 (15.0%) |
| Total | 7,162 (100.0%) | 2,221 (100.0%) |
Physical Housing Characteristics in Birmingham
Housing Structures in Birmingham
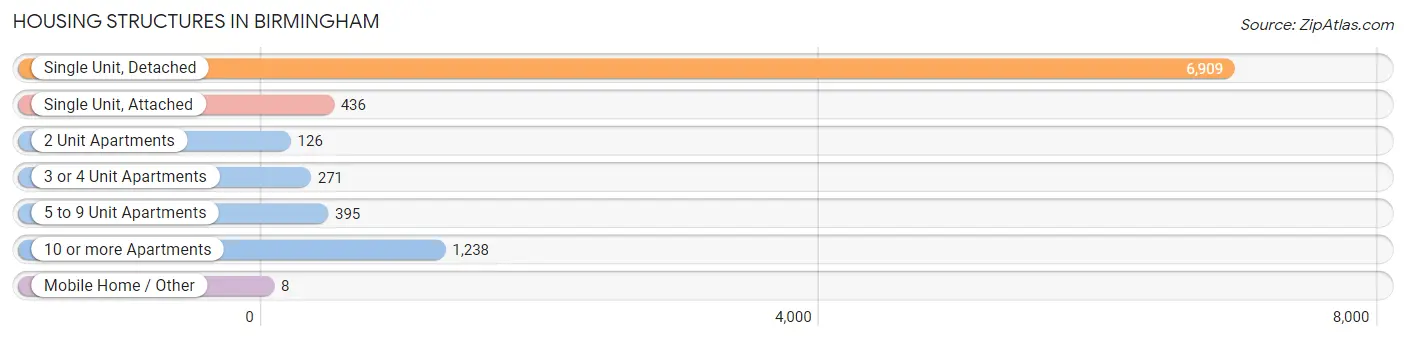
| Structure Type | # Housing Units | % Housing Units |
| Single Unit, Detached | 6,909 | 73.6% |
| Single Unit, Attached | 436 | 4.6% |
| 2 Unit Apartments | 126 | 1.3% |
| 3 or 4 Unit Apartments | 271 | 2.9% |
| 5 to 9 Unit Apartments | 395 | 4.2% |
| 10 or more Apartments | 1,238 | 13.2% |
| Mobile Home / Other | 8 | 0.1% |
| Total | 9,383 | 100.0% |
Housing Structures by Occupancy in Birmingham
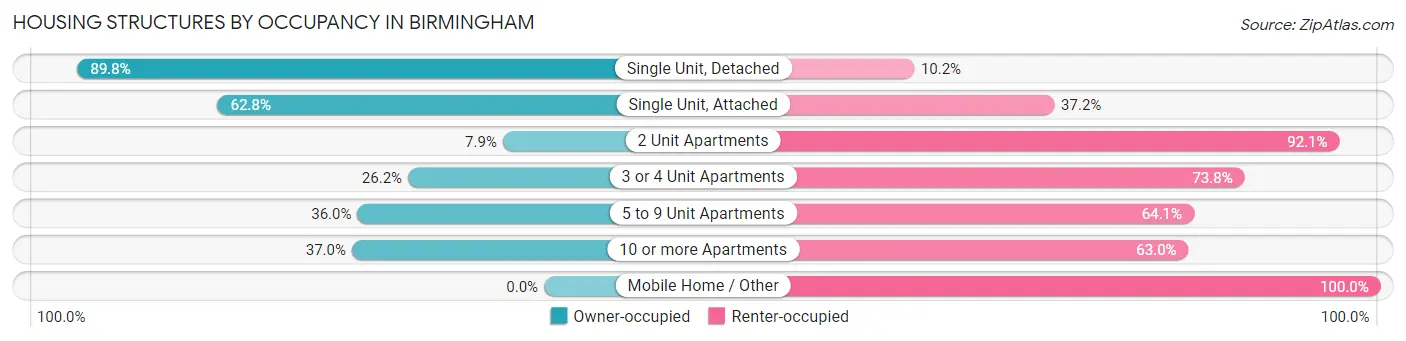
| Structure Type | Owner-occupied | Renter-occupied |
| Single Unit, Detached | 6,207 (89.8%) | 702 (10.2%) |
| Single Unit, Attached | 274 (62.8%) | 162 (37.2%) |
| 2 Unit Apartments | 10 (7.9%) | 116 (92.1%) |
| 3 or 4 Unit Apartments | 71 (26.2%) | 200 (73.8%) |
| 5 to 9 Unit Apartments | 142 (35.9%) | 253 (64.0%) |
| 10 or more Apartments | 458 (37.0%) | 780 (63.0%) |
| Mobile Home / Other | 0 (0.0%) | 8 (100.0%) |
| Total | 7,162 (76.3%) | 2,221 (23.7%) |
Housing Structures by Number of Rooms in Birmingham
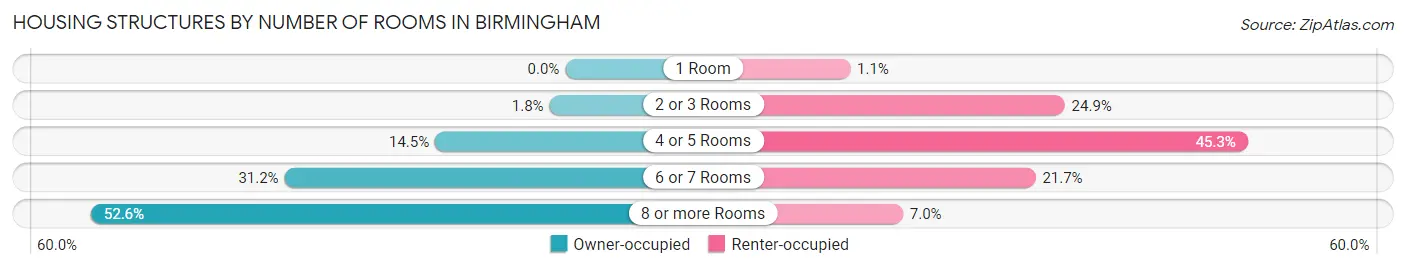
| Number of Rooms | Owner-occupied | Renter-occupied |
| 1 Room | 0 (0.0%) | 25 (1.1%) |
| 2 or 3 Rooms | 125 (1.8%) | 554 (24.9%) |
| 4 or 5 Rooms | 1,035 (14.4%) | 1,005 (45.3%) |
| 6 or 7 Rooms | 2,232 (31.2%) | 482 (21.7%) |
| 8 or more Rooms | 3,770 (52.6%) | 155 (7.0%) |
| Total | 7,162 (100.0%) | 2,221 (100.0%) |
Housing Structure by Heating Type in Birmingham
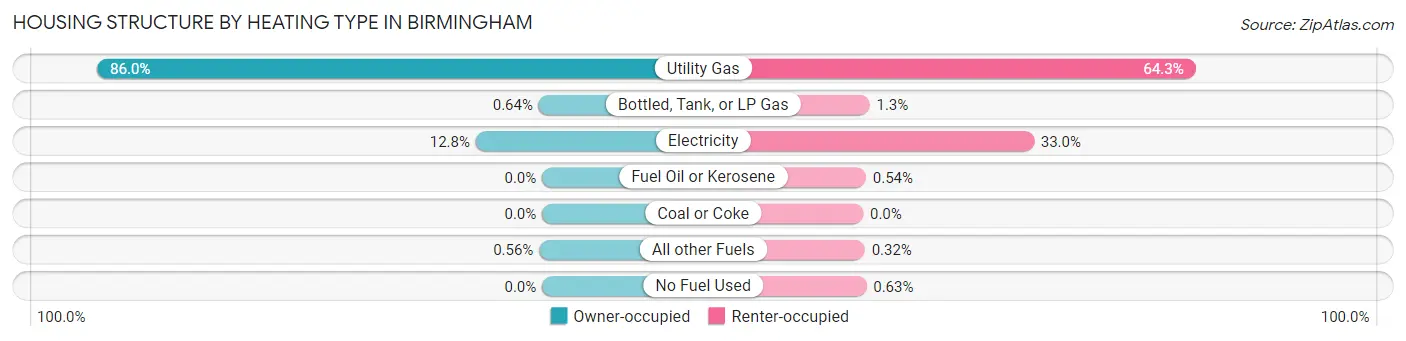
| Heating Type | Owner-occupied | Renter-occupied |
| Utility Gas | 6,158 (86.0%) | 1,427 (64.2%) |
| Bottled, Tank, or LP Gas | 46 (0.6%) | 28 (1.3%) |
| Electricity | 918 (12.8%) | 733 (33.0%) |
| Fuel Oil or Kerosene | 0 (0.0%) | 12 (0.5%) |
| Coal or Coke | 0 (0.0%) | 0 (0.0%) |
| All other Fuels | 40 (0.6%) | 7 (0.3%) |
| No Fuel Used | 0 (0.0%) | 14 (0.6%) |
| Total | 7,162 (100.0%) | 2,221 (100.0%) |
Household Vehicle Usage in Birmingham
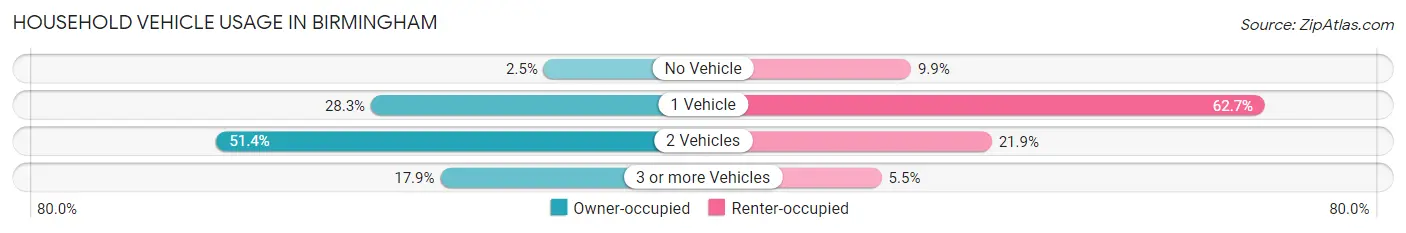
| Vehicles per Household | Owner-occupied | Renter-occupied |
| No Vehicle | 176 (2.5%) | 219 (9.9%) |
| 1 Vehicle | 2,025 (28.3%) | 1,393 (62.7%) |
| 2 Vehicles | 3,678 (51.3%) | 487 (21.9%) |
| 3 or more Vehicles | 1,283 (17.9%) | 122 (5.5%) |
| Total | 7,162 (100.0%) | 2,221 (100.0%) |
Real Estate & Mortgages in Birmingham
Real Estate and Mortgage Overview in Birmingham
| Characteristic | Without Mortgage | With Mortgage |
| Housing Units | 2,201 | 4,961 |
| Median Property Value | $526,400 | $733,500 |
| Median Household Income | $134,830 | $3,279 |
| Monthly Housing Costs | $1,161 | $2,834 |
| Real Estate Taxes | $8,329 | $21 |
Property Value by Mortgage Status in Birmingham
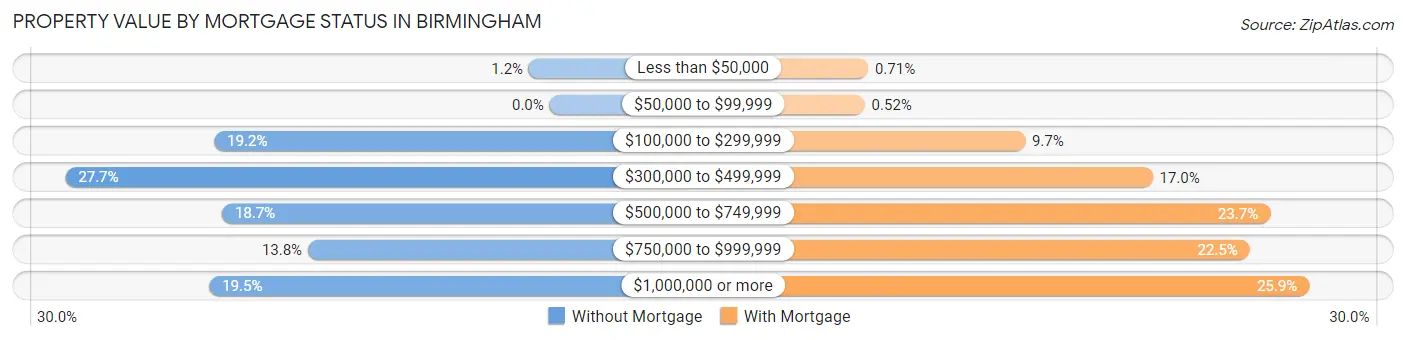
| Property Value | Without Mortgage | With Mortgage |
| Less than $50,000 | 26 (1.2%) | 35 (0.7%) |
| $50,000 to $99,999 | 0 (0.0%) | 26 (0.5%) |
| $100,000 to $299,999 | 422 (19.2%) | 480 (9.7%) |
| $300,000 to $499,999 | 609 (27.7%) | 842 (17.0%) |
| $500,000 to $749,999 | 412 (18.7%) | 1,175 (23.7%) |
| $750,000 to $999,999 | 304 (13.8%) | 1,117 (22.5%) |
| $1,000,000 or more | 428 (19.5%) | 1,286 (25.9%) |
| Total | 2,201 (100.0%) | 4,961 (100.0%) |
Household Income by Mortgage Status in Birmingham
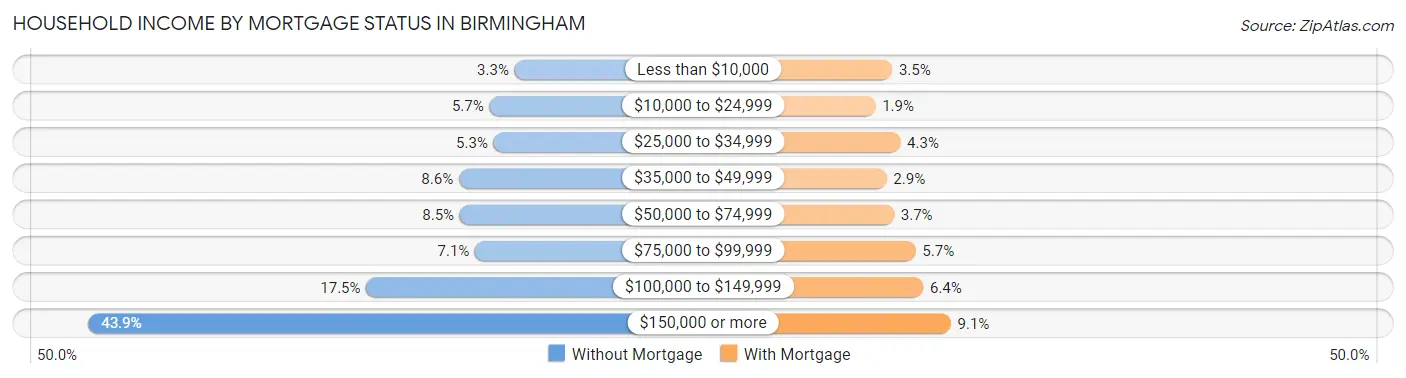
| Household Income | Without Mortgage | With Mortgage |
| Less than $10,000 | 73 (3.3%) | 172 (3.5%) |
| $10,000 to $24,999 | 126 (5.7%) | 93 (1.9%) |
| $25,000 to $34,999 | 117 (5.3%) | 211 (4.3%) |
| $35,000 to $49,999 | 190 (8.6%) | 146 (2.9%) |
| $50,000 to $74,999 | 188 (8.5%) | 181 (3.6%) |
| $75,000 to $99,999 | 156 (7.1%) | 283 (5.7%) |
| $100,000 to $149,999 | 384 (17.4%) | 319 (6.4%) |
| $150,000 or more | 967 (43.9%) | 449 (9.0%) |
| Total | 2,201 (100.0%) | 4,961 (100.0%) |
Property Value to Household Income Ratio in Birmingham
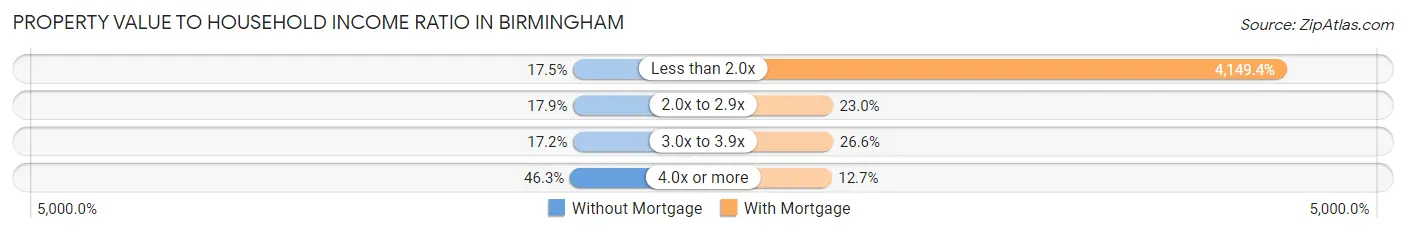
| Value-to-Income Ratio | Without Mortgage | With Mortgage |
| Less than 2.0x | 386 (17.5%) | 205,852 (4,149.4%) |
| 2.0x to 2.9x | 393 (17.9%) | 1,142 (23.0%) |
| 3.0x to 3.9x | 379 (17.2%) | 1,317 (26.6%) |
| 4.0x or more | 1,018 (46.3%) | 631 (12.7%) |
| Total | 2,201 (100.0%) | 4,961 (100.0%) |
Real Estate Taxes by Mortgage Status in Birmingham
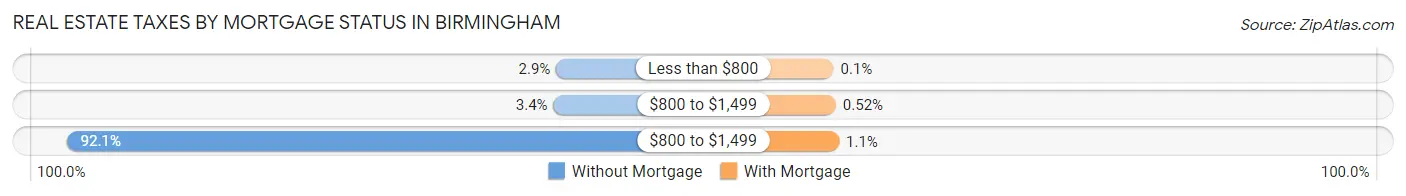
| Property Taxes | Without Mortgage | With Mortgage |
| Less than $800 | 64 (2.9%) | 5 (0.1%) |
| $800 to $1,499 | 75 (3.4%) | 26 (0.5%) |
| $800 to $1,499 | 2,028 (92.1%) | 55 (1.1%) |
| Total | 2,201 (100.0%) | 4,961 (100.0%) |
Health & Disability in Birmingham
Health Insurance Coverage by Age in Birmingham
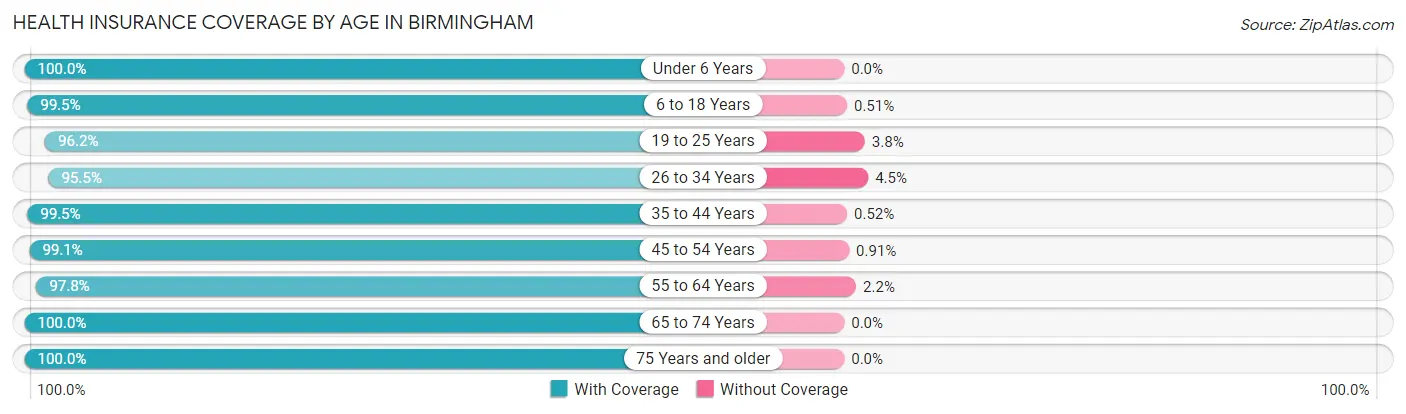
| Age Bracket | With Coverage | Without Coverage |
| Under 6 Years | 1,687 (100.0%) | 0 (0.0%) |
| 6 to 18 Years | 4,293 (99.5%) | 22 (0.5%) |
| 19 to 25 Years | 701 (96.2%) | 28 (3.8%) |
| 26 to 34 Years | 1,863 (95.5%) | 87 (4.5%) |
| 35 to 44 Years | 3,070 (99.5%) | 16 (0.5%) |
| 45 to 54 Years | 3,160 (99.1%) | 29 (0.9%) |
| 55 to 64 Years | 2,967 (97.8%) | 67 (2.2%) |
| 65 to 74 Years | 2,273 (100.0%) | 0 (0.0%) |
| 75 Years and older | 1,458 (100.0%) | 0 (0.0%) |
| Total | 21,472 (98.9%) | 249 (1.1%) |
Health Insurance Coverage by Citizenship Status in Birmingham
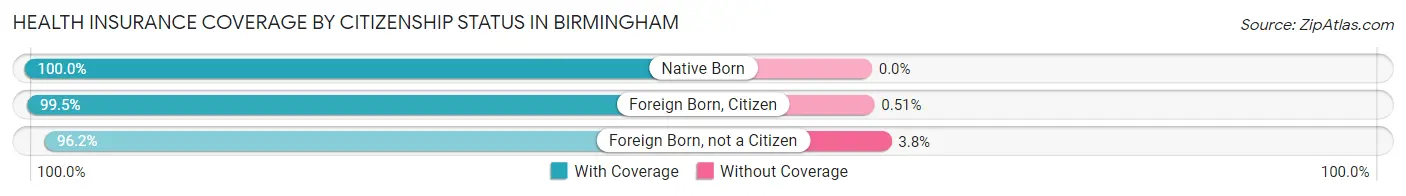
| Citizenship Status | With Coverage | Without Coverage |
| Native Born | 1,687 (100.0%) | 0 (0.0%) |
| Foreign Born, Citizen | 4,293 (99.5%) | 22 (0.5%) |
| Foreign Born, not a Citizen | 701 (96.2%) | 28 (3.8%) |
Health Insurance Coverage by Household Income in Birmingham
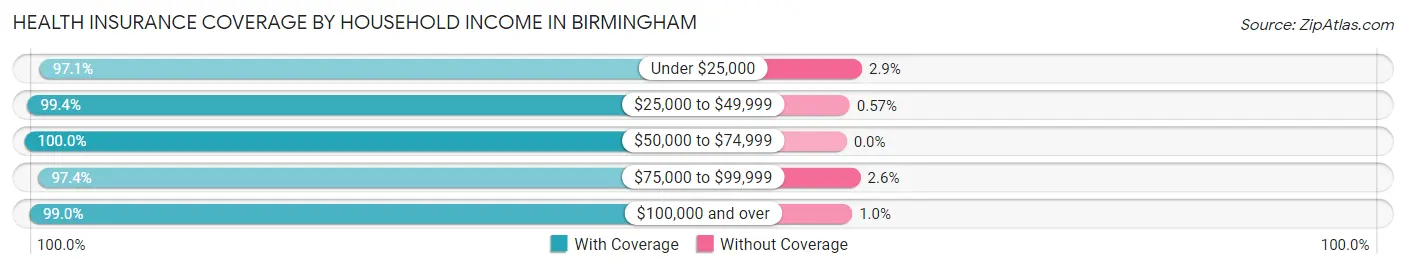
| Household Income | With Coverage | Without Coverage |
| Under $25,000 | 1,357 (97.1%) | 40 (2.9%) |
| $25,000 to $49,999 | 1,211 (99.4%) | 7 (0.6%) |
| $50,000 to $74,999 | 1,332 (100.0%) | 0 (0.0%) |
| $75,000 to $99,999 | 1,234 (97.4%) | 33 (2.6%) |
| $100,000 and over | 16,338 (99.0%) | 169 (1.0%) |
Public vs Private Health Insurance Coverage by Age in Birmingham
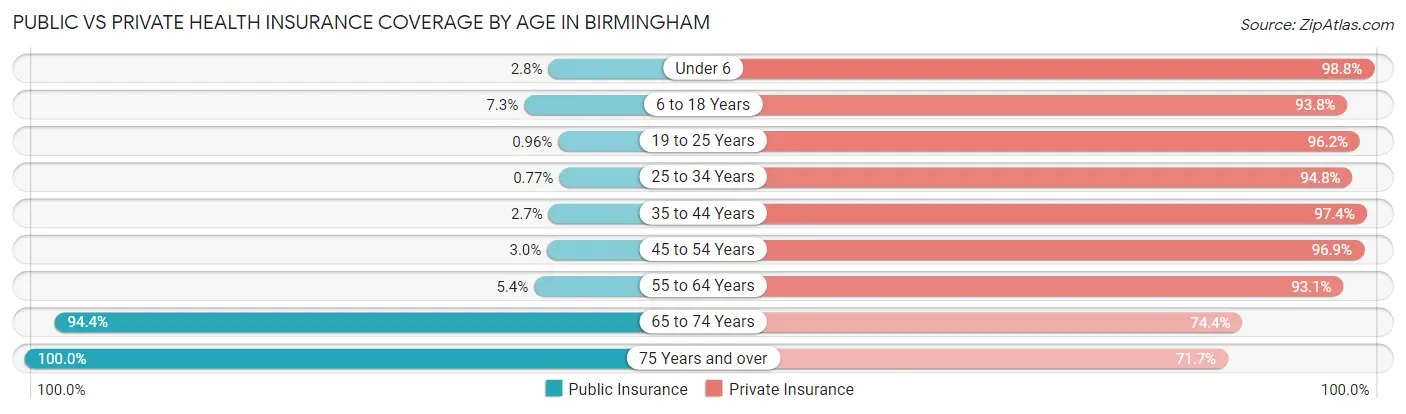
| Age Bracket | Public Insurance | Private Insurance |
| Under 6 | 47 (2.8%) | 1,667 (98.8%) |
| 6 to 18 Years | 315 (7.3%) | 4,049 (93.8%) |
| 19 to 25 Years | 7 (1.0%) | 701 (96.2%) |
| 25 to 34 Years | 15 (0.8%) | 1,848 (94.8%) |
| 35 to 44 Years | 84 (2.7%) | 3,006 (97.4%) |
| 45 to 54 Years | 96 (3.0%) | 3,090 (96.9%) |
| 55 to 64 Years | 165 (5.4%) | 2,825 (93.1%) |
| 65 to 74 Years | 2,146 (94.4%) | 1,690 (74.4%) |
| 75 Years and over | 1,458 (100.0%) | 1,045 (71.7%) |
| Total | 4,333 (20.0%) | 19,921 (91.7%) |
Disability Status by Sex by Age in Birmingham
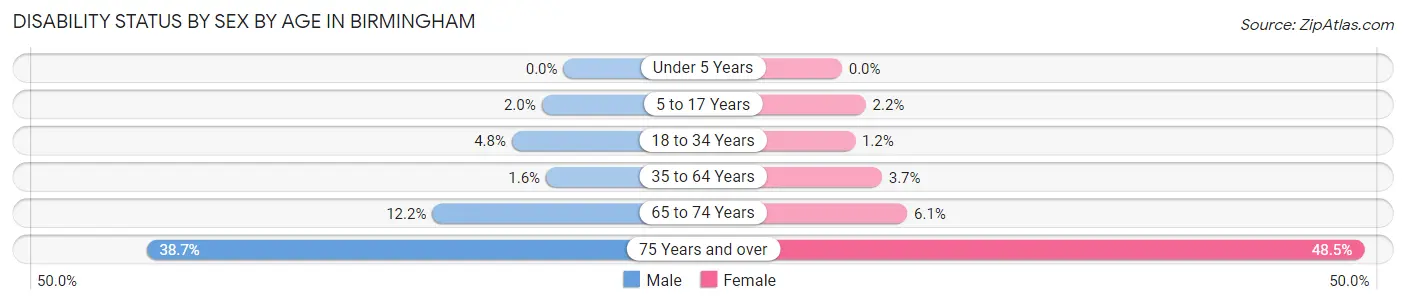
| Age Bracket | Male | Female |
| Under 5 Years | 0 (0.0%) | 0 (0.0%) |
| 5 to 17 Years | 46 (2.0%) | 44 (2.2%) |
| 18 to 34 Years | 71 (4.8%) | 18 (1.2%) |
| 35 to 64 Years | 73 (1.6%) | 178 (3.7%) |
| 65 to 74 Years | 132 (12.2%) | 72 (6.1%) |
| 75 Years and over | 224 (38.7%) | 426 (48.5%) |
Disability Class by Sex by Age in Birmingham
Disability Class: Hearing Difficulty
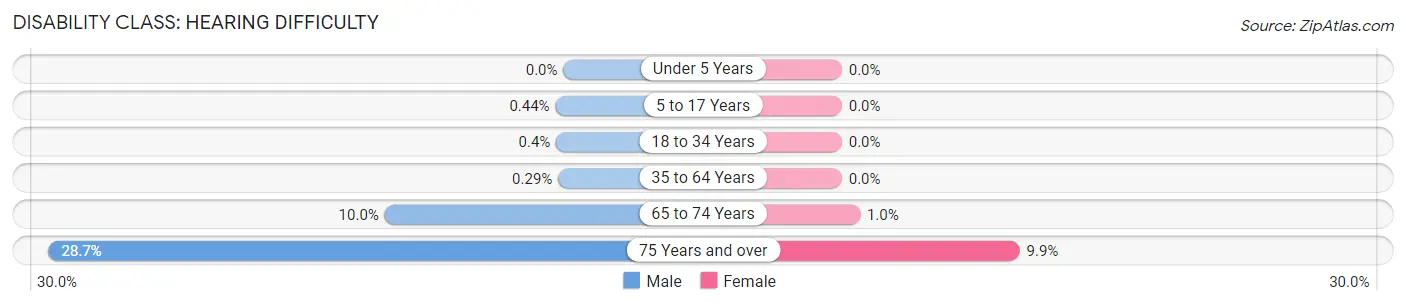
| Age Bracket | Male | Female |
| Under 5 Years | 0 (0.0%) | 0 (0.0%) |
| 5 to 17 Years | 10 (0.4%) | 0 (0.0%) |
| 18 to 34 Years | 6 (0.4%) | 0 (0.0%) |
| 35 to 64 Years | 13 (0.3%) | 0 (0.0%) |
| 65 to 74 Years | 108 (10.0%) | 12 (1.0%) |
| 75 Years and over | 166 (28.7%) | 87 (9.9%) |
Disability Class: Vision Difficulty
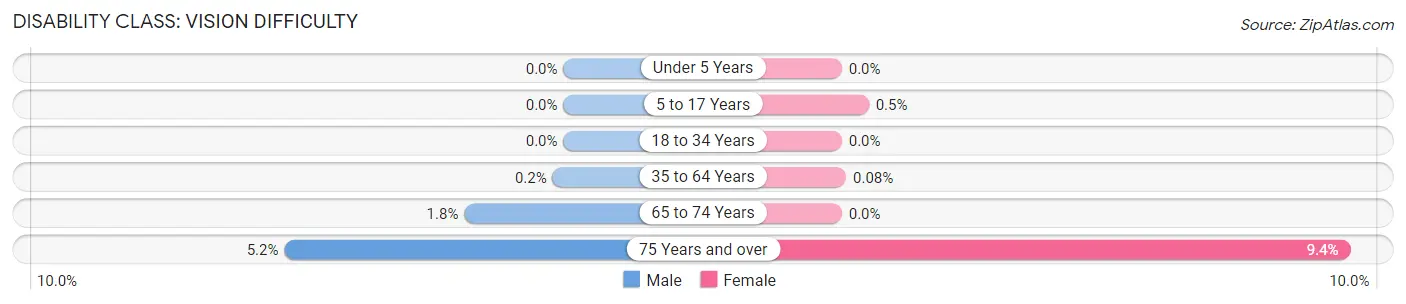
| Age Bracket | Male | Female |
| Under 5 Years | 0 (0.0%) | 0 (0.0%) |
| 5 to 17 Years | 0 (0.0%) | 10 (0.5%) |
| 18 to 34 Years | 0 (0.0%) | 0 (0.0%) |
| 35 to 64 Years | 9 (0.2%) | 4 (0.1%) |
| 65 to 74 Years | 20 (1.8%) | 0 (0.0%) |
| 75 Years and over | 30 (5.2%) | 83 (9.4%) |
Disability Class: Cognitive Difficulty
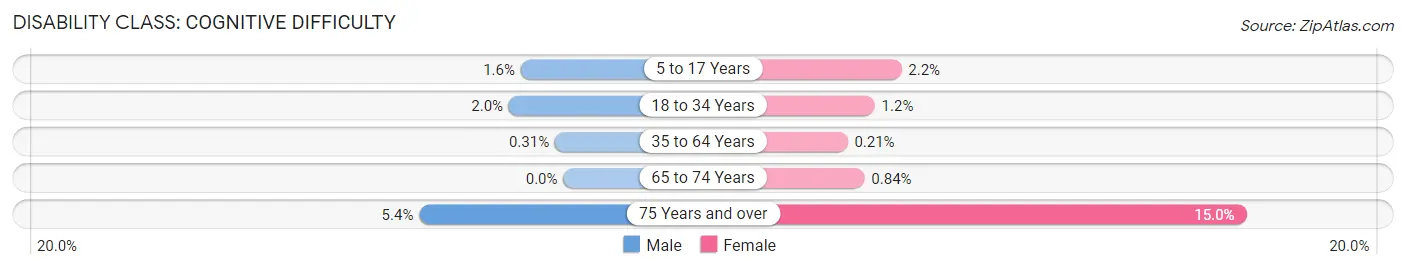
| Age Bracket | Male | Female |
| 5 to 17 Years | 36 (1.6%) | 44 (2.2%) |
| 18 to 34 Years | 30 (2.0%) | 18 (1.2%) |
| 35 to 64 Years | 14 (0.3%) | 10 (0.2%) |
| 65 to 74 Years | 0 (0.0%) | 10 (0.8%) |
| 75 Years and over | 31 (5.3%) | 132 (15.0%) |
Disability Class: Ambulatory Difficulty
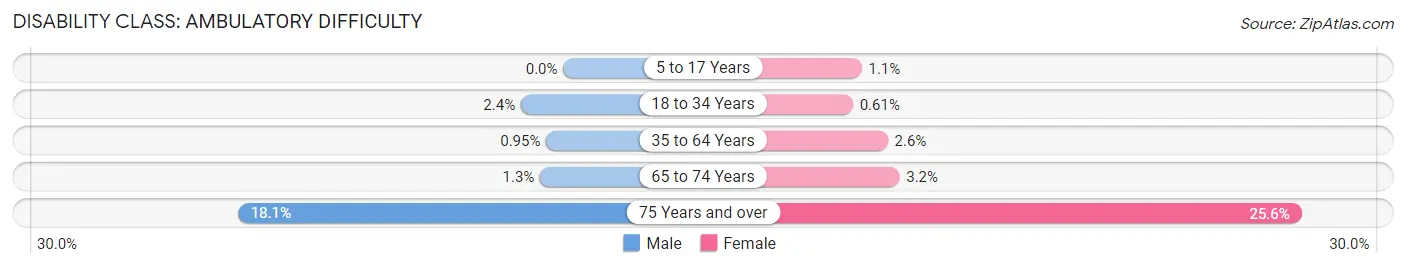
| Age Bracket | Male | Female |
| 5 to 17 Years | 0 (0.0%) | 22 (1.1%) |
| 18 to 34 Years | 35 (2.4%) | 9 (0.6%) |
| 35 to 64 Years | 43 (0.9%) | 122 (2.5%) |
| 65 to 74 Years | 14 (1.3%) | 38 (3.2%) |
| 75 Years and over | 105 (18.1%) | 225 (25.6%) |
Disability Class: Self-Care Difficulty
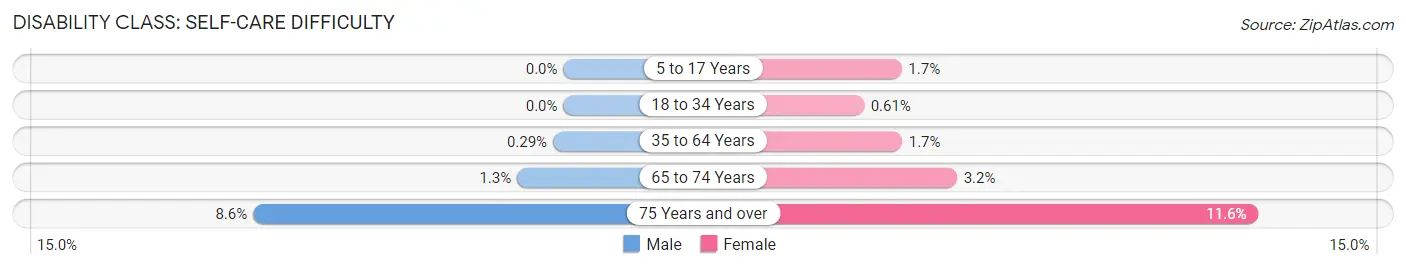
| Age Bracket | Male | Female |
| 5 to 17 Years | 0 (0.0%) | 33 (1.7%) |
| 18 to 34 Years | 0 (0.0%) | 9 (0.6%) |
| 35 to 64 Years | 13 (0.3%) | 80 (1.7%) |
| 65 to 74 Years | 14 (1.3%) | 38 (3.2%) |
| 75 Years and over | 50 (8.6%) | 102 (11.6%) |
Technology Access in Birmingham
Computing Device Access in Birmingham
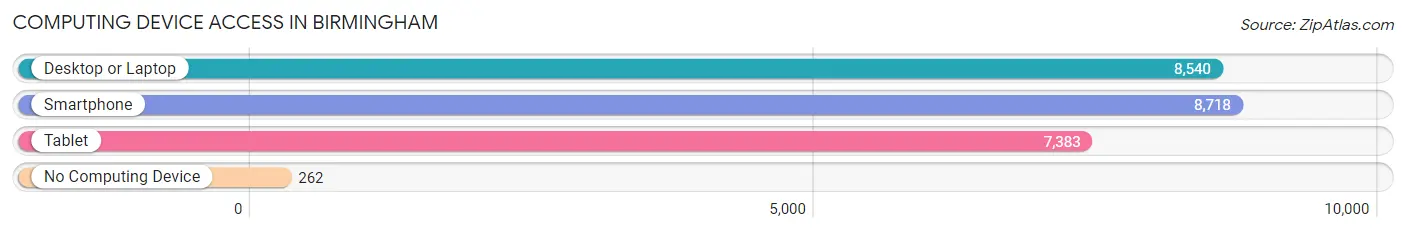
| Device Type | # Households | % Households |
| Desktop or Laptop | 8,540 | 91.0% |
| Smartphone | 8,718 | 92.9% |
| Tablet | 7,383 | 78.7% |
| No Computing Device | 262 | 2.8% |
| Total | 9,383 | 100.0% |
Internet Access in Birmingham
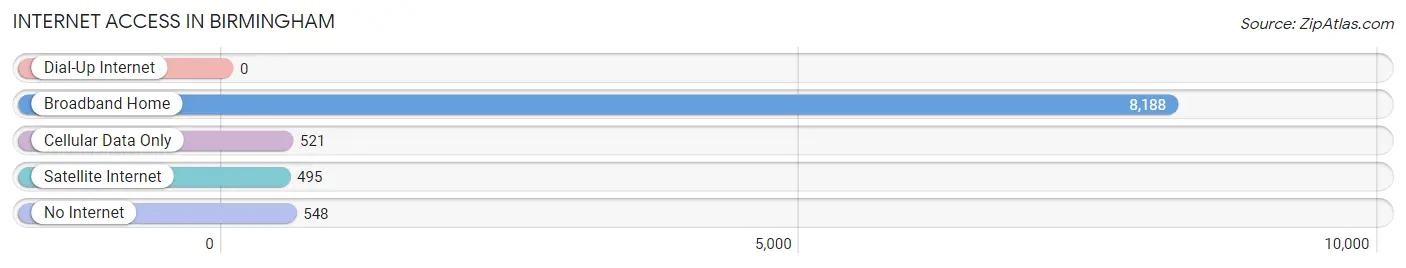
| Internet Type | # Households | % Households |
| Dial-Up Internet | 0 | 0.0% |
| Broadband Home | 8,188 | 87.3% |
| Cellular Data Only | 521 | 5.6% |
| Satellite Internet | 495 | 5.3% |
| No Internet | 548 | 5.8% |
| Total | 9,383 | 100.0% |
Birmingham Summary
Birmingham, Michigan is a city located in Oakland County, Michigan, United States. It is a suburb of Detroit and is part of the Detroit metropolitan area. As of the 2010 census, the population of Birmingham was 20,103.
History
Birmingham was first settled in 1819 by John W. Hunter and his family. The city was named after Birmingham, England, and was incorporated as a village in 1864. The city was incorporated as a city in 1933.
Birmingham was a popular destination for wealthy Detroiters in the late 19th and early 20th centuries. The city was home to many large estates, including the Cranbrook House and Gardens, which was designed by renowned architect Eliel Saarinen.
Geography
Birmingham is located in southeastern Oakland County, approximately 20 miles northwest of Detroit. The city is situated on the Rouge River, which flows into the Detroit River. The city is bordered by Bloomfield Township to the north, Troy to the east, Royal Oak to the south, and Beverly Hills to the west.
Birmingham has a total area of 4.2 square miles, all of which is land. The city is located in the Huron River watershed.
Economy
Birmingham is a major commercial center in Oakland County. The city is home to many upscale retail stores, restaurants, and other businesses. The city is also home to several corporate headquarters, including Beaumont Health, Flagstar Bank, and PulteGroup.
Birmingham is also home to several major employers, including the Detroit Medical Center, St. Joseph Mercy Oakland, and the University of Michigan Health System.
Demographics
As of the 2010 census, there were 20,103 people, 8,845 households, and 5,072 families residing in the city. The population density was 4,817.3 people per square mile. The racial makeup of the city was 87.2% White, 4.3% African American, 0.2% Native American, 6.2% Asian, 0.1% Pacific Islander, 0.7% from other races, and 1.3% from two or more races. Hispanic or Latino of any race were 2.7% of the population.
The median income for a household in the city was $90,945, and the median income for a family was $117,945. The per capita income for the city was $54,945. About 3.2% of families and 4.7% of the population were below the poverty line, including 5.2% of those under age 18 and 4.2% of those age 65 or over.
Common Questions
What is Per Capita Income in Birmingham?
Per Capita income in Birmingham is $101,884.
What is the Median Family Income in Birmingham?
Median Family Income in Birmingham is $233,988.
What is the Median Household income in Birmingham?
Median Household Income in Birmingham is $151,556.
What is Income or Wage Gap in Birmingham?
Income or Wage Gap in Birmingham is 50.0%.
Women in Birmingham earn 50.0 cents for every dollar earned by a man.
What is Family Income Deficit in Birmingham?
Family Income Deficit in Birmingham is $12,972.
Families that are below poverty line in Birmingham earn $12,972 less on average than the poverty threshold level.
What is Inequality or Gini Index in Birmingham?
Inequality or Gini Index in Birmingham is 0.52.
What is the Total Population of Birmingham?
Total Population of Birmingham is 21,738.
What is the Total Male Population of Birmingham?
Total Male Population of Birmingham is 10,655.
What is the Total Female Population of Birmingham?
Total Female Population of Birmingham is 11,083.
What is the Ratio of Males per 100 Females in Birmingham?
There are 96.14 Males per 100 Females in Birmingham.
What is the Ratio of Females per 100 Males in Birmingham?
There are 104.02 Females per 100 Males in Birmingham.
What is the Median Population Age in Birmingham?
Median Population Age in Birmingham is 42.0 Years.
What is the Average Family Size in Birmingham
Average Family Size in Birmingham is 3.1 People.
What is the Average Household Size in Birmingham
Average Household Size in Birmingham is 2.3 People.
How Large is the Labor Force in Birmingham?
There are 11,743 People in the Labor Forcein in Birmingham.
What is the Percentage of People in the Labor Force in Birmingham?
69.5% of People are in the Labor Force in Birmingham.
What is the Unemployment Rate in Birmingham?
Unemployment Rate in Birmingham is 4.2%.