Pine Prairie, LA Map & Demographics
Pine Prairie Map
Pine Prairie Overview
$15,745
PER CAPITA INCOME
$41,250
AVG FAMILY INCOME
$32,244
AVG HOUSEHOLD INCOME
36.3%
WAGE / INCOME GAP [ % ]
63.7¢/ $1
WAGE / INCOME GAP [ $ ]
0.48
INEQUALITY / GINI INDEX
1,414
TOTAL POPULATION
839
MALE POPULATION
575
FEMALE POPULATION
145.91
MALES / 100 FEMALES
68.53
FEMALES / 100 MALES
36.1
MEDIAN AGE
3.1
AVG FAMILY SIZE
2.5
AVG HOUSEHOLD SIZE
369
LABOR FORCE [ PEOPLE ]
31.9%
PERCENT IN LABOR FORCE
14.9%
UNEMPLOYMENT RATE
Pine Prairie Zip Codes
Pine Prairie Area Codes
Income in Pine Prairie
Income Overview in Pine Prairie
Per Capita Income in Pine Prairie is $15,745, while median incomes of families and households are $41,250 and $32,244 respectively.
| Characteristic | Number | Measure |
| Per Capita Income | 1,414 | $15,745 |
| Median Family Income | 273 | $41,250 |
| Mean Family Income | 273 | $62,322 |
| Median Household Income | 396 | $32,244 |
| Mean Household Income | 396 | $51,329 |
| Income Deficit | 273 | $0 |
| Wage / Income Gap (%) | 1,414 | 36.32% |
| Wage / Income Gap ($) | 1,414 | 63.68¢ per $1 |
| Gini / Inequality Index | 1,414 | 0.48 |
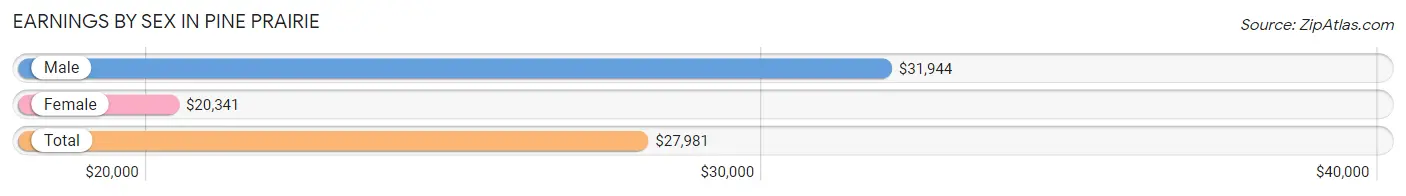
Earnings by Sex in Pine Prairie
Average Earnings in Pine Prairie are $27,981, $31,944 for men and $20,341 for women, a difference of 36.3%.
| Sex | Number | Average Earnings |
| Male | 150 (43.7%) | $31,944 |
| Female | 193 (56.3%) | $20,341 |
| Total | 343 (100.0%) | $27,981 |
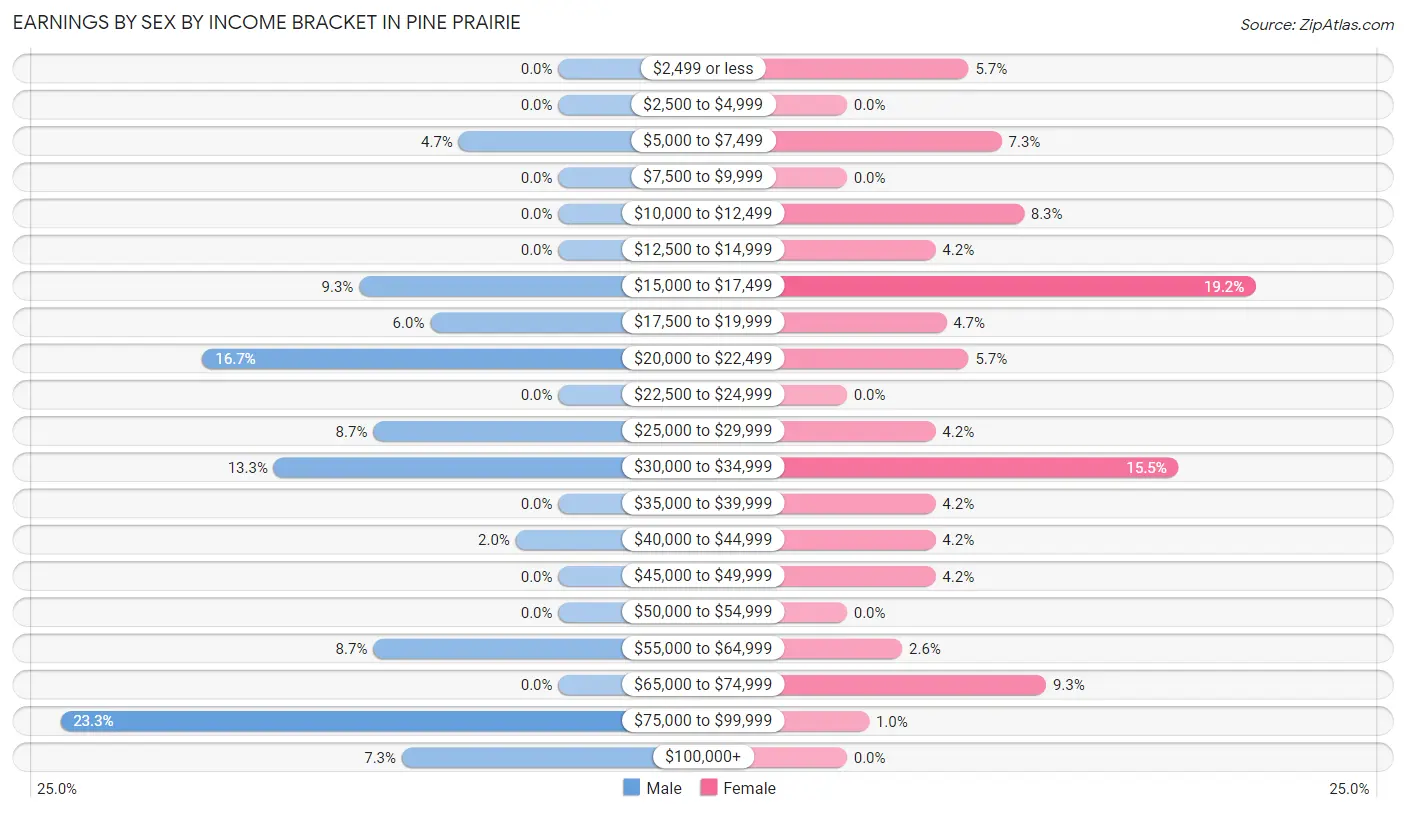
Earnings by Sex by Income Bracket in Pine Prairie
The most common earnings brackets in Pine Prairie are $75,000 to $99,999 for men (35 | 23.3%) and $15,000 to $17,499 for women (37 | 19.2%).
| Income | Male | Female |
| $2,499 or less | 0 (0.0%) | 11 (5.7%) |
| $2,500 to $4,999 | 0 (0.0%) | 0 (0.0%) |
| $5,000 to $7,499 | 7 (4.7%) | 14 (7.2%) |
| $7,500 to $9,999 | 0 (0.0%) | 0 (0.0%) |
| $10,000 to $12,499 | 0 (0.0%) | 16 (8.3%) |
| $12,500 to $14,999 | 0 (0.0%) | 8 (4.2%) |
| $15,000 to $17,499 | 14 (9.3%) | 37 (19.2%) |
| $17,500 to $19,999 | 9 (6.0%) | 9 (4.7%) |
| $20,000 to $22,499 | 25 (16.7%) | 11 (5.7%) |
| $22,500 to $24,999 | 0 (0.0%) | 0 (0.0%) |
| $25,000 to $29,999 | 13 (8.7%) | 8 (4.2%) |
| $30,000 to $34,999 | 20 (13.3%) | 30 (15.5%) |
| $35,000 to $39,999 | 0 (0.0%) | 8 (4.2%) |
| $40,000 to $44,999 | 3 (2.0%) | 8 (4.2%) |
| $45,000 to $49,999 | 0 (0.0%) | 8 (4.2%) |
| $50,000 to $54,999 | 0 (0.0%) | 0 (0.0%) |
| $55,000 to $64,999 | 13 (8.7%) | 5 (2.6%) |
| $65,000 to $74,999 | 0 (0.0%) | 18 (9.3%) |
| $75,000 to $99,999 | 35 (23.3%) | 2 (1.0%) |
| $100,000+ | 11 (7.3%) | 0 (0.0%) |
| Total | 150 (100.0%) | 193 (100.0%) |
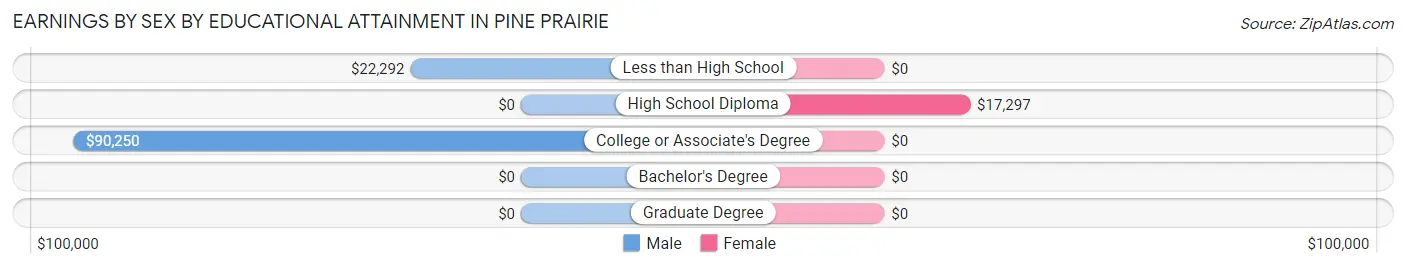
Earnings by Sex by Educational Attainment in Pine Prairie
| Educational Attainment | Male Income | Female Income |
| Less than High School | $22,292 | $0 |
| High School Diploma | - | - |
| College or Associate's Degree | $90,250 | $0 |
| Bachelor's Degree | - | - |
| Graduate Degree | - | - |
| Total | - | - |
Family Income in Pine Prairie
Family Income Brackets in Pine Prairie
According to the Pine Prairie family income data, there are 54 families falling into the $25,000 to $34,999 income range, which is the most common income bracket and makes up 19.8% of all families.
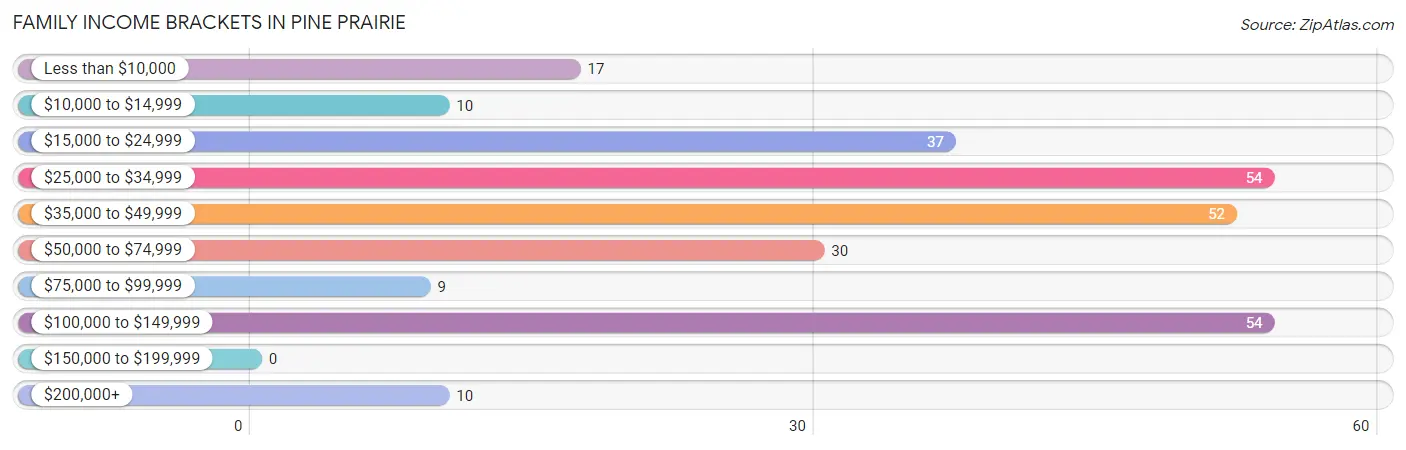
| Income Bracket | # Families | % Families |
| Less than $10,000 | 17 | 6.2% |
| $10,000 to $14,999 | 10 | 3.7% |
| $15,000 to $24,999 | 37 | 13.6% |
| $25,000 to $34,999 | 54 | 19.8% |
| $35,000 to $49,999 | 52 | 19.0% |
| $50,000 to $74,999 | 30 | 11.0% |
| $75,000 to $99,999 | 9 | 3.3% |
| $100,000 to $149,999 | 54 | 19.8% |
| $150,000 to $199,999 | 0 | 0.0% |
| $200,000+ | 10 | 3.7% |
Family Income by Famaliy Size in Pine Prairie
3-person families (57 | 20.9%) account for the highest median family income in Pine Prairie with $45,469 per family, while 2-person families (141 | 51.6%) have the highest median income of $19,188 per family member.
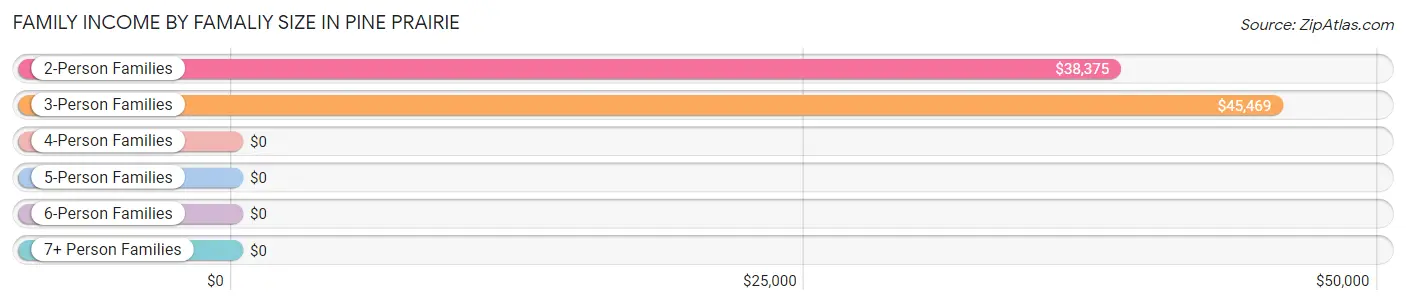
| Income Bracket | # Families | Median Income |
| 2-Person Families | 141 (51.6%) | $38,375 |
| 3-Person Families | 57 (20.9%) | $45,469 |
| 4-Person Families | 44 (16.1%) | $0 |
| 5-Person Families | 17 (6.2%) | $0 |
| 6-Person Families | 14 (5.1%) | $0 |
| 7+ Person Families | 0 (0.0%) | $0 |
| Total | 273 (100.0%) | $41,250 |
Family Income by Number of Earners in Pine Prairie
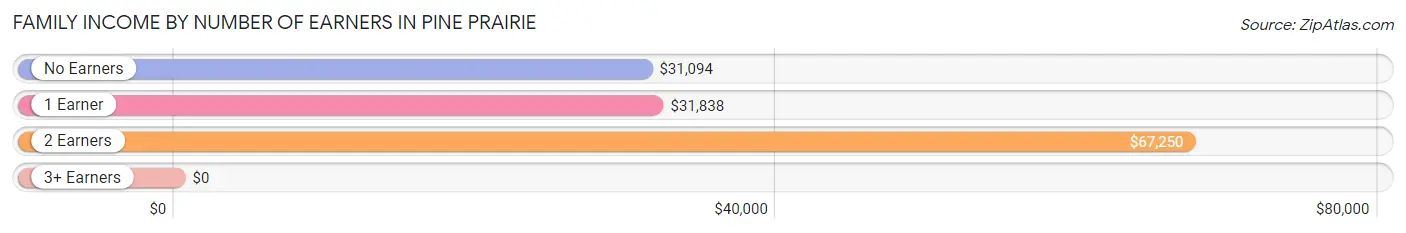
| Number of Earners | # Families | Median Income |
| No Earners | 81 (29.7%) | $31,094 |
| 1 Earner | 115 (42.1%) | $31,838 |
| 2 Earners | 67 (24.5%) | $67,250 |
| 3+ Earners | 10 (3.7%) | $0 |
| Total | 273 (100.0%) | $41,250 |
Household Income in Pine Prairie
Household Income Brackets in Pine Prairie
With 81 households falling in the category, the $25,000 to $34,999 income range is the most frequent in Pine Prairie, accounting for 20.4% of all households.
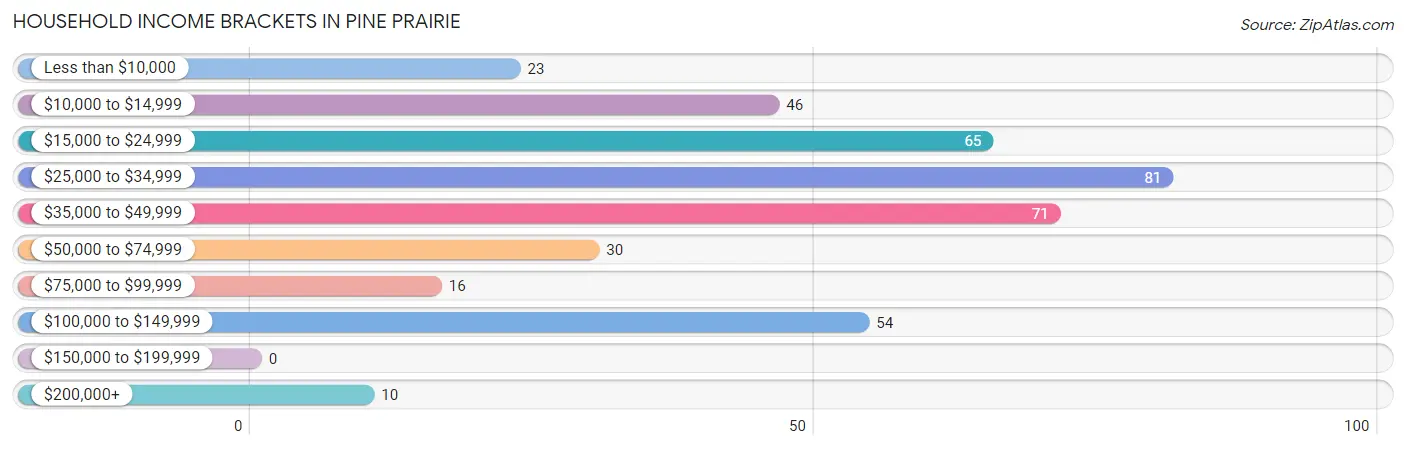
| Income Bracket | # Households | % Households |
| Less than $10,000 | 23 | 5.8% |
| $10,000 to $14,999 | 46 | 11.6% |
| $15,000 to $24,999 | 65 | 16.4% |
| $25,000 to $34,999 | 81 | 20.5% |
| $35,000 to $49,999 | 71 | 17.9% |
| $50,000 to $74,999 | 30 | 7.6% |
| $75,000 to $99,999 | 16 | 4.0% |
| $100,000 to $149,999 | 54 | 13.6% |
| $150,000 to $199,999 | 0 | 0.0% |
| $200,000+ | 10 | 2.5% |
Household Income by Householder Age in Pine Prairie
The median household income in Pine Prairie is $32,244, with the highest median household income of $45,735 found in the 25 to 44 years age bracket for the primary householder. A total of 130 households (32.8%) fall into this category. Meanwhile, the 15 to 24 years age bracket for the primary householder has the lowest median household income of $0, with 7 households (1.8%) in this group.
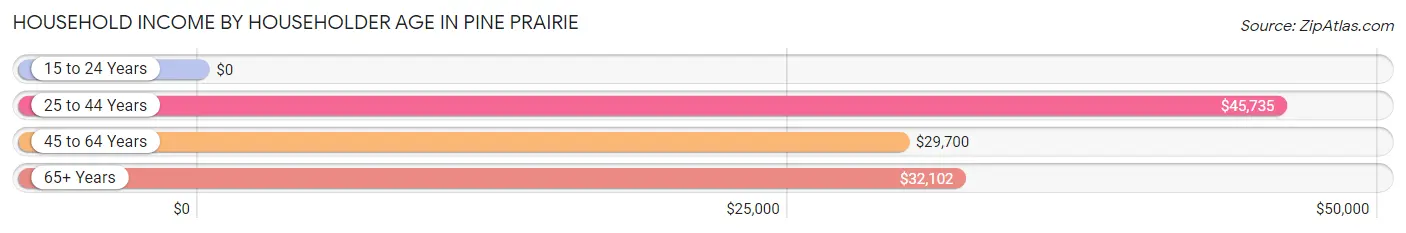
| Income Bracket | # Households | Median Income |
| 15 to 24 Years | 7 (1.8%) | $0 |
| 25 to 44 Years | 130 (32.8%) | $45,735 |
| 45 to 64 Years | 114 (28.8%) | $29,700 |
| 65+ Years | 145 (36.6%) | $32,102 |
| Total | 396 (100.0%) | $32,244 |
Poverty in Pine Prairie
Income Below Poverty by Sex and Age in Pine Prairie
With 23.1% poverty level for males and 27.5% for females among the residents of Pine Prairie, 15 year old males and 35 to 44 year old females are the most vulnerable to poverty, with 28 males (80.0%) and 29 females (58.0%) in their respective age groups living below the poverty level.
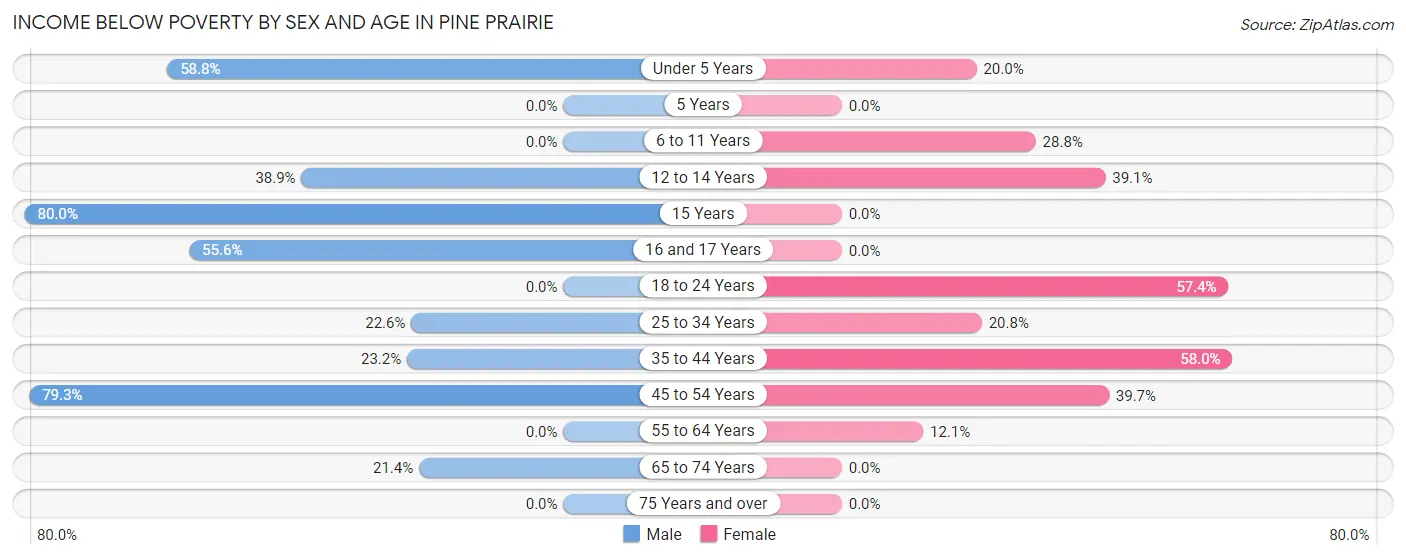
| Age Bracket | Male | Female |
| Under 5 Years | 10 (58.8%) | 7 (20.0%) |
| 5 Years | 0 (0.0%) | 0 (0.0%) |
| 6 to 11 Years | 0 (0.0%) | 19 (28.8%) |
| 12 to 14 Years | 14 (38.9%) | 9 (39.1%) |
| 15 Years | 28 (80.0%) | 0 (0.0%) |
| 16 and 17 Years | 10 (55.6%) | 0 (0.0%) |
| 18 to 24 Years | 0 (0.0%) | 31 (57.4%) |
| 25 to 34 Years | 7 (22.6%) | 16 (20.8%) |
| 35 to 44 Years | 13 (23.2%) | 29 (58.0%) |
| 45 to 54 Years | 23 (79.3%) | 23 (39.7%) |
| 55 to 64 Years | 0 (0.0%) | 7 (12.1%) |
| 65 to 74 Years | 9 (21.4%) | 0 (0.0%) |
| 75 Years and over | 0 (0.0%) | 0 (0.0%) |
| Total | 114 (23.1%) | 141 (27.5%) |
Income Above Poverty by Sex and Age in Pine Prairie
According to the poverty statistics in Pine Prairie, males aged 5 years and females aged 5 years are the age groups that are most secure financially, with 100.0% of males and 100.0% of females in these age groups living above the poverty line.
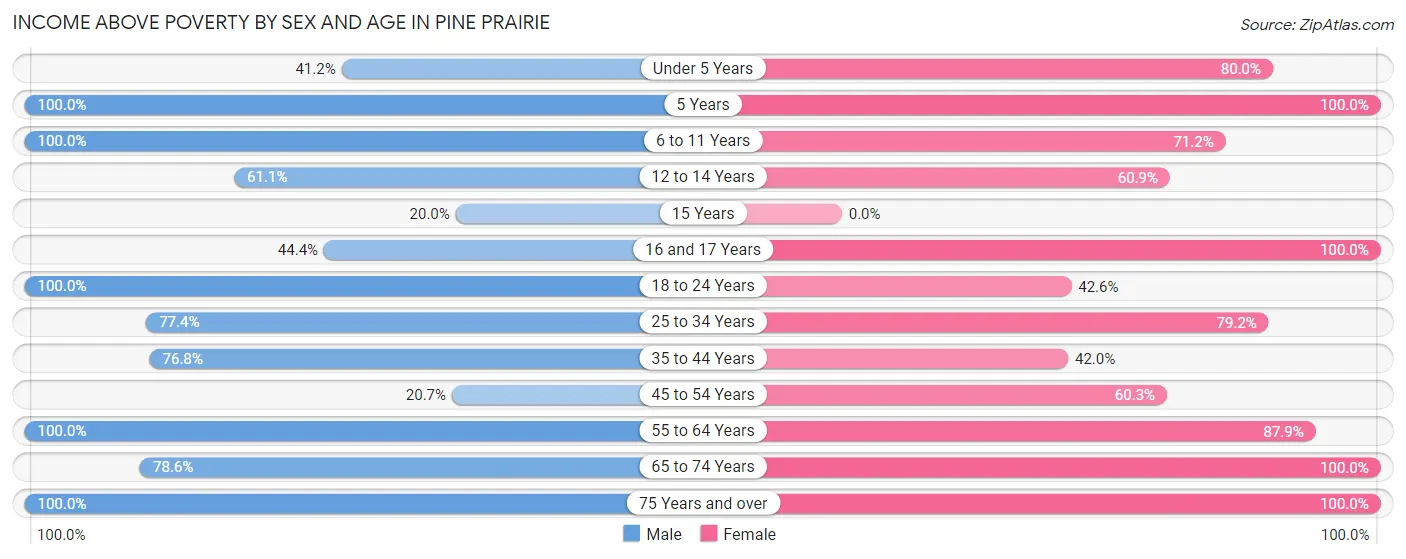
| Age Bracket | Male | Female |
| Under 5 Years | 7 (41.2%) | 28 (80.0%) |
| 5 Years | 11 (100.0%) | 12 (100.0%) |
| 6 to 11 Years | 23 (100.0%) | 47 (71.2%) |
| 12 to 14 Years | 22 (61.1%) | 14 (60.9%) |
| 15 Years | 7 (20.0%) | 0 (0.0%) |
| 16 and 17 Years | 8 (44.4%) | 7 (100.0%) |
| 18 to 24 Years | 22 (100.0%) | 23 (42.6%) |
| 25 to 34 Years | 24 (77.4%) | 61 (79.2%) |
| 35 to 44 Years | 43 (76.8%) | 21 (42.0%) |
| 45 to 54 Years | 6 (20.7%) | 35 (60.3%) |
| 55 to 64 Years | 81 (100.0%) | 51 (87.9%) |
| 65 to 74 Years | 33 (78.6%) | 53 (100.0%) |
| 75 Years and over | 92 (100.0%) | 19 (100.0%) |
| Total | 379 (76.9%) | 371 (72.5%) |
Income Below Poverty Among Married-Couple Families in Pine Prairie
The poverty statistics for married-couple families in Pine Prairie show that 7.8% or 16 of the total 205 families live below the poverty line. Families with 1 or 2 children have the highest poverty rate of 20.7%, comprising of 11 families. On the other hand, families with 3 or 4 children have the lowest poverty rate of 0.0%, which includes 0 families.
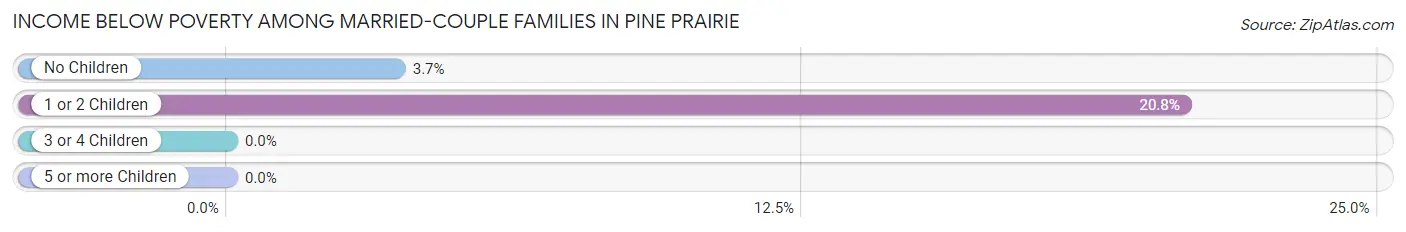
| Children | Above Poverty | Below Poverty |
| No Children | 132 (96.4%) | 5 (3.6%) |
| 1 or 2 Children | 42 (79.2%) | 11 (20.7%) |
| 3 or 4 Children | 15 (100.0%) | 0 (0.0%) |
| 5 or more Children | 0 (0.0%) | 0 (0.0%) |
| Total | 189 (92.2%) | 16 (7.8%) |
Income Below Poverty Among Single-Parent Households in Pine Prairie
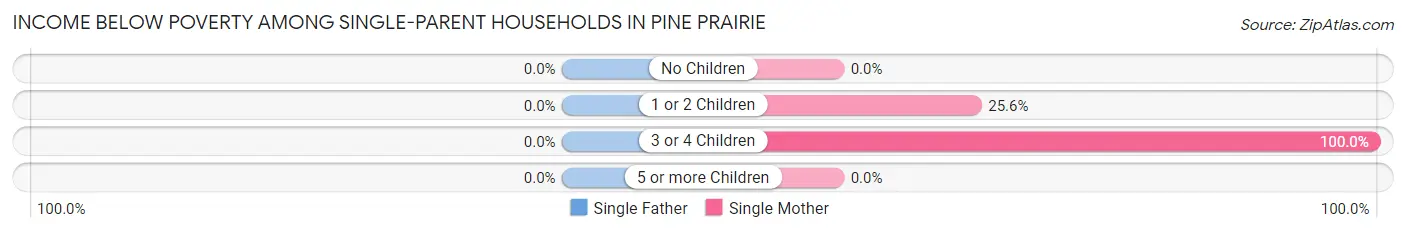
| Children | Single Father | Single Mother |
| No Children | 0 (0.0%) | 0 (0.0%) |
| 1 or 2 Children | 0 (0.0%) | 10 (25.6%) |
| 3 or 4 Children | 0 (0.0%) | 16 (100.0%) |
| 5 or more Children | 0 (0.0%) | 0 (0.0%) |
| Total | 0 (0.0%) | 26 (40.6%) |
Income Below Poverty Among Married-Couple vs Single-Parent Households in Pine Prairie
The poverty data for Pine Prairie shows that 16 of the married-couple family households (7.8%) and 26 of the single-parent households (38.2%) are living below the poverty level. Within the married-couple family households, those with 1 or 2 children have the highest poverty rate, with 11 households (20.7%) falling below the poverty line. Among the single-parent households, those with 3 or 4 children have the highest poverty rate, with 16 household (80.0%) living below poverty.
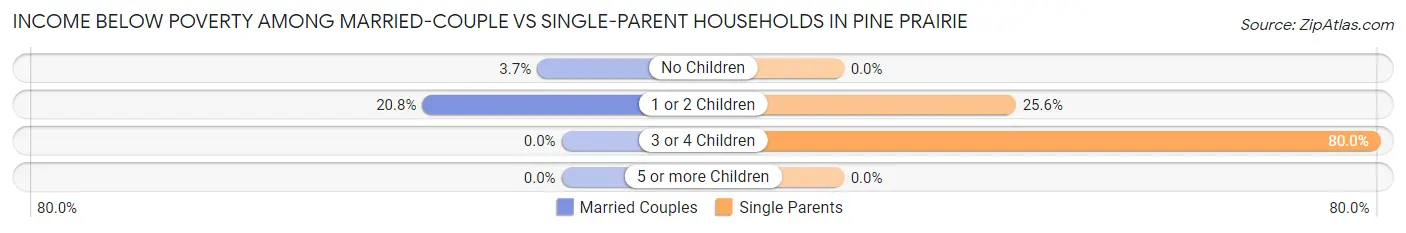
| Children | Married-Couple Families | Single-Parent Households |
| No Children | 5 (3.6%) | 0 (0.0%) |
| 1 or 2 Children | 11 (20.7%) | 10 (25.6%) |
| 3 or 4 Children | 0 (0.0%) | 16 (80.0%) |
| 5 or more Children | 0 (0.0%) | 0 (0.0%) |
| Total | 16 (7.8%) | 26 (38.2%) |
Race in Pine Prairie
The most populous races in Pine Prairie are White / Caucasian (1,040 | 73.6%), Some other Race (200 | 14.1%), and Hispanic or Latino (178 | 12.6%).
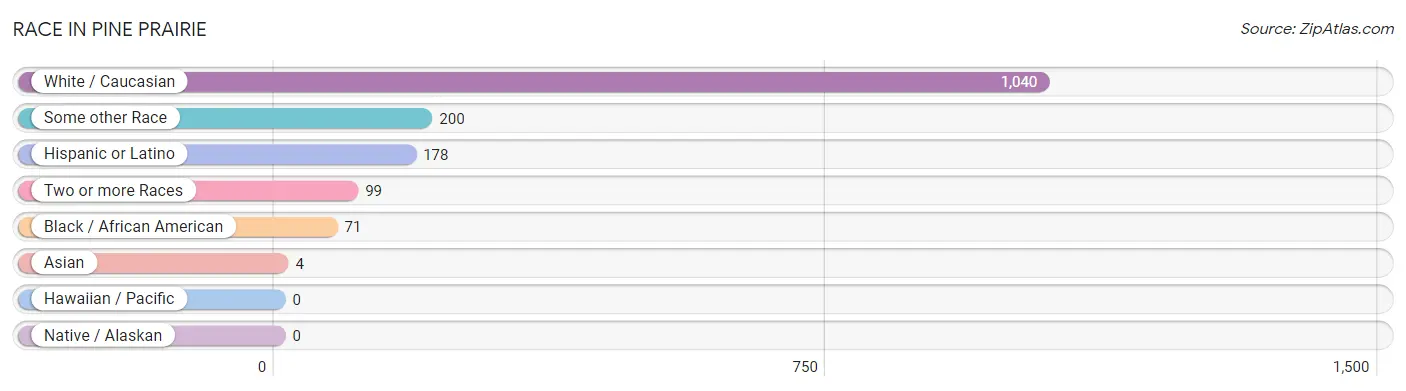
| Race | # Population | % Population |
| Asian | 4 | 0.3% |
| Black / African American | 71 | 5.0% |
| Hawaiian / Pacific | 0 | 0.0% |
| Hispanic or Latino | 178 | 12.6% |
| Native / Alaskan | 0 | 0.0% |
| White / Caucasian | 1,040 | 73.6% |
| Two or more Races | 99 | 7.0% |
| Some other Race | 200 | 14.1% |
| Total | 1,414 | 100.0% |
Ancestry in Pine Prairie
The most populous ancestries reported in Pine Prairie are French (512 | 36.2%), Irish (123 | 8.7%), Central American (98 | 6.9%), Honduran (87 | 6.1%), and English (65 | 4.6%), together accounting for 62.6% of all Pine Prairie residents.
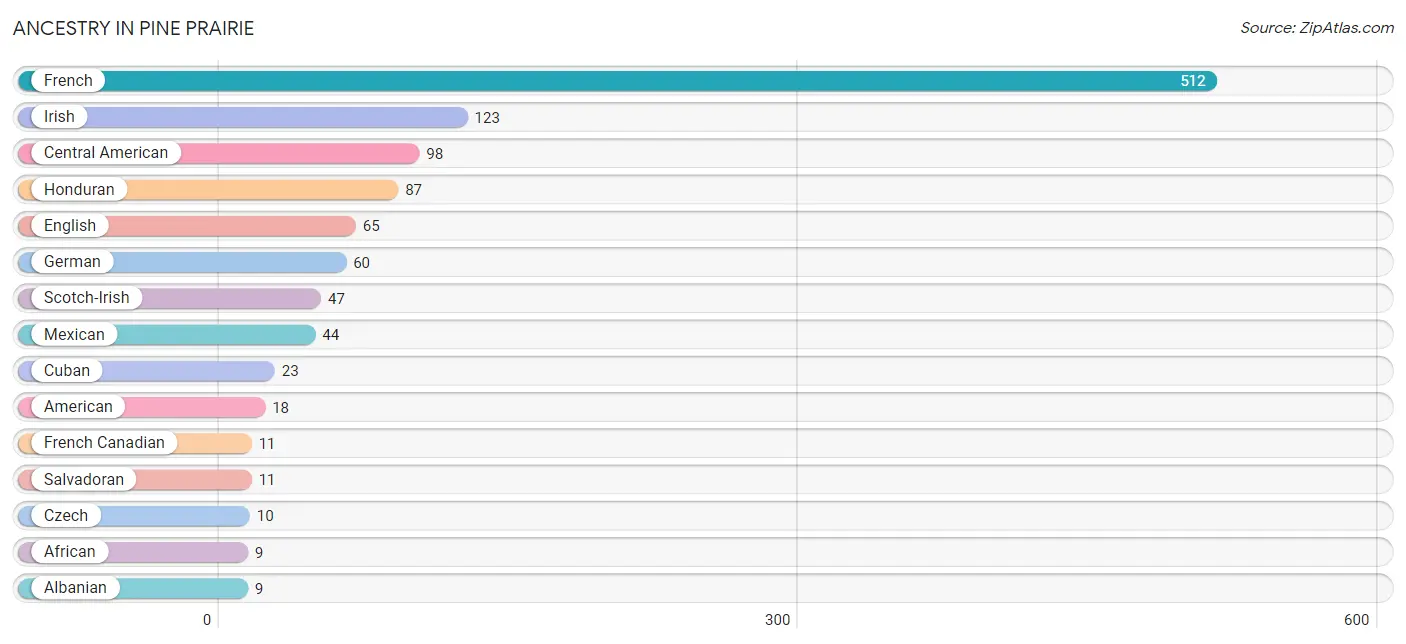
| Ancestry | # Population | % Population |
| African | 9 | 0.6% |
| Albanian | 9 | 0.6% |
| American | 18 | 1.3% |
| Arab | 8 | 0.6% |
| Arapaho | 8 | 0.6% |
| Central American | 98 | 6.9% |
| Cherokee | 6 | 0.4% |
| Comanche | 7 | 0.5% |
| Cuban | 23 | 1.6% |
| Czech | 10 | 0.7% |
| English | 65 | 4.6% |
| French | 512 | 36.2% |
| French Canadian | 11 | 0.8% |
| German | 60 | 4.2% |
| Honduran | 87 | 6.1% |
| Irish | 123 | 8.7% |
| Lebanese | 8 | 0.6% |
| Mexican | 44 | 3.1% |
| Salvadoran | 11 | 0.8% |
| Scotch-Irish | 47 | 3.3% |
| South American | 6 | 0.4% |
| Spaniard | 7 | 0.5% |
| Subsaharan African | 9 | 0.6% |
| Thai | 4 | 0.3% |
| Venezuelan | 6 | 0.4% | View All 25 Rows |
Immigrants in Pine Prairie
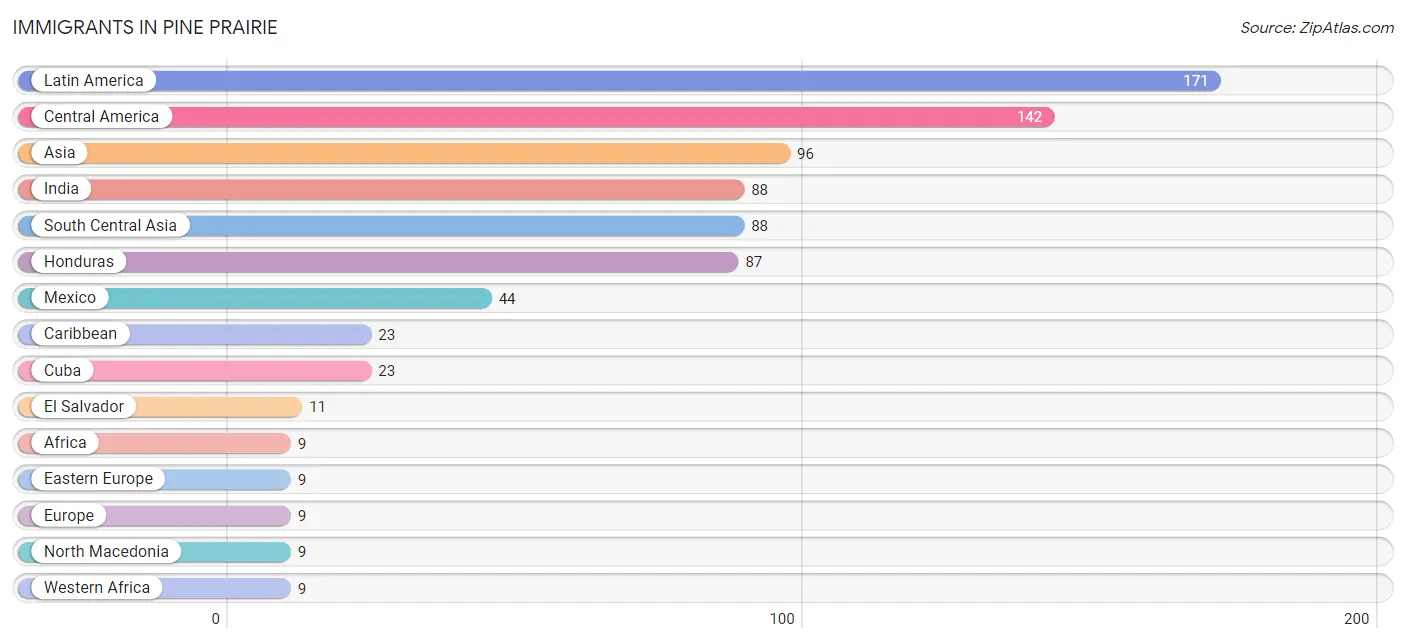
The most numerous immigrant groups reported in Pine Prairie came from Latin America (171 | 12.1%), Central America (142 | 10.0%), Asia (96 | 6.8%), India (88 | 6.2%), and South Central Asia (88 | 6.2%), together accounting for 41.4% of all Pine Prairie residents.
| Immigration Origin | # Population | % Population |
| Africa | 9 | 0.6% |
| Asia | 96 | 6.8% |
| Caribbean | 23 | 1.6% |
| Central America | 142 | 10.0% |
| Cuba | 23 | 1.6% |
| Eastern Europe | 9 | 0.6% |
| El Salvador | 11 | 0.8% |
| Europe | 9 | 0.6% |
| Honduras | 87 | 6.1% |
| India | 88 | 6.2% |
| Latin America | 171 | 12.1% |
| Lebanon | 8 | 0.6% |
| Mexico | 44 | 3.1% |
| North Macedonia | 9 | 0.6% |
| South America | 6 | 0.4% |
| South Central Asia | 88 | 6.2% |
| Venezuela | 6 | 0.4% |
| Western Africa | 9 | 0.6% |
| Western Asia | 8 | 0.6% | View All 19 Rows |
Sex and Age in Pine Prairie
Sex and Age in Pine Prairie
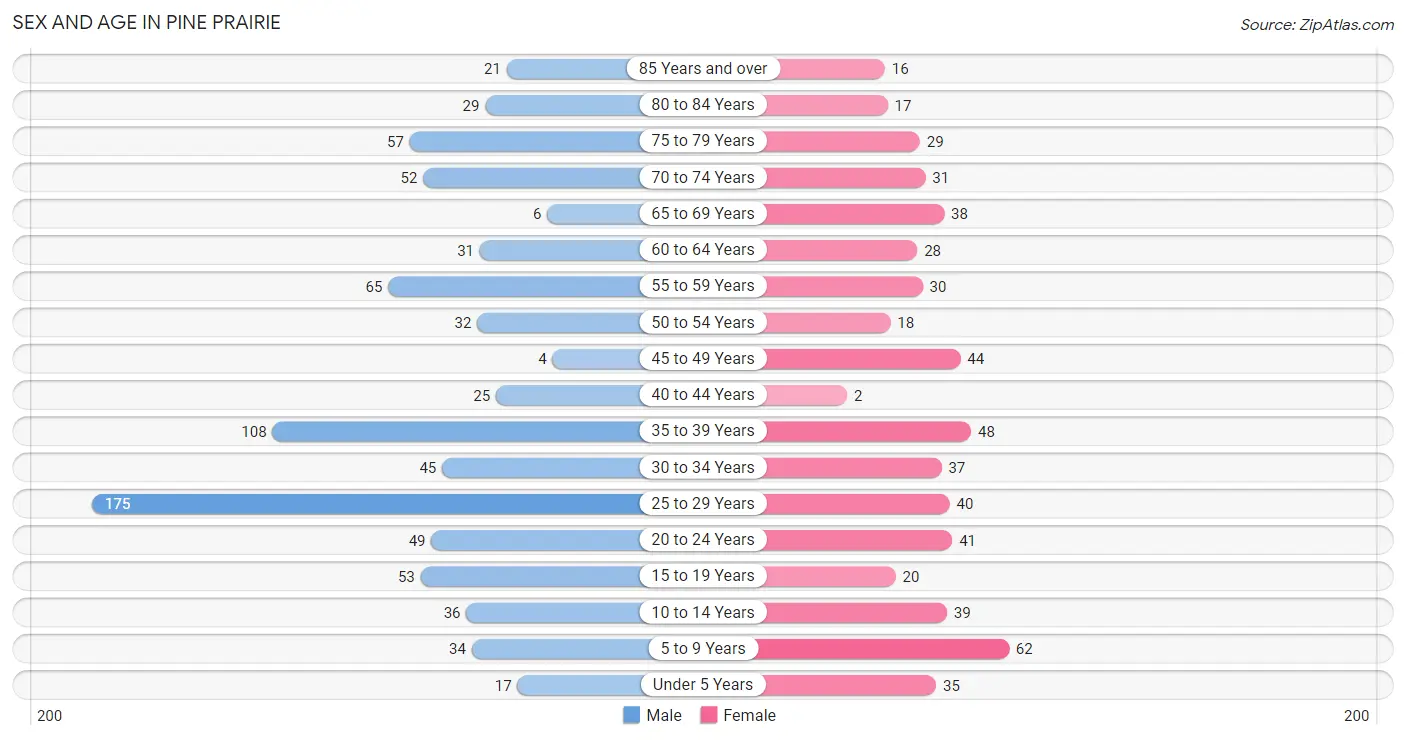
The most populous age groups in Pine Prairie are 25 to 29 Years (175 | 20.9%) for men and 5 to 9 Years (62 | 10.8%) for women.
| Age Bracket | Male | Female |
| Under 5 Years | 17 (2.0%) | 35 (6.1%) |
| 5 to 9 Years | 34 (4.1%) | 62 (10.8%) |
| 10 to 14 Years | 36 (4.3%) | 39 (6.8%) |
| 15 to 19 Years | 53 (6.3%) | 20 (3.5%) |
| 20 to 24 Years | 49 (5.8%) | 41 (7.1%) |
| 25 to 29 Years | 175 (20.9%) | 40 (7.0%) |
| 30 to 34 Years | 45 (5.4%) | 37 (6.4%) |
| 35 to 39 Years | 108 (12.9%) | 48 (8.4%) |
| 40 to 44 Years | 25 (3.0%) | 2 (0.4%) |
| 45 to 49 Years | 4 (0.5%) | 44 (7.6%) |
| 50 to 54 Years | 32 (3.8%) | 18 (3.1%) |
| 55 to 59 Years | 65 (7.7%) | 30 (5.2%) |
| 60 to 64 Years | 31 (3.7%) | 28 (4.9%) |
| 65 to 69 Years | 6 (0.7%) | 38 (6.6%) |
| 70 to 74 Years | 52 (6.2%) | 31 (5.4%) |
| 75 to 79 Years | 57 (6.8%) | 29 (5.0%) |
| 80 to 84 Years | 29 (3.5%) | 17 (3.0%) |
| 85 Years and over | 21 (2.5%) | 16 (2.8%) |
| Total | 839 (100.0%) | 575 (100.0%) |
Families and Households in Pine Prairie
Median Family Size in Pine Prairie
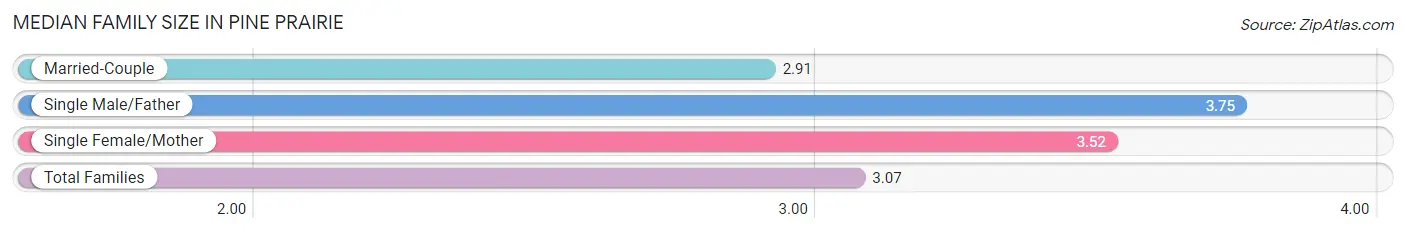
The median family size in Pine Prairie is 3.07 persons per family, with single male/father families (4 | 1.5%) accounting for the largest median family size of 3.75 persons per family. On the other hand, married-couple families (205 | 75.1%) represent the smallest median family size with 2.91 persons per family.
| Family Type | # Families | Family Size |
| Married-Couple | 205 (75.1%) | 2.91 |
| Single Male/Father | 4 (1.5%) | 3.75 |
| Single Female/Mother | 64 (23.4%) | 3.52 |
| Total Families | 273 (100.0%) | 3.07 |
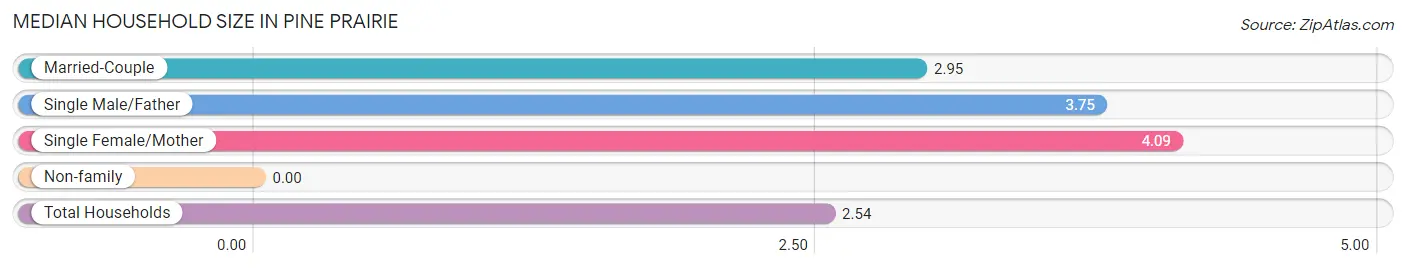
Median Household Size in Pine Prairie
| Household Type | # Households | Household Size |
| Married-Couple | 205 (51.8%) | 2.95 |
| Single Male/Father | 4 (1.0%) | 3.75 |
| Single Female/Mother | 64 (16.2%) | 4.09 |
| Non-family | 123 (31.1%) | - |
| Total Households | 396 (100.0%) | 2.54 |
Household Size by Marriage Status in Pine Prairie
Out of a total of 396 households in Pine Prairie, 273 (68.9%) are family households, while 123 (31.1%) are nonfamily households. The most numerous type of family households are 2-person households, comprising 141, and the most common type of nonfamily households are 1-person households, comprising 123.
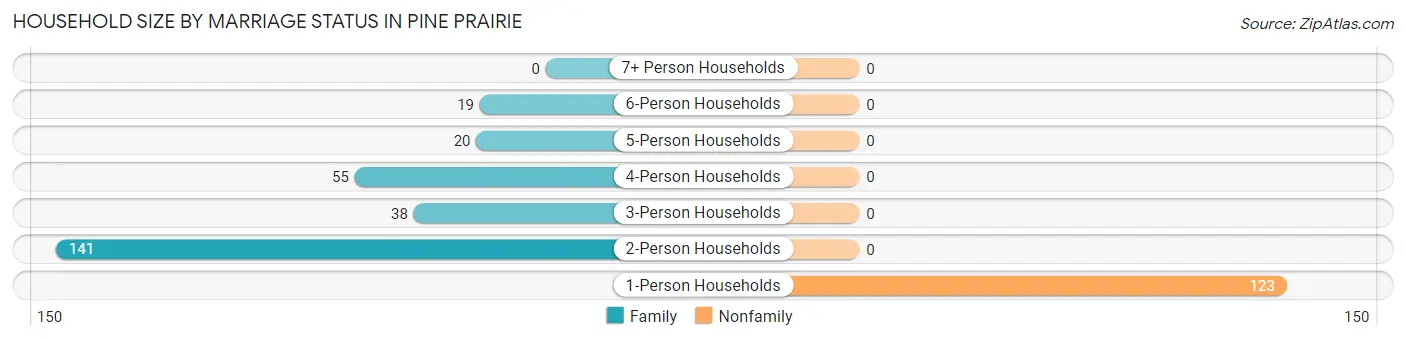
| Household Size | Family Households | Nonfamily Households |
| 1-Person Households | - | 123 (31.1%) |
| 2-Person Households | 141 (35.6%) | 0 (0.0%) |
| 3-Person Households | 38 (9.6%) | 0 (0.0%) |
| 4-Person Households | 55 (13.9%) | 0 (0.0%) |
| 5-Person Households | 20 (5.1%) | 0 (0.0%) |
| 6-Person Households | 19 (4.8%) | 0 (0.0%) |
| 7+ Person Households | 0 (0.0%) | 0 (0.0%) |
| Total | 273 (68.9%) | 123 (31.1%) |
Female Fertility in Pine Prairie
Fertility by Age in Pine Prairie
Average fertility rate in Pine Prairie is 43.0 births per 1,000 women. Women in the age bracket of 20 to 34 years have the highest fertility rate with 85.0 births per 1,000 women. Women in the age bracket of 20 to 34 years acount for 100.0% of all women with births.
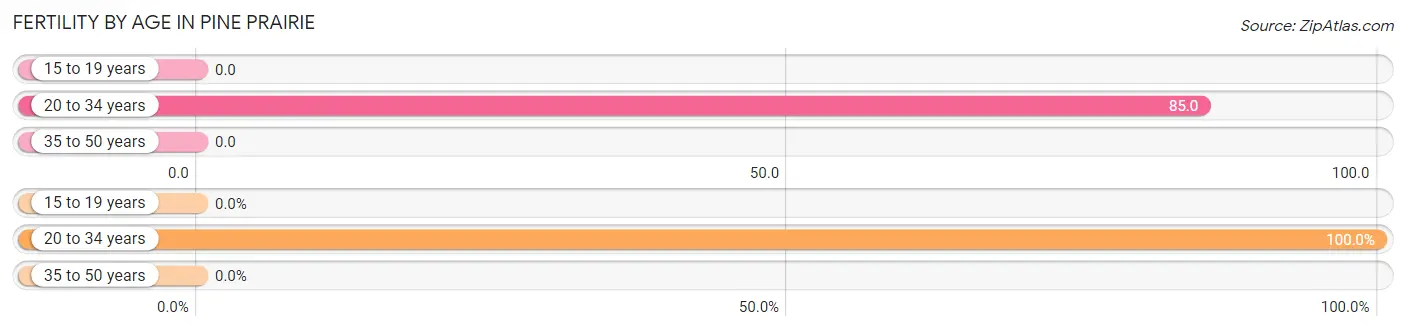
| Age Bracket | Women with Births | Births / 1,000 Women |
| 15 to 19 years | 0 (0.0%) | 0.0 |
| 20 to 34 years | 10 (100.0%) | 85.0 |
| 35 to 50 years | 0 (0.0%) | 0.0 |
| Total | 10 (100.0%) | 43.0 |
Fertility by Age by Marriage Status in Pine Prairie
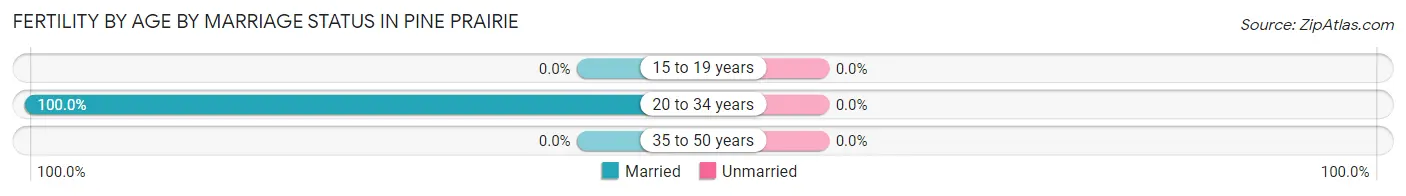
| Age Bracket | Married | Unmarried |
| 15 to 19 years | 0 (0.0%) | 0 (0.0%) |
| 20 to 34 years | 10 (100.0%) | 0 (0.0%) |
| 35 to 50 years | 0 (0.0%) | 0 (0.0%) |
| Total | 10 (100.0%) | 0 (0.0%) |
Fertility by Education in Pine Prairie
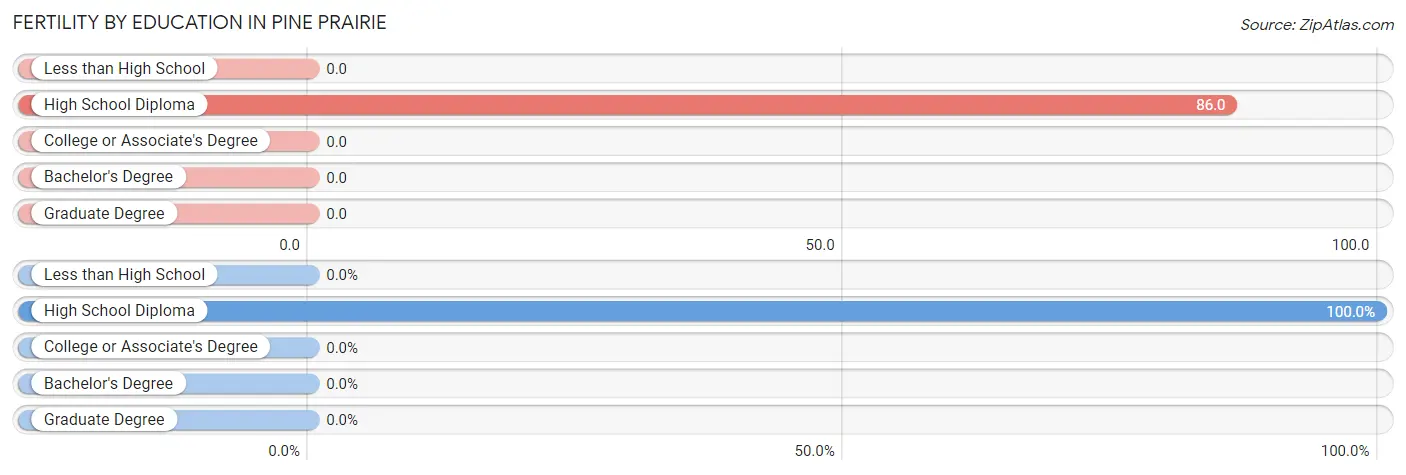
| Educational Attainment | Women with Births | Births / 1,000 Women |
| Less than High School | 0 (0.0%) | 0.0 |
| High School Diploma | 10 (100.0%) | 86.0 |
| College or Associate's Degree | 0 (0.0%) | 0.0 |
| Bachelor's Degree | 0 (0.0%) | 0.0 |
| Graduate Degree | 0 (0.0%) | 0.0 |
| Total | 10 (100.0%) | 43.0 |
Fertility by Education by Marriage Status in Pine Prairie
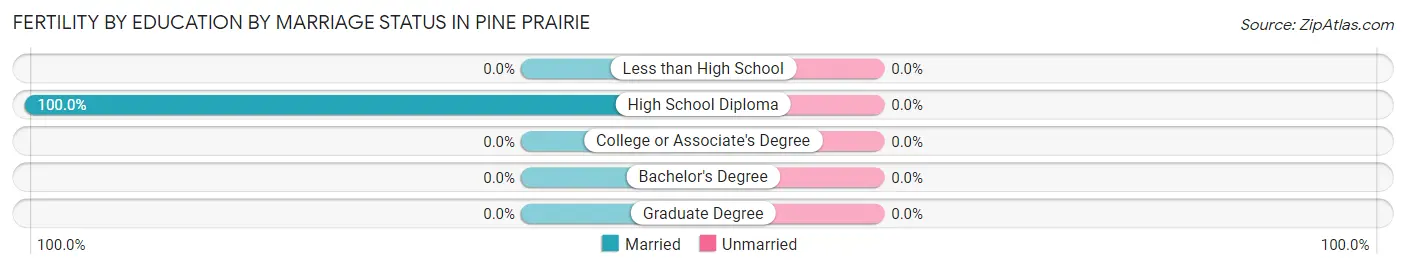
| Educational Attainment | Married | Unmarried |
| Less than High School | 0 (0.0%) | 0 (0.0%) |
| High School Diploma | 10 (100.0%) | 0 (0.0%) |
| College or Associate's Degree | 0 (0.0%) | 0 (0.0%) |
| Bachelor's Degree | 0 (0.0%) | 0 (0.0%) |
| Graduate Degree | 0 (0.0%) | 0 (0.0%) |
| Total | 10 (100.0%) | 0 (0.0%) |
Employment Characteristics in Pine Prairie
Employment by Class of Employer in Pine Prairie
Among the 314 employed individuals in Pine Prairie, private company employees (217 | 69.1%), local government employees (36 | 11.5%), and self-employed (not incorporated) (25 | 8.0%) make up the most common classes of employment.
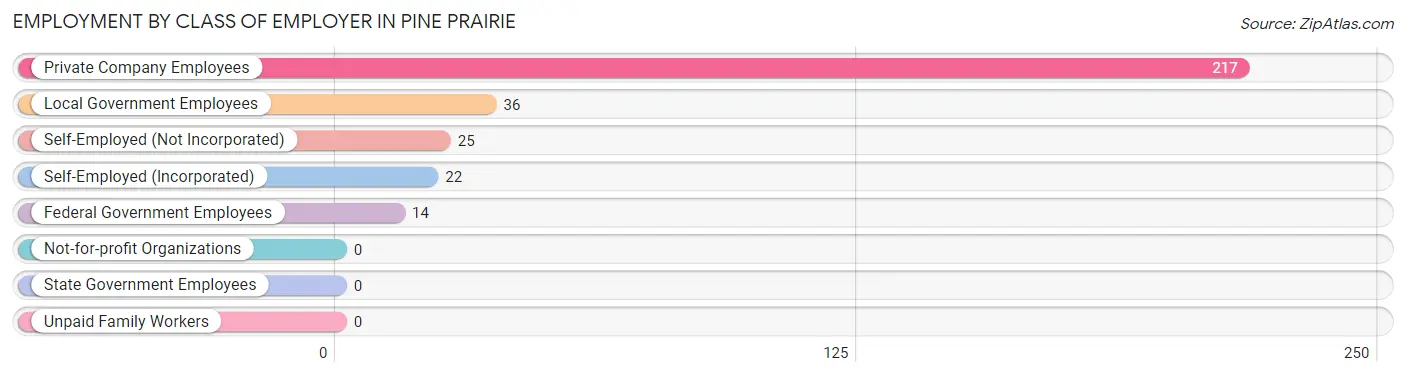
| Employer Class | # Employees | % Employees |
| Private Company Employees | 217 | 69.1% |
| Self-Employed (Incorporated) | 22 | 7.0% |
| Self-Employed (Not Incorporated) | 25 | 8.0% |
| Not-for-profit Organizations | 0 | 0.0% |
| Local Government Employees | 36 | 11.5% |
| State Government Employees | 0 | 0.0% |
| Federal Government Employees | 14 | 4.5% |
| Unpaid Family Workers | 0 | 0.0% |
| Total | 314 | 100.0% |
Employment Status by Age in Pine Prairie
According to the labor force statistics for Pine Prairie, out of the total population over 16 years of age (1,156), 31.9% or 369 individuals are in the labor force, with 14.9% or 55 of them unemployed. The age group with the highest labor force participation rate is 60 to 64 years, with 89.8% or 53 individuals in the labor force. Within the labor force, the 60 to 64 years age range has the highest percentage of unemployed individuals, with 47.2% or 25 of them being unemployed.
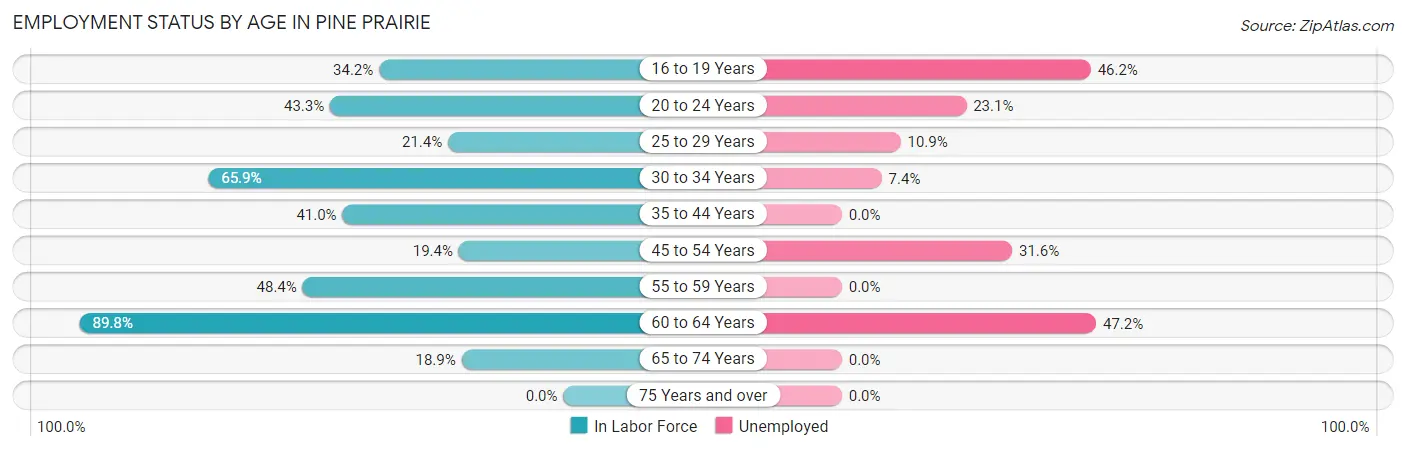
| Age Bracket | In Labor Force | Unemployed |
| 16 to 19 Years | 13 (34.2%) | 6 (46.2%) |
| 20 to 24 Years | 39 (43.3%) | 9 (23.1%) |
| 25 to 29 Years | 46 (21.4%) | 5 (10.9%) |
| 30 to 34 Years | 54 (65.9%) | 4 (7.4%) |
| 35 to 44 Years | 75 (41.0%) | 0 (0.0%) |
| 45 to 54 Years | 19 (19.4%) | 6 (31.6%) |
| 55 to 59 Years | 46 (48.4%) | 0 (0.0%) |
| 60 to 64 Years | 53 (89.8%) | 25 (47.2%) |
| 65 to 74 Years | 24 (18.9%) | 0 (0.0%) |
| 75 Years and over | 0 (0.0%) | 0 (0.0%) |
| Total | 369 (31.9%) | 55 (14.9%) |
Employment Status by Educational Attainment in Pine Prairie
According to labor force statistics for Pine Prairie, 40.0% of individuals (293) out of the total population between 25 and 64 years of age (732) are in the labor force, with 13.7% or 40 of them being unemployed. The group with the highest labor force participation rate are those with the educational attainment of bachelor's degree or higher, with 70.0% or 21 individuals in the labor force. Within the labor force, individuals with less than high school education have the highest percentage of unemployment, with 39.7% or 25 of them being unemployed.
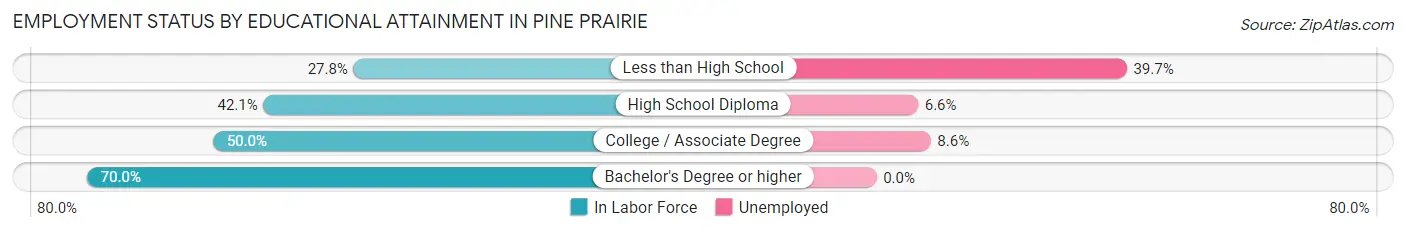
| Educational Attainment | In Labor Force | Unemployed |
| Less than High School | 63 (27.8%) | 90 (39.7%) |
| High School Diploma | 151 (42.1%) | 24 (6.6%) |
| College / Associate Degree | 58 (50.0%) | 10 (8.6%) |
| Bachelor's Degree or higher | 21 (70.0%) | 0 (0.0%) |
| Total | 293 (40.0%) | 100 (13.7%) |
Employment Occupations by Sex in Pine Prairie
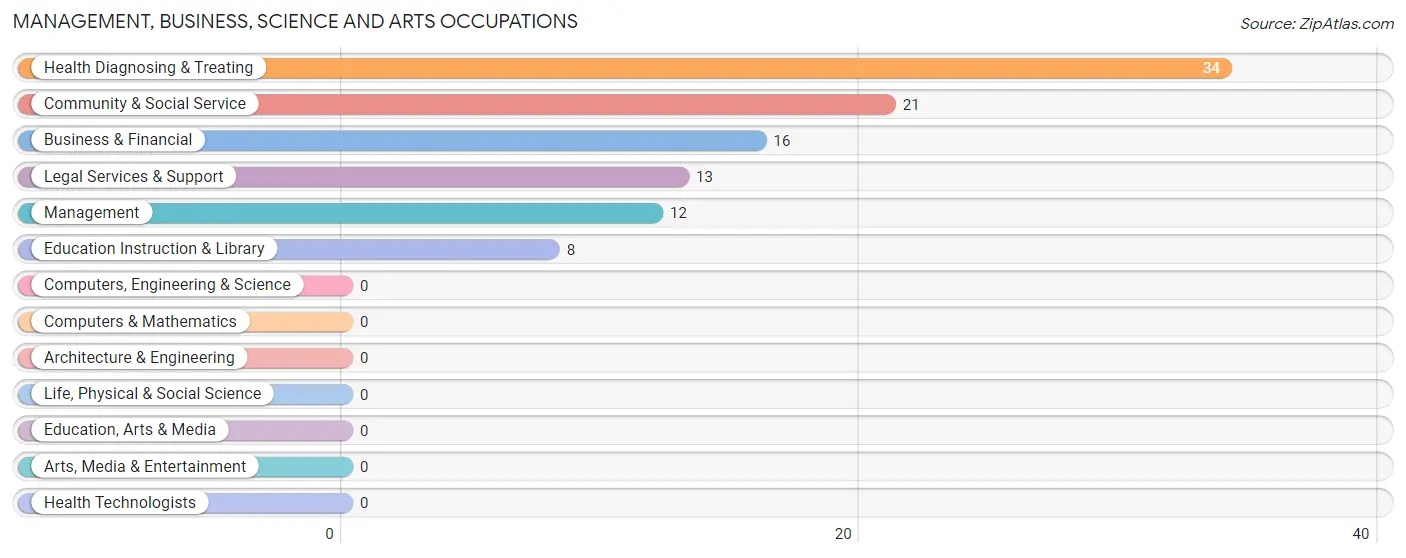
Management, Business, Science and Arts Occupations
The most common Management, Business, Science and Arts occupations in Pine Prairie are Health Diagnosing & Treating (34 | 10.8%), Community & Social Service (21 | 6.7%), Business & Financial (16 | 5.1%), Legal Services & Support (13 | 4.1%), and Management (12 | 3.8%).
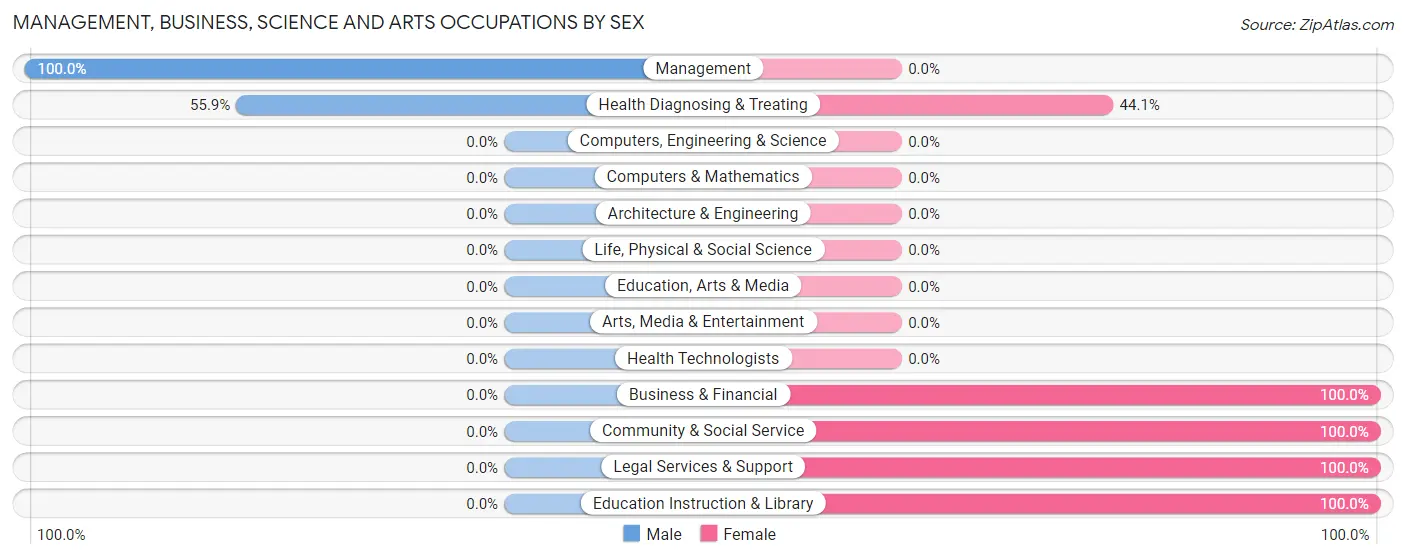
Management, Business, Science and Arts Occupations by Sex
Within the Management, Business, Science and Arts occupations in Pine Prairie, the most male-oriented occupations are Management (100.0%), and Health Diagnosing & Treating (55.9%), while the most female-oriented occupations are Business & Financial (100.0%), Community & Social Service (100.0%), and Legal Services & Support (100.0%).
| Occupation | Male | Female |
| Management | 12 (100.0%) | 0 (0.0%) |
| Business & Financial | 0 (0.0%) | 16 (100.0%) |
| Computers, Engineering & Science | 0 (0.0%) | 0 (0.0%) |
| Computers & Mathematics | 0 (0.0%) | 0 (0.0%) |
| Architecture & Engineering | 0 (0.0%) | 0 (0.0%) |
| Life, Physical & Social Science | 0 (0.0%) | 0 (0.0%) |
| Community & Social Service | 0 (0.0%) | 21 (100.0%) |
| Education, Arts & Media | 0 (0.0%) | 0 (0.0%) |
| Legal Services & Support | 0 (0.0%) | 13 (100.0%) |
| Education Instruction & Library | 0 (0.0%) | 8 (100.0%) |
| Arts, Media & Entertainment | 0 (0.0%) | 0 (0.0%) |
| Health Diagnosing & Treating | 19 (55.9%) | 15 (44.1%) |
| Health Technologists | 0 (0.0%) | 0 (0.0%) |
| Total (Category) | 31 (37.3%) | 52 (62.6%) |
| Total (Overall) | 135 (43.0%) | 179 (57.0%) |
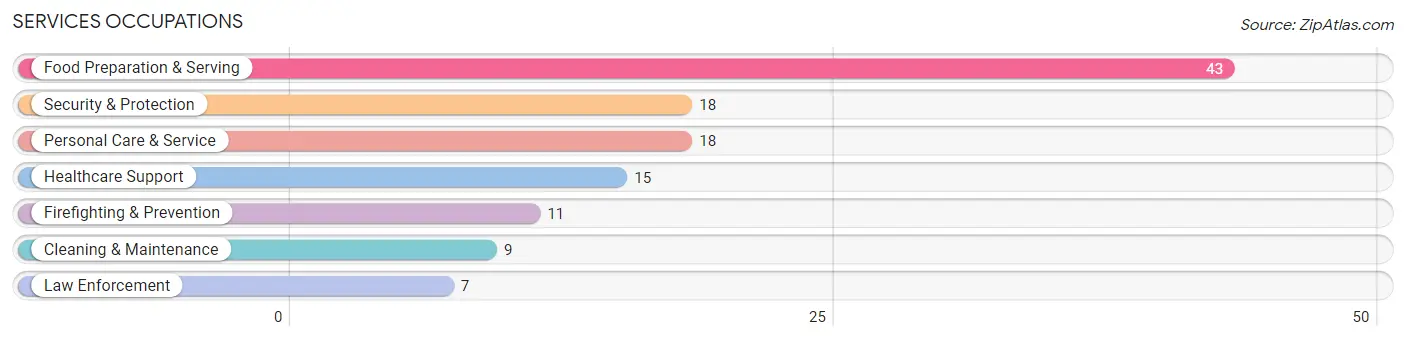
Services Occupations
The most common Services occupations in Pine Prairie are Food Preparation & Serving (43 | 13.7%), Security & Protection (18 | 5.7%), Personal Care & Service (18 | 5.7%), Healthcare Support (15 | 4.8%), and Firefighting & Prevention (11 | 3.5%).
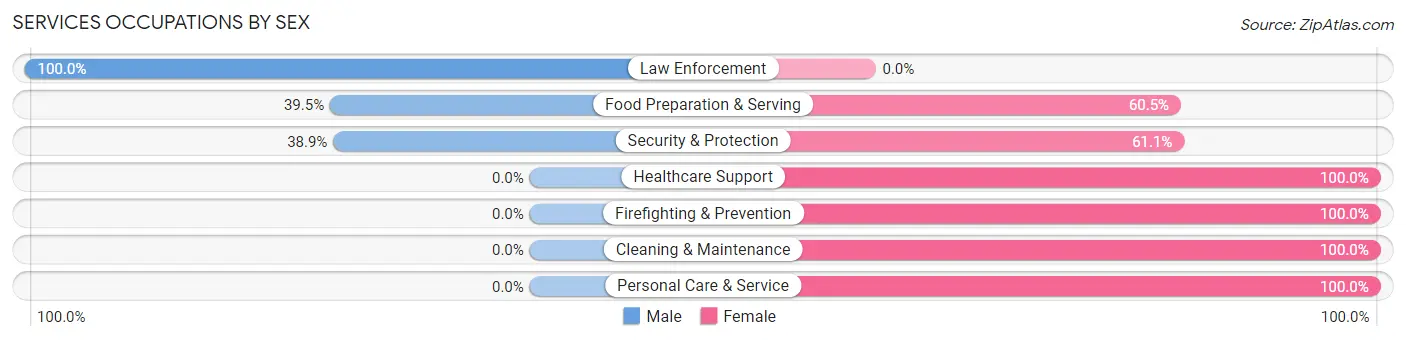
Services Occupations by Sex
Within the Services occupations in Pine Prairie, the most male-oriented occupations are Law Enforcement (100.0%), Food Preparation & Serving (39.5%), and Security & Protection (38.9%), while the most female-oriented occupations are Healthcare Support (100.0%), Firefighting & Prevention (100.0%), and Cleaning & Maintenance (100.0%).
| Occupation | Male | Female |
| Healthcare Support | 0 (0.0%) | 15 (100.0%) |
| Security & Protection | 7 (38.9%) | 11 (61.1%) |
| Firefighting & Prevention | 0 (0.0%) | 11 (100.0%) |
| Law Enforcement | 7 (100.0%) | 0 (0.0%) |
| Food Preparation & Serving | 17 (39.5%) | 26 (60.5%) |
| Cleaning & Maintenance | 0 (0.0%) | 9 (100.0%) |
| Personal Care & Service | 0 (0.0%) | 18 (100.0%) |
| Total (Category) | 24 (23.3%) | 79 (76.7%) |
| Total (Overall) | 135 (43.0%) | 179 (57.0%) |
Sales and Office Occupations
The most common Sales and Office occupations in Pine Prairie are Office & Administration (20 | 6.4%), and Sales & Related (8 | 2.5%).

Sales and Office Occupations by Sex

| Occupation | Male | Female |
| Sales & Related | 8 (100.0%) | 0 (0.0%) |
| Office & Administration | 0 (0.0%) | 20 (100.0%) |
| Total (Category) | 8 (28.6%) | 20 (71.4%) |
| Total (Overall) | 135 (43.0%) | 179 (57.0%) |
Natural Resources, Construction and Maintenance Occupations
The most common Natural Resources, Construction and Maintenance occupations in Pine Prairie are Construction & Extraction (41 | 13.1%), and Installation, Maintenance & Repair (21 | 6.7%).
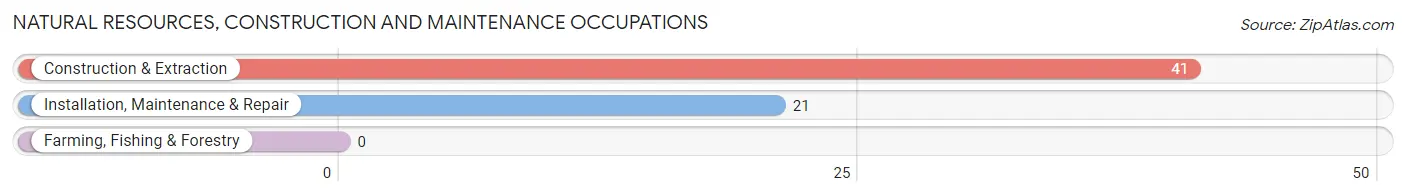
Natural Resources, Construction and Maintenance Occupations by Sex
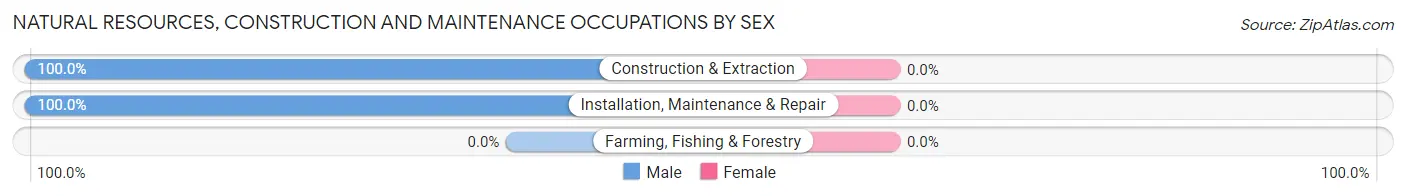
| Occupation | Male | Female |
| Farming, Fishing & Forestry | 0 (0.0%) | 0 (0.0%) |
| Construction & Extraction | 41 (100.0%) | 0 (0.0%) |
| Installation, Maintenance & Repair | 21 (100.0%) | 0 (0.0%) |
| Total (Category) | 62 (100.0%) | 0 (0.0%) |
| Total (Overall) | 135 (43.0%) | 179 (57.0%) |
Production, Transportation and Moving Occupations
The most common Production, Transportation and Moving occupations in Pine Prairie are , and Transportation (38 | 12.1%).
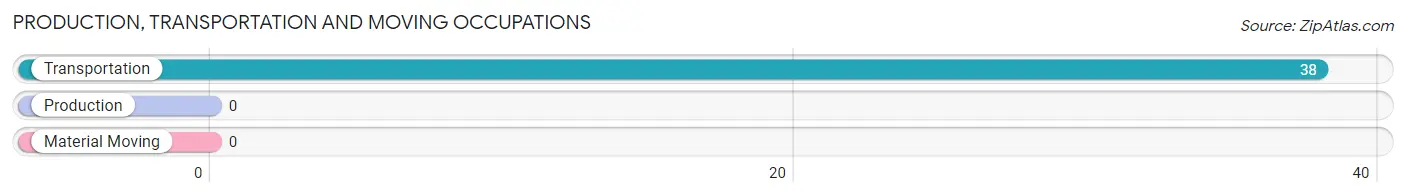
Production, Transportation and Moving Occupations by Sex
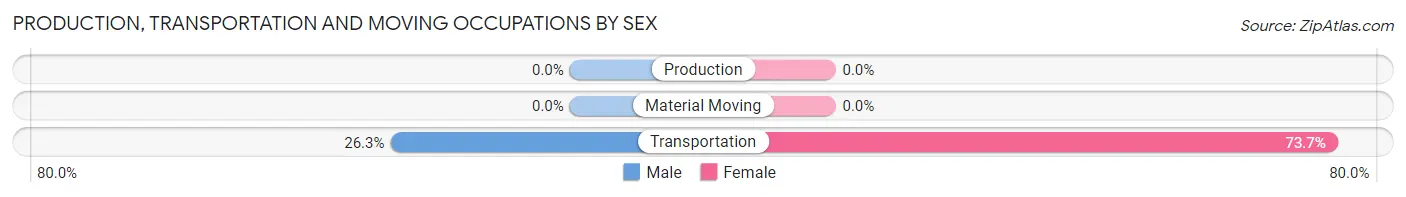
| Occupation | Male | Female |
| Production | 0 (0.0%) | 0 (0.0%) |
| Transportation | 10 (26.3%) | 28 (73.7%) |
| Material Moving | 0 (0.0%) | 0 (0.0%) |
| Total (Category) | 10 (26.3%) | 28 (73.7%) |
| Total (Overall) | 135 (43.0%) | 179 (57.0%) |
Employment Industries by Sex in Pine Prairie
Employment Industries in Pine Prairie
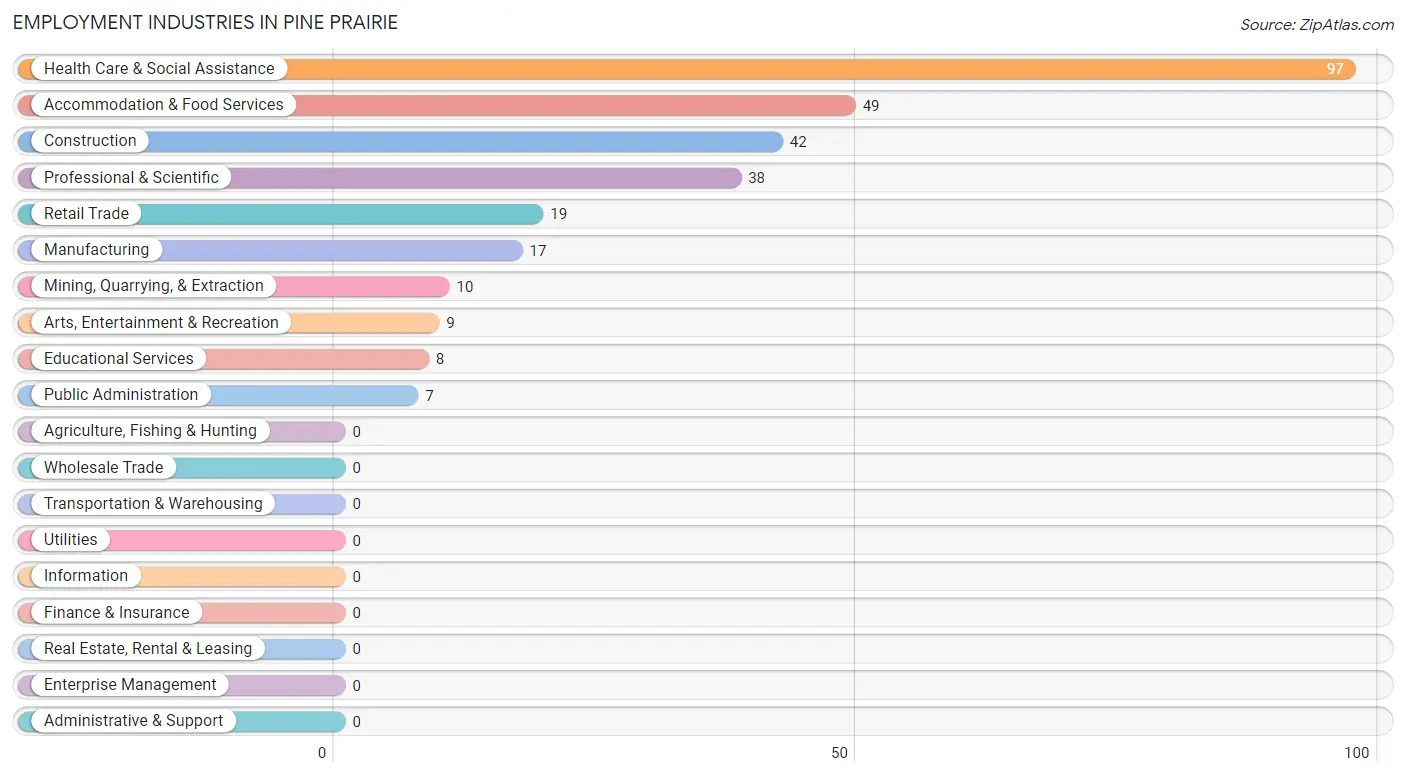
The major employment industries in Pine Prairie include Health Care & Social Assistance (97 | 30.9%), Accommodation & Food Services (49 | 15.6%), Construction (42 | 13.4%), Professional & Scientific (38 | 12.1%), and Retail Trade (19 | 6.0%).
Employment Industries by Sex in Pine Prairie
The Pine Prairie industries that see more men than women are Mining, Quarrying, & Extraction (100.0%), Construction (100.0%), and Manufacturing (100.0%), whereas the industries that tend to have a higher number of women are Professional & Scientific (100.0%), Educational Services (100.0%), and Health Care & Social Assistance (80.4%).
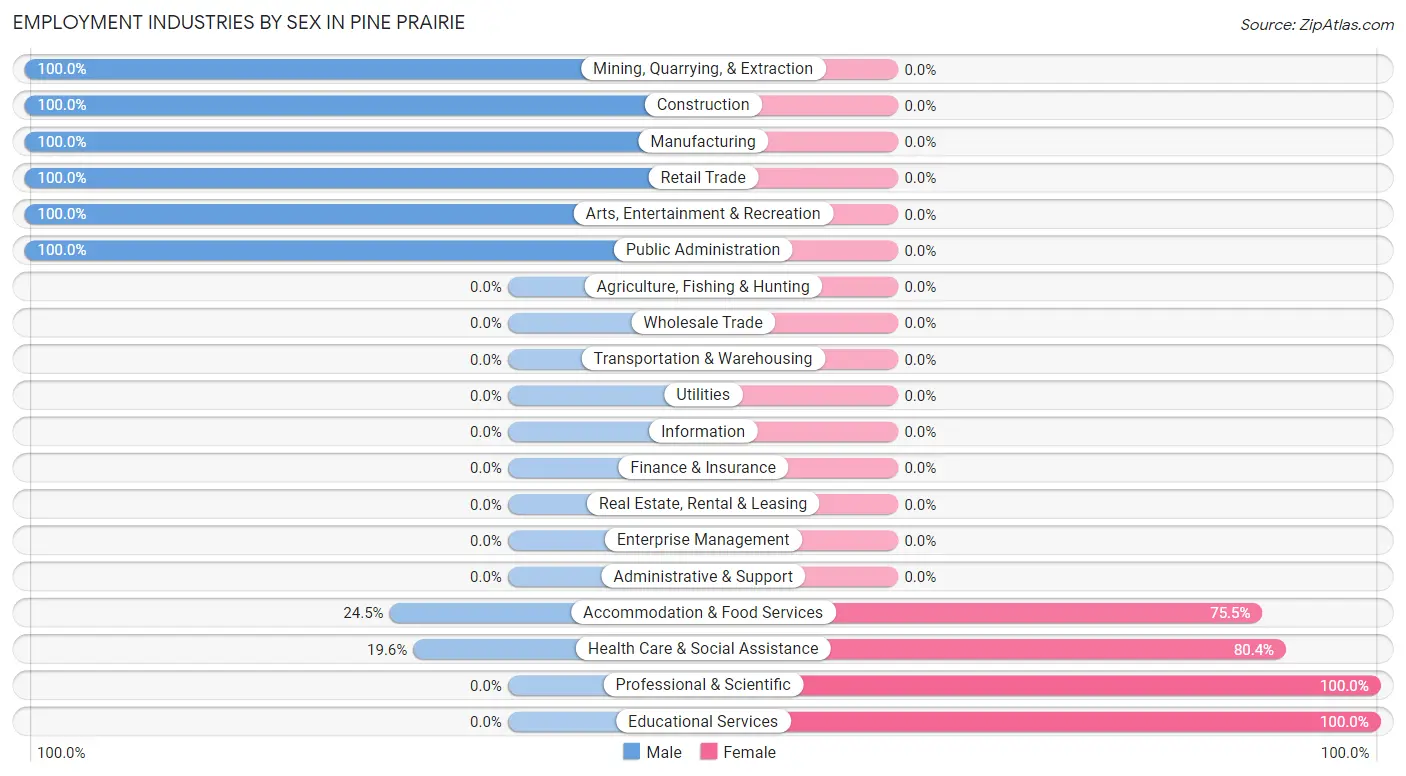
| Industry | Male | Female |
| Agriculture, Fishing & Hunting | 0 (0.0%) | 0 (0.0%) |
| Mining, Quarrying, & Extraction | 10 (100.0%) | 0 (0.0%) |
| Construction | 42 (100.0%) | 0 (0.0%) |
| Manufacturing | 17 (100.0%) | 0 (0.0%) |
| Wholesale Trade | 0 (0.0%) | 0 (0.0%) |
| Retail Trade | 19 (100.0%) | 0 (0.0%) |
| Transportation & Warehousing | 0 (0.0%) | 0 (0.0%) |
| Utilities | 0 (0.0%) | 0 (0.0%) |
| Information | 0 (0.0%) | 0 (0.0%) |
| Finance & Insurance | 0 (0.0%) | 0 (0.0%) |
| Real Estate, Rental & Leasing | 0 (0.0%) | 0 (0.0%) |
| Professional & Scientific | 0 (0.0%) | 38 (100.0%) |
| Enterprise Management | 0 (0.0%) | 0 (0.0%) |
| Administrative & Support | 0 (0.0%) | 0 (0.0%) |
| Educational Services | 0 (0.0%) | 8 (100.0%) |
| Health Care & Social Assistance | 19 (19.6%) | 78 (80.4%) |
| Arts, Entertainment & Recreation | 9 (100.0%) | 0 (0.0%) |
| Accommodation & Food Services | 12 (24.5%) | 37 (75.5%) |
| Public Administration | 7 (100.0%) | 0 (0.0%) |
| Total | 135 (43.0%) | 179 (57.0%) |
Education in Pine Prairie
School Enrollment in Pine Prairie
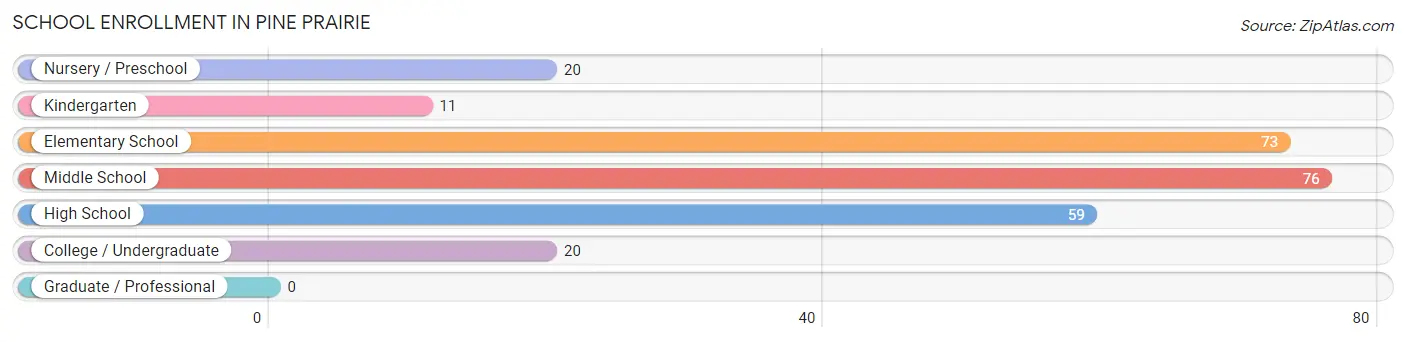
The most common levels of schooling among the 259 students in Pine Prairie are middle school (76 | 29.3%), elementary school (73 | 28.2%), and high school (59 | 22.8%).
| School Level | # Students | % Students |
| Nursery / Preschool | 20 | 7.7% |
| Kindergarten | 11 | 4.3% |
| Elementary School | 73 | 28.2% |
| Middle School | 76 | 29.3% |
| High School | 59 | 22.8% |
| College / Undergraduate | 20 | 7.7% |
| Graduate / Professional | 0 | 0.0% |
| Total | 259 | 100.0% |
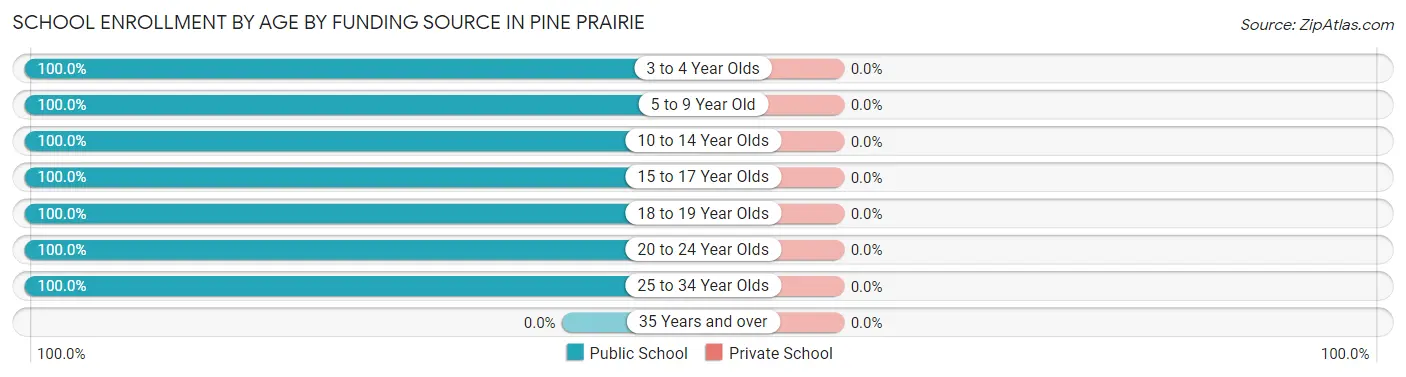
School Enrollment by Age by Funding Source in Pine Prairie
| Age Bracket | Public School | Private School |
| 3 to 4 Year Olds | 8 (100.0%) | 0 (0.0%) |
| 5 to 9 Year Old | 96 (100.0%) | 0 (0.0%) |
| 10 to 14 Year Olds | 75 (100.0%) | 0 (0.0%) |
| 15 to 17 Year Olds | 60 (100.0%) | 0 (0.0%) |
| 18 to 19 Year Olds | 7 (100.0%) | 0 (0.0%) |
| 20 to 24 Year Olds | 8 (100.0%) | 0 (0.0%) |
| 25 to 34 Year Olds | 5 (100.0%) | 0 (0.0%) |
| 35 Years and over | 0 (0.0%) | 0 (0.0%) |
| Total | 259 (100.0%) | 0 (0.0%) |
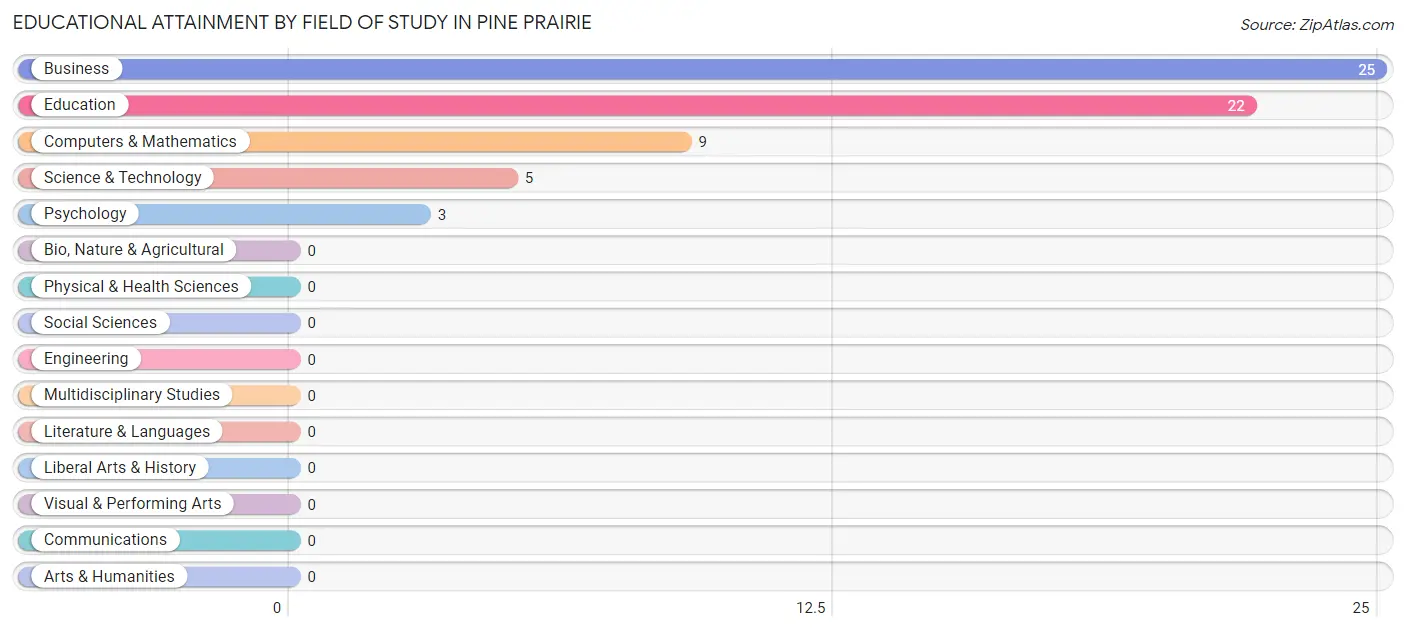
Educational Attainment by Field of Study in Pine Prairie
Business (25 | 39.1%), education (22 | 34.4%), computers & mathematics (9 | 14.1%), science & technology (5 | 7.8%), and psychology (3 | 4.7%) are the most common fields of study among 64 individuals in Pine Prairie who have obtained a bachelor's degree or higher.
| Field of Study | # Graduates | % Graduates |
| Computers & Mathematics | 9 | 14.1% |
| Bio, Nature & Agricultural | 0 | 0.0% |
| Physical & Health Sciences | 0 | 0.0% |
| Psychology | 3 | 4.7% |
| Social Sciences | 0 | 0.0% |
| Engineering | 0 | 0.0% |
| Multidisciplinary Studies | 0 | 0.0% |
| Science & Technology | 5 | 7.8% |
| Business | 25 | 39.1% |
| Education | 22 | 34.4% |
| Literature & Languages | 0 | 0.0% |
| Liberal Arts & History | 0 | 0.0% |
| Visual & Performing Arts | 0 | 0.0% |
| Communications | 0 | 0.0% |
| Arts & Humanities | 0 | 0.0% |
| Total | 64 | 100.0% |
Transportation & Commute in Pine Prairie
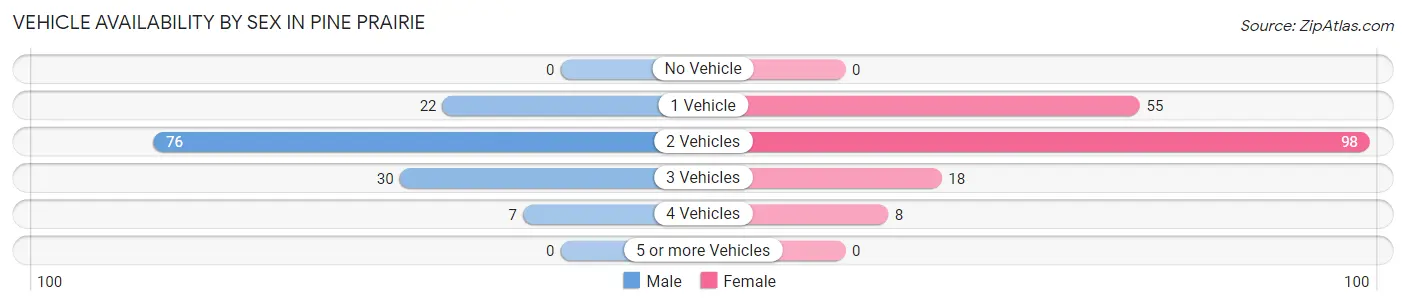
Vehicle Availability by Sex in Pine Prairie
The most prevalent vehicle ownership categories in Pine Prairie are males with 2 vehicles (76, accounting for 56.3%) and females with 2 vehicles (98, making up 42.5%).
| Vehicles Available | Male | Female |
| No Vehicle | 0 (0.0%) | 0 (0.0%) |
| 1 Vehicle | 22 (16.3%) | 55 (30.7%) |
| 2 Vehicles | 76 (56.3%) | 98 (54.7%) |
| 3 Vehicles | 30 (22.2%) | 18 (10.1%) |
| 4 Vehicles | 7 (5.2%) | 8 (4.5%) |
| 5 or more Vehicles | 0 (0.0%) | 0 (0.0%) |
| Total | 135 (100.0%) | 179 (100.0%) |
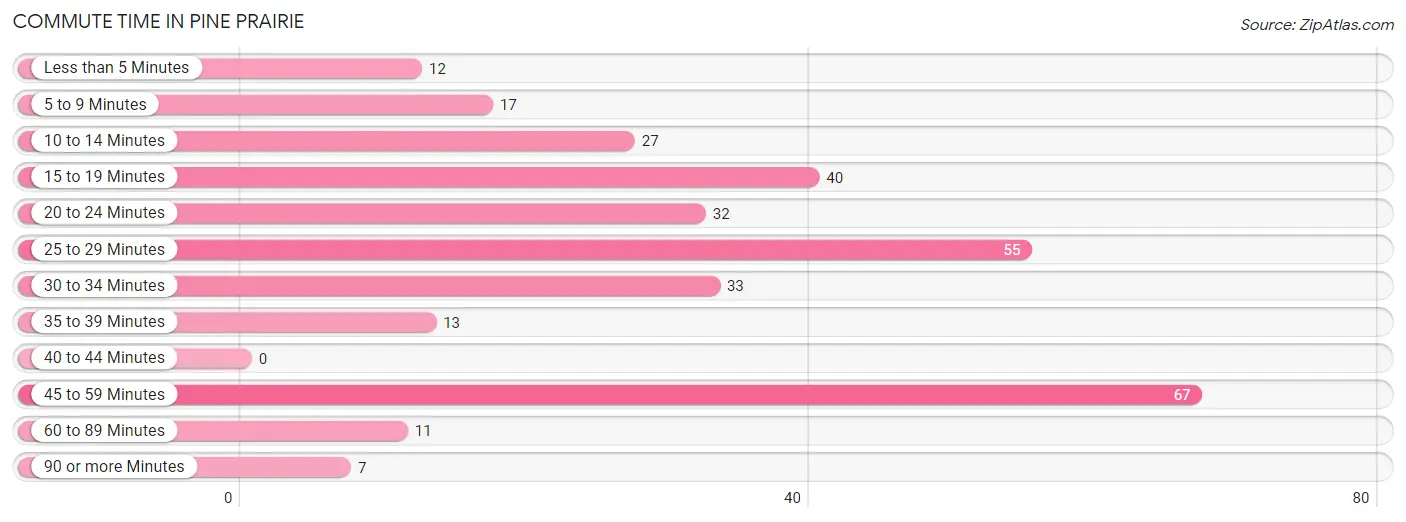
Commute Time in Pine Prairie
The most frequently occuring commute durations in Pine Prairie are 45 to 59 minutes (67 commuters, 21.3%), 25 to 29 minutes (55 commuters, 17.5%), and 15 to 19 minutes (40 commuters, 12.7%).
| Commute Time | # Commuters | % Commuters |
| Less than 5 Minutes | 12 | 3.8% |
| 5 to 9 Minutes | 17 | 5.4% |
| 10 to 14 Minutes | 27 | 8.6% |
| 15 to 19 Minutes | 40 | 12.7% |
| 20 to 24 Minutes | 32 | 10.2% |
| 25 to 29 Minutes | 55 | 17.5% |
| 30 to 34 Minutes | 33 | 10.5% |
| 35 to 39 Minutes | 13 | 4.1% |
| 40 to 44 Minutes | 0 | 0.0% |
| 45 to 59 Minutes | 67 | 21.3% |
| 60 to 89 Minutes | 11 | 3.5% |
| 90 or more Minutes | 7 | 2.2% |
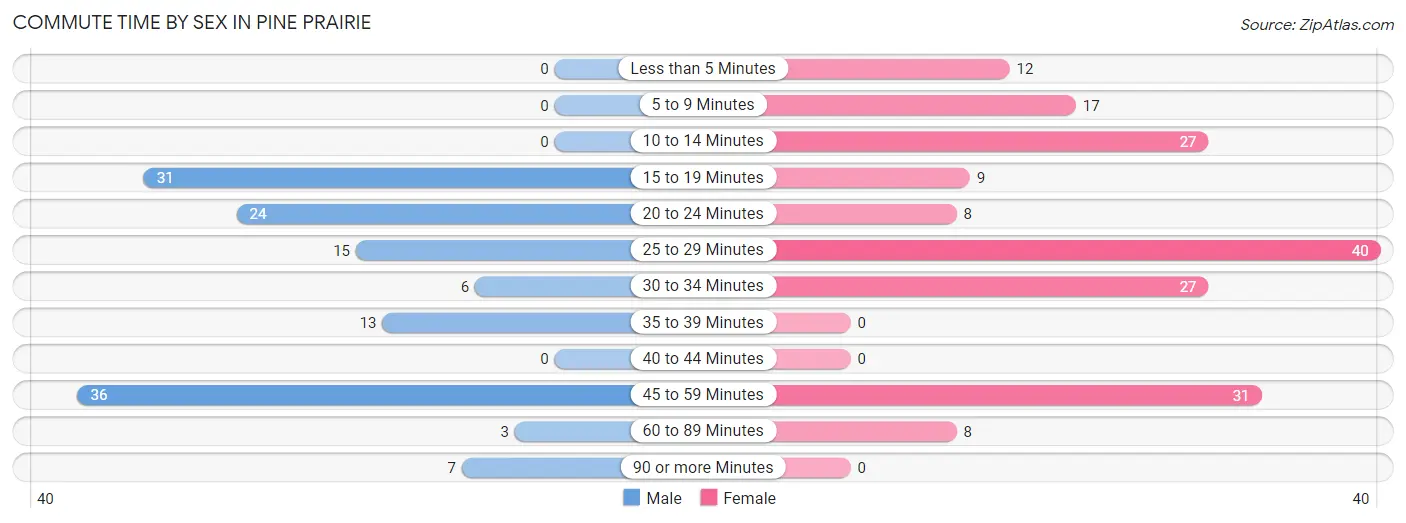
Commute Time by Sex in Pine Prairie
The most common commute times in Pine Prairie are 45 to 59 minutes (36 commuters, 26.7%) for males and 25 to 29 minutes (40 commuters, 22.4%) for females.
| Commute Time | Male | Female |
| Less than 5 Minutes | 0 (0.0%) | 12 (6.7%) |
| 5 to 9 Minutes | 0 (0.0%) | 17 (9.5%) |
| 10 to 14 Minutes | 0 (0.0%) | 27 (15.1%) |
| 15 to 19 Minutes | 31 (23.0%) | 9 (5.0%) |
| 20 to 24 Minutes | 24 (17.8%) | 8 (4.5%) |
| 25 to 29 Minutes | 15 (11.1%) | 40 (22.4%) |
| 30 to 34 Minutes | 6 (4.4%) | 27 (15.1%) |
| 35 to 39 Minutes | 13 (9.6%) | 0 (0.0%) |
| 40 to 44 Minutes | 0 (0.0%) | 0 (0.0%) |
| 45 to 59 Minutes | 36 (26.7%) | 31 (17.3%) |
| 60 to 89 Minutes | 3 (2.2%) | 8 (4.5%) |
| 90 or more Minutes | 7 (5.2%) | 0 (0.0%) |
Time of Departure to Work by Sex in Pine Prairie
The most frequent times of departure to work in Pine Prairie are 6:30 AM to 6:59 AM (39, 28.9%) for males and 7:30 AM to 7:59 AM (39, 21.8%) for females.
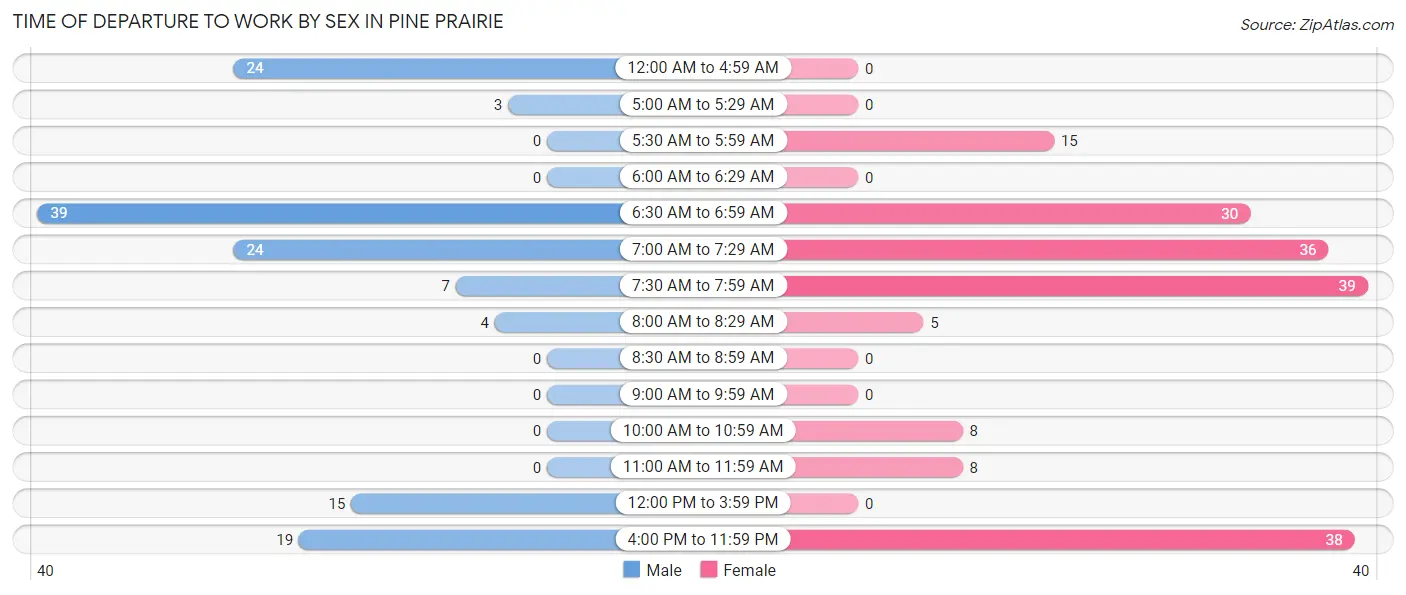
| Time of Departure | Male | Female |
| 12:00 AM to 4:59 AM | 24 (17.8%) | 0 (0.0%) |
| 5:00 AM to 5:29 AM | 3 (2.2%) | 0 (0.0%) |
| 5:30 AM to 5:59 AM | 0 (0.0%) | 15 (8.4%) |
| 6:00 AM to 6:29 AM | 0 (0.0%) | 0 (0.0%) |
| 6:30 AM to 6:59 AM | 39 (28.9%) | 30 (16.8%) |
| 7:00 AM to 7:29 AM | 24 (17.8%) | 36 (20.1%) |
| 7:30 AM to 7:59 AM | 7 (5.2%) | 39 (21.8%) |
| 8:00 AM to 8:29 AM | 4 (3.0%) | 5 (2.8%) |
| 8:30 AM to 8:59 AM | 0 (0.0%) | 0 (0.0%) |
| 9:00 AM to 9:59 AM | 0 (0.0%) | 0 (0.0%) |
| 10:00 AM to 10:59 AM | 0 (0.0%) | 8 (4.5%) |
| 11:00 AM to 11:59 AM | 0 (0.0%) | 8 (4.5%) |
| 12:00 PM to 3:59 PM | 15 (11.1%) | 0 (0.0%) |
| 4:00 PM to 11:59 PM | 19 (14.1%) | 38 (21.2%) |
| Total | 135 (100.0%) | 179 (100.0%) |
Housing Occupancy in Pine Prairie
Occupancy by Ownership in Pine Prairie
Of the total 396 dwellings in Pine Prairie, owner-occupied units account for 224 (56.6%), while renter-occupied units make up 172 (43.4%).
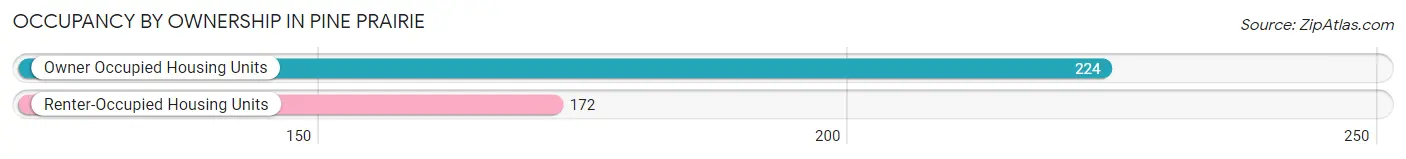
| Occupancy | # Housing Units | % Housing Units |
| Owner Occupied Housing Units | 224 | 56.6% |
| Renter-Occupied Housing Units | 172 | 43.4% |
| Total Occupied Housing Units | 396 | 100.0% |
Occupancy by Household Size in Pine Prairie
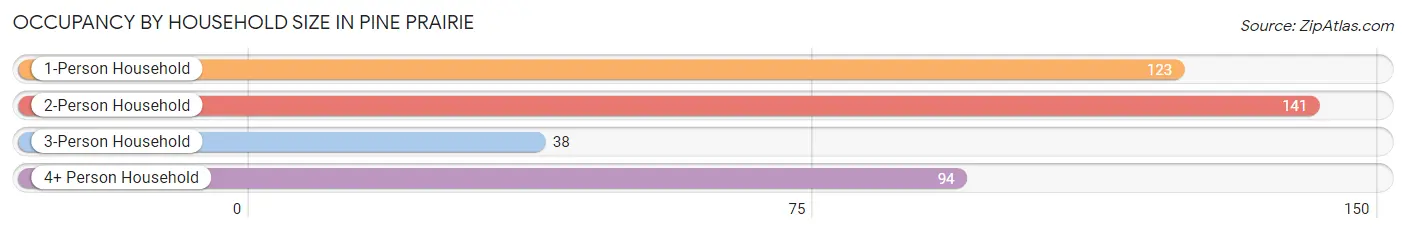
| Household Size | # Housing Units | % Housing Units |
| 1-Person Household | 123 | 31.1% |
| 2-Person Household | 141 | 35.6% |
| 3-Person Household | 38 | 9.6% |
| 4+ Person Household | 94 | 23.7% |
| Total Housing Units | 396 | 100.0% |
Occupancy by Ownership by Household Size in Pine Prairie
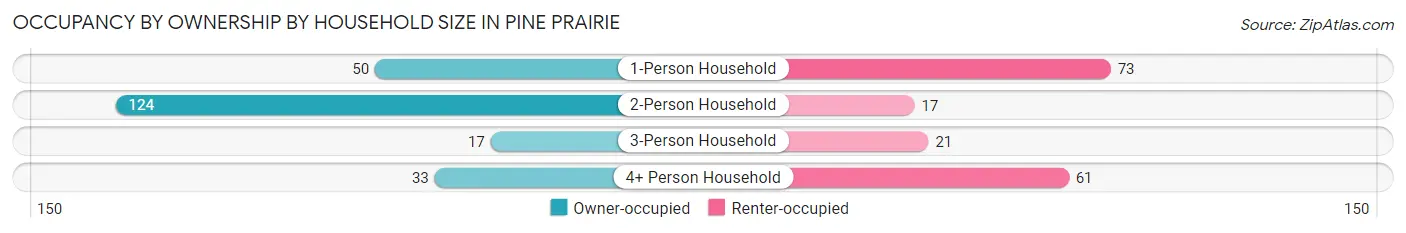
| Household Size | Owner-occupied | Renter-occupied |
| 1-Person Household | 50 (40.6%) | 73 (59.4%) |
| 2-Person Household | 124 (87.9%) | 17 (12.1%) |
| 3-Person Household | 17 (44.7%) | 21 (55.3%) |
| 4+ Person Household | 33 (35.1%) | 61 (64.9%) |
| Total Housing Units | 224 (56.6%) | 172 (43.4%) |
Occupancy by Educational Attainment in Pine Prairie
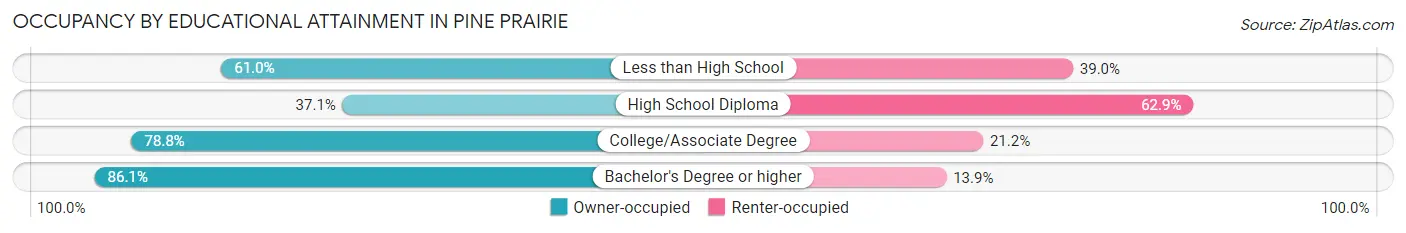
| Household Size | Owner-occupied | Renter-occupied |
| Less than High School | 61 (61.0%) | 39 (39.0%) |
| High School Diploma | 65 (37.1%) | 110 (62.9%) |
| College/Associate Degree | 67 (78.8%) | 18 (21.2%) |
| Bachelor's Degree or higher | 31 (86.1%) | 5 (13.9%) |
Occupancy by Age of Householder in Pine Prairie
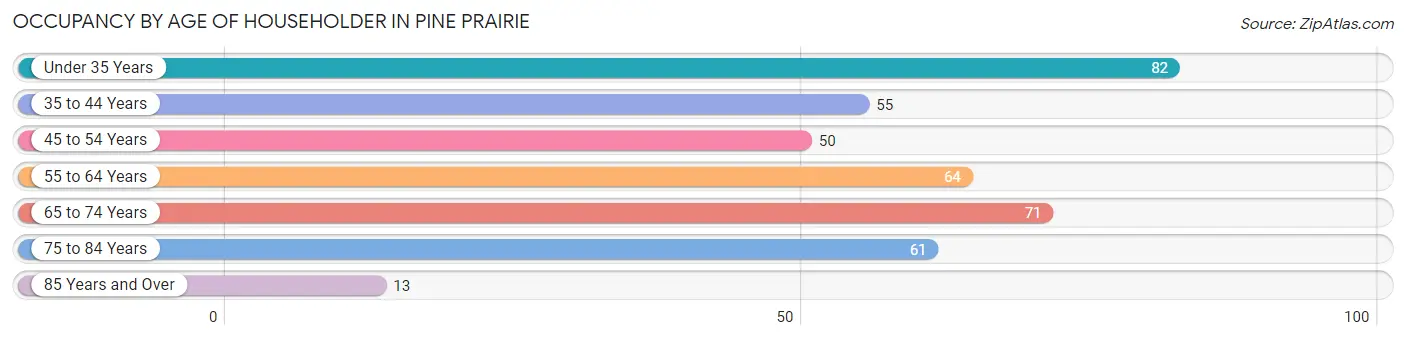
| Age Bracket | # Households | % Households |
| Under 35 Years | 82 | 20.7% |
| 35 to 44 Years | 55 | 13.9% |
| 45 to 54 Years | 50 | 12.6% |
| 55 to 64 Years | 64 | 16.2% |
| 65 to 74 Years | 71 | 17.9% |
| 75 to 84 Years | 61 | 15.4% |
| 85 Years and Over | 13 | 3.3% |
| Total | 396 | 100.0% |
Housing Finances in Pine Prairie
Median Income by Occupancy in Pine Prairie
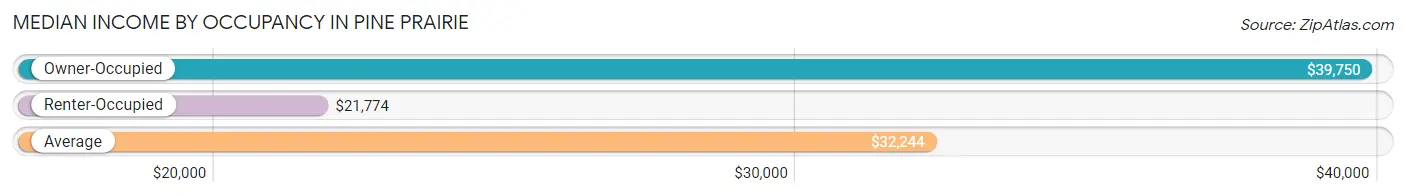
| Occupancy Type | # Households | Median Income |
| Owner-Occupied | 224 (56.6%) | $39,750 |
| Renter-Occupied | 172 (43.4%) | $21,774 |
| Average | 396 (100.0%) | $32,244 |
Occupancy by Householder Income Bracket in Pine Prairie
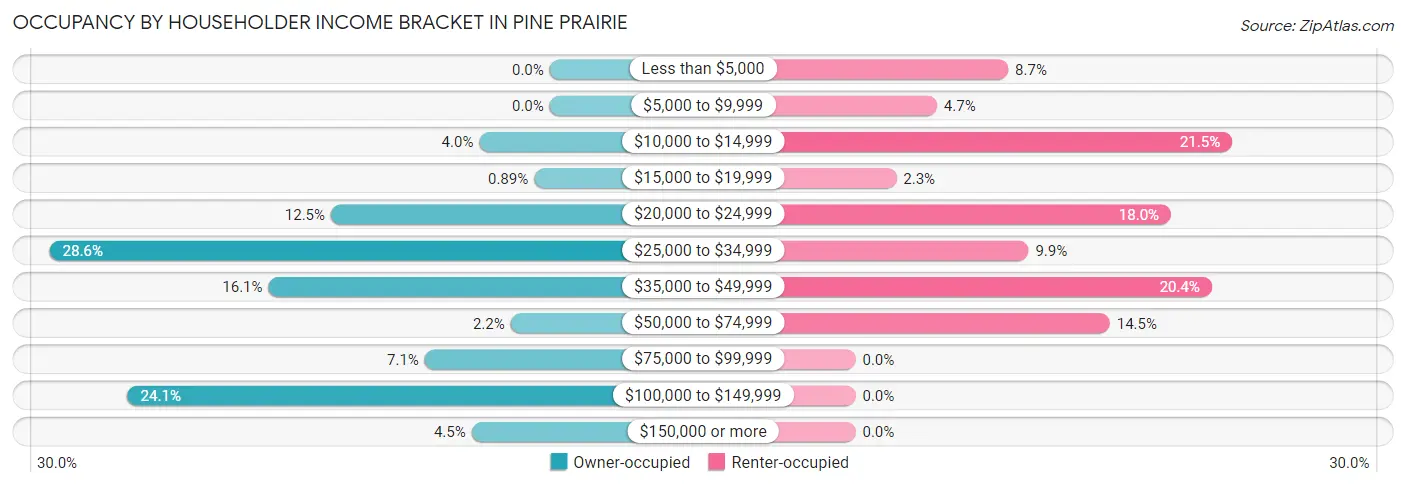
| Income Bracket | Owner-occupied | Renter-occupied |
| Less than $5,000 | 0 (0.0%) | 15 (8.7%) |
| $5,000 to $9,999 | 0 (0.0%) | 8 (4.6%) |
| $10,000 to $14,999 | 9 (4.0%) | 37 (21.5%) |
| $15,000 to $19,999 | 2 (0.9%) | 4 (2.3%) |
| $20,000 to $24,999 | 28 (12.5%) | 31 (18.0%) |
| $25,000 to $34,999 | 64 (28.6%) | 17 (9.9%) |
| $35,000 to $49,999 | 36 (16.1%) | 35 (20.3%) |
| $50,000 to $74,999 | 5 (2.2%) | 25 (14.5%) |
| $75,000 to $99,999 | 16 (7.1%) | 0 (0.0%) |
| $100,000 to $149,999 | 54 (24.1%) | 0 (0.0%) |
| $150,000 or more | 10 (4.5%) | 0 (0.0%) |
| Total | 224 (100.0%) | 172 (100.0%) |
Monthly Housing Cost Tiers in Pine Prairie
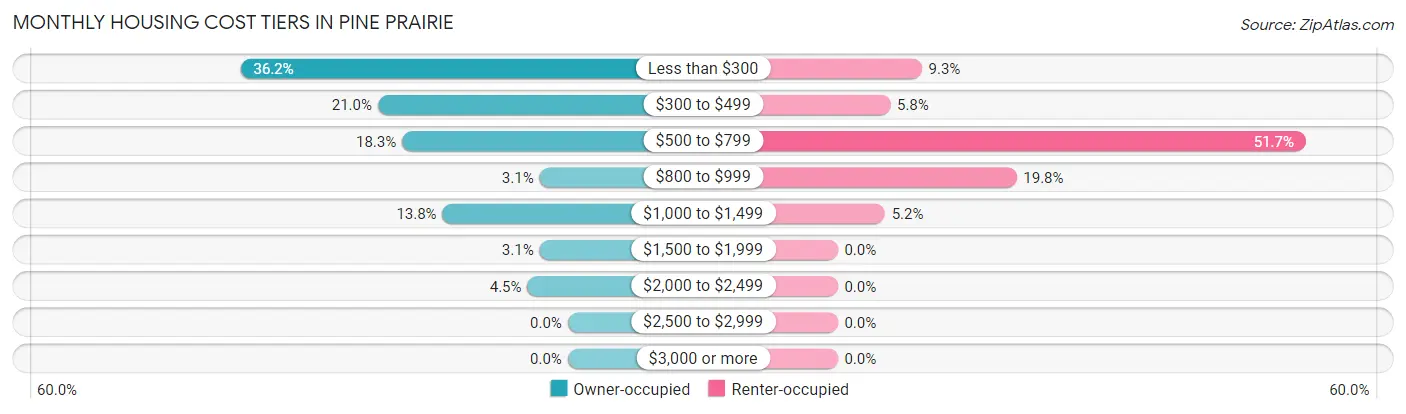
| Monthly Cost | Owner-occupied | Renter-occupied |
| Less than $300 | 81 (36.2%) | 16 (9.3%) |
| $300 to $499 | 47 (21.0%) | 10 (5.8%) |
| $500 to $799 | 41 (18.3%) | 89 (51.7%) |
| $800 to $999 | 7 (3.1%) | 34 (19.8%) |
| $1,000 to $1,499 | 31 (13.8%) | 9 (5.2%) |
| $1,500 to $1,999 | 7 (3.1%) | 0 (0.0%) |
| $2,000 to $2,499 | 10 (4.5%) | 0 (0.0%) |
| $2,500 to $2,999 | 0 (0.0%) | 0 (0.0%) |
| $3,000 or more | 0 (0.0%) | 0 (0.0%) |
| Total | 224 (100.0%) | 172 (100.0%) |
Physical Housing Characteristics in Pine Prairie
Housing Structures in Pine Prairie
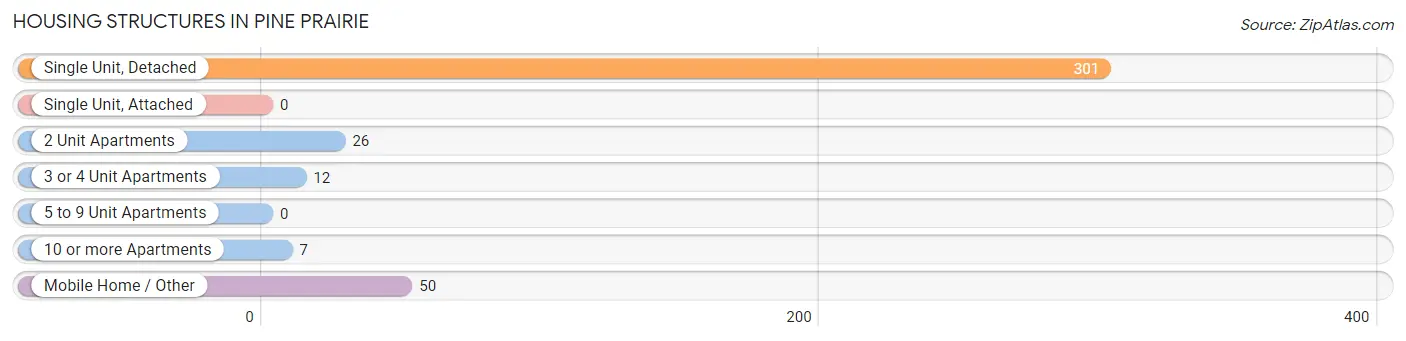
| Structure Type | # Housing Units | % Housing Units |
| Single Unit, Detached | 301 | 76.0% |
| Single Unit, Attached | 0 | 0.0% |
| 2 Unit Apartments | 26 | 6.6% |
| 3 or 4 Unit Apartments | 12 | 3.0% |
| 5 to 9 Unit Apartments | 0 | 0.0% |
| 10 or more Apartments | 7 | 1.8% |
| Mobile Home / Other | 50 | 12.6% |
| Total | 396 | 100.0% |
Housing Structures by Occupancy in Pine Prairie
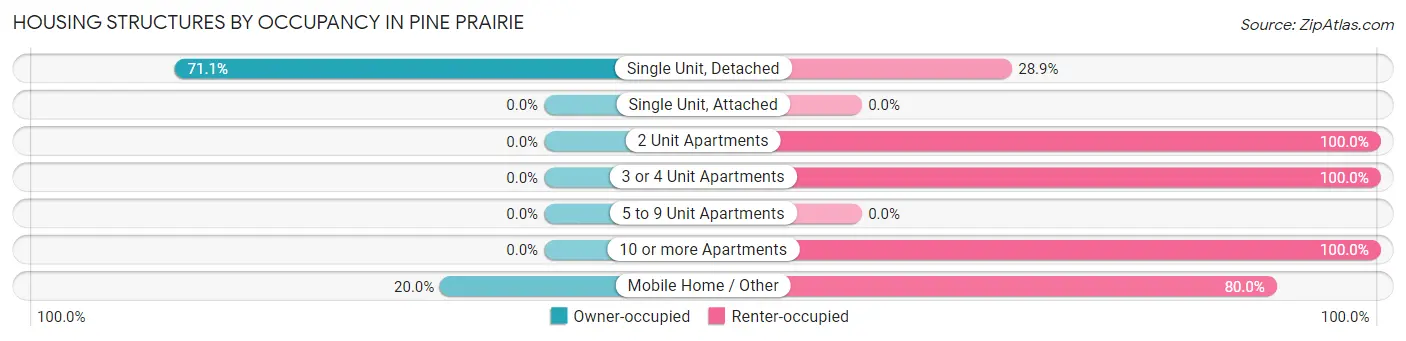
| Structure Type | Owner-occupied | Renter-occupied |
| Single Unit, Detached | 214 (71.1%) | 87 (28.9%) |
| Single Unit, Attached | 0 (0.0%) | 0 (0.0%) |
| 2 Unit Apartments | 0 (0.0%) | 26 (100.0%) |
| 3 or 4 Unit Apartments | 0 (0.0%) | 12 (100.0%) |
| 5 to 9 Unit Apartments | 0 (0.0%) | 0 (0.0%) |
| 10 or more Apartments | 0 (0.0%) | 7 (100.0%) |
| Mobile Home / Other | 10 (20.0%) | 40 (80.0%) |
| Total | 224 (56.6%) | 172 (43.4%) |
Housing Structures by Number of Rooms in Pine Prairie
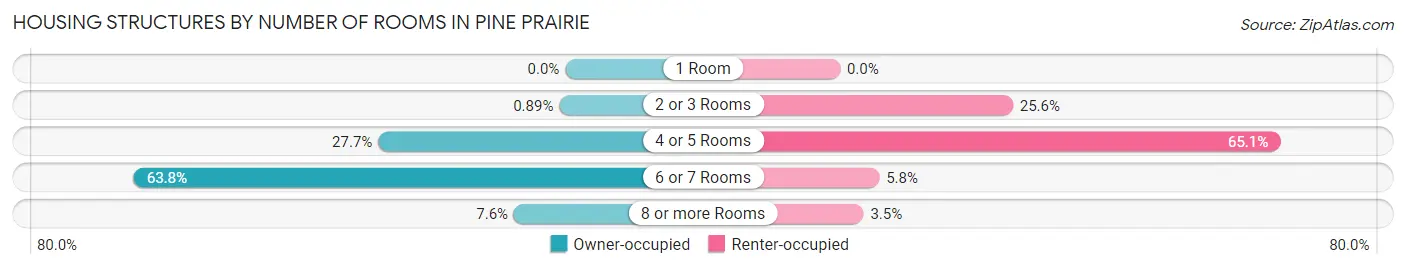
| Number of Rooms | Owner-occupied | Renter-occupied |
| 1 Room | 0 (0.0%) | 0 (0.0%) |
| 2 or 3 Rooms | 2 (0.9%) | 44 (25.6%) |
| 4 or 5 Rooms | 62 (27.7%) | 112 (65.1%) |
| 6 or 7 Rooms | 143 (63.8%) | 10 (5.8%) |
| 8 or more Rooms | 17 (7.6%) | 6 (3.5%) |
| Total | 224 (100.0%) | 172 (100.0%) |
Housing Structure by Heating Type in Pine Prairie
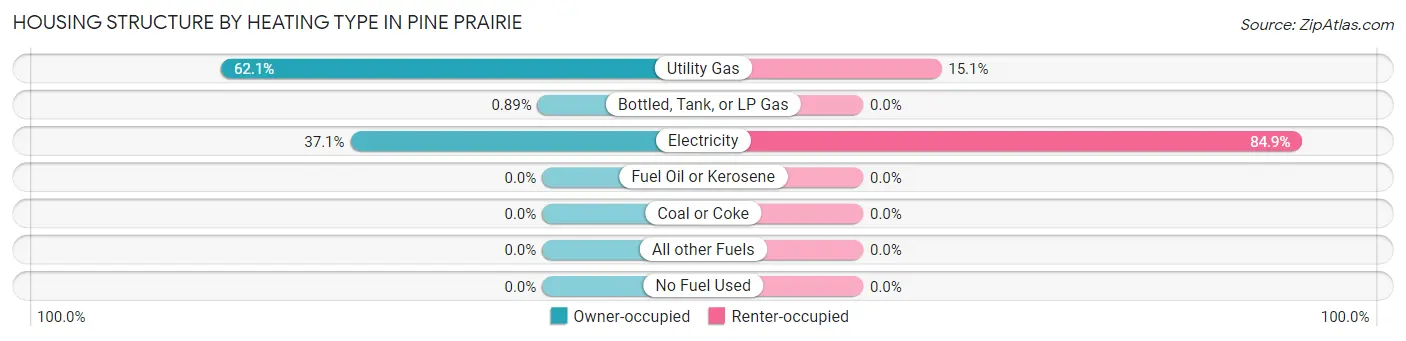
| Heating Type | Owner-occupied | Renter-occupied |
| Utility Gas | 139 (62.1%) | 26 (15.1%) |
| Bottled, Tank, or LP Gas | 2 (0.9%) | 0 (0.0%) |
| Electricity | 83 (37.0%) | 146 (84.9%) |
| Fuel Oil or Kerosene | 0 (0.0%) | 0 (0.0%) |
| Coal or Coke | 0 (0.0%) | 0 (0.0%) |
| All other Fuels | 0 (0.0%) | 0 (0.0%) |
| No Fuel Used | 0 (0.0%) | 0 (0.0%) |
| Total | 224 (100.0%) | 172 (100.0%) |
Household Vehicle Usage in Pine Prairie
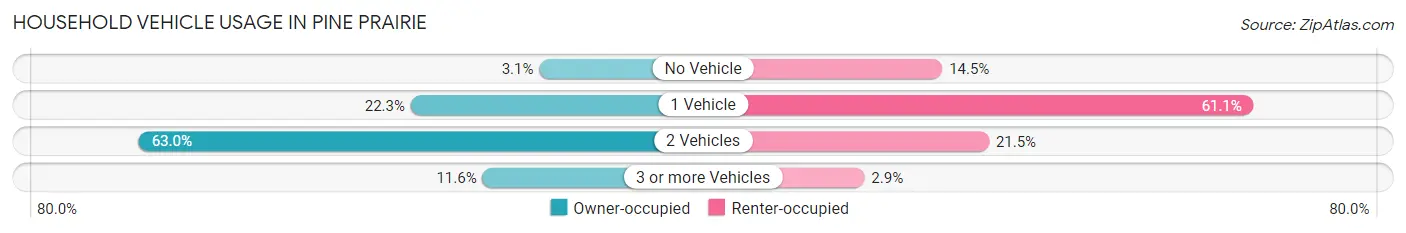
| Vehicles per Household | Owner-occupied | Renter-occupied |
| No Vehicle | 7 (3.1%) | 25 (14.5%) |
| 1 Vehicle | 50 (22.3%) | 105 (61.1%) |
| 2 Vehicles | 141 (62.9%) | 37 (21.5%) |
| 3 or more Vehicles | 26 (11.6%) | 5 (2.9%) |
| Total | 224 (100.0%) | 172 (100.0%) |
Real Estate & Mortgages in Pine Prairie
Real Estate and Mortgage Overview in Pine Prairie
| Characteristic | Without Mortgage | With Mortgage |
| Housing Units | 169 | 55 |
| Median Property Value | $155,400 | $155,100 |
| Median Household Income | $31,314 | $10 |
| Monthly Housing Costs | $312 | $0 |
| Real Estate Taxes | $199 | $7 |
Property Value by Mortgage Status in Pine Prairie
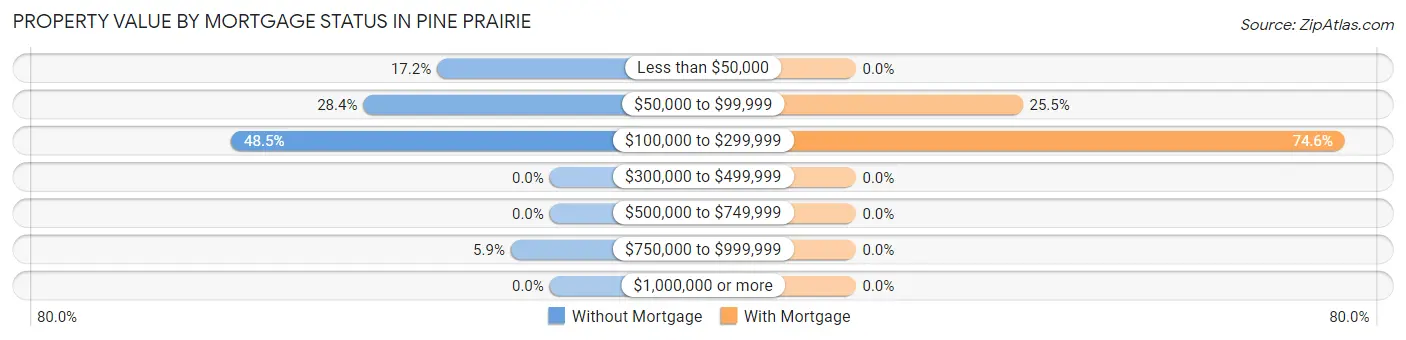
| Property Value | Without Mortgage | With Mortgage |
| Less than $50,000 | 29 (17.2%) | 0 (0.0%) |
| $50,000 to $99,999 | 48 (28.4%) | 14 (25.5%) |
| $100,000 to $299,999 | 82 (48.5%) | 41 (74.6%) |
| $300,000 to $499,999 | 0 (0.0%) | 0 (0.0%) |
| $500,000 to $749,999 | 0 (0.0%) | 0 (0.0%) |
| $750,000 to $999,999 | 10 (5.9%) | 0 (0.0%) |
| $1,000,000 or more | 0 (0.0%) | 0 (0.0%) |
| Total | 169 (100.0%) | 55 (100.0%) |
Household Income by Mortgage Status in Pine Prairie
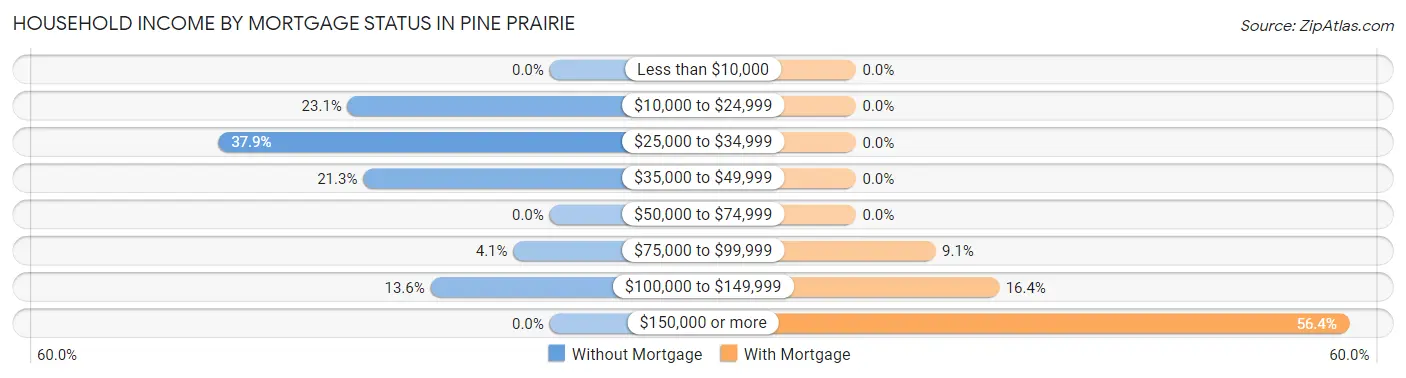
| Household Income | Without Mortgage | With Mortgage |
| Less than $10,000 | 0 (0.0%) | 0 (0.0%) |
| $10,000 to $24,999 | 39 (23.1%) | 0 (0.0%) |
| $25,000 to $34,999 | 64 (37.9%) | 0 (0.0%) |
| $35,000 to $49,999 | 36 (21.3%) | 0 (0.0%) |
| $50,000 to $74,999 | 0 (0.0%) | 0 (0.0%) |
| $75,000 to $99,999 | 7 (4.1%) | 5 (9.1%) |
| $100,000 to $149,999 | 23 (13.6%) | 9 (16.4%) |
| $150,000 or more | 0 (0.0%) | 31 (56.4%) |
| Total | 169 (100.0%) | 55 (100.0%) |
Property Value to Household Income Ratio in Pine Prairie
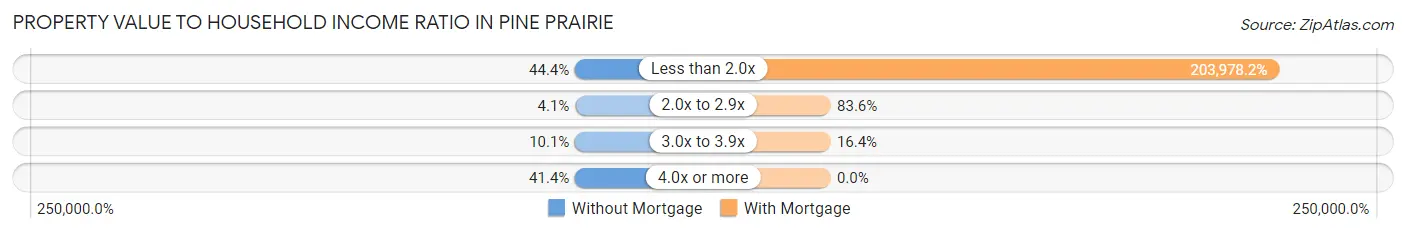
| Value-to-Income Ratio | Without Mortgage | With Mortgage |
| Less than 2.0x | 75 (44.4%) | 112,188 (203,978.2%) |
| 2.0x to 2.9x | 7 (4.1%) | 46 (83.6%) |
| 3.0x to 3.9x | 17 (10.1%) | 9 (16.4%) |
| 4.0x or more | 70 (41.4%) | 0 (0.0%) |
| Total | 169 (100.0%) | 55 (100.0%) |
Real Estate Taxes by Mortgage Status in Pine Prairie
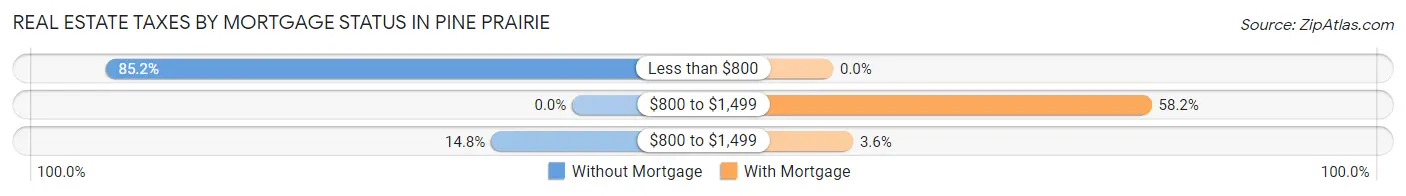
| Property Taxes | Without Mortgage | With Mortgage |
| Less than $800 | 144 (85.2%) | 0 (0.0%) |
| $800 to $1,499 | 0 (0.0%) | 32 (58.2%) |
| $800 to $1,499 | 25 (14.8%) | 2 (3.6%) |
| Total | 169 (100.0%) | 55 (100.0%) |
Health & Disability in Pine Prairie
Health Insurance Coverage by Age in Pine Prairie
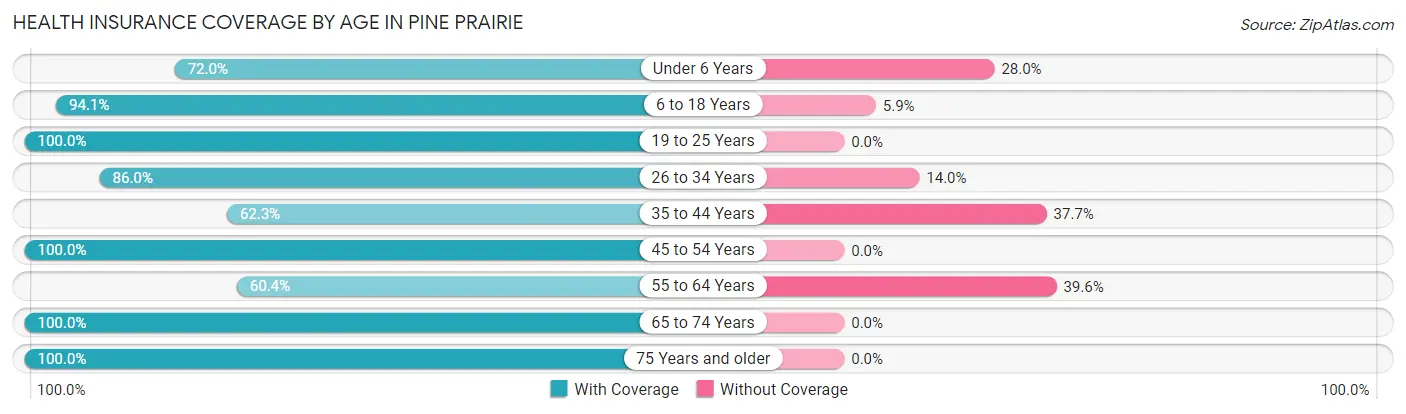
| Age Bracket | With Coverage | Without Coverage |
| Under 6 Years | 54 (72.0%) | 21 (28.0%) |
| 6 to 18 Years | 208 (94.1%) | 13 (5.9%) |
| 19 to 25 Years | 71 (100.0%) | 0 (0.0%) |
| 26 to 34 Years | 86 (86.0%) | 14 (14.0%) |
| 35 to 44 Years | 66 (62.3%) | 40 (37.7%) |
| 45 to 54 Years | 87 (100.0%) | 0 (0.0%) |
| 55 to 64 Years | 84 (60.4%) | 55 (39.6%) |
| 65 to 74 Years | 95 (100.0%) | 0 (0.0%) |
| 75 Years and older | 111 (100.0%) | 0 (0.0%) |
| Total | 862 (85.8%) | 143 (14.2%) |
Health Insurance Coverage by Citizenship Status in Pine Prairie
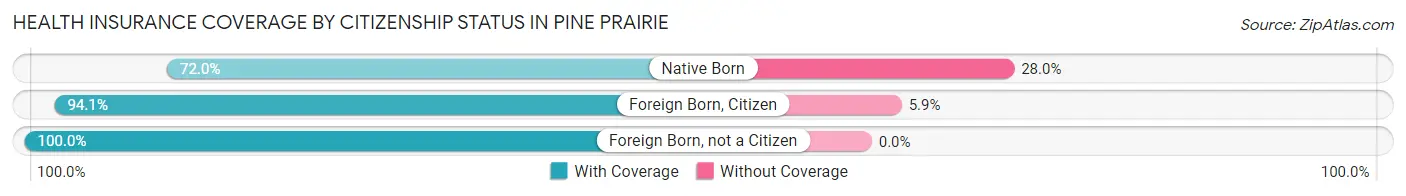
| Citizenship Status | With Coverage | Without Coverage |
| Native Born | 54 (72.0%) | 21 (28.0%) |
| Foreign Born, Citizen | 208 (94.1%) | 13 (5.9%) |
| Foreign Born, not a Citizen | 71 (100.0%) | 0 (0.0%) |
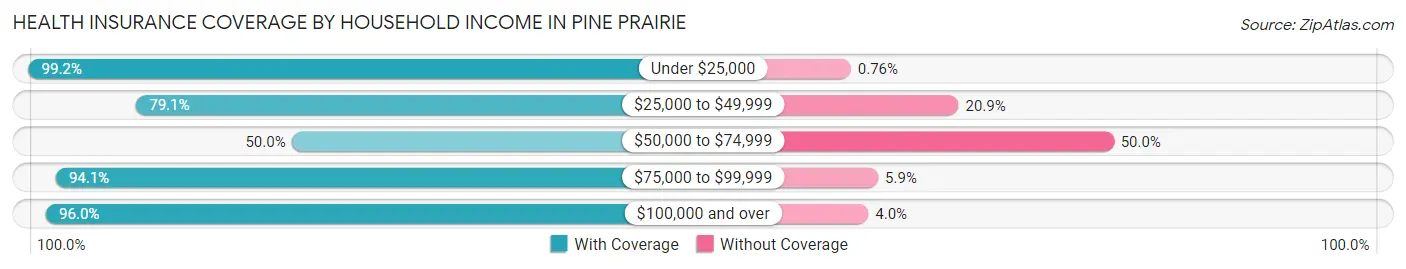
Health Insurance Coverage by Household Income in Pine Prairie
| Household Income | With Coverage | Without Coverage |
| Under $25,000 | 260 (99.2%) | 2 (0.8%) |
| $25,000 to $49,999 | 287 (79.1%) | 76 (20.9%) |
| $50,000 to $74,999 | 53 (50.0%) | 53 (50.0%) |
| $75,000 to $99,999 | 48 (94.1%) | 3 (5.9%) |
| $100,000 and over | 214 (96.0%) | 9 (4.0%) |
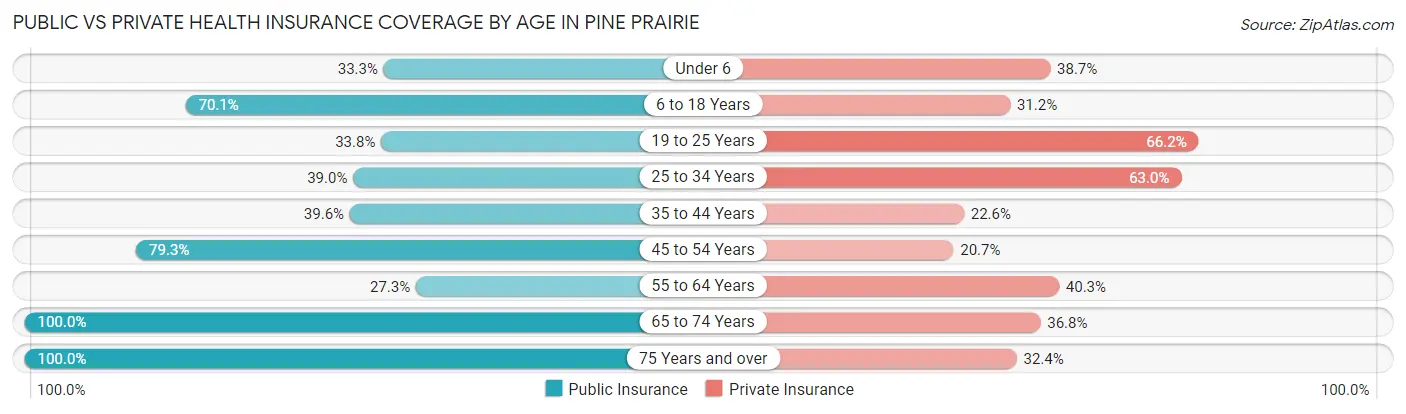
Public vs Private Health Insurance Coverage by Age in Pine Prairie
| Age Bracket | Public Insurance | Private Insurance |
| Under 6 | 25 (33.3%) | 29 (38.7%) |
| 6 to 18 Years | 155 (70.1%) | 69 (31.2%) |
| 19 to 25 Years | 24 (33.8%) | 47 (66.2%) |
| 25 to 34 Years | 39 (39.0%) | 63 (63.0%) |
| 35 to 44 Years | 42 (39.6%) | 24 (22.6%) |
| 45 to 54 Years | 69 (79.3%) | 18 (20.7%) |
| 55 to 64 Years | 38 (27.3%) | 56 (40.3%) |
| 65 to 74 Years | 95 (100.0%) | 35 (36.8%) |
| 75 Years and over | 111 (100.0%) | 36 (32.4%) |
| Total | 598 (59.5%) | 377 (37.5%) |
Disability Status by Sex by Age in Pine Prairie
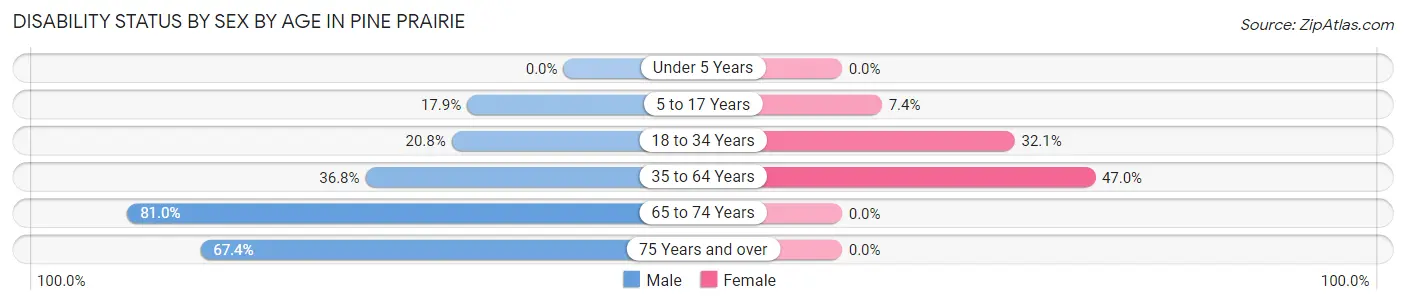
| Age Bracket | Male | Female |
| Under 5 Years | 0 (0.0%) | 0 (0.0%) |
| 5 to 17 Years | 22 (17.9%) | 8 (7.4%) |
| 18 to 34 Years | 11 (20.7%) | 42 (32.1%) |
| 35 to 64 Years | 61 (36.7%) | 78 (47.0%) |
| 65 to 74 Years | 34 (80.9%) | 0 (0.0%) |
| 75 Years and over | 62 (67.4%) | 0 (0.0%) |
Disability Class by Sex by Age in Pine Prairie
Disability Class: Hearing Difficulty
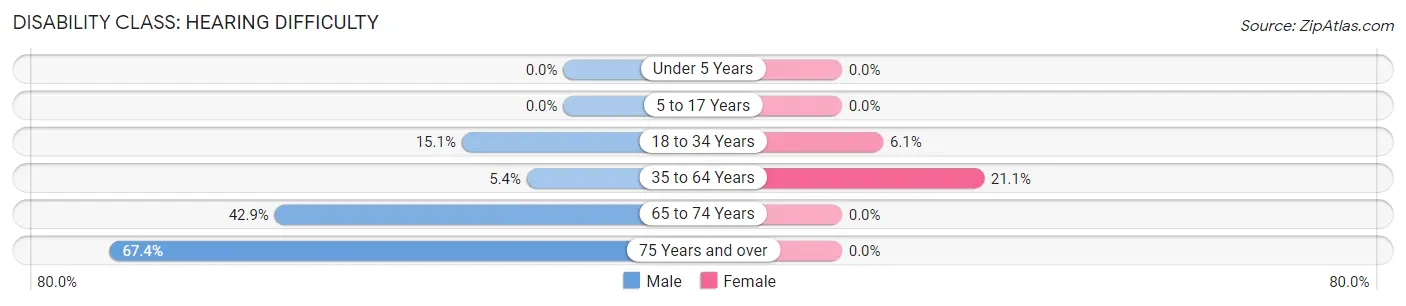
| Age Bracket | Male | Female |
| Under 5 Years | 0 (0.0%) | 0 (0.0%) |
| 5 to 17 Years | 0 (0.0%) | 0 (0.0%) |
| 18 to 34 Years | 8 (15.1%) | 8 (6.1%) |
| 35 to 64 Years | 9 (5.4%) | 35 (21.1%) |
| 65 to 74 Years | 18 (42.9%) | 0 (0.0%) |
| 75 Years and over | 62 (67.4%) | 0 (0.0%) |
Disability Class: Vision Difficulty
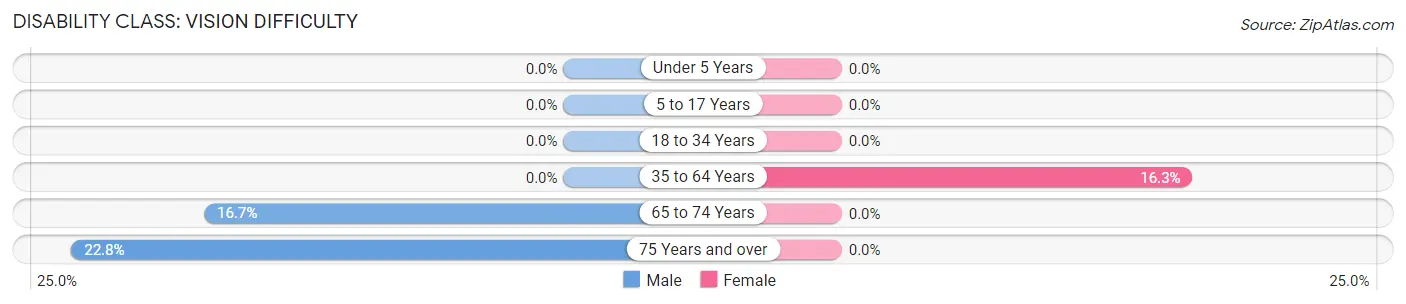
| Age Bracket | Male | Female |
| Under 5 Years | 0 (0.0%) | 0 (0.0%) |
| 5 to 17 Years | 0 (0.0%) | 0 (0.0%) |
| 18 to 34 Years | 0 (0.0%) | 0 (0.0%) |
| 35 to 64 Years | 0 (0.0%) | 27 (16.3%) |
| 65 to 74 Years | 7 (16.7%) | 0 (0.0%) |
| 75 Years and over | 21 (22.8%) | 0 (0.0%) |
Disability Class: Cognitive Difficulty
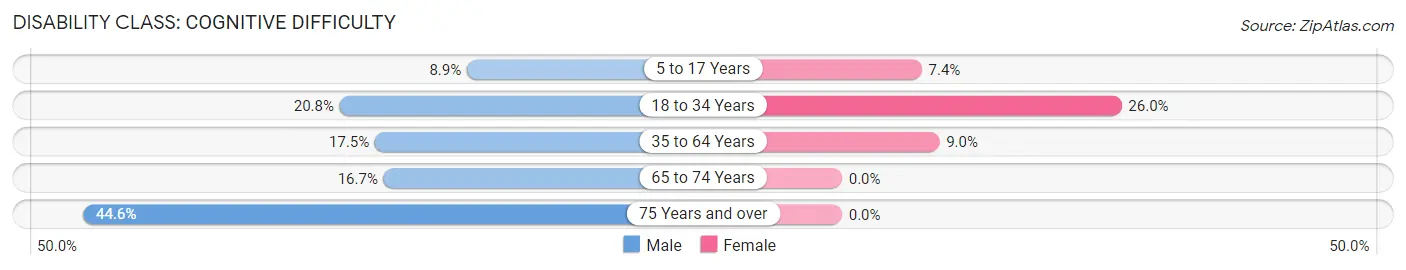
| Age Bracket | Male | Female |
| 5 to 17 Years | 11 (8.9%) | 8 (7.4%) |
| 18 to 34 Years | 11 (20.7%) | 34 (26.0%) |
| 35 to 64 Years | 29 (17.5%) | 15 (9.0%) |
| 65 to 74 Years | 7 (16.7%) | 0 (0.0%) |
| 75 Years and over | 41 (44.6%) | 0 (0.0%) |
Disability Class: Ambulatory Difficulty
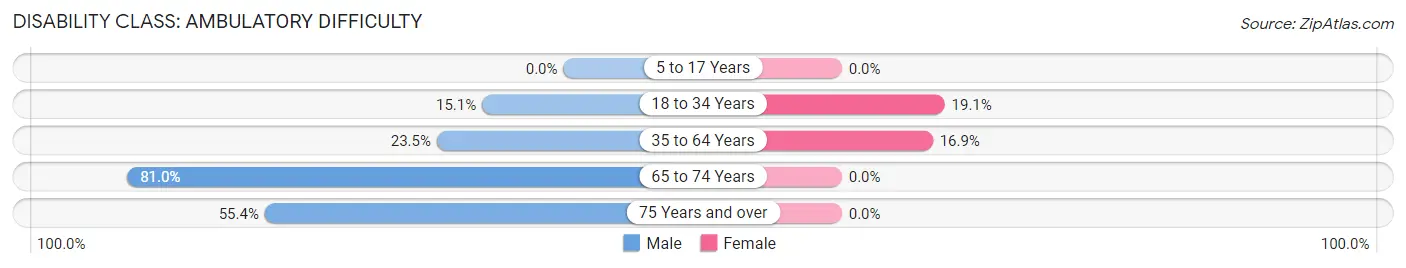
| Age Bracket | Male | Female |
| 5 to 17 Years | 0 (0.0%) | 0 (0.0%) |
| 18 to 34 Years | 8 (15.1%) | 25 (19.1%) |
| 35 to 64 Years | 39 (23.5%) | 28 (16.9%) |
| 65 to 74 Years | 34 (80.9%) | 0 (0.0%) |
| 75 Years and over | 51 (55.4%) | 0 (0.0%) |
Disability Class: Self-Care Difficulty
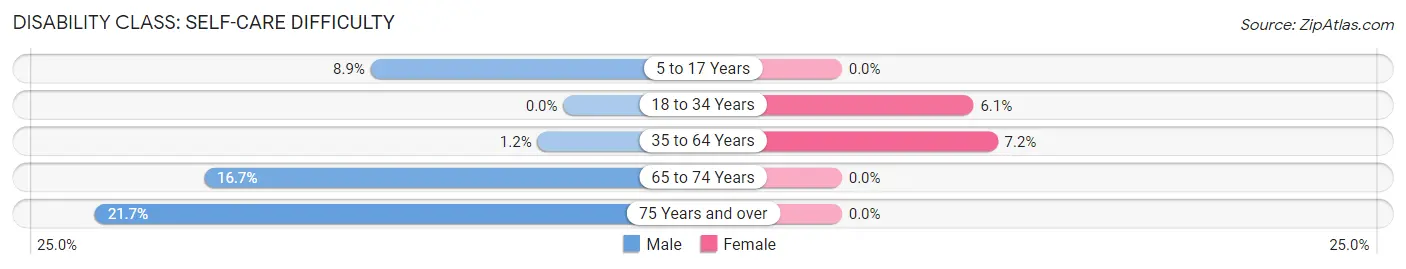
| Age Bracket | Male | Female |
| 5 to 17 Years | 11 (8.9%) | 0 (0.0%) |
| 18 to 34 Years | 0 (0.0%) | 8 (6.1%) |
| 35 to 64 Years | 2 (1.2%) | 12 (7.2%) |
| 65 to 74 Years | 7 (16.7%) | 0 (0.0%) |
| 75 Years and over | 20 (21.7%) | 0 (0.0%) |
Technology Access in Pine Prairie
Computing Device Access in Pine Prairie
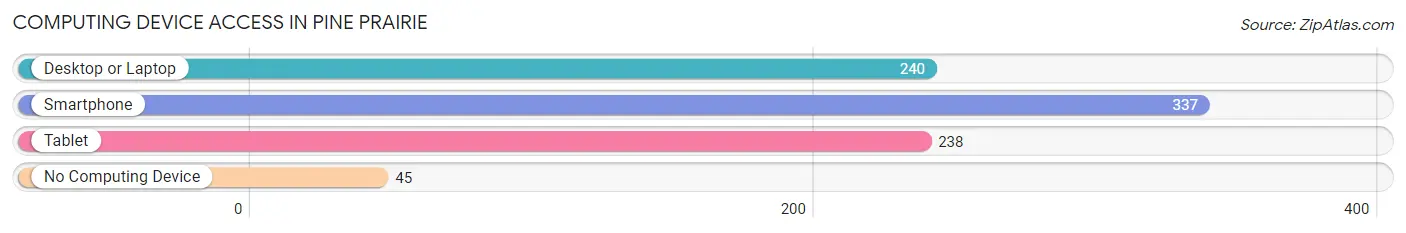
| Device Type | # Households | % Households |
| Desktop or Laptop | 240 | 60.6% |
| Smartphone | 337 | 85.1% |
| Tablet | 238 | 60.1% |
| No Computing Device | 45 | 11.4% |
| Total | 396 | 100.0% |
Internet Access in Pine Prairie
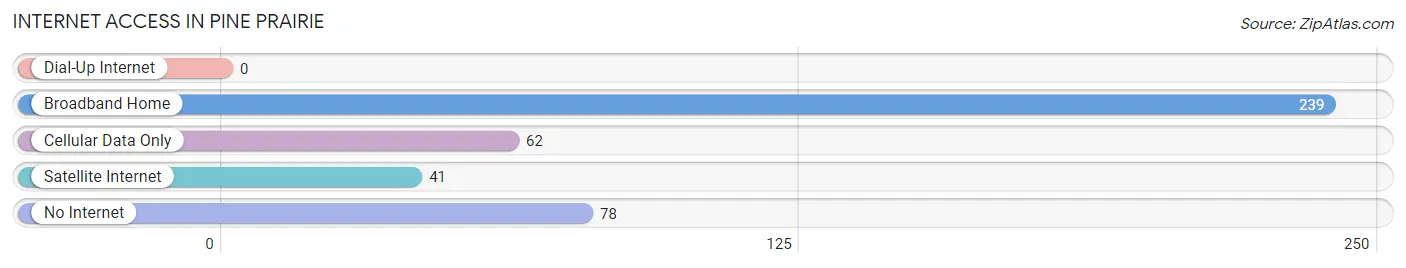
| Internet Type | # Households | % Households |
| Dial-Up Internet | 0 | 0.0% |
| Broadband Home | 239 | 60.4% |
| Cellular Data Only | 62 | 15.7% |
| Satellite Internet | 41 | 10.3% |
| No Internet | 78 | 19.7% |
| Total | 396 | 100.0% |
Pine Prairie Summary
Pine Prairie is a small town located in Evangeline Parish, Louisiana. It is situated in the heart of Cajun Country, and is home to a population of approximately 1,500 people. The town is known for its rich cultural heritage, and is home to a variety of businesses, including a number of restaurants, stores, and other services.
History
Pine Prairie was founded in 1883 by a group of French-speaking settlers from the nearby town of Mamou. The town was named after the nearby pine trees, which were abundant in the area. The settlers were attracted to the area due to its fertile soil and abundant natural resources.
The town quickly grew, and by the early 1900s, it had become a thriving community. The town was home to a variety of businesses, including a sawmill, a cotton gin, and a general store. The town also had a post office, a bank, and a school.
In the early 1900s, the town was also home to a number of churches, including the First Baptist Church, the First Methodist Church, and the First Presbyterian Church. The town also had a number of fraternal organizations, including the Knights of Pythias and the Independent Order of Odd Fellows.
Geography
Pine Prairie is located in the heart of Cajun Country, in the southwestern part of Evangeline Parish. The town is situated on the banks of the Bayou Teche, and is surrounded by a number of small towns and villages. The town is located approximately 30 miles from the city of Lafayette, and is approximately 90 miles from the state capital of Baton Rouge.
The town is situated in a flat, low-lying area, and is surrounded by a number of small lakes and ponds. The area is known for its lush vegetation, and is home to a variety of wildlife, including deer, wild turkeys, and a variety of birds.
Economy
Pine Prairie is home to a variety of businesses, including a number of restaurants, stores, and other services. The town is also home to a number of manufacturing and industrial businesses, including a sawmill, a cotton gin, and a number of other businesses.
The town is also home to a number of agricultural businesses, including a number of farms and ranches. The town is also home to a number of oil and gas companies, which are involved in the exploration and production of oil and gas in the area.
Demographics
As of the 2010 census, the population of Pine Prairie was 1,500. The town is predominantly white, with approximately 90% of the population being white. The town is also home to a small African American population, with approximately 5% of the population being African American. The town is also home to a small Hispanic population, with approximately 3% of the population being Hispanic.
The town is also home to a variety of religious denominations, including Catholic, Baptist, Methodist, and Presbyterian. The town is also home to a number of fraternal organizations, including the Knights of Pythias and the Independent Order of Odd Fellows.
Conclusion
Pine Prairie is a small town located in Evangeline Parish, Louisiana. The town is known for its rich cultural heritage, and is home to a variety of businesses, including a number of restaurants, stores, and other services. The town is predominantly white, with approximately 90% of the population being white. The town is also home to a small African American population, with approximately 5% of the population being African American. The town is also home to a small Hispanic population, with approximately 3% of the population being Hispanic. The town is also home to a variety of religious denominations, including Catholic, Baptist, Methodist, and Presbyterian. The town is also home to a number of fraternal organizations, including the Knights of Pythias and the Independent Order of Odd Fellows.
Common Questions
What is Per Capita Income in Pine Prairie?
Per Capita income in Pine Prairie is $15,745.
What is the Median Family Income in Pine Prairie?
Median Family Income in Pine Prairie is $41,250.
What is the Median Household income in Pine Prairie?
Median Household Income in Pine Prairie is $32,244.
What is Income or Wage Gap in Pine Prairie?
Income or Wage Gap in Pine Prairie is 36.3%.
Women in Pine Prairie earn 63.7 cents for every dollar earned by a man.
What is Inequality or Gini Index in Pine Prairie?
Inequality or Gini Index in Pine Prairie is 0.48.
What is the Total Population of Pine Prairie?
Total Population of Pine Prairie is 1,414.
What is the Total Male Population of Pine Prairie?
Total Male Population of Pine Prairie is 839.
What is the Total Female Population of Pine Prairie?
Total Female Population of Pine Prairie is 575.
What is the Ratio of Males per 100 Females in Pine Prairie?
There are 145.91 Males per 100 Females in Pine Prairie.
What is the Ratio of Females per 100 Males in Pine Prairie?
There are 68.53 Females per 100 Males in Pine Prairie.
What is the Median Population Age in Pine Prairie?
Median Population Age in Pine Prairie is 36.1 Years.
What is the Average Family Size in Pine Prairie
Average Family Size in Pine Prairie is 3.1 People.
What is the Average Household Size in Pine Prairie
Average Household Size in Pine Prairie is 2.5 People.
How Large is the Labor Force in Pine Prairie?
There are 369 People in the Labor Forcein in Pine Prairie.
What is the Percentage of People in the Labor Force in Pine Prairie?
31.9% of People are in the Labor Force in Pine Prairie.
What is the Unemployment Rate in Pine Prairie?
Unemployment Rate in Pine Prairie is 14.9%.