Ketchikan, AK Map & Demographics
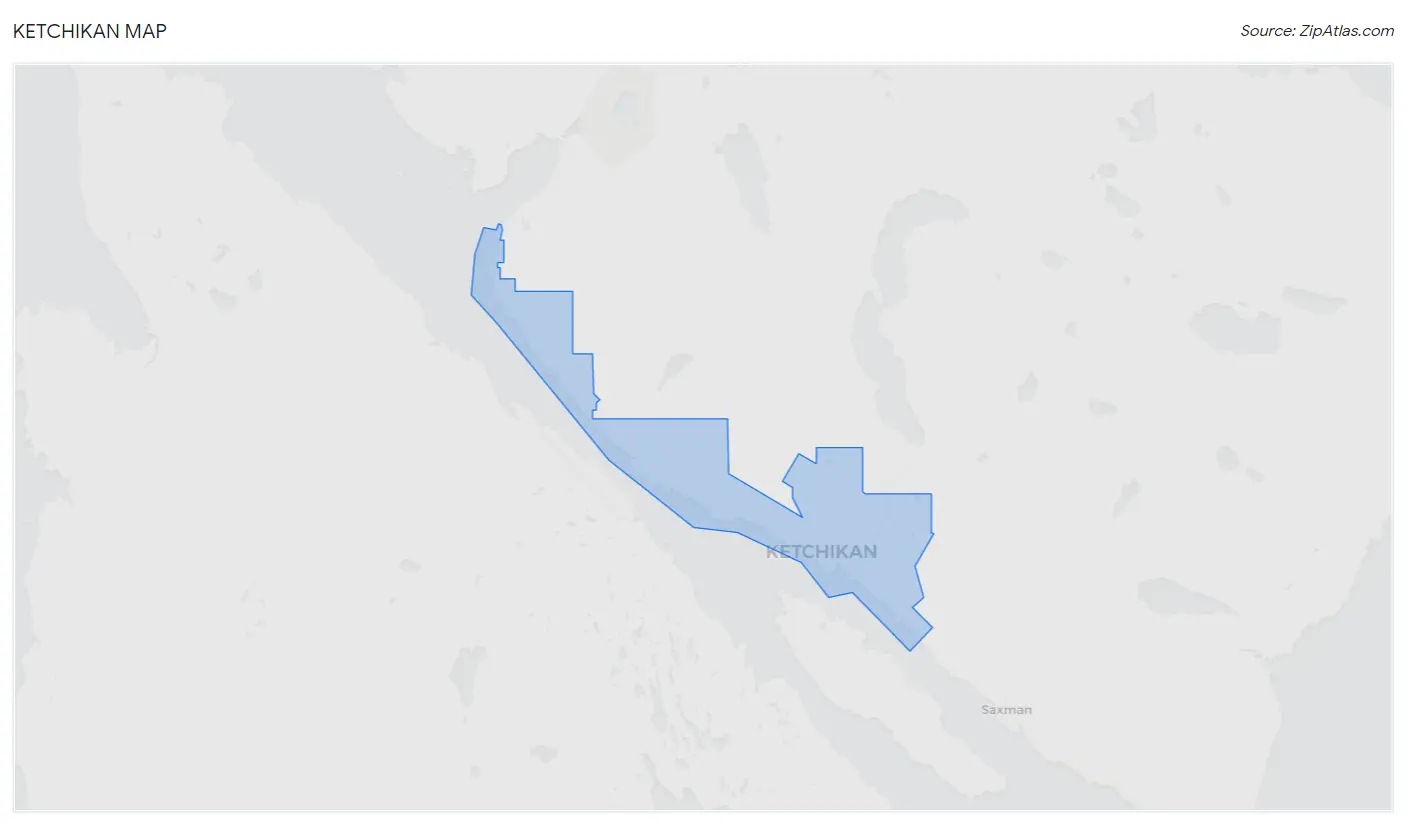
Ketchikan Map
Ketchikan Overview
$41,057
PER CAPITA INCOME
$95,000
AVG FAMILY INCOME
$73,512
AVG HOUSEHOLD INCOME
25.5%
WAGE / INCOME GAP [ % ]
74.5¢/ $1
WAGE / INCOME GAP [ $ ]
$11,732
FAMILY INCOME DEFICIT
0.48
INEQUALITY / GINI INDEX
8,168
TOTAL POPULATION
4,208
MALE POPULATION
3,960
FEMALE POPULATION
106.26
MALES / 100 FEMALES
94.11
FEMALES / 100 MALES
37.0
MEDIAN AGE
3.0
AVG FAMILY SIZE
2.4
AVG HOUSEHOLD SIZE
4,450
LABOR FORCE [ PEOPLE ]
67.2%
PERCENT IN LABOR FORCE
5.1%
UNEMPLOYMENT RATE
Ketchikan Zip Codes
Ketchikan Area Codes
Income in Ketchikan
Income Overview in Ketchikan
Per Capita Income in Ketchikan is $41,057, while median incomes of families and households are $95,000 and $73,512 respectively.
| Characteristic | Number | Measure |
| Per Capita Income | 8,168 | $41,057 |
| Median Family Income | 1,920 | $95,000 |
| Mean Family Income | 1,920 | $118,234 |
| Median Household Income | 3,285 | $73,512 |
| Mean Household Income | 3,285 | $100,072 |
| Income Deficit | 1,920 | $11,732 |
| Wage / Income Gap (%) | 8,168 | 25.48% |
| Wage / Income Gap ($) | 8,168 | 74.52¢ per $1 |
| Gini / Inequality Index | 8,168 | 0.48 |
Earnings by Sex in Ketchikan
Average Earnings in Ketchikan are $41,100, $46,563 for men and $34,697 for women, a difference of 25.5%.
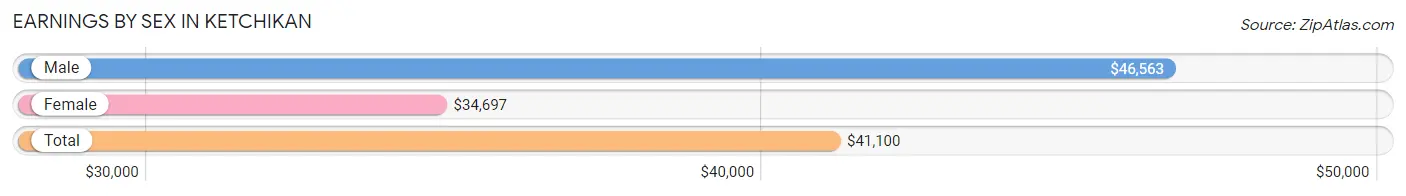
| Sex | Number | Average Earnings |
| Male | 2,588 (52.7%) | $46,563 |
| Female | 2,323 (47.3%) | $34,697 |
| Total | 4,911 (100.0%) | $41,100 |
Earnings by Sex by Income Bracket in Ketchikan
The most common earnings brackets in Ketchikan are $100,000+ for men (345 | 13.3%) and $100,000+ for women (225 | 9.7%).
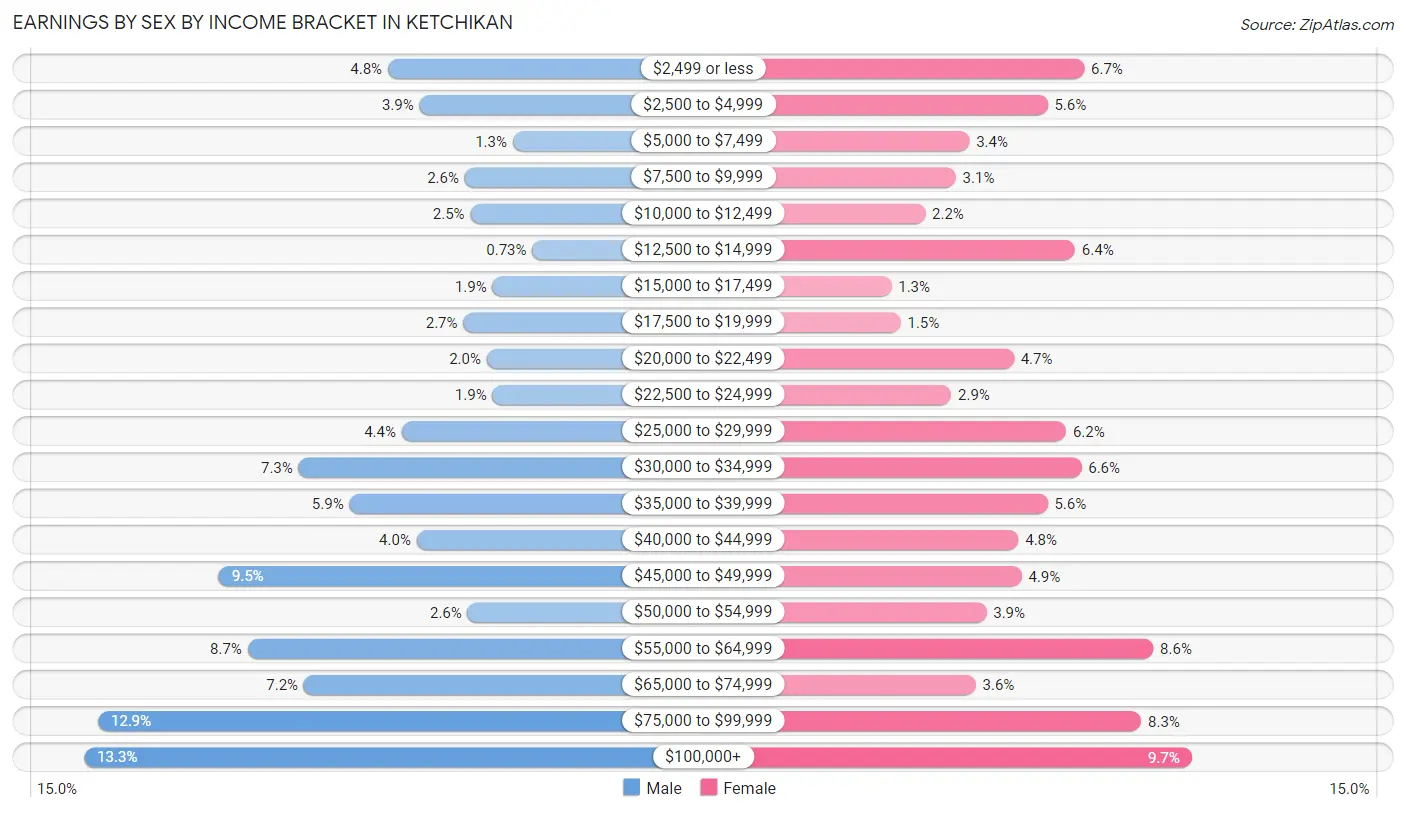
| Income | Male | Female |
| $2,499 or less | 124 (4.8%) | 155 (6.7%) |
| $2,500 to $4,999 | 101 (3.9%) | 131 (5.6%) |
| $5,000 to $7,499 | 33 (1.3%) | 80 (3.4%) |
| $7,500 to $9,999 | 68 (2.6%) | 71 (3.1%) |
| $10,000 to $12,499 | 64 (2.5%) | 51 (2.2%) |
| $12,500 to $14,999 | 19 (0.7%) | 149 (6.4%) |
| $15,000 to $17,499 | 48 (1.8%) | 29 (1.3%) |
| $17,500 to $19,999 | 69 (2.7%) | 35 (1.5%) |
| $20,000 to $22,499 | 52 (2.0%) | 109 (4.7%) |
| $22,500 to $24,999 | 48 (1.8%) | 68 (2.9%) |
| $25,000 to $29,999 | 114 (4.4%) | 143 (6.2%) |
| $30,000 to $34,999 | 189 (7.3%) | 153 (6.6%) |
| $35,000 to $39,999 | 152 (5.9%) | 131 (5.6%) |
| $40,000 to $44,999 | 103 (4.0%) | 112 (4.8%) |
| $45,000 to $49,999 | 247 (9.5%) | 114 (4.9%) |
| $50,000 to $54,999 | 66 (2.5%) | 91 (3.9%) |
| $55,000 to $64,999 | 226 (8.7%) | 200 (8.6%) |
| $65,000 to $74,999 | 185 (7.1%) | 84 (3.6%) |
| $75,000 to $99,999 | 335 (12.9%) | 192 (8.3%) |
| $100,000+ | 345 (13.3%) | 225 (9.7%) |
| Total | 2,588 (100.0%) | 2,323 (100.0%) |
Earnings by Sex by Educational Attainment in Ketchikan
Average earnings in Ketchikan are $49,982 for men and $40,788 for women, a difference of 18.4%. Men with an educational attainment of graduate degree enjoy the highest average annual earnings of $81,944, while those with high school diploma education earn the least with $45,160. Women with an educational attainment of graduate degree earn the most with the average annual earnings of $74,028, while those with high school diploma education have the smallest earnings of $31,563.
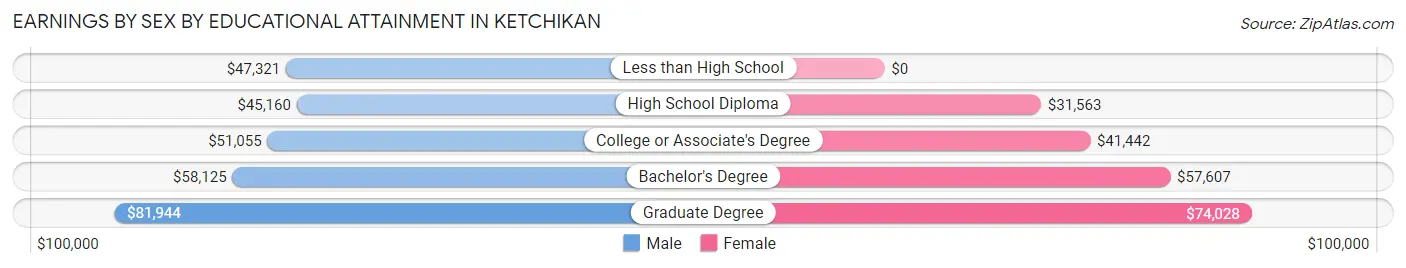
| Educational Attainment | Male Income | Female Income |
| Less than High School | $47,321 | $0 |
| High School Diploma | $45,160 | $31,563 |
| College or Associate's Degree | $51,055 | $41,442 |
| Bachelor's Degree | $58,125 | $57,607 |
| Graduate Degree | $81,944 | $74,028 |
| Total | $49,982 | $40,788 |
Family Income in Ketchikan
Family Income Brackets in Ketchikan
According to the Ketchikan family income data, there are 394 families falling into the $100,000 to $149,999 income range, which is the most common income bracket and makes up 20.5% of all families. Conversely, the $10,000 to $14,999 income bracket is the least frequent group with only 19 families (1.0%) belonging to this category.
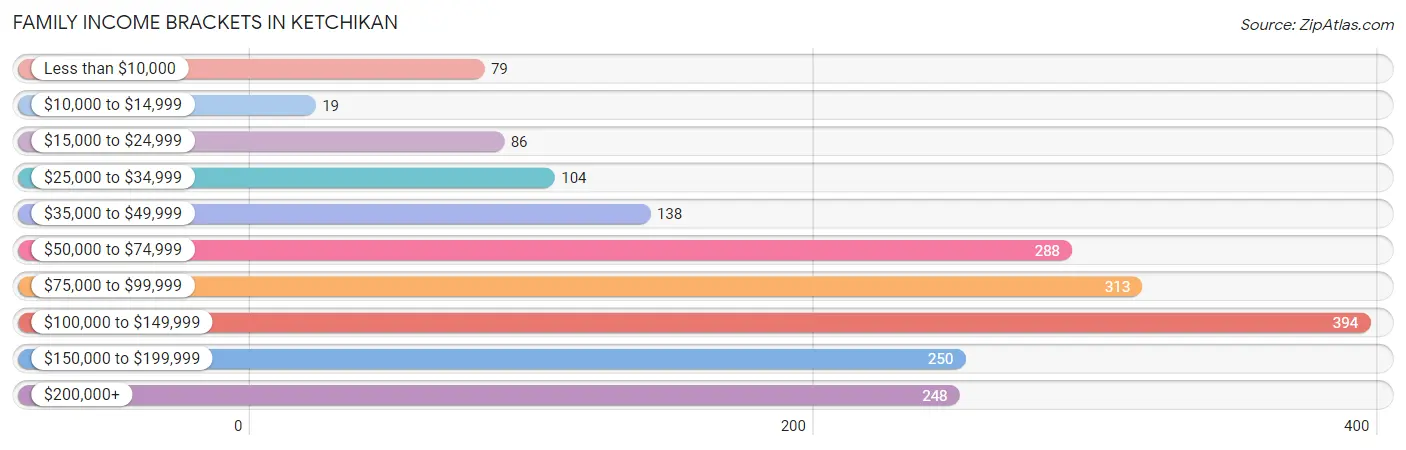
| Income Bracket | # Families | % Families |
| Less than $10,000 | 79 | 4.1% |
| $10,000 to $14,999 | 19 | 1.0% |
| $15,000 to $24,999 | 86 | 4.5% |
| $25,000 to $34,999 | 104 | 5.4% |
| $35,000 to $49,999 | 138 | 7.2% |
| $50,000 to $74,999 | 288 | 15.0% |
| $75,000 to $99,999 | 313 | 16.3% |
| $100,000 to $149,999 | 394 | 20.5% |
| $150,000 to $199,999 | 250 | 13.0% |
| $200,000+ | 248 | 12.9% |
Family Income by Famaliy Size in Ketchikan
7+ person families (25 | 1.3%) account for the highest median family income in Ketchikan with $187,679 per family, while 2-person families (1,029 | 53.6%) have the highest median income of $43,542 per family member.
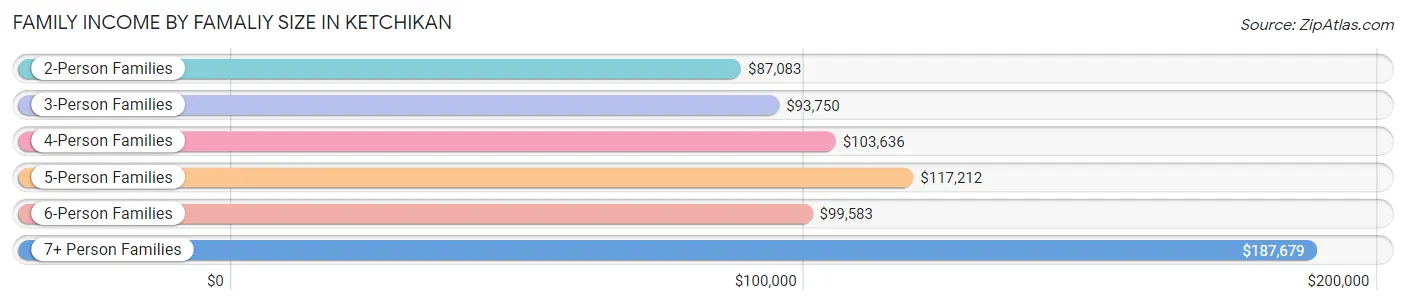
| Income Bracket | # Families | Median Income |
| 2-Person Families | 1,029 (53.6%) | $87,083 |
| 3-Person Families | 415 (21.6%) | $93,750 |
| 4-Person Families | 282 (14.7%) | $103,636 |
| 5-Person Families | 113 (5.9%) | $117,212 |
| 6-Person Families | 56 (2.9%) | $99,583 |
| 7+ Person Families | 25 (1.3%) | $187,679 |
| Total | 1,920 (100.0%) | $95,000 |
Family Income by Number of Earners in Ketchikan
The median family income in Ketchikan is $95,000, with families comprising 3+ earners (240) having the highest median family income of $168,194, while families with 1 earner (606) have the lowest median family income of $55,300, accounting for 12.5% and 31.6% of families, respectively.
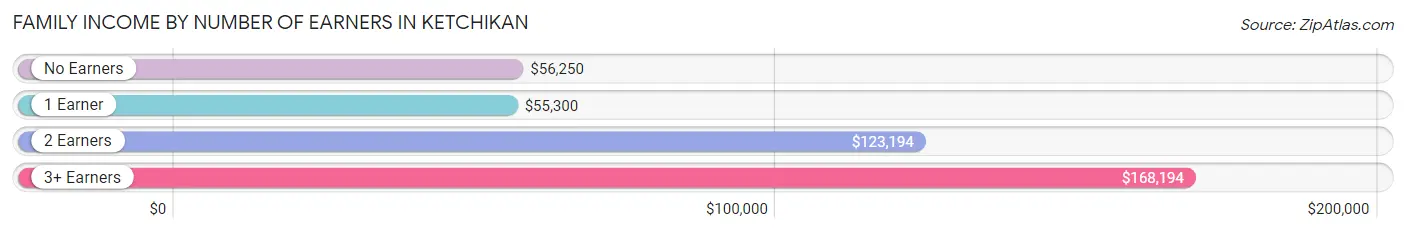
| Number of Earners | # Families | Median Income |
| No Earners | 183 (9.5%) | $56,250 |
| 1 Earner | 606 (31.6%) | $55,300 |
| 2 Earners | 891 (46.4%) | $123,194 |
| 3+ Earners | 240 (12.5%) | $168,194 |
| Total | 1,920 (100.0%) | $95,000 |
Household Income in Ketchikan
Household Income Brackets in Ketchikan
With 503 households falling in the category, the $75,000 to $99,999 income range is the most frequent in Ketchikan, accounting for 15.3% of all households. In contrast, only 89 households (2.7%) fall into the $10,000 to $14,999 income bracket, making it the least populous group.
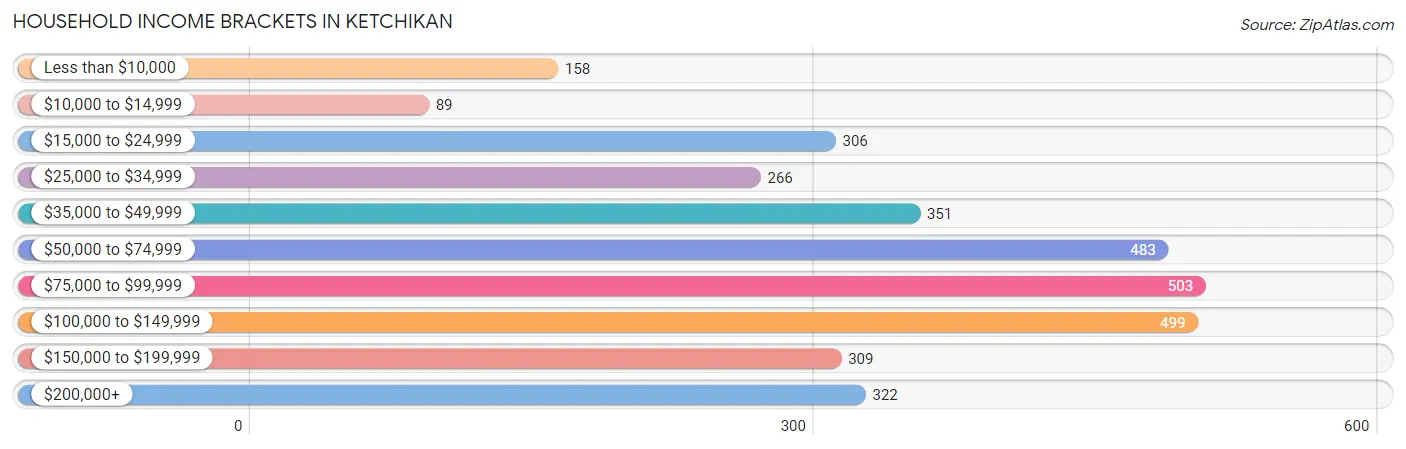
| Income Bracket | # Households | % Households |
| Less than $10,000 | 158 | 4.8% |
| $10,000 to $14,999 | 89 | 2.7% |
| $15,000 to $24,999 | 306 | 9.3% |
| $25,000 to $34,999 | 266 | 8.1% |
| $35,000 to $49,999 | 351 | 10.7% |
| $50,000 to $74,999 | 483 | 14.7% |
| $75,000 to $99,999 | 503 | 15.3% |
| $100,000 to $149,999 | 499 | 15.2% |
| $150,000 to $199,999 | 309 | 9.4% |
| $200,000+ | 322 | 9.8% |
Household Income by Householder Age in Ketchikan
The median household income in Ketchikan is $73,512, with the highest median household income of $91,667 found in the 45 to 64 years age bracket for the primary householder. A total of 1,140 households (34.7%) fall into this category. Meanwhile, the 65+ years age bracket for the primary householder has the lowest median household income of $51,750, with 875 households (26.6%) in this group.
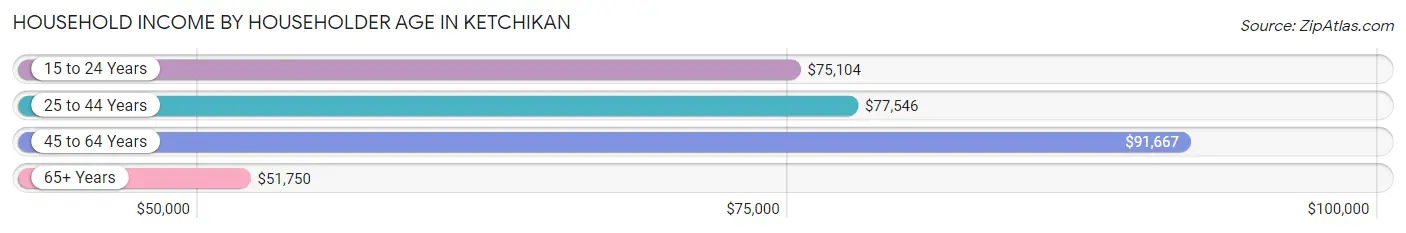
| Income Bracket | # Households | Median Income |
| 15 to 24 Years | 143 (4.3%) | $75,104 |
| 25 to 44 Years | 1,127 (34.3%) | $77,546 |
| 45 to 64 Years | 1,140 (34.7%) | $91,667 |
| 65+ Years | 875 (26.6%) | $51,750 |
| Total | 3,285 (100.0%) | $73,512 |
Poverty in Ketchikan
Income Below Poverty by Sex and Age in Ketchikan
With 11.6% poverty level for males and 14.3% for females among the residents of Ketchikan, 15 year old males and 18 to 24 year old females are the most vulnerable to poverty, with 12 males (32.4%) and 97 females (28.9%) in their respective age groups living below the poverty level.
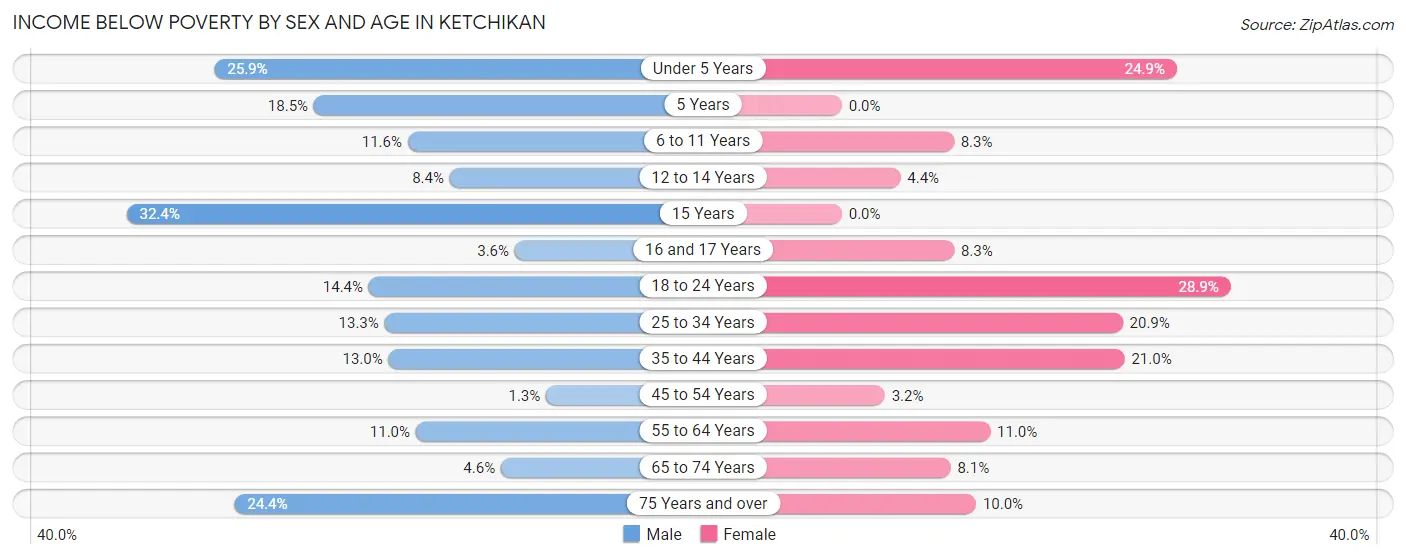
| Age Bracket | Male | Female |
| Under 5 Years | 57 (25.9%) | 48 (24.9%) |
| 5 Years | 5 (18.5%) | 0 (0.0%) |
| 6 to 11 Years | 50 (11.6%) | 25 (8.3%) |
| 12 to 14 Years | 7 (8.4%) | 7 (4.3%) |
| 15 Years | 12 (32.4%) | 0 (0.0%) |
| 16 and 17 Years | 4 (3.6%) | 7 (8.3%) |
| 18 to 24 Years | 52 (14.4%) | 97 (28.9%) |
| 25 to 34 Years | 97 (13.3%) | 128 (20.8%) |
| 35 to 44 Years | 68 (13.0%) | 115 (21.0%) |
| 45 to 54 Years | 5 (1.3%) | 13 (3.2%) |
| 55 to 64 Years | 67 (11.0%) | 63 (11.0%) |
| 65 to 74 Years | 20 (4.6%) | 31 (8.1%) |
| 75 Years and over | 32 (24.4%) | 26 (10.0%) |
| Total | 476 (11.6%) | 560 (14.3%) |
Income Above Poverty by Sex and Age in Ketchikan
According to the poverty statistics in Ketchikan, males aged 45 to 54 years and females aged 5 years are the age groups that are most secure financially, with 98.7% of males and 100.0% of females in these age groups living above the poverty line.
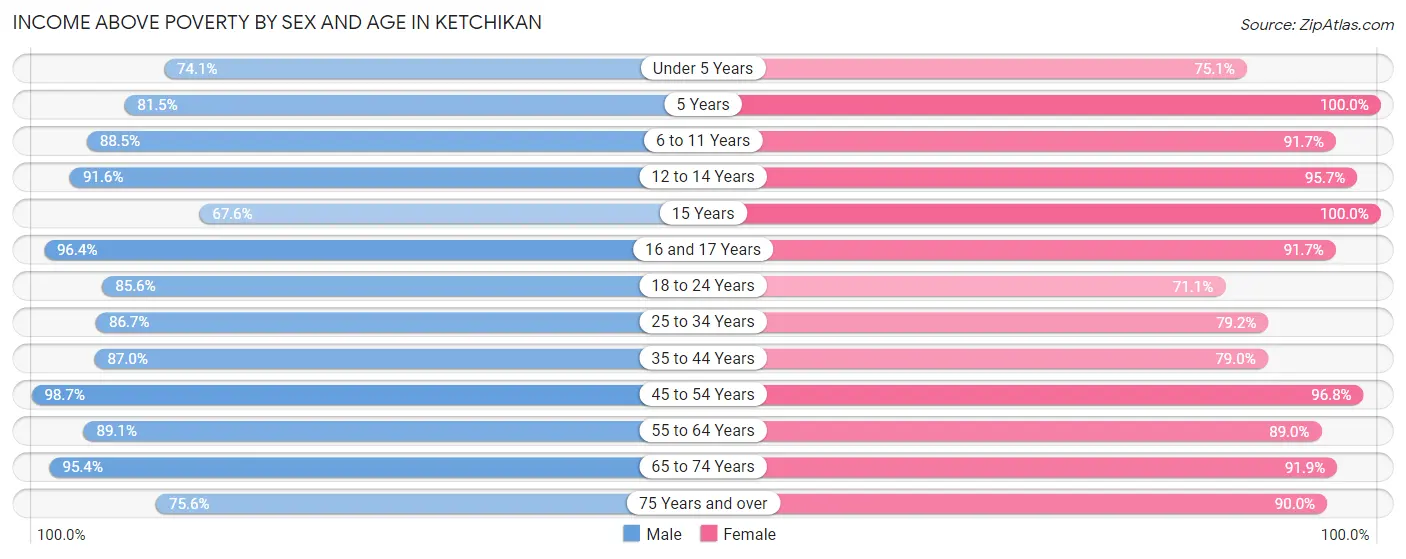
| Age Bracket | Male | Female |
| Under 5 Years | 163 (74.1%) | 145 (75.1%) |
| 5 Years | 22 (81.5%) | 28 (100.0%) |
| 6 to 11 Years | 383 (88.4%) | 276 (91.7%) |
| 12 to 14 Years | 76 (91.6%) | 154 (95.7%) |
| 15 Years | 25 (67.6%) | 24 (100.0%) |
| 16 and 17 Years | 107 (96.4%) | 77 (91.7%) |
| 18 to 24 Years | 308 (85.6%) | 239 (71.1%) |
| 25 to 34 Years | 634 (86.7%) | 486 (79.1%) |
| 35 to 44 Years | 456 (87.0%) | 433 (79.0%) |
| 45 to 54 Years | 386 (98.7%) | 394 (96.8%) |
| 55 to 64 Years | 545 (89.0%) | 509 (89.0%) |
| 65 to 74 Years | 412 (95.4%) | 353 (91.9%) |
| 75 Years and over | 99 (75.6%) | 235 (90.0%) |
| Total | 3,616 (88.4%) | 3,353 (85.7%) |
Income Below Poverty Among Married-Couple Families in Ketchikan
The poverty statistics for married-couple families in Ketchikan show that 3.1% or 40 of the total 1,290 families live below the poverty line. Families with 3 or 4 children have the highest poverty rate of 8.8%, comprising of 5 families. On the other hand, families with 5 or more children have the lowest poverty rate of 0.0%, which includes 0 families.
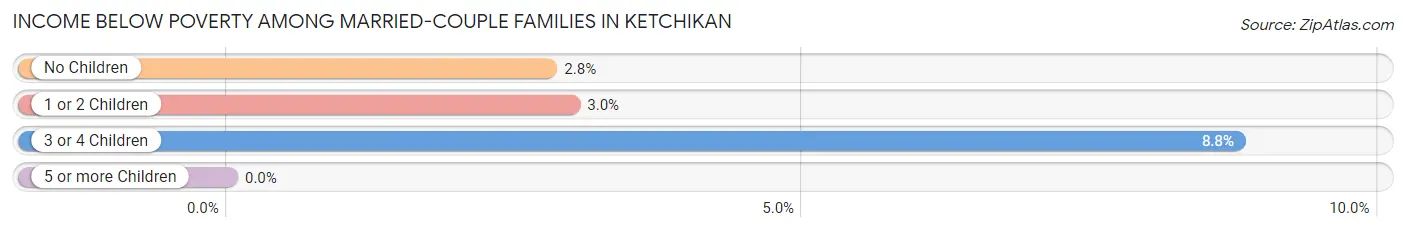
| Children | Above Poverty | Below Poverty |
| No Children | 768 (97.2%) | 22 (2.8%) |
| 1 or 2 Children | 423 (97.0%) | 13 (3.0%) |
| 3 or 4 Children | 52 (91.2%) | 5 (8.8%) |
| 5 or more Children | 7 (100.0%) | 0 (0.0%) |
| Total | 1,250 (96.9%) | 40 (3.1%) |
Income Below Poverty Among Single-Parent Households in Ketchikan
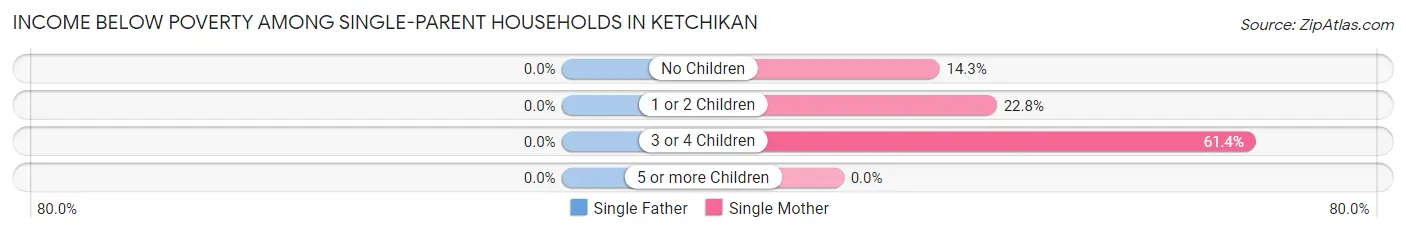
| Children | Single Father | Single Mother |
| No Children | 0 (0.0%) | 21 (14.3%) |
| 1 or 2 Children | 0 (0.0%) | 52 (22.8%) |
| 3 or 4 Children | 0 (0.0%) | 35 (61.4%) |
| 5 or more Children | 0 (0.0%) | 0 (0.0%) |
| Total | 0 (0.0%) | 108 (25.0%) |
Income Below Poverty Among Married-Couple vs Single-Parent Households in Ketchikan
The poverty data for Ketchikan shows that 40 of the married-couple family households (3.1%) and 108 of the single-parent households (17.1%) are living below the poverty level. Within the married-couple family households, those with 3 or 4 children have the highest poverty rate, with 5 households (8.8%) falling below the poverty line. Among the single-parent households, those with 3 or 4 children have the highest poverty rate, with 35 household (39.8%) living below poverty.
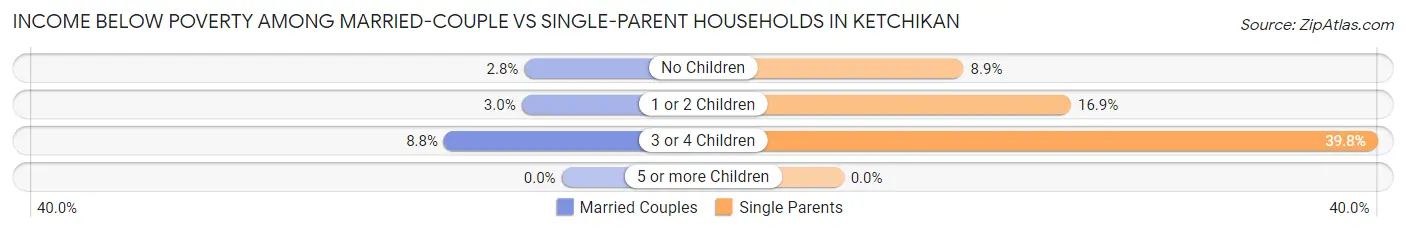
| Children | Married-Couple Families | Single-Parent Households |
| No Children | 22 (2.8%) | 21 (8.9%) |
| 1 or 2 Children | 13 (3.0%) | 52 (16.9%) |
| 3 or 4 Children | 5 (8.8%) | 35 (39.8%) |
| 5 or more Children | 0 (0.0%) | 0 (0.0%) |
| Total | 40 (3.1%) | 108 (17.1%) |
Race in Ketchikan
The most populous races in Ketchikan are White / Caucasian (4,474 | 54.8%), Native / Alaskan (1,424 | 17.4%), and Asian (1,114 | 13.6%).
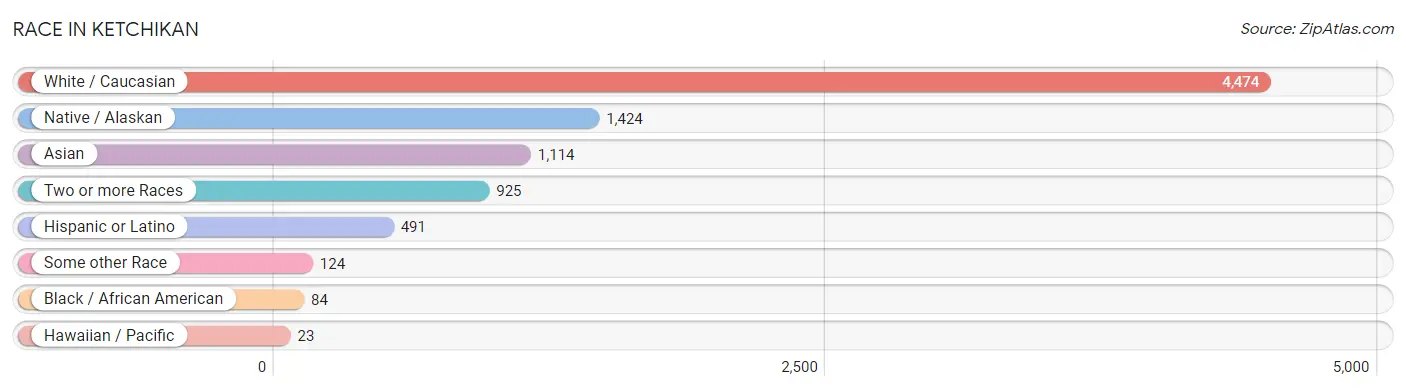
| Race | # Population | % Population |
| Asian | 1,114 | 13.6% |
| Black / African American | 84 | 1.0% |
| Hawaiian / Pacific | 23 | 0.3% |
| Hispanic or Latino | 491 | 6.0% |
| Native / Alaskan | 1,424 | 17.4% |
| White / Caucasian | 4,474 | 54.8% |
| Two or more Races | 925 | 11.3% |
| Some other Race | 124 | 1.5% |
| Total | 8,168 | 100.0% |
Ancestry in Ketchikan
The most populous ancestries reported in Ketchikan are Korean (1,146 | 14.0%), Tlingit-Haida (1,035 | 12.7%), German (943 | 11.6%), English (657 | 8.0%), and Irish (643 | 7.9%), together accounting for 54.2% of all Ketchikan residents.
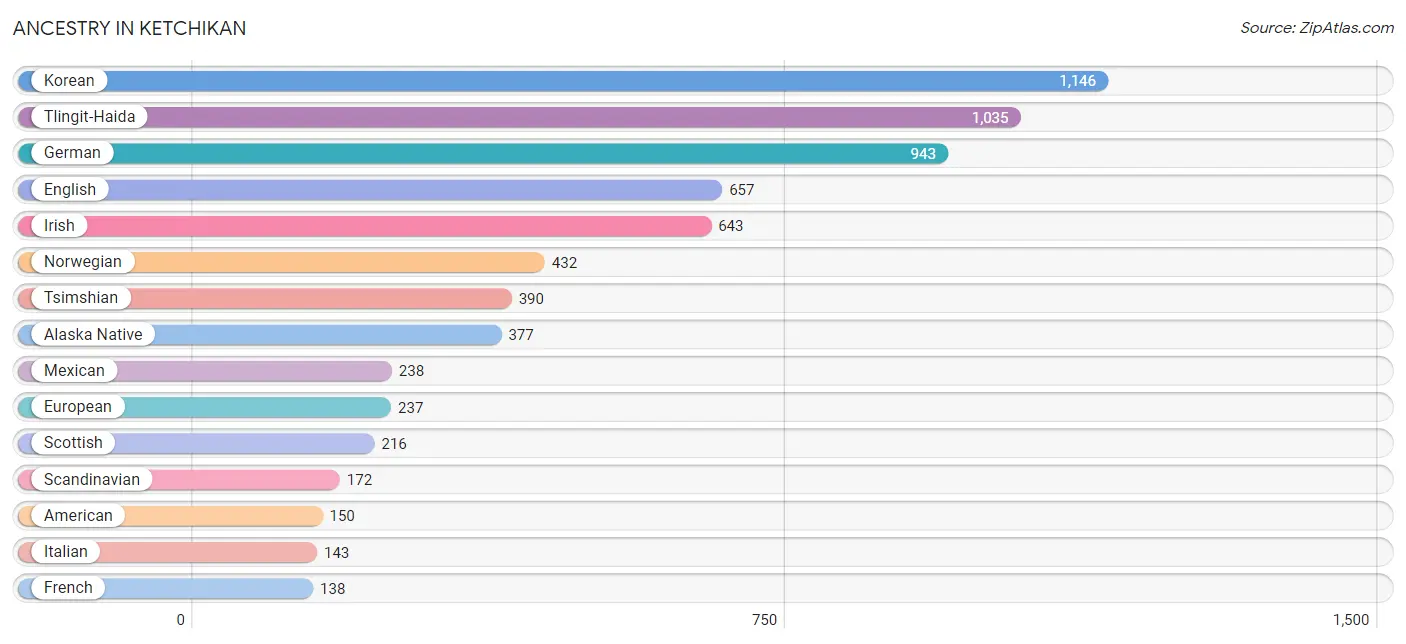
| Ancestry | # Population | % Population |
| African | 36 | 0.4% |
| Alaska Native | 377 | 4.6% |
| Alaskan Athabascan | 32 | 0.4% |
| Albanian | 30 | 0.4% |
| Aleut | 94 | 1.1% |
| American | 150 | 1.8% |
| Apache | 5 | 0.1% |
| Arab | 3 | 0.0% |
| Australian | 11 | 0.1% |
| Austrian | 7 | 0.1% |
| Belgian | 8 | 0.1% |
| Bhutanese | 4 | 0.1% |
| British | 64 | 0.8% |
| Burmese | 12 | 0.2% |
| Canadian | 45 | 0.5% |
| Central American | 40 | 0.5% |
| Cherokee | 51 | 0.6% |
| Cheyenne | 6 | 0.1% |
| Chippewa | 26 | 0.3% |
| Colombian | 1 | 0.0% |
| Cuban | 45 | 0.5% |
| Czech | 13 | 0.2% |
| Czechoslovakian | 4 | 0.1% |
| Danish | 22 | 0.3% |
| Dutch | 59 | 0.7% |
| Eastern European | 8 | 0.1% |
| English | 657 | 8.0% |
| European | 237 | 2.9% |
| Finnish | 78 | 0.9% |
| French | 138 | 1.7% |
| French American Indian | 15 | 0.2% |
| French Canadian | 13 | 0.2% |
| German | 943 | 11.6% |
| Greek | 14 | 0.2% |
| Guatemalan | 21 | 0.3% |
| Hungarian | 31 | 0.4% |
| Indian (Asian) | 7 | 0.1% |
| Inupiat | 37 | 0.4% |
| Irish | 643 | 7.9% |
| Italian | 143 | 1.8% |
| Korean | 1,146 | 14.0% |
| Lebanese | 3 | 0.0% |
| Lithuanian | 2 | 0.0% |
| Mexican | 238 | 2.9% |
| Native Hawaiian | 11 | 0.1% |
| Navajo | 6 | 0.1% |
| Nigerian | 9 | 0.1% |
| Northern European | 3 | 0.0% |
| Norwegian | 432 | 5.3% |
| Paiute | 10 | 0.1% |
| Pennsylvania German | 7 | 0.1% |
| Peruvian | 85 | 1.0% |
| Polish | 54 | 0.7% |
| Portuguese | 8 | 0.1% |
| Puerto Rican | 48 | 0.6% |
| Russian | 29 | 0.4% |
| Salvadoran | 19 | 0.2% |
| Samoan | 28 | 0.3% |
| Scandinavian | 172 | 2.1% |
| Scotch-Irish | 94 | 1.1% |
| Scottish | 216 | 2.6% |
| Seminole | 1 | 0.0% |
| Sioux | 20 | 0.2% |
| Slovene | 6 | 0.1% |
| South American | 86 | 1.1% |
| Spanish | 11 | 0.1% |
| Sri Lankan | 3 | 0.0% |
| Subsaharan African | 45 | 0.5% |
| Swedish | 132 | 1.6% |
| Swiss | 6 | 0.1% |
| Thai | 54 | 0.7% |
| Tlingit-Haida | 1,035 | 12.7% |
| Tsimshian | 390 | 4.8% |
| Ukrainian | 7 | 0.1% |
| Welsh | 87 | 1.1% |
| West Indian | 22 | 0.3% |
| Yup'ik | 14 | 0.2% | View All 77 Rows |
Immigrants in Ketchikan
The most numerous immigrant groups reported in Ketchikan came from Asia (908 | 11.1%), South Eastern Asia (867 | 10.6%), Philippines (853 | 10.4%), Latin America (96 | 1.2%), and Central America (64 | 0.8%), together accounting for 34.1% of all Ketchikan residents.
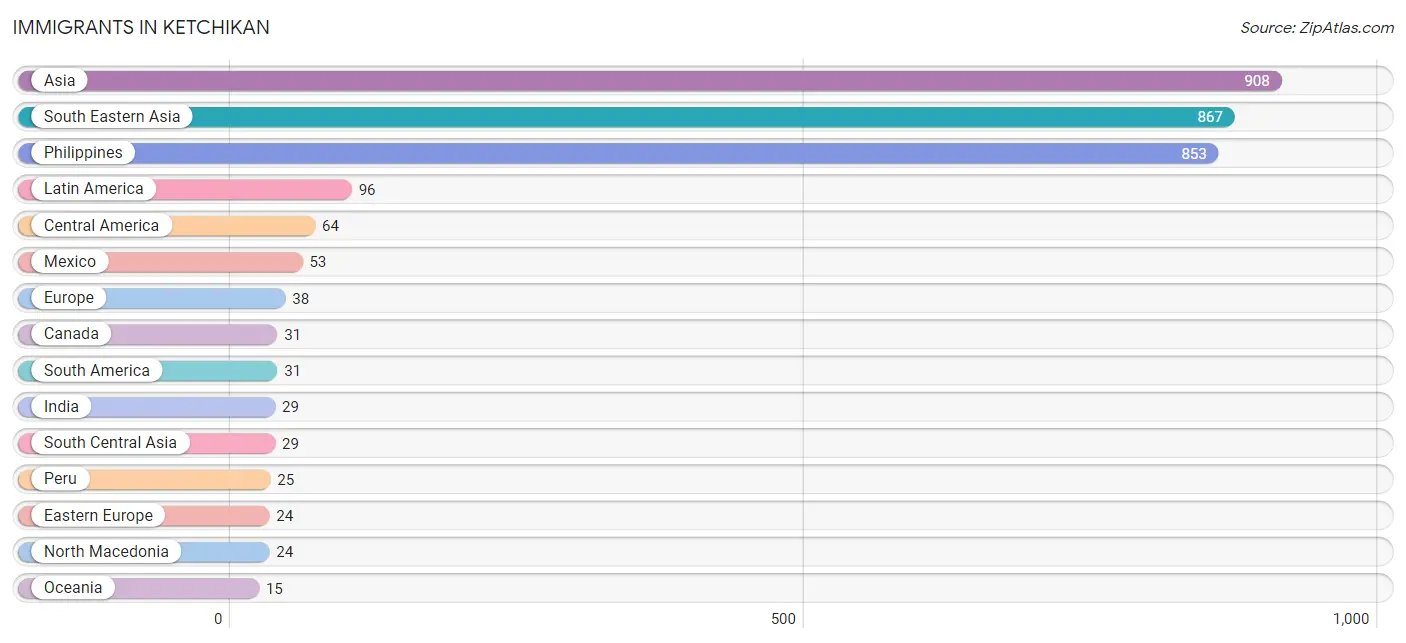
| Immigration Origin | # Population | % Population |
| Africa | 12 | 0.2% |
| Asia | 908 | 11.1% |
| Canada | 31 | 0.4% |
| Caribbean | 1 | 0.0% |
| Central America | 64 | 0.8% |
| Colombia | 1 | 0.0% |
| Eastern Africa | 2 | 0.0% |
| Eastern Asia | 12 | 0.2% |
| Eastern Europe | 24 | 0.3% |
| Europe | 38 | 0.5% |
| Germany | 5 | 0.1% |
| Guatemala | 11 | 0.1% |
| India | 29 | 0.4% |
| Jamaica | 1 | 0.0% |
| Japan | 6 | 0.1% |
| Korea | 6 | 0.1% |
| Latin America | 96 | 1.2% |
| Mexico | 53 | 0.6% |
| Netherlands | 3 | 0.0% |
| Nigeria | 10 | 0.1% |
| North Macedonia | 24 | 0.3% |
| Northern Europe | 6 | 0.1% |
| Oceania | 15 | 0.2% |
| Peru | 25 | 0.3% |
| Philippines | 853 | 10.4% |
| South America | 31 | 0.4% |
| South Central Asia | 29 | 0.4% |
| South Eastern Asia | 867 | 10.6% |
| Thailand | 13 | 0.2% |
| Vietnam | 1 | 0.0% |
| Western Africa | 10 | 0.1% |
| Western Europe | 8 | 0.1% |
| Zimbabwe | 2 | 0.0% | View All 33 Rows |
Sex and Age in Ketchikan
Sex and Age in Ketchikan
The most populous age groups in Ketchikan are 25 to 29 Years (415 | 9.9%) for men and 30 to 34 Years (315 | 8.0%) for women.
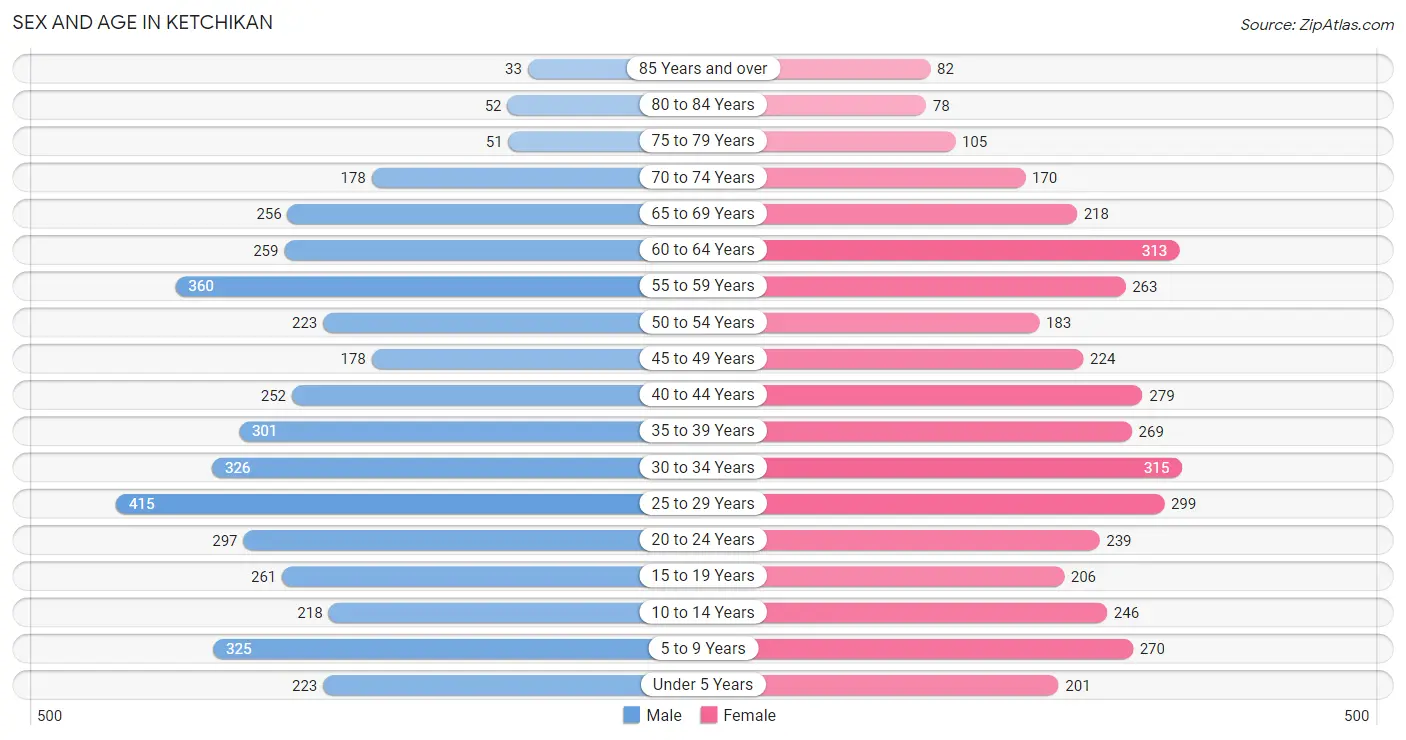
| Age Bracket | Male | Female |
| Under 5 Years | 223 (5.3%) | 201 (5.1%) |
| 5 to 9 Years | 325 (7.7%) | 270 (6.8%) |
| 10 to 14 Years | 218 (5.2%) | 246 (6.2%) |
| 15 to 19 Years | 261 (6.2%) | 206 (5.2%) |
| 20 to 24 Years | 297 (7.1%) | 239 (6.0%) |
| 25 to 29 Years | 415 (9.9%) | 299 (7.5%) |
| 30 to 34 Years | 326 (7.7%) | 315 (8.0%) |
| 35 to 39 Years | 301 (7.1%) | 269 (6.8%) |
| 40 to 44 Years | 252 (6.0%) | 279 (7.0%) |
| 45 to 49 Years | 178 (4.2%) | 224 (5.7%) |
| 50 to 54 Years | 223 (5.3%) | 183 (4.6%) |
| 55 to 59 Years | 360 (8.6%) | 263 (6.6%) |
| 60 to 64 Years | 259 (6.1%) | 313 (7.9%) |
| 65 to 69 Years | 256 (6.1%) | 218 (5.5%) |
| 70 to 74 Years | 178 (4.2%) | 170 (4.3%) |
| 75 to 79 Years | 51 (1.2%) | 105 (2.6%) |
| 80 to 84 Years | 52 (1.2%) | 78 (2.0%) |
| 85 Years and over | 33 (0.8%) | 82 (2.1%) |
| Total | 4,208 (100.0%) | 3,960 (100.0%) |
Families and Households in Ketchikan
Median Family Size in Ketchikan
The median family size in Ketchikan is 3.05 persons per family, with single female/mother families (432 | 22.5%) accounting for the largest median family size of 3.19 persons per family. On the other hand, single male/father families (198 | 10.3%) represent the smallest median family size with 2.86 persons per family.
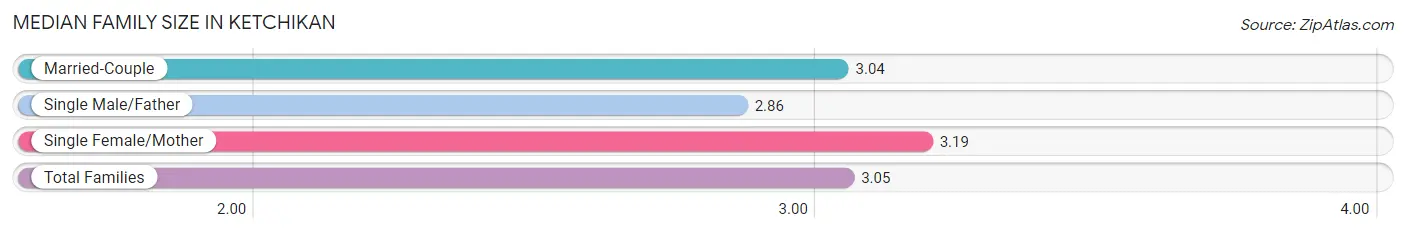
| Family Type | # Families | Family Size |
| Married-Couple | 1,290 (67.2%) | 3.04 |
| Single Male/Father | 198 (10.3%) | 2.86 |
| Single Female/Mother | 432 (22.5%) | 3.19 |
| Total Families | 1,920 (100.0%) | 3.05 |
Median Household Size in Ketchikan
The median household size in Ketchikan is 2.41 persons per household, with single female/mother households (432 | 13.2%) accounting for the largest median household size of 3.76 persons per household. non-family households (1,365 | 41.5%) represent the smallest median household size with 1.23 persons per household.
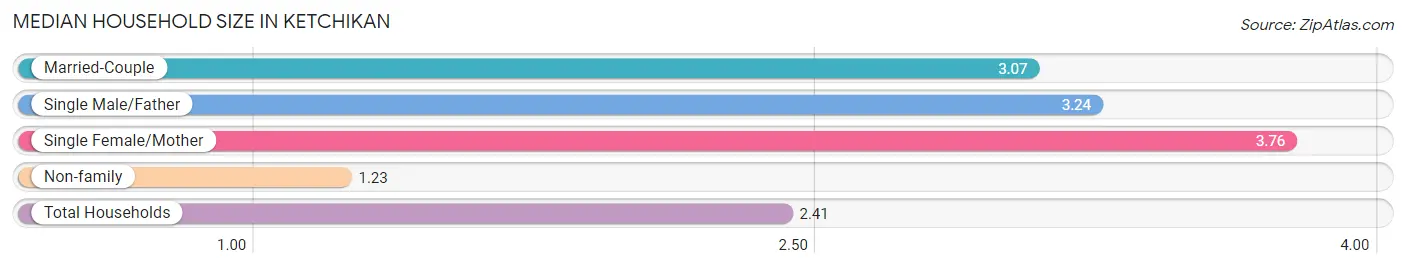
| Household Type | # Households | Household Size |
| Married-Couple | 1,290 (39.3%) | 3.07 |
| Single Male/Father | 198 (6.0%) | 3.24 |
| Single Female/Mother | 432 (13.2%) | 3.76 |
| Non-family | 1,365 (41.5%) | 1.23 |
| Total Households | 3,285 (100.0%) | 2.41 |
Household Size by Marriage Status in Ketchikan
Out of a total of 3,285 households in Ketchikan, 1,920 (58.5%) are family households, while 1,365 (41.5%) are nonfamily households. The most numerous type of family households are 2-person households, comprising 894, and the most common type of nonfamily households are 1-person households, comprising 1,112.
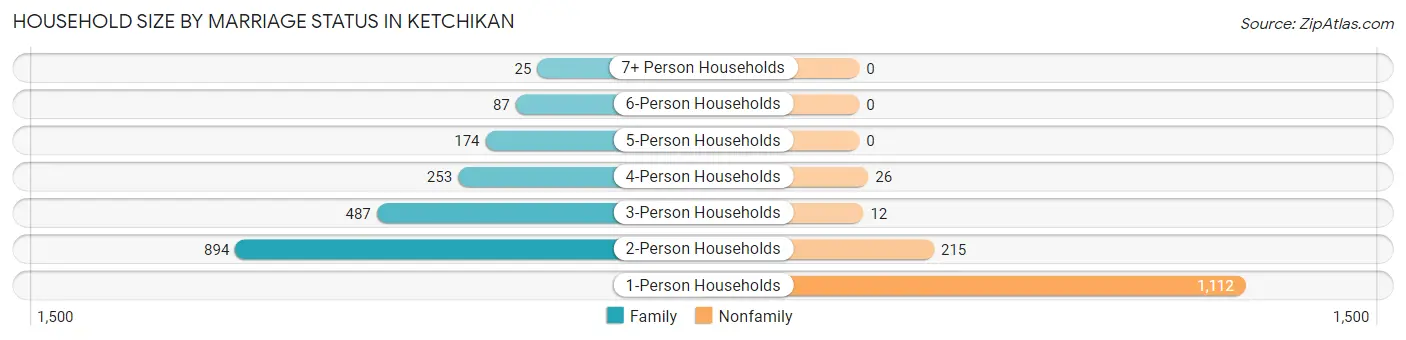
| Household Size | Family Households | Nonfamily Households |
| 1-Person Households | - | 1,112 (33.9%) |
| 2-Person Households | 894 (27.2%) | 215 (6.5%) |
| 3-Person Households | 487 (14.8%) | 12 (0.4%) |
| 4-Person Households | 253 (7.7%) | 26 (0.8%) |
| 5-Person Households | 174 (5.3%) | 0 (0.0%) |
| 6-Person Households | 87 (2.6%) | 0 (0.0%) |
| 7+ Person Households | 25 (0.8%) | 0 (0.0%) |
| Total | 1,920 (58.5%) | 1,365 (41.5%) |
Female Fertility in Ketchikan
Fertility by Age in Ketchikan
Average fertility rate in Ketchikan is 31.0 births per 1,000 women. Women in the age bracket of 20 to 34 years have the highest fertility rate with 63.0 births per 1,000 women. Women in the age bracket of 20 to 34 years acount for 93.1% of all women with births.
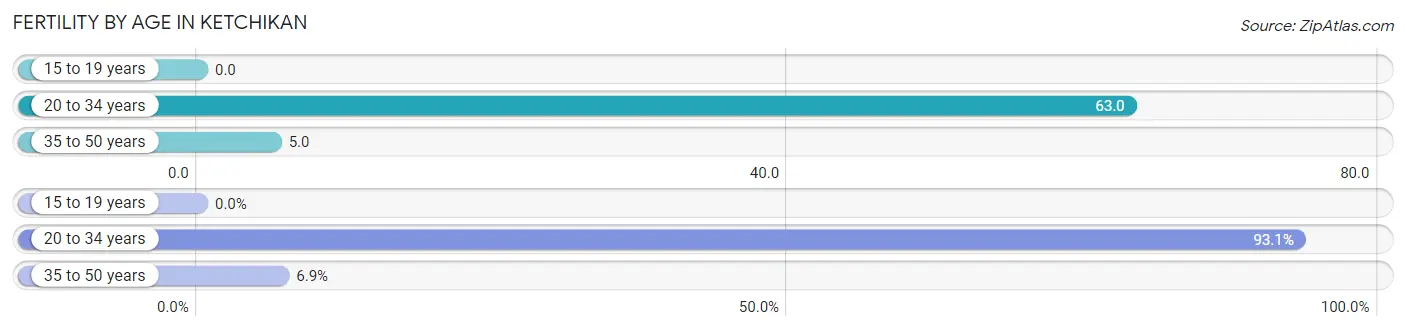
| Age Bracket | Women with Births | Births / 1,000 Women |
| 15 to 19 years | 0 (0.0%) | 0.0 |
| 20 to 34 years | 54 (93.1%) | 63.0 |
| 35 to 50 years | 4 (6.9%) | 5.0 |
| Total | 58 (100.0%) | 31.0 |
Fertility by Age by Marriage Status in Ketchikan
22.4% of women with births (58) in Ketchikan are married. The highest percentage of unmarried women with births falls into 35 to 50 years age bracket with 100.0% of them unmarried at the time of birth, while the lowest percentage of unmarried women with births belong to 20 to 34 years age bracket with 75.9% of them unmarried.
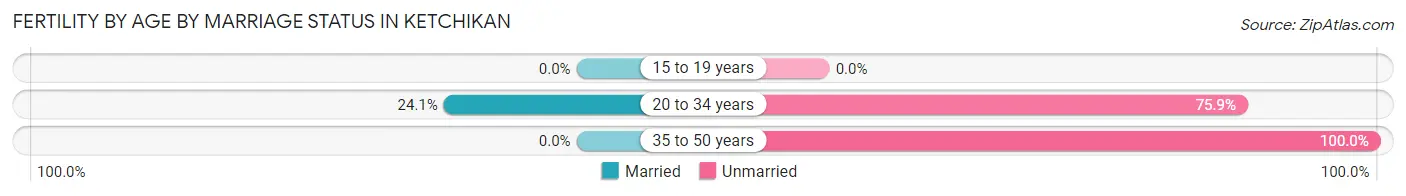
| Age Bracket | Married | Unmarried |
| 15 to 19 years | 0 (0.0%) | 0 (0.0%) |
| 20 to 34 years | 13 (24.1%) | 41 (75.9%) |
| 35 to 50 years | 0 (0.0%) | 4 (100.0%) |
| Total | 13 (22.4%) | 45 (77.6%) |
Fertility by Education in Ketchikan
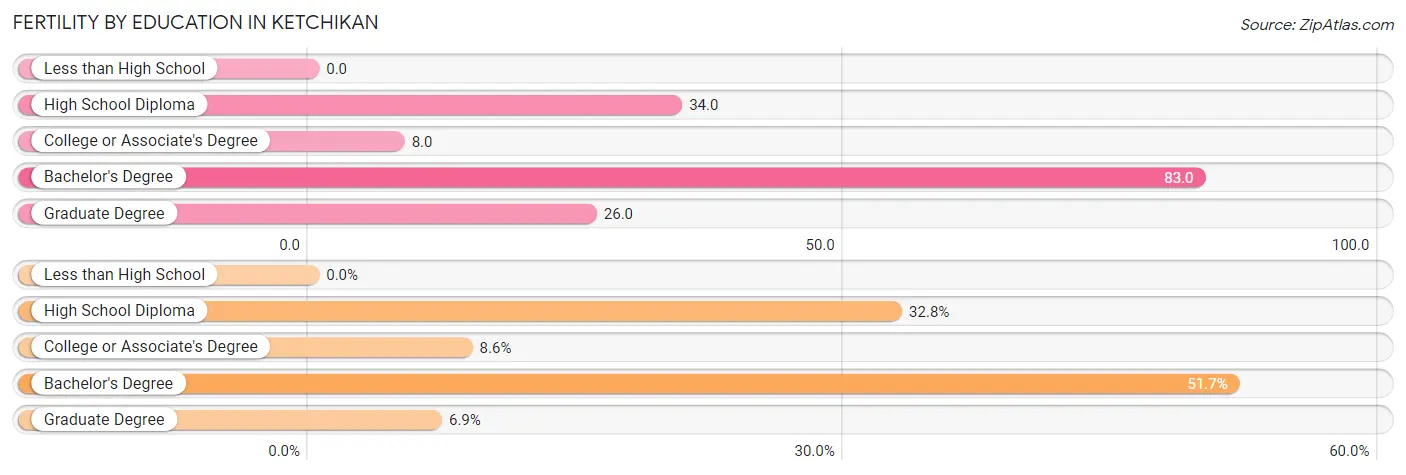
| Educational Attainment | Women with Births | Births / 1,000 Women |
| Less than High School | 0 (0.0%) | 0.0 |
| High School Diploma | 19 (32.8%) | 34.0 |
| College or Associate's Degree | 5 (8.6%) | 8.0 |
| Bachelor's Degree | 30 (51.7%) | 83.0 |
| Graduate Degree | 4 (6.9%) | 26.0 |
| Total | 58 (100.0%) | 31.0 |
Fertility by Education by Marriage Status in Ketchikan
77.6% of women with births in Ketchikan are unmarried. Women with the educational attainment of bachelor's degree are most likely to be married with 43.3% of them married at childbirth, while women with the educational attainment of high school diploma are least likely to be married with 100.0% of them unmarried at childbirth.
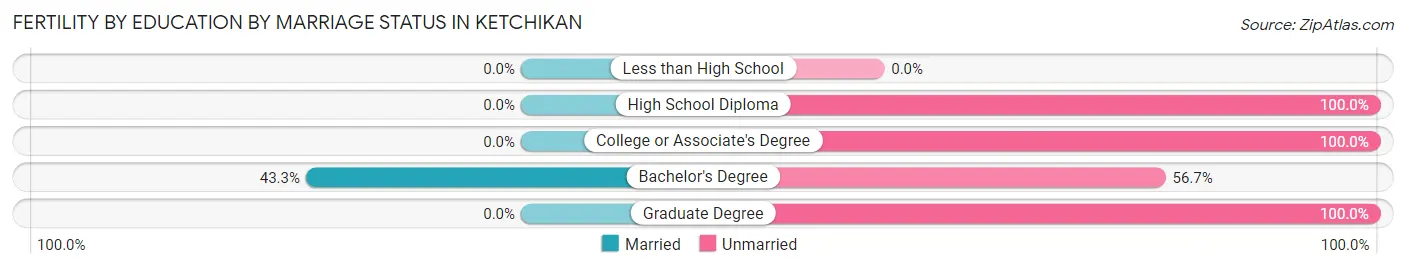
| Educational Attainment | Married | Unmarried |
| Less than High School | 0 (0.0%) | 0 (0.0%) |
| High School Diploma | 0 (0.0%) | 19 (100.0%) |
| College or Associate's Degree | 0 (0.0%) | 5 (100.0%) |
| Bachelor's Degree | 13 (43.3%) | 17 (56.7%) |
| Graduate Degree | 0 (0.0%) | 4 (100.0%) |
| Total | 13 (22.4%) | 45 (77.6%) |
Employment Characteristics in Ketchikan
Employment by Class of Employer in Ketchikan
Among the 4,118 employed individuals in Ketchikan, private company employees (2,153 | 52.3%), not-for-profit organizations (505 | 12.3%), and local government employees (494 | 12.0%) make up the most common classes of employment.
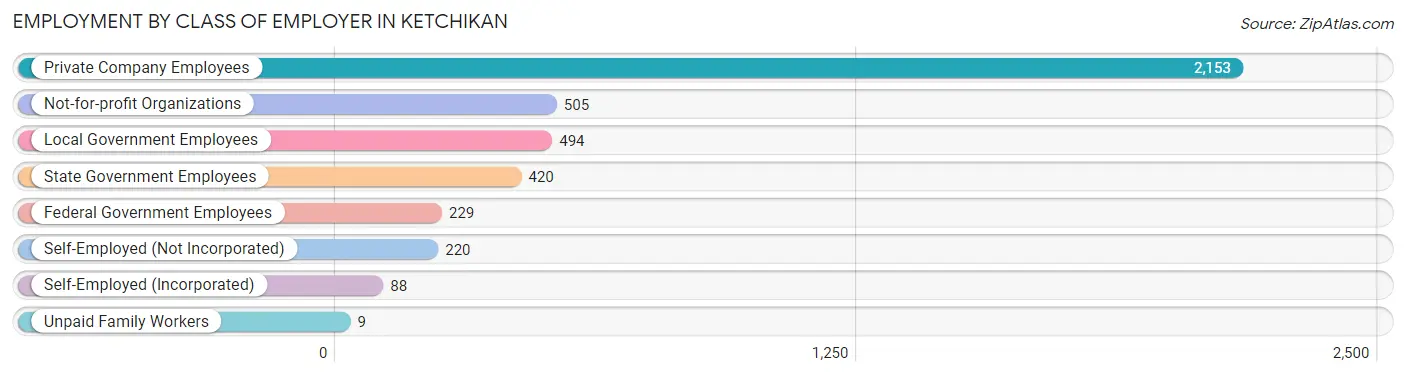
| Employer Class | # Employees | % Employees |
| Private Company Employees | 2,153 | 52.3% |
| Self-Employed (Incorporated) | 88 | 2.1% |
| Self-Employed (Not Incorporated) | 220 | 5.3% |
| Not-for-profit Organizations | 505 | 12.3% |
| Local Government Employees | 494 | 12.0% |
| State Government Employees | 420 | 10.2% |
| Federal Government Employees | 229 | 5.6% |
| Unpaid Family Workers | 9 | 0.2% |
| Total | 4,118 | 100.0% |
Employment Status by Age in Ketchikan
According to the labor force statistics for Ketchikan, out of the total population over 16 years of age (6,622), 67.2% or 4,450 individuals are in the labor force, with 5.1% or 227 of them unemployed. The age group with the highest labor force participation rate is 45 to 54 years, with 91.8% or 742 individuals in the labor force. Within the labor force, the 25 to 29 years age range has the highest percentage of unemployed individuals, with 13.6% or 86 of them being unemployed.
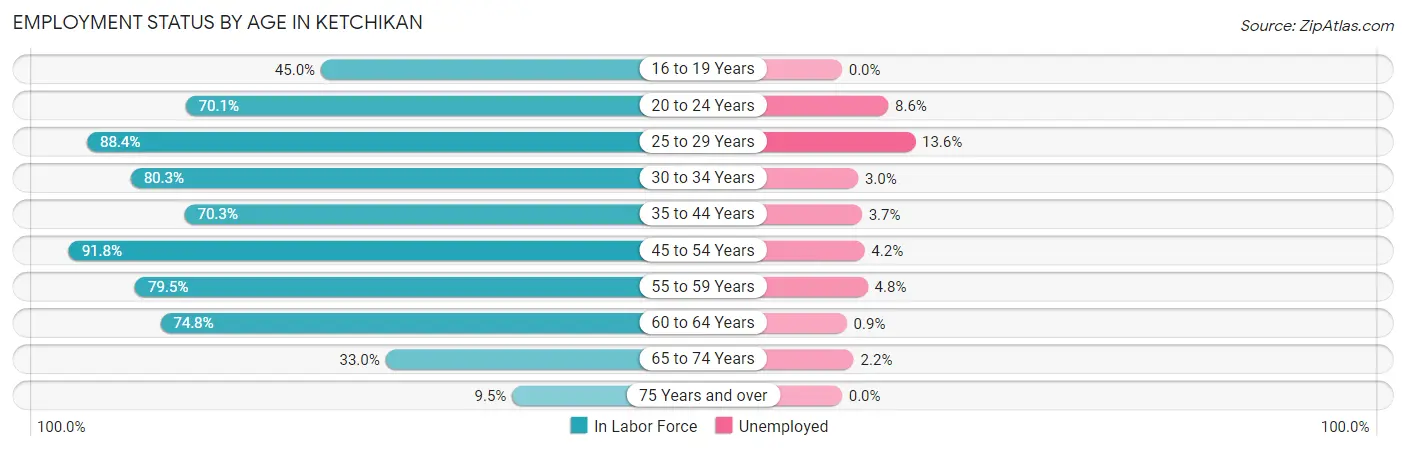
| Age Bracket | In Labor Force | Unemployed |
| 16 to 19 Years | 182 (45.0%) | 0 (0.0%) |
| 20 to 24 Years | 376 (70.1%) | 32 (8.6%) |
| 25 to 29 Years | 631 (88.4%) | 86 (13.6%) |
| 30 to 34 Years | 515 (80.3%) | 15 (3.0%) |
| 35 to 44 Years | 774 (70.3%) | 29 (3.7%) |
| 45 to 54 Years | 742 (91.8%) | 31 (4.2%) |
| 55 to 59 Years | 495 (79.5%) | 24 (4.8%) |
| 60 to 64 Years | 428 (74.8%) | 4 (0.9%) |
| 65 to 74 Years | 271 (33.0%) | 6 (2.2%) |
| 75 Years and over | 38 (9.5%) | 0 (0.0%) |
| Total | 4,450 (67.2%) | 227 (5.1%) |
Employment Status by Educational Attainment in Ketchikan
According to labor force statistics for Ketchikan, 80.4% of individuals (3,585) out of the total population between 25 and 64 years of age (4,459) are in the labor force, with 5.2% or 186 of them being unemployed. The group with the highest labor force participation rate are those with the educational attainment of bachelor's degree or higher, with 88.5% or 1,081 individuals in the labor force. Within the labor force, individuals with high school diploma education have the highest percentage of unemployment, with 9.7% or 103 of them being unemployed.
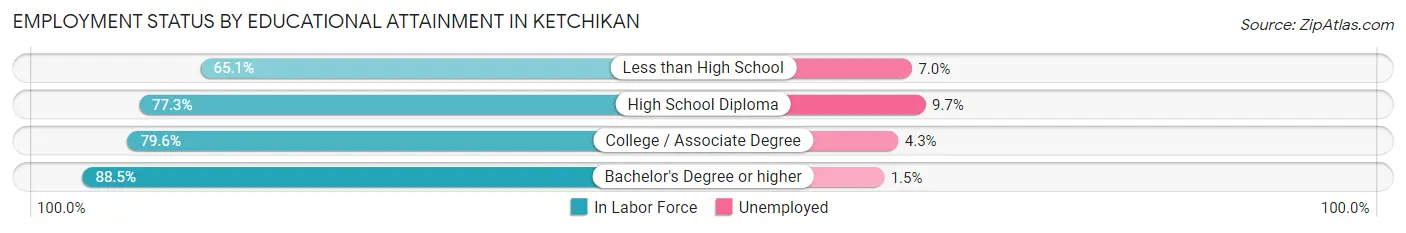
| Educational Attainment | In Labor Force | Unemployed |
| Less than High School | 185 (65.1%) | 20 (7.0%) |
| High School Diploma | 1,057 (77.3%) | 133 (9.7%) |
| College / Associate Degree | 1,262 (79.6%) | 68 (4.3%) |
| Bachelor's Degree or higher | 1,081 (88.5%) | 18 (1.5%) |
| Total | 3,585 (80.4%) | 232 (5.2%) |
Employment Occupations by Sex in Ketchikan
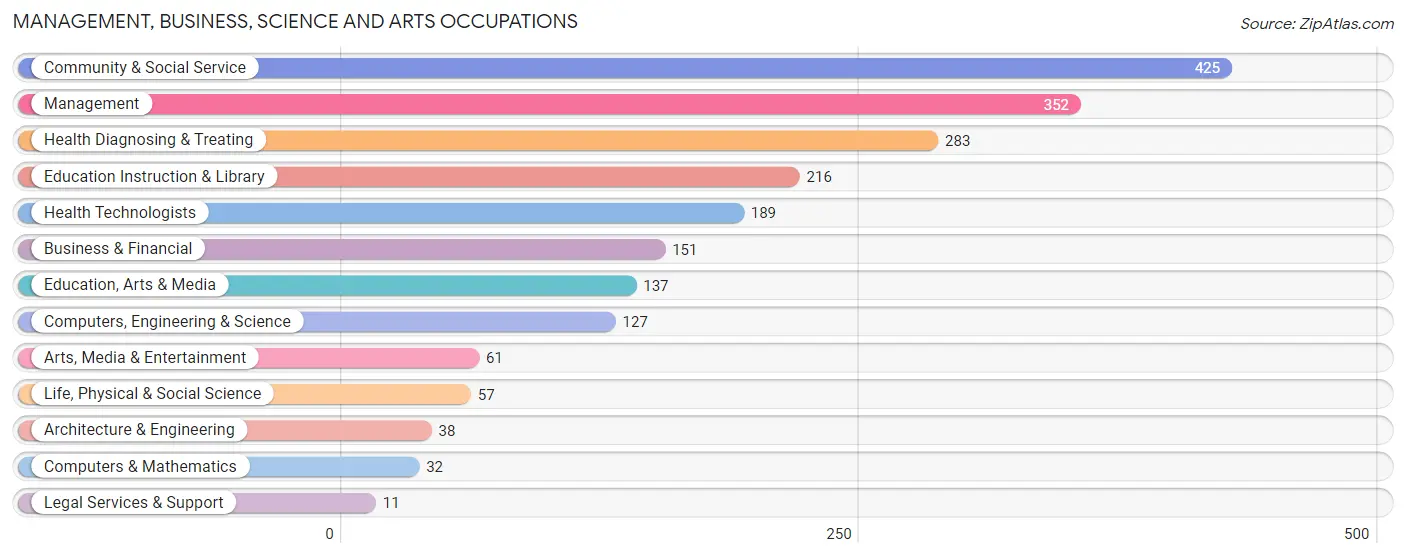
Management, Business, Science and Arts Occupations
The most common Management, Business, Science and Arts occupations in Ketchikan are Community & Social Service (425 | 10.3%), Management (352 | 8.5%), Health Diagnosing & Treating (283 | 6.9%), Education Instruction & Library (216 | 5.2%), and Health Technologists (189 | 4.6%).
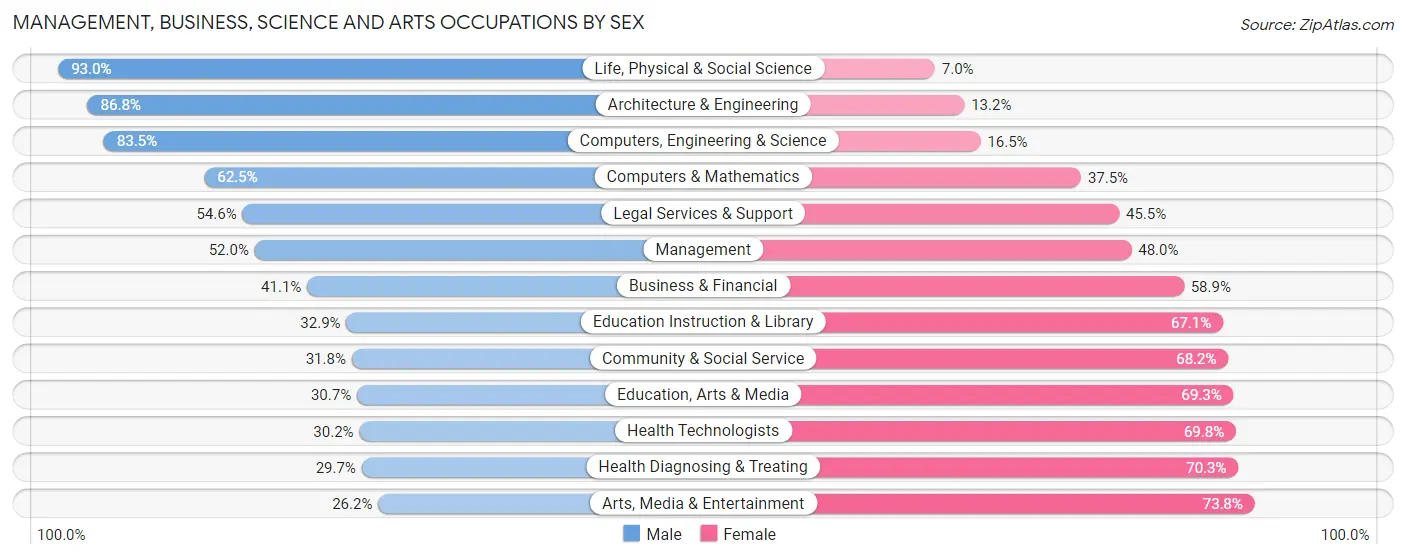
Management, Business, Science and Arts Occupations by Sex
Within the Management, Business, Science and Arts occupations in Ketchikan, the most male-oriented occupations are Life, Physical & Social Science (93.0%), Architecture & Engineering (86.8%), and Computers, Engineering & Science (83.5%), while the most female-oriented occupations are Arts, Media & Entertainment (73.8%), Health Diagnosing & Treating (70.3%), and Health Technologists (69.8%).
| Occupation | Male | Female |
| Management | 183 (52.0%) | 169 (48.0%) |
| Business & Financial | 62 (41.1%) | 89 (58.9%) |
| Computers, Engineering & Science | 106 (83.5%) | 21 (16.5%) |
| Computers & Mathematics | 20 (62.5%) | 12 (37.5%) |
| Architecture & Engineering | 33 (86.8%) | 5 (13.2%) |
| Life, Physical & Social Science | 53 (93.0%) | 4 (7.0%) |
| Community & Social Service | 135 (31.8%) | 290 (68.2%) |
| Education, Arts & Media | 42 (30.7%) | 95 (69.3%) |
| Legal Services & Support | 6 (54.5%) | 5 (45.5%) |
| Education Instruction & Library | 71 (32.9%) | 145 (67.1%) |
| Arts, Media & Entertainment | 16 (26.2%) | 45 (73.8%) |
| Health Diagnosing & Treating | 84 (29.7%) | 199 (70.3%) |
| Health Technologists | 57 (30.2%) | 132 (69.8%) |
| Total (Category) | 570 (42.6%) | 768 (57.4%) |
| Total (Overall) | 2,170 (52.6%) | 1,955 (47.4%) |
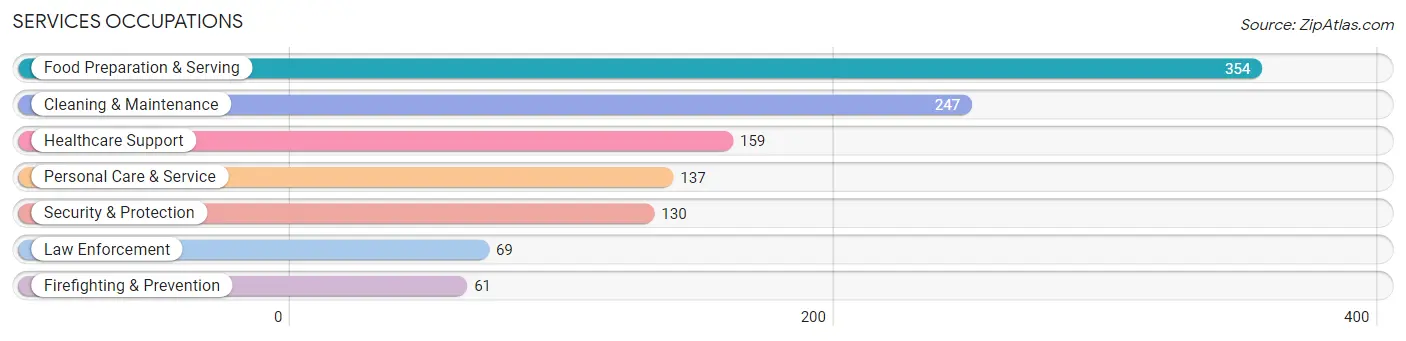
Services Occupations
The most common Services occupations in Ketchikan are Food Preparation & Serving (354 | 8.6%), Cleaning & Maintenance (247 | 6.0%), Healthcare Support (159 | 3.8%), Personal Care & Service (137 | 3.3%), and Security & Protection (130 | 3.2%).
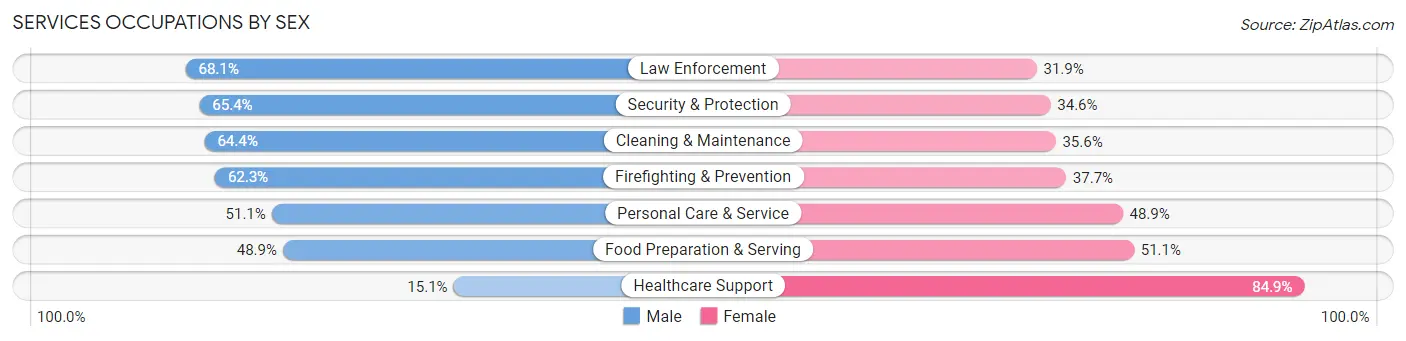
Services Occupations by Sex
Within the Services occupations in Ketchikan, the most male-oriented occupations are Law Enforcement (68.1%), Security & Protection (65.4%), and Cleaning & Maintenance (64.4%), while the most female-oriented occupations are Healthcare Support (84.9%), Food Preparation & Serving (51.1%), and Personal Care & Service (48.9%).
| Occupation | Male | Female |
| Healthcare Support | 24 (15.1%) | 135 (84.9%) |
| Security & Protection | 85 (65.4%) | 45 (34.6%) |
| Firefighting & Prevention | 38 (62.3%) | 23 (37.7%) |
| Law Enforcement | 47 (68.1%) | 22 (31.9%) |
| Food Preparation & Serving | 173 (48.9%) | 181 (51.1%) |
| Cleaning & Maintenance | 159 (64.4%) | 88 (35.6%) |
| Personal Care & Service | 70 (51.1%) | 67 (48.9%) |
| Total (Category) | 511 (49.8%) | 516 (50.2%) |
| Total (Overall) | 2,170 (52.6%) | 1,955 (47.4%) |
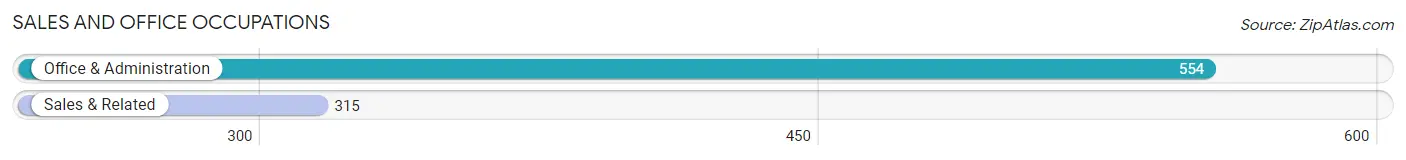
Sales and Office Occupations
The most common Sales and Office occupations in Ketchikan are Office & Administration (554 | 13.4%), and Sales & Related (315 | 7.6%).
Sales and Office Occupations by Sex
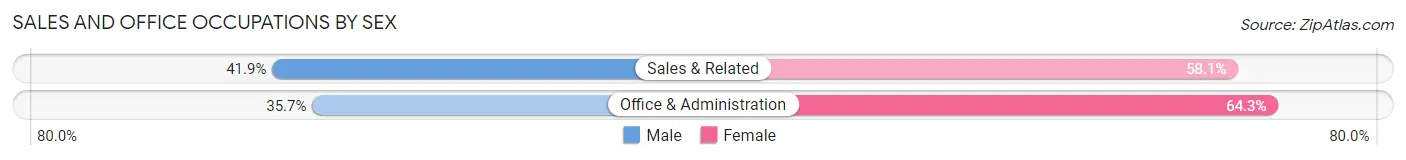
| Occupation | Male | Female |
| Sales & Related | 132 (41.9%) | 183 (58.1%) |
| Office & Administration | 198 (35.7%) | 356 (64.3%) |
| Total (Category) | 330 (38.0%) | 539 (62.0%) |
| Total (Overall) | 2,170 (52.6%) | 1,955 (47.4%) |
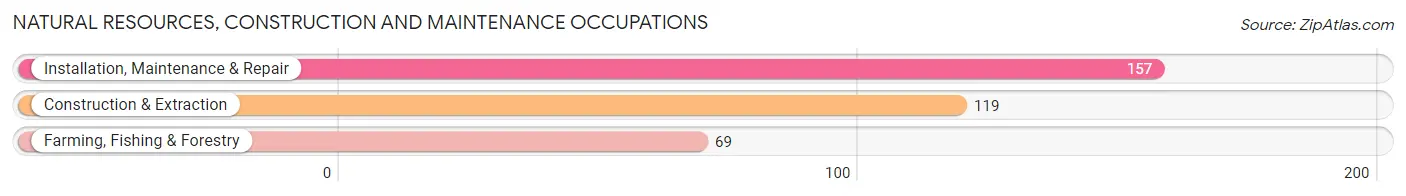
Natural Resources, Construction and Maintenance Occupations
The most common Natural Resources, Construction and Maintenance occupations in Ketchikan are Installation, Maintenance & Repair (157 | 3.8%), Construction & Extraction (119 | 2.9%), and Farming, Fishing & Forestry (69 | 1.7%).
Natural Resources, Construction and Maintenance Occupations by Sex
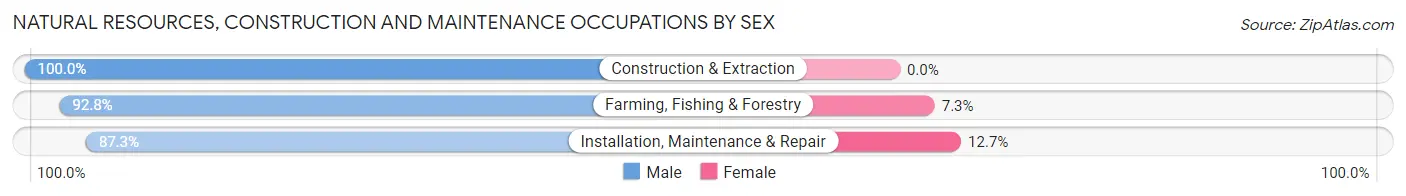
| Occupation | Male | Female |
| Farming, Fishing & Forestry | 64 (92.7%) | 5 (7.2%) |
| Construction & Extraction | 119 (100.0%) | 0 (0.0%) |
| Installation, Maintenance & Repair | 137 (87.3%) | 20 (12.7%) |
| Total (Category) | 320 (92.7%) | 25 (7.2%) |
| Total (Overall) | 2,170 (52.6%) | 1,955 (47.4%) |
Production, Transportation and Moving Occupations
The most common Production, Transportation and Moving occupations in Ketchikan are Transportation (226 | 5.5%), Production (211 | 5.1%), and Material Moving (109 | 2.6%).
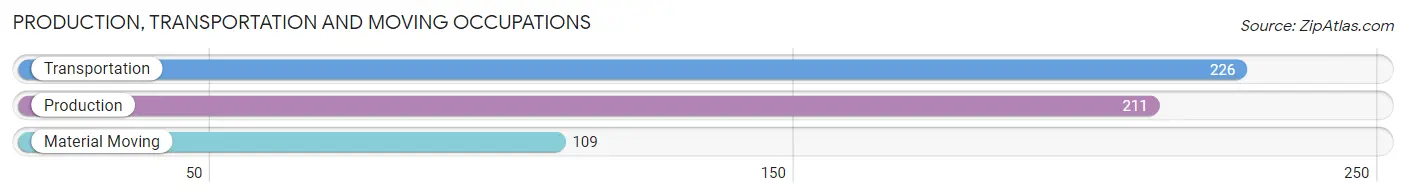
Production, Transportation and Moving Occupations by Sex
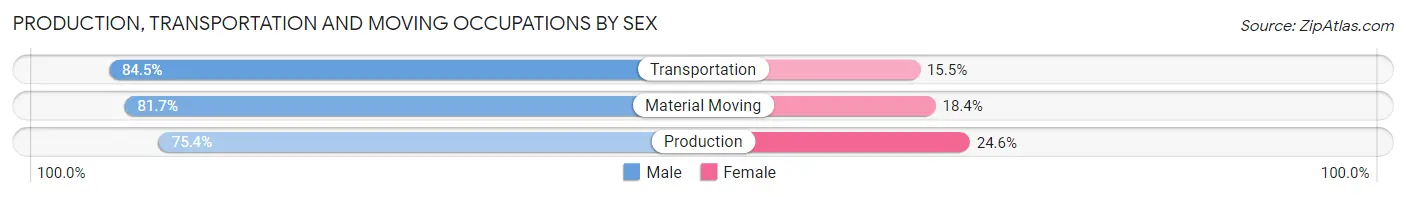
| Occupation | Male | Female |
| Production | 159 (75.4%) | 52 (24.6%) |
| Transportation | 191 (84.5%) | 35 (15.5%) |
| Material Moving | 89 (81.7%) | 20 (18.3%) |
| Total (Category) | 439 (80.4%) | 107 (19.6%) |
| Total (Overall) | 2,170 (52.6%) | 1,955 (47.4%) |
Employment Industries by Sex in Ketchikan
Employment Industries in Ketchikan
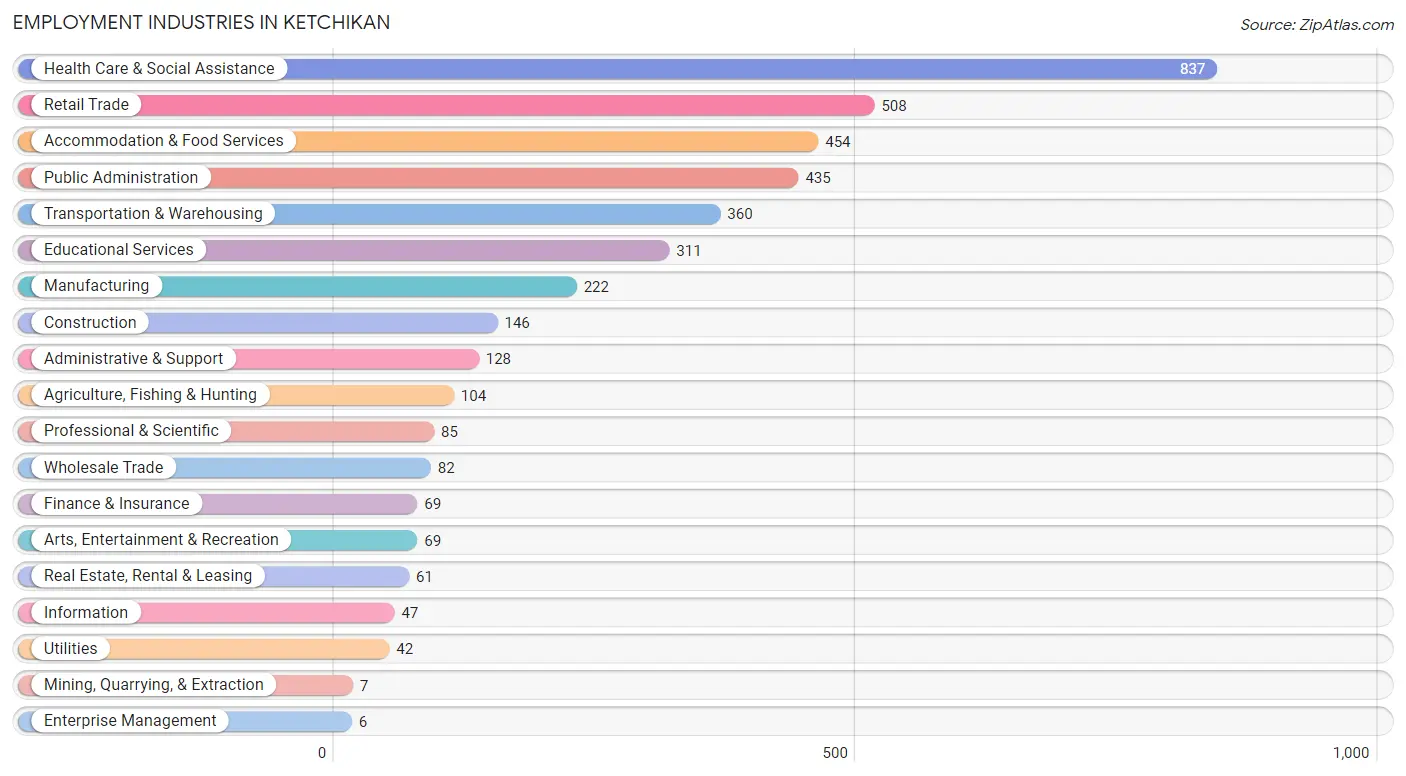
The major employment industries in Ketchikan include Health Care & Social Assistance (837 | 20.3%), Retail Trade (508 | 12.3%), Accommodation & Food Services (454 | 11.0%), Public Administration (435 | 10.5%), and Transportation & Warehousing (360 | 8.7%).
Employment Industries by Sex in Ketchikan
The Ketchikan industries that see more men than women are Mining, Quarrying, & Extraction (100.0%), Enterprise Management (100.0%), and Manufacturing (91.0%), whereas the industries that tend to have a higher number of women are Arts, Entertainment & Recreation (73.9%), Finance & Insurance (69.6%), and Health Care & Social Assistance (66.3%).
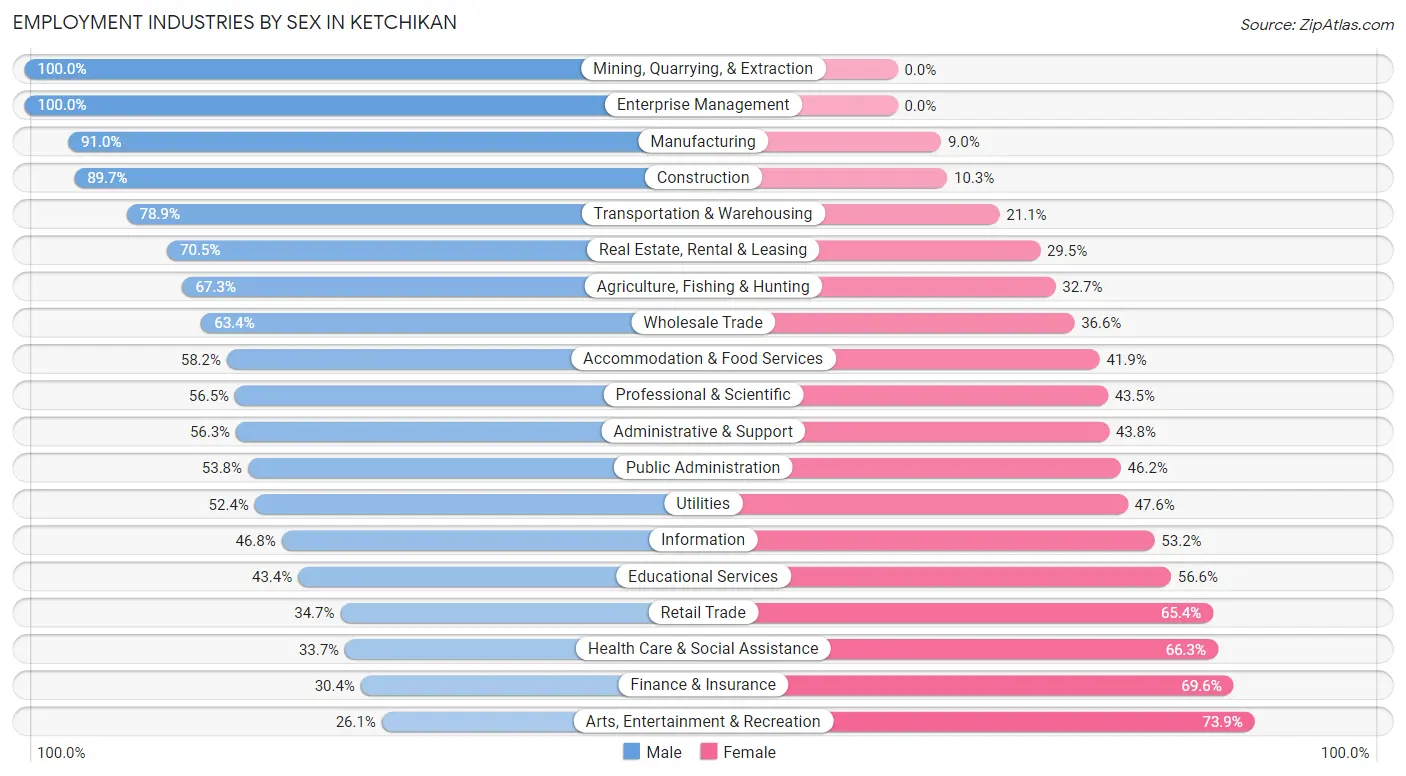
| Industry | Male | Female |
| Agriculture, Fishing & Hunting | 70 (67.3%) | 34 (32.7%) |
| Mining, Quarrying, & Extraction | 7 (100.0%) | 0 (0.0%) |
| Construction | 131 (89.7%) | 15 (10.3%) |
| Manufacturing | 202 (91.0%) | 20 (9.0%) |
| Wholesale Trade | 52 (63.4%) | 30 (36.6%) |
| Retail Trade | 176 (34.6%) | 332 (65.3%) |
| Transportation & Warehousing | 284 (78.9%) | 76 (21.1%) |
| Utilities | 22 (52.4%) | 20 (47.6%) |
| Information | 22 (46.8%) | 25 (53.2%) |
| Finance & Insurance | 21 (30.4%) | 48 (69.6%) |
| Real Estate, Rental & Leasing | 43 (70.5%) | 18 (29.5%) |
| Professional & Scientific | 48 (56.5%) | 37 (43.5%) |
| Enterprise Management | 6 (100.0%) | 0 (0.0%) |
| Administrative & Support | 72 (56.2%) | 56 (43.8%) |
| Educational Services | 135 (43.4%) | 176 (56.6%) |
| Health Care & Social Assistance | 282 (33.7%) | 555 (66.3%) |
| Arts, Entertainment & Recreation | 18 (26.1%) | 51 (73.9%) |
| Accommodation & Food Services | 264 (58.2%) | 190 (41.8%) |
| Public Administration | 234 (53.8%) | 201 (46.2%) |
| Total | 2,170 (52.6%) | 1,955 (47.4%) |
Education in Ketchikan
School Enrollment in Ketchikan
The most common levels of schooling among the 1,692 students in Ketchikan are elementary school (548 | 32.4%), high school (354 | 20.9%), and middle school (340 | 20.1%).
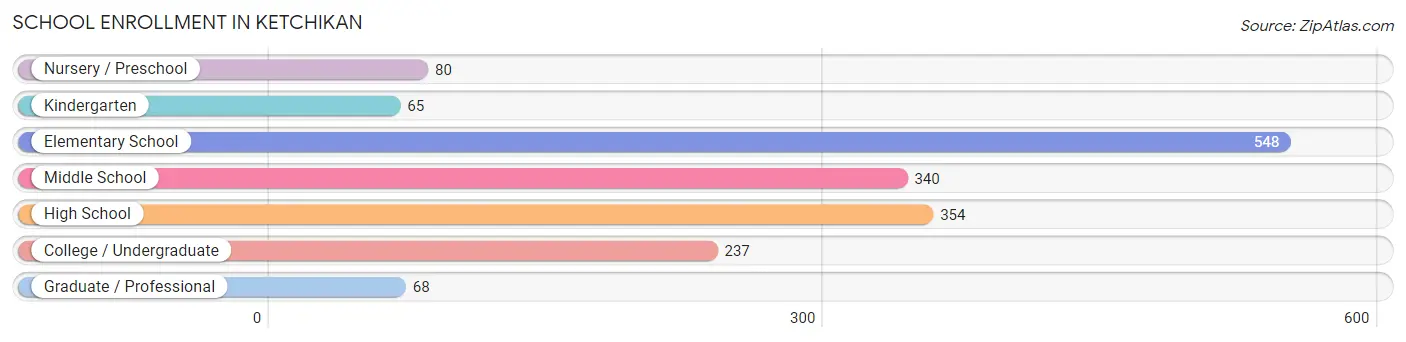
| School Level | # Students | % Students |
| Nursery / Preschool | 80 | 4.7% |
| Kindergarten | 65 | 3.8% |
| Elementary School | 548 | 32.4% |
| Middle School | 340 | 20.1% |
| High School | 354 | 20.9% |
| College / Undergraduate | 237 | 14.0% |
| Graduate / Professional | 68 | 4.0% |
| Total | 1,692 | 100.0% |
School Enrollment by Age by Funding Source in Ketchikan
Out of a total of 1,692 students who are enrolled in schools in Ketchikan, 217 (12.8%) attend a private institution, while the remaining 1,475 (87.2%) are enrolled in public schools. The age group of 3 to 4 year olds has the highest likelihood of being enrolled in private schools, with 21 (29.6% in the age bracket) enrolled. Conversely, the age group of 15 to 17 year olds has the lowest likelihood of being enrolled in a private school, with 259 (100.0% in the age bracket) attending a public institution.
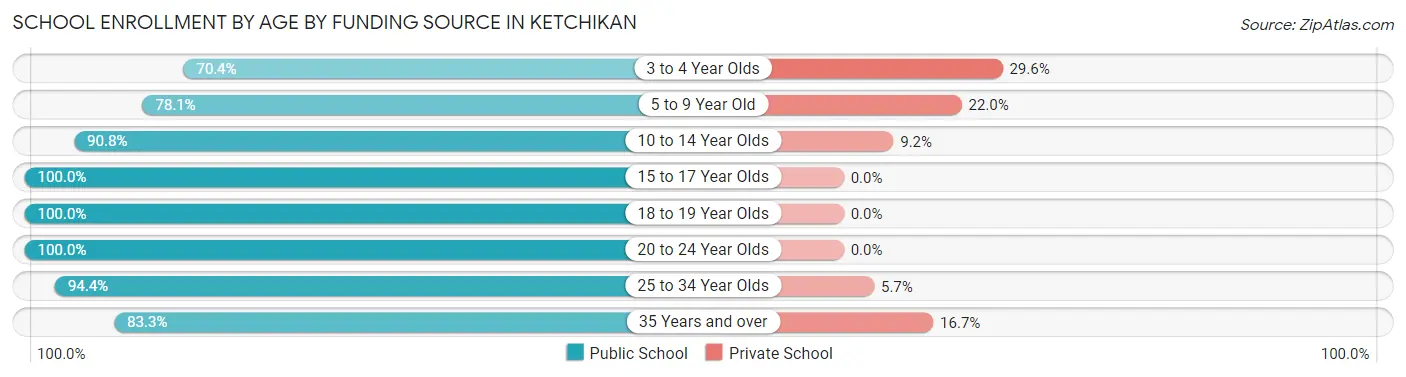
| Age Bracket | Public School | Private School |
| 3 to 4 Year Olds | 50 (70.4%) | 21 (29.6%) |
| 5 to 9 Year Old | 448 (78.0%) | 126 (22.0%) |
| 10 to 14 Year Olds | 383 (90.8%) | 39 (9.2%) |
| 15 to 17 Year Olds | 259 (100.0%) | 0 (0.0%) |
| 18 to 19 Year Olds | 69 (100.0%) | 0 (0.0%) |
| 20 to 24 Year Olds | 29 (100.0%) | 0 (0.0%) |
| 25 to 34 Year Olds | 117 (94.4%) | 7 (5.7%) |
| 35 Years and over | 120 (83.3%) | 24 (16.7%) |
| Total | 1,475 (87.2%) | 217 (12.8%) |
Educational Attainment by Field of Study in Ketchikan
Science & technology (227 | 14.3%), education (227 | 14.3%), business (225 | 14.2%), social sciences (115 | 7.2%), and bio, nature & agricultural (114 | 7.2%) are the most common fields of study among 1,587 individuals in Ketchikan who have obtained a bachelor's degree or higher.
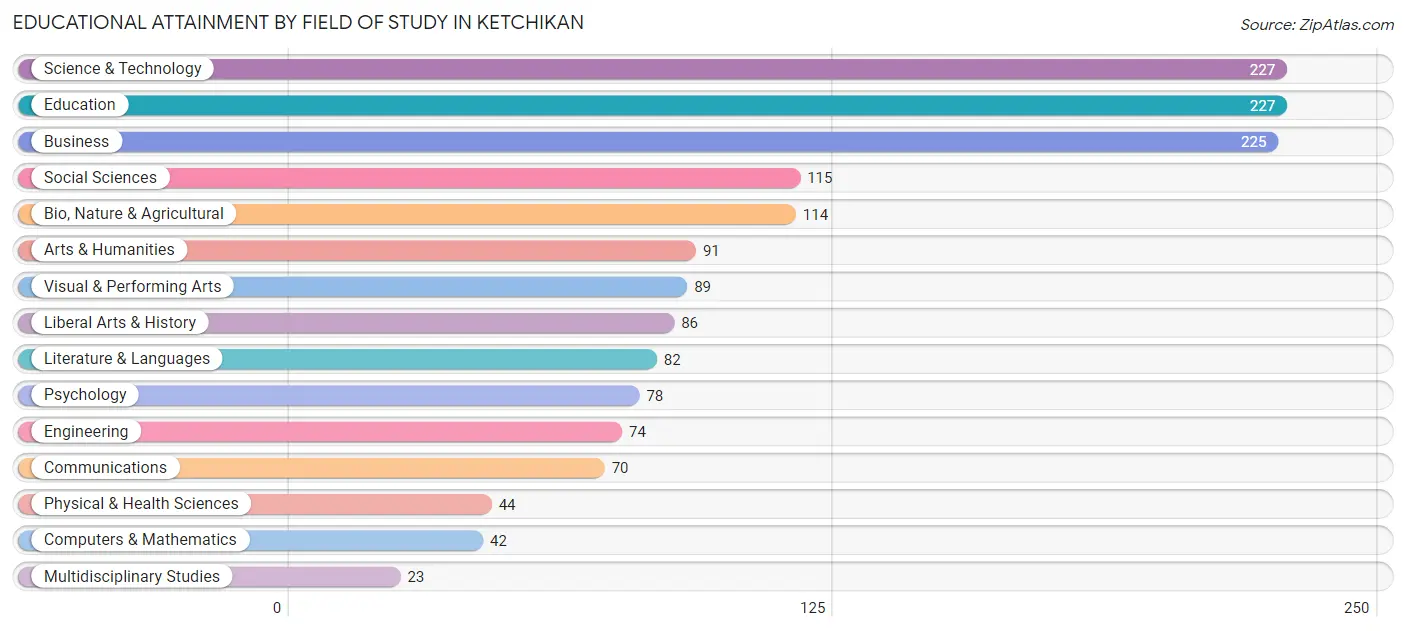
| Field of Study | # Graduates | % Graduates |
| Computers & Mathematics | 42 | 2.6% |
| Bio, Nature & Agricultural | 114 | 7.2% |
| Physical & Health Sciences | 44 | 2.8% |
| Psychology | 78 | 4.9% |
| Social Sciences | 115 | 7.2% |
| Engineering | 74 | 4.7% |
| Multidisciplinary Studies | 23 | 1.5% |
| Science & Technology | 227 | 14.3% |
| Business | 225 | 14.2% |
| Education | 227 | 14.3% |
| Literature & Languages | 82 | 5.2% |
| Liberal Arts & History | 86 | 5.4% |
| Visual & Performing Arts | 89 | 5.6% |
| Communications | 70 | 4.4% |
| Arts & Humanities | 91 | 5.7% |
| Total | 1,587 | 100.0% |
Transportation & Commute in Ketchikan
Vehicle Availability by Sex in Ketchikan
The most prevalent vehicle ownership categories in Ketchikan are males with 2 vehicles (817, accounting for 37.9%) and females with 2 vehicles (672, making up 43.2%).
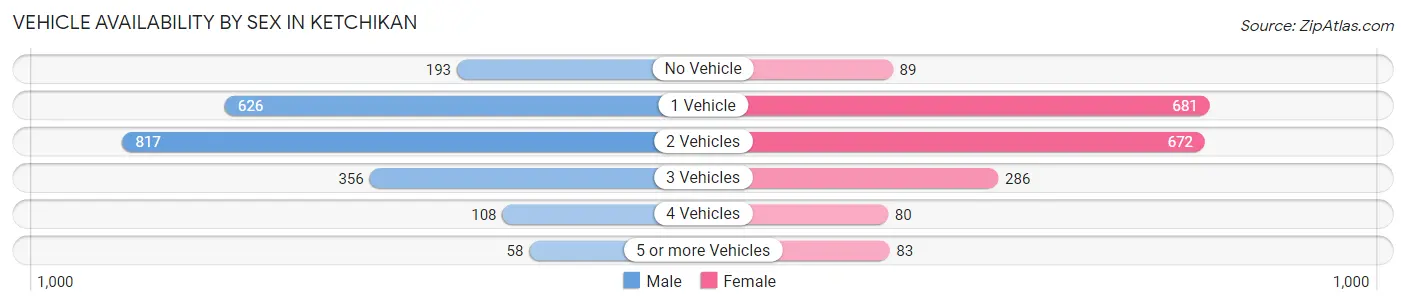
| Vehicles Available | Male | Female |
| No Vehicle | 193 (8.9%) | 89 (4.7%) |
| 1 Vehicle | 626 (29.0%) | 681 (36.0%) |
| 2 Vehicles | 817 (37.9%) | 672 (35.5%) |
| 3 Vehicles | 356 (16.5%) | 286 (15.1%) |
| 4 Vehicles | 108 (5.0%) | 80 (4.2%) |
| 5 or more Vehicles | 58 (2.7%) | 83 (4.4%) |
| Total | 2,158 (100.0%) | 1,891 (100.0%) |
Commute Time in Ketchikan
The most frequently occuring commute durations in Ketchikan are 5 to 9 minutes (1,542 commuters, 38.6%), 10 to 14 minutes (1,007 commuters, 25.2%), and less than 5 minutes (615 commuters, 15.4%).
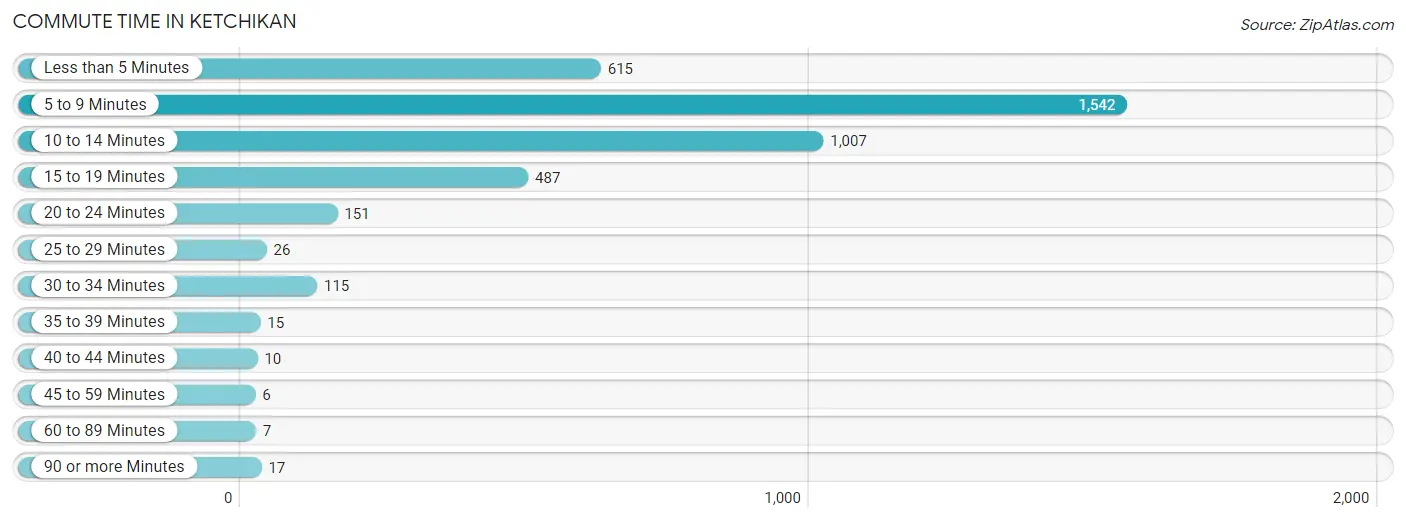
| Commute Time | # Commuters | % Commuters |
| Less than 5 Minutes | 615 | 15.4% |
| 5 to 9 Minutes | 1,542 | 38.6% |
| 10 to 14 Minutes | 1,007 | 25.2% |
| 15 to 19 Minutes | 487 | 12.2% |
| 20 to 24 Minutes | 151 | 3.8% |
| 25 to 29 Minutes | 26 | 0.6% |
| 30 to 34 Minutes | 115 | 2.9% |
| 35 to 39 Minutes | 15 | 0.4% |
| 40 to 44 Minutes | 10 | 0.3% |
| 45 to 59 Minutes | 6 | 0.2% |
| 60 to 89 Minutes | 7 | 0.2% |
| 90 or more Minutes | 17 | 0.4% |
Commute Time by Sex in Ketchikan
The most common commute times in Ketchikan are 5 to 9 minutes (825 commuters, 37.9%) for males and 5 to 9 minutes (717 commuters, 39.3%) for females.
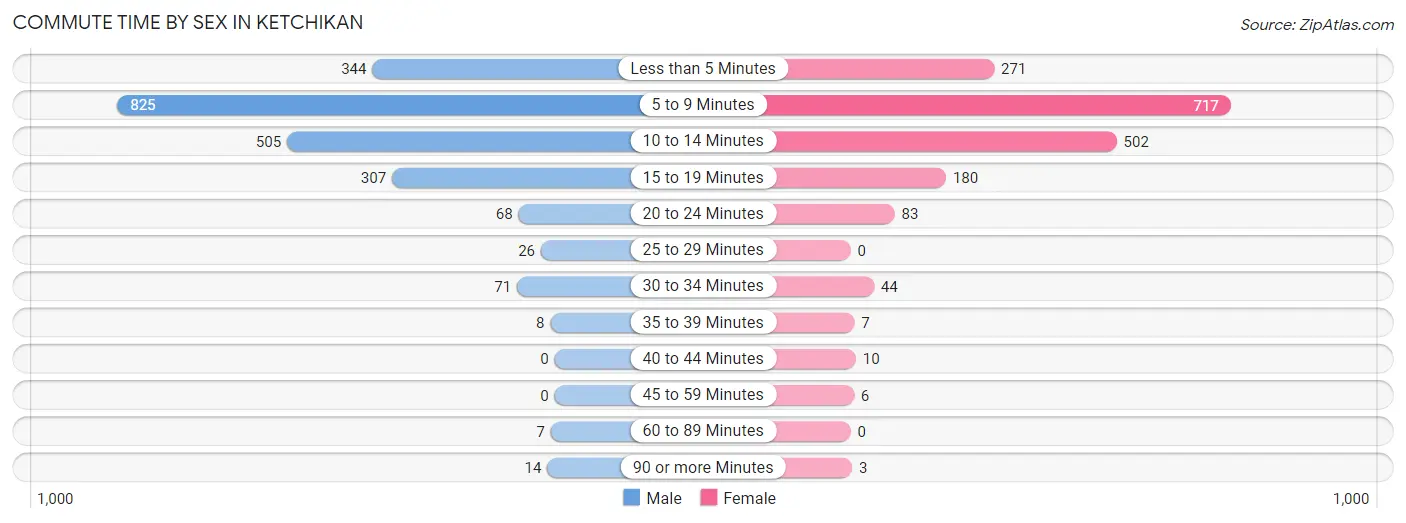
| Commute Time | Male | Female |
| Less than 5 Minutes | 344 (15.8%) | 271 (14.9%) |
| 5 to 9 Minutes | 825 (37.9%) | 717 (39.3%) |
| 10 to 14 Minutes | 505 (23.2%) | 502 (27.5%) |
| 15 to 19 Minutes | 307 (14.1%) | 180 (9.9%) |
| 20 to 24 Minutes | 68 (3.1%) | 83 (4.5%) |
| 25 to 29 Minutes | 26 (1.2%) | 0 (0.0%) |
| 30 to 34 Minutes | 71 (3.3%) | 44 (2.4%) |
| 35 to 39 Minutes | 8 (0.4%) | 7 (0.4%) |
| 40 to 44 Minutes | 0 (0.0%) | 10 (0.5%) |
| 45 to 59 Minutes | 0 (0.0%) | 6 (0.3%) |
| 60 to 89 Minutes | 7 (0.3%) | 0 (0.0%) |
| 90 or more Minutes | 14 (0.6%) | 3 (0.2%) |
Time of Departure to Work by Sex in Ketchikan
The most frequent times of departure to work in Ketchikan are 7:30 AM to 7:59 AM (460, 21.1%) for males and 7:30 AM to 7:59 AM (381, 20.9%) for females.
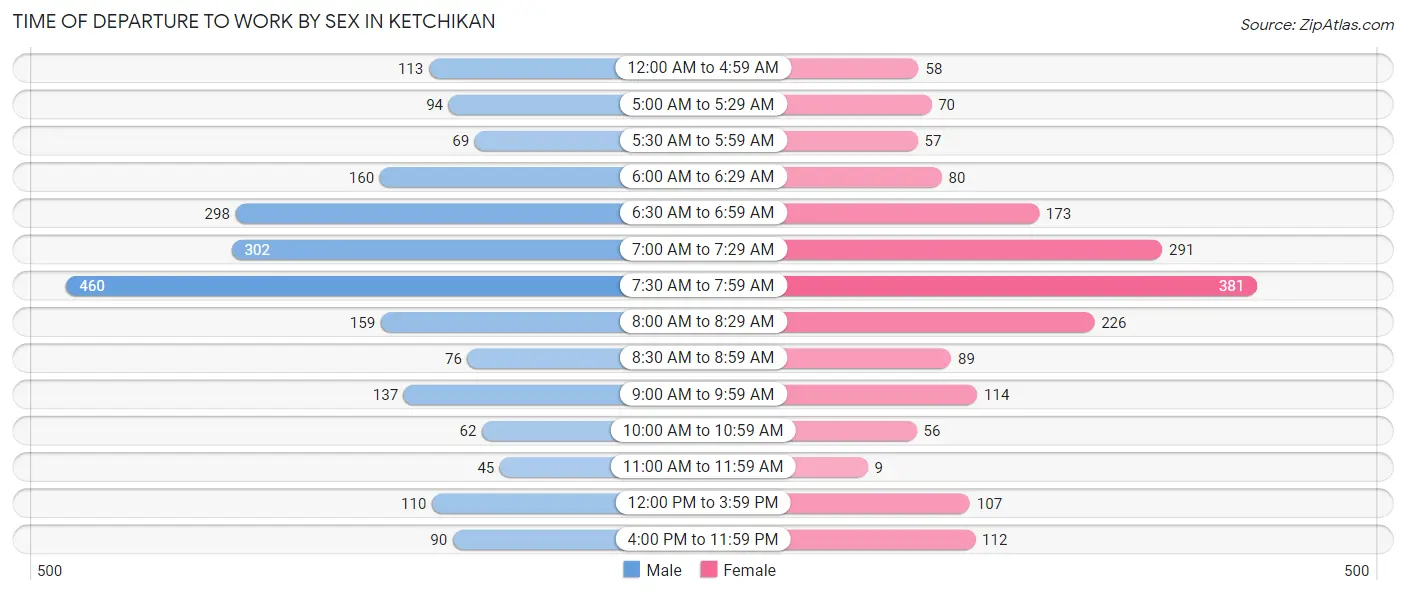
| Time of Departure | Male | Female |
| 12:00 AM to 4:59 AM | 113 (5.2%) | 58 (3.2%) |
| 5:00 AM to 5:29 AM | 94 (4.3%) | 70 (3.8%) |
| 5:30 AM to 5:59 AM | 69 (3.2%) | 57 (3.1%) |
| 6:00 AM to 6:29 AM | 160 (7.4%) | 80 (4.4%) |
| 6:30 AM to 6:59 AM | 298 (13.7%) | 173 (9.5%) |
| 7:00 AM to 7:29 AM | 302 (13.9%) | 291 (16.0%) |
| 7:30 AM to 7:59 AM | 460 (21.1%) | 381 (20.9%) |
| 8:00 AM to 8:29 AM | 159 (7.3%) | 226 (12.4%) |
| 8:30 AM to 8:59 AM | 76 (3.5%) | 89 (4.9%) |
| 9:00 AM to 9:59 AM | 137 (6.3%) | 114 (6.2%) |
| 10:00 AM to 10:59 AM | 62 (2.9%) | 56 (3.1%) |
| 11:00 AM to 11:59 AM | 45 (2.1%) | 9 (0.5%) |
| 12:00 PM to 3:59 PM | 110 (5.1%) | 107 (5.9%) |
| 4:00 PM to 11:59 PM | 90 (4.1%) | 112 (6.1%) |
| Total | 2,175 (100.0%) | 1,823 (100.0%) |
Housing Occupancy in Ketchikan
Occupancy by Ownership in Ketchikan
Of the total 3,285 dwellings in Ketchikan, owner-occupied units account for 1,842 (56.1%), while renter-occupied units make up 1,443 (43.9%).
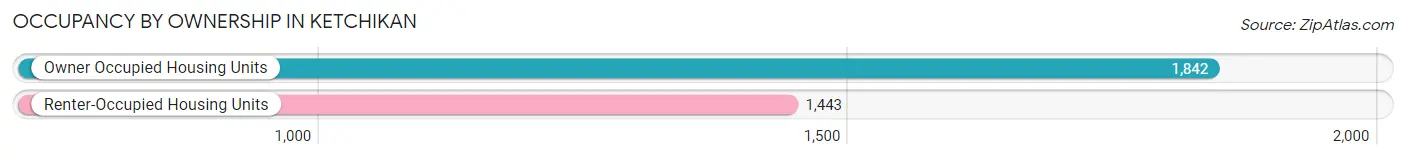
| Occupancy | # Housing Units | % Housing Units |
| Owner Occupied Housing Units | 1,842 | 56.1% |
| Renter-Occupied Housing Units | 1,443 | 43.9% |
| Total Occupied Housing Units | 3,285 | 100.0% |
Occupancy by Household Size in Ketchikan
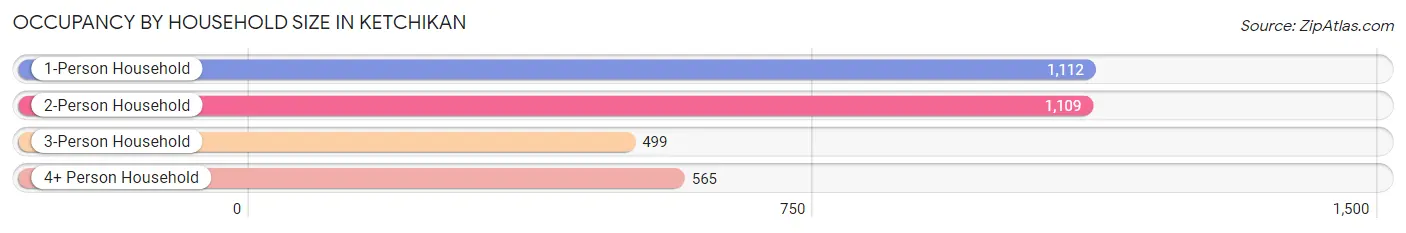
| Household Size | # Housing Units | % Housing Units |
| 1-Person Household | 1,112 | 33.9% |
| 2-Person Household | 1,109 | 33.8% |
| 3-Person Household | 499 | 15.2% |
| 4+ Person Household | 565 | 17.2% |
| Total Housing Units | 3,285 | 100.0% |
Occupancy by Ownership by Household Size in Ketchikan
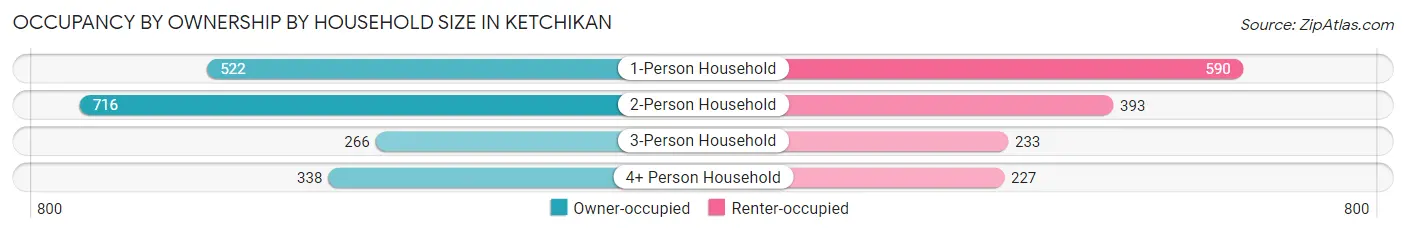
| Household Size | Owner-occupied | Renter-occupied |
| 1-Person Household | 522 (46.9%) | 590 (53.1%) |
| 2-Person Household | 716 (64.6%) | 393 (35.4%) |
| 3-Person Household | 266 (53.3%) | 233 (46.7%) |
| 4+ Person Household | 338 (59.8%) | 227 (40.2%) |
| Total Housing Units | 1,842 (56.1%) | 1,443 (43.9%) |
Occupancy by Educational Attainment in Ketchikan
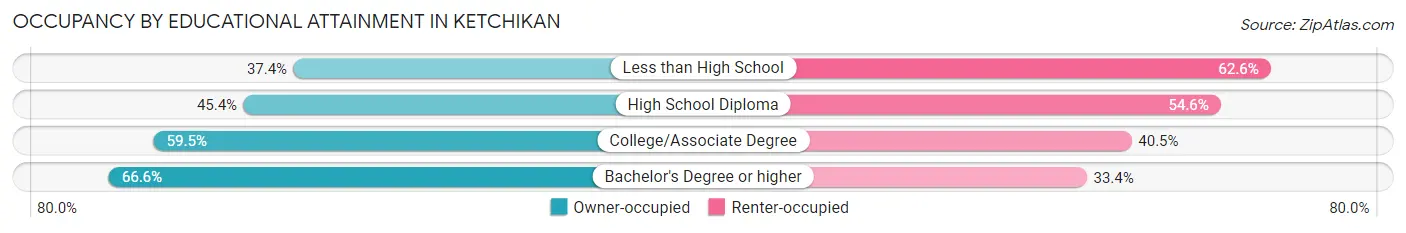
| Household Size | Owner-occupied | Renter-occupied |
| Less than High School | 79 (37.4%) | 132 (62.6%) |
| High School Diploma | 407 (45.4%) | 490 (54.6%) |
| College/Associate Degree | 791 (59.5%) | 538 (40.5%) |
| Bachelor's Degree or higher | 565 (66.6%) | 283 (33.4%) |
Occupancy by Age of Householder in Ketchikan
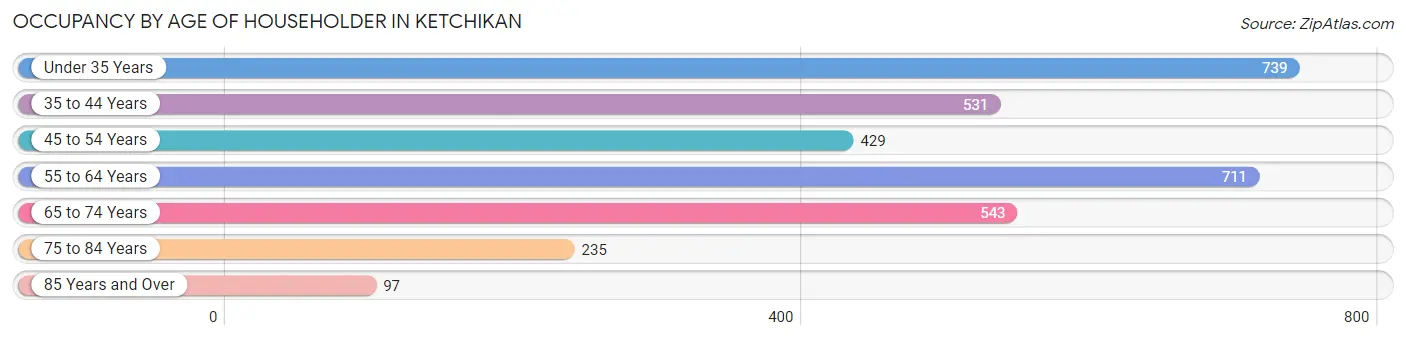
| Age Bracket | # Households | % Households |
| Under 35 Years | 739 | 22.5% |
| 35 to 44 Years | 531 | 16.2% |
| 45 to 54 Years | 429 | 13.1% |
| 55 to 64 Years | 711 | 21.6% |
| 65 to 74 Years | 543 | 16.5% |
| 75 to 84 Years | 235 | 7.1% |
| 85 Years and Over | 97 | 2.9% |
| Total | 3,285 | 100.0% |
Housing Finances in Ketchikan
Median Income by Occupancy in Ketchikan
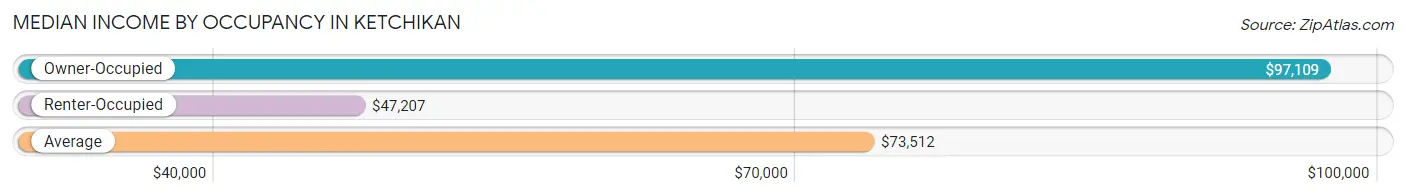
| Occupancy Type | # Households | Median Income |
| Owner-Occupied | 1,842 (56.1%) | $97,109 |
| Renter-Occupied | 1,443 (43.9%) | $47,207 |
| Average | 3,285 (100.0%) | $73,512 |
Occupancy by Householder Income Bracket in Ketchikan
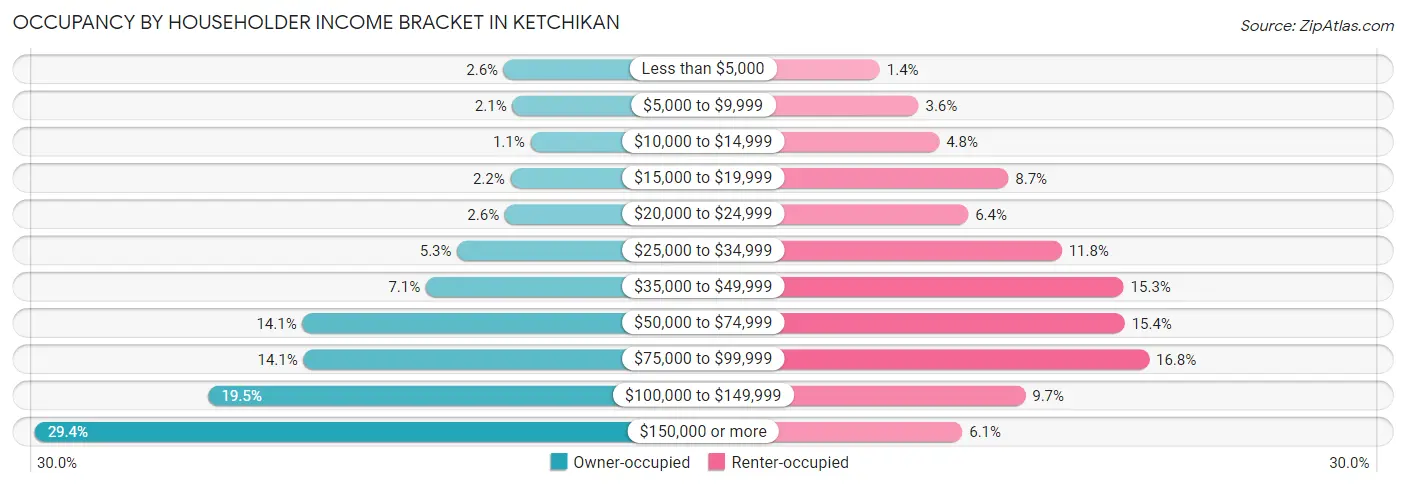
| Income Bracket | Owner-occupied | Renter-occupied |
| Less than $5,000 | 48 (2.6%) | 20 (1.4%) |
| $5,000 to $9,999 | 39 (2.1%) | 52 (3.6%) |
| $10,000 to $14,999 | 20 (1.1%) | 69 (4.8%) |
| $15,000 to $19,999 | 41 (2.2%) | 126 (8.7%) |
| $20,000 to $24,999 | 47 (2.5%) | 93 (6.4%) |
| $25,000 to $34,999 | 97 (5.3%) | 170 (11.8%) |
| $35,000 to $49,999 | 130 (7.1%) | 221 (15.3%) |
| $50,000 to $74,999 | 260 (14.1%) | 222 (15.4%) |
| $75,000 to $99,999 | 259 (14.1%) | 242 (16.8%) |
| $100,000 to $149,999 | 359 (19.5%) | 140 (9.7%) |
| $150,000 or more | 542 (29.4%) | 88 (6.1%) |
| Total | 1,842 (100.0%) | 1,443 (100.0%) |
Monthly Housing Cost Tiers in Ketchikan
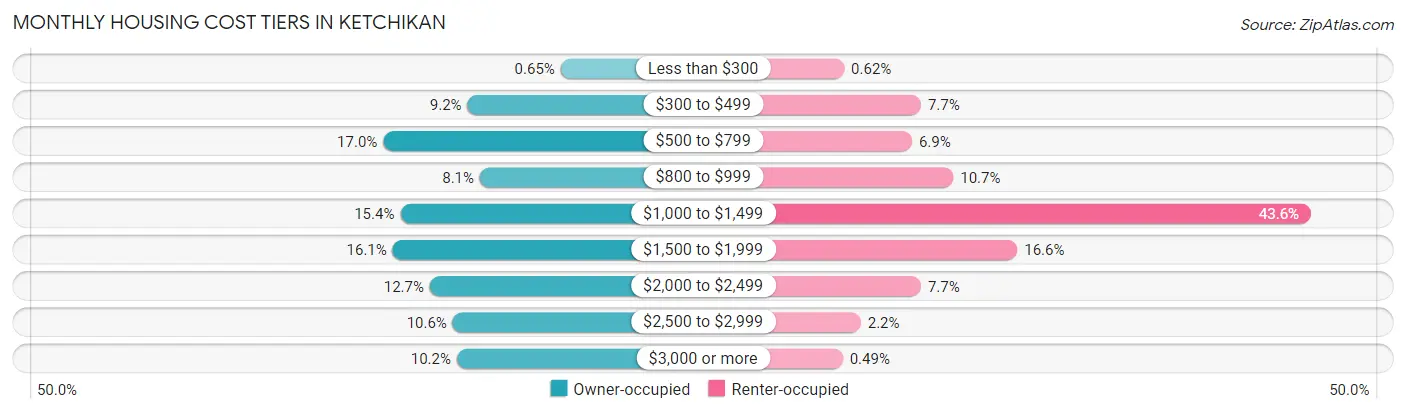
| Monthly Cost | Owner-occupied | Renter-occupied |
| Less than $300 | 12 (0.6%) | 9 (0.6%) |
| $300 to $499 | 170 (9.2%) | 111 (7.7%) |
| $500 to $799 | 313 (17.0%) | 99 (6.9%) |
| $800 to $999 | 149 (8.1%) | 154 (10.7%) |
| $1,000 to $1,499 | 284 (15.4%) | 629 (43.6%) |
| $1,500 to $1,999 | 297 (16.1%) | 239 (16.6%) |
| $2,000 to $2,499 | 234 (12.7%) | 111 (7.7%) |
| $2,500 to $2,999 | 195 (10.6%) | 31 (2.1%) |
| $3,000 or more | 188 (10.2%) | 7 (0.5%) |
| Total | 1,842 (100.0%) | 1,443 (100.0%) |
Physical Housing Characteristics in Ketchikan
Housing Structures in Ketchikan
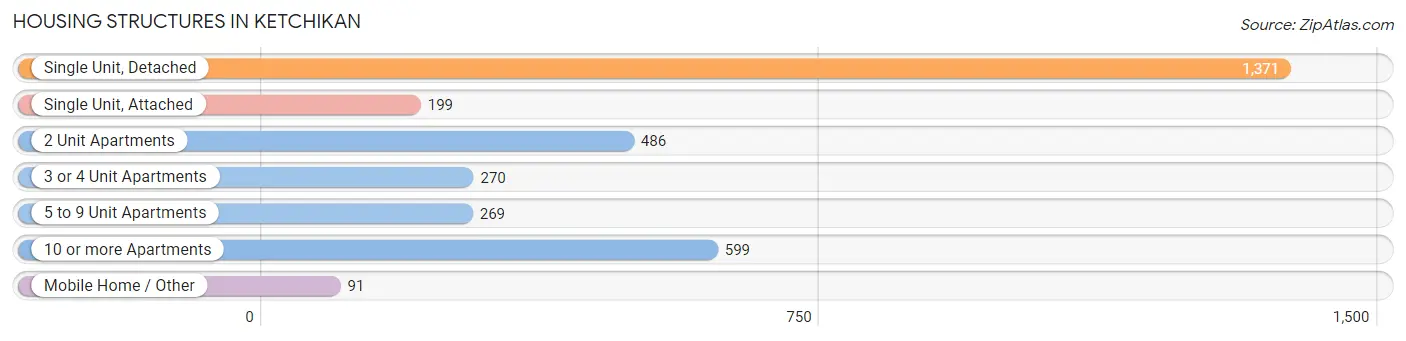
| Structure Type | # Housing Units | % Housing Units |
| Single Unit, Detached | 1,371 | 41.7% |
| Single Unit, Attached | 199 | 6.1% |
| 2 Unit Apartments | 486 | 14.8% |
| 3 or 4 Unit Apartments | 270 | 8.2% |
| 5 to 9 Unit Apartments | 269 | 8.2% |
| 10 or more Apartments | 599 | 18.2% |
| Mobile Home / Other | 91 | 2.8% |
| Total | 3,285 | 100.0% |
Housing Structures by Occupancy in Ketchikan
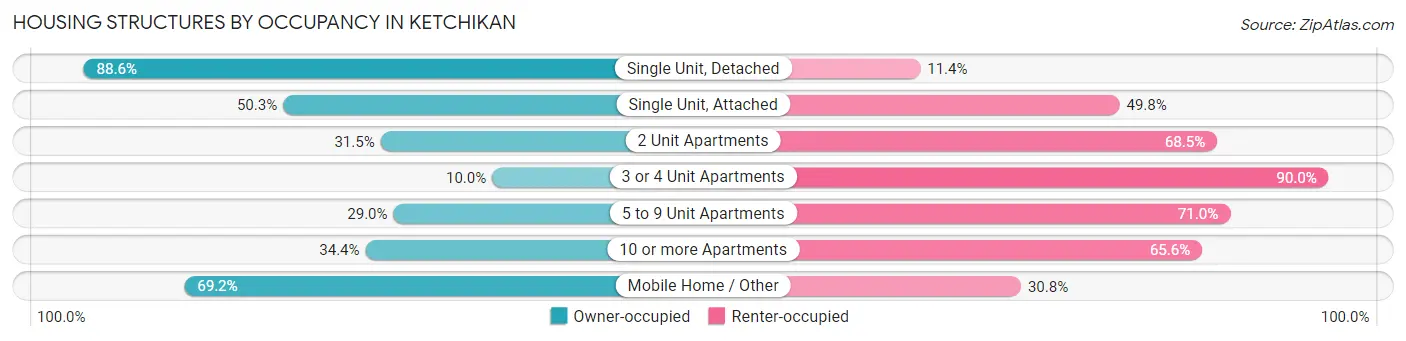
| Structure Type | Owner-occupied | Renter-occupied |
| Single Unit, Detached | 1,215 (88.6%) | 156 (11.4%) |
| Single Unit, Attached | 100 (50.2%) | 99 (49.7%) |
| 2 Unit Apartments | 153 (31.5%) | 333 (68.5%) |
| 3 or 4 Unit Apartments | 27 (10.0%) | 243 (90.0%) |
| 5 to 9 Unit Apartments | 78 (29.0%) | 191 (71.0%) |
| 10 or more Apartments | 206 (34.4%) | 393 (65.6%) |
| Mobile Home / Other | 63 (69.2%) | 28 (30.8%) |
| Total | 1,842 (56.1%) | 1,443 (43.9%) |
Housing Structures by Number of Rooms in Ketchikan
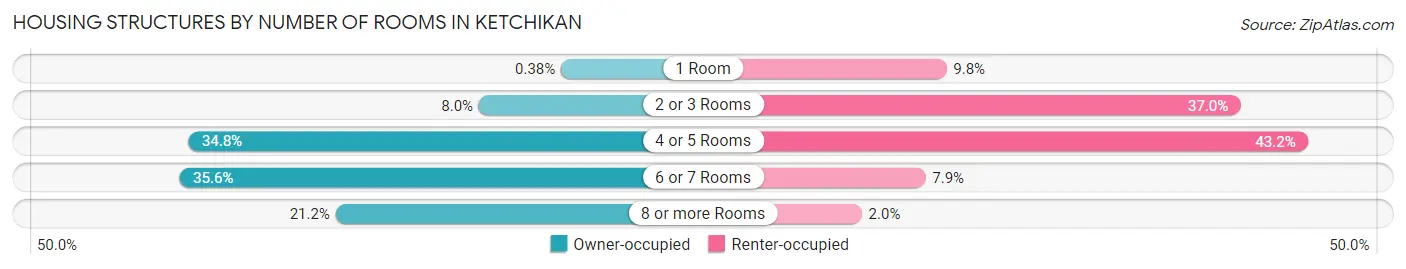
| Number of Rooms | Owner-occupied | Renter-occupied |
| 1 Room | 7 (0.4%) | 142 (9.8%) |
| 2 or 3 Rooms | 147 (8.0%) | 534 (37.0%) |
| 4 or 5 Rooms | 641 (34.8%) | 624 (43.2%) |
| 6 or 7 Rooms | 656 (35.6%) | 114 (7.9%) |
| 8 or more Rooms | 391 (21.2%) | 29 (2.0%) |
| Total | 1,842 (100.0%) | 1,443 (100.0%) |
Housing Structure by Heating Type in Ketchikan
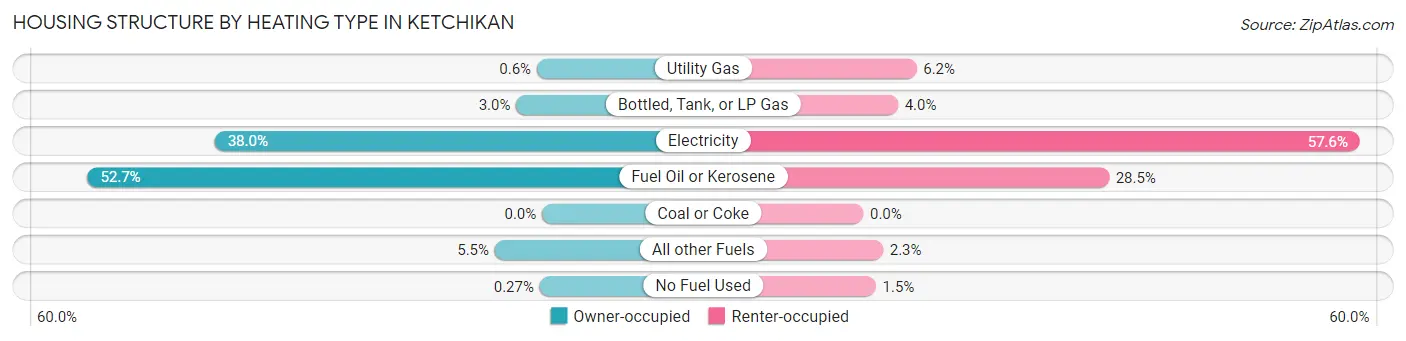
| Heating Type | Owner-occupied | Renter-occupied |
| Utility Gas | 11 (0.6%) | 89 (6.2%) |
| Bottled, Tank, or LP Gas | 55 (3.0%) | 58 (4.0%) |
| Electricity | 699 (38.0%) | 831 (57.6%) |
| Fuel Oil or Kerosene | 971 (52.7%) | 411 (28.5%) |
| Coal or Coke | 0 (0.0%) | 0 (0.0%) |
| All other Fuels | 101 (5.5%) | 33 (2.3%) |
| No Fuel Used | 5 (0.3%) | 21 (1.5%) |
| Total | 1,842 (100.0%) | 1,443 (100.0%) |
Household Vehicle Usage in Ketchikan
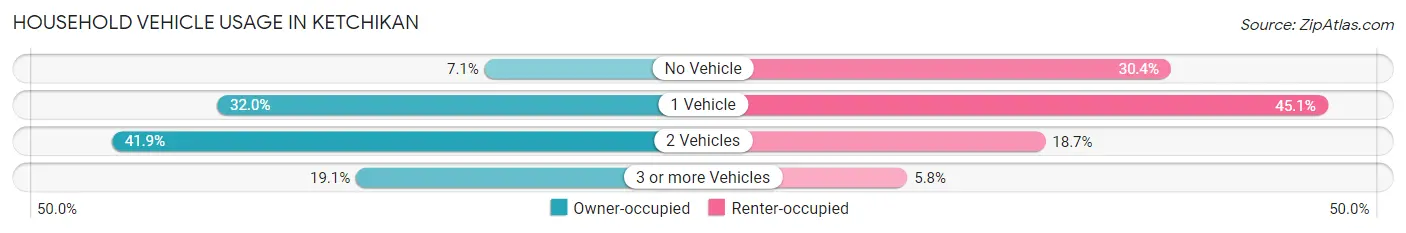
| Vehicles per Household | Owner-occupied | Renter-occupied |
| No Vehicle | 130 (7.1%) | 439 (30.4%) |
| 1 Vehicle | 590 (32.0%) | 650 (45.1%) |
| 2 Vehicles | 771 (41.9%) | 270 (18.7%) |
| 3 or more Vehicles | 351 (19.1%) | 84 (5.8%) |
| Total | 1,842 (100.0%) | 1,443 (100.0%) |
Real Estate & Mortgages in Ketchikan
Real Estate and Mortgage Overview in Ketchikan
| Characteristic | Without Mortgage | With Mortgage |
| Housing Units | 673 | 1,169 |
| Median Property Value | $259,700 | $342,900 |
| Median Household Income | $61,058 | $450 |
| Monthly Housing Costs | $619 | $188 |
| Real Estate Taxes | $2,032 | $45 |
Property Value by Mortgage Status in Ketchikan
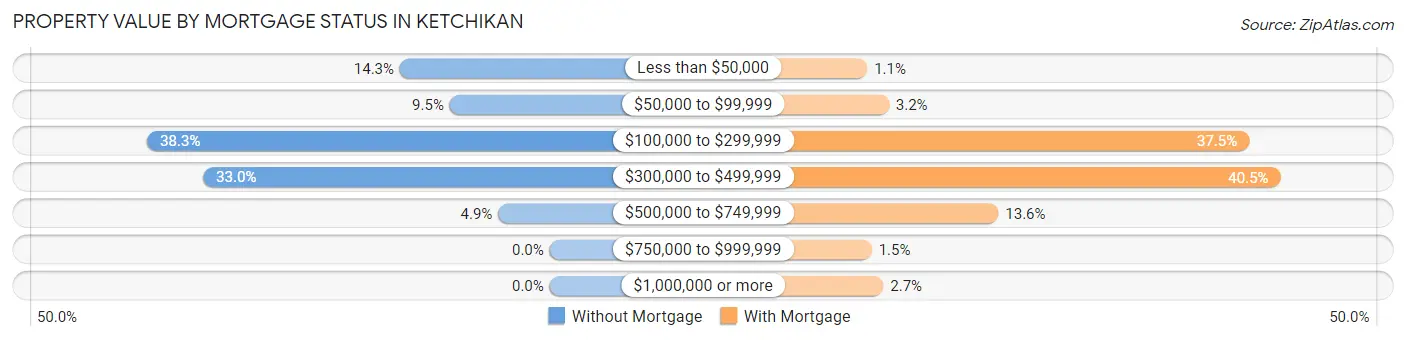
| Property Value | Without Mortgage | With Mortgage |
| Less than $50,000 | 96 (14.3%) | 13 (1.1%) |
| $50,000 to $99,999 | 64 (9.5%) | 37 (3.2%) |
| $100,000 to $299,999 | 258 (38.3%) | 438 (37.5%) |
| $300,000 to $499,999 | 222 (33.0%) | 473 (40.5%) |
| $500,000 to $749,999 | 33 (4.9%) | 159 (13.6%) |
| $750,000 to $999,999 | 0 (0.0%) | 18 (1.5%) |
| $1,000,000 or more | 0 (0.0%) | 31 (2.6%) |
| Total | 673 (100.0%) | 1,169 (100.0%) |
Household Income by Mortgage Status in Ketchikan
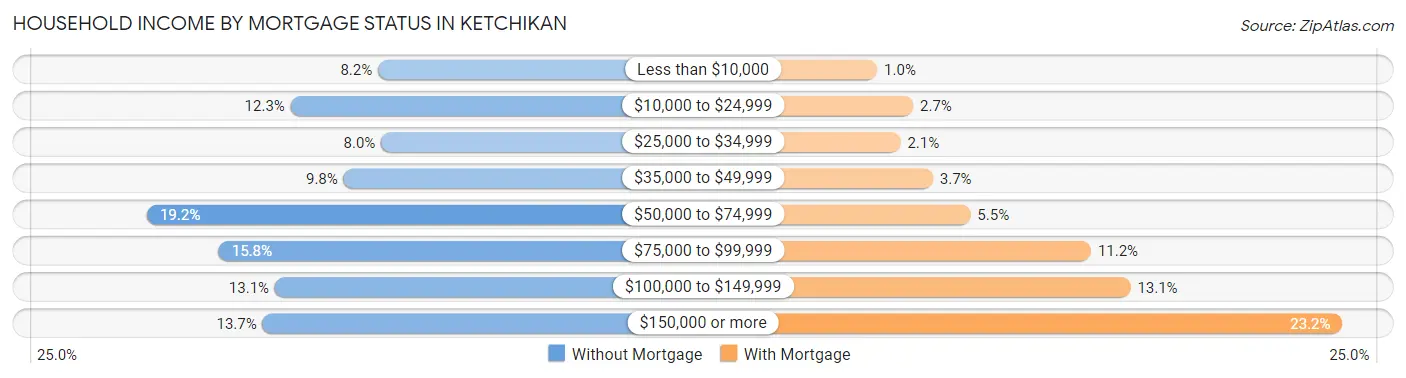
| Household Income | Without Mortgage | With Mortgage |
| Less than $10,000 | 55 (8.2%) | 12 (1.0%) |
| $10,000 to $24,999 | 83 (12.3%) | 32 (2.7%) |
| $25,000 to $34,999 | 54 (8.0%) | 25 (2.1%) |
| $35,000 to $49,999 | 66 (9.8%) | 43 (3.7%) |
| $50,000 to $74,999 | 129 (19.2%) | 64 (5.5%) |
| $75,000 to $99,999 | 106 (15.8%) | 131 (11.2%) |
| $100,000 to $149,999 | 88 (13.1%) | 153 (13.1%) |
| $150,000 or more | 92 (13.7%) | 271 (23.2%) |
| Total | 673 (100.0%) | 1,169 (100.0%) |
Property Value to Household Income Ratio in Ketchikan
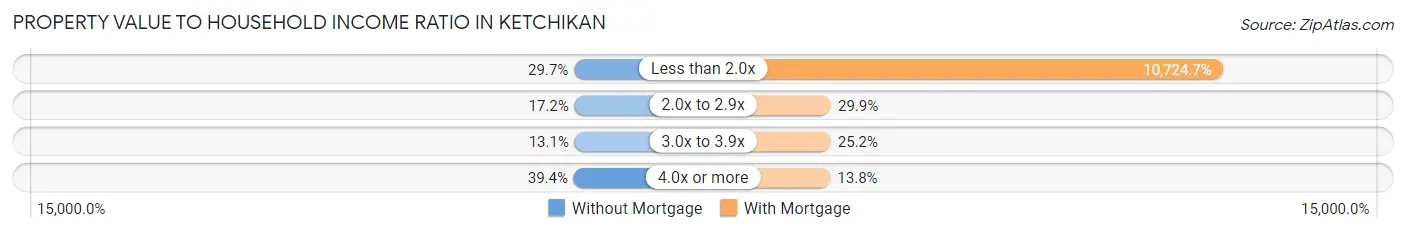
| Value-to-Income Ratio | Without Mortgage | With Mortgage |
| Less than 2.0x | 200 (29.7%) | 125,372 (10,724.7%) |
| 2.0x to 2.9x | 116 (17.2%) | 349 (29.8%) |
| 3.0x to 3.9x | 88 (13.1%) | 295 (25.2%) |
| 4.0x or more | 265 (39.4%) | 161 (13.8%) |
| Total | 673 (100.0%) | 1,169 (100.0%) |
Real Estate Taxes by Mortgage Status in Ketchikan
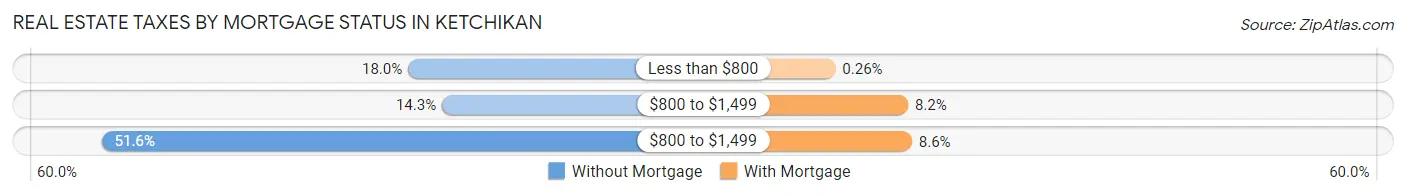
| Property Taxes | Without Mortgage | With Mortgage |
| Less than $800 | 121 (18.0%) | 3 (0.3%) |
| $800 to $1,499 | 96 (14.3%) | 96 (8.2%) |
| $800 to $1,499 | 347 (51.6%) | 101 (8.6%) |
| Total | 673 (100.0%) | 1,169 (100.0%) |
Health & Disability in Ketchikan
Health Insurance Coverage by Age in Ketchikan
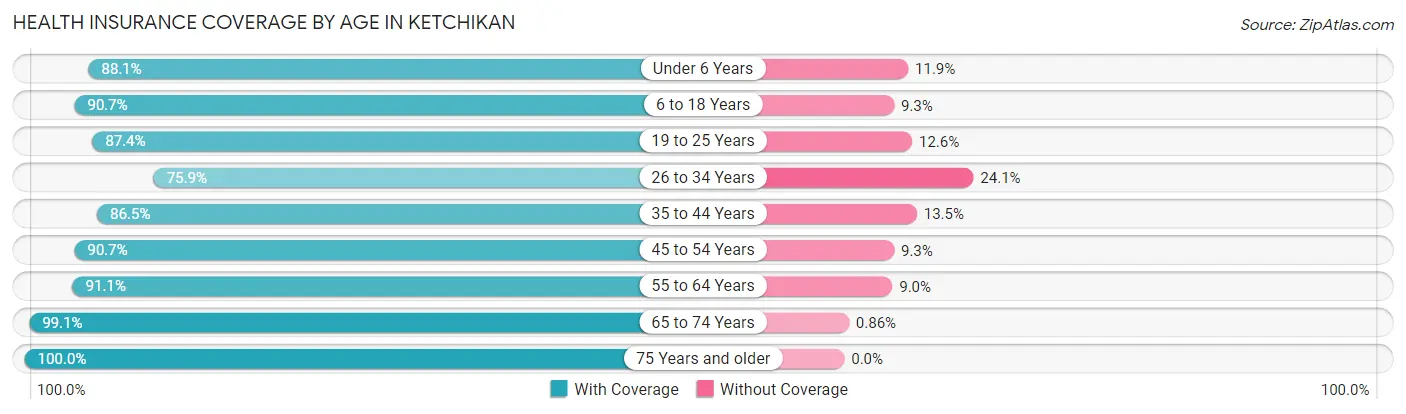
| Age Bracket | With Coverage | Without Coverage |
| Under 6 Years | 422 (88.1%) | 57 (11.9%) |
| 6 to 18 Years | 1,202 (90.7%) | 123 (9.3%) |
| 19 to 25 Years | 650 (87.4%) | 94 (12.6%) |
| 26 to 34 Years | 886 (75.9%) | 281 (24.1%) |
| 35 to 44 Years | 921 (86.5%) | 144 (13.5%) |
| 45 to 54 Years | 724 (90.7%) | 74 (9.3%) |
| 55 to 64 Years | 1,078 (91.0%) | 106 (8.9%) |
| 65 to 74 Years | 809 (99.1%) | 7 (0.9%) |
| 75 Years and older | 392 (100.0%) | 0 (0.0%) |
| Total | 7,084 (88.9%) | 886 (11.1%) |
Health Insurance Coverage by Citizenship Status in Ketchikan
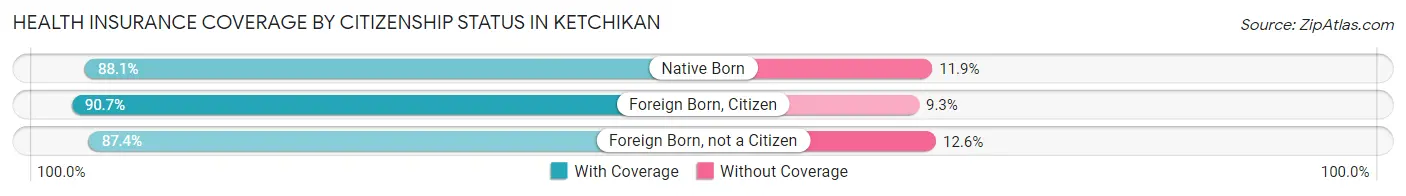
| Citizenship Status | With Coverage | Without Coverage |
| Native Born | 422 (88.1%) | 57 (11.9%) |
| Foreign Born, Citizen | 1,202 (90.7%) | 123 (9.3%) |
| Foreign Born, not a Citizen | 650 (87.4%) | 94 (12.6%) |
Health Insurance Coverage by Household Income in Ketchikan
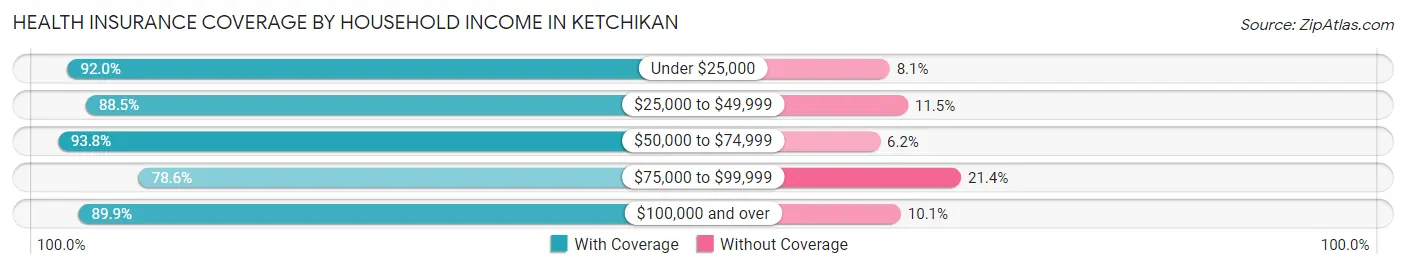
| Household Income | With Coverage | Without Coverage |
| Under $25,000 | 845 (91.9%) | 74 (8.1%) |
| $25,000 to $49,999 | 987 (88.5%) | 128 (11.5%) |
| $50,000 to $74,999 | 1,082 (93.8%) | 72 (6.2%) |
| $75,000 to $99,999 | 955 (78.6%) | 260 (21.4%) |
| $100,000 and over | 3,080 (89.9%) | 347 (10.1%) |
Public vs Private Health Insurance Coverage by Age in Ketchikan
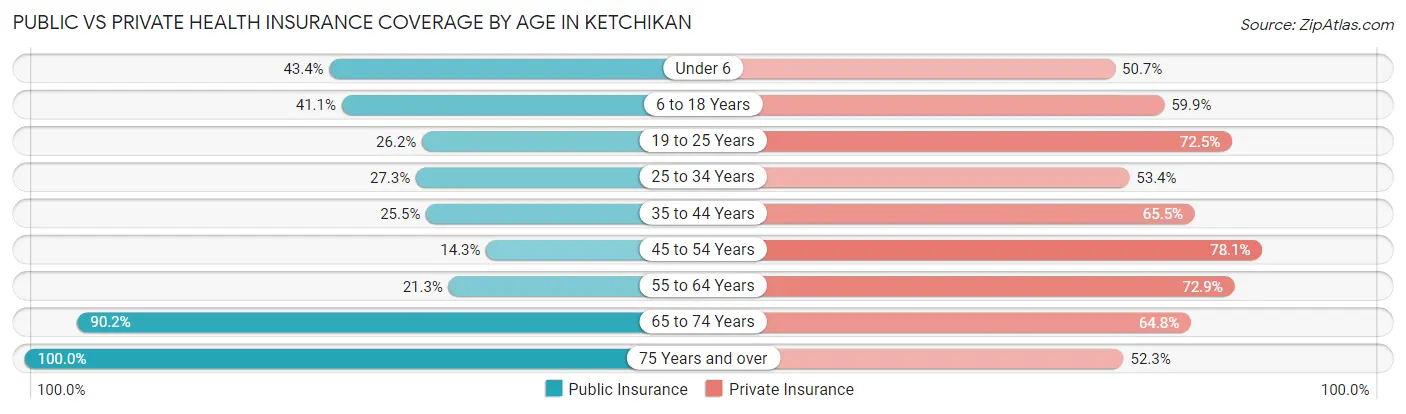
| Age Bracket | Public Insurance | Private Insurance |
| Under 6 | 208 (43.4%) | 243 (50.7%) |
| 6 to 18 Years | 545 (41.1%) | 793 (59.9%) |
| 19 to 25 Years | 195 (26.2%) | 539 (72.5%) |
| 25 to 34 Years | 319 (27.3%) | 623 (53.4%) |
| 35 to 44 Years | 271 (25.5%) | 698 (65.5%) |
| 45 to 54 Years | 114 (14.3%) | 623 (78.1%) |
| 55 to 64 Years | 252 (21.3%) | 863 (72.9%) |
| 65 to 74 Years | 736 (90.2%) | 529 (64.8%) |
| 75 Years and over | 392 (100.0%) | 205 (52.3%) |
| Total | 3,032 (38.0%) | 5,116 (64.2%) |
Disability Status by Sex by Age in Ketchikan
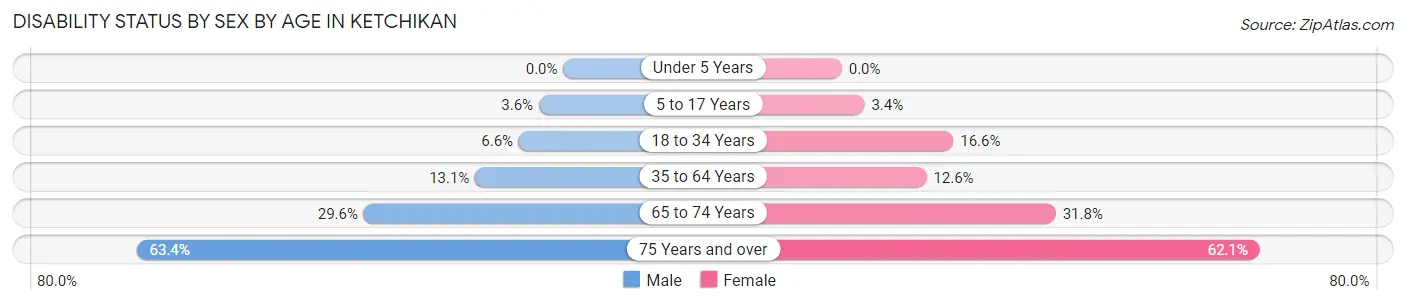
| Age Bracket | Male | Female |
| Under 5 Years | 0 (0.0%) | 0 (0.0%) |
| 5 to 17 Years | 25 (3.6%) | 21 (3.4%) |
| 18 to 34 Years | 69 (6.6%) | 154 (16.6%) |
| 35 to 64 Years | 199 (13.1%) | 192 (12.6%) |
| 65 to 74 Years | 128 (29.6%) | 122 (31.8%) |
| 75 Years and over | 83 (63.4%) | 162 (62.1%) |
Disability Class by Sex by Age in Ketchikan
Disability Class: Hearing Difficulty
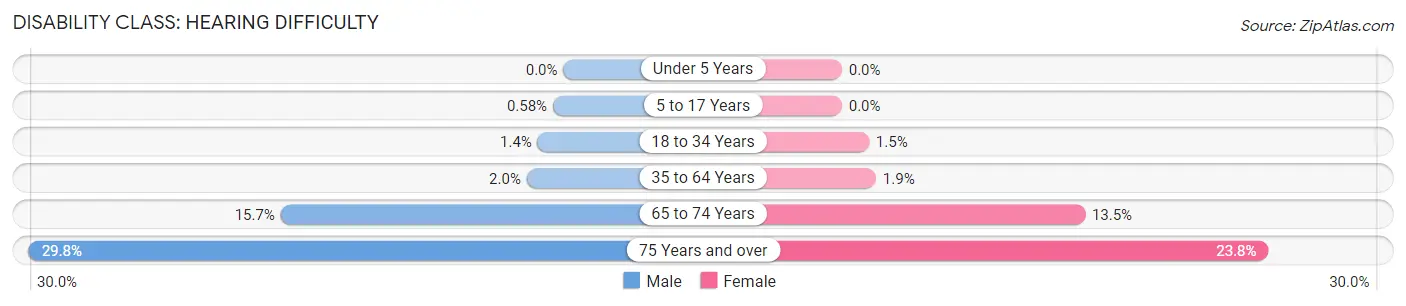
| Age Bracket | Male | Female |
| Under 5 Years | 0 (0.0%) | 0 (0.0%) |
| 5 to 17 Years | 4 (0.6%) | 0 (0.0%) |
| 18 to 34 Years | 15 (1.4%) | 14 (1.5%) |
| 35 to 64 Years | 31 (2.0%) | 29 (1.9%) |
| 65 to 74 Years | 68 (15.7%) | 52 (13.5%) |
| 75 Years and over | 39 (29.8%) | 62 (23.7%) |
Disability Class: Vision Difficulty
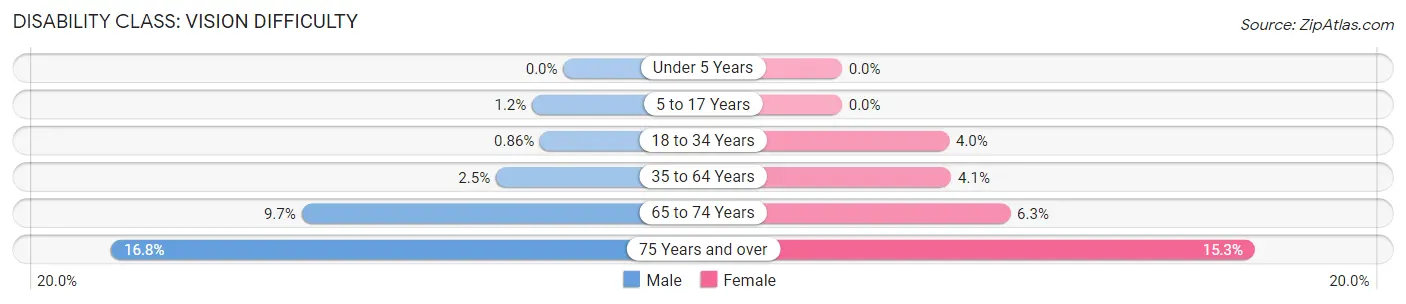
| Age Bracket | Male | Female |
| Under 5 Years | 0 (0.0%) | 0 (0.0%) |
| 5 to 17 Years | 8 (1.2%) | 0 (0.0%) |
| 18 to 34 Years | 9 (0.9%) | 37 (4.0%) |
| 35 to 64 Years | 38 (2.5%) | 62 (4.1%) |
| 65 to 74 Years | 42 (9.7%) | 24 (6.2%) |
| 75 Years and over | 22 (16.8%) | 40 (15.3%) |
Disability Class: Cognitive Difficulty
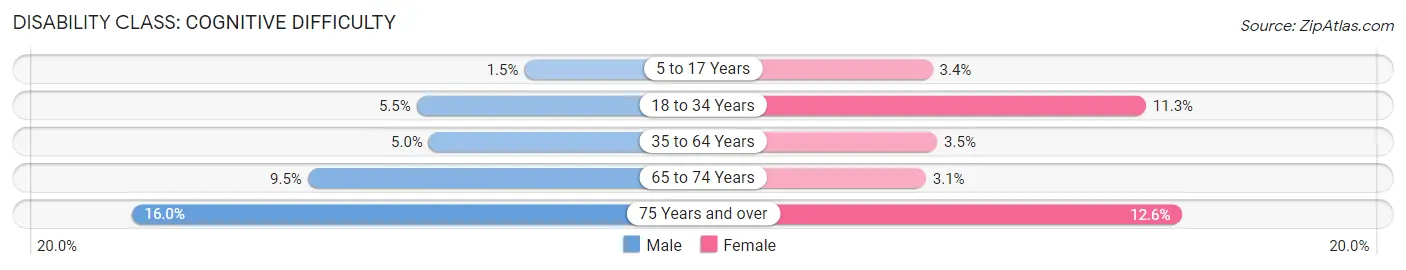
| Age Bracket | Male | Female |
| 5 to 17 Years | 10 (1.5%) | 21 (3.4%) |
| 18 to 34 Years | 57 (5.4%) | 105 (11.3%) |
| 35 to 64 Years | 76 (5.0%) | 54 (3.5%) |
| 65 to 74 Years | 41 (9.5%) | 12 (3.1%) |
| 75 Years and over | 21 (16.0%) | 33 (12.6%) |
Disability Class: Ambulatory Difficulty
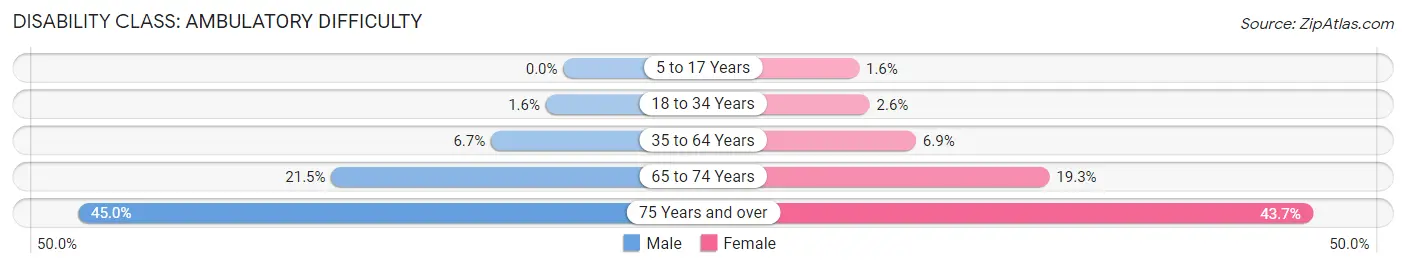
| Age Bracket | Male | Female |
| 5 to 17 Years | 0 (0.0%) | 10 (1.6%) |
| 18 to 34 Years | 17 (1.6%) | 24 (2.6%) |
| 35 to 64 Years | 102 (6.7%) | 105 (6.9%) |
| 65 to 74 Years | 93 (21.5%) | 74 (19.3%) |
| 75 Years and over | 59 (45.0%) | 114 (43.7%) |
Disability Class: Self-Care Difficulty
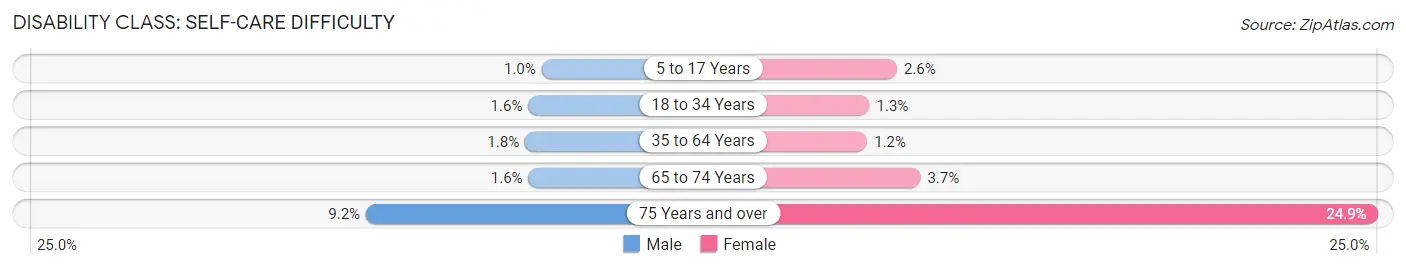
| Age Bracket | Male | Female |
| 5 to 17 Years | 7 (1.0%) | 16 (2.6%) |
| 18 to 34 Years | 17 (1.6%) | 12 (1.3%) |
| 35 to 64 Years | 27 (1.8%) | 18 (1.2%) |
| 65 to 74 Years | 7 (1.6%) | 14 (3.6%) |
| 75 Years and over | 12 (9.2%) | 65 (24.9%) |
Technology Access in Ketchikan
Computing Device Access in Ketchikan
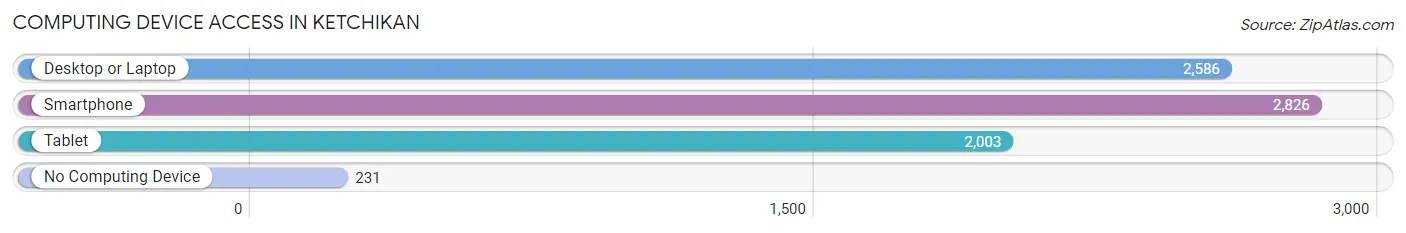
| Device Type | # Households | % Households |
| Desktop or Laptop | 2,586 | 78.7% |
| Smartphone | 2,826 | 86.0% |
| Tablet | 2,003 | 61.0% |
| No Computing Device | 231 | 7.0% |
| Total | 3,285 | 100.0% |
Internet Access in Ketchikan
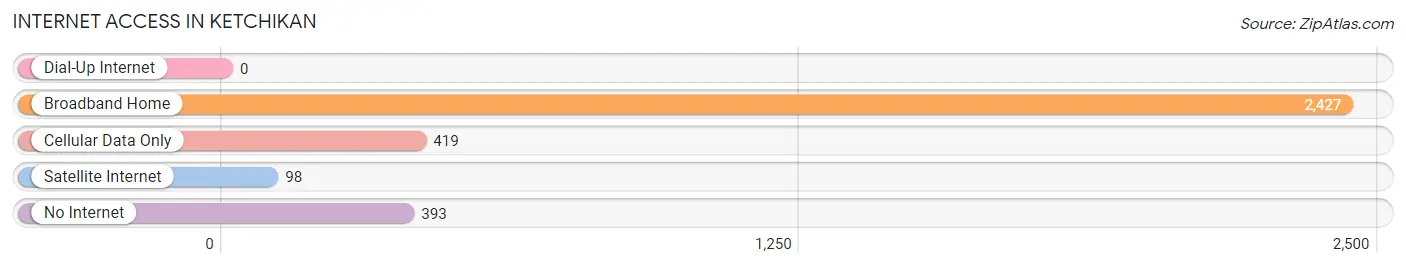
| Internet Type | # Households | % Households |
| Dial-Up Internet | 0 | 0.0% |
| Broadband Home | 2,427 | 73.9% |
| Cellular Data Only | 419 | 12.8% |
| Satellite Internet | 98 | 3.0% |
| No Internet | 393 | 12.0% |
| Total | 3,285 | 100.0% |
Ketchikan Summary
Ketchikan, Alaska is a small city located in the southeastern part of the state. It is the fifth-largest city in Alaska and the largest city in the Ketchikan Gateway Borough. The city is situated on Revillagigedo Island, which is part of the Alexander Archipelago in the Inside Passage of the Pacific Ocean. Ketchikan is known for its abundant natural beauty, its rich cultural heritage, and its vibrant economy.
History
Ketchikan has a long and rich history. The area has been inhabited by the Tlingit people for thousands of years. The first European settlers arrived in the late 19th century, and the city was officially incorporated in 1900. Ketchikan quickly became a major port of call for ships traveling between Seattle and Alaska. The city was also a major center for the salmon canning industry, which was a major source of employment and economic activity in the area.
In the early 20th century, Ketchikan was a major hub for the Alaska gold rush. The city was also a major center for the timber industry, which was a major source of employment and economic activity in the area.
Geography
Ketchikan is located on Revillagigedo Island, which is part of the Alexander Archipelago in the Inside Passage of the Pacific Ocean. The city is situated on the western side of the island, and is surrounded by the Tongass National Forest. The city is located at the mouth of the Ketchikan River, which is the largest river in the area. The city is also located near several other rivers, including the Stikine, Unuk, and Taku Rivers.
The city has a humid subtropical climate, with mild winters and warm summers. The average annual temperature is around 50°F (10°C). The city receives an average of over 100 inches (254 cm) of precipitation per year, making it one of the wettest cities in the United States.
Economy
Ketchikan’s economy is largely based on tourism, fishing, and timber. The city is a major port of call for cruise ships traveling between Seattle and Alaska, and is a popular destination for tourists. The city is also home to several seafood processing plants, which process salmon, halibut, and other fish. The timber industry is also a major source of employment and economic activity in the area.
Demographics
As of the 2010 census, Ketchikan had a population of 8,050. The city is predominantly white (83.3%), with smaller percentages of Native American (7.2%), Asian (2.2%), and African American (1.2%) residents. The median household income in the city is $50,945, and the median home value is $219,400. The city has a high rate of poverty, with 22.3% of the population living below the poverty line.
Ketchikan is a diverse and vibrant city with a rich cultural heritage. The city is home to a variety of attractions, including the Totem Heritage Center, the Tongass Historical Museum, and the Southeast Alaska Discovery Center. The city is also home to a variety of outdoor activities, including fishing, hiking, and kayaking. Ketchikan is a great place to visit, and is a great place to live.
Common Questions
What is Per Capita Income in Ketchikan?
Per Capita income in Ketchikan is $41,057.
What is the Median Family Income in Ketchikan?
Median Family Income in Ketchikan is $95,000.
What is the Median Household income in Ketchikan?
Median Household Income in Ketchikan is $73,512.
What is Income or Wage Gap in Ketchikan?
Income or Wage Gap in Ketchikan is 25.5%.
Women in Ketchikan earn 74.5 cents for every dollar earned by a man.
What is Family Income Deficit in Ketchikan?
Family Income Deficit in Ketchikan is $11,732.
Families that are below poverty line in Ketchikan earn $11,732 less on average than the poverty threshold level.
What is Inequality or Gini Index in Ketchikan?
Inequality or Gini Index in Ketchikan is 0.48.
What is the Total Population of Ketchikan?
Total Population of Ketchikan is 8,168.
What is the Total Male Population of Ketchikan?
Total Male Population of Ketchikan is 4,208.
What is the Total Female Population of Ketchikan?
Total Female Population of Ketchikan is 3,960.
What is the Ratio of Males per 100 Females in Ketchikan?
There are 106.26 Males per 100 Females in Ketchikan.
What is the Ratio of Females per 100 Males in Ketchikan?
There are 94.11 Females per 100 Males in Ketchikan.
What is the Median Population Age in Ketchikan?
Median Population Age in Ketchikan is 37.0 Years.
What is the Average Family Size in Ketchikan
Average Family Size in Ketchikan is 3.0 People.
What is the Average Household Size in Ketchikan
Average Household Size in Ketchikan is 2.4 People.
How Large is the Labor Force in Ketchikan?
There are 4,450 People in the Labor Forcein in Ketchikan.
What is the Percentage of People in the Labor Force in Ketchikan?
67.2% of People are in the Labor Force in Ketchikan.
What is the Unemployment Rate in Ketchikan?
Unemployment Rate in Ketchikan is 5.1%.