Unalaska, AK Map & Demographics
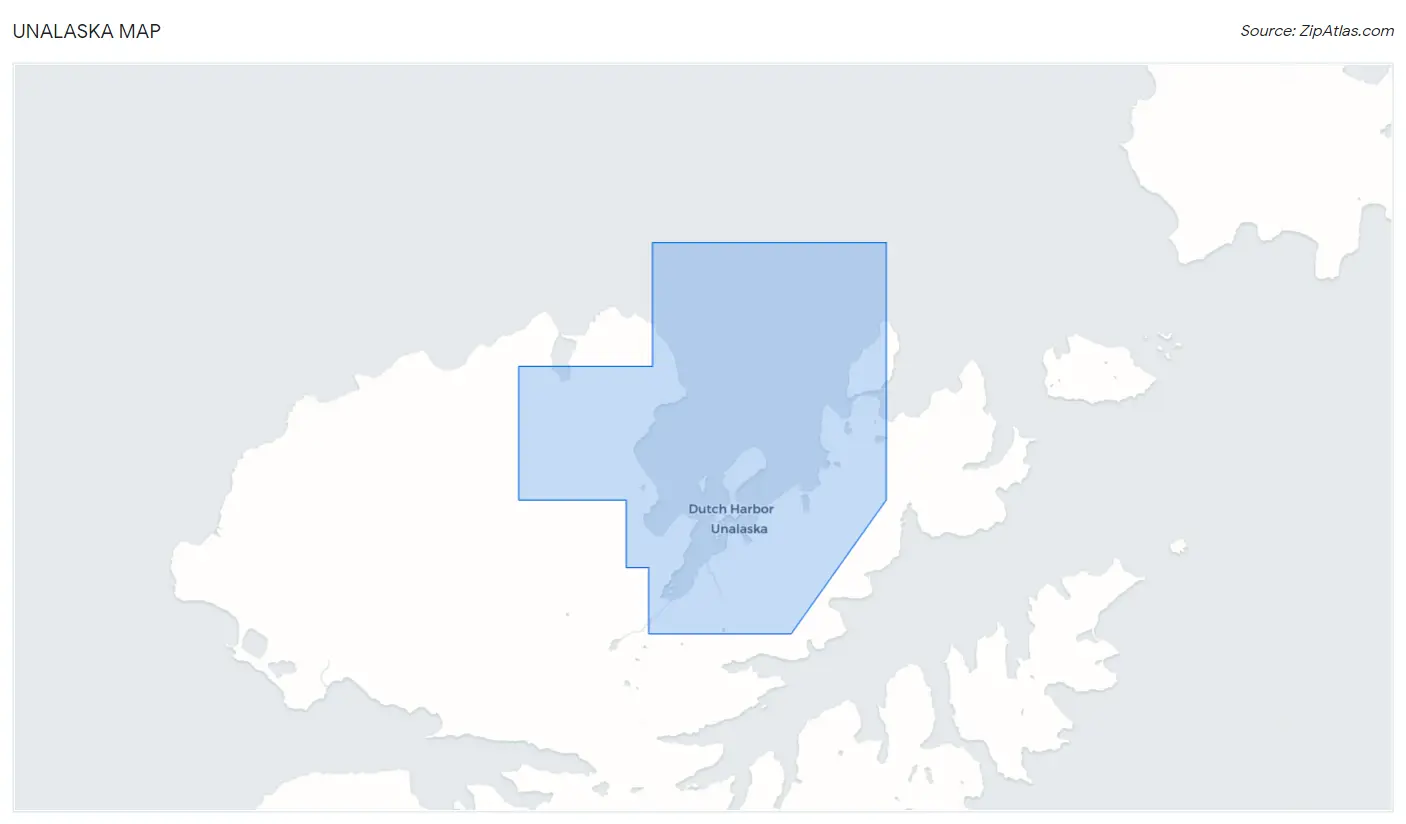
Unalaska Map
Unalaska Overview
$46,296
PER CAPITA INCOME
$119,375
AVG FAMILY INCOME
$104,706
AVG HOUSEHOLD INCOME
32.6%
WAGE / INCOME GAP [ % ]
67.4¢/ $1
WAGE / INCOME GAP [ $ ]
0.31
INEQUALITY / GINI INDEX
4,342
TOTAL POPULATION
2,840
MALE POPULATION
1,502
FEMALE POPULATION
189.08
MALES / 100 FEMALES
52.89
FEMALES / 100 MALES
38.7
MEDIAN AGE
4.8
AVG FAMILY SIZE
3.9
AVG HOUSEHOLD SIZE
3,145
LABOR FORCE [ PEOPLE ]
85.7%
PERCENT IN LABOR FORCE
3.3%
UNEMPLOYMENT RATE
Unalaska Zip Codes
Unalaska Area Codes
Income in Unalaska
Income Overview in Unalaska
Per Capita Income in Unalaska is $46,296, while median incomes of families and households are $119,375 and $104,706 respectively.
| Characteristic | Number | Measure |
| Per Capita Income | 4,342 | $46,296 |
| Median Family Income | 447 | $119,375 |
| Mean Family Income | 447 | $126,940 |
| Median Household Income | 796 | $104,706 |
| Mean Household Income | 796 | $121,897 |
| Income Deficit | 447 | $0 |
| Wage / Income Gap (%) | 4,342 | 32.56% |
| Wage / Income Gap ($) | 4,342 | 67.44¢ per $1 |
| Gini / Inequality Index | 4,342 | 0.31 |
Earnings by Sex in Unalaska
Average Earnings in Unalaska are $45,309, $52,773 for men and $35,588 for women, a difference of 32.6%.
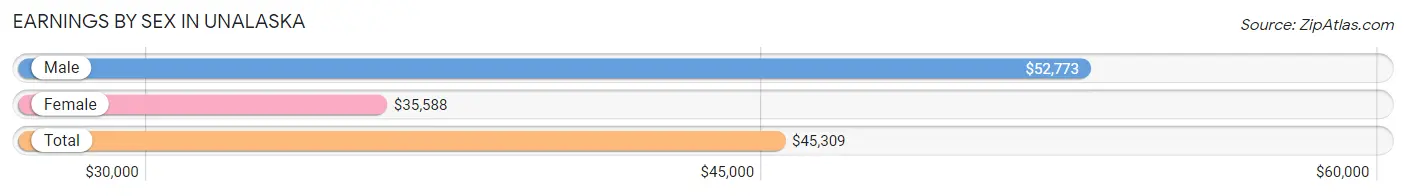
| Sex | Number | Average Earnings |
| Male | 2,398 (73.8%) | $52,773 |
| Female | 850 (26.2%) | $35,588 |
| Total | 3,248 (100.0%) | $45,309 |
Earnings by Sex by Income Bracket in Unalaska
The most common earnings brackets in Unalaska are $100,000+ for men (512 | 21.3%) and $20,000 to $22,499 for women (133 | 15.7%).
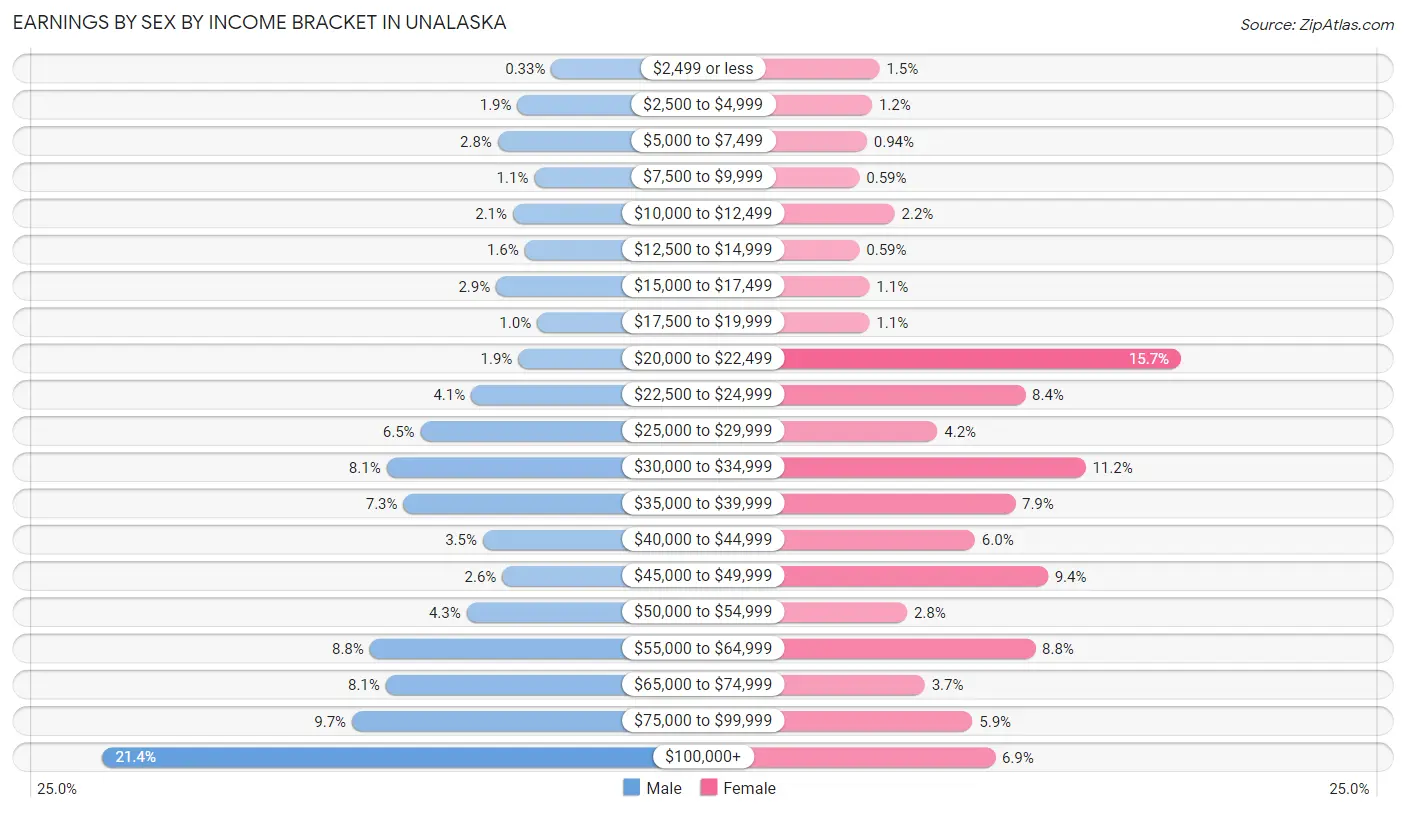
| Income | Male | Female |
| $2,499 or less | 8 (0.3%) | 13 (1.5%) |
| $2,500 to $4,999 | 46 (1.9%) | 10 (1.2%) |
| $5,000 to $7,499 | 68 (2.8%) | 8 (0.9%) |
| $7,500 to $9,999 | 27 (1.1%) | 5 (0.6%) |
| $10,000 to $12,499 | 51 (2.1%) | 19 (2.2%) |
| $12,500 to $14,999 | 38 (1.6%) | 5 (0.6%) |
| $15,000 to $17,499 | 70 (2.9%) | 9 (1.1%) |
| $17,500 to $19,999 | 24 (1.0%) | 9 (1.1%) |
| $20,000 to $22,499 | 45 (1.9%) | 133 (15.7%) |
| $22,500 to $24,999 | 98 (4.1%) | 71 (8.4%) |
| $25,000 to $29,999 | 155 (6.5%) | 36 (4.2%) |
| $30,000 to $34,999 | 193 (8.1%) | 95 (11.2%) |
| $35,000 to $39,999 | 174 (7.3%) | 67 (7.9%) |
| $40,000 to $44,999 | 85 (3.5%) | 51 (6.0%) |
| $45,000 to $49,999 | 63 (2.6%) | 80 (9.4%) |
| $50,000 to $54,999 | 103 (4.3%) | 24 (2.8%) |
| $55,000 to $64,999 | 212 (8.8%) | 75 (8.8%) |
| $65,000 to $74,999 | 194 (8.1%) | 31 (3.6%) |
| $75,000 to $99,999 | 232 (9.7%) | 50 (5.9%) |
| $100,000+ | 512 (21.3%) | 59 (6.9%) |
| Total | 2,398 (100.0%) | 850 (100.0%) |
Earnings by Sex by Educational Attainment in Unalaska
Average earnings in Unalaska are $52,909 for men and $39,667 for women, a difference of 25.0%. Men with an educational attainment of bachelor's degree enjoy the highest average annual earnings of $101,250, while those with less than high school education earn the least with $39,655. Women with an educational attainment of bachelor's degree earn the most with the average annual earnings of $50,179, while those with less than high school education have the smallest earnings of $28,750.
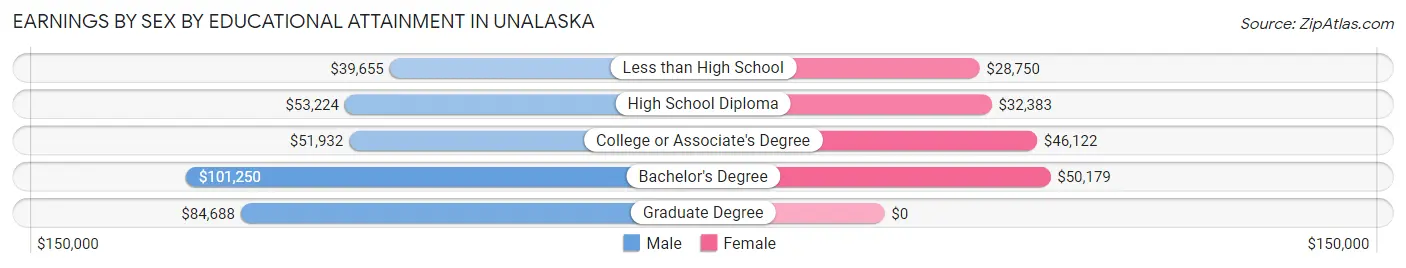
| Educational Attainment | Male Income | Female Income |
| Less than High School | $39,655 | $28,750 |
| High School Diploma | $53,224 | $32,383 |
| College or Associate's Degree | $51,932 | $46,122 |
| Bachelor's Degree | $101,250 | $50,179 |
| Graduate Degree | $84,688 | $0 |
| Total | $52,909 | $39,667 |
Family Income in Unalaska
Family Income Brackets in Unalaska
According to the Unalaska family income data, there are 161 families falling into the $100,000 to $149,999 income range, which is the most common income bracket and makes up 36.0% of all families. Conversely, the $10,000 to $14,999 income bracket is the least frequent group with only 2 families (0.4%) belonging to this category.
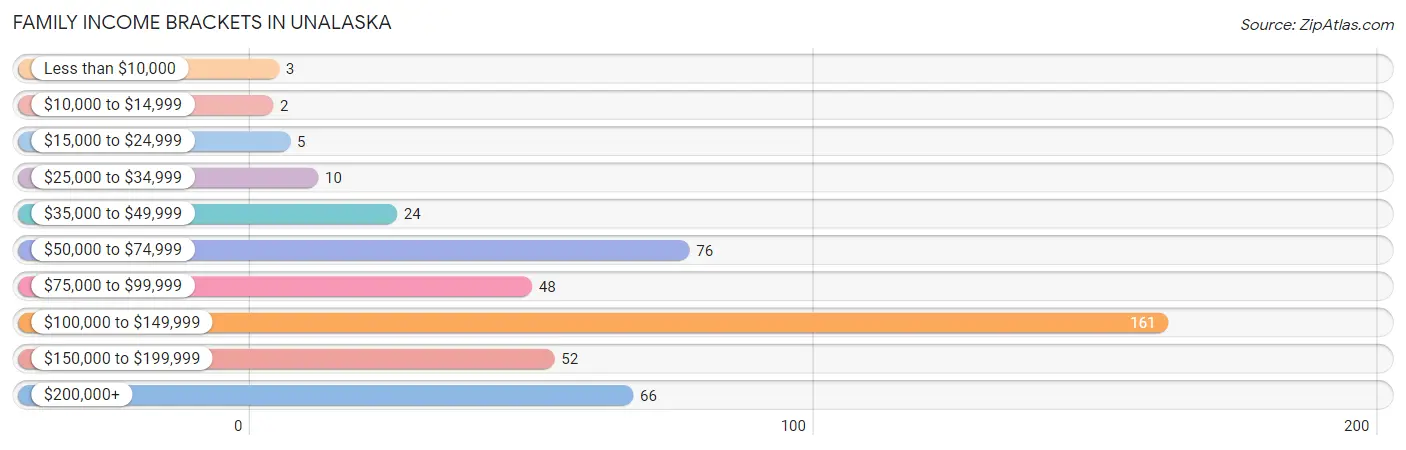
| Income Bracket | # Families | % Families |
| Less than $10,000 | 3 | 0.7% |
| $10,000 to $14,999 | 2 | 0.4% |
| $15,000 to $24,999 | 5 | 1.1% |
| $25,000 to $34,999 | 10 | 2.2% |
| $35,000 to $49,999 | 24 | 5.4% |
| $50,000 to $74,999 | 76 | 17.0% |
| $75,000 to $99,999 | 48 | 10.7% |
| $100,000 to $149,999 | 161 | 36.0% |
| $150,000 to $199,999 | 52 | 11.6% |
| $200,000+ | 66 | 14.8% |
Family Income by Famaliy Size in Unalaska
7+ person families (29 | 6.5%) account for the highest median family income in Unalaska with $250,001 per family, while 2-person families (174 | 38.9%) have the highest median income of $51,000 per family member.
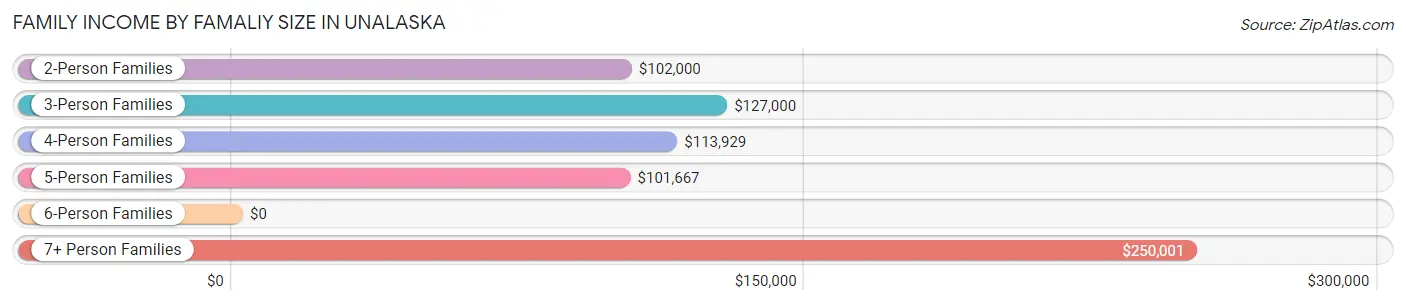
| Income Bracket | # Families | Median Income |
| 2-Person Families | 174 (38.9%) | $102,000 |
| 3-Person Families | 94 (21.0%) | $127,000 |
| 4-Person Families | 110 (24.6%) | $113,929 |
| 5-Person Families | 38 (8.5%) | $101,667 |
| 6-Person Families | 2 (0.4%) | $0 |
| 7+ Person Families | 29 (6.5%) | $250,001 |
| Total | 447 (100.0%) | $119,375 |
Family Income by Number of Earners in Unalaska
The median family income in Unalaska is $119,375, with families comprising 3+ earners (58) having the highest median family income of $228,750, while families with no earners (48) have the lowest median family income of $68,659, accounting for 13.0% and 10.7% of families, respectively.
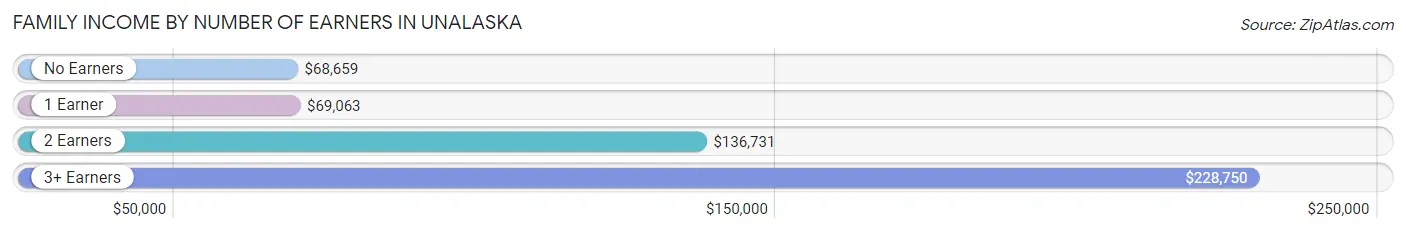
| Number of Earners | # Families | Median Income |
| No Earners | 48 (10.7%) | $68,659 |
| 1 Earner | 111 (24.8%) | $69,063 |
| 2 Earners | 230 (51.4%) | $136,731 |
| 3+ Earners | 58 (13.0%) | $228,750 |
| Total | 447 (100.0%) | $119,375 |
Household Income in Unalaska
Household Income Brackets in Unalaska
With 233 households falling in the category, the $100,000 to $149,999 income range is the most frequent in Unalaska, accounting for 29.3% of all households. In contrast, only 5 households (0.6%) fall into the less than $10,000 income bracket, making it the least populous group.
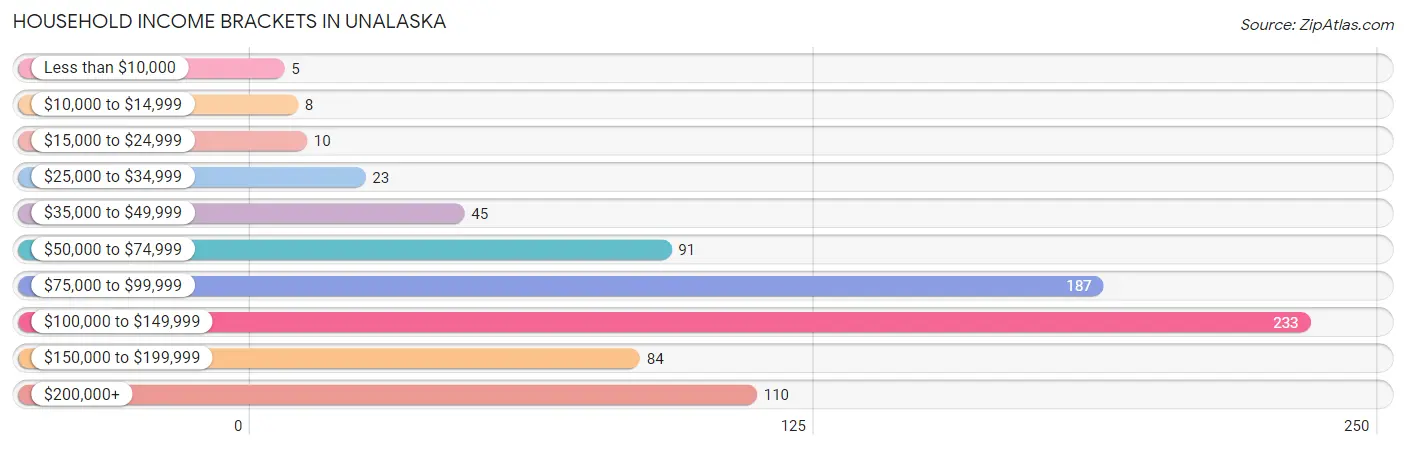
| Income Bracket | # Households | % Households |
| Less than $10,000 | 5 | 0.6% |
| $10,000 to $14,999 | 8 | 1.0% |
| $15,000 to $24,999 | 10 | 1.3% |
| $25,000 to $34,999 | 23 | 2.9% |
| $35,000 to $49,999 | 45 | 5.7% |
| $50,000 to $74,999 | 91 | 11.4% |
| $75,000 to $99,999 | 187 | 23.5% |
| $100,000 to $149,999 | 233 | 29.3% |
| $150,000 to $199,999 | 84 | 10.6% |
| $200,000+ | 110 | 13.8% |
Household Income by Householder Age in Unalaska
The median household income in Unalaska is $104,706, with the highest median household income of $113,355 found in the 45 to 64 years age bracket for the primary householder. A total of 465 households (58.4%) fall into this category. Meanwhile, the 15 to 24 years age bracket for the primary householder has the lowest median household income of $0, with 7 households (0.9%) in this group.
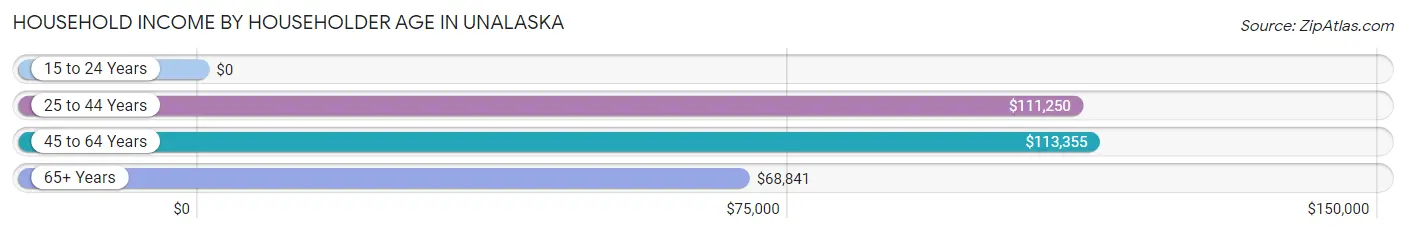
| Income Bracket | # Households | Median Income |
| 15 to 24 Years | 7 (0.9%) | $0 |
| 25 to 44 Years | 226 (28.4%) | $111,250 |
| 45 to 64 Years | 465 (58.4%) | $113,355 |
| 65+ Years | 98 (12.3%) | $68,841 |
| Total | 796 (100.0%) | $104,706 |
Poverty in Unalaska
Income Below Poverty by Sex and Age in Unalaska
With 8.3% poverty level for males and 7.5% for females among the residents of Unalaska, 15 year old males and 75 year old and over females are the most vulnerable to poverty, with 44 males (84.6%) and 26 females (81.2%) in their respective age groups living below the poverty level.
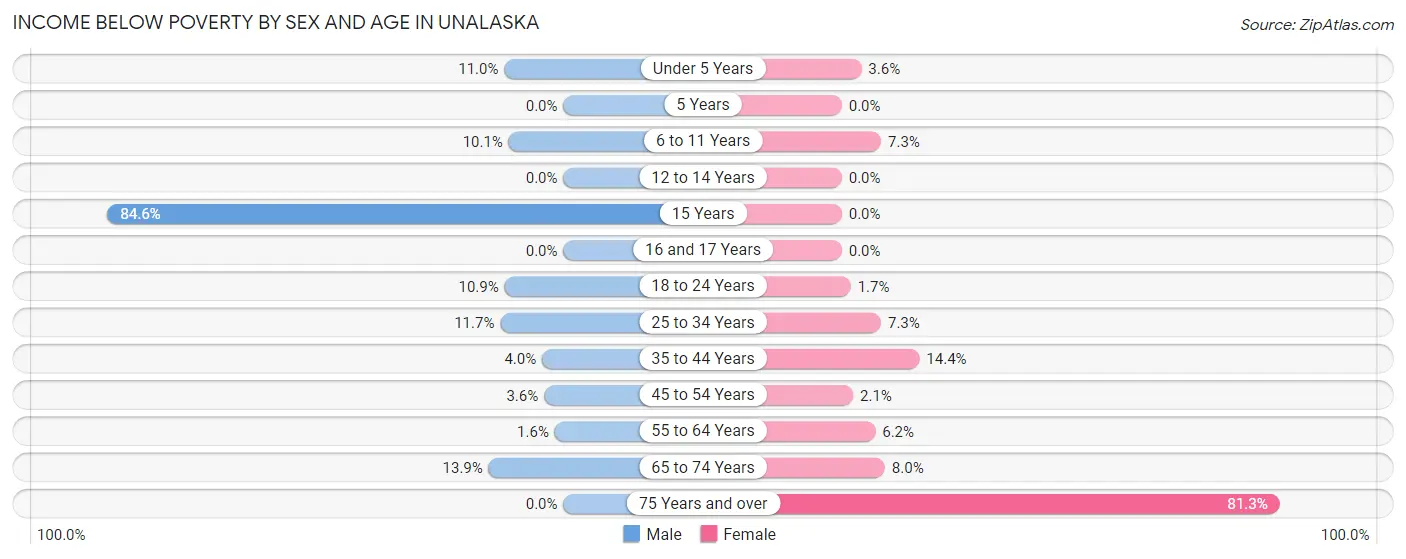
| Age Bracket | Male | Female |
| Under 5 Years | 8 (11.0%) | 4 (3.6%) |
| 5 Years | 0 (0.0%) | 0 (0.0%) |
| 6 to 11 Years | 14 (10.1%) | 10 (7.3%) |
| 12 to 14 Years | 0 (0.0%) | 0 (0.0%) |
| 15 Years | 44 (84.6%) | 0 (0.0%) |
| 16 and 17 Years | 0 (0.0%) | 0 (0.0%) |
| 18 to 24 Years | 31 (10.9%) | 2 (1.7%) |
| 25 to 34 Years | 68 (11.7%) | 11 (7.3%) |
| 35 to 44 Years | 20 (4.0%) | 33 (14.4%) |
| 45 to 54 Years | 24 (3.6%) | 6 (2.1%) |
| 55 to 64 Years | 5 (1.6%) | 13 (6.2%) |
| 65 to 74 Years | 19 (13.9%) | 6 (8.0%) |
| 75 Years and over | 0 (0.0%) | 26 (81.2%) |
| Total | 233 (8.3%) | 111 (7.5%) |
Income Above Poverty by Sex and Age in Unalaska
According to the poverty statistics in Unalaska, males aged 5 years and females aged 5 years are the age groups that are most secure financially, with 100.0% of males and 100.0% of females in these age groups living above the poverty line.
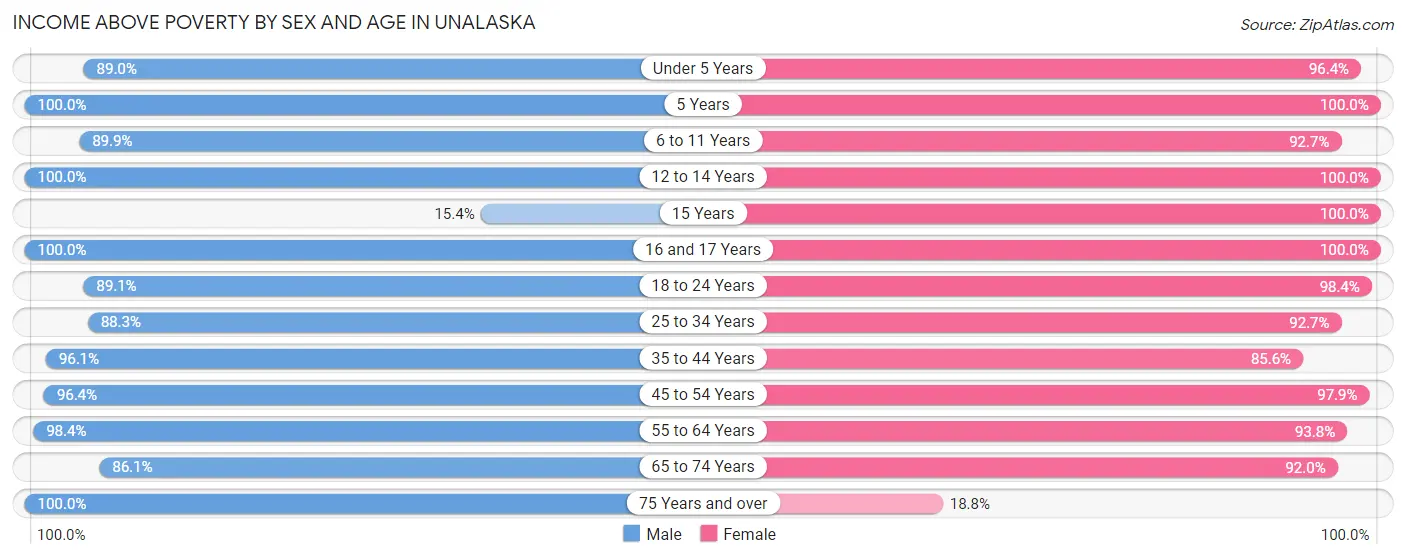
| Age Bracket | Male | Female |
| Under 5 Years | 65 (89.0%) | 106 (96.4%) |
| 5 Years | 6 (100.0%) | 20 (100.0%) |
| 6 to 11 Years | 124 (89.9%) | 127 (92.7%) |
| 12 to 14 Years | 32 (100.0%) | 40 (100.0%) |
| 15 Years | 8 (15.4%) | 22 (100.0%) |
| 16 and 17 Years | 27 (100.0%) | 42 (100.0%) |
| 18 to 24 Years | 253 (89.1%) | 119 (98.4%) |
| 25 to 34 Years | 512 (88.3%) | 140 (92.7%) |
| 35 to 44 Years | 486 (96.1%) | 196 (85.6%) |
| 45 to 54 Years | 646 (96.4%) | 280 (97.9%) |
| 55 to 64 Years | 308 (98.4%) | 196 (93.8%) |
| 65 to 74 Years | 118 (86.1%) | 69 (92.0%) |
| 75 Years and over | 2 (100.0%) | 6 (18.8%) |
| Total | 2,587 (91.7%) | 1,363 (92.5%) |
Income Below Poverty Among Married-Couple Families in Unalaska
The poverty statistics for married-couple families in Unalaska show that 1.8% or 7 of the total 381 families live below the poverty line. Families with 3 or 4 children have the highest poverty rate of 7.7%, comprising of 3 families. On the other hand, families with no children have the lowest poverty rate of 0.0%, which includes 0 families.
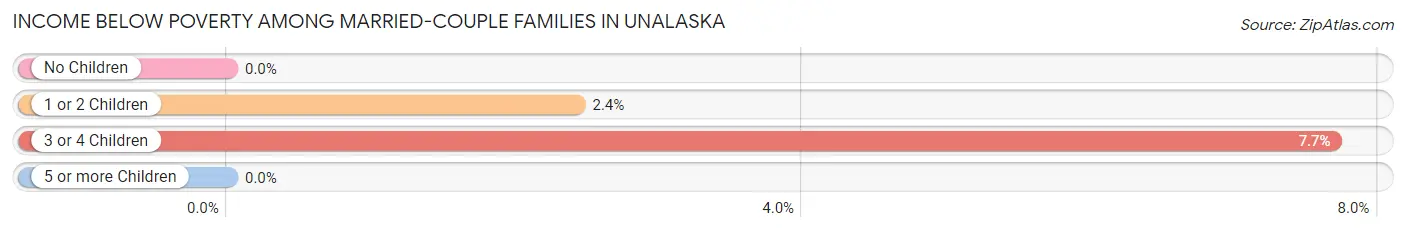
| Children | Above Poverty | Below Poverty |
| No Children | 166 (100.0%) | 0 (0.0%) |
| 1 or 2 Children | 161 (97.6%) | 4 (2.4%) |
| 3 or 4 Children | 36 (92.3%) | 3 (7.7%) |
| 5 or more Children | 11 (100.0%) | 0 (0.0%) |
| Total | 374 (98.2%) | 7 (1.8%) |
Income Below Poverty Among Single-Parent Households in Unalaska
According to the poverty data in Unalaska, 3.3% or 1 single-father households and 13.9% or 5 single-mother households are living below the poverty line. Among single-father households, those with no children have the highest poverty rate, with 1 households (50.0%) experiencing poverty. Likewise, among single-mother households, those with 3 or 4 children have the highest poverty rate, with 3 households (37.5%) falling below the poverty line.
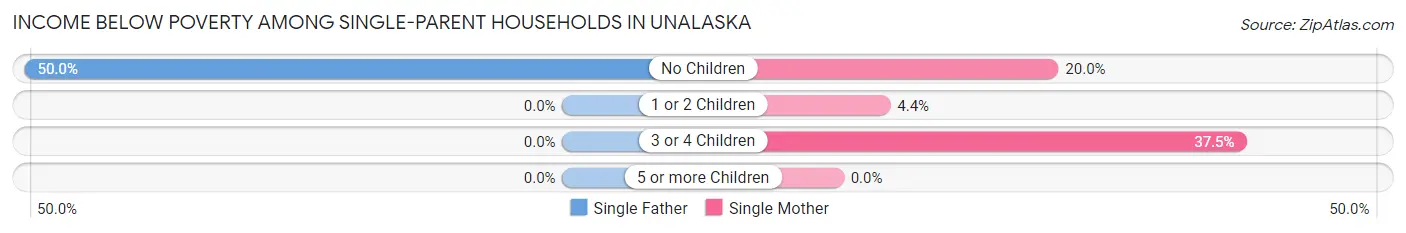
| Children | Single Father | Single Mother |
| No Children | 1 (50.0%) | 1 (20.0%) |
| 1 or 2 Children | 0 (0.0%) | 1 (4.3%) |
| 3 or 4 Children | 0 (0.0%) | 3 (37.5%) |
| 5 or more Children | 0 (0.0%) | 0 (0.0%) |
| Total | 1 (3.3%) | 5 (13.9%) |
Income Below Poverty Among Married-Couple vs Single-Parent Households in Unalaska
The poverty data for Unalaska shows that 7 of the married-couple family households (1.8%) and 6 of the single-parent households (9.1%) are living below the poverty level. Within the married-couple family households, those with 3 or 4 children have the highest poverty rate, with 3 households (7.7%) falling below the poverty line. Among the single-parent households, those with 3 or 4 children have the highest poverty rate, with 3 household (37.5%) living below poverty.
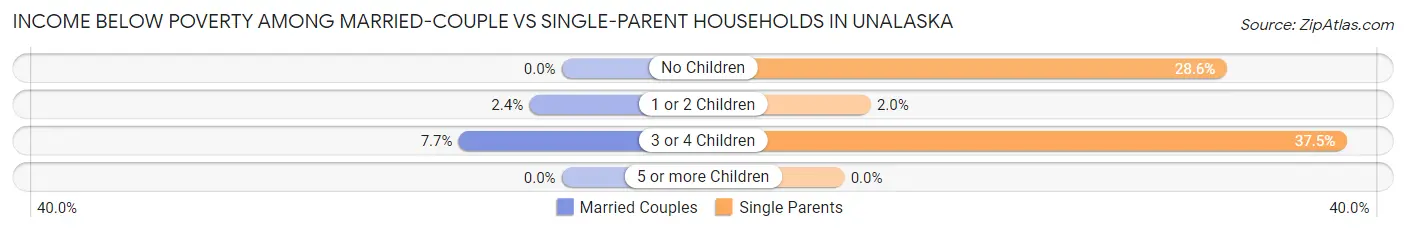
| Children | Married-Couple Families | Single-Parent Households |
| No Children | 0 (0.0%) | 2 (28.6%) |
| 1 or 2 Children | 4 (2.4%) | 1 (2.0%) |
| 3 or 4 Children | 3 (7.7%) | 3 (37.5%) |
| 5 or more Children | 0 (0.0%) | 0 (0.0%) |
| Total | 7 (1.8%) | 6 (9.1%) |
Race in Unalaska
The most populous races in Unalaska are Asian (2,057 | 47.4%), White / Caucasian (1,081 | 24.9%), and Hispanic or Latino (706 | 16.3%).
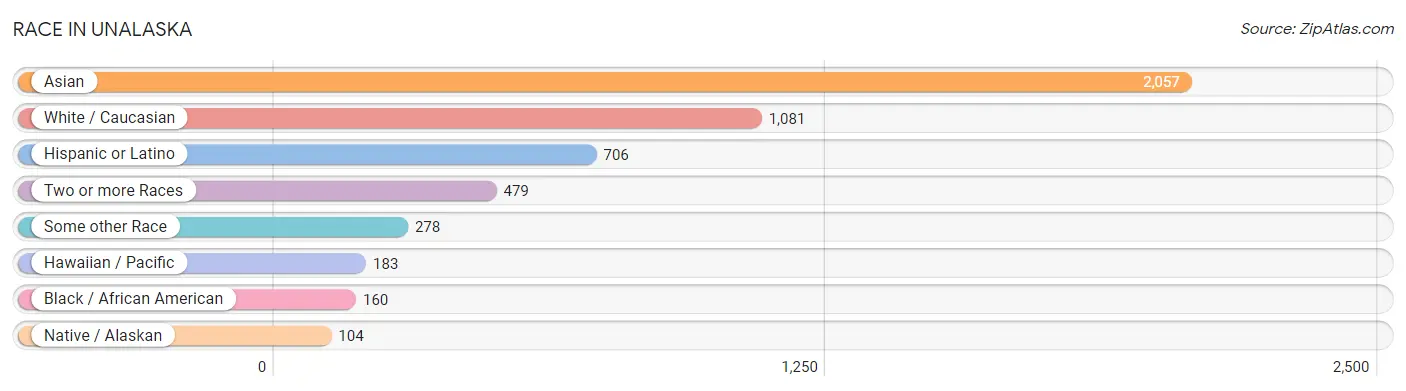
| Race | # Population | % Population |
| Asian | 2,057 | 47.4% |
| Black / African American | 160 | 3.7% |
| Hawaiian / Pacific | 183 | 4.2% |
| Hispanic or Latino | 706 | 16.3% |
| Native / Alaskan | 104 | 2.4% |
| White / Caucasian | 1,081 | 24.9% |
| Two or more Races | 479 | 11.0% |
| Some other Race | 278 | 6.4% |
| Total | 4,342 | 100.0% |
Ancestry in Unalaska
The most populous ancestries reported in Unalaska are Korean (1,984 | 45.7%), Mexican (485 | 11.2%), German (250 | 5.8%), Samoan (187 | 4.3%), and European (166 | 3.8%), together accounting for 70.8% of all Unalaska residents.
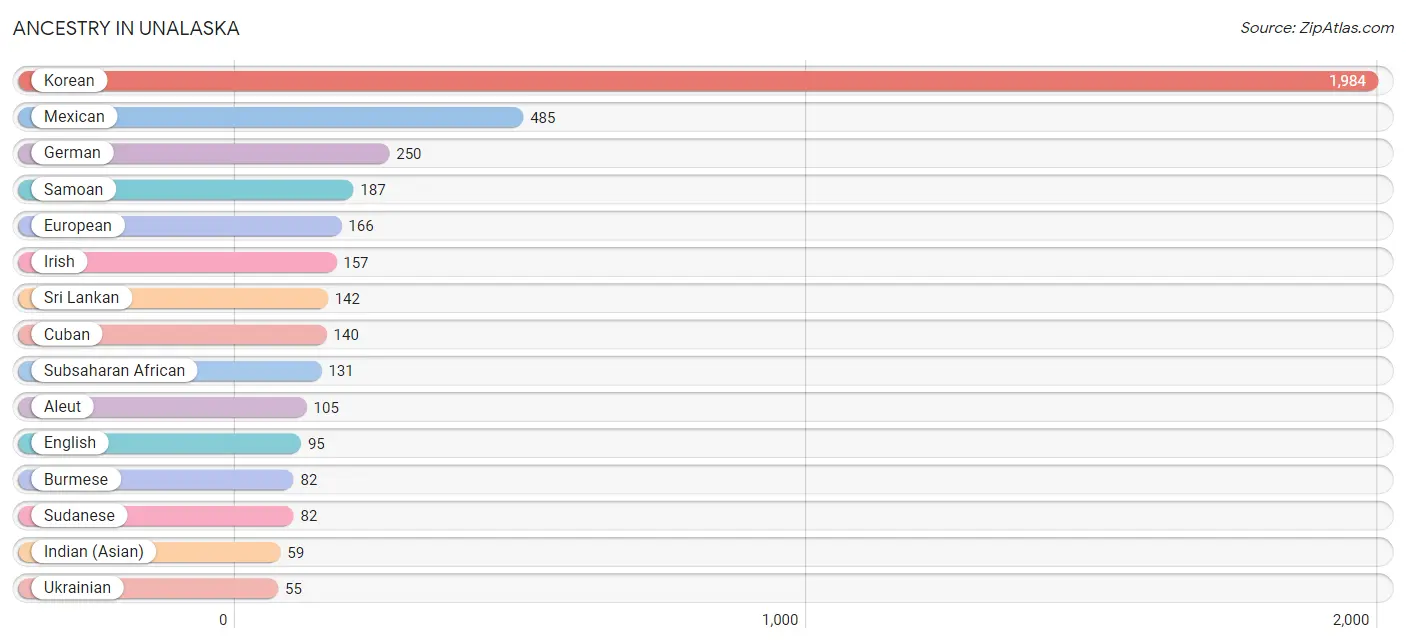
| Ancestry | # Population | % Population |
| African | 27 | 0.6% |
| Alaska Native | 6 | 0.1% |
| Alaskan Athabascan | 2 | 0.1% |
| Aleut | 105 | 2.4% |
| American | 2 | 0.1% |
| Arab | 4 | 0.1% |
| Bangladeshi | 8 | 0.2% |
| Belgian | 3 | 0.1% |
| Bhutanese | 36 | 0.8% |
| Brazilian | 1 | 0.0% |
| British | 11 | 0.3% |
| Burmese | 82 | 1.9% |
| Cajun | 13 | 0.3% |
| Central American | 34 | 0.8% |
| Cherokee | 12 | 0.3% |
| Choctaw | 4 | 0.1% |
| Colombian | 3 | 0.1% |
| Cuban | 140 | 3.2% |
| Czech | 23 | 0.5% |
| Dutch | 29 | 0.7% |
| Dutch West Indian | 4 | 0.1% |
| Eastern European | 7 | 0.2% |
| English | 95 | 2.2% |
| European | 166 | 3.8% |
| Finnish | 7 | 0.2% |
| French | 43 | 1.0% |
| French Canadian | 2 | 0.1% |
| German | 250 | 5.8% |
| Greek | 1 | 0.0% |
| Guamanian / Chamorro | 4 | 0.1% |
| Guatemalan | 17 | 0.4% |
| Haitian | 4 | 0.1% |
| Honduran | 4 | 0.1% |
| Houma | 1 | 0.0% |
| Hungarian | 1 | 0.0% |
| Icelander | 5 | 0.1% |
| Indian (Asian) | 59 | 1.4% |
| Inupiat | 4 | 0.1% |
| Irish | 157 | 3.6% |
| Italian | 42 | 1.0% |
| Jamaican | 15 | 0.4% |
| Korean | 1,984 | 45.7% |
| Laotian | 4 | 0.1% |
| Lithuanian | 18 | 0.4% |
| Macedonian | 33 | 0.8% |
| Mexican | 485 | 11.2% |
| Mexican American Indian | 25 | 0.6% |
| Native Hawaiian | 23 | 0.5% |
| Northern European | 3 | 0.1% |
| Norwegian | 48 | 1.1% |
| Osage | 1 | 0.0% |
| Pakistani | 5 | 0.1% |
| Polish | 30 | 0.7% |
| Portuguese | 5 | 0.1% |
| Pueblo | 1 | 0.0% |
| Puerto Rican | 2 | 0.1% |
| Romanian | 41 | 0.9% |
| Russian | 29 | 0.7% |
| Salvadoran | 13 | 0.3% |
| Samoan | 187 | 4.3% |
| Scandinavian | 3 | 0.1% |
| Scotch-Irish | 19 | 0.4% |
| Scottish | 10 | 0.2% |
| Senegalese | 3 | 0.1% |
| Serbian | 27 | 0.6% |
| Somali | 3 | 0.1% |
| South American | 3 | 0.1% |
| South American Indian | 7 | 0.2% |
| Spaniard | 17 | 0.4% |
| Spanish | 9 | 0.2% |
| Sri Lankan | 142 | 3.3% |
| Subsaharan African | 131 | 3.0% |
| Sudanese | 82 | 1.9% |
| Swedish | 2 | 0.1% |
| Thai | 3 | 0.1% |
| Tlingit-Haida | 3 | 0.1% |
| Ukrainian | 55 | 1.3% |
| Welsh | 27 | 0.6% |
| Yup'ik | 1 | 0.0% | View All 79 Rows |
Immigrants in Unalaska
The most numerous immigrant groups reported in Unalaska came from Asia (1,670 | 38.5%), South Eastern Asia (1,597 | 36.8%), Philippines (1,479 | 34.1%), Latin America (244 | 5.6%), and Central America (174 | 4.0%), together accounting for 118.9% of all Unalaska residents.
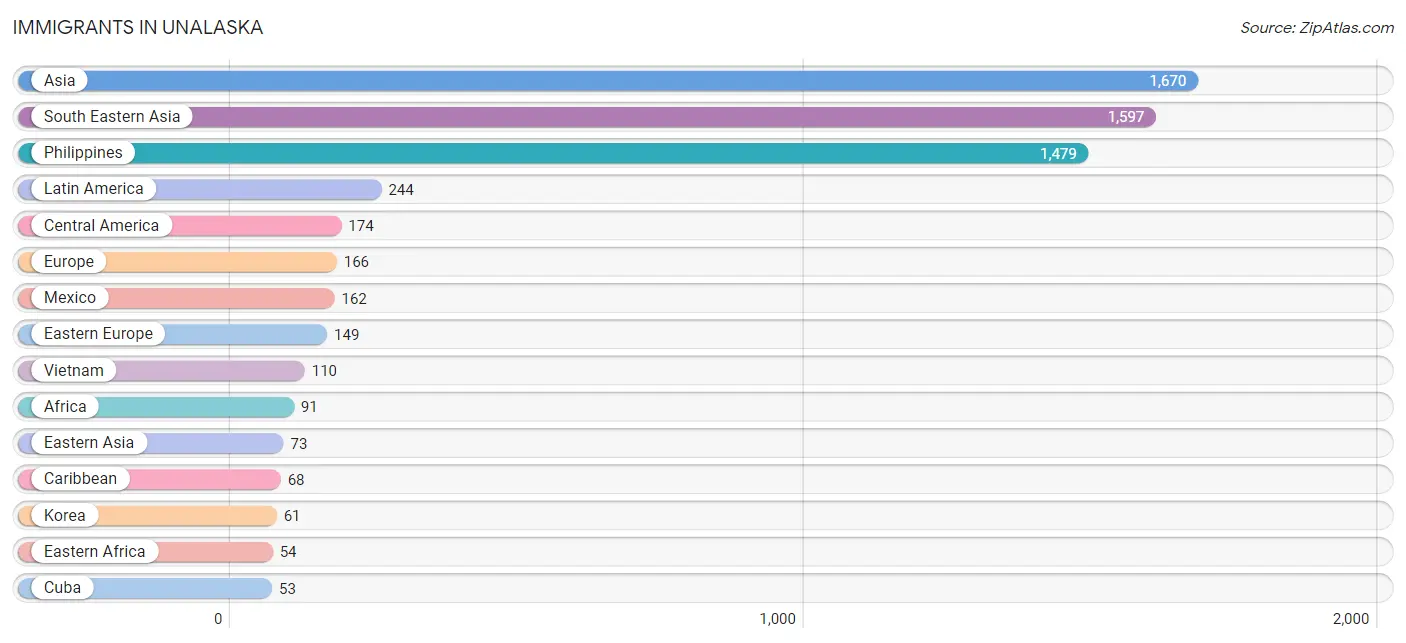
| Immigration Origin | # Population | % Population |
| Africa | 91 | 2.1% |
| Asia | 1,670 | 38.5% |
| Belarus | 1 | 0.0% |
| Bosnia and Herzegovina | 6 | 0.1% |
| Brazil | 1 | 0.0% |
| Canada | 1 | 0.0% |
| Caribbean | 68 | 1.6% |
| Central America | 174 | 4.0% |
| Cuba | 53 | 1.2% |
| Eastern Africa | 54 | 1.2% |
| Eastern Asia | 73 | 1.7% |
| Eastern Europe | 149 | 3.4% |
| El Salvador | 2 | 0.1% |
| Europe | 166 | 3.8% |
| Germany | 1 | 0.0% |
| Guatemala | 6 | 0.1% |
| Honduras | 4 | 0.1% |
| Ireland | 1 | 0.0% |
| Jamaica | 15 | 0.4% |
| Japan | 12 | 0.3% |
| Korea | 61 | 1.4% |
| Latin America | 244 | 5.6% |
| Mexico | 162 | 3.7% |
| Micronesia | 4 | 0.1% |
| Moldova | 36 | 0.8% |
| North Macedonia | 33 | 0.8% |
| Northern Africa | 18 | 0.4% |
| Northern Europe | 2 | 0.1% |
| Oceania | 51 | 1.2% |
| Peru | 1 | 0.0% |
| Philippines | 1,479 | 34.1% |
| Romania | 5 | 0.1% |
| Scotland | 1 | 0.0% |
| Senegal | 3 | 0.1% |
| Serbia | 21 | 0.5% |
| Somalia | 3 | 0.1% |
| South America | 2 | 0.1% |
| South Eastern Asia | 1,597 | 36.8% |
| Sudan | 16 | 0.4% |
| Thailand | 8 | 0.2% |
| Ukraine | 47 | 1.1% |
| Vietnam | 110 | 2.5% |
| Western Africa | 4 | 0.1% |
| Western Europe | 1 | 0.0% | View All 44 Rows |
Sex and Age in Unalaska
Sex and Age in Unalaska
The most populous age groups in Unalaska are 50 to 54 Years (420 | 14.8%) for men and 50 to 54 Years (179 | 11.9%) for women.
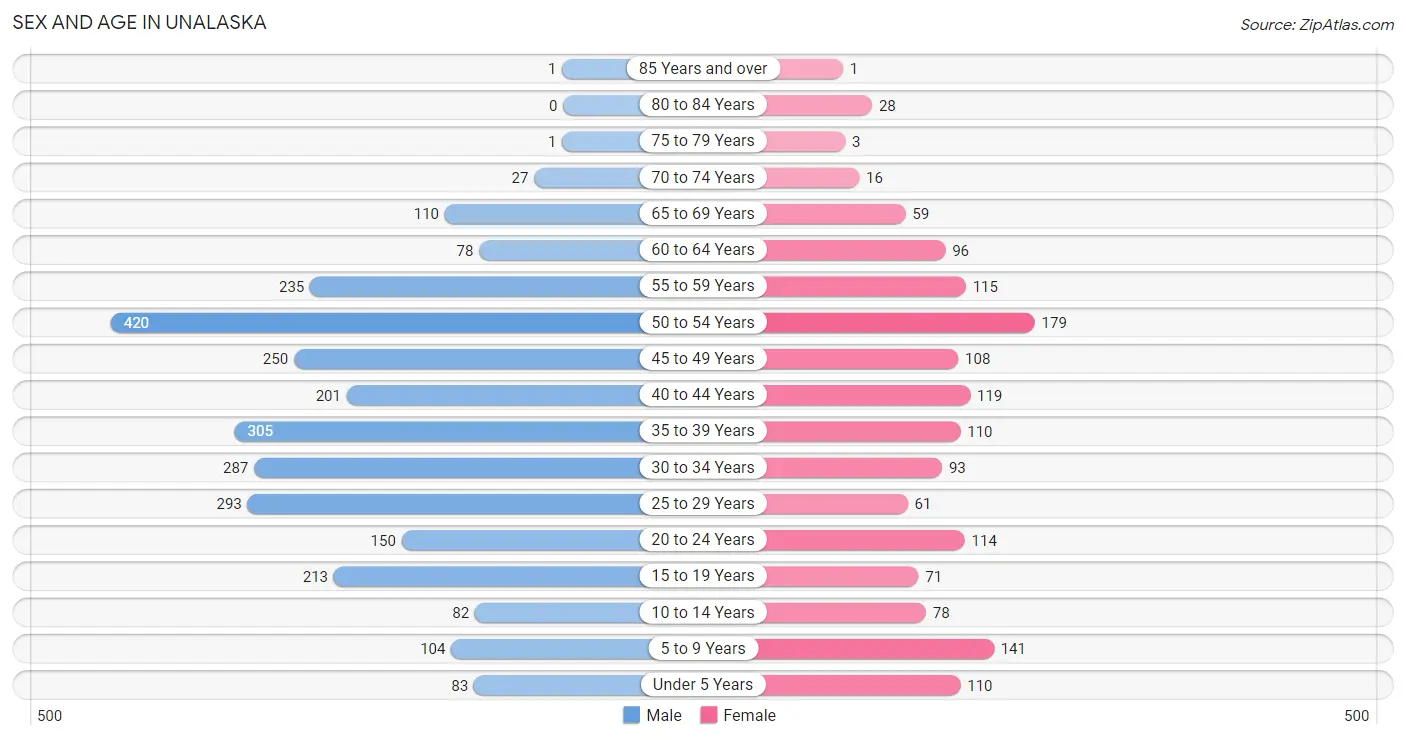
| Age Bracket | Male | Female |
| Under 5 Years | 83 (2.9%) | 110 (7.3%) |
| 5 to 9 Years | 104 (3.7%) | 141 (9.4%) |
| 10 to 14 Years | 82 (2.9%) | 78 (5.2%) |
| 15 to 19 Years | 213 (7.5%) | 71 (4.7%) |
| 20 to 24 Years | 150 (5.3%) | 114 (7.6%) |
| 25 to 29 Years | 293 (10.3%) | 61 (4.1%) |
| 30 to 34 Years | 287 (10.1%) | 93 (6.2%) |
| 35 to 39 Years | 305 (10.7%) | 110 (7.3%) |
| 40 to 44 Years | 201 (7.1%) | 119 (7.9%) |
| 45 to 49 Years | 250 (8.8%) | 108 (7.2%) |
| 50 to 54 Years | 420 (14.8%) | 179 (11.9%) |
| 55 to 59 Years | 235 (8.3%) | 115 (7.7%) |
| 60 to 64 Years | 78 (2.8%) | 96 (6.4%) |
| 65 to 69 Years | 110 (3.9%) | 59 (3.9%) |
| 70 to 74 Years | 27 (0.9%) | 16 (1.1%) |
| 75 to 79 Years | 1 (0.0%) | 3 (0.2%) |
| 80 to 84 Years | 0 (0.0%) | 28 (1.9%) |
| 85 Years and over | 1 (0.0%) | 1 (0.1%) |
| Total | 2,840 (100.0%) | 1,502 (100.0%) |
Families and Households in Unalaska
Median Family Size in Unalaska
The median family size in Unalaska is 4.82 persons per family, with single female/mother families (36 | 8.1%) accounting for the largest median family size of 5.69 persons per family. On the other hand, married-couple families (381 | 85.2%) represent the smallest median family size with 4.70 persons per family.
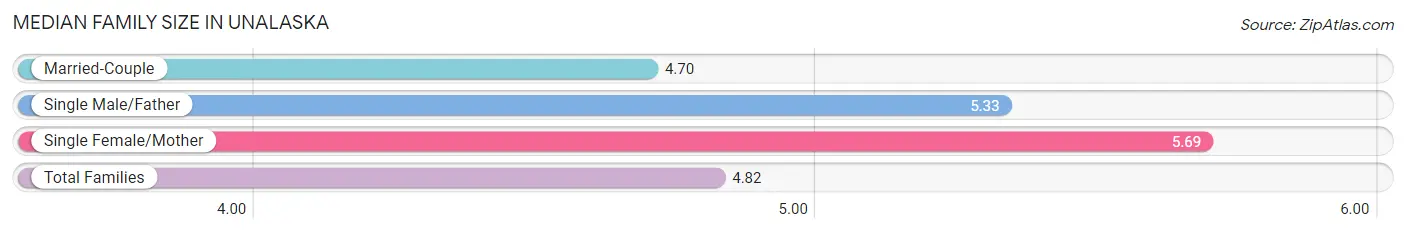
| Family Type | # Families | Family Size |
| Married-Couple | 381 (85.2%) | 4.70 |
| Single Male/Father | 30 (6.7%) | 5.33 |
| Single Female/Mother | 36 (8.1%) | 5.69 |
| Total Families | 447 (100.0%) | 4.82 |
Median Household Size in Unalaska
The median household size in Unalaska is 3.87 persons per household, with single male/father households (30 | 3.8%) accounting for the largest median household size of 6.6 persons per household. non-family households (349 | 43.8%) represent the smallest median household size with 2.40 persons per household.
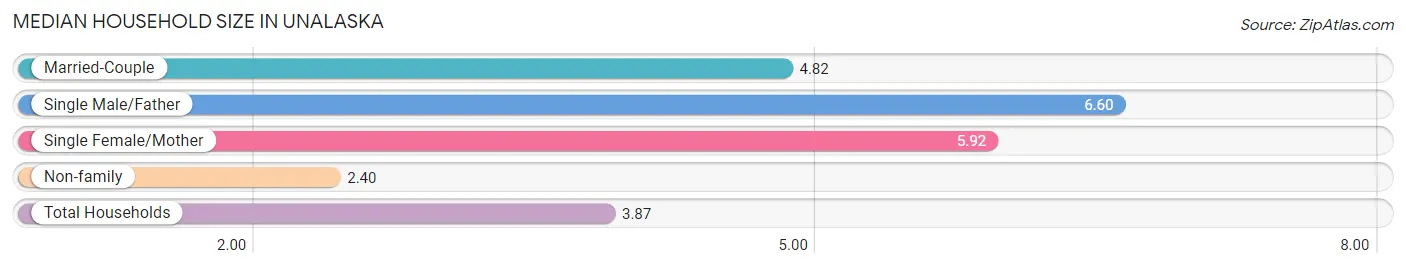
| Household Type | # Households | Household Size |
| Married-Couple | 381 (47.9%) | 4.82 |
| Single Male/Father | 30 (3.8%) | 6.60 |
| Single Female/Mother | 36 (4.5%) | 5.92 |
| Non-family | 349 (43.8%) | 2.40 |
| Total Households | 796 (100.0%) | 3.87 |
Household Size by Marriage Status in Unalaska
Out of a total of 796 households in Unalaska, 447 (56.2%) are family households, while 349 (43.8%) are nonfamily households. The most numerous type of family households are 2-person households, comprising 165, and the most common type of nonfamily households are 1-person households, comprising 250.
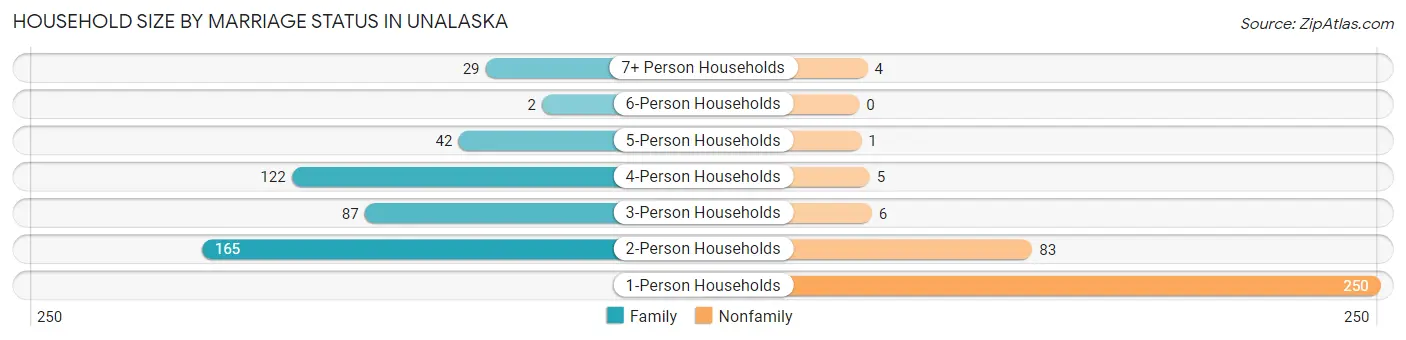
| Household Size | Family Households | Nonfamily Households |
| 1-Person Households | - | 250 (31.4%) |
| 2-Person Households | 165 (20.7%) | 83 (10.4%) |
| 3-Person Households | 87 (10.9%) | 6 (0.7%) |
| 4-Person Households | 122 (15.3%) | 5 (0.6%) |
| 5-Person Households | 42 (5.3%) | 1 (0.1%) |
| 6-Person Households | 2 (0.3%) | 0 (0.0%) |
| 7+ Person Households | 29 (3.6%) | 4 (0.5%) |
| Total | 447 (56.2%) | 349 (43.8%) |
Female Fertility in Unalaska
Fertility by Age in Unalaska
Average fertility rate in Unalaska is 44.0 births per 1,000 women. Women in the age bracket of 20 to 34 years have the highest fertility rate with 119.0 births per 1,000 women. Women in the age bracket of 20 to 34 years acount for 100.0% of all women with births.
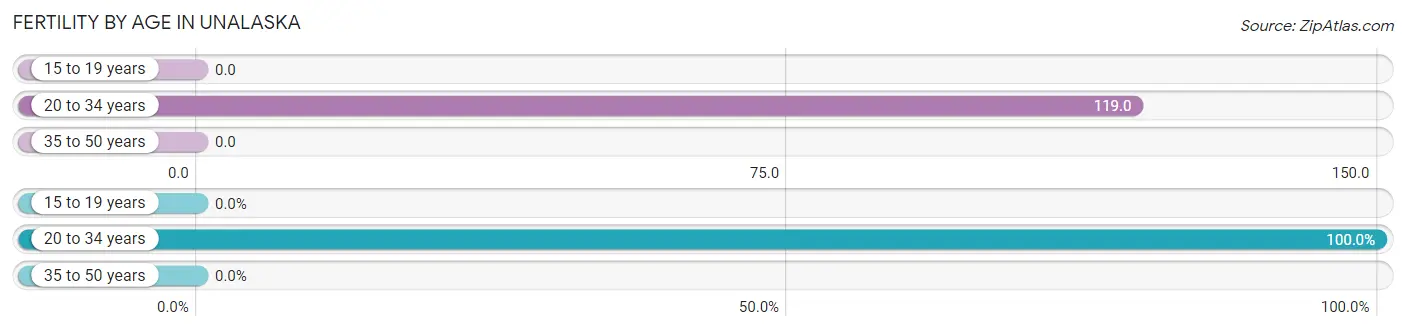
| Age Bracket | Women with Births | Births / 1,000 Women |
| 15 to 19 years | 0 (0.0%) | 0.0 |
| 20 to 34 years | 32 (100.0%) | 119.0 |
| 35 to 50 years | 0 (0.0%) | 0.0 |
| Total | 32 (100.0%) | 44.0 |
Fertility by Age by Marriage Status in Unalaska
87.5% of women with births (32) in Unalaska are married. The highest percentage of unmarried women with births falls into 20 to 34 years age bracket with 12.5% of them unmarried at the time of birth, while the lowest percentage of unmarried women with births belong to 20 to 34 years age bracket with 12.5% of them unmarried.
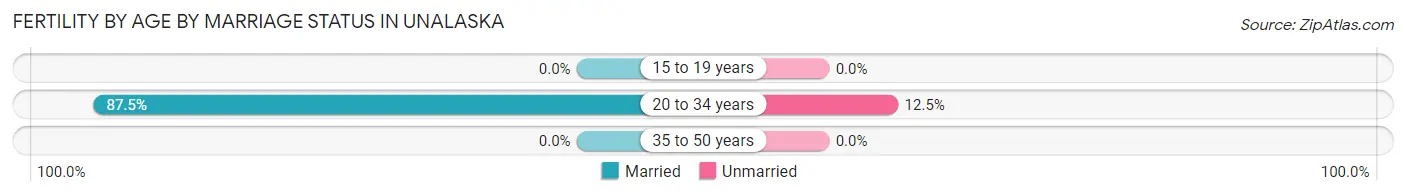
| Age Bracket | Married | Unmarried |
| 15 to 19 years | 0 (0.0%) | 0 (0.0%) |
| 20 to 34 years | 28 (87.5%) | 4 (12.5%) |
| 35 to 50 years | 0 (0.0%) | 0 (0.0%) |
| Total | 28 (87.5%) | 4 (12.5%) |
Fertility by Education in Unalaska
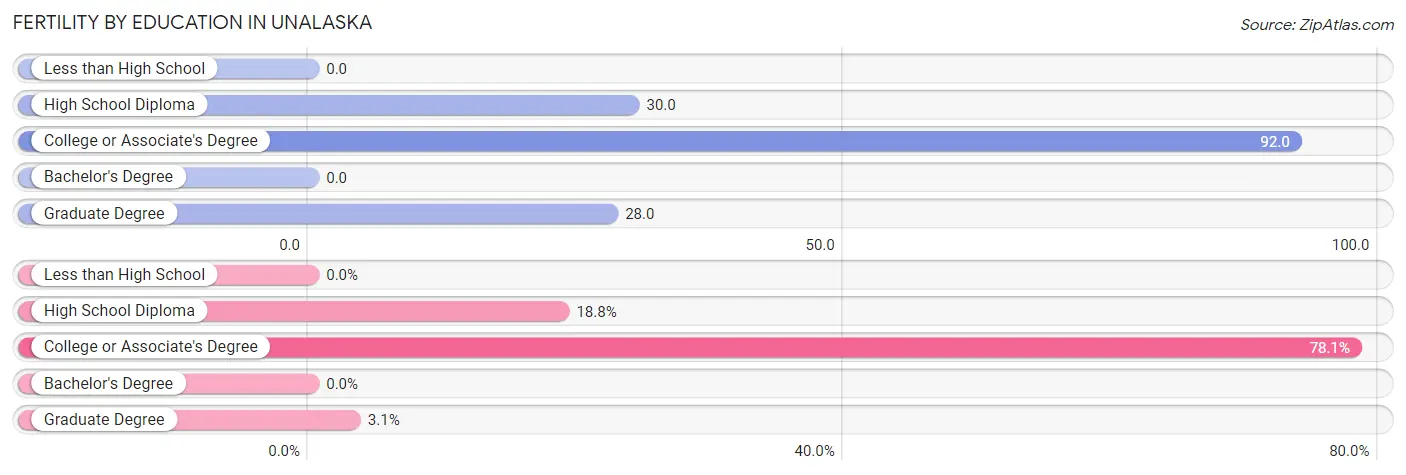
| Educational Attainment | Women with Births | Births / 1,000 Women |
| Less than High School | 0 (0.0%) | 0.0 |
| High School Diploma | 6 (18.8%) | 30.0 |
| College or Associate's Degree | 25 (78.1%) | 92.0 |
| Bachelor's Degree | 0 (0.0%) | 0.0 |
| Graduate Degree | 1 (3.1%) | 28.0 |
| Total | 32 (100.0%) | 44.0 |
Fertility by Education by Marriage Status in Unalaska
12.5% of women with births in Unalaska are unmarried. Women with the educational attainment of graduate degree are most likely to be married with 100.0% of them married at childbirth, while women with the educational attainment of high school diploma are least likely to be married with 50.0% of them unmarried at childbirth.
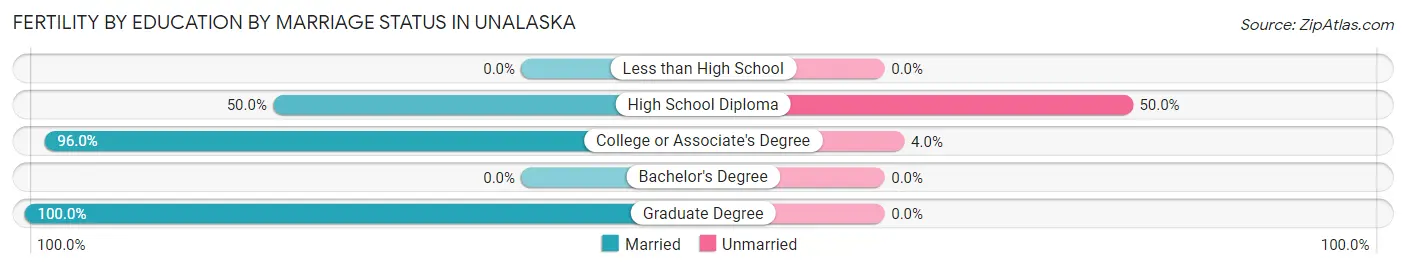
| Educational Attainment | Married | Unmarried |
| Less than High School | 0 (0.0%) | 0 (0.0%) |
| High School Diploma | 3 (50.0%) | 3 (50.0%) |
| College or Associate's Degree | 24 (96.0%) | 1 (4.0%) |
| Bachelor's Degree | 0 (0.0%) | 0 (0.0%) |
| Graduate Degree | 1 (100.0%) | 0 (0.0%) |
| Total | 28 (87.5%) | 4 (12.5%) |
Employment Characteristics in Unalaska
Employment by Class of Employer in Unalaska
Among the 2,887 employed individuals in Unalaska, private company employees (2,258 | 78.2%), local government employees (321 | 11.1%), and federal government employees (98 | 3.4%) make up the most common classes of employment.
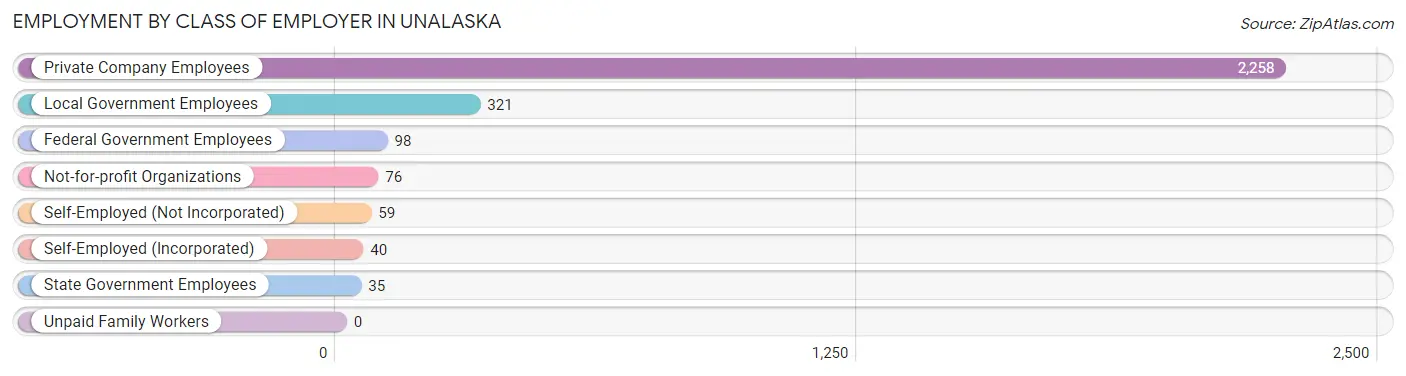
| Employer Class | # Employees | % Employees |
| Private Company Employees | 2,258 | 78.2% |
| Self-Employed (Incorporated) | 40 | 1.4% |
| Self-Employed (Not Incorporated) | 59 | 2.0% |
| Not-for-profit Organizations | 76 | 2.6% |
| Local Government Employees | 321 | 11.1% |
| State Government Employees | 35 | 1.2% |
| Federal Government Employees | 98 | 3.4% |
| Unpaid Family Workers | 0 | 0.0% |
| Total | 2,887 | 100.0% |
Employment Status by Age in Unalaska
According to the labor force statistics for Unalaska, out of the total population over 16 years of age (3,670), 85.7% or 3,145 individuals are in the labor force, with 3.3% or 104 of them unemployed. The age group with the highest labor force participation rate is 25 to 29 years, with 94.6% or 335 individuals in the labor force. Within the labor force, the 65 to 74 years age range has the highest percentage of unemployed individuals, with 14.9% or 18 of them being unemployed.
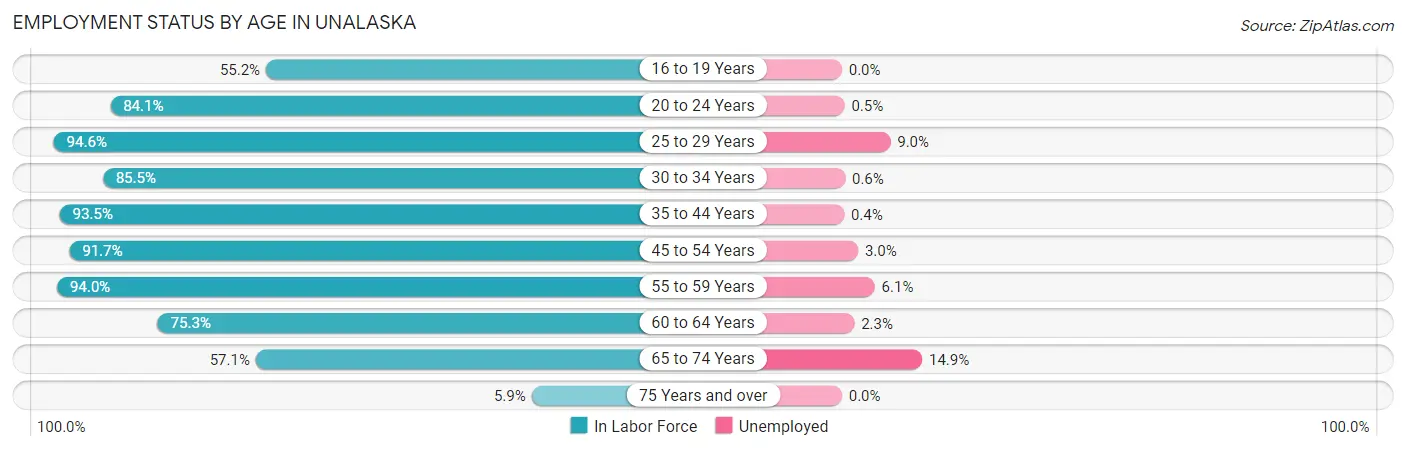
| Age Bracket | In Labor Force | Unemployed |
| 16 to 19 Years | 116 (55.2%) | 0 (0.0%) |
| 20 to 24 Years | 222 (84.1%) | 1 (0.5%) |
| 25 to 29 Years | 335 (94.6%) | 30 (9.0%) |
| 30 to 34 Years | 325 (85.5%) | 2 (0.6%) |
| 35 to 44 Years | 687 (93.5%) | 3 (0.4%) |
| 45 to 54 Years | 878 (91.7%) | 26 (3.0%) |
| 55 to 59 Years | 329 (94.0%) | 20 (6.1%) |
| 60 to 64 Years | 131 (75.3%) | 3 (2.3%) |
| 65 to 74 Years | 121 (57.1%) | 18 (14.9%) |
| 75 Years and over | 2 (5.9%) | 0 (0.0%) |
| Total | 3,145 (85.7%) | 104 (3.3%) |
Employment Status by Educational Attainment in Unalaska
According to labor force statistics for Unalaska, 91.0% of individuals (2,684) out of the total population between 25 and 64 years of age (2,950) are in the labor force, with 3.1% or 83 of them being unemployed. The group with the highest labor force participation rate are those with the educational attainment of college / associate degree, with 94.2% or 910 individuals in the labor force. Within the labor force, individuals with less than high school education have the highest percentage of unemployment, with 9.7% or 24 of them being unemployed.
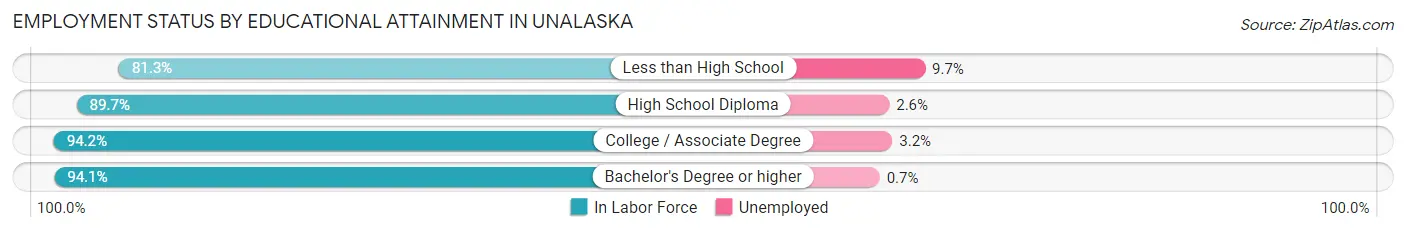
| Educational Attainment | In Labor Force | Unemployed |
| Less than High School | 248 (81.3%) | 30 (9.7%) |
| High School Diploma | 1,067 (89.7%) | 31 (2.6%) |
| College / Associate Degree | 910 (94.2%) | 31 (3.2%) |
| Bachelor's Degree or higher | 461 (94.1%) | 3 (0.7%) |
| Total | 2,684 (91.0%) | 91 (3.1%) |
Employment Occupations by Sex in Unalaska
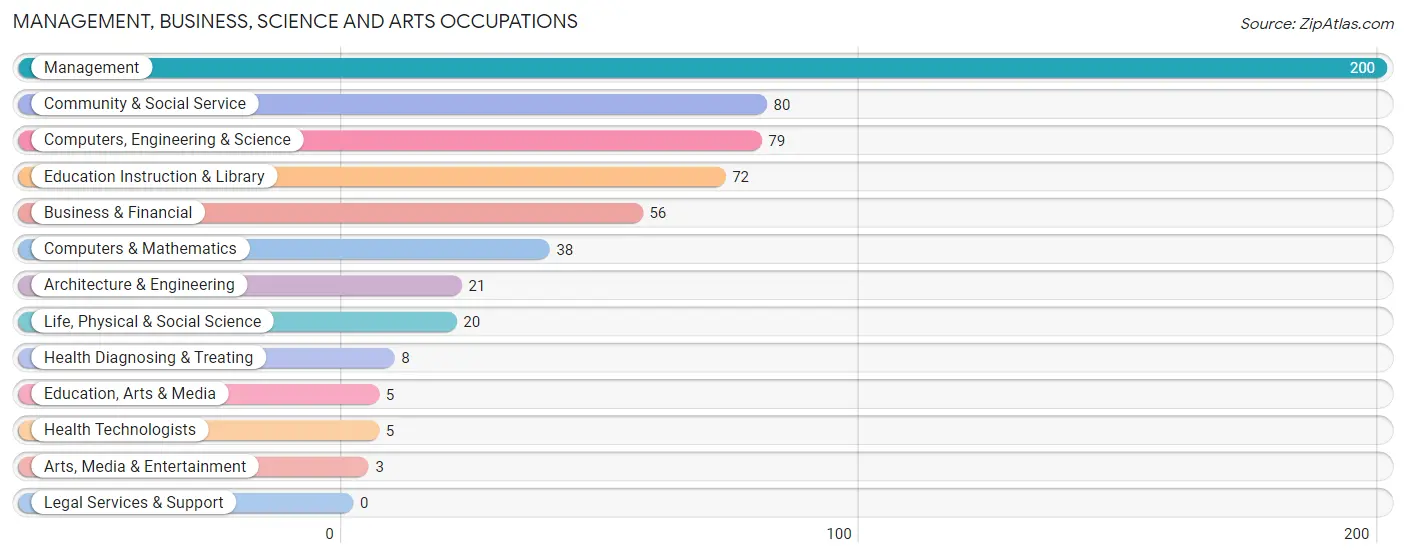
Management, Business, Science and Arts Occupations
The most common Management, Business, Science and Arts occupations in Unalaska are Management (200 | 6.6%), Community & Social Service (80 | 2.6%), Computers, Engineering & Science (79 | 2.6%), Education Instruction & Library (72 | 2.4%), and Business & Financial (56 | 1.8%).
Management, Business, Science and Arts Occupations by Sex
Within the Management, Business, Science and Arts occupations in Unalaska, the most male-oriented occupations are Arts, Media & Entertainment (100.0%), Computers & Mathematics (94.7%), and Business & Financial (75.0%), while the most female-oriented occupations are Education, Arts & Media (80.0%), Life, Physical & Social Science (55.0%), and Community & Social Service (48.7%).
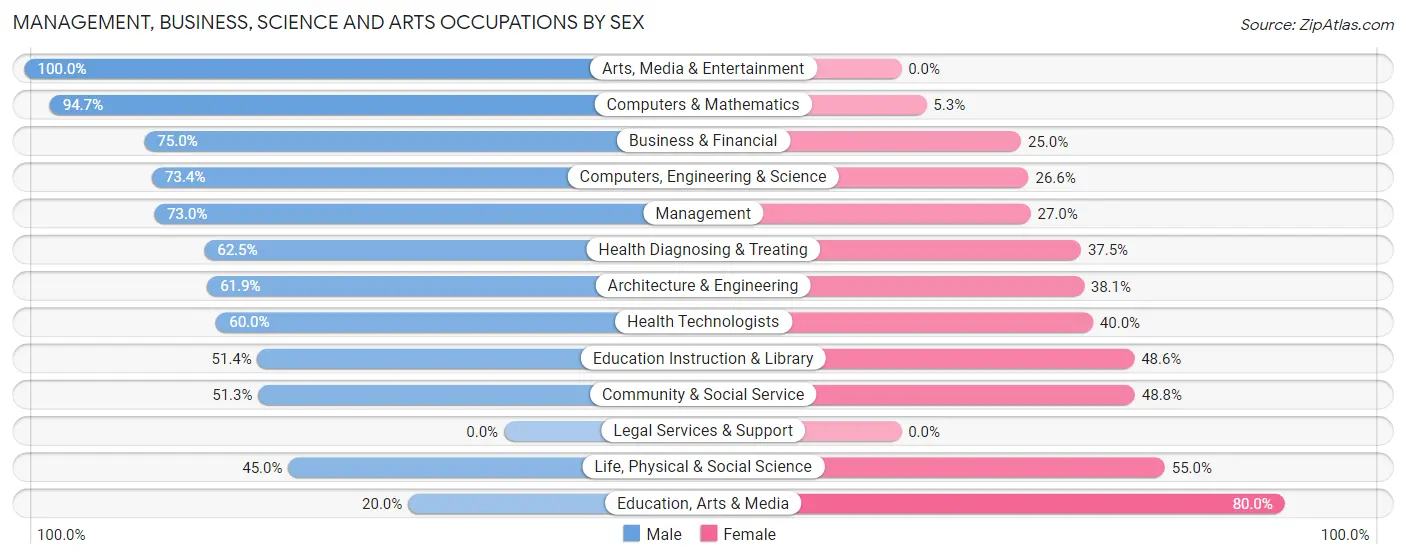
| Occupation | Male | Female |
| Management | 146 (73.0%) | 54 (27.0%) |
| Business & Financial | 42 (75.0%) | 14 (25.0%) |
| Computers, Engineering & Science | 58 (73.4%) | 21 (26.6%) |
| Computers & Mathematics | 36 (94.7%) | 2 (5.3%) |
| Architecture & Engineering | 13 (61.9%) | 8 (38.1%) |
| Life, Physical & Social Science | 9 (45.0%) | 11 (55.0%) |
| Community & Social Service | 41 (51.2%) | 39 (48.7%) |
| Education, Arts & Media | 1 (20.0%) | 4 (80.0%) |
| Legal Services & Support | 0 (0.0%) | 0 (0.0%) |
| Education Instruction & Library | 37 (51.4%) | 35 (48.6%) |
| Arts, Media & Entertainment | 3 (100.0%) | 0 (0.0%) |
| Health Diagnosing & Treating | 5 (62.5%) | 3 (37.5%) |
| Health Technologists | 3 (60.0%) | 2 (40.0%) |
| Total (Category) | 292 (69.0%) | 131 (31.0%) |
| Total (Overall) | 2,247 (74.2%) | 783 (25.8%) |
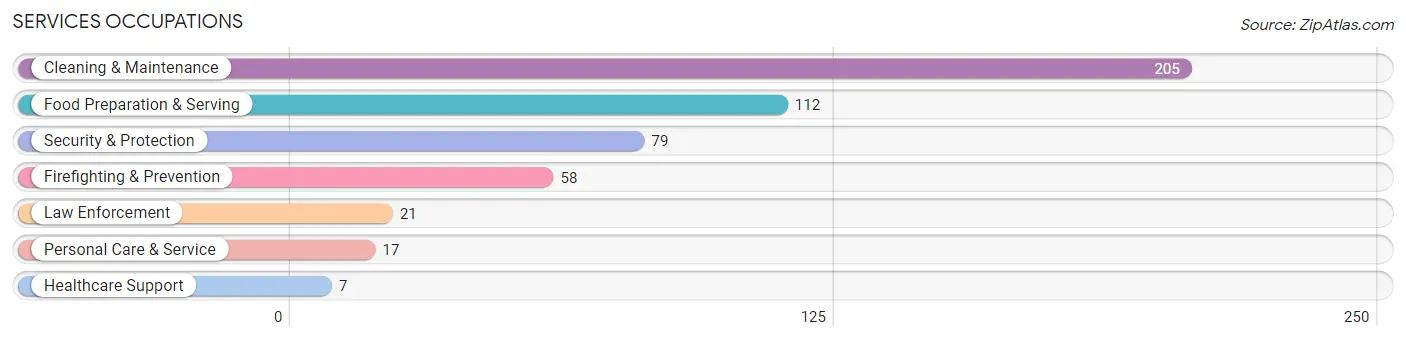
Services Occupations
The most common Services occupations in Unalaska are Cleaning & Maintenance (205 | 6.8%), Food Preparation & Serving (112 | 3.7%), Security & Protection (79 | 2.6%), Firefighting & Prevention (58 | 1.9%), and Law Enforcement (21 | 0.7%).
Services Occupations by Sex
Within the Services occupations in Unalaska, the most male-oriented occupations are Firefighting & Prevention (89.7%), Security & Protection (84.8%), and Law Enforcement (71.4%), while the most female-oriented occupations are Personal Care & Service (82.4%), Healthcare Support (57.1%), and Food Preparation & Serving (42.9%).
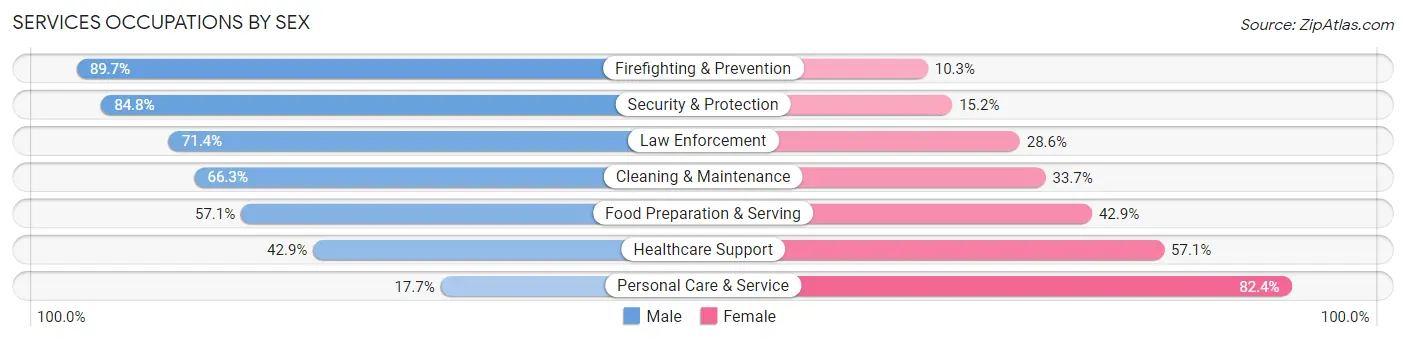
| Occupation | Male | Female |
| Healthcare Support | 3 (42.9%) | 4 (57.1%) |
| Security & Protection | 67 (84.8%) | 12 (15.2%) |
| Firefighting & Prevention | 52 (89.7%) | 6 (10.3%) |
| Law Enforcement | 15 (71.4%) | 6 (28.6%) |
| Food Preparation & Serving | 64 (57.1%) | 48 (42.9%) |
| Cleaning & Maintenance | 136 (66.3%) | 69 (33.7%) |
| Personal Care & Service | 3 (17.6%) | 14 (82.4%) |
| Total (Category) | 273 (65.0%) | 147 (35.0%) |
| Total (Overall) | 2,247 (74.2%) | 783 (25.8%) |
Sales and Office Occupations
The most common Sales and Office occupations in Unalaska are Sales & Related (235 | 7.8%), and Office & Administration (211 | 7.0%).
Sales and Office Occupations by Sex
| Occupation | Male | Female |
| Sales & Related | 70 (29.8%) | 165 (70.2%) |
| Office & Administration | 53 (25.1%) | 158 (74.9%) |
| Total (Category) | 123 (27.6%) | 323 (72.4%) |
| Total (Overall) | 2,247 (74.2%) | 783 (25.8%) |
Natural Resources, Construction and Maintenance Occupations
The most common Natural Resources, Construction and Maintenance occupations in Unalaska are Installation, Maintenance & Repair (197 | 6.5%), Construction & Extraction (143 | 4.7%), and Farming, Fishing & Forestry (41 | 1.3%).
Natural Resources, Construction and Maintenance Occupations by Sex
| Occupation | Male | Female |
| Farming, Fishing & Forestry | 38 (92.7%) | 3 (7.3%) |
| Construction & Extraction | 142 (99.3%) | 1 (0.7%) |
| Installation, Maintenance & Repair | 194 (98.5%) | 3 (1.5%) |
| Total (Category) | 374 (98.2%) | 7 (1.8%) |
| Total (Overall) | 2,247 (74.2%) | 783 (25.8%) |
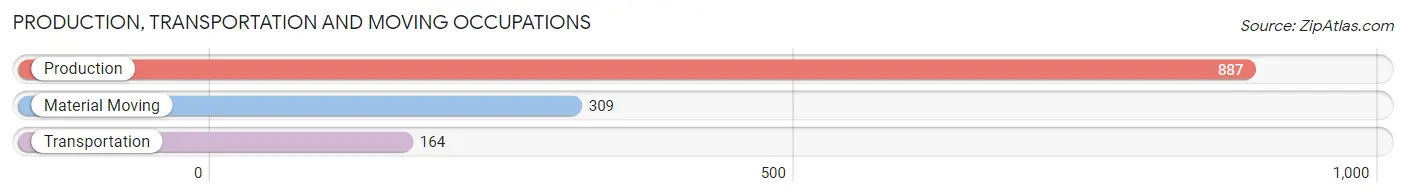
Production, Transportation and Moving Occupations
The most common Production, Transportation and Moving occupations in Unalaska are Production (887 | 29.3%), Material Moving (309 | 10.2%), and Transportation (164 | 5.4%).
Production, Transportation and Moving Occupations by Sex
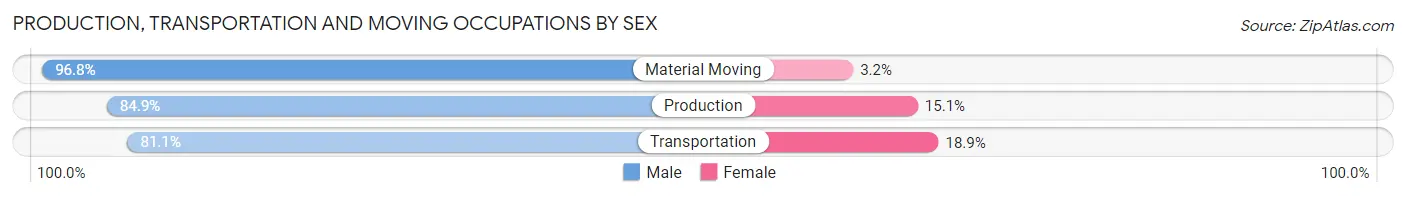
| Occupation | Male | Female |
| Production | 753 (84.9%) | 134 (15.1%) |
| Transportation | 133 (81.1%) | 31 (18.9%) |
| Material Moving | 299 (96.8%) | 10 (3.2%) |
| Total (Category) | 1,185 (87.1%) | 175 (12.9%) |
| Total (Overall) | 2,247 (74.2%) | 783 (25.8%) |
Employment Industries by Sex in Unalaska
Employment Industries in Unalaska
The major employment industries in Unalaska include Manufacturing (1,292 | 42.6%), Transportation & Warehousing (533 | 17.6%), Public Administration (299 | 9.9%), Retail Trade (242 | 8.0%), and Construction (132 | 4.4%).

Employment Industries by Sex in Unalaska
The Unalaska industries that see more men than women are Agriculture, Fishing & Hunting (97.7%), Construction (96.2%), and Wholesale Trade (93.8%), whereas the industries that tend to have a higher number of women are Finance & Insurance (100.0%), Health Care & Social Assistance (87.7%), and Information (83.9%).
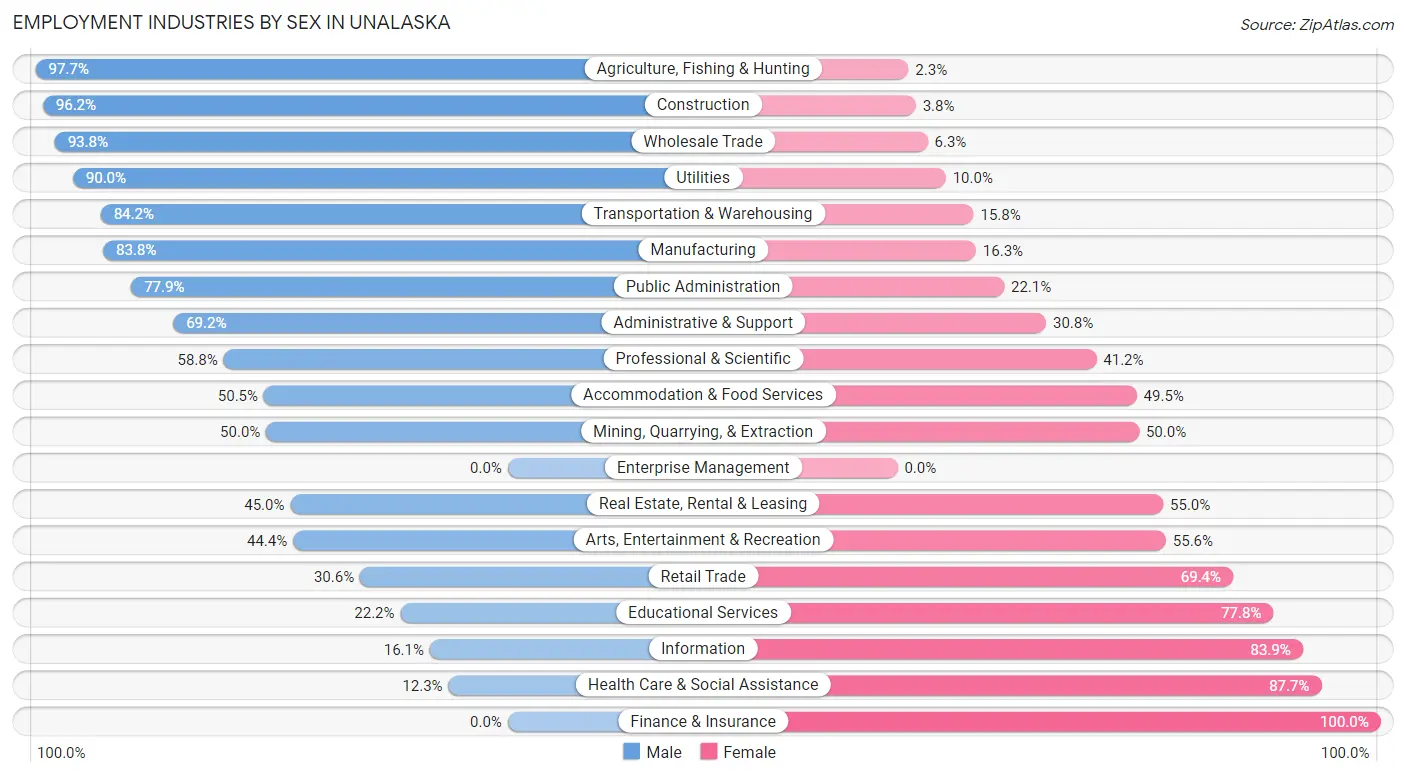
| Industry | Male | Female |
| Agriculture, Fishing & Hunting | 43 (97.7%) | 1 (2.3%) |
| Mining, Quarrying, & Extraction | 3 (50.0%) | 3 (50.0%) |
| Construction | 127 (96.2%) | 5 (3.8%) |
| Manufacturing | 1,082 (83.8%) | 210 (16.3%) |
| Wholesale Trade | 30 (93.8%) | 2 (6.2%) |
| Retail Trade | 74 (30.6%) | 168 (69.4%) |
| Transportation & Warehousing | 449 (84.2%) | 84 (15.8%) |
| Utilities | 9 (90.0%) | 1 (10.0%) |
| Information | 5 (16.1%) | 26 (83.9%) |
| Finance & Insurance | 0 (0.0%) | 2 (100.0%) |
| Real Estate, Rental & Leasing | 18 (45.0%) | 22 (55.0%) |
| Professional & Scientific | 20 (58.8%) | 14 (41.2%) |
| Enterprise Management | 0 (0.0%) | 0 (0.0%) |
| Administrative & Support | 18 (69.2%) | 8 (30.8%) |
| Educational Services | 12 (22.2%) | 42 (77.8%) |
| Health Care & Social Assistance | 7 (12.3%) | 50 (87.7%) |
| Arts, Entertainment & Recreation | 12 (44.4%) | 15 (55.6%) |
| Accommodation & Food Services | 53 (50.5%) | 52 (49.5%) |
| Public Administration | 233 (77.9%) | 66 (22.1%) |
| Total | 2,247 (74.2%) | 783 (25.8%) |
Education in Unalaska
School Enrollment in Unalaska
The most common levels of schooling among the 773 students in Unalaska are elementary school (219 | 28.3%), high school (189 | 24.4%), and middle school (125 | 16.2%).
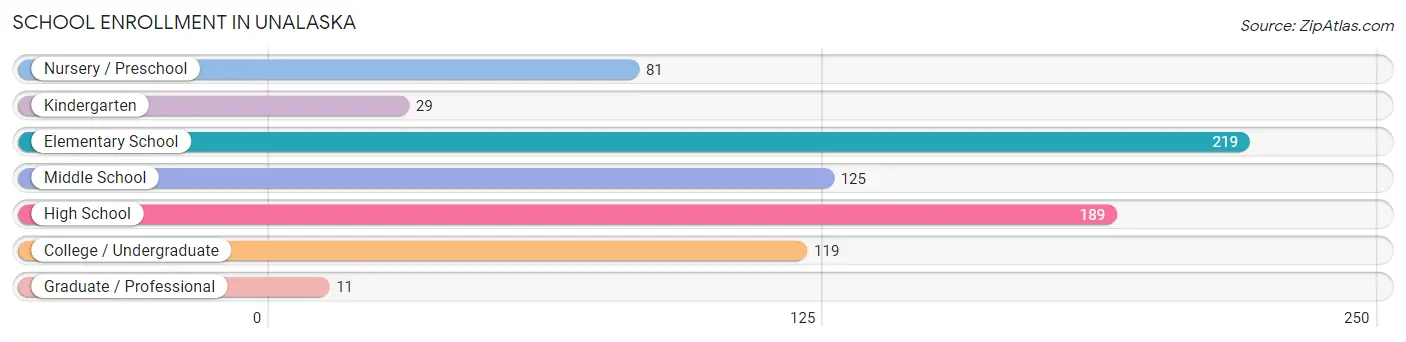
| School Level | # Students | % Students |
| Nursery / Preschool | 81 | 10.5% |
| Kindergarten | 29 | 3.7% |
| Elementary School | 219 | 28.3% |
| Middle School | 125 | 16.2% |
| High School | 189 | 24.4% |
| College / Undergraduate | 119 | 15.4% |
| Graduate / Professional | 11 | 1.4% |
| Total | 773 | 100.0% |
School Enrollment by Age by Funding Source in Unalaska
Out of a total of 773 students who are enrolled in schools in Unalaska, 27 (3.5%) attend a private institution, while the remaining 746 (96.5%) are enrolled in public schools. The age group of 25 to 34 year olds has the highest likelihood of being enrolled in private schools, with 1 (33.3% in the age bracket) enrolled. Conversely, the age group of 15 to 17 year olds has the lowest likelihood of being enrolled in a private school, with 143 (100.0% in the age bracket) attending a public institution.
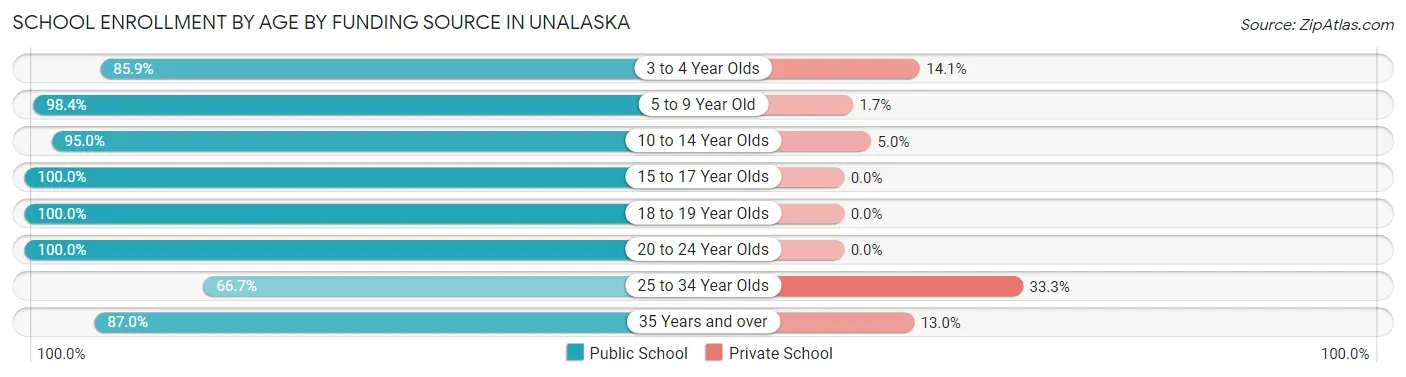
| Age Bracket | Public School | Private School |
| 3 to 4 Year Olds | 67 (85.9%) | 11 (14.1%) |
| 5 to 9 Year Old | 238 (98.4%) | 4 (1.7%) |
| 10 to 14 Year Olds | 151 (95.0%) | 8 (5.0%) |
| 15 to 17 Year Olds | 143 (100.0%) | 0 (0.0%) |
| 18 to 19 Year Olds | 40 (100.0%) | 0 (0.0%) |
| 20 to 24 Year Olds | 85 (100.0%) | 0 (0.0%) |
| 25 to 34 Year Olds | 2 (66.7%) | 1 (33.3%) |
| 35 Years and over | 20 (87.0%) | 3 (13.0%) |
| Total | 746 (96.5%) | 27 (3.5%) |
Educational Attainment by Field of Study in Unalaska
Business (171 | 30.4%), science & technology (69 | 12.3%), engineering (58 | 10.3%), visual & performing arts (47 | 8.4%), and education (45 | 8.0%) are the most common fields of study among 562 individuals in Unalaska who have obtained a bachelor's degree or higher.
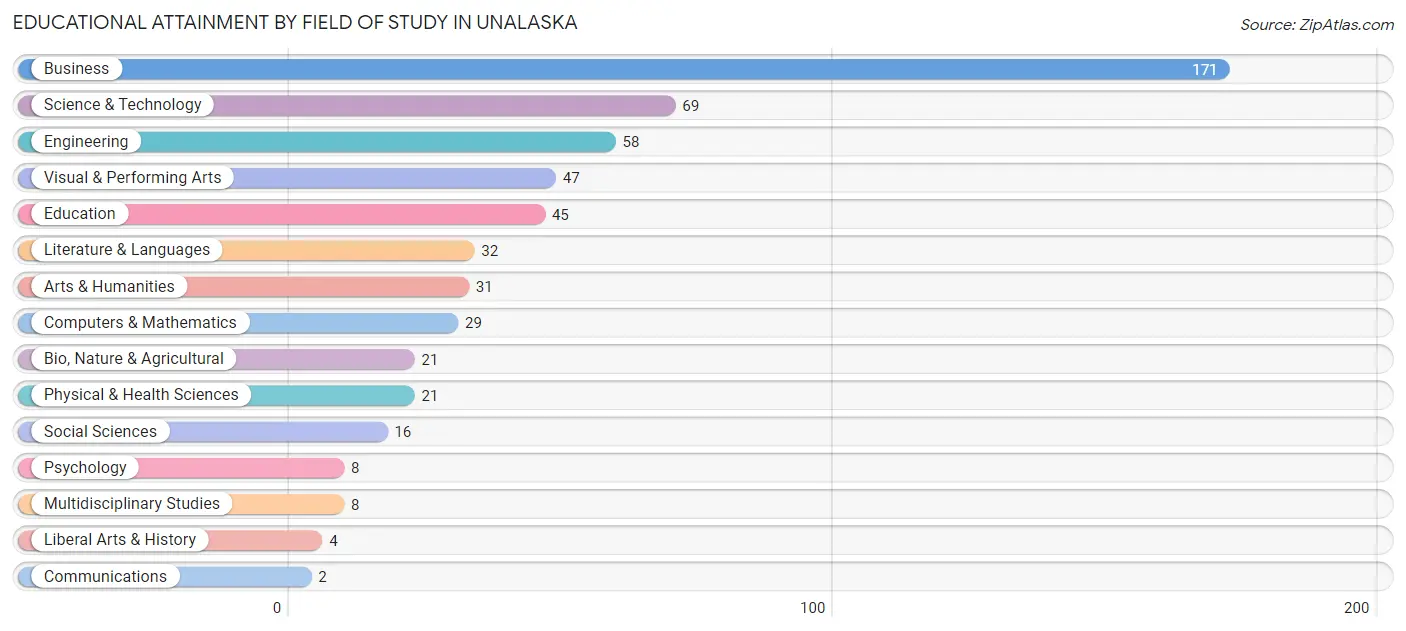
| Field of Study | # Graduates | % Graduates |
| Computers & Mathematics | 29 | 5.2% |
| Bio, Nature & Agricultural | 21 | 3.7% |
| Physical & Health Sciences | 21 | 3.7% |
| Psychology | 8 | 1.4% |
| Social Sciences | 16 | 2.9% |
| Engineering | 58 | 10.3% |
| Multidisciplinary Studies | 8 | 1.4% |
| Science & Technology | 69 | 12.3% |
| Business | 171 | 30.4% |
| Education | 45 | 8.0% |
| Literature & Languages | 32 | 5.7% |
| Liberal Arts & History | 4 | 0.7% |
| Visual & Performing Arts | 47 | 8.4% |
| Communications | 2 | 0.4% |
| Arts & Humanities | 31 | 5.5% |
| Total | 562 | 100.0% |
Transportation & Commute in Unalaska
Vehicle Availability by Sex in Unalaska
The most prevalent vehicle ownership categories in Unalaska are males with 2 vehicles (411, accounting for 35.6%) and females with 2 vehicles (323, making up 64.6%).
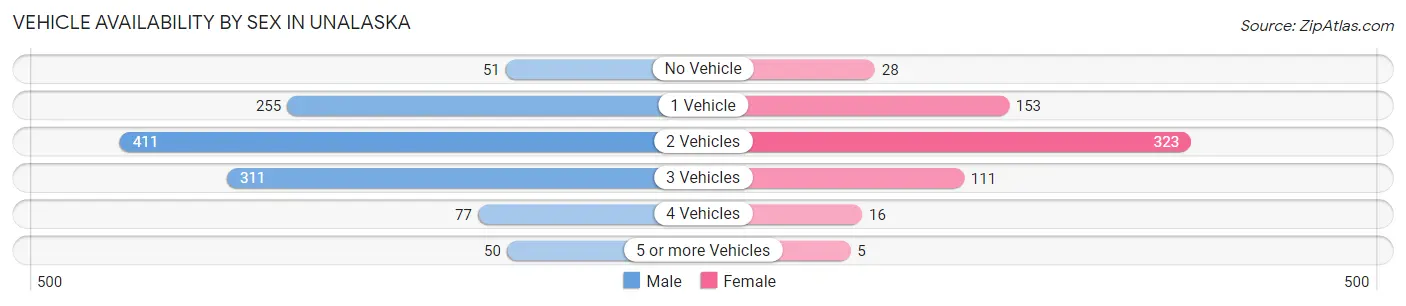
| Vehicles Available | Male | Female |
| No Vehicle | 51 (4.4%) | 28 (4.4%) |
| 1 Vehicle | 255 (22.1%) | 153 (24.1%) |
| 2 Vehicles | 411 (35.6%) | 323 (50.8%) |
| 3 Vehicles | 311 (26.9%) | 111 (17.4%) |
| 4 Vehicles | 77 (6.7%) | 16 (2.5%) |
| 5 or more Vehicles | 50 (4.3%) | 5 (0.8%) |
| Total | 1,155 (100.0%) | 636 (100.0%) |
Commute Time in Unalaska
The most frequently occuring commute durations in Unalaska are 5 to 9 minutes (1,427 commuters, 50.6%), less than 5 minutes (701 commuters, 24.9%), and 10 to 14 minutes (568 commuters, 20.2%).
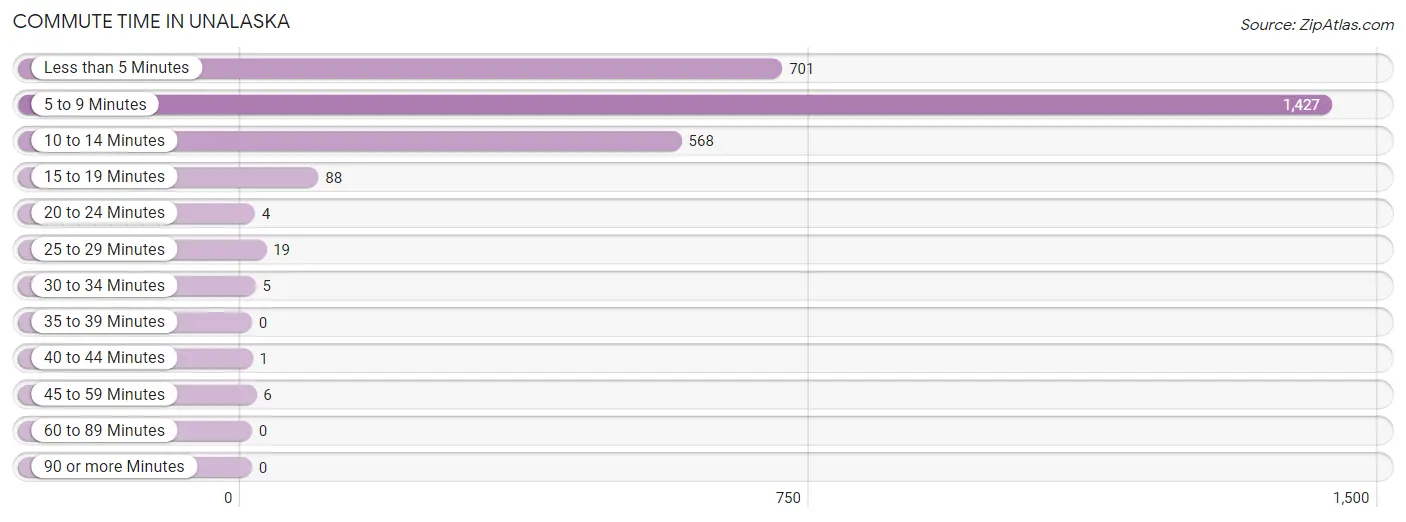
| Commute Time | # Commuters | % Commuters |
| Less than 5 Minutes | 701 | 24.9% |
| 5 to 9 Minutes | 1,427 | 50.6% |
| 10 to 14 Minutes | 568 | 20.2% |
| 15 to 19 Minutes | 88 | 3.1% |
| 20 to 24 Minutes | 4 | 0.1% |
| 25 to 29 Minutes | 19 | 0.7% |
| 30 to 34 Minutes | 5 | 0.2% |
| 35 to 39 Minutes | 0 | 0.0% |
| 40 to 44 Minutes | 1 | 0.0% |
| 45 to 59 Minutes | 6 | 0.2% |
| 60 to 89 Minutes | 0 | 0.0% |
| 90 or more Minutes | 0 | 0.0% |
Commute Time by Sex in Unalaska
The most common commute times in Unalaska are 5 to 9 minutes (992 commuters, 47.6%) for males and 5 to 9 minutes (435 commuters, 59.1%) for females.
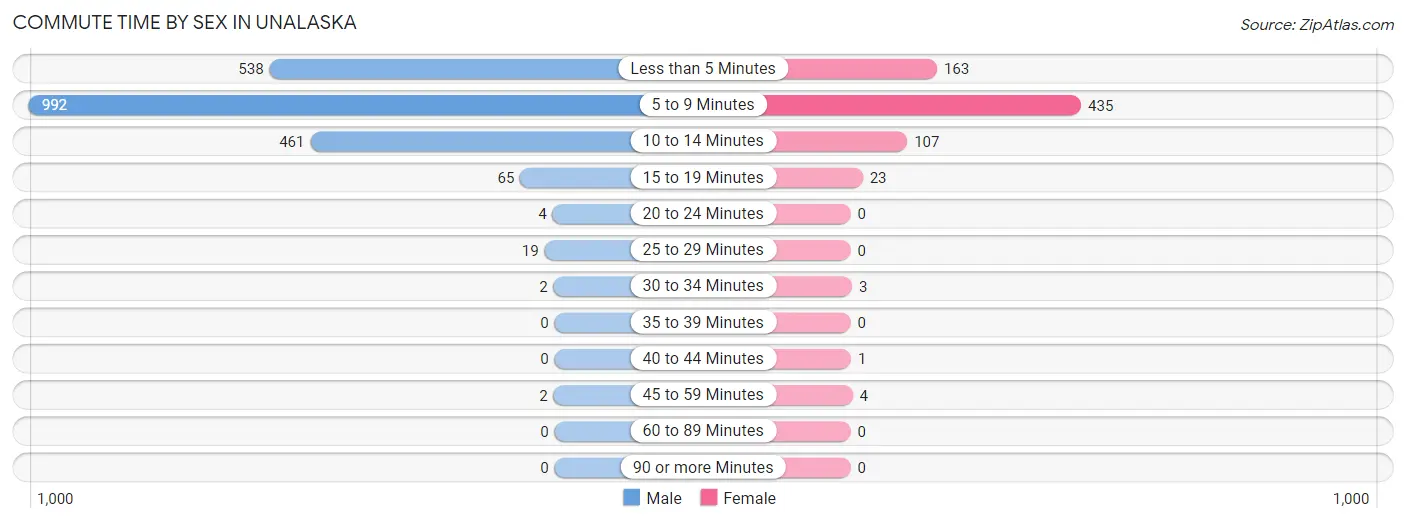
| Commute Time | Male | Female |
| Less than 5 Minutes | 538 (25.8%) | 163 (22.2%) |
| 5 to 9 Minutes | 992 (47.6%) | 435 (59.1%) |
| 10 to 14 Minutes | 461 (22.1%) | 107 (14.5%) |
| 15 to 19 Minutes | 65 (3.1%) | 23 (3.1%) |
| 20 to 24 Minutes | 4 (0.2%) | 0 (0.0%) |
| 25 to 29 Minutes | 19 (0.9%) | 0 (0.0%) |
| 30 to 34 Minutes | 2 (0.1%) | 3 (0.4%) |
| 35 to 39 Minutes | 0 (0.0%) | 0 (0.0%) |
| 40 to 44 Minutes | 0 (0.0%) | 1 (0.1%) |
| 45 to 59 Minutes | 2 (0.1%) | 4 (0.5%) |
| 60 to 89 Minutes | 0 (0.0%) | 0 (0.0%) |
| 90 or more Minutes | 0 (0.0%) | 0 (0.0%) |
Time of Departure to Work by Sex in Unalaska
The most frequent times of departure to work in Unalaska are 5:30 AM to 5:59 AM (387, 18.6%) for males and 8:00 AM to 8:29 AM (146, 19.8%) for females.
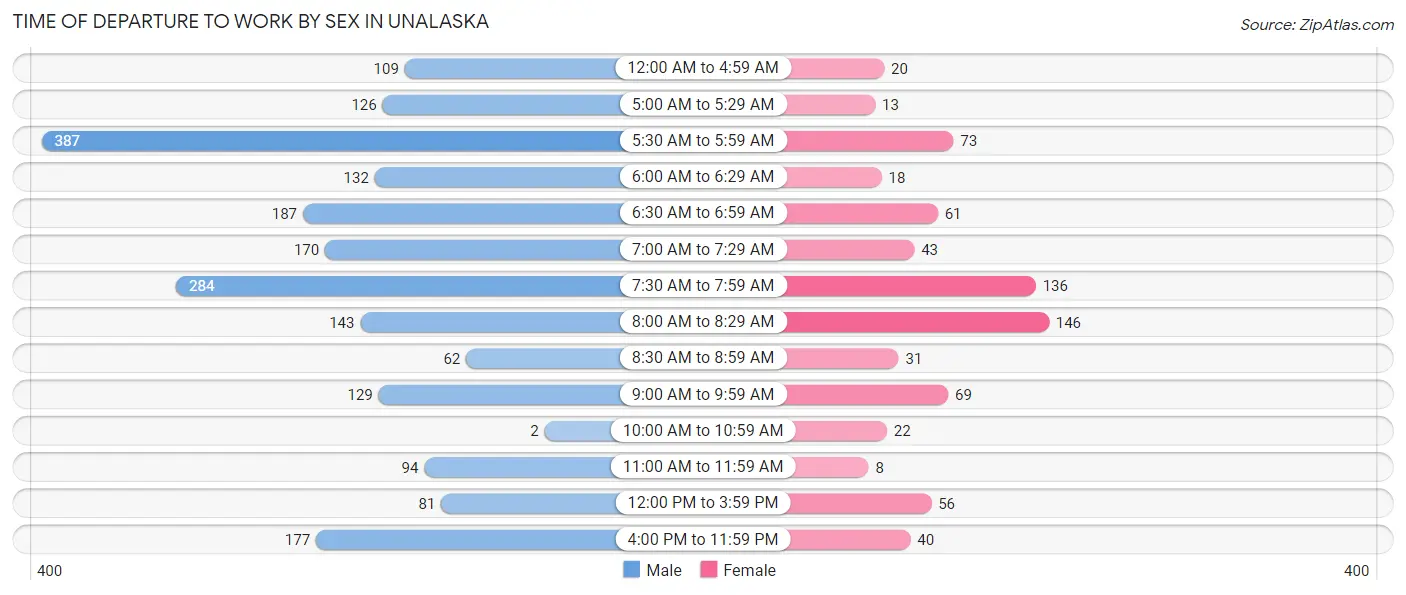
| Time of Departure | Male | Female |
| 12:00 AM to 4:59 AM | 109 (5.2%) | 20 (2.7%) |
| 5:00 AM to 5:29 AM | 126 (6.0%) | 13 (1.8%) |
| 5:30 AM to 5:59 AM | 387 (18.6%) | 73 (9.9%) |
| 6:00 AM to 6:29 AM | 132 (6.3%) | 18 (2.5%) |
| 6:30 AM to 6:59 AM | 187 (9.0%) | 61 (8.3%) |
| 7:00 AM to 7:29 AM | 170 (8.2%) | 43 (5.8%) |
| 7:30 AM to 7:59 AM | 284 (13.6%) | 136 (18.5%) |
| 8:00 AM to 8:29 AM | 143 (6.9%) | 146 (19.8%) |
| 8:30 AM to 8:59 AM | 62 (3.0%) | 31 (4.2%) |
| 9:00 AM to 9:59 AM | 129 (6.2%) | 69 (9.4%) |
| 10:00 AM to 10:59 AM | 2 (0.1%) | 22 (3.0%) |
| 11:00 AM to 11:59 AM | 94 (4.5%) | 8 (1.1%) |
| 12:00 PM to 3:59 PM | 81 (3.9%) | 56 (7.6%) |
| 4:00 PM to 11:59 PM | 177 (8.5%) | 40 (5.4%) |
| Total | 2,083 (100.0%) | 736 (100.0%) |
Housing Occupancy in Unalaska
Occupancy by Ownership in Unalaska
Of the total 796 dwellings in Unalaska, owner-occupied units account for 185 (23.2%), while renter-occupied units make up 611 (76.8%).
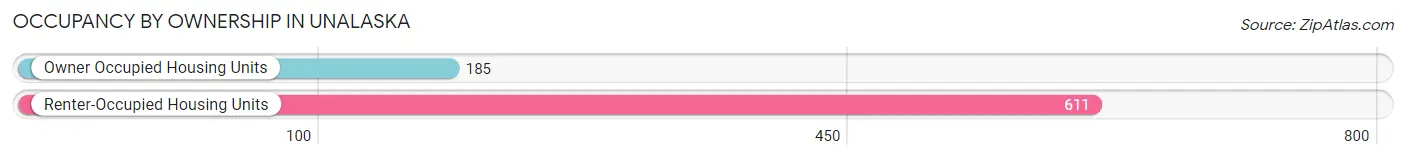
| Occupancy | # Housing Units | % Housing Units |
| Owner Occupied Housing Units | 185 | 23.2% |
| Renter-Occupied Housing Units | 611 | 76.8% |
| Total Occupied Housing Units | 796 | 100.0% |
Occupancy by Household Size in Unalaska
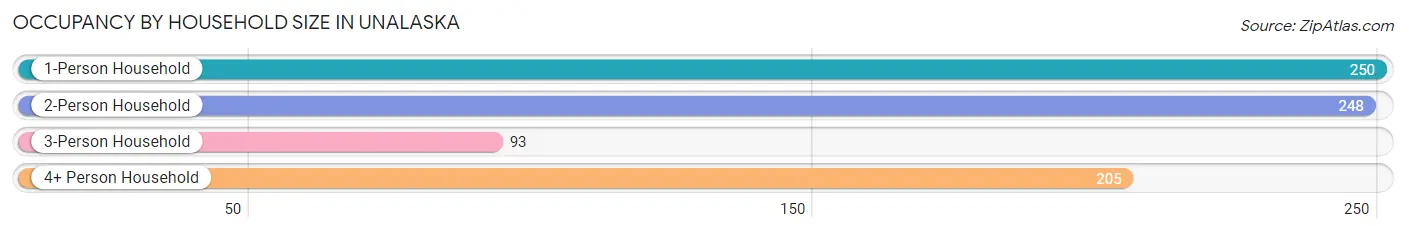
| Household Size | # Housing Units | % Housing Units |
| 1-Person Household | 250 | 31.4% |
| 2-Person Household | 248 | 31.2% |
| 3-Person Household | 93 | 11.7% |
| 4+ Person Household | 205 | 25.8% |
| Total Housing Units | 796 | 100.0% |
Occupancy by Ownership by Household Size in Unalaska
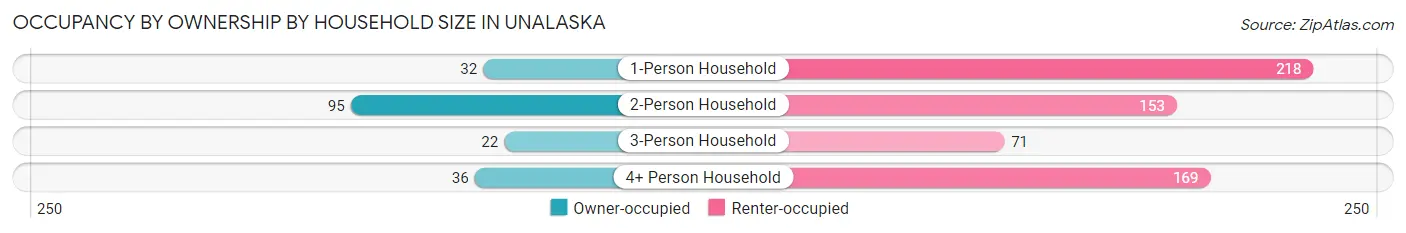
| Household Size | Owner-occupied | Renter-occupied |
| 1-Person Household | 32 (12.8%) | 218 (87.2%) |
| 2-Person Household | 95 (38.3%) | 153 (61.7%) |
| 3-Person Household | 22 (23.7%) | 71 (76.3%) |
| 4+ Person Household | 36 (17.6%) | 169 (82.4%) |
| Total Housing Units | 185 (23.2%) | 611 (76.8%) |
Occupancy by Educational Attainment in Unalaska
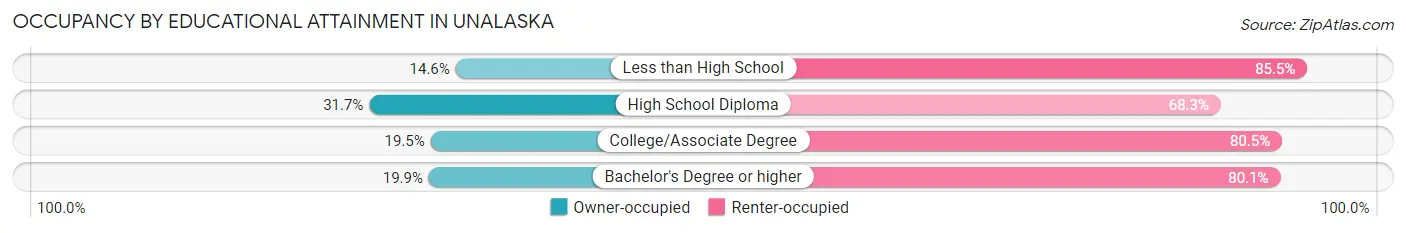
| Household Size | Owner-occupied | Renter-occupied |
| Less than High School | 8 (14.5%) | 47 (85.5%) |
| High School Diploma | 83 (31.7%) | 179 (68.3%) |
| College/Associate Degree | 65 (19.5%) | 268 (80.5%) |
| Bachelor's Degree or higher | 29 (19.9%) | 117 (80.1%) |
Occupancy by Age of Householder in Unalaska
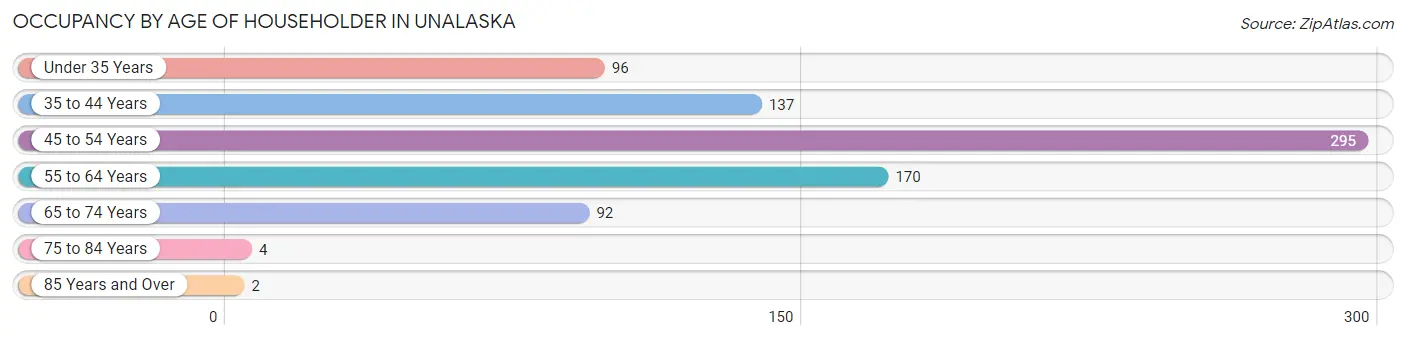
| Age Bracket | # Households | % Households |
| Under 35 Years | 96 | 12.1% |
| 35 to 44 Years | 137 | 17.2% |
| 45 to 54 Years | 295 | 37.1% |
| 55 to 64 Years | 170 | 21.4% |
| 65 to 74 Years | 92 | 11.6% |
| 75 to 84 Years | 4 | 0.5% |
| 85 Years and Over | 2 | 0.3% |
| Total | 796 | 100.0% |
Housing Finances in Unalaska
Median Income by Occupancy in Unalaska
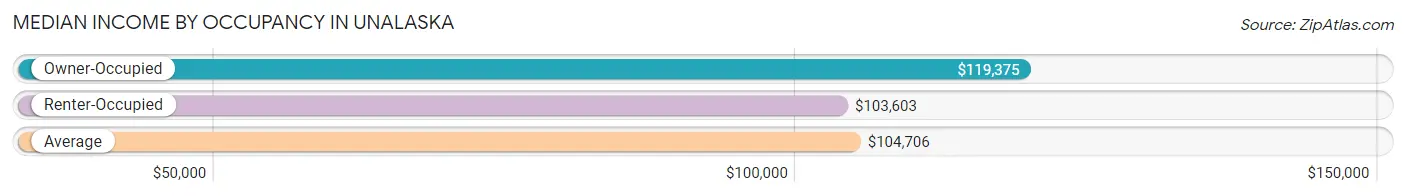
| Occupancy Type | # Households | Median Income |
| Owner-Occupied | 185 (23.2%) | $119,375 |
| Renter-Occupied | 611 (76.8%) | $103,603 |
| Average | 796 (100.0%) | $104,706 |
Occupancy by Householder Income Bracket in Unalaska
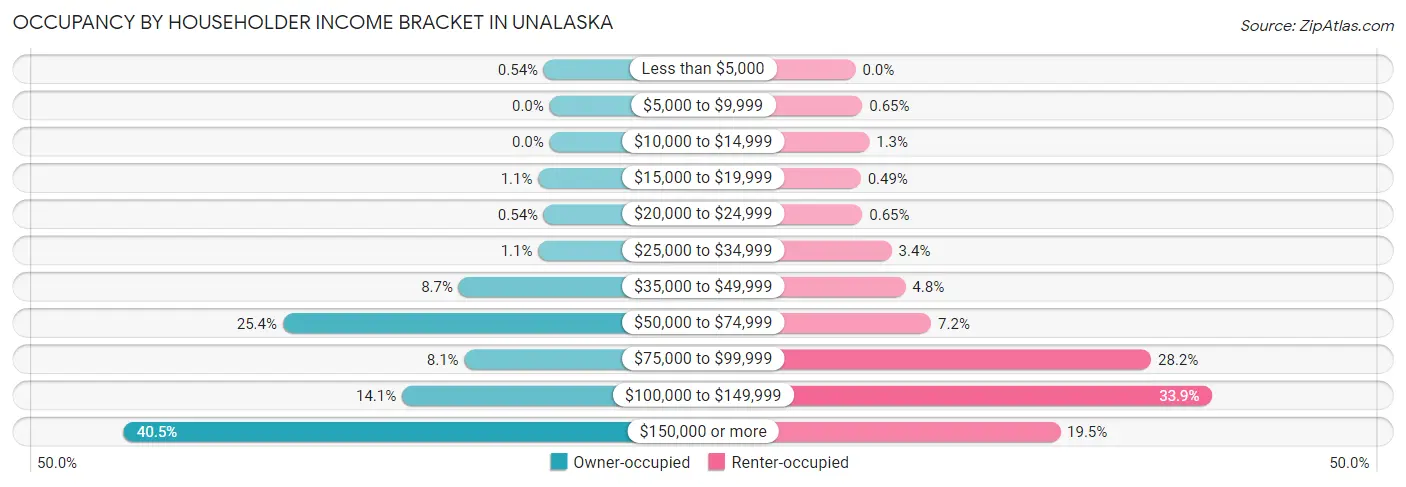
| Income Bracket | Owner-occupied | Renter-occupied |
| Less than $5,000 | 1 (0.5%) | 0 (0.0%) |
| $5,000 to $9,999 | 0 (0.0%) | 4 (0.6%) |
| $10,000 to $14,999 | 0 (0.0%) | 8 (1.3%) |
| $15,000 to $19,999 | 2 (1.1%) | 3 (0.5%) |
| $20,000 to $24,999 | 1 (0.5%) | 4 (0.6%) |
| $25,000 to $34,999 | 2 (1.1%) | 21 (3.4%) |
| $35,000 to $49,999 | 16 (8.6%) | 29 (4.8%) |
| $50,000 to $74,999 | 47 (25.4%) | 44 (7.2%) |
| $75,000 to $99,999 | 15 (8.1%) | 172 (28.1%) |
| $100,000 to $149,999 | 26 (14.1%) | 207 (33.9%) |
| $150,000 or more | 75 (40.5%) | 119 (19.5%) |
| Total | 185 (100.0%) | 611 (100.0%) |
Monthly Housing Cost Tiers in Unalaska
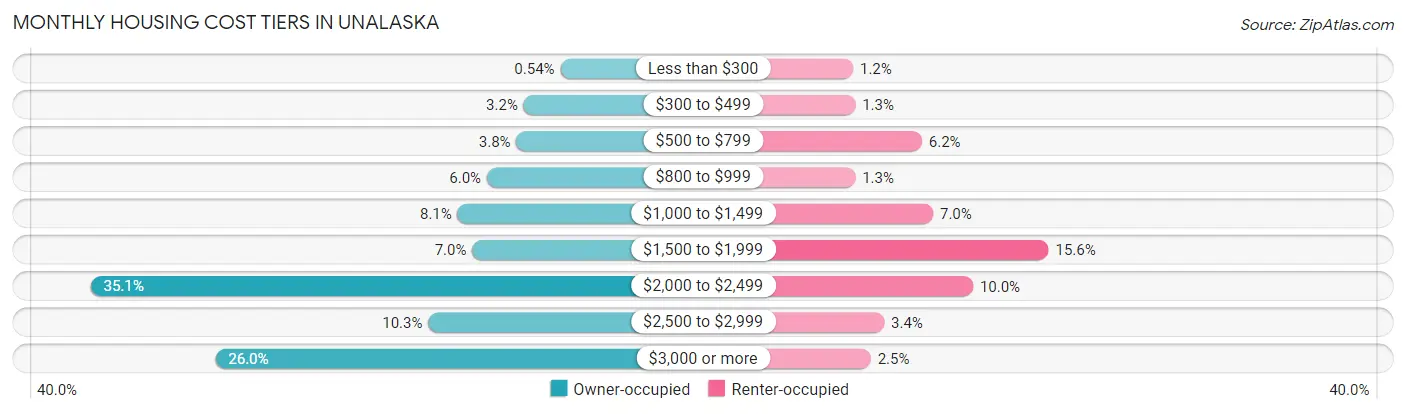
| Monthly Cost | Owner-occupied | Renter-occupied |
| Less than $300 | 1 (0.5%) | 7 (1.1%) |
| $300 to $499 | 6 (3.2%) | 8 (1.3%) |
| $500 to $799 | 7 (3.8%) | 38 (6.2%) |
| $800 to $999 | 11 (5.9%) | 8 (1.3%) |
| $1,000 to $1,499 | 15 (8.1%) | 43 (7.0%) |
| $1,500 to $1,999 | 13 (7.0%) | 95 (15.5%) |
| $2,000 to $2,499 | 65 (35.1%) | 61 (10.0%) |
| $2,500 to $2,999 | 19 (10.3%) | 21 (3.4%) |
| $3,000 or more | 48 (26.0%) | 15 (2.5%) |
| Total | 185 (100.0%) | 611 (100.0%) |
Physical Housing Characteristics in Unalaska
Housing Structures in Unalaska
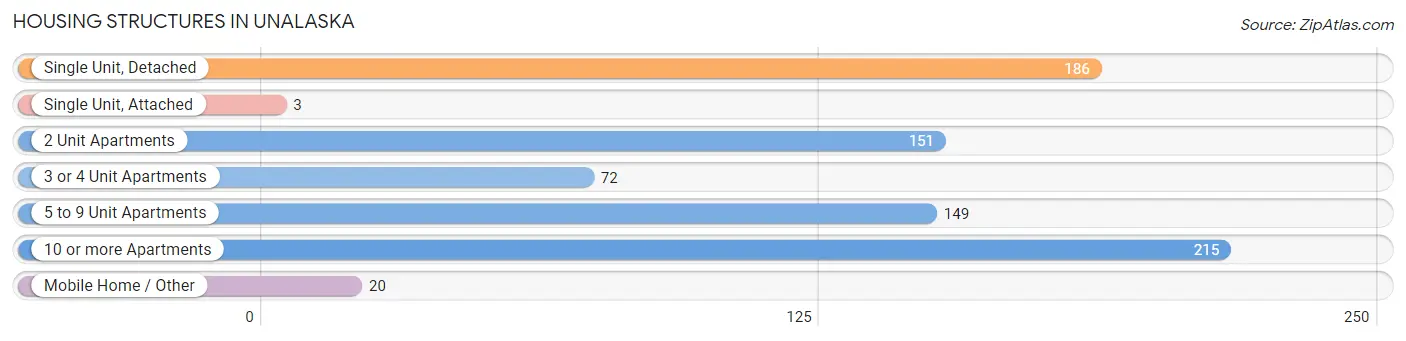
| Structure Type | # Housing Units | % Housing Units |
| Single Unit, Detached | 186 | 23.4% |
| Single Unit, Attached | 3 | 0.4% |
| 2 Unit Apartments | 151 | 19.0% |
| 3 or 4 Unit Apartments | 72 | 9.0% |
| 5 to 9 Unit Apartments | 149 | 18.7% |
| 10 or more Apartments | 215 | 27.0% |
| Mobile Home / Other | 20 | 2.5% |
| Total | 796 | 100.0% |
Housing Structures by Occupancy in Unalaska
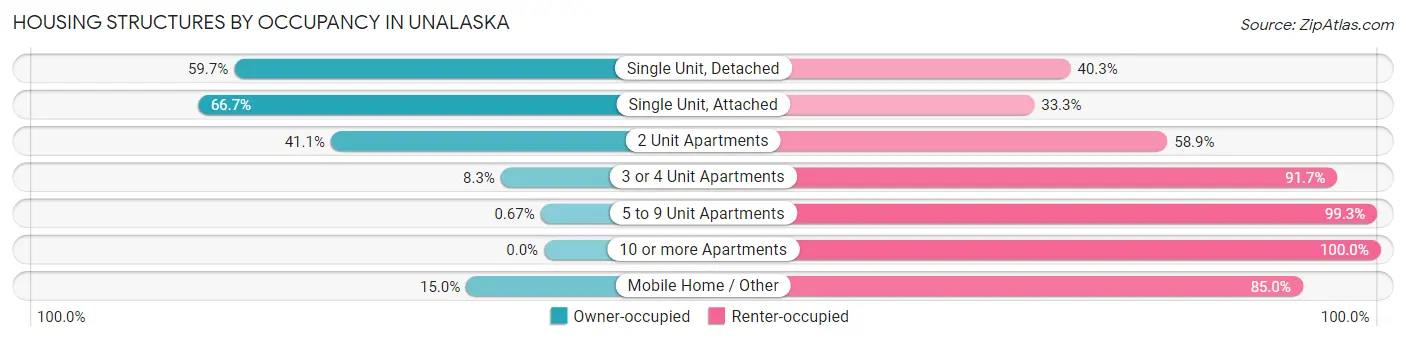
| Structure Type | Owner-occupied | Renter-occupied |
| Single Unit, Detached | 111 (59.7%) | 75 (40.3%) |
| Single Unit, Attached | 2 (66.7%) | 1 (33.3%) |
| 2 Unit Apartments | 62 (41.1%) | 89 (58.9%) |
| 3 or 4 Unit Apartments | 6 (8.3%) | 66 (91.7%) |
| 5 to 9 Unit Apartments | 1 (0.7%) | 148 (99.3%) |
| 10 or more Apartments | 0 (0.0%) | 215 (100.0%) |
| Mobile Home / Other | 3 (15.0%) | 17 (85.0%) |
| Total | 185 (23.2%) | 611 (76.8%) |
Housing Structures by Number of Rooms in Unalaska
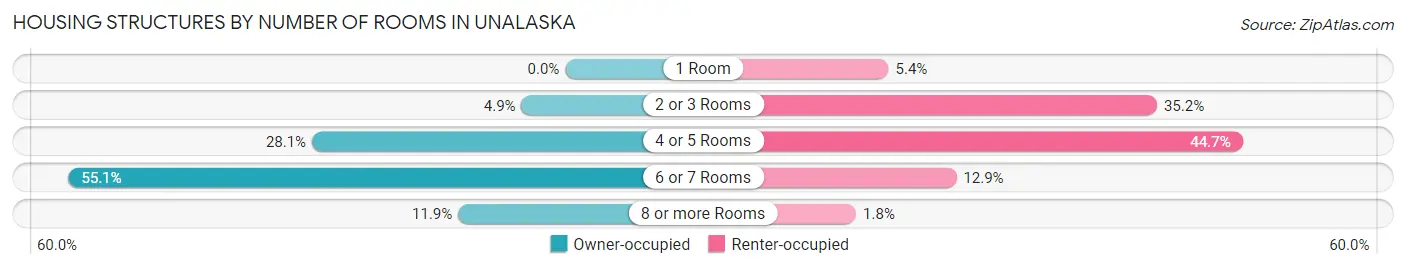
| Number of Rooms | Owner-occupied | Renter-occupied |
| 1 Room | 0 (0.0%) | 33 (5.4%) |
| 2 or 3 Rooms | 9 (4.9%) | 215 (35.2%) |
| 4 or 5 Rooms | 52 (28.1%) | 273 (44.7%) |
| 6 or 7 Rooms | 102 (55.1%) | 79 (12.9%) |
| 8 or more Rooms | 22 (11.9%) | 11 (1.8%) |
| Total | 185 (100.0%) | 611 (100.0%) |
Housing Structure by Heating Type in Unalaska
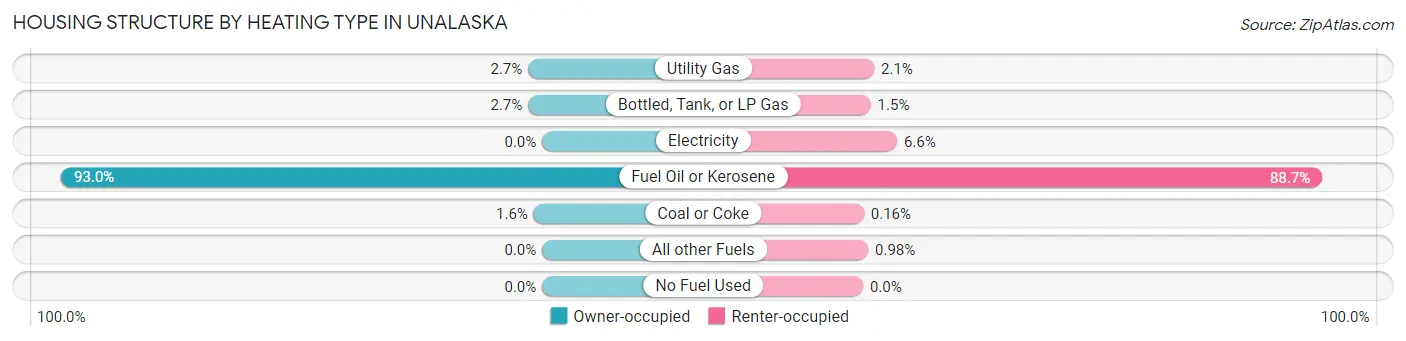
| Heating Type | Owner-occupied | Renter-occupied |
| Utility Gas | 5 (2.7%) | 13 (2.1%) |
| Bottled, Tank, or LP Gas | 5 (2.7%) | 9 (1.5%) |
| Electricity | 0 (0.0%) | 40 (6.6%) |
| Fuel Oil or Kerosene | 172 (93.0%) | 542 (88.7%) |
| Coal or Coke | 3 (1.6%) | 1 (0.2%) |
| All other Fuels | 0 (0.0%) | 6 (1.0%) |
| No Fuel Used | 0 (0.0%) | 0 (0.0%) |
| Total | 185 (100.0%) | 611 (100.0%) |
Household Vehicle Usage in Unalaska
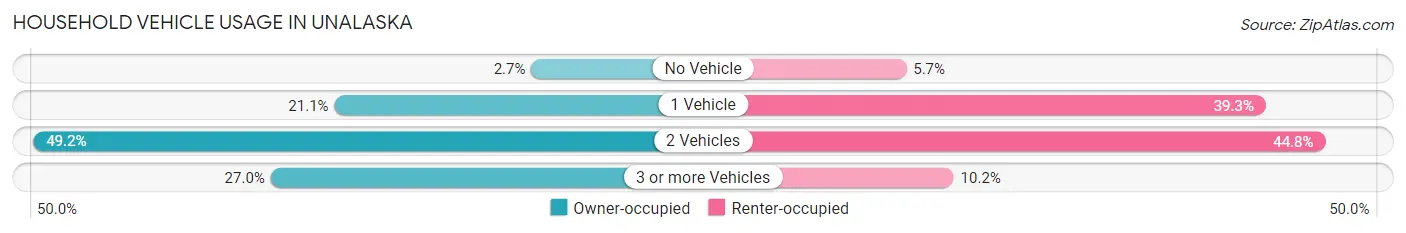
| Vehicles per Household | Owner-occupied | Renter-occupied |
| No Vehicle | 5 (2.7%) | 35 (5.7%) |
| 1 Vehicle | 39 (21.1%) | 240 (39.3%) |
| 2 Vehicles | 91 (49.2%) | 274 (44.8%) |
| 3 or more Vehicles | 50 (27.0%) | 62 (10.2%) |
| Total | 185 (100.0%) | 611 (100.0%) |
Real Estate & Mortgages in Unalaska
Real Estate and Mortgage Overview in Unalaska
| Characteristic | Without Mortgage | With Mortgage |
| Housing Units | 39 | 146 |
| Median Property Value | $335,000 | $443,000 |
| Median Household Income | $118,125 | $60 |
| Monthly Housing Costs | $913 | $48 |
| Real Estate Taxes | $2,143 | $4 |
Property Value by Mortgage Status in Unalaska
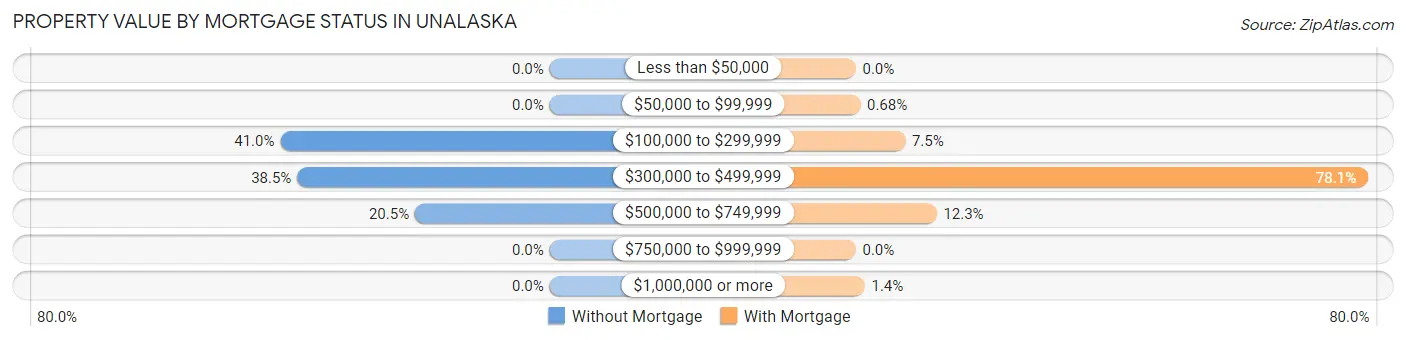
| Property Value | Without Mortgage | With Mortgage |
| Less than $50,000 | 0 (0.0%) | 0 (0.0%) |
| $50,000 to $99,999 | 0 (0.0%) | 1 (0.7%) |
| $100,000 to $299,999 | 16 (41.0%) | 11 (7.5%) |
| $300,000 to $499,999 | 15 (38.5%) | 114 (78.1%) |
| $500,000 to $749,999 | 8 (20.5%) | 18 (12.3%) |
| $750,000 to $999,999 | 0 (0.0%) | 0 (0.0%) |
| $1,000,000 or more | 0 (0.0%) | 2 (1.4%) |
| Total | 39 (100.0%) | 146 (100.0%) |
Household Income by Mortgage Status in Unalaska
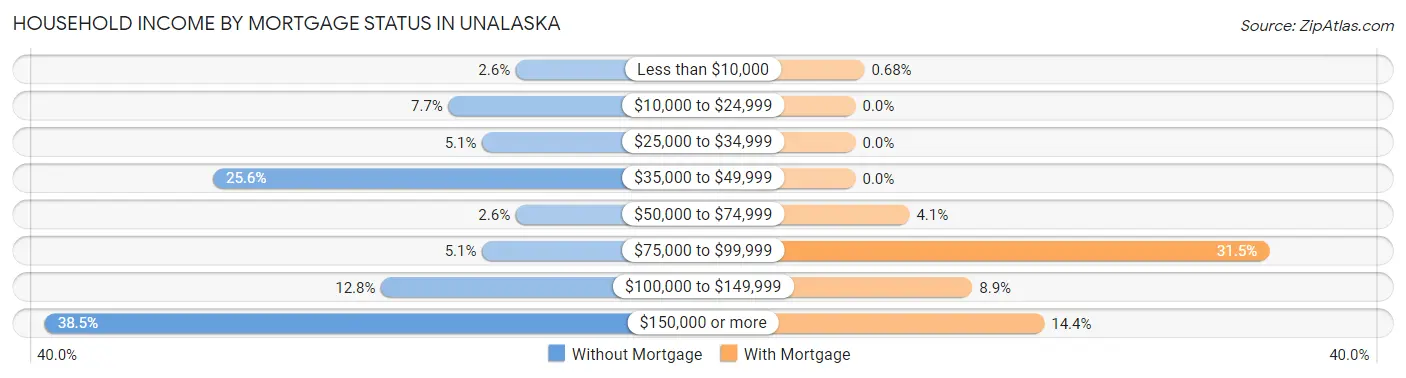
| Household Income | Without Mortgage | With Mortgage |
| Less than $10,000 | 1 (2.6%) | 1 (0.7%) |
| $10,000 to $24,999 | 3 (7.7%) | 0 (0.0%) |
| $25,000 to $34,999 | 2 (5.1%) | 0 (0.0%) |
| $35,000 to $49,999 | 10 (25.6%) | 0 (0.0%) |
| $50,000 to $74,999 | 1 (2.6%) | 6 (4.1%) |
| $75,000 to $99,999 | 2 (5.1%) | 46 (31.5%) |
| $100,000 to $149,999 | 5 (12.8%) | 13 (8.9%) |
| $150,000 or more | 15 (38.5%) | 21 (14.4%) |
| Total | 39 (100.0%) | 146 (100.0%) |
Property Value to Household Income Ratio in Unalaska
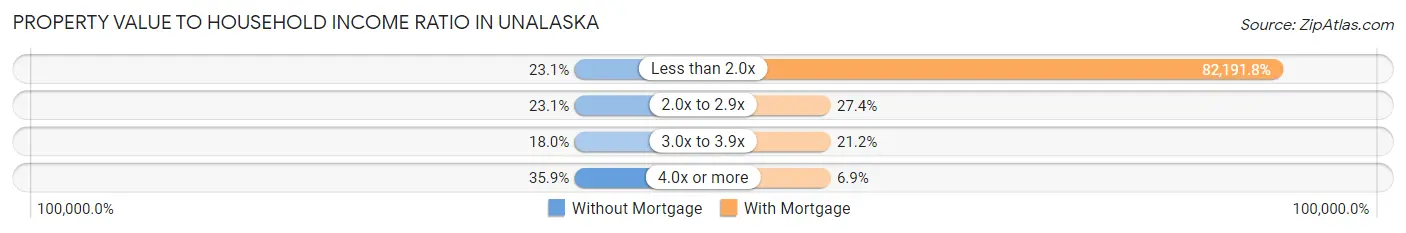
| Value-to-Income Ratio | Without Mortgage | With Mortgage |
| Less than 2.0x | 9 (23.1%) | 120,000 (82,191.8%) |
| 2.0x to 2.9x | 9 (23.1%) | 40 (27.4%) |
| 3.0x to 3.9x | 7 (17.9%) | 31 (21.2%) |
| 4.0x or more | 14 (35.9%) | 10 (6.9%) |
| Total | 39 (100.0%) | 146 (100.0%) |
Real Estate Taxes by Mortgage Status in Unalaska
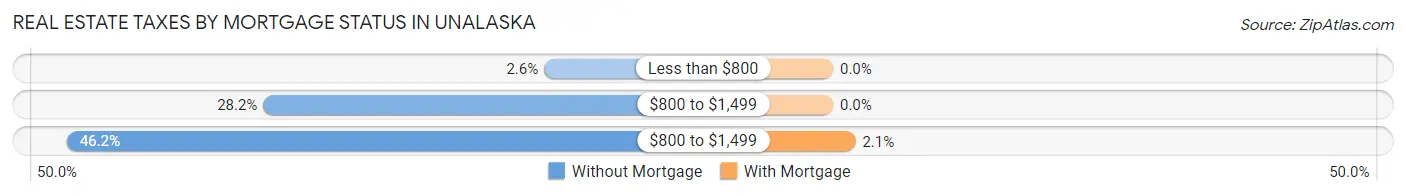
| Property Taxes | Without Mortgage | With Mortgage |
| Less than $800 | 1 (2.6%) | 0 (0.0%) |
| $800 to $1,499 | 11 (28.2%) | 0 (0.0%) |
| $800 to $1,499 | 18 (46.2%) | 3 (2.1%) |
| Total | 39 (100.0%) | 146 (100.0%) |
Health & Disability in Unalaska
Health Insurance Coverage by Age in Unalaska
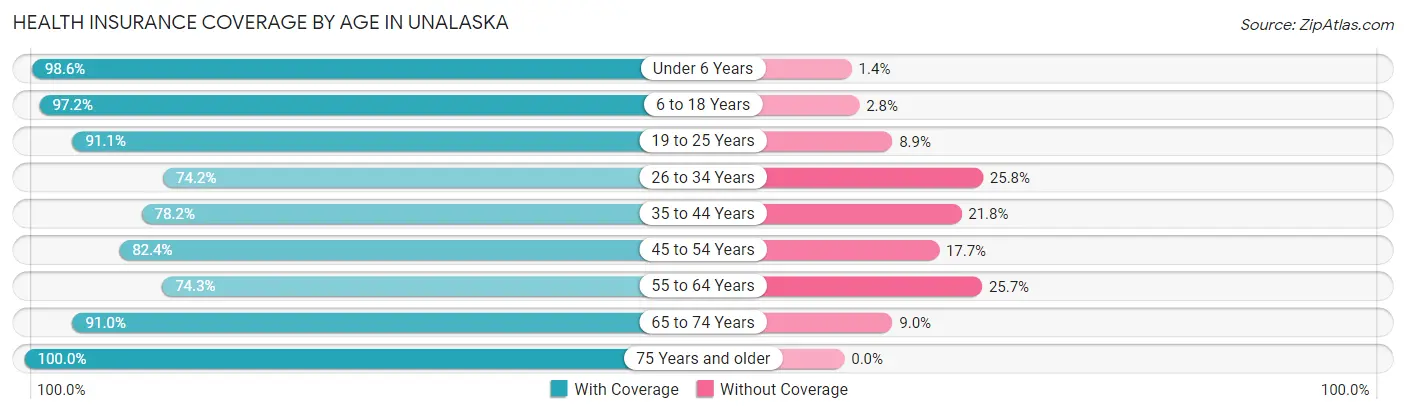
| Age Bracket | With Coverage | Without Coverage |
| Under 6 Years | 216 (98.6%) | 3 (1.4%) |
| 6 to 18 Years | 595 (97.2%) | 17 (2.8%) |
| 19 to 25 Years | 326 (91.1%) | 32 (8.9%) |
| 26 to 34 Years | 508 (74.2%) | 177 (25.8%) |
| 35 to 44 Years | 570 (78.2%) | 159 (21.8%) |
| 45 to 54 Years | 784 (82.4%) | 168 (17.6%) |
| 55 to 64 Years | 388 (74.3%) | 134 (25.7%) |
| 65 to 74 Years | 193 (91.0%) | 19 (9.0%) |
| 75 Years and older | 34 (100.0%) | 0 (0.0%) |
| Total | 3,614 (83.6%) | 709 (16.4%) |
Health Insurance Coverage by Citizenship Status in Unalaska
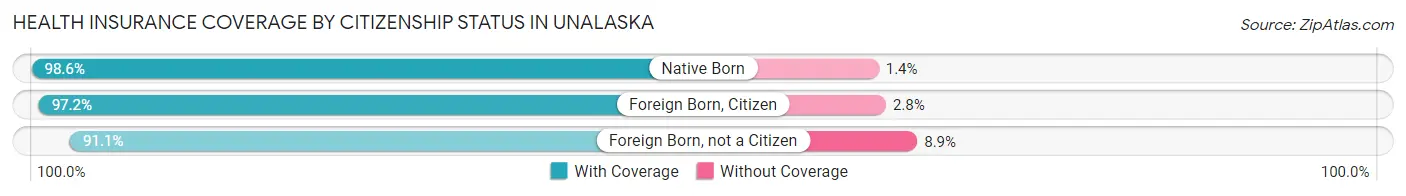
| Citizenship Status | With Coverage | Without Coverage |
| Native Born | 216 (98.6%) | 3 (1.4%) |
| Foreign Born, Citizen | 595 (97.2%) | 17 (2.8%) |
| Foreign Born, not a Citizen | 326 (91.1%) | 32 (8.9%) |
Health Insurance Coverage by Household Income in Unalaska
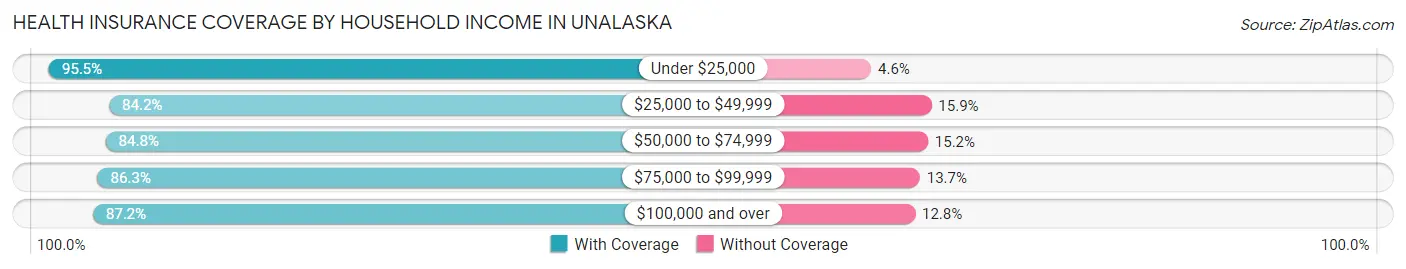
| Household Income | With Coverage | Without Coverage |
| Under $25,000 | 63 (95.5%) | 3 (4.5%) |
| $25,000 to $49,999 | 154 (84.2%) | 29 (15.9%) |
| $50,000 to $74,999 | 201 (84.8%) | 36 (15.2%) |
| $75,000 to $99,999 | 328 (86.3%) | 52 (13.7%) |
| $100,000 and over | 1,923 (87.2%) | 282 (12.8%) |
Public vs Private Health Insurance Coverage by Age in Unalaska
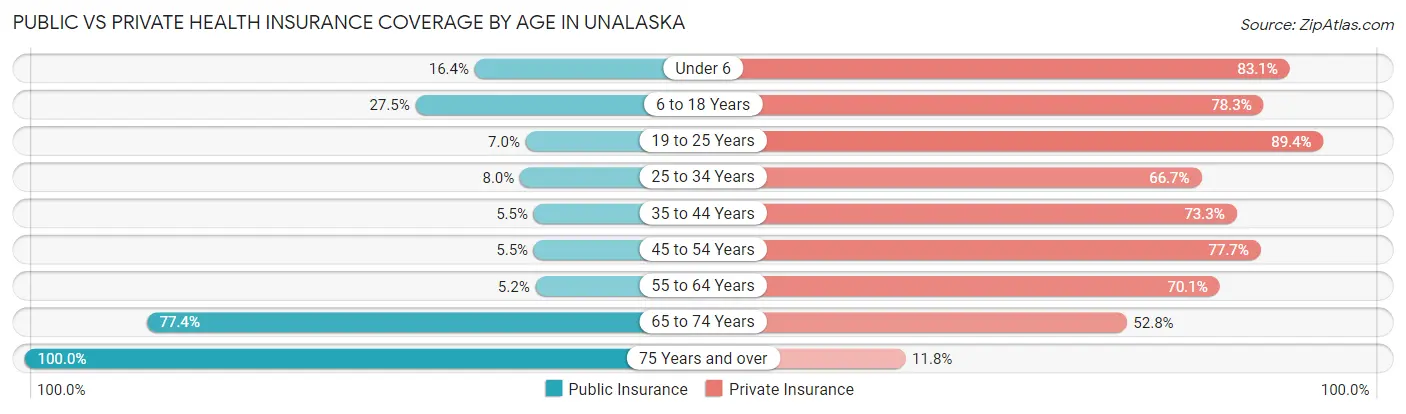
| Age Bracket | Public Insurance | Private Insurance |
| Under 6 | 36 (16.4%) | 182 (83.1%) |
| 6 to 18 Years | 168 (27.5%) | 479 (78.3%) |
| 19 to 25 Years | 25 (7.0%) | 320 (89.4%) |
| 25 to 34 Years | 55 (8.0%) | 457 (66.7%) |
| 35 to 44 Years | 40 (5.5%) | 534 (73.3%) |
| 45 to 54 Years | 52 (5.5%) | 740 (77.7%) |
| 55 to 64 Years | 27 (5.2%) | 366 (70.1%) |
| 65 to 74 Years | 164 (77.4%) | 112 (52.8%) |
| 75 Years and over | 34 (100.0%) | 4 (11.8%) |
| Total | 601 (13.9%) | 3,194 (73.9%) |
Disability Status by Sex by Age in Unalaska
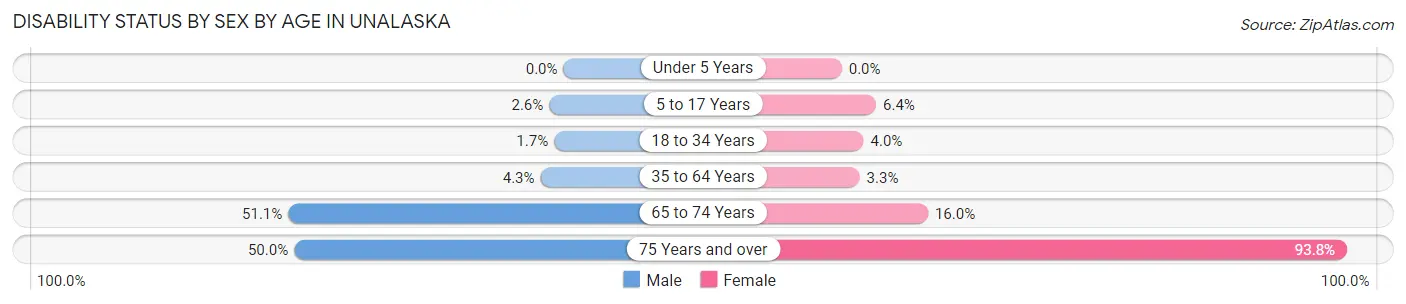
| Age Bracket | Male | Female |
| Under 5 Years | 0 (0.0%) | 0 (0.0%) |
| 5 to 17 Years | 7 (2.6%) | 18 (6.4%) |
| 18 to 34 Years | 15 (1.7%) | 11 (4.0%) |
| 35 to 64 Years | 63 (4.3%) | 24 (3.3%) |
| 65 to 74 Years | 70 (51.1%) | 12 (16.0%) |
| 75 Years and over | 1 (50.0%) | 30 (93.8%) |
Disability Class by Sex by Age in Unalaska
Disability Class: Hearing Difficulty
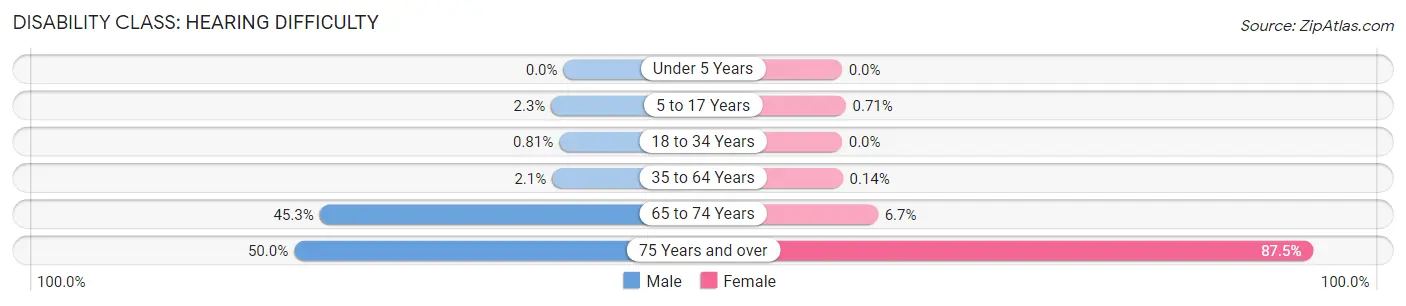
| Age Bracket | Male | Female |
| Under 5 Years | 0 (0.0%) | 0 (0.0%) |
| 5 to 17 Years | 6 (2.3%) | 2 (0.7%) |
| 18 to 34 Years | 7 (0.8%) | 0 (0.0%) |
| 35 to 64 Years | 31 (2.1%) | 1 (0.1%) |
| 65 to 74 Years | 62 (45.3%) | 5 (6.7%) |
| 75 Years and over | 1 (50.0%) | 28 (87.5%) |
Disability Class: Vision Difficulty
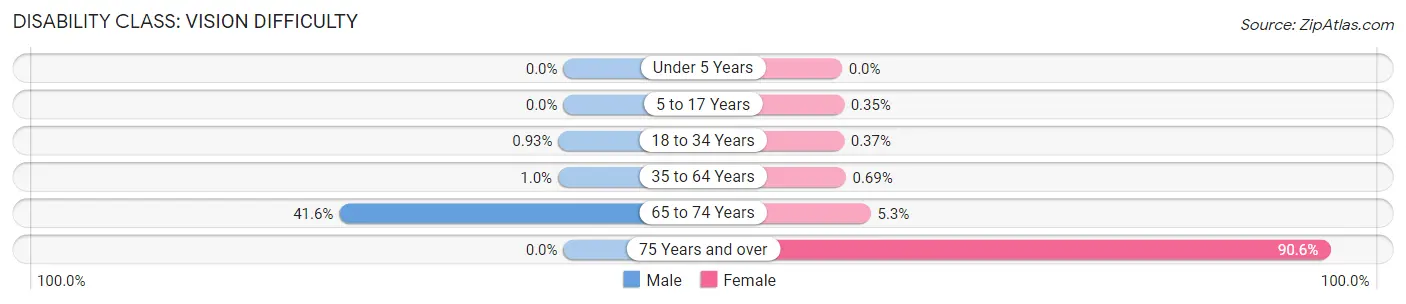
| Age Bracket | Male | Female |
| Under 5 Years | 0 (0.0%) | 0 (0.0%) |
| 5 to 17 Years | 0 (0.0%) | 1 (0.4%) |
| 18 to 34 Years | 8 (0.9%) | 1 (0.4%) |
| 35 to 64 Years | 15 (1.0%) | 5 (0.7%) |
| 65 to 74 Years | 57 (41.6%) | 4 (5.3%) |
| 75 Years and over | 0 (0.0%) | 29 (90.6%) |
Disability Class: Cognitive Difficulty
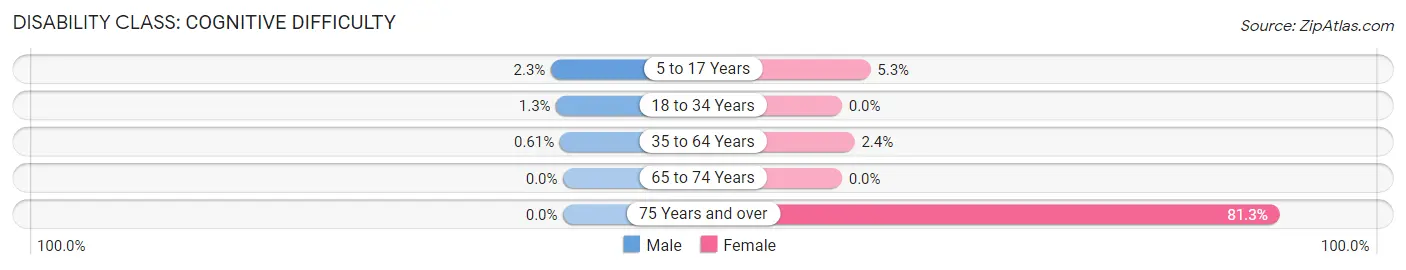
| Age Bracket | Male | Female |
| 5 to 17 Years | 6 (2.3%) | 15 (5.3%) |
| 18 to 34 Years | 11 (1.3%) | 0 (0.0%) |
| 35 to 64 Years | 9 (0.6%) | 17 (2.4%) |
| 65 to 74 Years | 0 (0.0%) | 0 (0.0%) |
| 75 Years and over | 0 (0.0%) | 26 (81.2%) |
Disability Class: Ambulatory Difficulty
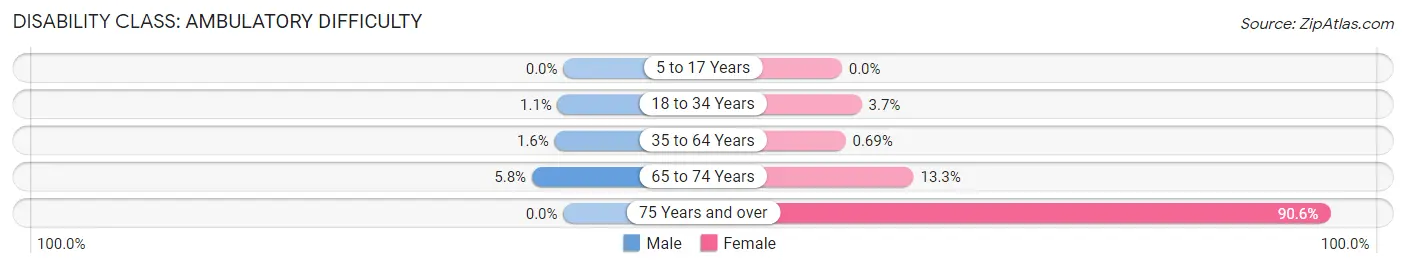
| Age Bracket | Male | Female |
| 5 to 17 Years | 0 (0.0%) | 0 (0.0%) |
| 18 to 34 Years | 9 (1.1%) | 10 (3.7%) |
| 35 to 64 Years | 24 (1.6%) | 5 (0.7%) |
| 65 to 74 Years | 8 (5.8%) | 10 (13.3%) |
| 75 Years and over | 0 (0.0%) | 29 (90.6%) |
Disability Class: Self-Care Difficulty
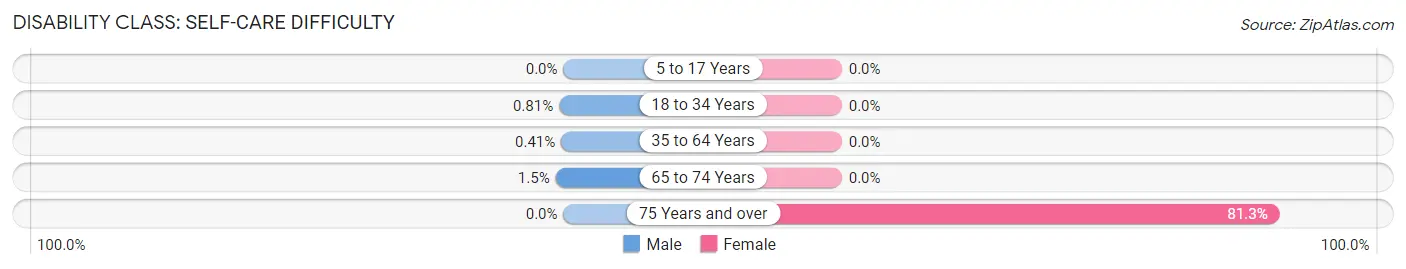
| Age Bracket | Male | Female |
| 5 to 17 Years | 0 (0.0%) | 0 (0.0%) |
| 18 to 34 Years | 7 (0.8%) | 0 (0.0%) |
| 35 to 64 Years | 6 (0.4%) | 0 (0.0%) |
| 65 to 74 Years | 2 (1.5%) | 0 (0.0%) |
| 75 Years and over | 0 (0.0%) | 26 (81.2%) |
Technology Access in Unalaska
Computing Device Access in Unalaska
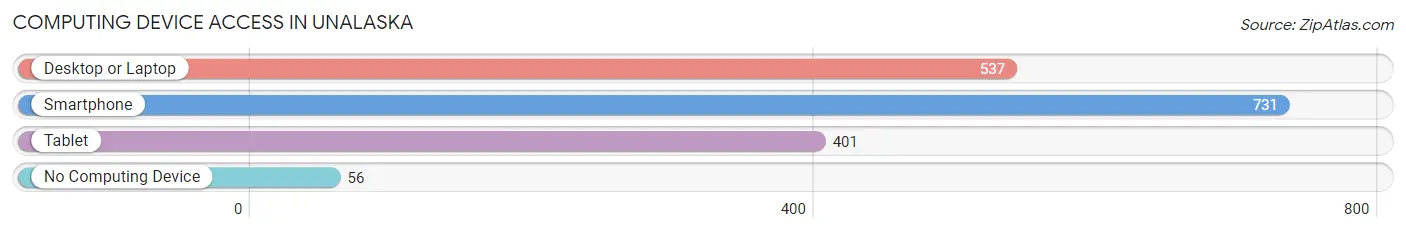
| Device Type | # Households | % Households |
| Desktop or Laptop | 537 | 67.5% |
| Smartphone | 731 | 91.8% |
| Tablet | 401 | 50.4% |
| No Computing Device | 56 | 7.0% |
| Total | 796 | 100.0% |
Internet Access in Unalaska
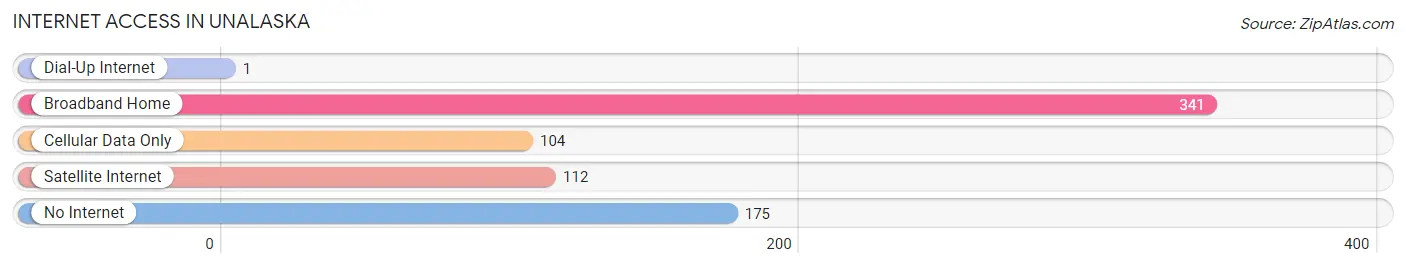
| Internet Type | # Households | % Households |
| Dial-Up Internet | 1 | 0.1% |
| Broadband Home | 341 | 42.8% |
| Cellular Data Only | 104 | 13.1% |
| Satellite Internet | 112 | 14.1% |
| No Internet | 175 | 22.0% |
| Total | 796 | 100.0% |
Unalaska Summary
Unalaska is a city located in the Aleutian Islands of Alaska. It is the largest city in the Aleutian Islands and the 11th largest city in the state of Alaska. Unalaska is located on Unalaska Island, the second largest island in the Aleutian chain. The city is situated on the eastern side of the island, facing the Bering Sea. Unalaska is the main port of the Aleutian Islands and is the hub of the fishing industry in the region.
Geography
Unalaska is located on Unalaska Island, the second largest island in the Aleutian chain. The island is located in the Bering Sea, approximately 1,200 miles southwest of Anchorage. The island is approximately 40 miles long and 20 miles wide, with a total area of 837 square miles. The terrain of the island is mostly mountainous, with the highest peak reaching an elevation of 4,715 feet. The climate of Unalaska is subarctic, with cool summers and cold winters. The average annual temperature is 37°F, with an average high of 54°F in the summer and an average low of 20°F in the winter.
History
Unalaska has a long and rich history. The island has been inhabited by the Unangan people for thousands of years. The Unangan people were a semi-nomadic hunter-gatherer society that lived off the land and sea. The Unangan people were known for their intricate basket weaving and their skill in hunting and fishing.
In 1759, the Russian explorer Vitus Bering arrived in Unalaska and claimed the island for Russia. The island was then used as a base for the Russian fur trade. In 1867, the United States purchased Alaska from Russia, and Unalaska became part of the United States.
In the early 1900s, Unalaska became a major fishing port. The island was home to a large fleet of fishing vessels, and the city became a hub for the fishing industry in the region. In the 1940s, the United States military established a base on the island, which was used as a staging area for the Aleutian Campaign during World War II.
Economy
Unalaska’s economy is largely based on fishing and seafood processing. The city is home to a large fleet of fishing vessels, and the port is a major hub for the fishing industry in the region. The city is also home to several seafood processing plants, which process and package fish and other seafood products for export.
In addition to fishing and seafood processing, Unalaska is also home to a number of other industries. The city is home to a number of retail stores, restaurants, and other businesses. The city is also home to a number of government offices, including the Unalaska City Hall and the Unalaska Public Library.
Demographics
As of the 2010 census, Unalaska had a population of 4,376. The population is largely composed of Native Americans, with the Unangan people making up the majority of the population. The city also has a large population of non-Native Americans, including people of European, Asian, and Hispanic descent.
The median household income in Unalaska is $60,945, and the median home value is $219,400. The city has a high rate of poverty, with 24.3% of the population living below the poverty line.
Conclusion
Unalaska is a city located in the Aleutian Islands of Alaska. It is the largest city in the Aleutian Islands and the 11th largest city in the state of Alaska. Unalaska is located on Unalaska Island, the second largest island in the Aleutian chain. The city is situated on the eastern side of the island, facing the Bering Sea. Unalaska is the main port of the Aleutian Islands and is the hub of the fishing industry in the region. The city has a long and rich history, and its economy is largely based on fishing and seafood processing. The population of Unalaska is largely composed of Native Americans, with the Unangan people making up the majority of the population. The city also has a large population of non-Native Americans, including people of European, Asian, and Hispanic descent.
Common Questions
What is Per Capita Income in Unalaska?
Per Capita income in Unalaska is $46,296.
What is the Median Family Income in Unalaska?
Median Family Income in Unalaska is $119,375.
What is the Median Household income in Unalaska?
Median Household Income in Unalaska is $104,706.
What is Income or Wage Gap in Unalaska?
Income or Wage Gap in Unalaska is 32.6%.
Women in Unalaska earn 67.4 cents for every dollar earned by a man.
What is Inequality or Gini Index in Unalaska?
Inequality or Gini Index in Unalaska is 0.31.
What is the Total Population of Unalaska?
Total Population of Unalaska is 4,342.
What is the Total Male Population of Unalaska?
Total Male Population of Unalaska is 2,840.
What is the Total Female Population of Unalaska?
Total Female Population of Unalaska is 1,502.
What is the Ratio of Males per 100 Females in Unalaska?
There are 189.08 Males per 100 Females in Unalaska.
What is the Ratio of Females per 100 Males in Unalaska?
There are 52.89 Females per 100 Males in Unalaska.
What is the Median Population Age in Unalaska?
Median Population Age in Unalaska is 38.7 Years.
What is the Average Family Size in Unalaska
Average Family Size in Unalaska is 4.8 People.
What is the Average Household Size in Unalaska
Average Household Size in Unalaska is 3.9 People.
How Large is the Labor Force in Unalaska?
There are 3,145 People in the Labor Forcein in Unalaska.
What is the Percentage of People in the Labor Force in Unalaska?
85.7% of People are in the Labor Force in Unalaska.
What is the Unemployment Rate in Unalaska?
Unemployment Rate in Unalaska is 3.3%.