Kaleva, MI Map & Demographics
Kaleva Map
Kaleva Overview
$18,341
PER CAPITA INCOME
$46,875
AVG FAMILY INCOME
$40,000
AVG HOUSEHOLD INCOME
17.2%
WAGE / INCOME GAP [ % ]
82.8¢/ $1
WAGE / INCOME GAP [ $ ]
0.34
INEQUALITY / GINI INDEX
487
TOTAL POPULATION
250
MALE POPULATION
237
FEMALE POPULATION
105.49
MALES / 100 FEMALES
94.80
FEMALES / 100 MALES
37.6
MEDIAN AGE
3.4
AVG FAMILY SIZE
2.5
AVG HOUSEHOLD SIZE
152
LABOR FORCE [ PEOPLE ]
41.1%
PERCENT IN LABOR FORCE
9.2%
UNEMPLOYMENT RATE
Kaleva Zip Codes
Kaleva Area Codes
Income in Kaleva
Income Overview in Kaleva
Per Capita Income in Kaleva is $18,341, while median incomes of families and households are $46,875 and $40,000 respectively.
| Characteristic | Number | Measure |
| Per Capita Income | 487 | $18,341 |
| Median Family Income | 99 | $46,875 |
| Mean Family Income | 99 | $49,753 |
| Median Household Income | 194 | $40,000 |
| Mean Household Income | 194 | $43,887 |
| Income Deficit | 99 | $0 |
| Wage / Income Gap (%) | 487 | 17.23% |
| Wage / Income Gap ($) | 487 | 82.77¢ per $1 |
| Gini / Inequality Index | 487 | 0.34 |
Earnings by Sex in Kaleva
Average Earnings in Kaleva are $29,375, $31,042 for men and $25,694 for women, a difference of 17.2%.
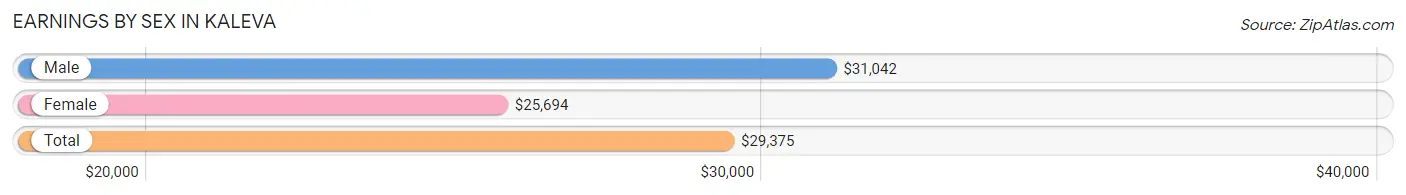
| Sex | Number | Average Earnings |
| Male | 78 (51.7%) | $31,042 |
| Female | 73 (48.3%) | $25,694 |
| Total | 151 (100.0%) | $29,375 |
Earnings by Sex by Income Bracket in Kaleva
The most common earnings brackets in Kaleva are $30,000 to $34,999 for men (17 | 21.8%) and $20,000 to $22,499 for women (11 | 15.1%).
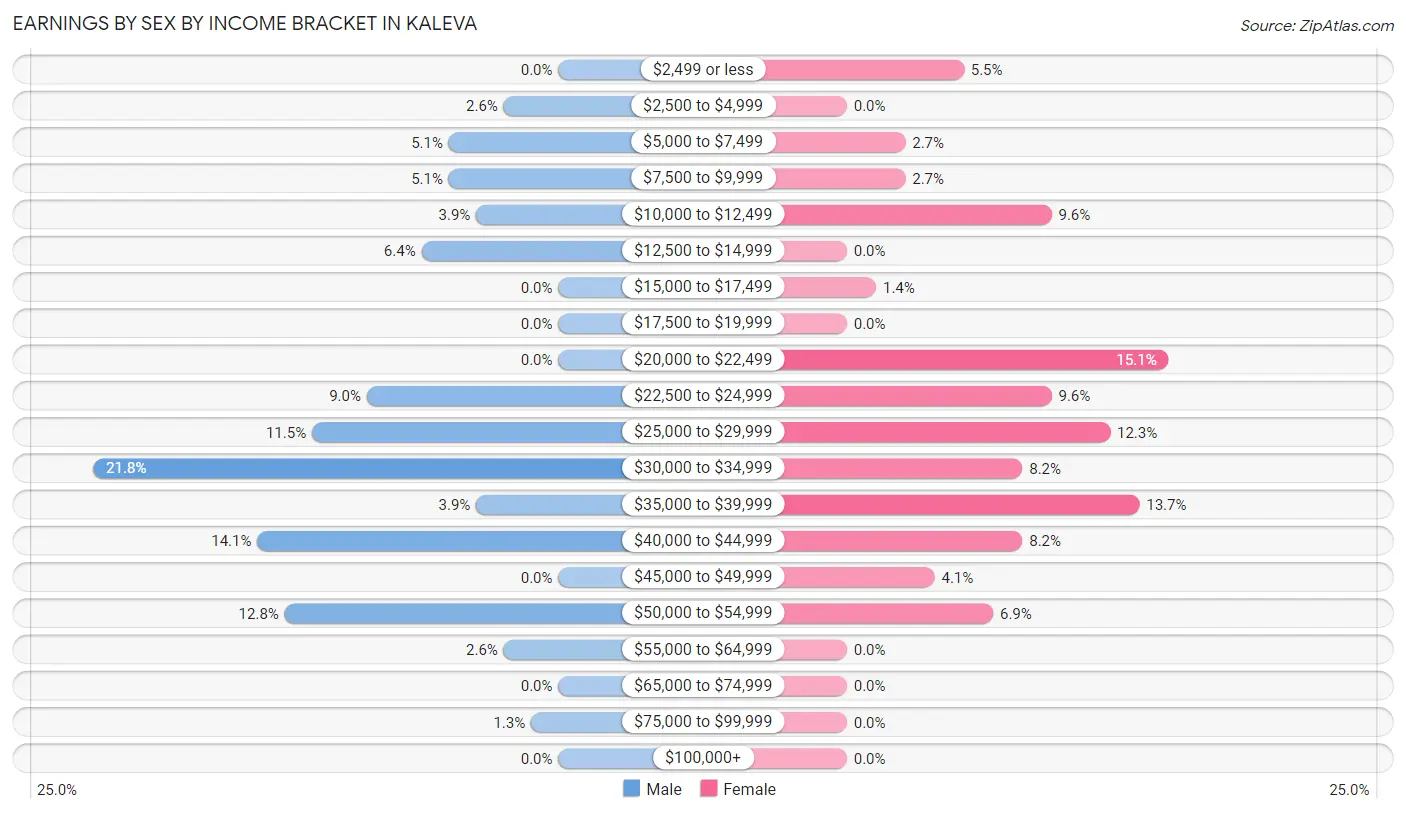
| Income | Male | Female |
| $2,499 or less | 0 (0.0%) | 4 (5.5%) |
| $2,500 to $4,999 | 2 (2.6%) | 0 (0.0%) |
| $5,000 to $7,499 | 4 (5.1%) | 2 (2.7%) |
| $7,500 to $9,999 | 4 (5.1%) | 2 (2.7%) |
| $10,000 to $12,499 | 3 (3.8%) | 7 (9.6%) |
| $12,500 to $14,999 | 5 (6.4%) | 0 (0.0%) |
| $15,000 to $17,499 | 0 (0.0%) | 1 (1.4%) |
| $17,500 to $19,999 | 0 (0.0%) | 0 (0.0%) |
| $20,000 to $22,499 | 0 (0.0%) | 11 (15.1%) |
| $22,500 to $24,999 | 7 (9.0%) | 7 (9.6%) |
| $25,000 to $29,999 | 9 (11.5%) | 9 (12.3%) |
| $30,000 to $34,999 | 17 (21.8%) | 6 (8.2%) |
| $35,000 to $39,999 | 3 (3.8%) | 10 (13.7%) |
| $40,000 to $44,999 | 11 (14.1%) | 6 (8.2%) |
| $45,000 to $49,999 | 0 (0.0%) | 3 (4.1%) |
| $50,000 to $54,999 | 10 (12.8%) | 5 (6.9%) |
| $55,000 to $64,999 | 2 (2.6%) | 0 (0.0%) |
| $65,000 to $74,999 | 0 (0.0%) | 0 (0.0%) |
| $75,000 to $99,999 | 1 (1.3%) | 0 (0.0%) |
| $100,000+ | 0 (0.0%) | 0 (0.0%) |
| Total | 78 (100.0%) | 73 (100.0%) |
Earnings by Sex by Educational Attainment in Kaleva
Average earnings in Kaleva are $31,042 for men and $26,389 for women, a difference of 15.0%. Men with an educational attainment of high school diploma enjoy the highest average annual earnings of $31,250, while those with college or associate's degree education earn the least with $30,556. Women with an educational attainment of high school diploma earn the most with the average annual earnings of $35,000, while those with college or associate's degree education have the smallest earnings of $25,278.
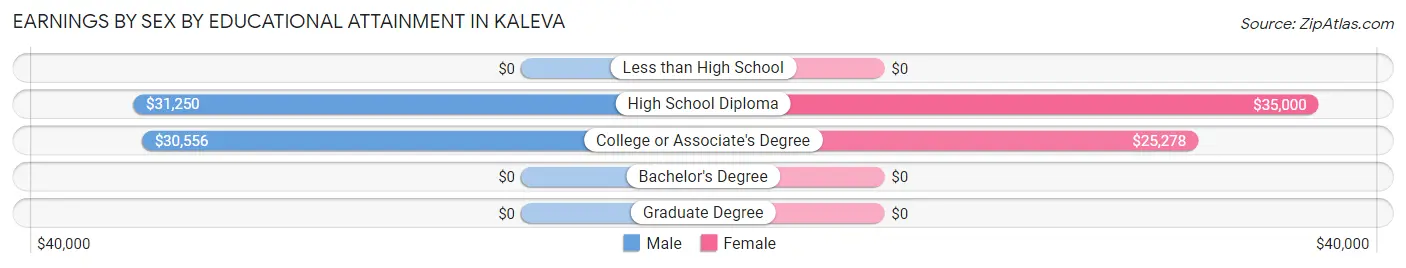
| Educational Attainment | Male Income | Female Income |
| Less than High School | - | - |
| High School Diploma | $31,250 | $35,000 |
| College or Associate's Degree | $30,556 | $25,278 |
| Bachelor's Degree | - | - |
| Graduate Degree | - | - |
| Total | $31,042 | $26,389 |
Family Income in Kaleva
Family Income Brackets in Kaleva
According to the Kaleva family income data, there are 30 families falling into the $35,000 to $49,999 income range, which is the most common income bracket and makes up 30.3% of all families.
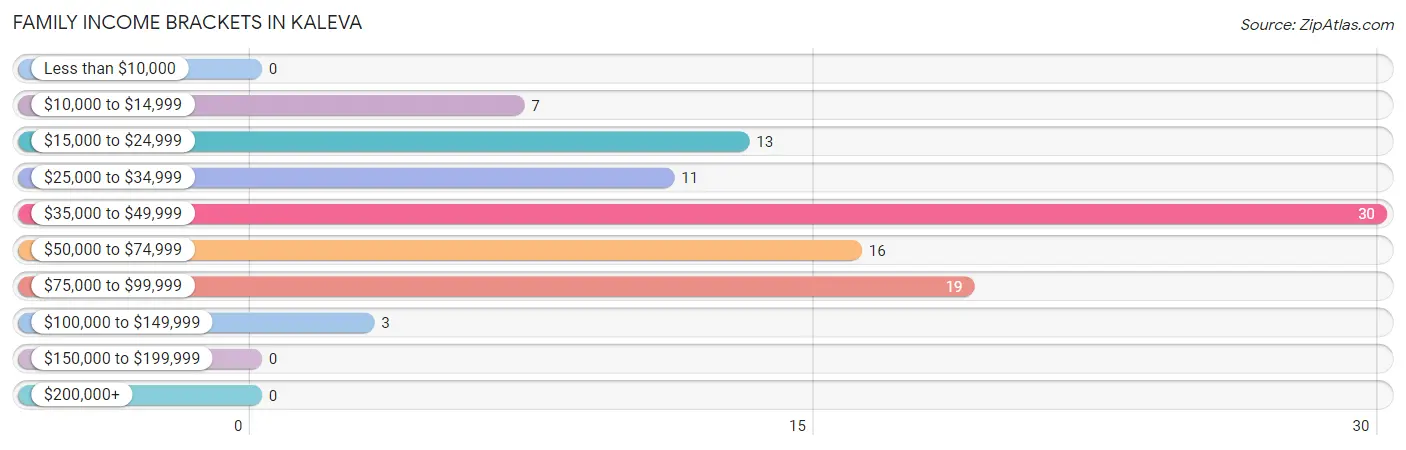
| Income Bracket | # Families | % Families |
| Less than $10,000 | 0 | 0.0% |
| $10,000 to $14,999 | 7 | 7.1% |
| $15,000 to $24,999 | 13 | 13.1% |
| $25,000 to $34,999 | 11 | 11.1% |
| $35,000 to $49,999 | 30 | 30.3% |
| $50,000 to $74,999 | 16 | 16.2% |
| $75,000 to $99,999 | 19 | 19.2% |
| $100,000 to $149,999 | 3 | 3.0% |
| $150,000 to $199,999 | 0 | 0.0% |
| $200,000+ | 0 | 0.0% |
Family Income by Famaliy Size in Kaleva
2-person families (58 | 58.6%) account for the highest median family income in Kaleva with $49,318 per family, while 2-person families (58 | 58.6%) have the highest median income of $24,659 per family member.
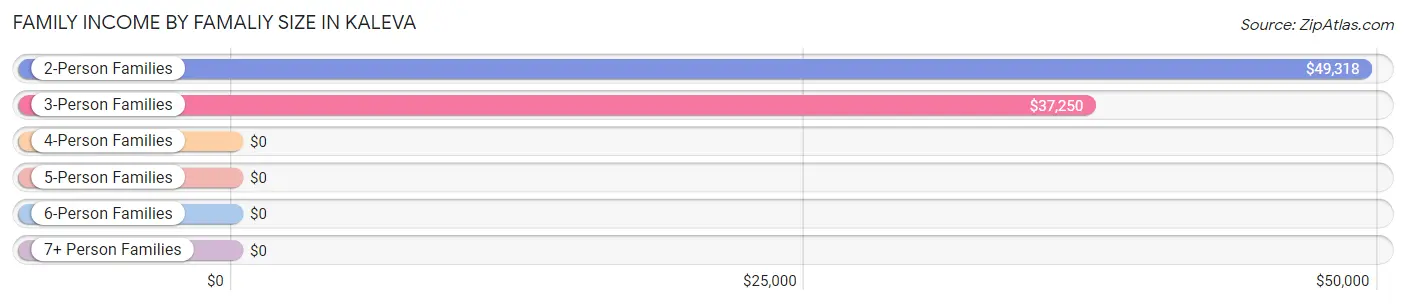
| Income Bracket | # Families | Median Income |
| 2-Person Families | 58 (58.6%) | $49,318 |
| 3-Person Families | 15 (15.1%) | $37,250 |
| 4-Person Families | 13 (13.1%) | $0 |
| 5-Person Families | 2 (2.0%) | $0 |
| 6-Person Families | 2 (2.0%) | $0 |
| 7+ Person Families | 9 (9.1%) | $0 |
| Total | 99 (100.0%) | $46,875 |
Family Income by Number of Earners in Kaleva
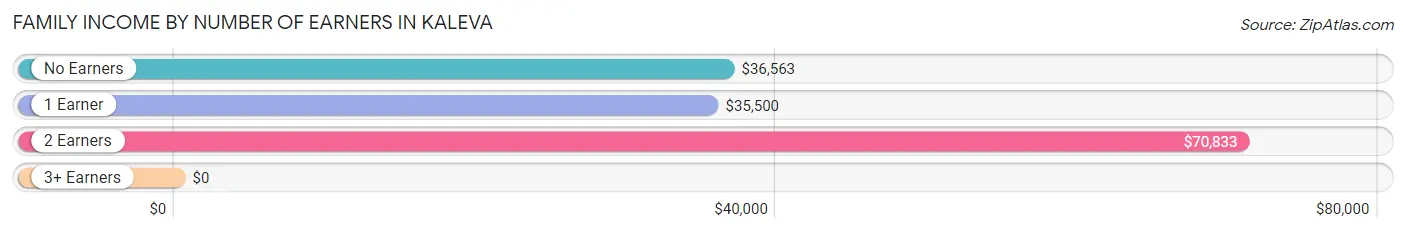
| Number of Earners | # Families | Median Income |
| No Earners | 25 (25.3%) | $36,563 |
| 1 Earner | 44 (44.4%) | $35,500 |
| 2 Earners | 30 (30.3%) | $70,833 |
| 3+ Earners | 0 (0.0%) | $0 |
| Total | 99 (100.0%) | $46,875 |
Household Income in Kaleva
Household Income Brackets in Kaleva
With 41 households falling in the category, the $35,000 to $49,999 income range is the most frequent in Kaleva, accounting for 21.1% of all households.
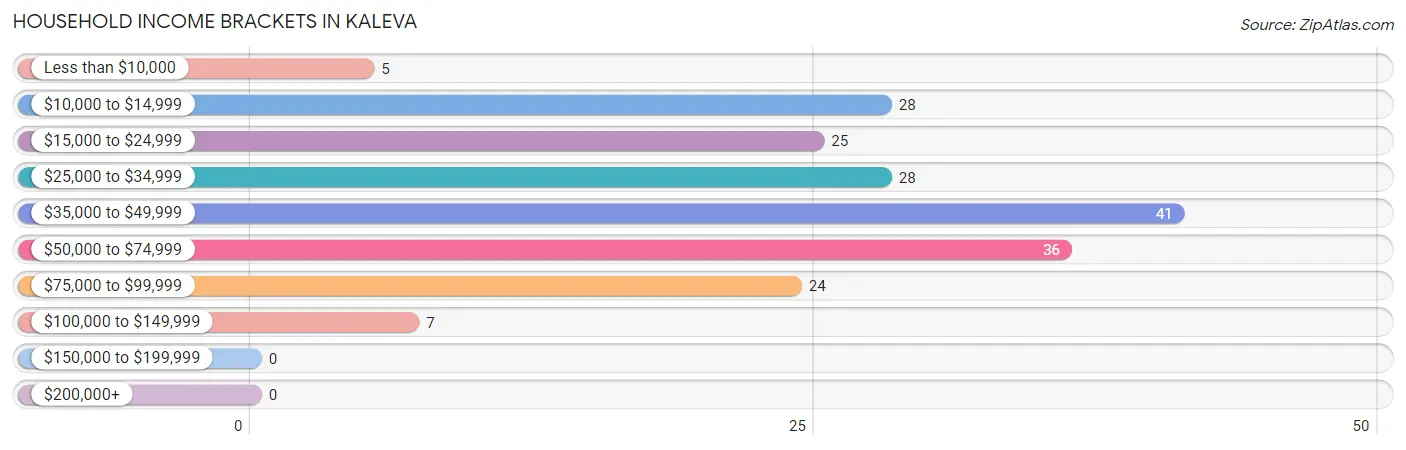
| Income Bracket | # Households | % Households |
| Less than $10,000 | 5 | 2.6% |
| $10,000 to $14,999 | 28 | 14.4% |
| $15,000 to $24,999 | 25 | 12.9% |
| $25,000 to $34,999 | 28 | 14.4% |
| $35,000 to $49,999 | 41 | 21.1% |
| $50,000 to $74,999 | 36 | 18.6% |
| $75,000 to $99,999 | 24 | 12.4% |
| $100,000 to $149,999 | 7 | 3.6% |
| $150,000 to $199,999 | 0 | 0.0% |
| $200,000+ | 0 | 0.0% |
Household Income by Householder Age in Kaleva
The median household income in Kaleva is $40,000, with the highest median household income of $43,000 found in the 65+ years age bracket for the primary householder. A total of 82 households (42.3%) fall into this category. Meanwhile, the 15 to 24 years age bracket for the primary householder has the lowest median household income of $0, with 2 households (1.0%) in this group.
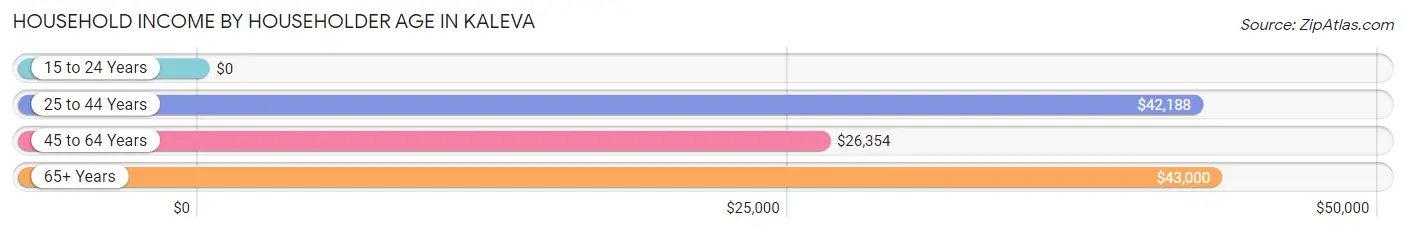
| Income Bracket | # Households | Median Income |
| 15 to 24 Years | 2 (1.0%) | $0 |
| 25 to 44 Years | 55 (28.3%) | $42,188 |
| 45 to 64 Years | 55 (28.3%) | $26,354 |
| 65+ Years | 82 (42.3%) | $43,000 |
| Total | 194 (100.0%) | $40,000 |
Poverty in Kaleva
Income Below Poverty by Sex and Age in Kaleva
With 42.6% poverty level for males and 36.2% for females among the residents of Kaleva, 6 to 11 year old males and 6 to 11 year old females are the most vulnerable to poverty, with 22 males (100.0%) and 3 females (100.0%) in their respective age groups living below the poverty level.
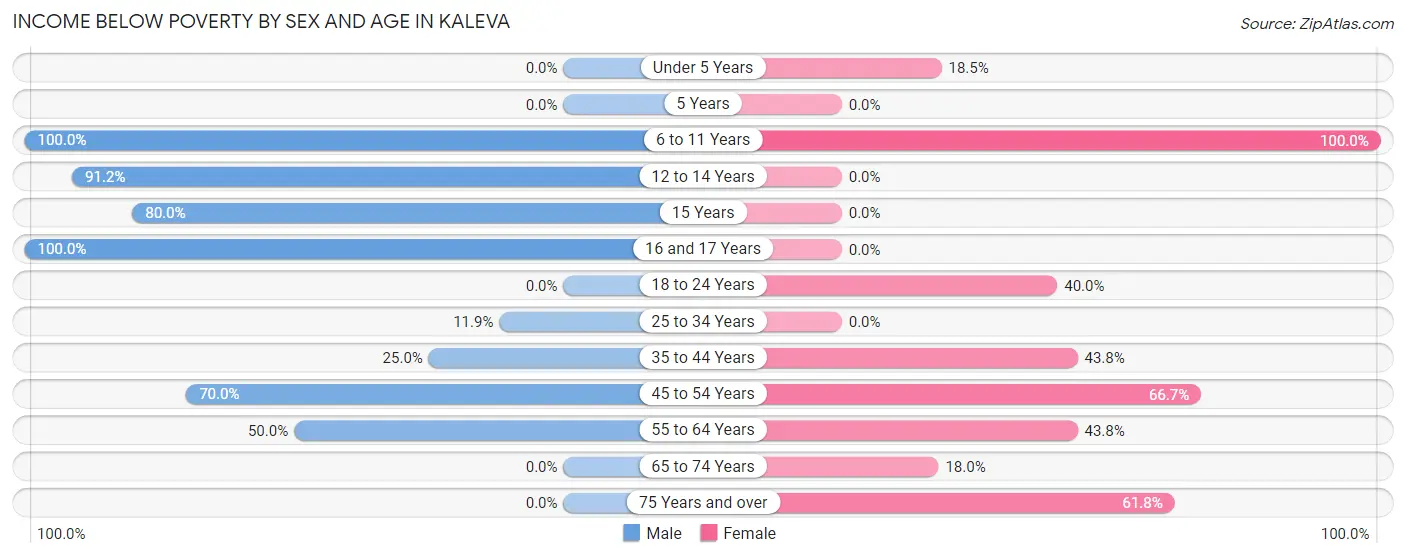
| Age Bracket | Male | Female |
| Under 5 Years | 0 (0.0%) | 5 (18.5%) |
| 5 Years | 0 (0.0%) | 0 (0.0%) |
| 6 to 11 Years | 22 (100.0%) | 3 (100.0%) |
| 12 to 14 Years | 31 (91.2%) | 0 (0.0%) |
| 15 Years | 4 (80.0%) | 0 (0.0%) |
| 16 and 17 Years | 15 (100.0%) | 0 (0.0%) |
| 18 to 24 Years | 0 (0.0%) | 6 (40.0%) |
| 25 to 34 Years | 5 (11.9%) | 0 (0.0%) |
| 35 to 44 Years | 6 (25.0%) | 7 (43.8%) |
| 45 to 54 Years | 7 (70.0%) | 20 (66.7%) |
| 55 to 64 Years | 13 (50.0%) | 14 (43.8%) |
| 65 to 74 Years | 0 (0.0%) | 7 (17.9%) |
| 75 Years and over | 0 (0.0%) | 21 (61.8%) |
| Total | 103 (42.6%) | 83 (36.2%) |
Income Above Poverty by Sex and Age in Kaleva
According to the poverty statistics in Kaleva, males aged under 5 years and females aged 12 to 14 years are the age groups that are most secure financially, with 100.0% of males and 100.0% of females in these age groups living above the poverty line.
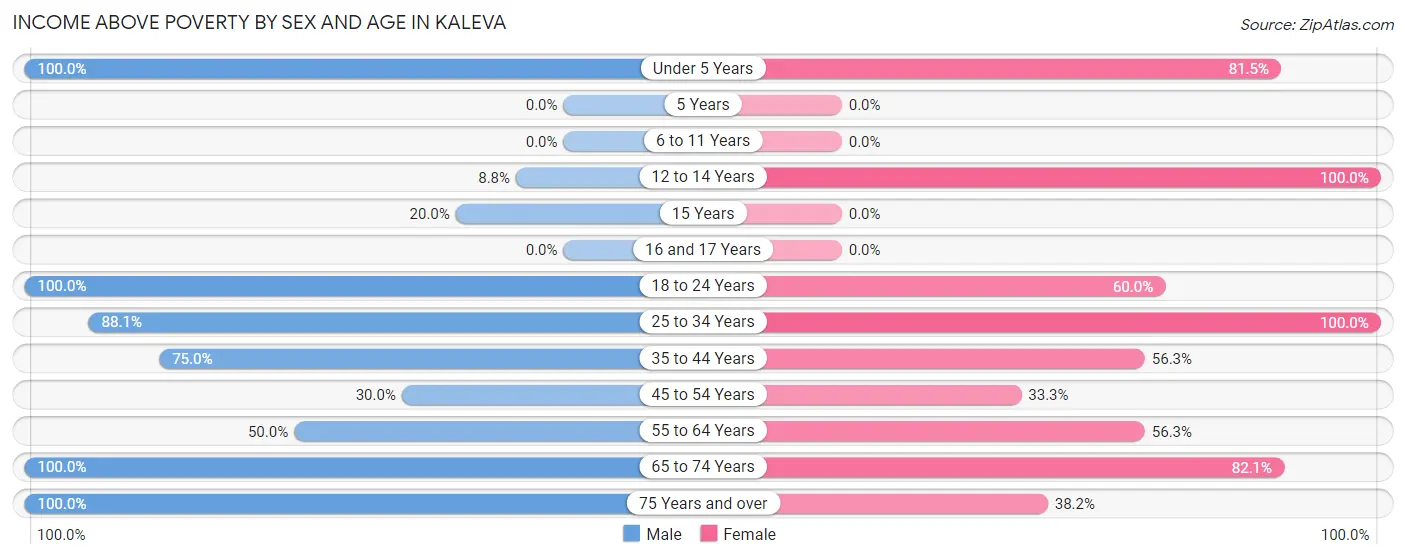
| Age Bracket | Male | Female |
| Under 5 Years | 8 (100.0%) | 22 (81.5%) |
| 5 Years | 0 (0.0%) | 0 (0.0%) |
| 6 to 11 Years | 0 (0.0%) | 0 (0.0%) |
| 12 to 14 Years | 3 (8.8%) | 2 (100.0%) |
| 15 Years | 1 (20.0%) | 0 (0.0%) |
| 16 and 17 Years | 0 (0.0%) | 0 (0.0%) |
| 18 to 24 Years | 5 (100.0%) | 9 (60.0%) |
| 25 to 34 Years | 37 (88.1%) | 31 (100.0%) |
| 35 to 44 Years | 18 (75.0%) | 9 (56.2%) |
| 45 to 54 Years | 3 (30.0%) | 10 (33.3%) |
| 55 to 64 Years | 13 (50.0%) | 18 (56.2%) |
| 65 to 74 Years | 27 (100.0%) | 32 (82.1%) |
| 75 Years and over | 24 (100.0%) | 13 (38.2%) |
| Total | 139 (57.4%) | 146 (63.8%) |
Income Below Poverty Among Married-Couple Families in Kaleva
The poverty statistics for married-couple families in Kaleva show that 29.9% or 23 of the total 77 families live below the poverty line. Families with 3 or 4 children have the highest poverty rate of 100.0%, comprising of 2 families. On the other hand, families with no children have the lowest poverty rate of 15.2%, which includes 7 families.
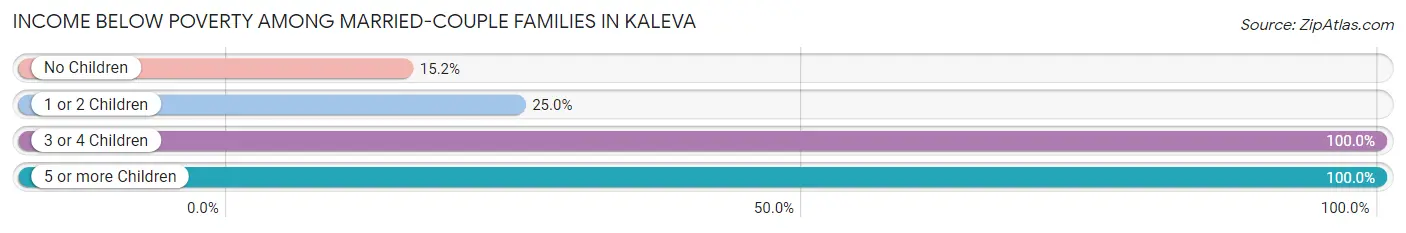
| Children | Above Poverty | Below Poverty |
| No Children | 39 (84.8%) | 7 (15.2%) |
| 1 or 2 Children | 15 (75.0%) | 5 (25.0%) |
| 3 or 4 Children | 0 (0.0%) | 2 (100.0%) |
| 5 or more Children | 0 (0.0%) | 9 (100.0%) |
| Total | 54 (70.1%) | 23 (29.9%) |
Income Below Poverty Among Single-Parent Households in Kaleva
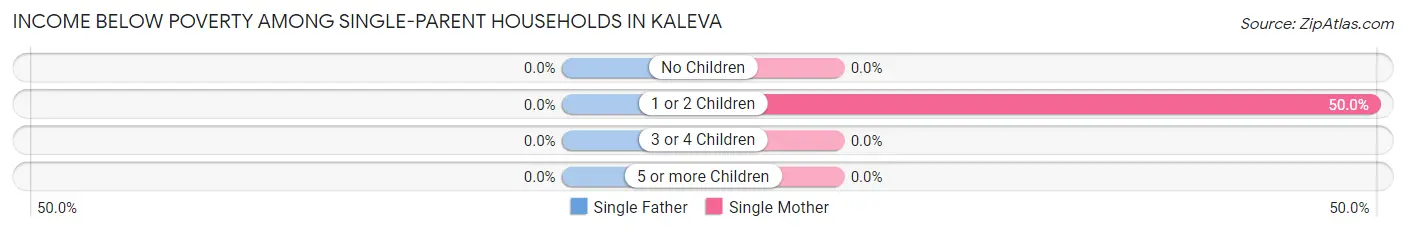
| Children | Single Father | Single Mother |
| No Children | 0 (0.0%) | 0 (0.0%) |
| 1 or 2 Children | 0 (0.0%) | 3 (50.0%) |
| 3 or 4 Children | 0 (0.0%) | 0 (0.0%) |
| 5 or more Children | 0 (0.0%) | 0 (0.0%) |
| Total | 0 (0.0%) | 3 (20.0%) |
Income Below Poverty Among Married-Couple vs Single-Parent Households in Kaleva
The poverty data for Kaleva shows that 23 of the married-couple family households (29.9%) and 3 of the single-parent households (13.6%) are living below the poverty level. Within the married-couple family households, those with 3 or 4 children have the highest poverty rate, with 2 households (100.0%) falling below the poverty line. Among the single-parent households, those with 1 or 2 children have the highest poverty rate, with 3 household (37.5%) living below poverty.
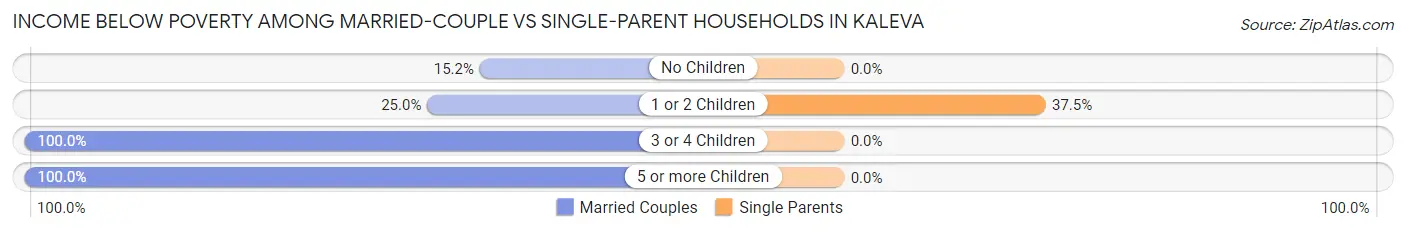
| Children | Married-Couple Families | Single-Parent Households |
| No Children | 7 (15.2%) | 0 (0.0%) |
| 1 or 2 Children | 5 (25.0%) | 3 (37.5%) |
| 3 or 4 Children | 2 (100.0%) | 0 (0.0%) |
| 5 or more Children | 9 (100.0%) | 0 (0.0%) |
| Total | 23 (29.9%) | 3 (13.6%) |
Race in Kaleva
The most populous races in Kaleva are White / Caucasian (465 | 95.5%), Hispanic or Latino (18 | 3.7%), and Two or more Races (14 | 2.9%).
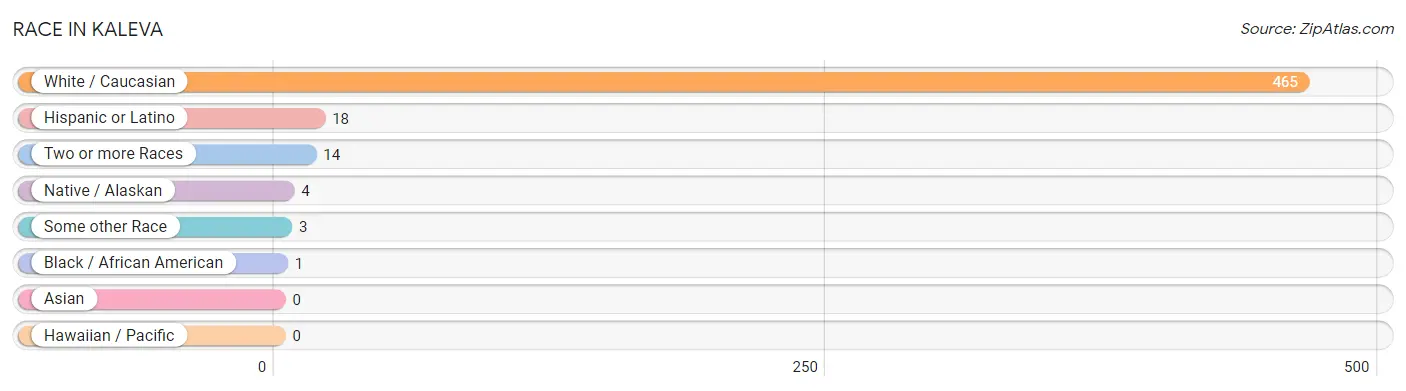
| Race | # Population | % Population |
| Asian | 0 | 0.0% |
| Black / African American | 1 | 0.2% |
| Hawaiian / Pacific | 0 | 0.0% |
| Hispanic or Latino | 18 | 3.7% |
| Native / Alaskan | 4 | 0.8% |
| White / Caucasian | 465 | 95.5% |
| Two or more Races | 14 | 2.9% |
| Some other Race | 3 | 0.6% |
| Total | 487 | 100.0% |
Ancestry in Kaleva
The most populous ancestries reported in Kaleva are German (113 | 23.2%), Irish (63 | 12.9%), Polish (49 | 10.1%), English (38 | 7.8%), and French (31 | 6.4%), together accounting for 60.4% of all Kaleva residents.
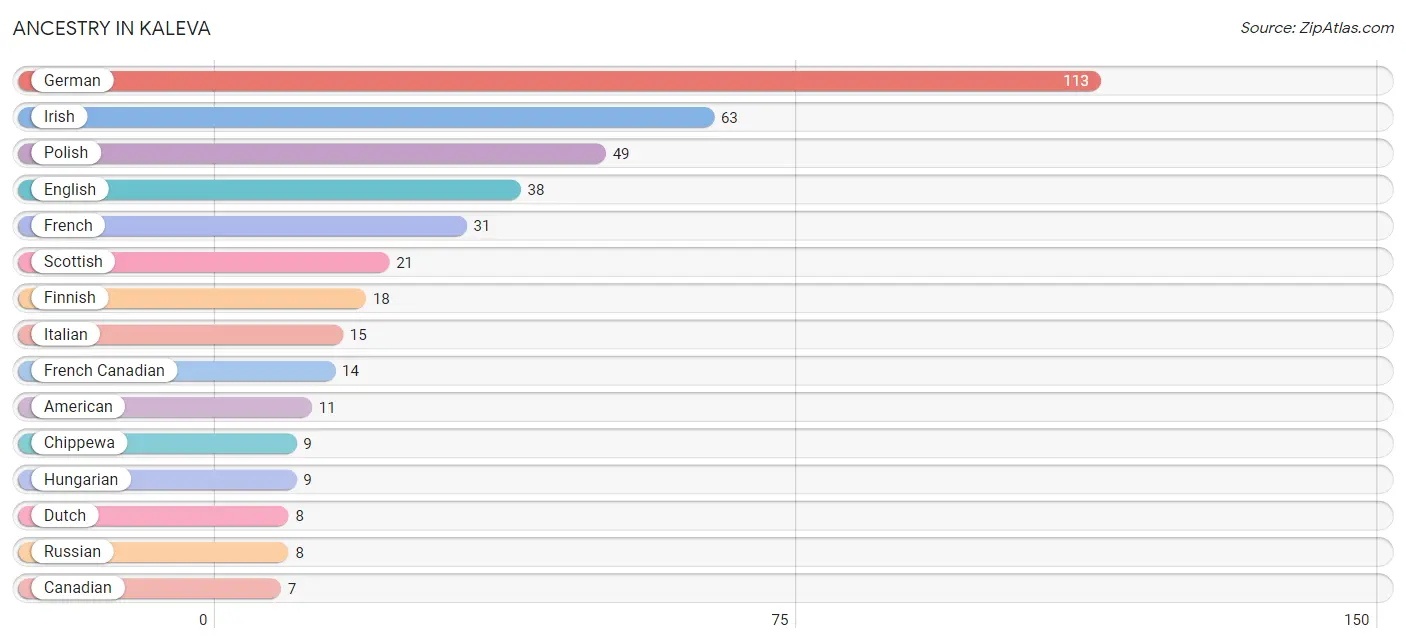
| Ancestry | # Population | % Population |
| American | 11 | 2.3% |
| Canadian | 7 | 1.4% |
| Chippewa | 9 | 1.8% |
| Choctaw | 1 | 0.2% |
| Danish | 4 | 0.8% |
| Dutch | 8 | 1.6% |
| English | 38 | 7.8% |
| Finnish | 18 | 3.7% |
| French | 31 | 6.4% |
| French Canadian | 14 | 2.9% |
| German | 113 | 23.2% |
| Hungarian | 9 | 1.8% |
| Irish | 63 | 12.9% |
| Italian | 15 | 3.1% |
| Macedonian | 7 | 1.4% |
| Mexican | 3 | 0.6% |
| Norwegian | 3 | 0.6% |
| Polish | 49 | 10.1% |
| Puerto Rican | 3 | 0.6% |
| Russian | 8 | 1.6% |
| Scottish | 21 | 4.3% |
| Spaniard | 5 | 1.0% |
| Spanish | 7 | 1.4% |
| Swedish | 1 | 0.2% | View All 24 Rows |
Immigrants in Kaleva
The most numerous immigrant groups reported in Kaleva came from Eastern Europe (4 | 0.8%), Europe (4 | 0.8%), and North Macedonia (4 | 0.8%), together accounting for 2.5% of all Kaleva residents.
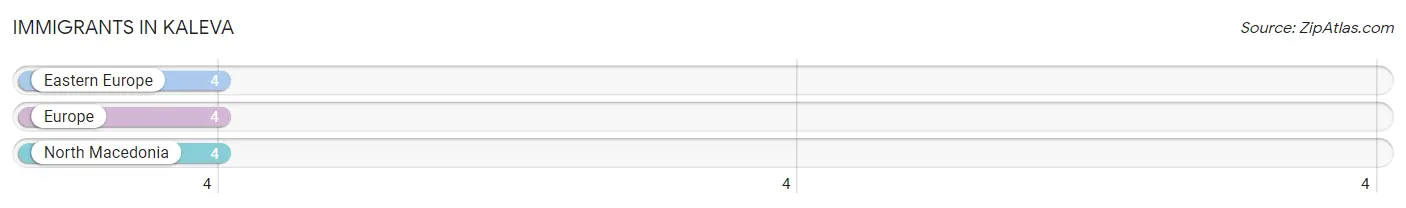
| Immigration Origin | # Population | % Population |
| Eastern Europe | 4 | 0.8% |
| Europe | 4 | 0.8% |
| North Macedonia | 4 | 0.8% | View All 3 Rows |
Sex and Age in Kaleva
Sex and Age in Kaleva
The most populous age groups in Kaleva are 10 to 14 Years (42 | 16.8%) for men and Under 5 Years (35 | 14.8%) for women.
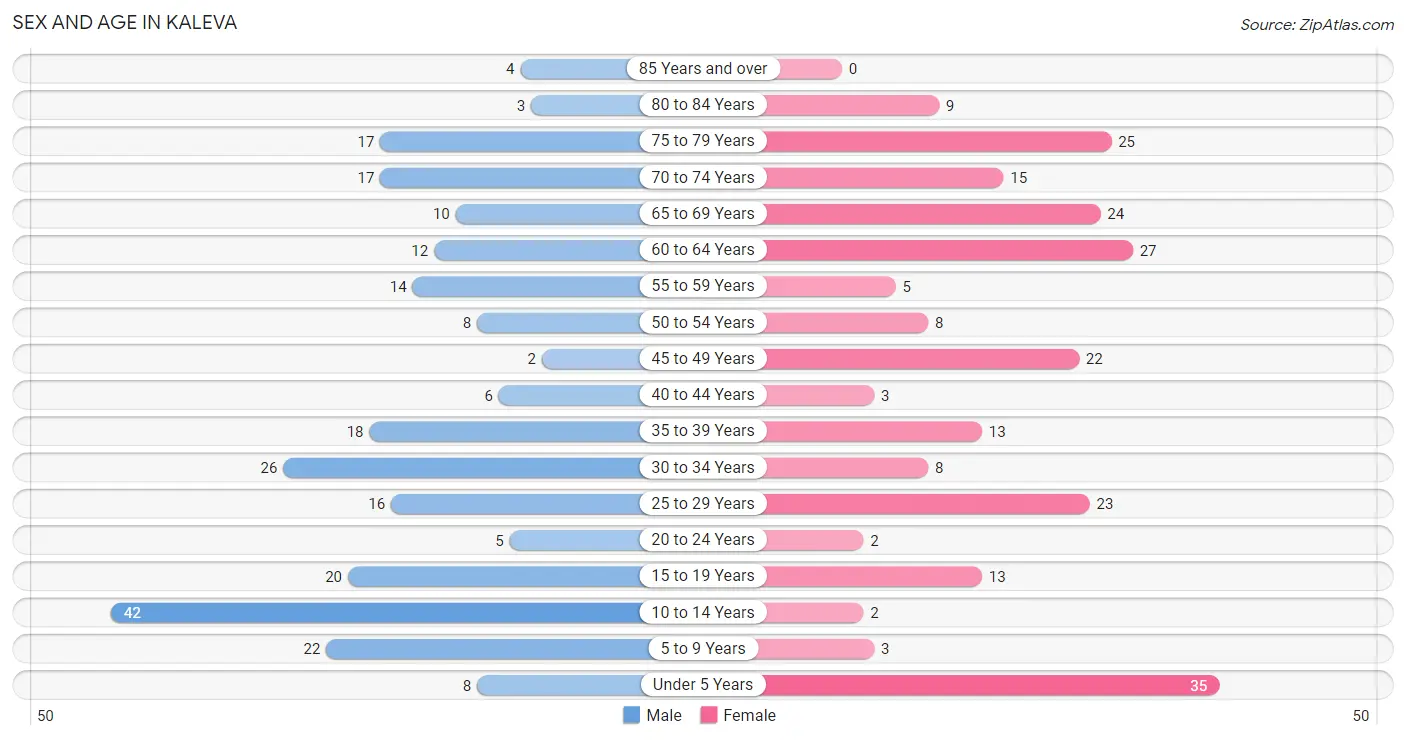
| Age Bracket | Male | Female |
| Under 5 Years | 8 (3.2%) | 35 (14.8%) |
| 5 to 9 Years | 22 (8.8%) | 3 (1.3%) |
| 10 to 14 Years | 42 (16.8%) | 2 (0.8%) |
| 15 to 19 Years | 20 (8.0%) | 13 (5.5%) |
| 20 to 24 Years | 5 (2.0%) | 2 (0.8%) |
| 25 to 29 Years | 16 (6.4%) | 23 (9.7%) |
| 30 to 34 Years | 26 (10.4%) | 8 (3.4%) |
| 35 to 39 Years | 18 (7.2%) | 13 (5.5%) |
| 40 to 44 Years | 6 (2.4%) | 3 (1.3%) |
| 45 to 49 Years | 2 (0.8%) | 22 (9.3%) |
| 50 to 54 Years | 8 (3.2%) | 8 (3.4%) |
| 55 to 59 Years | 14 (5.6%) | 5 (2.1%) |
| 60 to 64 Years | 12 (4.8%) | 27 (11.4%) |
| 65 to 69 Years | 10 (4.0%) | 24 (10.1%) |
| 70 to 74 Years | 17 (6.8%) | 15 (6.3%) |
| 75 to 79 Years | 17 (6.8%) | 25 (10.5%) |
| 80 to 84 Years | 3 (1.2%) | 9 (3.8%) |
| 85 Years and over | 4 (1.6%) | 0 (0.0%) |
| Total | 250 (100.0%) | 237 (100.0%) |
Families and Households in Kaleva
Median Family Size in Kaleva
The median family size in Kaleva is 3.44 persons per family, with single male/father families (7 | 7.1%) accounting for the largest median family size of 4.29 persons per family. On the other hand, single female/mother families (15 | 15.1%) represent the smallest median family size with 3.07 persons per family.
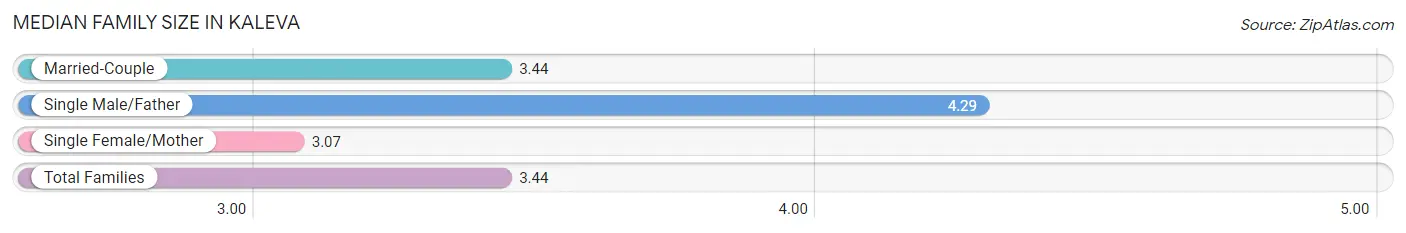
| Family Type | # Families | Family Size |
| Married-Couple | 77 (77.8%) | 3.44 |
| Single Male/Father | 7 (7.1%) | 4.29 |
| Single Female/Mother | 15 (15.1%) | 3.07 |
| Total Families | 99 (100.0%) | 3.44 |
Median Household Size in Kaleva
The median household size in Kaleva is 2.51 persons per household, with single male/father households (7 | 3.6%) accounting for the largest median household size of 5 persons per household. non-family households (95 | 49.0%) represent the smallest median household size with 1.48 persons per household.
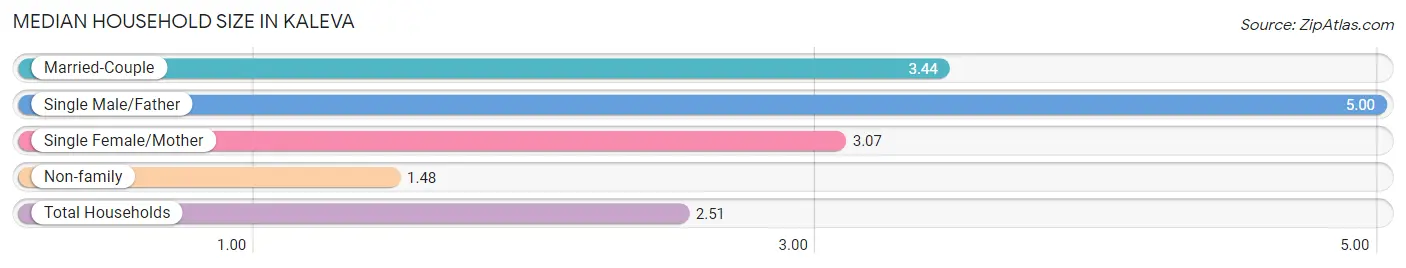
| Household Type | # Households | Household Size |
| Married-Couple | 77 (39.7%) | 3.44 |
| Single Male/Father | 7 (3.6%) | 5.00 |
| Single Female/Mother | 15 (7.7%) | 3.07 |
| Non-family | 95 (49.0%) | 1.48 |
| Total Households | 194 (100.0%) | 2.51 |
Household Size by Marriage Status in Kaleva
Out of a total of 194 households in Kaleva, 99 (51.0%) are family households, while 95 (49.0%) are nonfamily households. The most numerous type of family households are 2-person households, comprising 54, and the most common type of nonfamily households are 1-person households, comprising 72.
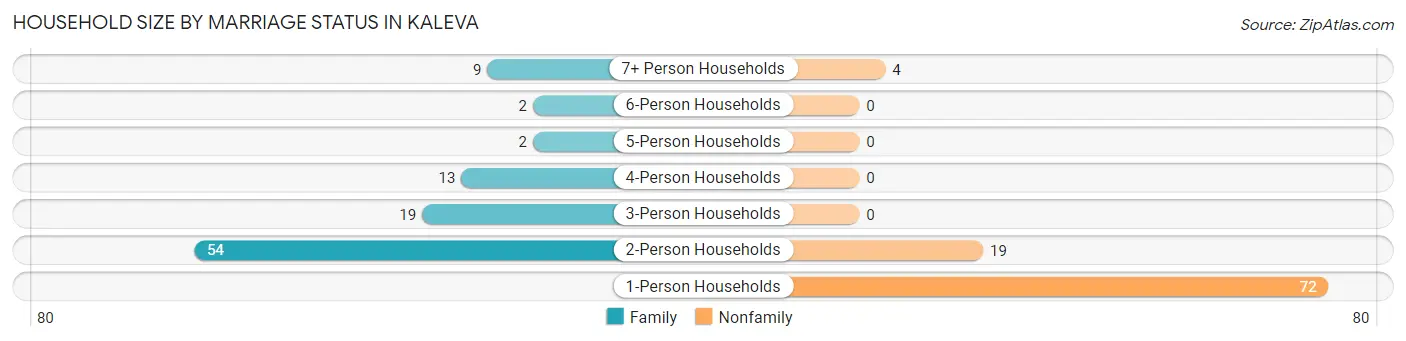
| Household Size | Family Households | Nonfamily Households |
| 1-Person Households | - | 72 (37.1%) |
| 2-Person Households | 54 (27.8%) | 19 (9.8%) |
| 3-Person Households | 19 (9.8%) | 0 (0.0%) |
| 4-Person Households | 13 (6.7%) | 0 (0.0%) |
| 5-Person Households | 2 (1.0%) | 0 (0.0%) |
| 6-Person Households | 2 (1.0%) | 0 (0.0%) |
| 7+ Person Households | 9 (4.6%) | 4 (2.1%) |
| Total | 99 (51.0%) | 95 (49.0%) |
Female Fertility in Kaleva
Fertility by Age in Kaleva
Average fertility rate in Kaleva is 83.0 births per 1,000 women. Women in the age bracket of 20 to 34 years have the highest fertility rate with 212.0 births per 1,000 women. Women in the age bracket of 20 to 34 years acount for 100.0% of all women with births.
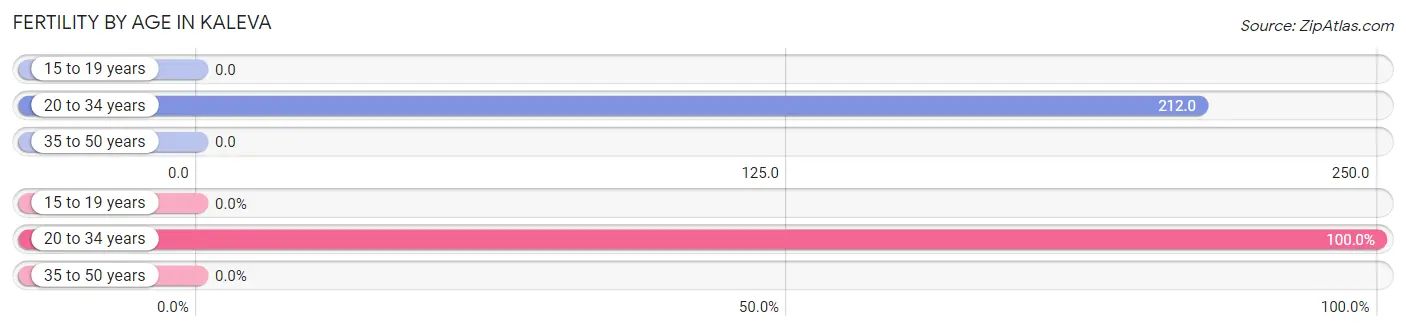
| Age Bracket | Women with Births | Births / 1,000 Women |
| 15 to 19 years | 0 (0.0%) | 0.0 |
| 20 to 34 years | 7 (100.0%) | 212.0 |
| 35 to 50 years | 0 (0.0%) | 0.0 |
| Total | 7 (100.0%) | 83.0 |
Fertility by Age by Marriage Status in Kaleva
71.4% of women with births (7) in Kaleva are married. The highest percentage of unmarried women with births falls into 20 to 34 years age bracket with 28.6% of them unmarried at the time of birth, while the lowest percentage of unmarried women with births belong to 20 to 34 years age bracket with 28.6% of them unmarried.
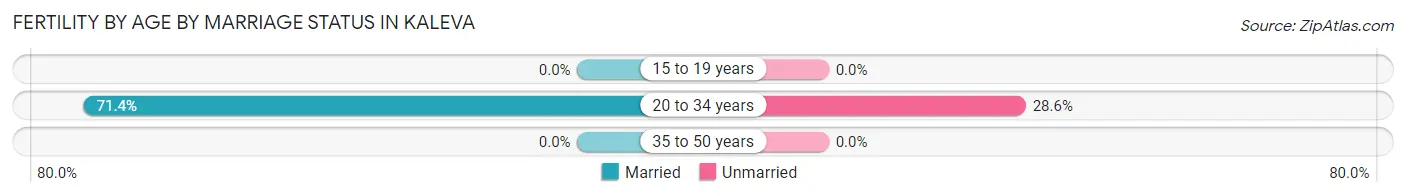
| Age Bracket | Married | Unmarried |
| 15 to 19 years | 0 (0.0%) | 0 (0.0%) |
| 20 to 34 years | 5 (71.4%) | 2 (28.6%) |
| 35 to 50 years | 0 (0.0%) | 0 (0.0%) |
| Total | 5 (71.4%) | 2 (28.6%) |
Fertility by Education in Kaleva
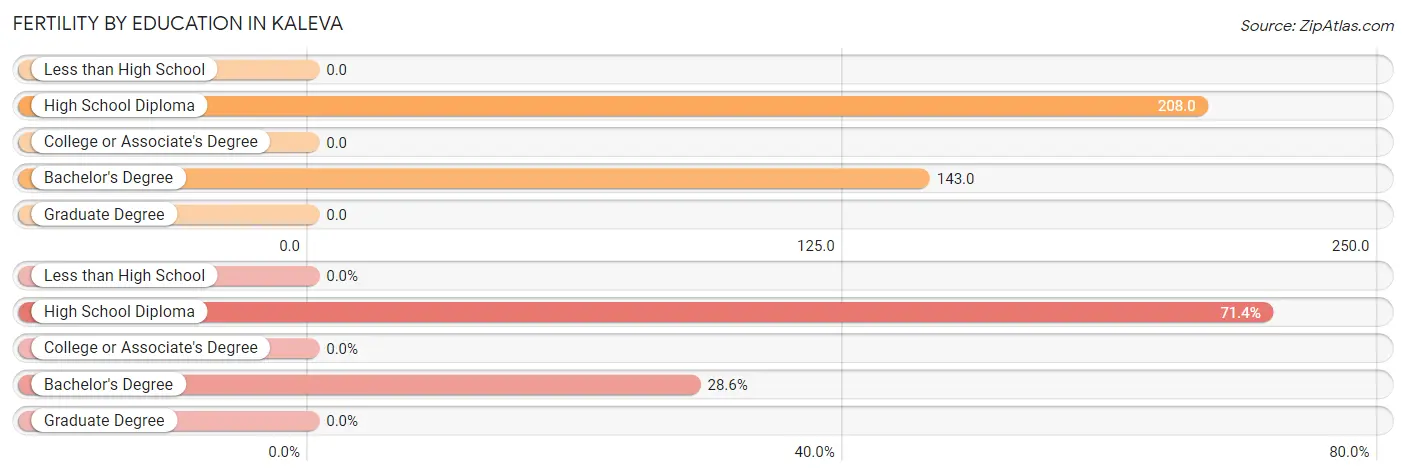
| Educational Attainment | Women with Births | Births / 1,000 Women |
| Less than High School | 0 (0.0%) | 0.0 |
| High School Diploma | 5 (71.4%) | 208.0 |
| College or Associate's Degree | 0 (0.0%) | 0.0 |
| Bachelor's Degree | 2 (28.6%) | 143.0 |
| Graduate Degree | 0 (0.0%) | 0.0 |
| Total | 7 (100.0%) | 83.0 |
Fertility by Education by Marriage Status in Kaleva
28.6% of women with births in Kaleva are unmarried. Women with the educational attainment of high school diploma are most likely to be married with 100.0% of them married at childbirth, while women with the educational attainment of bachelor's degree are least likely to be married with 100.0% of them unmarried at childbirth.
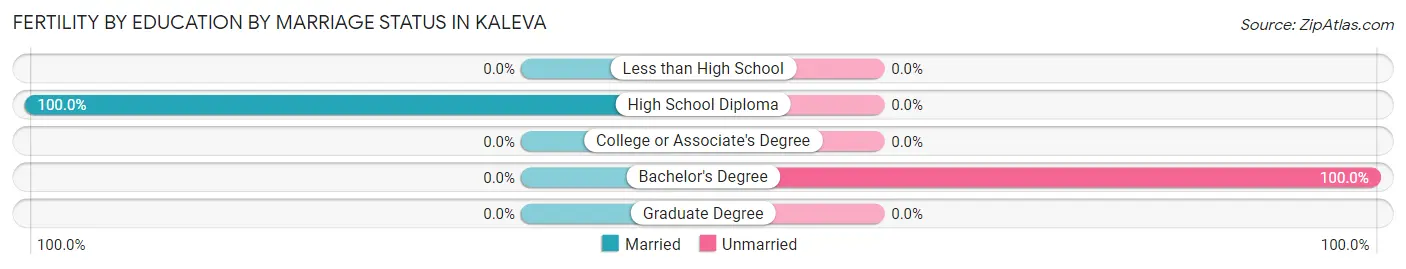
| Educational Attainment | Married | Unmarried |
| Less than High School | 0 (0.0%) | 0 (0.0%) |
| High School Diploma | 5 (100.0%) | 0 (0.0%) |
| College or Associate's Degree | 0 (0.0%) | 0 (0.0%) |
| Bachelor's Degree | 0 (0.0%) | 2 (100.0%) |
| Graduate Degree | 0 (0.0%) | 0 (0.0%) |
| Total | 5 (71.4%) | 2 (28.6%) |
Employment Characteristics in Kaleva
Employment by Class of Employer in Kaleva
Among the 138 employed individuals in Kaleva, private company employees (104 | 75.4%), local government employees (14 | 10.1%), and not-for-profit organizations (13 | 9.4%) make up the most common classes of employment.
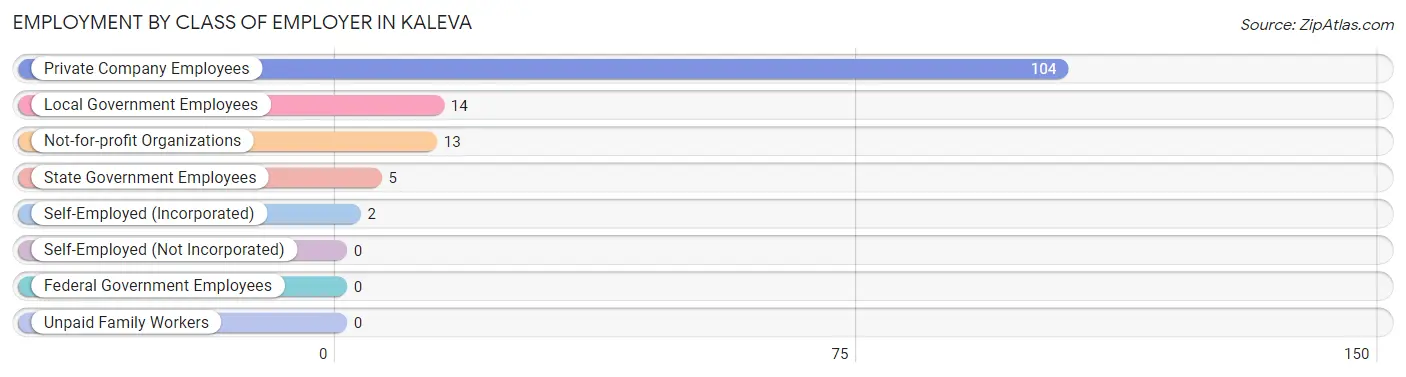
| Employer Class | # Employees | % Employees |
| Private Company Employees | 104 | 75.4% |
| Self-Employed (Incorporated) | 2 | 1.5% |
| Self-Employed (Not Incorporated) | 0 | 0.0% |
| Not-for-profit Organizations | 13 | 9.4% |
| Local Government Employees | 14 | 10.1% |
| State Government Employees | 5 | 3.6% |
| Federal Government Employees | 0 | 0.0% |
| Unpaid Family Workers | 0 | 0.0% |
| Total | 138 | 100.0% |
Employment Status by Age in Kaleva
According to the labor force statistics for Kaleva, out of the total population over 16 years of age (370), 41.1% or 152 individuals are in the labor force, with 9.2% or 14 of them unemployed. The age group with the highest labor force participation rate is 20 to 24 years, with 100.0% or 7 individuals in the labor force. Within the labor force, the 16 to 19 years age range has the highest percentage of unemployed individuals, with 100.0% or 3 of them being unemployed.
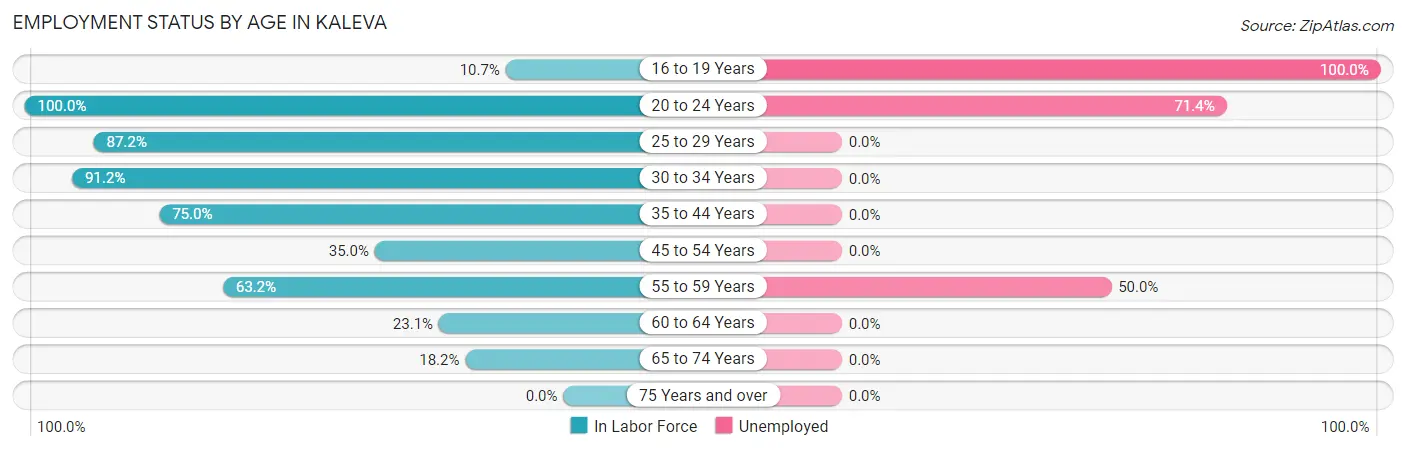
| Age Bracket | In Labor Force | Unemployed |
| 16 to 19 Years | 3 (10.7%) | 3 (100.0%) |
| 20 to 24 Years | 7 (100.0%) | 5 (71.4%) |
| 25 to 29 Years | 34 (87.2%) | 0 (0.0%) |
| 30 to 34 Years | 31 (91.2%) | 0 (0.0%) |
| 35 to 44 Years | 30 (75.0%) | 0 (0.0%) |
| 45 to 54 Years | 14 (35.0%) | 0 (0.0%) |
| 55 to 59 Years | 12 (63.2%) | 6 (50.0%) |
| 60 to 64 Years | 9 (23.1%) | 0 (0.0%) |
| 65 to 74 Years | 12 (18.2%) | 0 (0.0%) |
| 75 Years and over | 0 (0.0%) | 0 (0.0%) |
| Total | 152 (41.1%) | 14 (9.2%) |
Employment Status by Educational Attainment in Kaleva
According to labor force statistics for Kaleva, 61.6% of individuals (130) out of the total population between 25 and 64 years of age (211) are in the labor force, with 4.6% or 6 of them being unemployed. The group with the highest labor force participation rate are those with the educational attainment of bachelor's degree or higher, with 73.3% or 22 individuals in the labor force. Within the labor force, individuals with bachelor's degree or higher education have the highest percentage of unemployment, with 13.6% or 3 of them being unemployed.
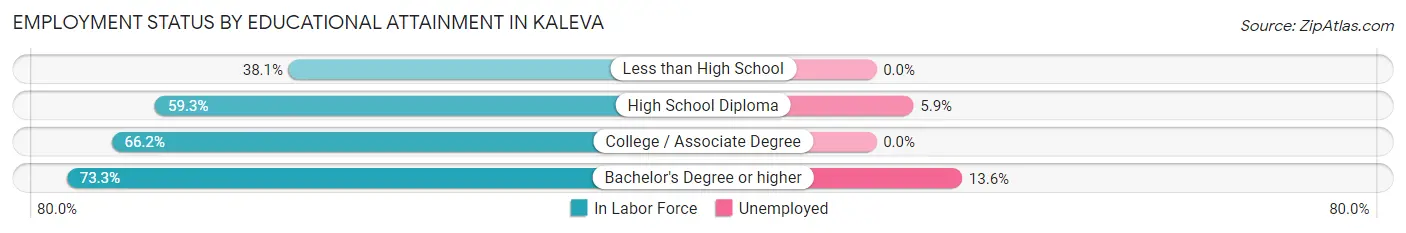
| Educational Attainment | In Labor Force | Unemployed |
| Less than High School | 8 (38.1%) | 0 (0.0%) |
| High School Diploma | 51 (59.3%) | 5 (5.9%) |
| College / Associate Degree | 49 (66.2%) | 0 (0.0%) |
| Bachelor's Degree or higher | 22 (73.3%) | 4 (13.6%) |
| Total | 130 (61.6%) | 10 (4.6%) |
Employment Occupations by Sex in Kaleva
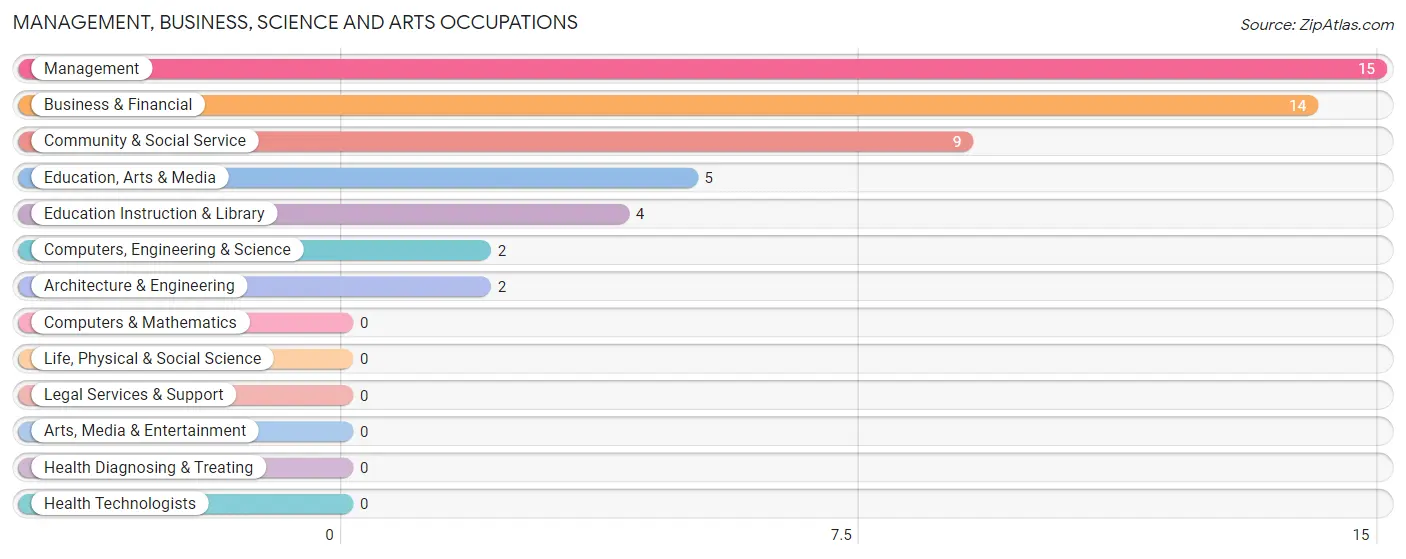
Management, Business, Science and Arts Occupations
The most common Management, Business, Science and Arts occupations in Kaleva are Management (15 | 10.9%), Business & Financial (14 | 10.1%), Community & Social Service (9 | 6.5%), Education, Arts & Media (5 | 3.6%), and Education Instruction & Library (4 | 2.9%).
Management, Business, Science and Arts Occupations by Sex
Within the Management, Business, Science and Arts occupations in Kaleva, the most male-oriented occupations are Computers, Engineering & Science (100.0%), Architecture & Engineering (100.0%), and Education Instruction & Library (100.0%), while the most female-oriented occupations are Business & Financial (100.0%), Education, Arts & Media (100.0%), and Community & Social Service (55.6%).
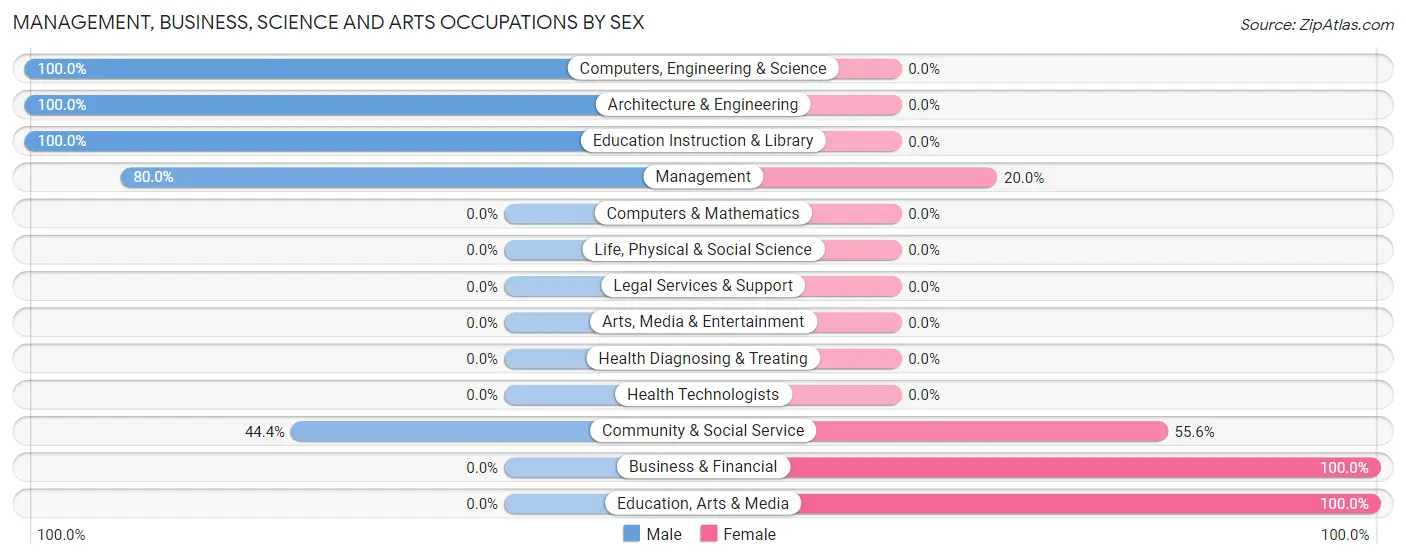
| Occupation | Male | Female |
| Management | 12 (80.0%) | 3 (20.0%) |
| Business & Financial | 0 (0.0%) | 14 (100.0%) |
| Computers, Engineering & Science | 2 (100.0%) | 0 (0.0%) |
| Computers & Mathematics | 0 (0.0%) | 0 (0.0%) |
| Architecture & Engineering | 2 (100.0%) | 0 (0.0%) |
| Life, Physical & Social Science | 0 (0.0%) | 0 (0.0%) |
| Community & Social Service | 4 (44.4%) | 5 (55.6%) |
| Education, Arts & Media | 0 (0.0%) | 5 (100.0%) |
| Legal Services & Support | 0 (0.0%) | 0 (0.0%) |
| Education Instruction & Library | 4 (100.0%) | 0 (0.0%) |
| Arts, Media & Entertainment | 0 (0.0%) | 0 (0.0%) |
| Health Diagnosing & Treating | 0 (0.0%) | 0 (0.0%) |
| Health Technologists | 0 (0.0%) | 0 (0.0%) |
| Total (Category) | 18 (45.0%) | 22 (55.0%) |
| Total (Overall) | 68 (49.3%) | 70 (50.7%) |
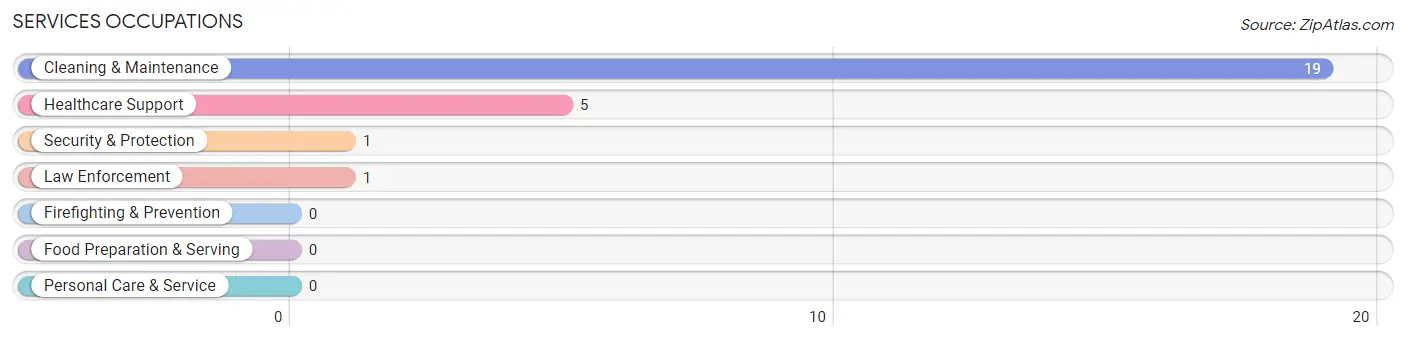
Services Occupations
The most common Services occupations in Kaleva are Cleaning & Maintenance (19 | 13.8%), Healthcare Support (5 | 3.6%), Security & Protection (1 | 0.7%), and Law Enforcement (1 | 0.7%).
Services Occupations by Sex
Within the Services occupations in Kaleva, the most male-oriented occupations are Security & Protection (100.0%), Law Enforcement (100.0%), and Cleaning & Maintenance (21.0%), while the most female-oriented occupations are Healthcare Support (100.0%), and Cleaning & Maintenance (78.9%).
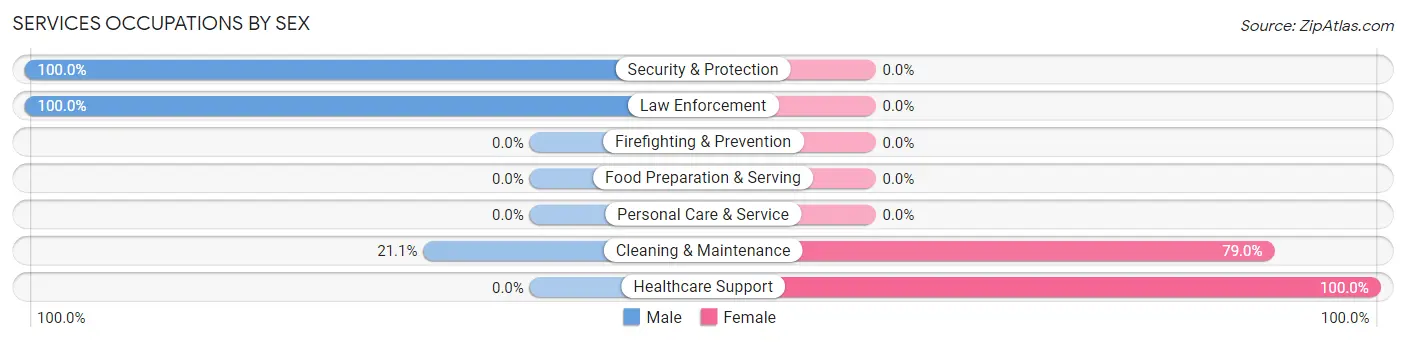
| Occupation | Male | Female |
| Healthcare Support | 0 (0.0%) | 5 (100.0%) |
| Security & Protection | 1 (100.0%) | 0 (0.0%) |
| Firefighting & Prevention | 0 (0.0%) | 0 (0.0%) |
| Law Enforcement | 1 (100.0%) | 0 (0.0%) |
| Food Preparation & Serving | 0 (0.0%) | 0 (0.0%) |
| Cleaning & Maintenance | 4 (21.0%) | 15 (78.9%) |
| Personal Care & Service | 0 (0.0%) | 0 (0.0%) |
| Total (Category) | 5 (20.0%) | 20 (80.0%) |
| Total (Overall) | 68 (49.3%) | 70 (50.7%) |
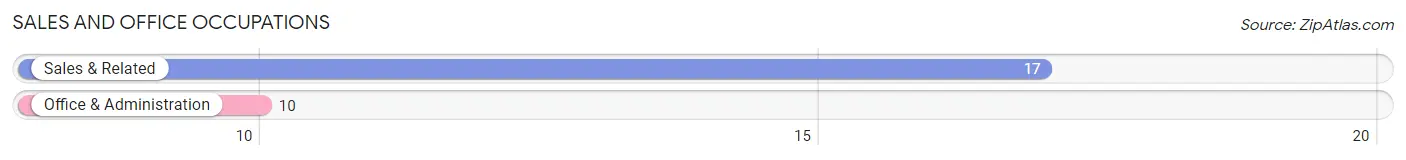
Sales and Office Occupations
The most common Sales and Office occupations in Kaleva are Sales & Related (17 | 12.3%), and Office & Administration (10 | 7.2%).
Sales and Office Occupations by Sex
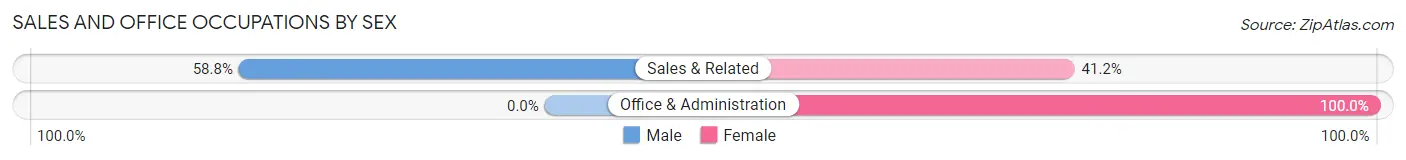
| Occupation | Male | Female |
| Sales & Related | 10 (58.8%) | 7 (41.2%) |
| Office & Administration | 0 (0.0%) | 10 (100.0%) |
| Total (Category) | 10 (37.0%) | 17 (63.0%) |
| Total (Overall) | 68 (49.3%) | 70 (50.7%) |
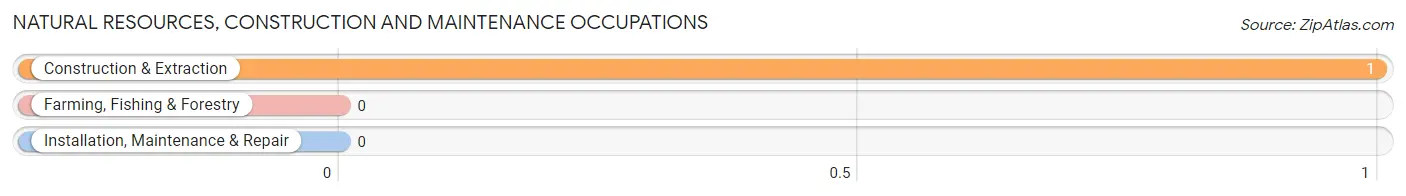
Natural Resources, Construction and Maintenance Occupations
The most common Natural Resources, Construction and Maintenance occupations in Kaleva are , and Construction & Extraction (1 | 0.7%).
Natural Resources, Construction and Maintenance Occupations by Sex
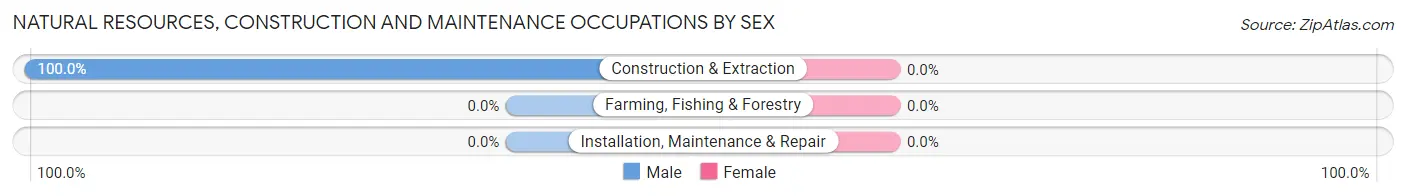
| Occupation | Male | Female |
| Farming, Fishing & Forestry | 0 (0.0%) | 0 (0.0%) |
| Construction & Extraction | 1 (100.0%) | 0 (0.0%) |
| Installation, Maintenance & Repair | 0 (0.0%) | 0 (0.0%) |
| Total (Category) | 1 (100.0%) | 0 (0.0%) |
| Total (Overall) | 68 (49.3%) | 70 (50.7%) |
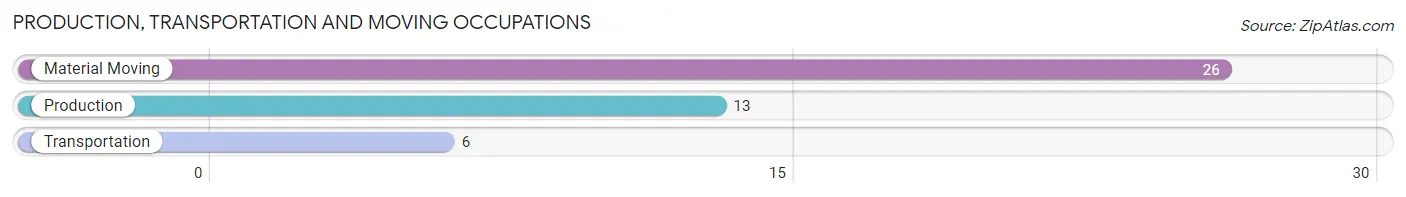
Production, Transportation and Moving Occupations
The most common Production, Transportation and Moving occupations in Kaleva are Material Moving (26 | 18.8%), Production (13 | 9.4%), and Transportation (6 | 4.3%).
Production, Transportation and Moving Occupations by Sex
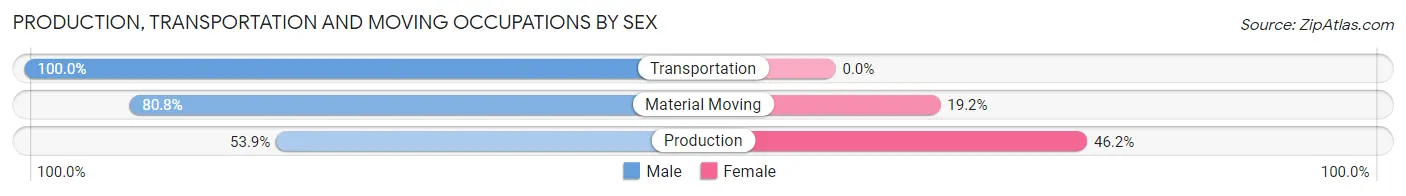
| Occupation | Male | Female |
| Production | 7 (53.8%) | 6 (46.2%) |
| Transportation | 6 (100.0%) | 0 (0.0%) |
| Material Moving | 21 (80.8%) | 5 (19.2%) |
| Total (Category) | 34 (75.6%) | 11 (24.4%) |
| Total (Overall) | 68 (49.3%) | 70 (50.7%) |
Employment Industries by Sex in Kaleva
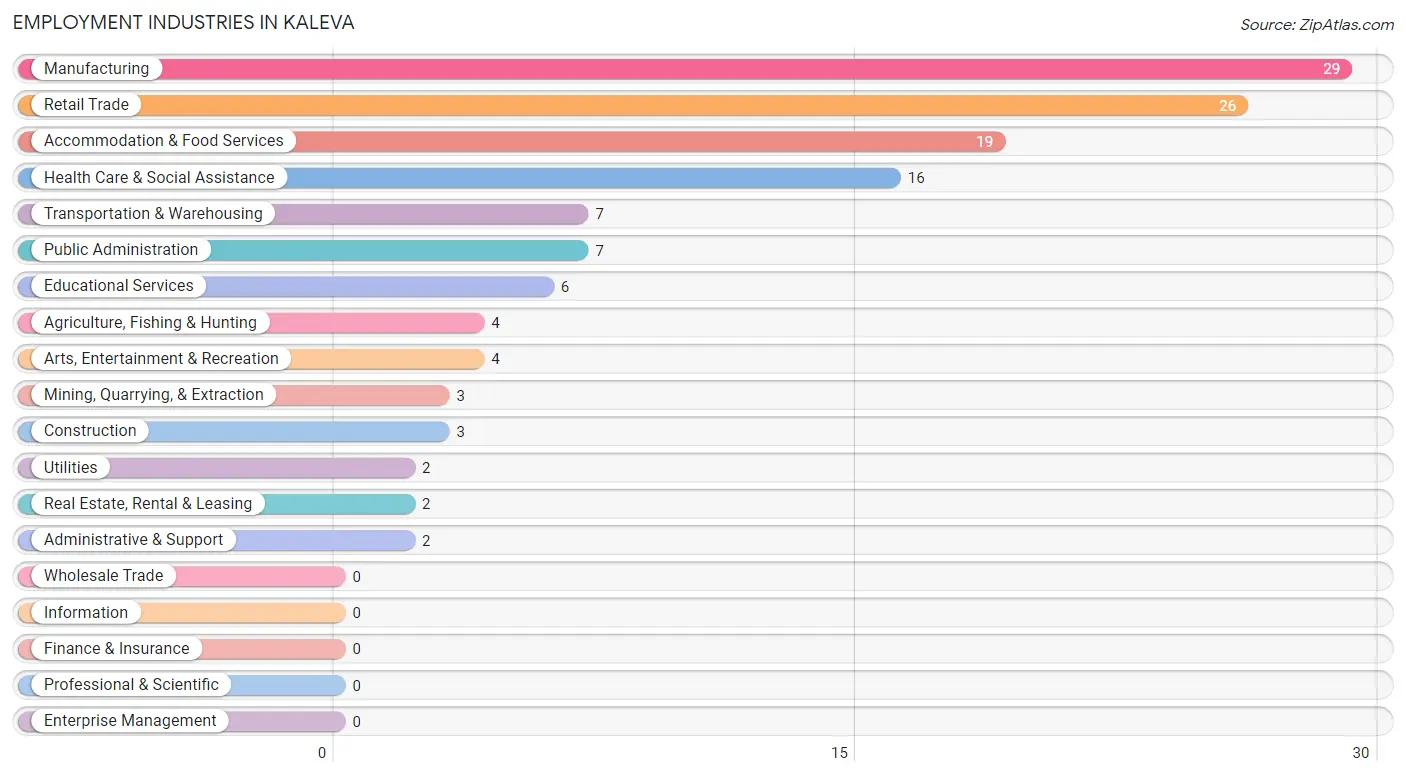
Employment Industries in Kaleva
The major employment industries in Kaleva include Manufacturing (29 | 21.0%), Retail Trade (26 | 18.8%), Accommodation & Food Services (19 | 13.8%), Health Care & Social Assistance (16 | 11.6%), and Transportation & Warehousing (7 | 5.1%).
Employment Industries by Sex in Kaleva
The Kaleva industries that see more men than women are Agriculture, Fishing & Hunting (100.0%), Utilities (100.0%), and Administrative & Support (100.0%), whereas the industries that tend to have a higher number of women are Mining, Quarrying, & Extraction (100.0%), Real Estate, Rental & Leasing (100.0%), and Health Care & Social Assistance (100.0%).
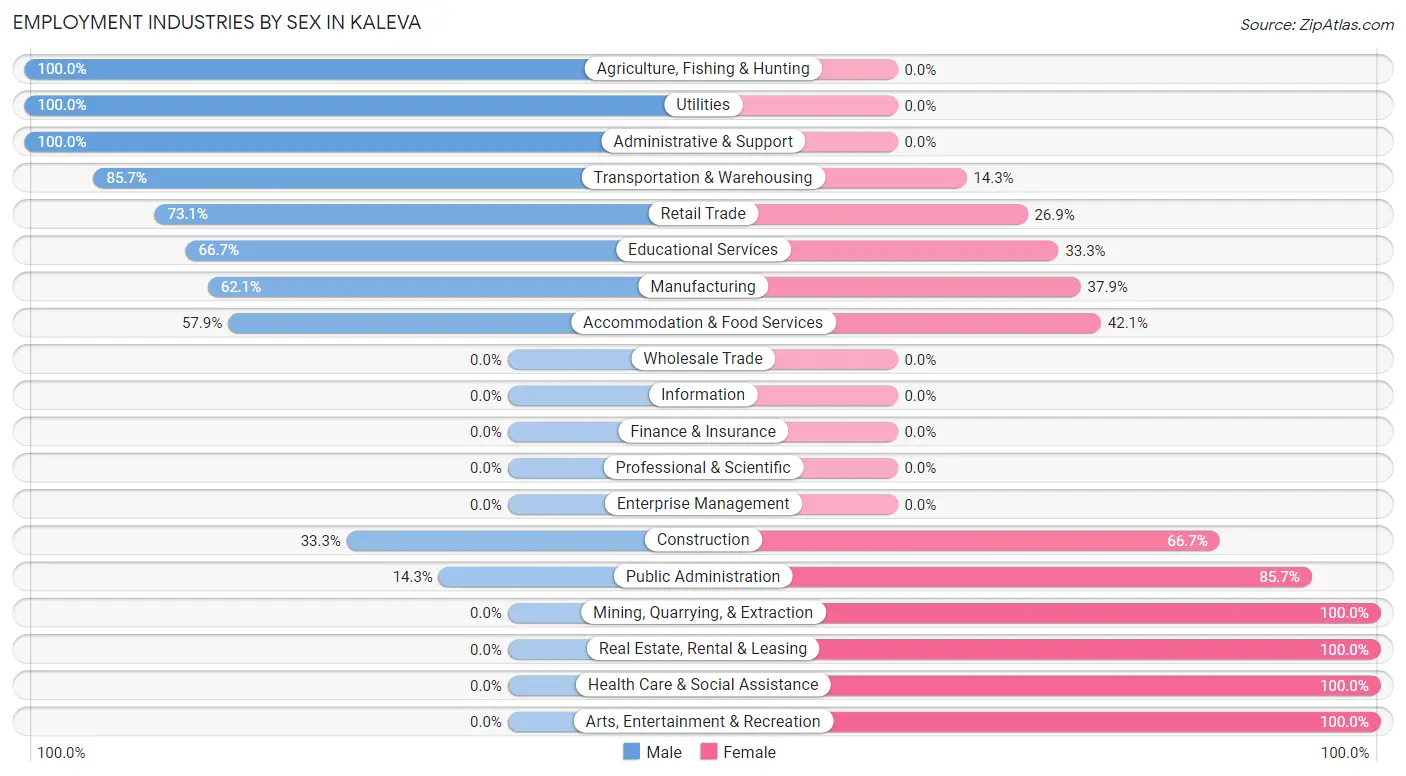
| Industry | Male | Female |
| Agriculture, Fishing & Hunting | 4 (100.0%) | 0 (0.0%) |
| Mining, Quarrying, & Extraction | 0 (0.0%) | 3 (100.0%) |
| Construction | 1 (33.3%) | 2 (66.7%) |
| Manufacturing | 18 (62.1%) | 11 (37.9%) |
| Wholesale Trade | 0 (0.0%) | 0 (0.0%) |
| Retail Trade | 19 (73.1%) | 7 (26.9%) |
| Transportation & Warehousing | 6 (85.7%) | 1 (14.3%) |
| Utilities | 2 (100.0%) | 0 (0.0%) |
| Information | 0 (0.0%) | 0 (0.0%) |
| Finance & Insurance | 0 (0.0%) | 0 (0.0%) |
| Real Estate, Rental & Leasing | 0 (0.0%) | 2 (100.0%) |
| Professional & Scientific | 0 (0.0%) | 0 (0.0%) |
| Enterprise Management | 0 (0.0%) | 0 (0.0%) |
| Administrative & Support | 2 (100.0%) | 0 (0.0%) |
| Educational Services | 4 (66.7%) | 2 (33.3%) |
| Health Care & Social Assistance | 0 (0.0%) | 16 (100.0%) |
| Arts, Entertainment & Recreation | 0 (0.0%) | 4 (100.0%) |
| Accommodation & Food Services | 11 (57.9%) | 8 (42.1%) |
| Public Administration | 1 (14.3%) | 6 (85.7%) |
| Total | 68 (49.3%) | 70 (50.7%) |
Education in Kaleva
School Enrollment in Kaleva
The most common levels of schooling among the 118 students in Kaleva are middle school (48 | 40.7%), high school (28 | 23.7%), and kindergarten (14 | 11.9%).
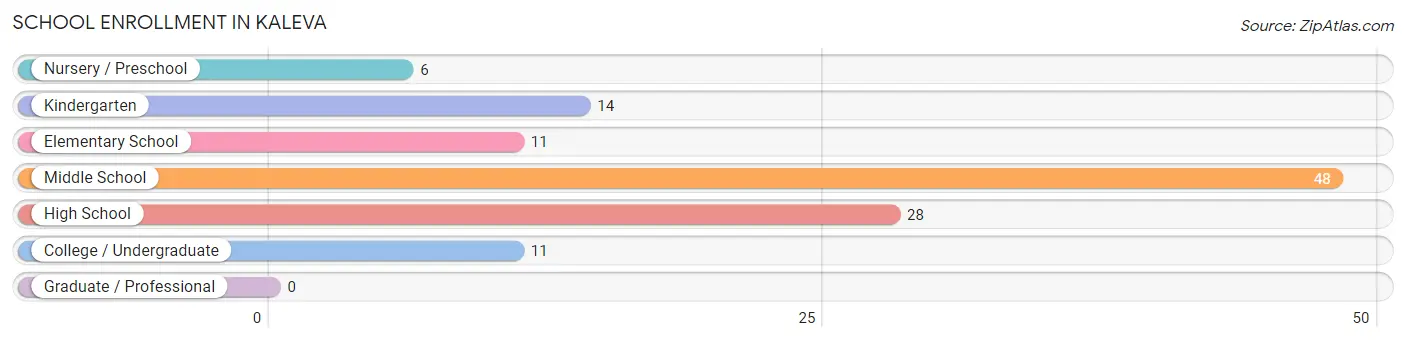
| School Level | # Students | % Students |
| Nursery / Preschool | 6 | 5.1% |
| Kindergarten | 14 | 11.9% |
| Elementary School | 11 | 9.3% |
| Middle School | 48 | 40.7% |
| High School | 28 | 23.7% |
| College / Undergraduate | 11 | 9.3% |
| Graduate / Professional | 0 | 0.0% |
| Total | 118 | 100.0% |
School Enrollment by Age by Funding Source in Kaleva
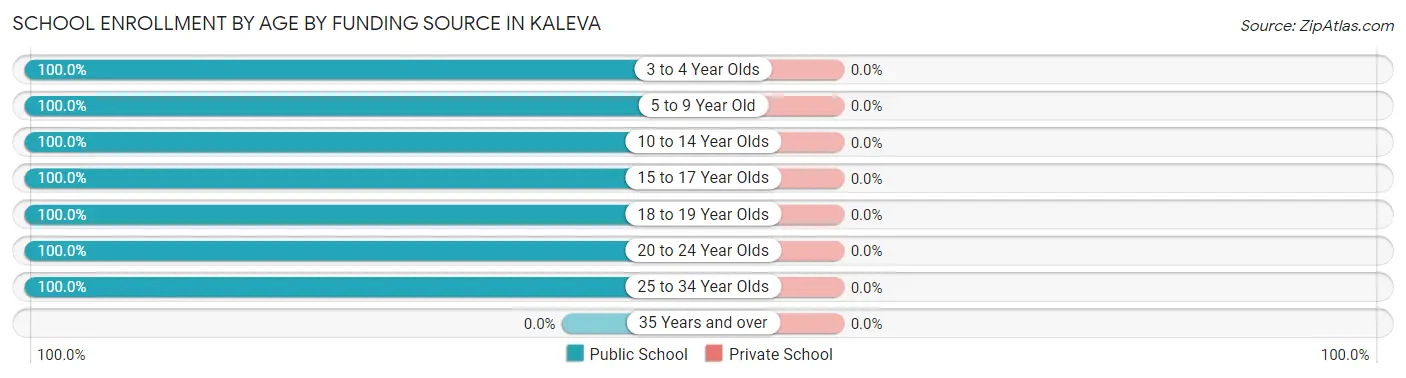
| Age Bracket | Public School | Private School |
| 3 to 4 Year Olds | 6 (100.0%) | 0 (0.0%) |
| 5 to 9 Year Old | 25 (100.0%) | 0 (0.0%) |
| 10 to 14 Year Olds | 44 (100.0%) | 0 (0.0%) |
| 15 to 17 Year Olds | 20 (100.0%) | 0 (0.0%) |
| 18 to 19 Year Olds | 10 (100.0%) | 0 (0.0%) |
| 20 to 24 Year Olds | 2 (100.0%) | 0 (0.0%) |
| 25 to 34 Year Olds | 11 (100.0%) | 0 (0.0%) |
| 35 Years and over | 0 (0.0%) | 0 (0.0%) |
| Total | 118 (100.0%) | 0 (0.0%) |
Educational Attainment by Field of Study in Kaleva
Education (15 | 26.8%), social sciences (10 | 17.9%), business (9 | 16.1%), arts & humanities (6 | 10.7%), and bio, nature & agricultural (5 | 8.9%) are the most common fields of study among 56 individuals in Kaleva who have obtained a bachelor's degree or higher.
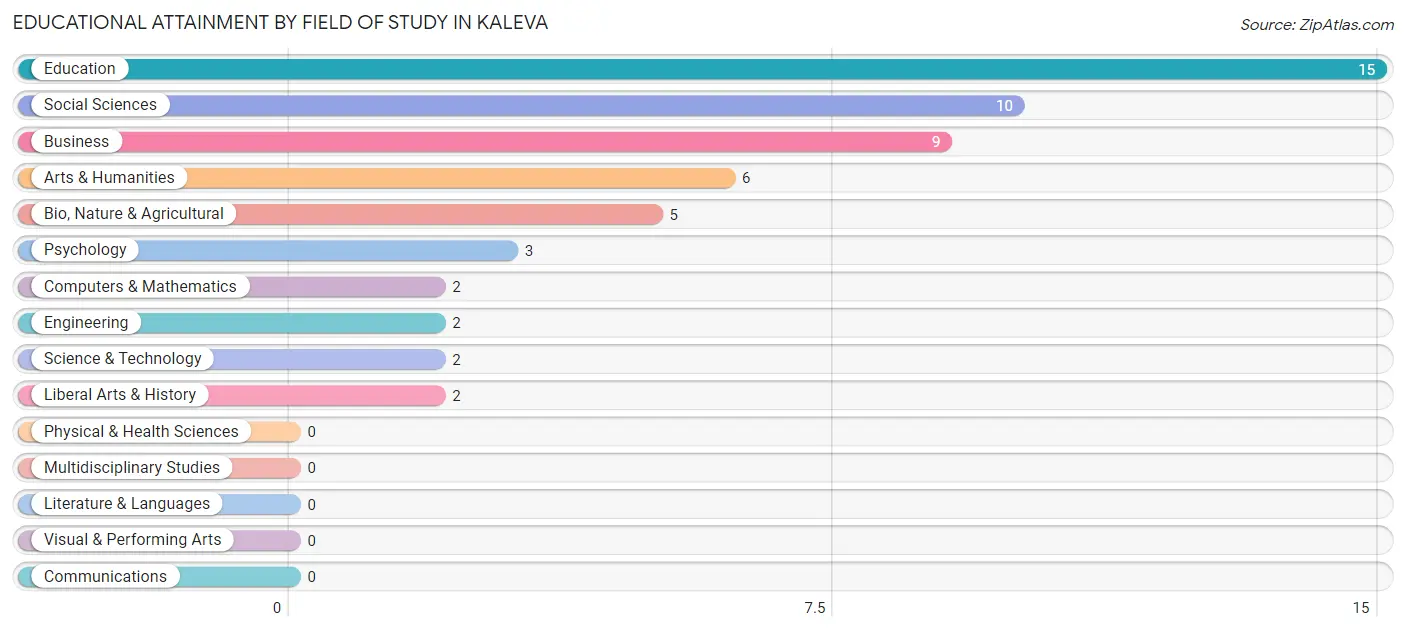
| Field of Study | # Graduates | % Graduates |
| Computers & Mathematics | 2 | 3.6% |
| Bio, Nature & Agricultural | 5 | 8.9% |
| Physical & Health Sciences | 0 | 0.0% |
| Psychology | 3 | 5.4% |
| Social Sciences | 10 | 17.9% |
| Engineering | 2 | 3.6% |
| Multidisciplinary Studies | 0 | 0.0% |
| Science & Technology | 2 | 3.6% |
| Business | 9 | 16.1% |
| Education | 15 | 26.8% |
| Literature & Languages | 0 | 0.0% |
| Liberal Arts & History | 2 | 3.6% |
| Visual & Performing Arts | 0 | 0.0% |
| Communications | 0 | 0.0% |
| Arts & Humanities | 6 | 10.7% |
| Total | 56 | 100.0% |
Transportation & Commute in Kaleva
Vehicle Availability by Sex in Kaleva
The most prevalent vehicle ownership categories in Kaleva are males with 2 vehicles (33, accounting for 48.5%) and females with 2 vehicles (47, making up 47.1%).
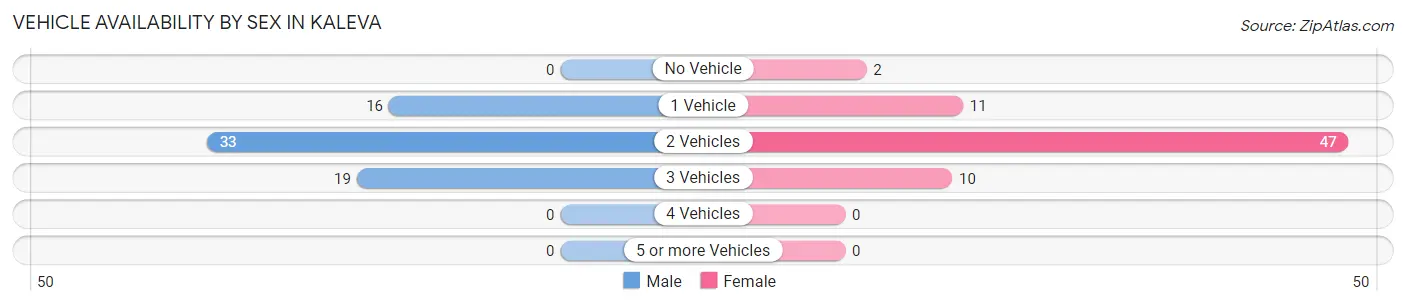
| Vehicles Available | Male | Female |
| No Vehicle | 0 (0.0%) | 2 (2.9%) |
| 1 Vehicle | 16 (23.5%) | 11 (15.7%) |
| 2 Vehicles | 33 (48.5%) | 47 (67.1%) |
| 3 Vehicles | 19 (27.9%) | 10 (14.3%) |
| 4 Vehicles | 0 (0.0%) | 0 (0.0%) |
| 5 or more Vehicles | 0 (0.0%) | 0 (0.0%) |
| Total | 68 (100.0%) | 70 (100.0%) |
Commute Time in Kaleva
The most frequently occuring commute durations in Kaleva are 20 to 24 minutes (38 commuters, 29.0%), 5 to 9 minutes (26 commuters, 19.9%), and 45 to 59 minutes (22 commuters, 16.8%).
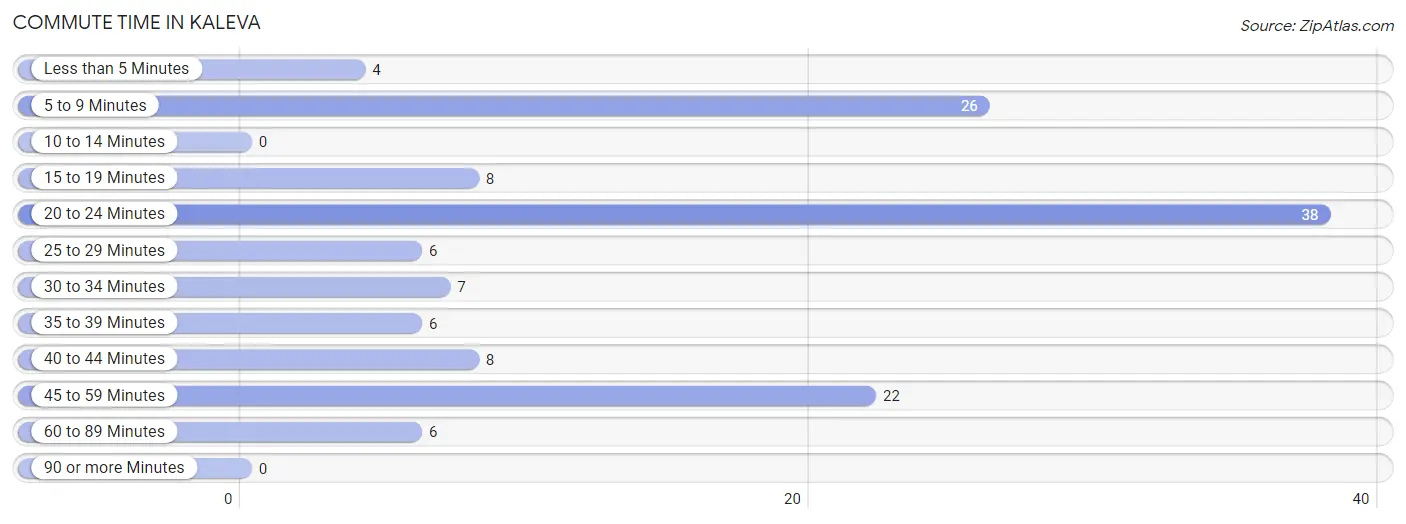
| Commute Time | # Commuters | % Commuters |
| Less than 5 Minutes | 4 | 3.0% |
| 5 to 9 Minutes | 26 | 19.9% |
| 10 to 14 Minutes | 0 | 0.0% |
| 15 to 19 Minutes | 8 | 6.1% |
| 20 to 24 Minutes | 38 | 29.0% |
| 25 to 29 Minutes | 6 | 4.6% |
| 30 to 34 Minutes | 7 | 5.3% |
| 35 to 39 Minutes | 6 | 4.6% |
| 40 to 44 Minutes | 8 | 6.1% |
| 45 to 59 Minutes | 22 | 16.8% |
| 60 to 89 Minutes | 6 | 4.6% |
| 90 or more Minutes | 0 | 0.0% |
Commute Time by Sex in Kaleva
The most common commute times in Kaleva are 5 to 9 minutes (16 commuters, 24.6%) for males and 20 to 24 minutes (22 commuters, 33.3%) for females.
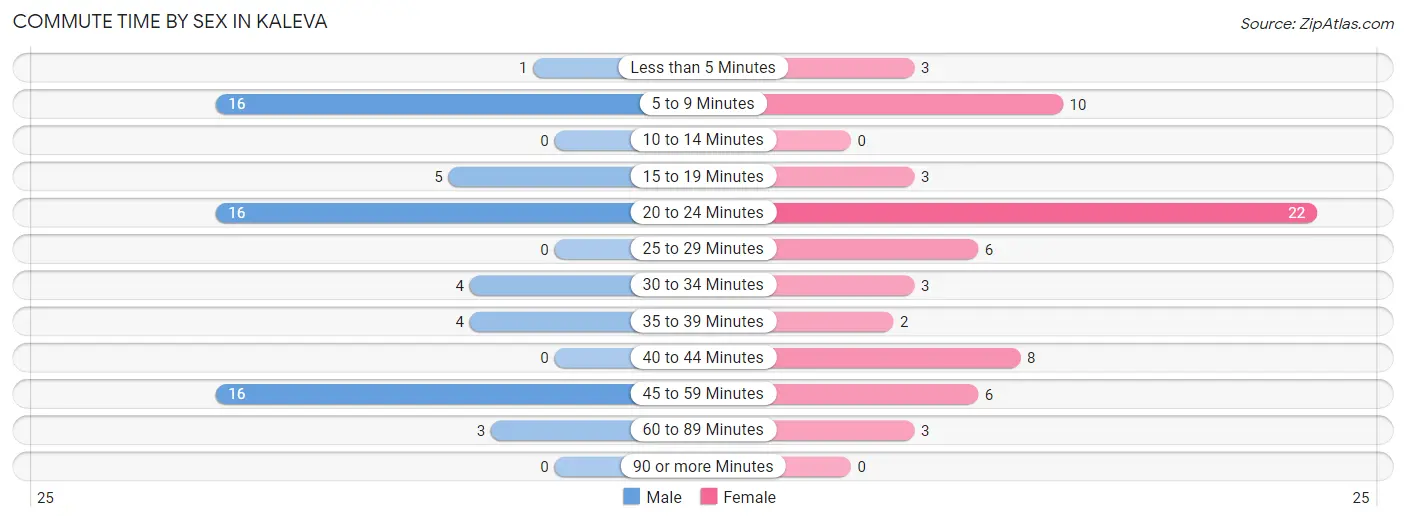
| Commute Time | Male | Female |
| Less than 5 Minutes | 1 (1.5%) | 3 (4.5%) |
| 5 to 9 Minutes | 16 (24.6%) | 10 (15.1%) |
| 10 to 14 Minutes | 0 (0.0%) | 0 (0.0%) |
| 15 to 19 Minutes | 5 (7.7%) | 3 (4.5%) |
| 20 to 24 Minutes | 16 (24.6%) | 22 (33.3%) |
| 25 to 29 Minutes | 0 (0.0%) | 6 (9.1%) |
| 30 to 34 Minutes | 4 (6.1%) | 3 (4.5%) |
| 35 to 39 Minutes | 4 (6.1%) | 2 (3.0%) |
| 40 to 44 Minutes | 0 (0.0%) | 8 (12.1%) |
| 45 to 59 Minutes | 16 (24.6%) | 6 (9.1%) |
| 60 to 89 Minutes | 3 (4.6%) | 3 (4.5%) |
| 90 or more Minutes | 0 (0.0%) | 0 (0.0%) |
Time of Departure to Work by Sex in Kaleva
The most frequent times of departure to work in Kaleva are 4:00 PM to 11:59 PM (17, 26.2%) for males and 7:30 AM to 7:59 AM (27, 40.9%) for females.
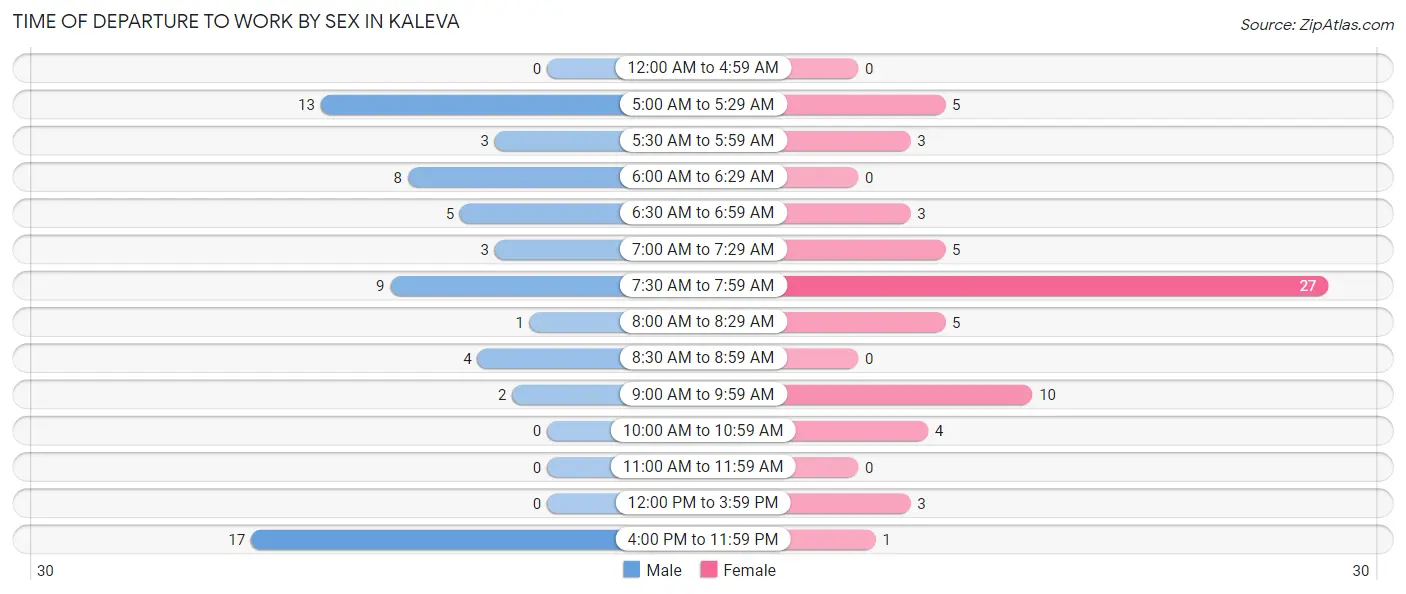
| Time of Departure | Male | Female |
| 12:00 AM to 4:59 AM | 0 (0.0%) | 0 (0.0%) |
| 5:00 AM to 5:29 AM | 13 (20.0%) | 5 (7.6%) |
| 5:30 AM to 5:59 AM | 3 (4.6%) | 3 (4.5%) |
| 6:00 AM to 6:29 AM | 8 (12.3%) | 0 (0.0%) |
| 6:30 AM to 6:59 AM | 5 (7.7%) | 3 (4.5%) |
| 7:00 AM to 7:29 AM | 3 (4.6%) | 5 (7.6%) |
| 7:30 AM to 7:59 AM | 9 (13.9%) | 27 (40.9%) |
| 8:00 AM to 8:29 AM | 1 (1.5%) | 5 (7.6%) |
| 8:30 AM to 8:59 AM | 4 (6.1%) | 0 (0.0%) |
| 9:00 AM to 9:59 AM | 2 (3.1%) | 10 (15.1%) |
| 10:00 AM to 10:59 AM | 0 (0.0%) | 4 (6.1%) |
| 11:00 AM to 11:59 AM | 0 (0.0%) | 0 (0.0%) |
| 12:00 PM to 3:59 PM | 0 (0.0%) | 3 (4.5%) |
| 4:00 PM to 11:59 PM | 17 (26.2%) | 1 (1.5%) |
| Total | 65 (100.0%) | 66 (100.0%) |
Housing Occupancy in Kaleva
Occupancy by Ownership in Kaleva
Of the total 194 dwellings in Kaleva, owner-occupied units account for 149 (76.8%), while renter-occupied units make up 45 (23.2%).
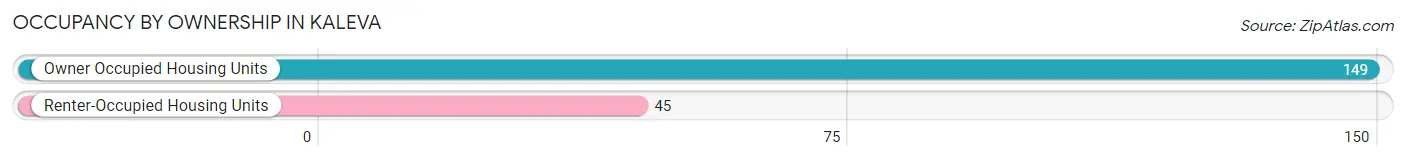
| Occupancy | # Housing Units | % Housing Units |
| Owner Occupied Housing Units | 149 | 76.8% |
| Renter-Occupied Housing Units | 45 | 23.2% |
| Total Occupied Housing Units | 194 | 100.0% |
Occupancy by Household Size in Kaleva
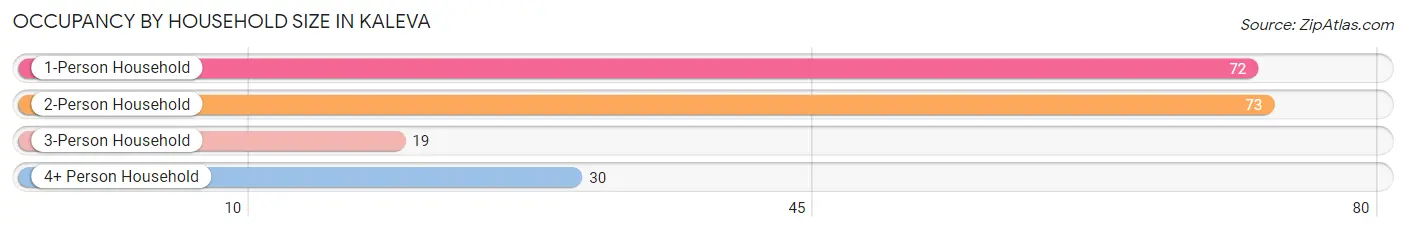
| Household Size | # Housing Units | % Housing Units |
| 1-Person Household | 72 | 37.1% |
| 2-Person Household | 73 | 37.6% |
| 3-Person Household | 19 | 9.8% |
| 4+ Person Household | 30 | 15.5% |
| Total Housing Units | 194 | 100.0% |
Occupancy by Ownership by Household Size in Kaleva
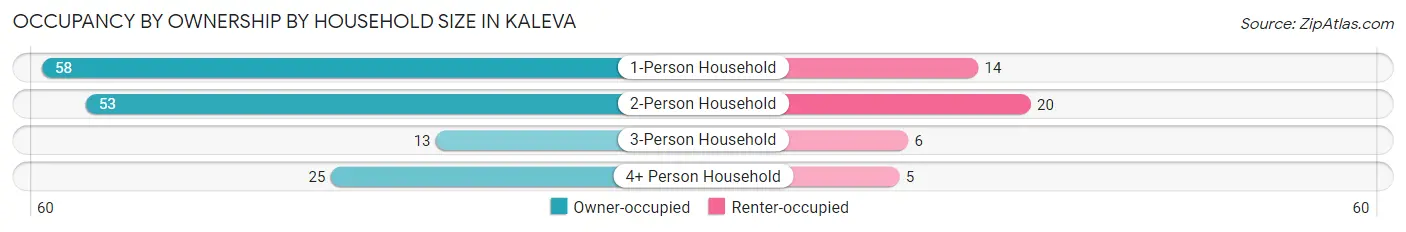
| Household Size | Owner-occupied | Renter-occupied |
| 1-Person Household | 58 (80.6%) | 14 (19.4%) |
| 2-Person Household | 53 (72.6%) | 20 (27.4%) |
| 3-Person Household | 13 (68.4%) | 6 (31.6%) |
| 4+ Person Household | 25 (83.3%) | 5 (16.7%) |
| Total Housing Units | 149 (76.8%) | 45 (23.2%) |
Occupancy by Educational Attainment in Kaleva
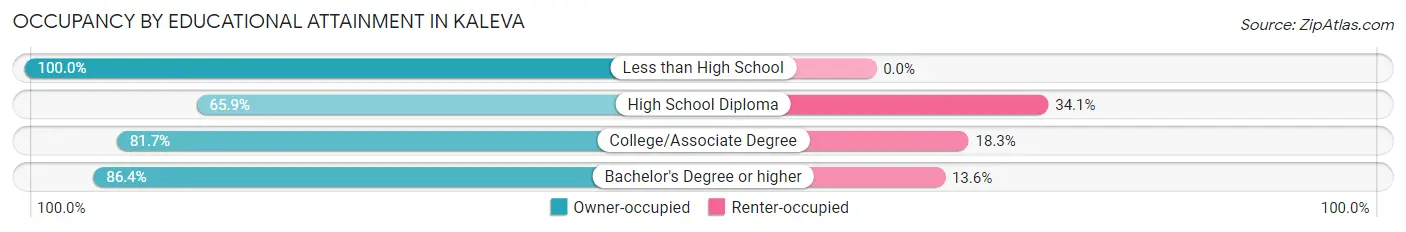
| Household Size | Owner-occupied | Renter-occupied |
| Less than High School | 16 (100.0%) | 0 (0.0%) |
| High School Diploma | 56 (65.9%) | 29 (34.1%) |
| College/Associate Degree | 58 (81.7%) | 13 (18.3%) |
| Bachelor's Degree or higher | 19 (86.4%) | 3 (13.6%) |
Occupancy by Age of Householder in Kaleva
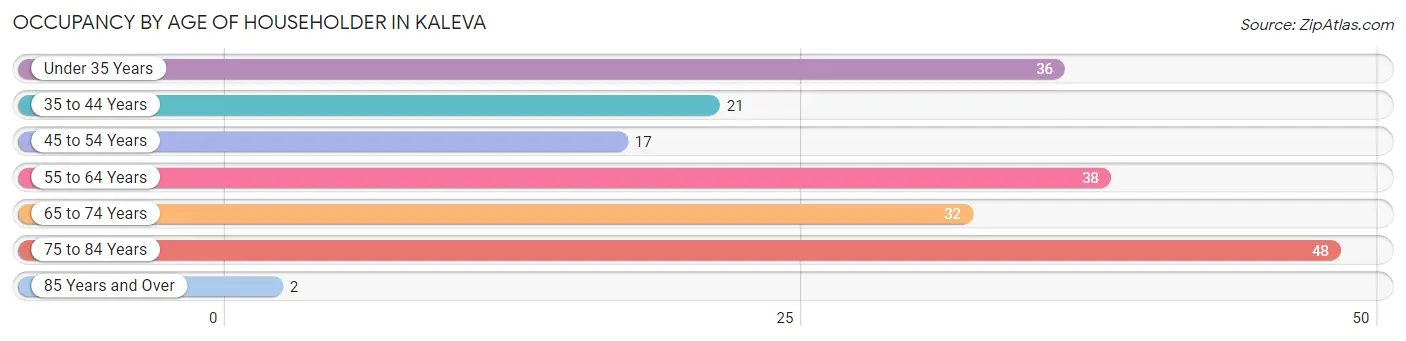
| Age Bracket | # Households | % Households |
| Under 35 Years | 36 | 18.6% |
| 35 to 44 Years | 21 | 10.8% |
| 45 to 54 Years | 17 | 8.8% |
| 55 to 64 Years | 38 | 19.6% |
| 65 to 74 Years | 32 | 16.5% |
| 75 to 84 Years | 48 | 24.7% |
| 85 Years and Over | 2 | 1.0% |
| Total | 194 | 100.0% |
Housing Finances in Kaleva
Median Income by Occupancy in Kaleva
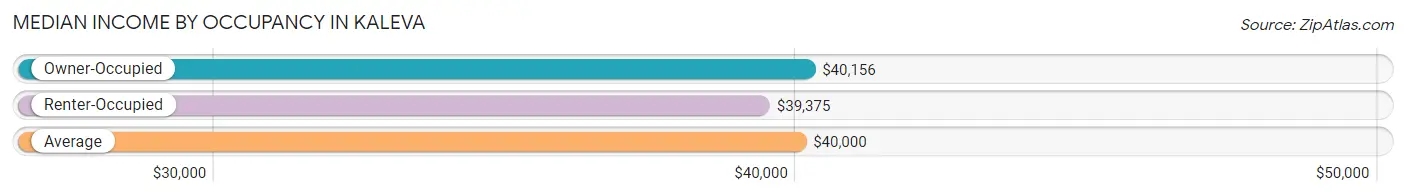
| Occupancy Type | # Households | Median Income |
| Owner-Occupied | 149 (76.8%) | $40,156 |
| Renter-Occupied | 45 (23.2%) | $39,375 |
| Average | 194 (100.0%) | $40,000 |
Occupancy by Householder Income Bracket in Kaleva
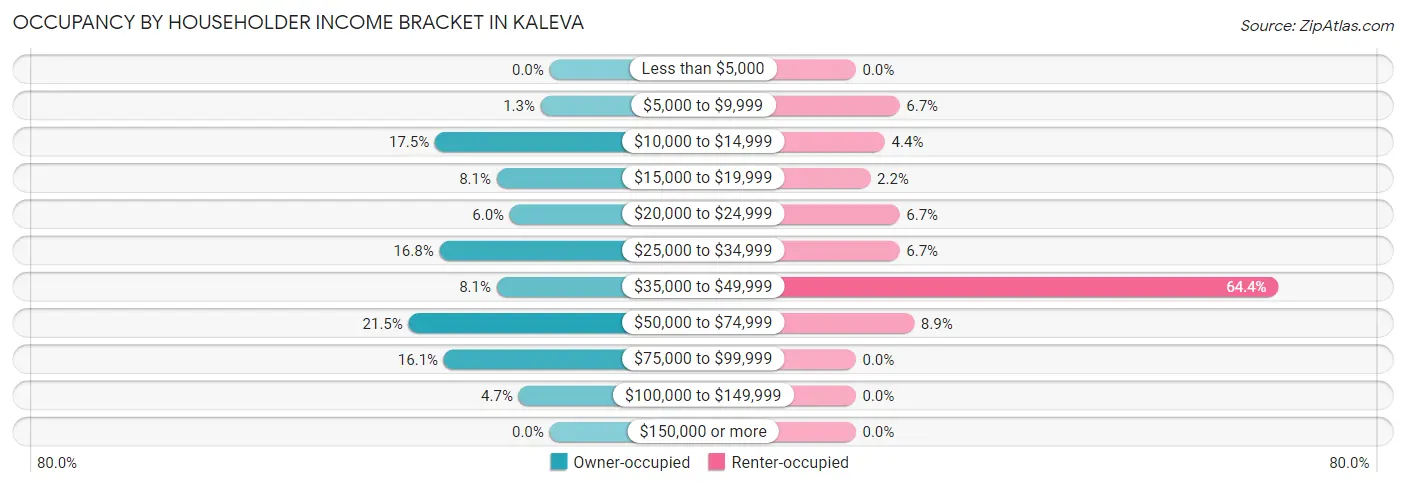
| Income Bracket | Owner-occupied | Renter-occupied |
| Less than $5,000 | 0 (0.0%) | 0 (0.0%) |
| $5,000 to $9,999 | 2 (1.3%) | 3 (6.7%) |
| $10,000 to $14,999 | 26 (17.4%) | 2 (4.4%) |
| $15,000 to $19,999 | 12 (8.1%) | 1 (2.2%) |
| $20,000 to $24,999 | 9 (6.0%) | 3 (6.7%) |
| $25,000 to $34,999 | 25 (16.8%) | 3 (6.7%) |
| $35,000 to $49,999 | 12 (8.1%) | 29 (64.4%) |
| $50,000 to $74,999 | 32 (21.5%) | 4 (8.9%) |
| $75,000 to $99,999 | 24 (16.1%) | 0 (0.0%) |
| $100,000 to $149,999 | 7 (4.7%) | 0 (0.0%) |
| $150,000 or more | 0 (0.0%) | 0 (0.0%) |
| Total | 149 (100.0%) | 45 (100.0%) |
Monthly Housing Cost Tiers in Kaleva
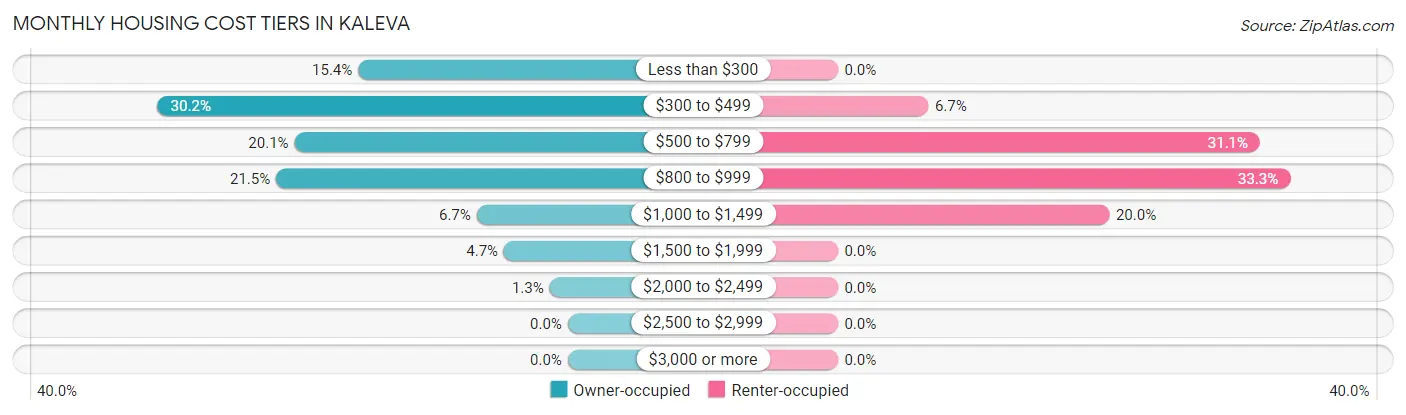
| Monthly Cost | Owner-occupied | Renter-occupied |
| Less than $300 | 23 (15.4%) | 0 (0.0%) |
| $300 to $499 | 45 (30.2%) | 3 (6.7%) |
| $500 to $799 | 30 (20.1%) | 14 (31.1%) |
| $800 to $999 | 32 (21.5%) | 15 (33.3%) |
| $1,000 to $1,499 | 10 (6.7%) | 9 (20.0%) |
| $1,500 to $1,999 | 7 (4.7%) | 0 (0.0%) |
| $2,000 to $2,499 | 2 (1.3%) | 0 (0.0%) |
| $2,500 to $2,999 | 0 (0.0%) | 0 (0.0%) |
| $3,000 or more | 0 (0.0%) | 0 (0.0%) |
| Total | 149 (100.0%) | 45 (100.0%) |
Physical Housing Characteristics in Kaleva
Housing Structures in Kaleva
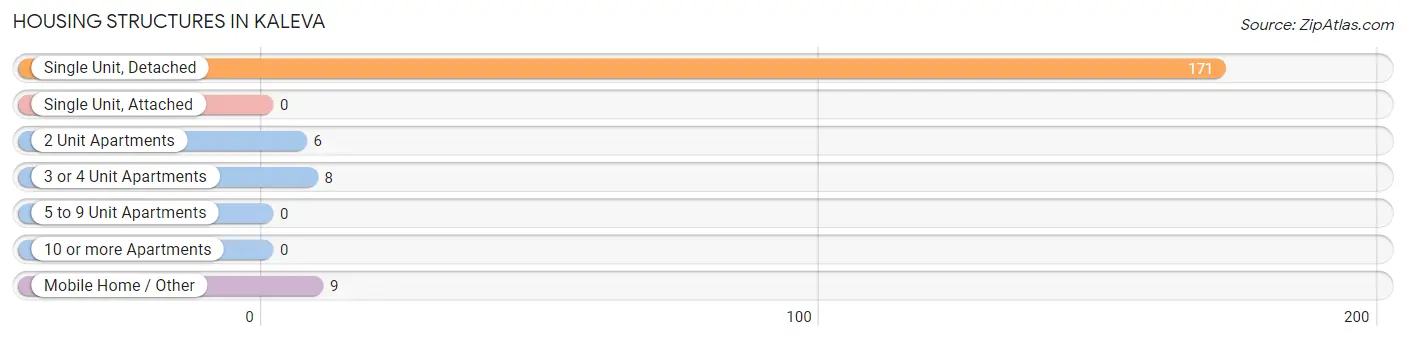
| Structure Type | # Housing Units | % Housing Units |
| Single Unit, Detached | 171 | 88.1% |
| Single Unit, Attached | 0 | 0.0% |
| 2 Unit Apartments | 6 | 3.1% |
| 3 or 4 Unit Apartments | 8 | 4.1% |
| 5 to 9 Unit Apartments | 0 | 0.0% |
| 10 or more Apartments | 0 | 0.0% |
| Mobile Home / Other | 9 | 4.6% |
| Total | 194 | 100.0% |
Housing Structures by Occupancy in Kaleva
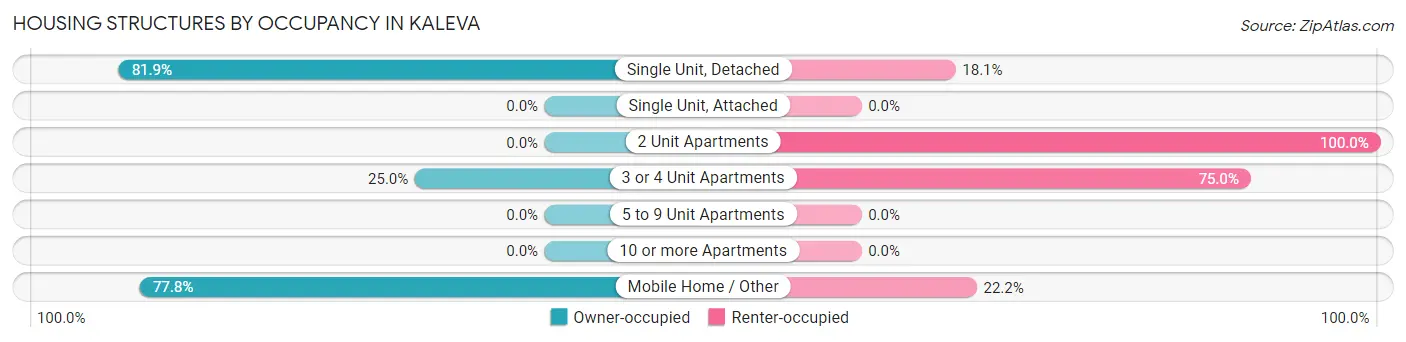
| Structure Type | Owner-occupied | Renter-occupied |
| Single Unit, Detached | 140 (81.9%) | 31 (18.1%) |
| Single Unit, Attached | 0 (0.0%) | 0 (0.0%) |
| 2 Unit Apartments | 0 (0.0%) | 6 (100.0%) |
| 3 or 4 Unit Apartments | 2 (25.0%) | 6 (75.0%) |
| 5 to 9 Unit Apartments | 0 (0.0%) | 0 (0.0%) |
| 10 or more Apartments | 0 (0.0%) | 0 (0.0%) |
| Mobile Home / Other | 7 (77.8%) | 2 (22.2%) |
| Total | 149 (76.8%) | 45 (23.2%) |
Housing Structures by Number of Rooms in Kaleva
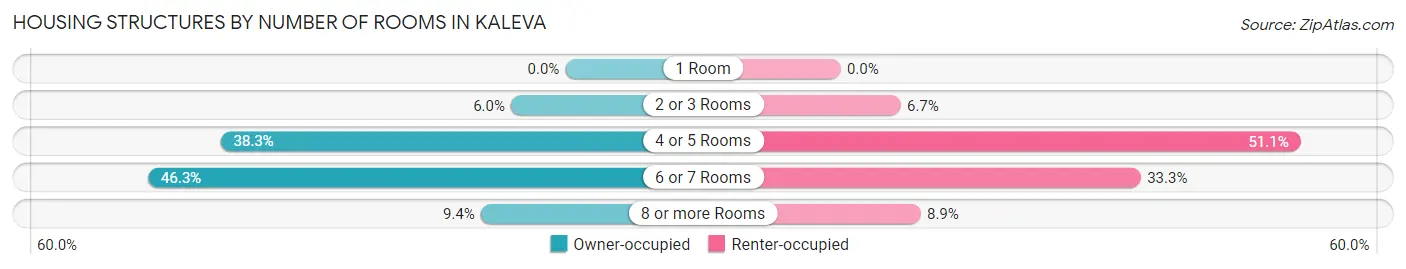
| Number of Rooms | Owner-occupied | Renter-occupied |
| 1 Room | 0 (0.0%) | 0 (0.0%) |
| 2 or 3 Rooms | 9 (6.0%) | 3 (6.7%) |
| 4 or 5 Rooms | 57 (38.3%) | 23 (51.1%) |
| 6 or 7 Rooms | 69 (46.3%) | 15 (33.3%) |
| 8 or more Rooms | 14 (9.4%) | 4 (8.9%) |
| Total | 149 (100.0%) | 45 (100.0%) |
Housing Structure by Heating Type in Kaleva

| Heating Type | Owner-occupied | Renter-occupied |
| Utility Gas | 108 (72.5%) | 19 (42.2%) |
| Bottled, Tank, or LP Gas | 9 (6.0%) | 8 (17.8%) |
| Electricity | 19 (12.8%) | 15 (33.3%) |
| Fuel Oil or Kerosene | 6 (4.0%) | 0 (0.0%) |
| Coal or Coke | 0 (0.0%) | 0 (0.0%) |
| All other Fuels | 7 (4.7%) | 3 (6.7%) |
| No Fuel Used | 0 (0.0%) | 0 (0.0%) |
| Total | 149 (100.0%) | 45 (100.0%) |
Household Vehicle Usage in Kaleva
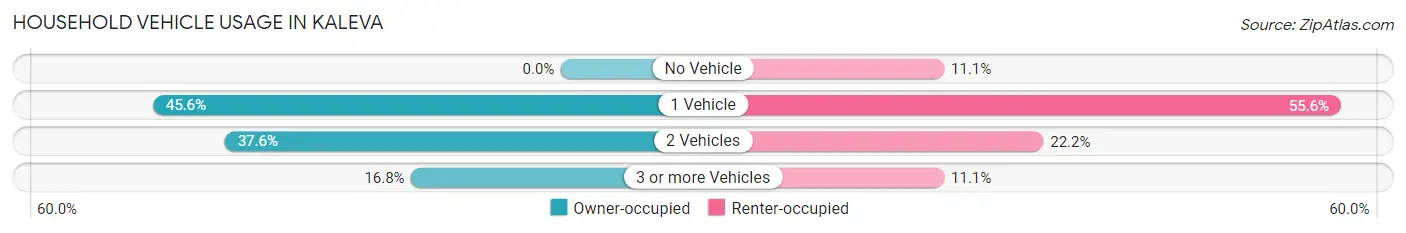
| Vehicles per Household | Owner-occupied | Renter-occupied |
| No Vehicle | 0 (0.0%) | 5 (11.1%) |
| 1 Vehicle | 68 (45.6%) | 25 (55.6%) |
| 2 Vehicles | 56 (37.6%) | 10 (22.2%) |
| 3 or more Vehicles | 25 (16.8%) | 5 (11.1%) |
| Total | 149 (100.0%) | 45 (100.0%) |
Real Estate & Mortgages in Kaleva
Real Estate and Mortgage Overview in Kaleva
| Characteristic | Without Mortgage | With Mortgage |
| Housing Units | 76 | 73 |
| Median Property Value | $82,900 | $79,800 |
| Median Household Income | - | - |
| Monthly Housing Costs | $357 | $0 |
| Real Estate Taxes | $1,214 | $2 |
Property Value by Mortgage Status in Kaleva
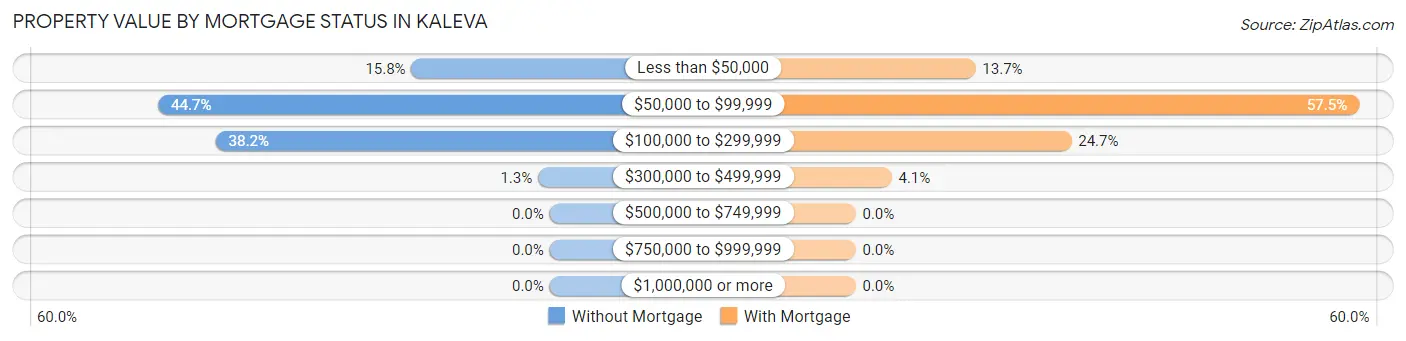
| Property Value | Without Mortgage | With Mortgage |
| Less than $50,000 | 12 (15.8%) | 10 (13.7%) |
| $50,000 to $99,999 | 34 (44.7%) | 42 (57.5%) |
| $100,000 to $299,999 | 29 (38.2%) | 18 (24.7%) |
| $300,000 to $499,999 | 1 (1.3%) | 3 (4.1%) |
| $500,000 to $749,999 | 0 (0.0%) | 0 (0.0%) |
| $750,000 to $999,999 | 0 (0.0%) | 0 (0.0%) |
| $1,000,000 or more | 0 (0.0%) | 0 (0.0%) |
| Total | 76 (100.0%) | 73 (100.0%) |
Household Income by Mortgage Status in Kaleva
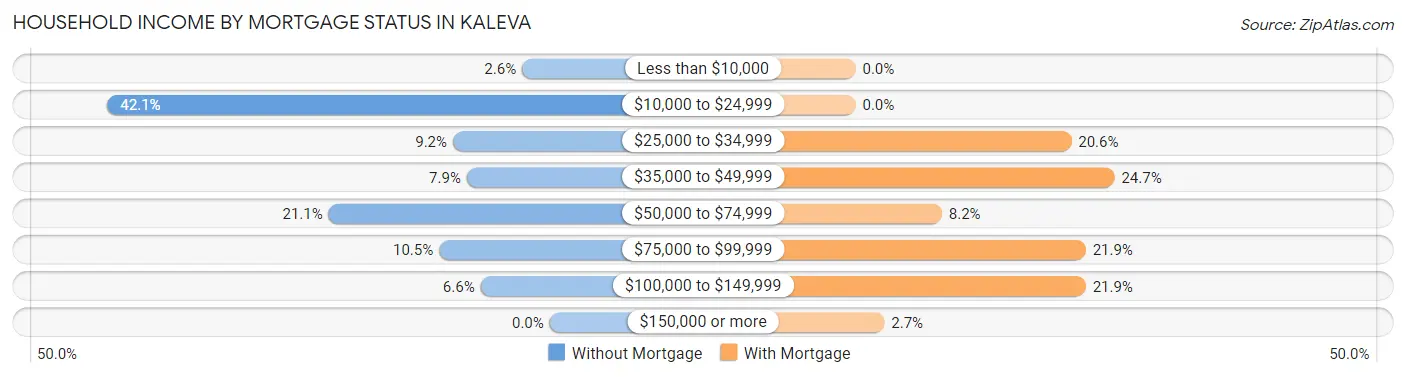
| Household Income | Without Mortgage | With Mortgage |
| Less than $10,000 | 2 (2.6%) | 0 (0.0%) |
| $10,000 to $24,999 | 32 (42.1%) | 0 (0.0%) |
| $25,000 to $34,999 | 7 (9.2%) | 15 (20.5%) |
| $35,000 to $49,999 | 6 (7.9%) | 18 (24.7%) |
| $50,000 to $74,999 | 16 (21.0%) | 6 (8.2%) |
| $75,000 to $99,999 | 8 (10.5%) | 16 (21.9%) |
| $100,000 to $149,999 | 5 (6.6%) | 16 (21.9%) |
| $150,000 or more | 0 (0.0%) | 2 (2.7%) |
| Total | 76 (100.0%) | 73 (100.0%) |
Property Value to Household Income Ratio in Kaleva
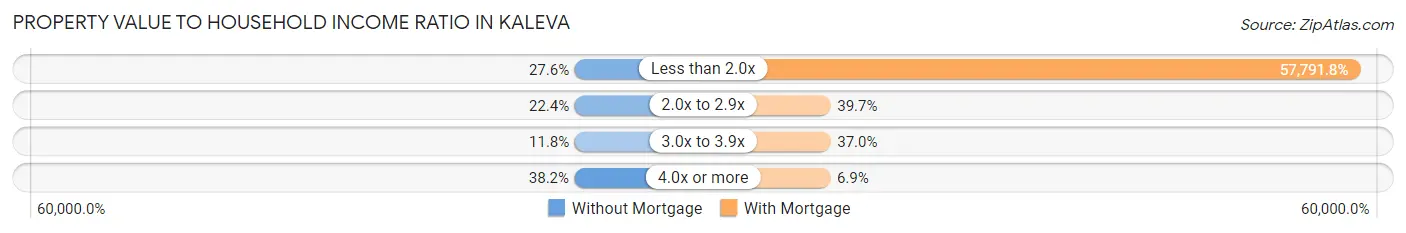
| Value-to-Income Ratio | Without Mortgage | With Mortgage |
| Less than 2.0x | 21 (27.6%) | 42,188 (57,791.8%) |
| 2.0x to 2.9x | 17 (22.4%) | 29 (39.7%) |
| 3.0x to 3.9x | 9 (11.8%) | 27 (37.0%) |
| 4.0x or more | 29 (38.2%) | 5 (6.9%) |
| Total | 76 (100.0%) | 73 (100.0%) |
Real Estate Taxes by Mortgage Status in Kaleva
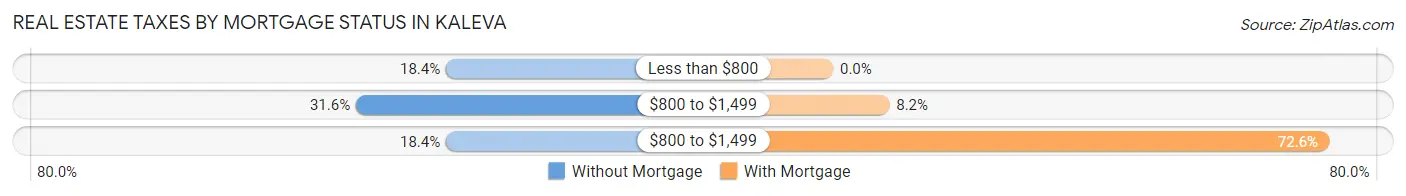
| Property Taxes | Without Mortgage | With Mortgage |
| Less than $800 | 14 (18.4%) | 0 (0.0%) |
| $800 to $1,499 | 24 (31.6%) | 6 (8.2%) |
| $800 to $1,499 | 14 (18.4%) | 53 (72.6%) |
| Total | 76 (100.0%) | 73 (100.0%) |
Health & Disability in Kaleva
Health Insurance Coverage by Age in Kaleva
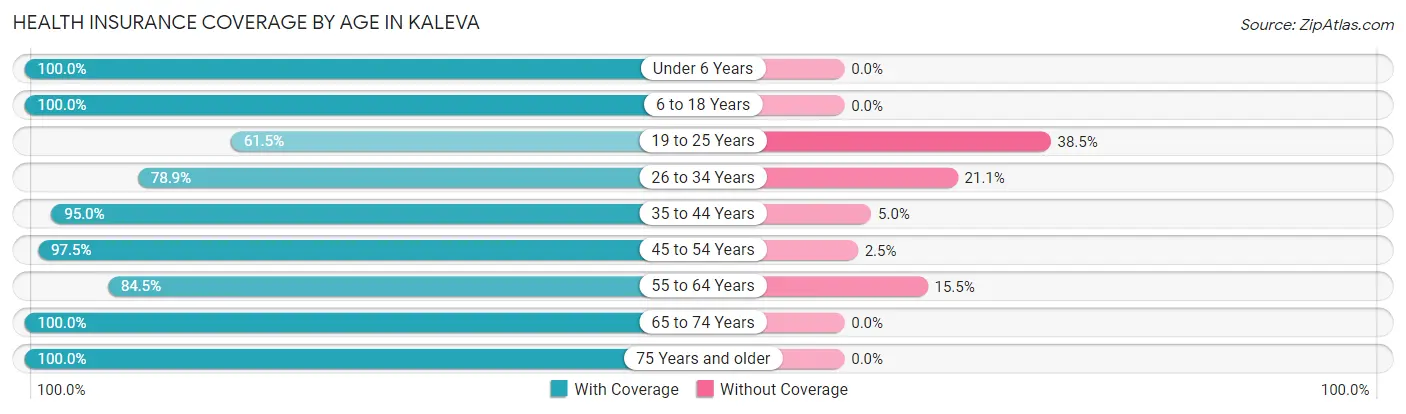
| Age Bracket | With Coverage | Without Coverage |
| Under 6 Years | 43 (100.0%) | 0 (0.0%) |
| 6 to 18 Years | 98 (100.0%) | 0 (0.0%) |
| 19 to 25 Years | 8 (61.5%) | 5 (38.5%) |
| 26 to 34 Years | 56 (78.9%) | 15 (21.1%) |
| 35 to 44 Years | 38 (95.0%) | 2 (5.0%) |
| 45 to 54 Years | 39 (97.5%) | 1 (2.5%) |
| 55 to 64 Years | 49 (84.5%) | 9 (15.5%) |
| 65 to 74 Years | 66 (100.0%) | 0 (0.0%) |
| 75 Years and older | 58 (100.0%) | 0 (0.0%) |
| Total | 455 (93.4%) | 32 (6.6%) |
Health Insurance Coverage by Citizenship Status in Kaleva
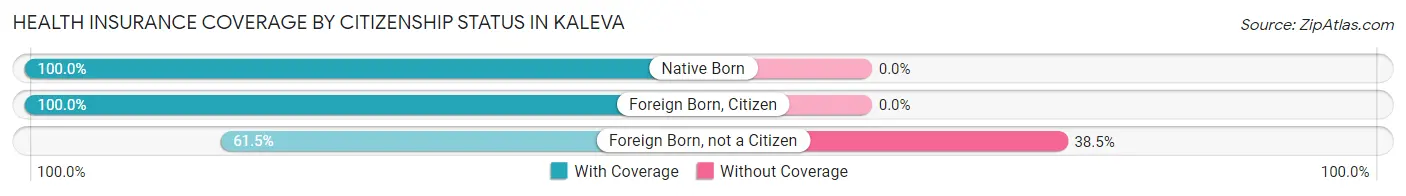
| Citizenship Status | With Coverage | Without Coverage |
| Native Born | 43 (100.0%) | 0 (0.0%) |
| Foreign Born, Citizen | 98 (100.0%) | 0 (0.0%) |
| Foreign Born, not a Citizen | 8 (61.5%) | 5 (38.5%) |
Health Insurance Coverage by Household Income in Kaleva
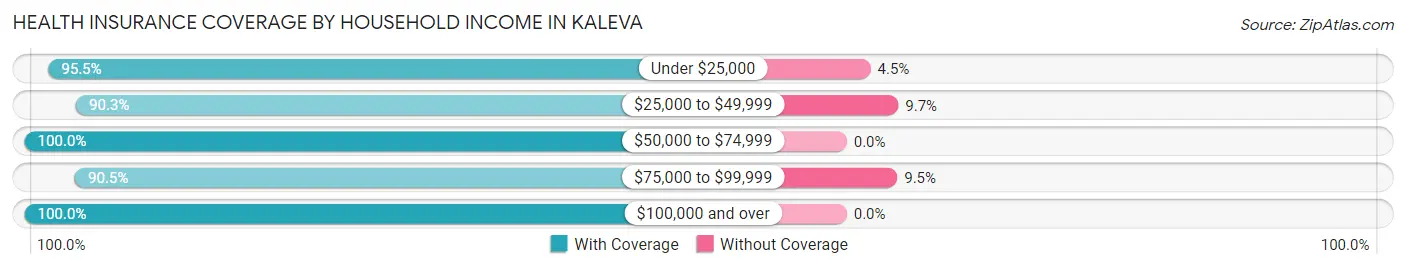
| Household Income | With Coverage | Without Coverage |
| Under $25,000 | 107 (95.5%) | 5 (4.5%) |
| $25,000 to $49,999 | 187 (90.3%) | 20 (9.7%) |
| $50,000 to $74,999 | 77 (100.0%) | 0 (0.0%) |
| $75,000 to $99,999 | 67 (90.5%) | 7 (9.5%) |
| $100,000 and over | 17 (100.0%) | 0 (0.0%) |
Public vs Private Health Insurance Coverage by Age in Kaleva
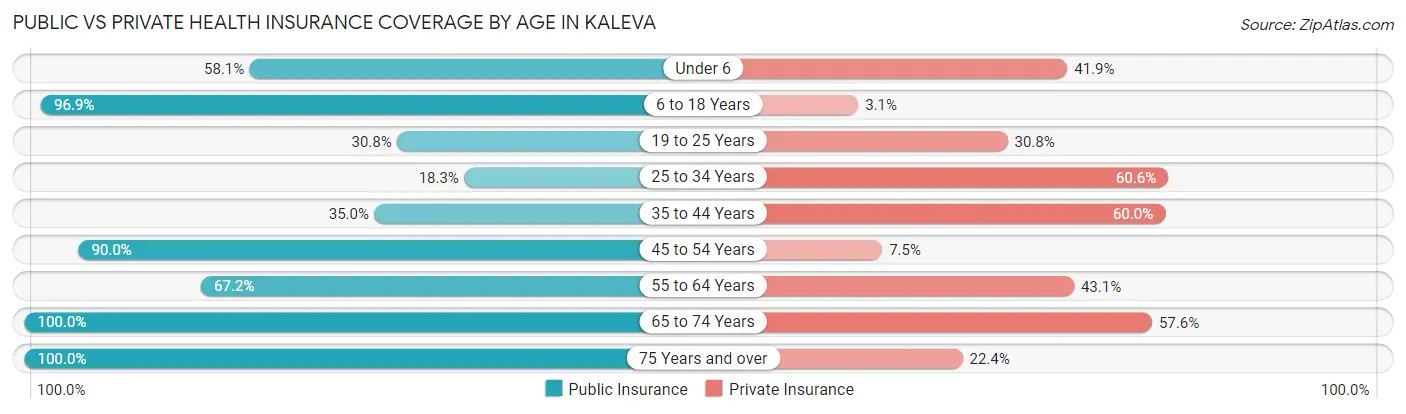
| Age Bracket | Public Insurance | Private Insurance |
| Under 6 | 25 (58.1%) | 18 (41.9%) |
| 6 to 18 Years | 95 (96.9%) | 3 (3.1%) |
| 19 to 25 Years | 4 (30.8%) | 4 (30.8%) |
| 25 to 34 Years | 13 (18.3%) | 43 (60.6%) |
| 35 to 44 Years | 14 (35.0%) | 24 (60.0%) |
| 45 to 54 Years | 36 (90.0%) | 3 (7.5%) |
| 55 to 64 Years | 39 (67.2%) | 25 (43.1%) |
| 65 to 74 Years | 66 (100.0%) | 38 (57.6%) |
| 75 Years and over | 58 (100.0%) | 13 (22.4%) |
| Total | 350 (71.9%) | 171 (35.1%) |
Disability Status by Sex by Age in Kaleva
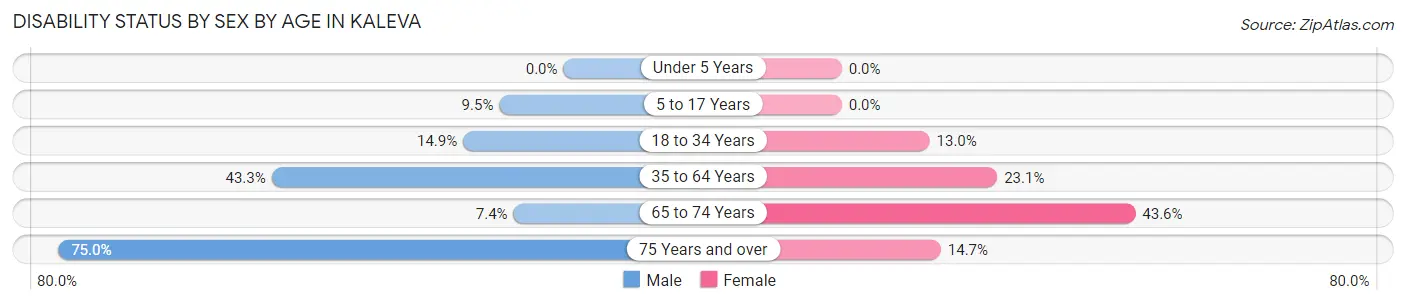
| Age Bracket | Male | Female |
| Under 5 Years | 0 (0.0%) | 0 (0.0%) |
| 5 to 17 Years | 8 (9.5%) | 0 (0.0%) |
| 18 to 34 Years | 7 (14.9%) | 6 (13.0%) |
| 35 to 64 Years | 26 (43.3%) | 18 (23.1%) |
| 65 to 74 Years | 2 (7.4%) | 17 (43.6%) |
| 75 Years and over | 18 (75.0%) | 5 (14.7%) |
Disability Class by Sex by Age in Kaleva
Disability Class: Hearing Difficulty
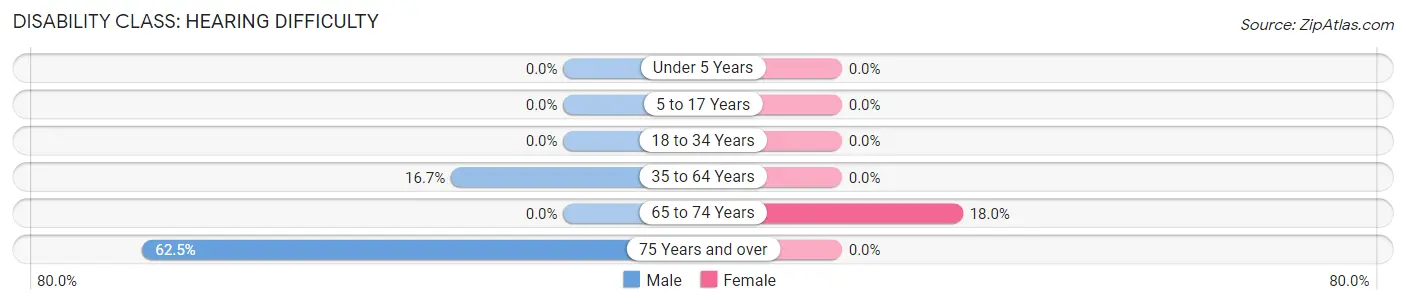
| Age Bracket | Male | Female |
| Under 5 Years | 0 (0.0%) | 0 (0.0%) |
| 5 to 17 Years | 0 (0.0%) | 0 (0.0%) |
| 18 to 34 Years | 0 (0.0%) | 0 (0.0%) |
| 35 to 64 Years | 10 (16.7%) | 0 (0.0%) |
| 65 to 74 Years | 0 (0.0%) | 7 (17.9%) |
| 75 Years and over | 15 (62.5%) | 0 (0.0%) |
Disability Class: Vision Difficulty
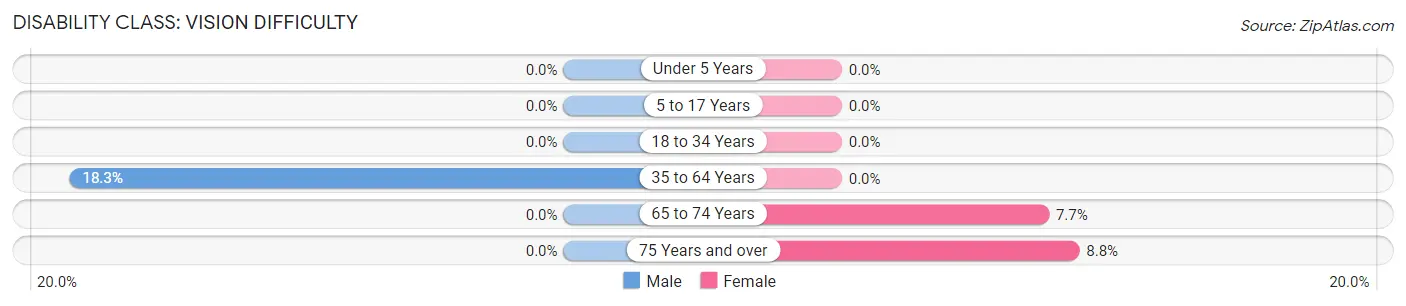
| Age Bracket | Male | Female |
| Under 5 Years | 0 (0.0%) | 0 (0.0%) |
| 5 to 17 Years | 0 (0.0%) | 0 (0.0%) |
| 18 to 34 Years | 0 (0.0%) | 0 (0.0%) |
| 35 to 64 Years | 11 (18.3%) | 0 (0.0%) |
| 65 to 74 Years | 0 (0.0%) | 3 (7.7%) |
| 75 Years and over | 0 (0.0%) | 3 (8.8%) |
Disability Class: Cognitive Difficulty
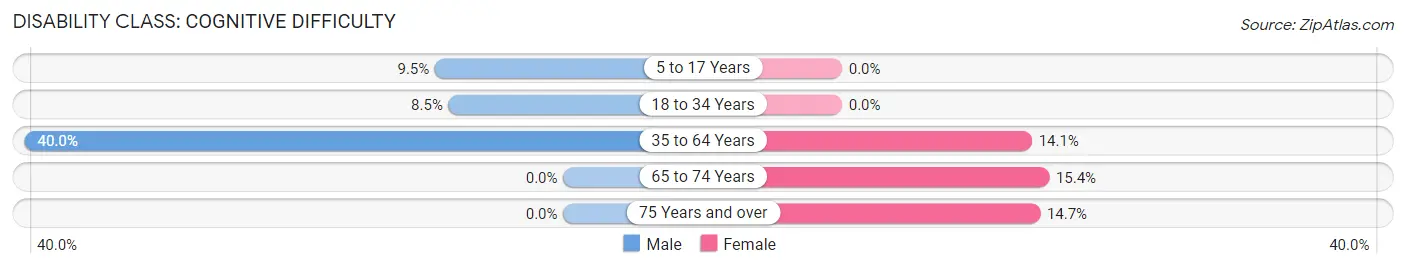
| Age Bracket | Male | Female |
| 5 to 17 Years | 8 (9.5%) | 0 (0.0%) |
| 18 to 34 Years | 4 (8.5%) | 0 (0.0%) |
| 35 to 64 Years | 24 (40.0%) | 11 (14.1%) |
| 65 to 74 Years | 0 (0.0%) | 6 (15.4%) |
| 75 Years and over | 0 (0.0%) | 5 (14.7%) |
Disability Class: Ambulatory Difficulty
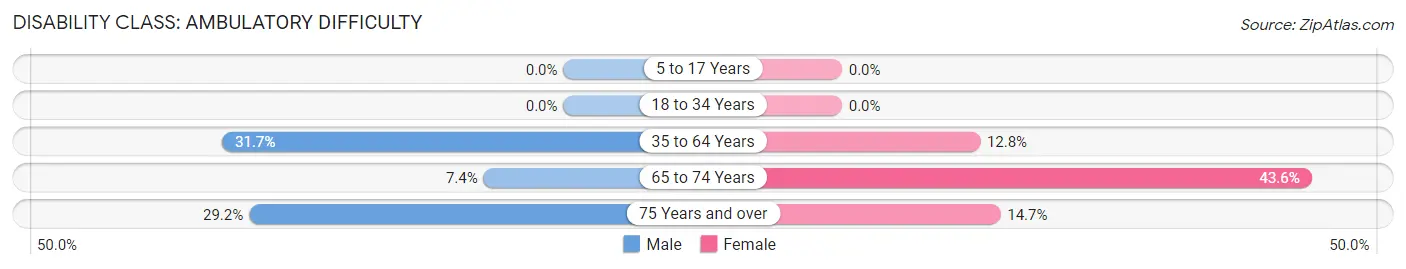
| Age Bracket | Male | Female |
| 5 to 17 Years | 0 (0.0%) | 0 (0.0%) |
| 18 to 34 Years | 0 (0.0%) | 0 (0.0%) |
| 35 to 64 Years | 19 (31.7%) | 10 (12.8%) |
| 65 to 74 Years | 2 (7.4%) | 17 (43.6%) |
| 75 Years and over | 7 (29.2%) | 5 (14.7%) |
Disability Class: Self-Care Difficulty
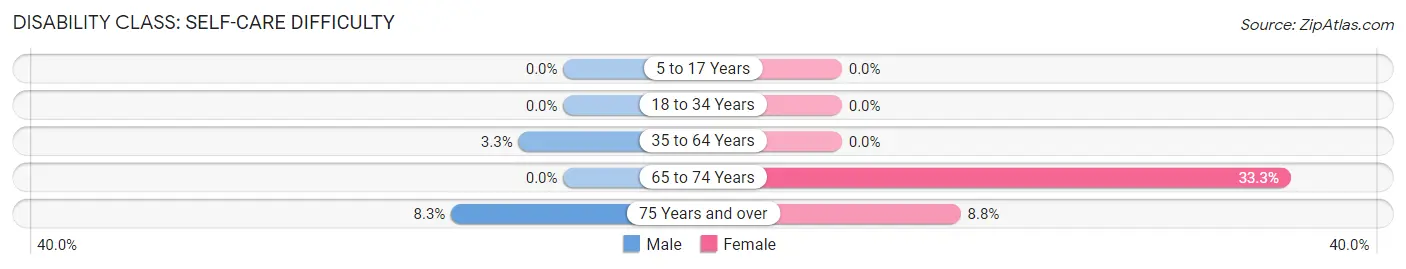
| Age Bracket | Male | Female |
| 5 to 17 Years | 0 (0.0%) | 0 (0.0%) |
| 18 to 34 Years | 0 (0.0%) | 0 (0.0%) |
| 35 to 64 Years | 2 (3.3%) | 0 (0.0%) |
| 65 to 74 Years | 0 (0.0%) | 13 (33.3%) |
| 75 Years and over | 2 (8.3%) | 3 (8.8%) |
Technology Access in Kaleva
Computing Device Access in Kaleva
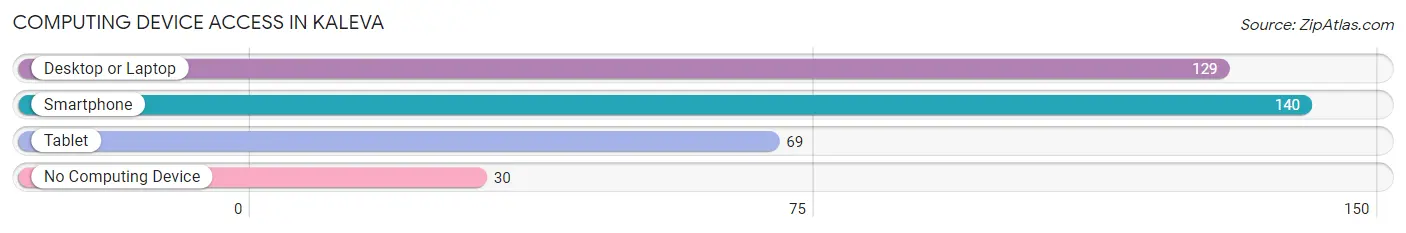
| Device Type | # Households | % Households |
| Desktop or Laptop | 129 | 66.5% |
| Smartphone | 140 | 72.2% |
| Tablet | 69 | 35.6% |
| No Computing Device | 30 | 15.5% |
| Total | 194 | 100.0% |
Internet Access in Kaleva
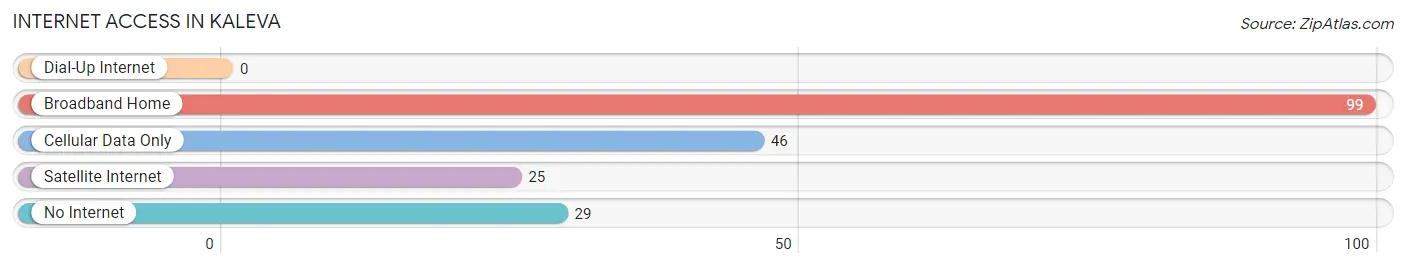
| Internet Type | # Households | % Households |
| Dial-Up Internet | 0 | 0.0% |
| Broadband Home | 99 | 51.0% |
| Cellular Data Only | 46 | 23.7% |
| Satellite Internet | 25 | 12.9% |
| No Internet | 29 | 14.9% |
| Total | 194 | 100.0% |
Kaleva Summary
Kaleva is a small unincorporated community located in Manistee County, Michigan. It is situated on the banks of the Manistee River, approximately 10 miles east of Manistee. The population of Kaleva was estimated to be around 500 in 2020.
History
Kaleva was founded in 1871 by Finnish immigrants who had come to the area to work in the lumber industry. The town was named after the Finnish national epic, the Kalevala. The first settlers built a sawmill and a gristmill, and the town quickly grew. By the early 1900s, Kaleva had become a thriving community with a variety of businesses, including a general store, a blacksmith shop, a hotel, and a post office.
In the early 1900s, Kaleva was a popular destination for tourists, who came to enjoy the area’s natural beauty and to fish in the Manistee River. The town also had a thriving lumber industry, and the local sawmill was one of the largest in the area.
In the 1950s, the lumber industry began to decline, and the town’s population began to dwindle. In the 1970s, the town was nearly abandoned, but in the 1980s, a new wave of immigrants began to move to Kaleva, and the town began to experience a resurgence.
Geography
Kaleva is located in Manistee County, Michigan, approximately 10 miles east of Manistee. The town is situated on the banks of the Manistee River, and is surrounded by rolling hills and forests. The area is known for its natural beauty, and is a popular destination for outdoor recreation.
Economy
Kaleva’s economy is largely based on tourism and outdoor recreation. The town is home to several campgrounds, and the nearby Manistee River is a popular destination for fishing and boating. The town also has a few small businesses, including a general store, a restaurant, and a gas station.
Demographics
Kaleva’s population was estimated to be around 500 in 2020. The town is predominantly white, with a small minority population. The median household income is around $35,000, and the median home value is around $90,000. The town has a high rate of homeownership, with nearly 80% of residents owning their own homes.
Common Questions
What is Per Capita Income in Kaleva?
Per Capita income in Kaleva is $18,341.
What is the Median Family Income in Kaleva?
Median Family Income in Kaleva is $46,875.
What is the Median Household income in Kaleva?
Median Household Income in Kaleva is $40,000.
What is Income or Wage Gap in Kaleva?
Income or Wage Gap in Kaleva is 17.2%.
Women in Kaleva earn 82.8 cents for every dollar earned by a man.
What is Inequality or Gini Index in Kaleva?
Inequality or Gini Index in Kaleva is 0.34.
What is the Total Population of Kaleva?
Total Population of Kaleva is 487.
What is the Total Male Population of Kaleva?
Total Male Population of Kaleva is 250.
What is the Total Female Population of Kaleva?
Total Female Population of Kaleva is 237.
What is the Ratio of Males per 100 Females in Kaleva?
There are 105.49 Males per 100 Females in Kaleva.
What is the Ratio of Females per 100 Males in Kaleva?
There are 94.80 Females per 100 Males in Kaleva.
What is the Median Population Age in Kaleva?
Median Population Age in Kaleva is 37.6 Years.
What is the Average Family Size in Kaleva
Average Family Size in Kaleva is 3.4 People.
What is the Average Household Size in Kaleva
Average Household Size in Kaleva is 2.5 People.
How Large is the Labor Force in Kaleva?
There are 152 People in the Labor Forcein in Kaleva.
What is the Percentage of People in the Labor Force in Kaleva?
41.1% of People are in the Labor Force in Kaleva.
What is the Unemployment Rate in Kaleva?
Unemployment Rate in Kaleva is 9.2%.