Rittman, OH Map & Demographics
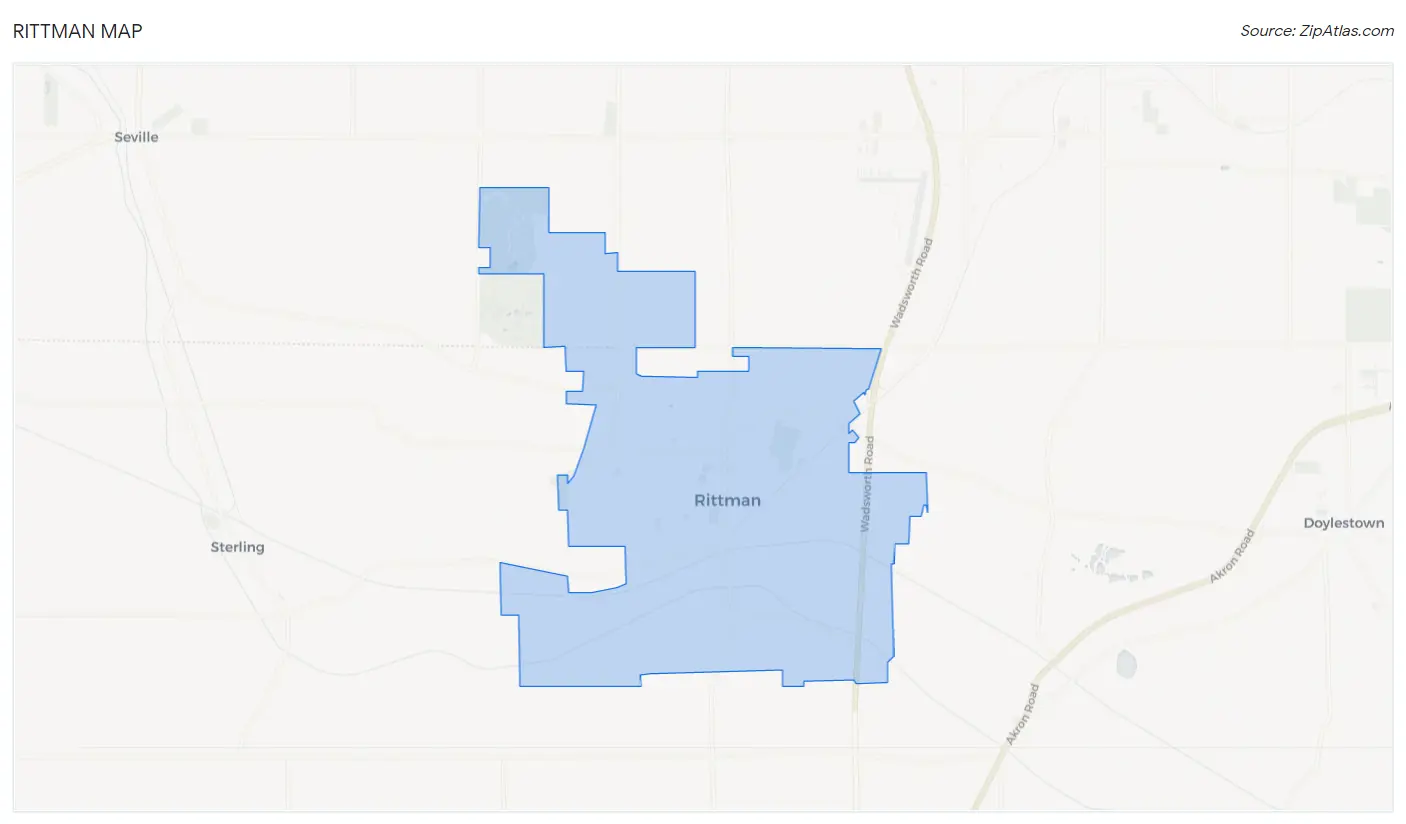
Rittman Map
Rittman Overview
$36,297
PER CAPITA INCOME
$88,144
AVG FAMILY INCOME
$61,331
AVG HOUSEHOLD INCOME
21.5%
WAGE / INCOME GAP [ % ]
78.5¢/ $1
WAGE / INCOME GAP [ $ ]
0.48
INEQUALITY / GINI INDEX
6,058
TOTAL POPULATION
3,254
MALE POPULATION
2,804
FEMALE POPULATION
116.05
MALES / 100 FEMALES
86.17
FEMALES / 100 MALES
36.5
MEDIAN AGE
3.2
AVG FAMILY SIZE
2.5
AVG HOUSEHOLD SIZE
3,151
LABOR FORCE [ PEOPLE ]
65.9%
PERCENT IN LABOR FORCE
7.3%
UNEMPLOYMENT RATE
Rittman Zip Codes
Rittman Area Codes
Income in Rittman
Income Overview in Rittman
Per Capita Income in Rittman is $36,297, while median incomes of families and households are $88,144 and $61,331 respectively.
| Characteristic | Number | Measure |
| Per Capita Income | 6,058 | $36,297 |
| Median Family Income | 1,486 | $88,144 |
| Mean Family Income | 1,486 | $92,921 |
| Median Household Income | 2,407 | $61,331 |
| Mean Household Income | 2,407 | $88,809 |
| Income Deficit | 1,486 | $0 |
| Wage / Income Gap (%) | 6,058 | 21.48% |
| Wage / Income Gap ($) | 6,058 | 78.52¢ per $1 |
| Gini / Inequality Index | 6,058 | 0.48 |
Earnings by Sex in Rittman
Average Earnings in Rittman are $37,153, $41,264 for men and $32,400 for women, a difference of 21.5%.
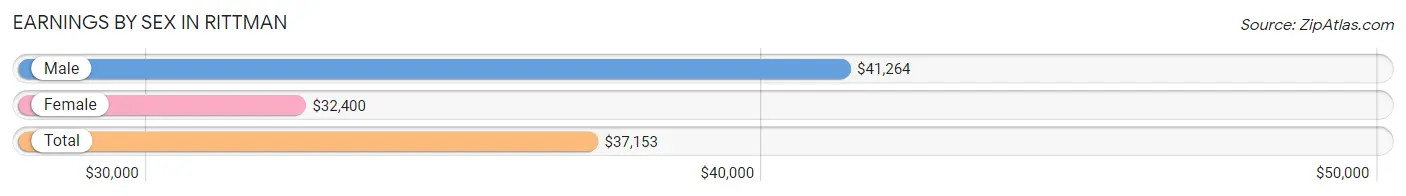
| Sex | Number | Average Earnings |
| Male | 1,905 (58.9%) | $41,264 |
| Female | 1,332 (41.1%) | $32,400 |
| Total | 3,237 (100.0%) | $37,153 |
Earnings by Sex by Income Bracket in Rittman
The most common earnings brackets in Rittman are $100,000+ for men (266 | 14.0%) and $75,000 to $99,999 for women (145 | 10.9%).
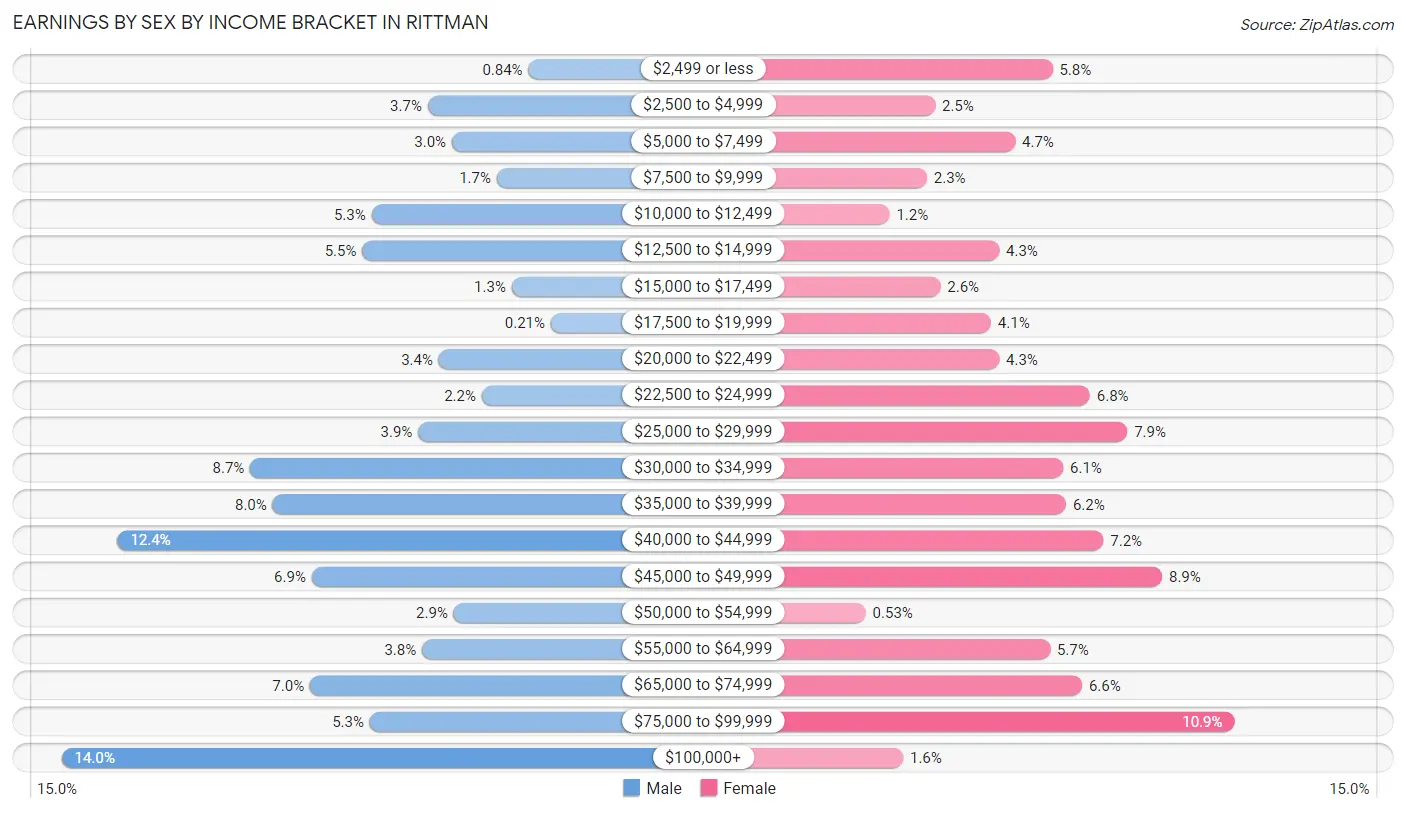
| Income | Male | Female |
| $2,499 or less | 16 (0.8%) | 77 (5.8%) |
| $2,500 to $4,999 | 70 (3.7%) | 33 (2.5%) |
| $5,000 to $7,499 | 57 (3.0%) | 63 (4.7%) |
| $7,500 to $9,999 | 33 (1.7%) | 30 (2.2%) |
| $10,000 to $12,499 | 100 (5.2%) | 16 (1.2%) |
| $12,500 to $14,999 | 105 (5.5%) | 57 (4.3%) |
| $15,000 to $17,499 | 25 (1.3%) | 35 (2.6%) |
| $17,500 to $19,999 | 4 (0.2%) | 54 (4.1%) |
| $20,000 to $22,499 | 64 (3.4%) | 57 (4.3%) |
| $22,500 to $24,999 | 41 (2.1%) | 91 (6.8%) |
| $25,000 to $29,999 | 75 (3.9%) | 105 (7.9%) |
| $30,000 to $34,999 | 165 (8.7%) | 81 (6.1%) |
| $35,000 to $39,999 | 153 (8.0%) | 82 (6.2%) |
| $40,000 to $44,999 | 236 (12.4%) | 96 (7.2%) |
| $45,000 to $49,999 | 132 (6.9%) | 118 (8.9%) |
| $50,000 to $54,999 | 56 (2.9%) | 7 (0.5%) |
| $55,000 to $64,999 | 73 (3.8%) | 76 (5.7%) |
| $65,000 to $74,999 | 133 (7.0%) | 88 (6.6%) |
| $75,000 to $99,999 | 101 (5.3%) | 145 (10.9%) |
| $100,000+ | 266 (14.0%) | 21 (1.6%) |
| Total | 1,905 (100.0%) | 1,332 (100.0%) |
Earnings by Sex by Educational Attainment in Rittman
Average earnings in Rittman are $46,354 for men and $37,418 for women, a difference of 19.3%. Men with an educational attainment of bachelor's degree enjoy the highest average annual earnings of $63,839, while those with high school diploma education earn the least with $42,520. Women with an educational attainment of graduate degree earn the most with the average annual earnings of $77,679, while those with high school diploma education have the smallest earnings of $21,477.
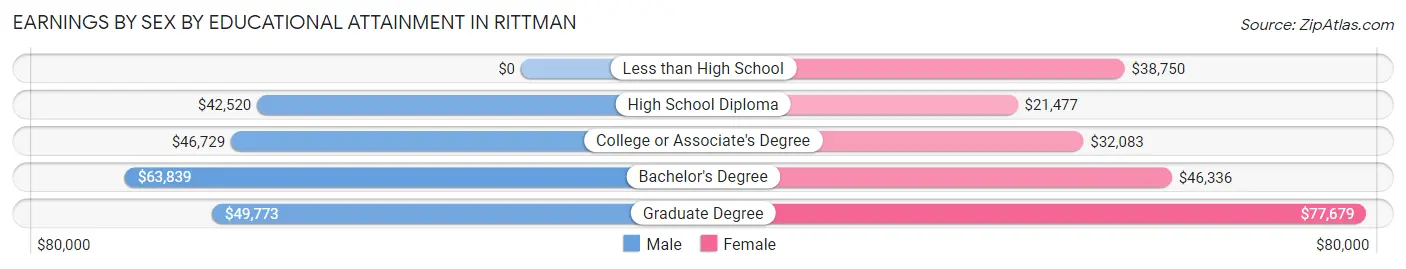
| Educational Attainment | Male Income | Female Income |
| Less than High School | - | - |
| High School Diploma | $42,520 | $21,477 |
| College or Associate's Degree | $46,729 | $32,083 |
| Bachelor's Degree | $63,839 | $46,336 |
| Graduate Degree | $49,773 | $77,679 |
| Total | $46,354 | $37,418 |
Family Income in Rittman
Family Income Brackets in Rittman
According to the Rittman family income data, there are 425 families falling into the $100,000 to $149,999 income range, which is the most common income bracket and makes up 28.6% of all families.
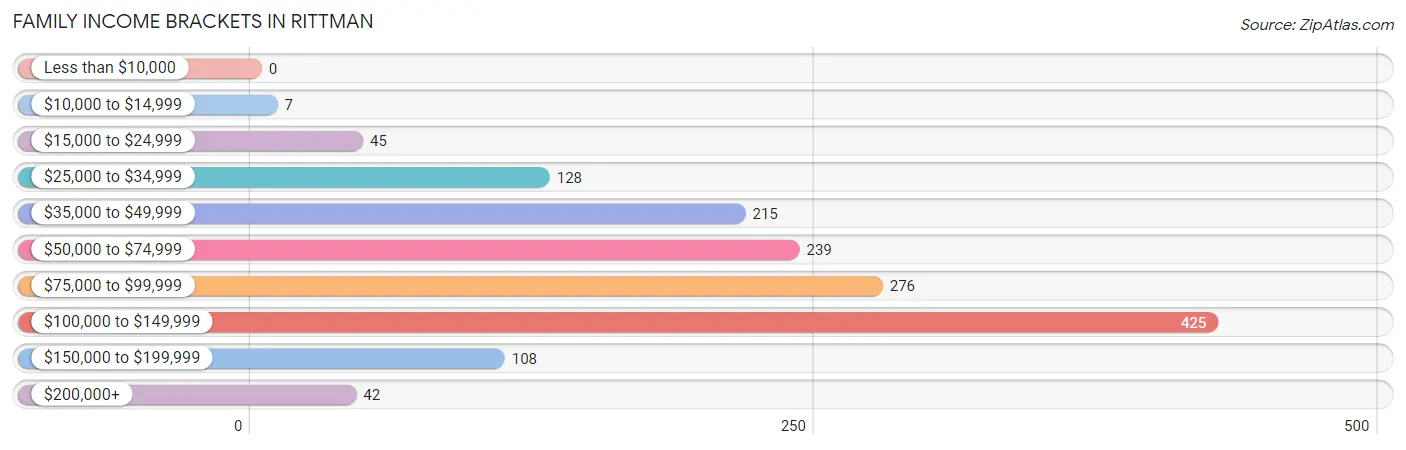
| Income Bracket | # Families | % Families |
| Less than $10,000 | 0 | 0.0% |
| $10,000 to $14,999 | 7 | 0.5% |
| $15,000 to $24,999 | 45 | 3.0% |
| $25,000 to $34,999 | 128 | 8.6% |
| $35,000 to $49,999 | 215 | 14.5% |
| $50,000 to $74,999 | 239 | 16.1% |
| $75,000 to $99,999 | 276 | 18.6% |
| $100,000 to $149,999 | 425 | 28.6% |
| $150,000 to $199,999 | 108 | 7.3% |
| $200,000+ | 42 | 2.8% |
Family Income by Famaliy Size in Rittman
5-person families (178 | 12.0%) account for the highest median family income in Rittman with $111,711 per family, while 2-person families (735 | 49.5%) have the highest median income of $35,822 per family member.
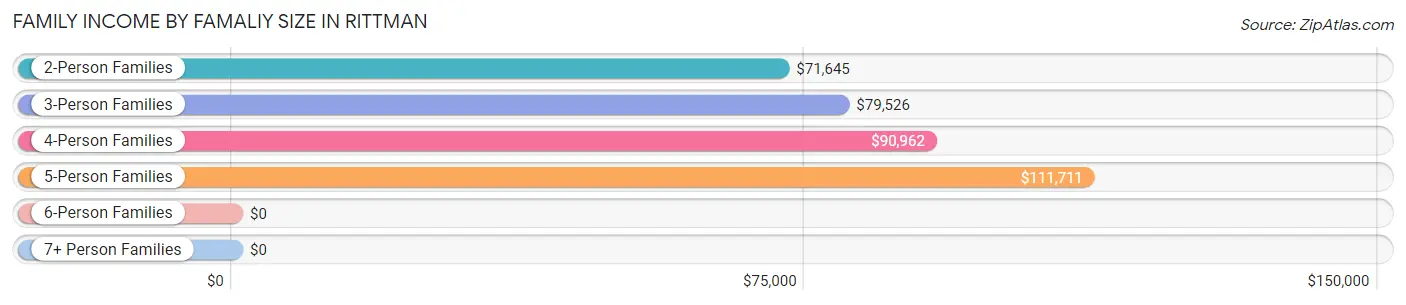
| Income Bracket | # Families | Median Income |
| 2-Person Families | 735 (49.5%) | $71,645 |
| 3-Person Families | 291 (19.6%) | $79,526 |
| 4-Person Families | 214 (14.4%) | $90,962 |
| 5-Person Families | 178 (12.0%) | $111,711 |
| 6-Person Families | 12 (0.8%) | $0 |
| 7+ Person Families | 56 (3.8%) | $0 |
| Total | 1,486 (100.0%) | $88,144 |
Family Income by Number of Earners in Rittman
The median family income in Rittman is $88,144, with families comprising 3+ earners (182) having the highest median family income of $140,313, while families with no earners (179) have the lowest median family income of $45,625, accounting for 12.2% and 12.0% of families, respectively.
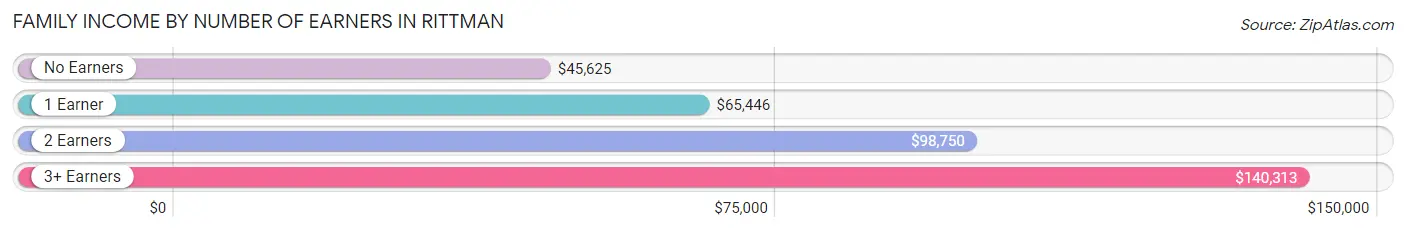
| Number of Earners | # Families | Median Income |
| No Earners | 179 (12.0%) | $45,625 |
| 1 Earner | 460 (31.0%) | $65,446 |
| 2 Earners | 665 (44.8%) | $98,750 |
| 3+ Earners | 182 (12.2%) | $140,313 |
| Total | 1,486 (100.0%) | $88,144 |
Household Income in Rittman
Household Income Brackets in Rittman
With 438 households falling in the category, the $50,000 to $74,999 income range is the most frequent in Rittman, accounting for 18.2% of all households. In contrast, only 70 households (2.9%) fall into the less than $10,000 income bracket, making it the least populous group.
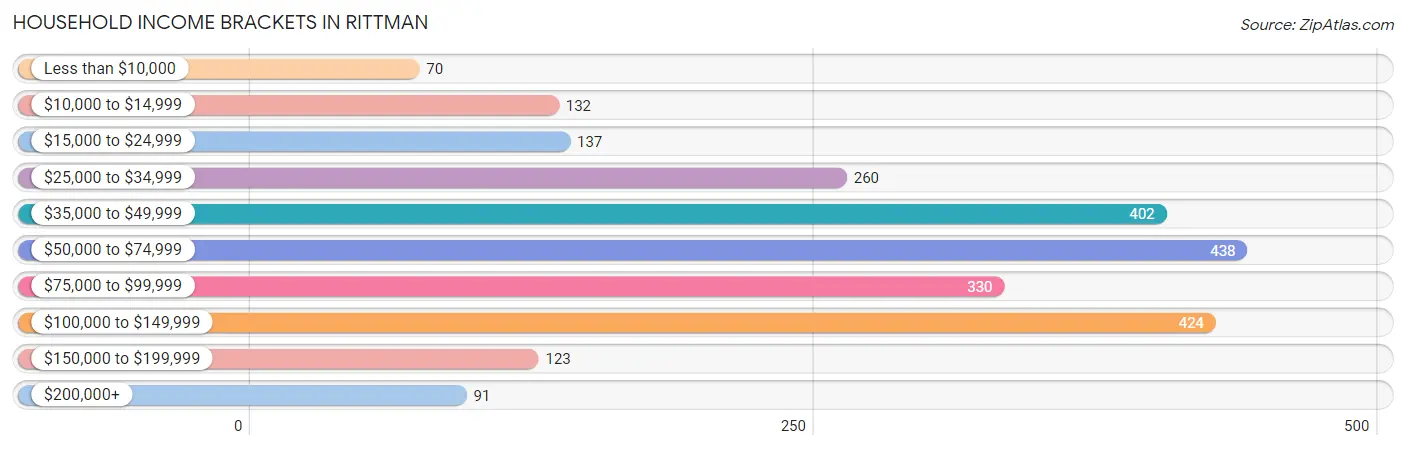
| Income Bracket | # Households | % Households |
| Less than $10,000 | 70 | 2.9% |
| $10,000 to $14,999 | 132 | 5.5% |
| $15,000 to $24,999 | 137 | 5.7% |
| $25,000 to $34,999 | 260 | 10.8% |
| $35,000 to $49,999 | 402 | 16.7% |
| $50,000 to $74,999 | 438 | 18.2% |
| $75,000 to $99,999 | 330 | 13.7% |
| $100,000 to $149,999 | 424 | 17.6% |
| $150,000 to $199,999 | 123 | 5.1% |
| $200,000+ | 91 | 3.8% |
Household Income by Householder Age in Rittman
The median household income in Rittman is $61,331, with the highest median household income of $77,632 found in the 45 to 64 years age bracket for the primary householder. A total of 988 households (41.0%) fall into this category. Meanwhile, the 65+ years age bracket for the primary householder has the lowest median household income of $34,423, with 496 households (20.6%) in this group.
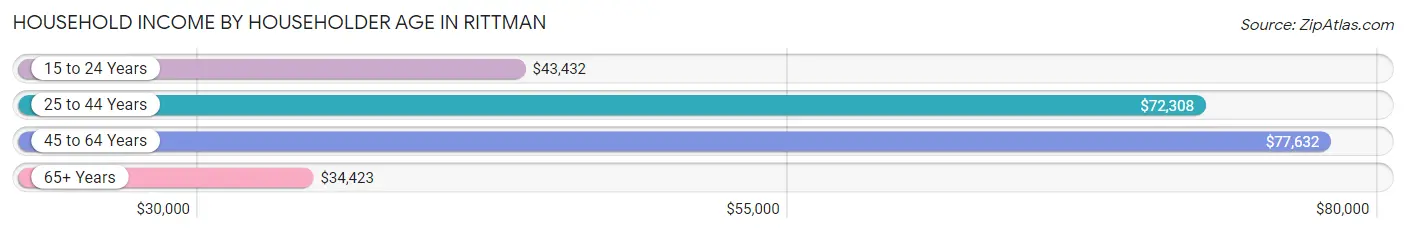
| Income Bracket | # Households | Median Income |
| 15 to 24 Years | 105 (4.4%) | $43,432 |
| 25 to 44 Years | 818 (34.0%) | $72,308 |
| 45 to 64 Years | 988 (41.0%) | $77,632 |
| 65+ Years | 496 (20.6%) | $34,423 |
| Total | 2,407 (100.0%) | $61,331 |
Poverty in Rittman
Income Below Poverty by Sex and Age in Rittman
With 14.1% poverty level for males and 8.7% for females among the residents of Rittman, 6 to 11 year old males and 75 year old and over females are the most vulnerable to poverty, with 97 males (38.0%) and 66 females (32.7%) in their respective age groups living below the poverty level.
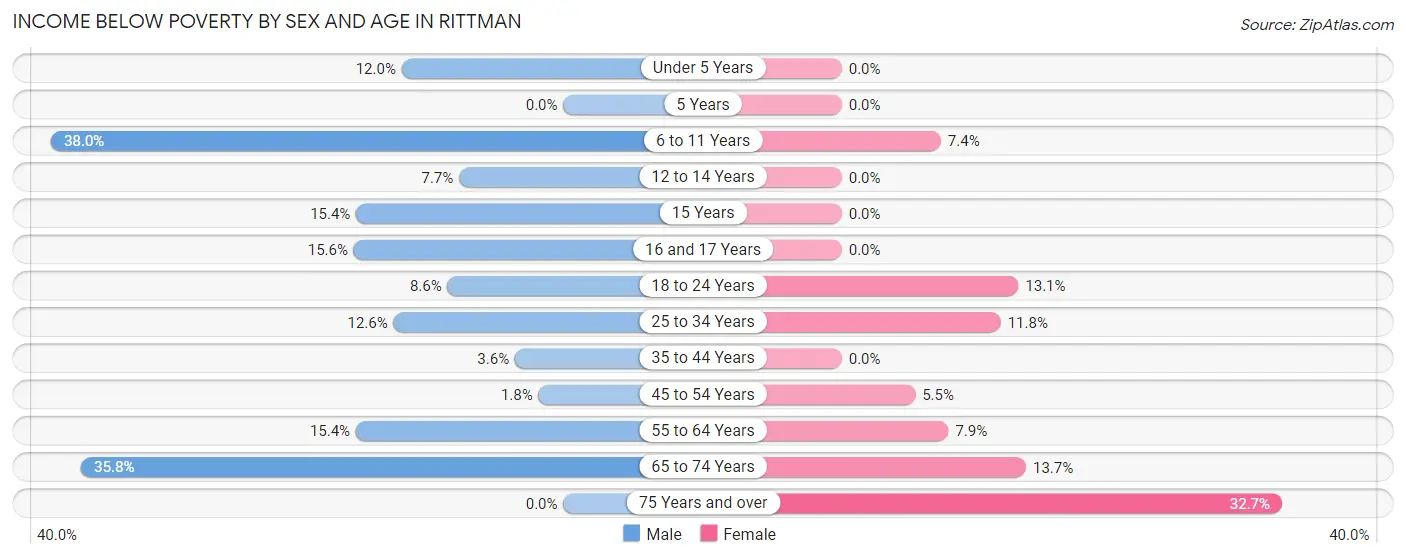
| Age Bracket | Male | Female |
| Under 5 Years | 21 (12.0%) | 0 (0.0%) |
| 5 Years | 0 (0.0%) | 0 (0.0%) |
| 6 to 11 Years | 97 (38.0%) | 19 (7.4%) |
| 12 to 14 Years | 12 (7.7%) | 0 (0.0%) |
| 15 Years | 8 (15.4%) | 0 (0.0%) |
| 16 and 17 Years | 21 (15.6%) | 0 (0.0%) |
| 18 to 24 Years | 35 (8.6%) | 32 (13.1%) |
| 25 to 34 Years | 56 (12.6%) | 44 (11.8%) |
| 35 to 44 Years | 13 (3.6%) | 0 (0.0%) |
| 45 to 54 Years | 7 (1.8%) | 15 (5.4%) |
| 55 to 64 Years | 59 (15.4%) | 42 (7.9%) |
| 65 to 74 Years | 121 (35.8%) | 26 (13.7%) |
| 75 Years and over | 0 (0.0%) | 66 (32.7%) |
| Total | 450 (14.1%) | 244 (8.7%) |
Income Above Poverty by Sex and Age in Rittman
According to the poverty statistics in Rittman, males aged 5 years and females aged under 5 years are the age groups that are most secure financially, with 100.0% of males and 100.0% of females in these age groups living above the poverty line.
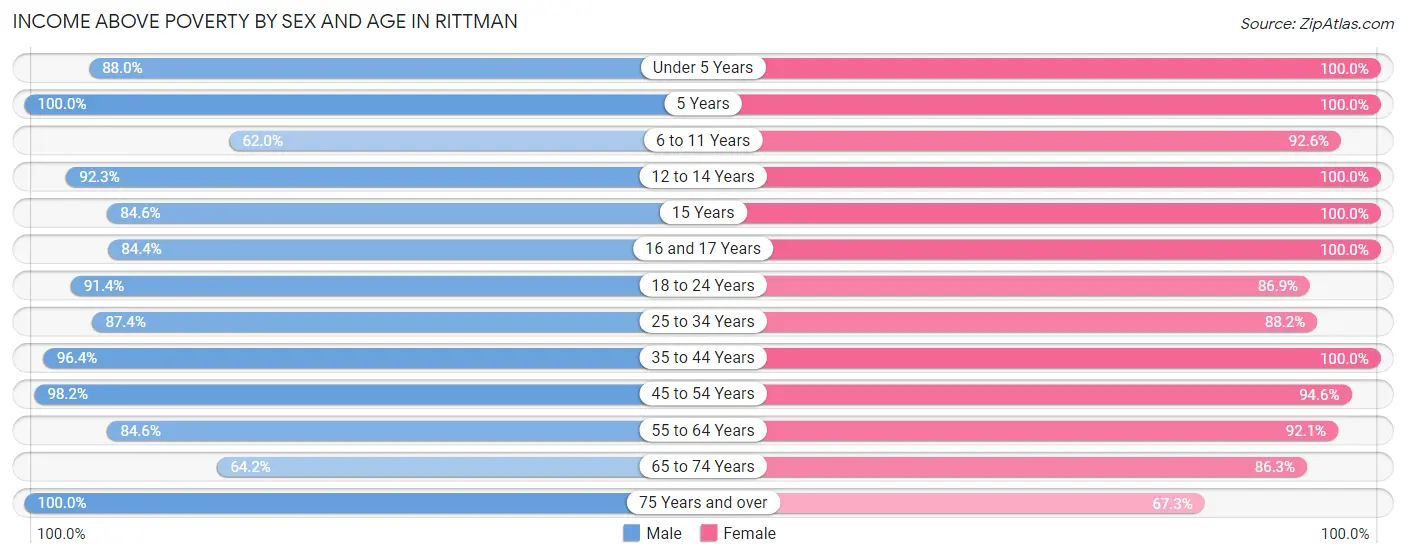
| Age Bracket | Male | Female |
| Under 5 Years | 154 (88.0%) | 153 (100.0%) |
| 5 Years | 12 (100.0%) | 55 (100.0%) |
| 6 to 11 Years | 158 (62.0%) | 239 (92.6%) |
| 12 to 14 Years | 143 (92.3%) | 95 (100.0%) |
| 15 Years | 44 (84.6%) | 67 (100.0%) |
| 16 and 17 Years | 114 (84.4%) | 41 (100.0%) |
| 18 to 24 Years | 372 (91.4%) | 212 (86.9%) |
| 25 to 34 Years | 388 (87.4%) | 329 (88.2%) |
| 35 to 44 Years | 349 (96.4%) | 305 (100.0%) |
| 45 to 54 Years | 373 (98.2%) | 260 (94.6%) |
| 55 to 64 Years | 324 (84.6%) | 488 (92.1%) |
| 65 to 74 Years | 217 (64.2%) | 164 (86.3%) |
| 75 Years and over | 100 (100.0%) | 136 (67.3%) |
| Total | 2,748 (85.9%) | 2,544 (91.2%) |
Income Below Poverty Among Married-Couple Families in Rittman
The poverty statistics for married-couple families in Rittman show that 4.9% or 56 of the total 1,141 families live below the poverty line. Families with 5 or more children have the highest poverty rate of 39.3%, comprising of 22 families. On the other hand, families with 1 or 2 children have the lowest poverty rate of 0.0%, which includes 0 families.
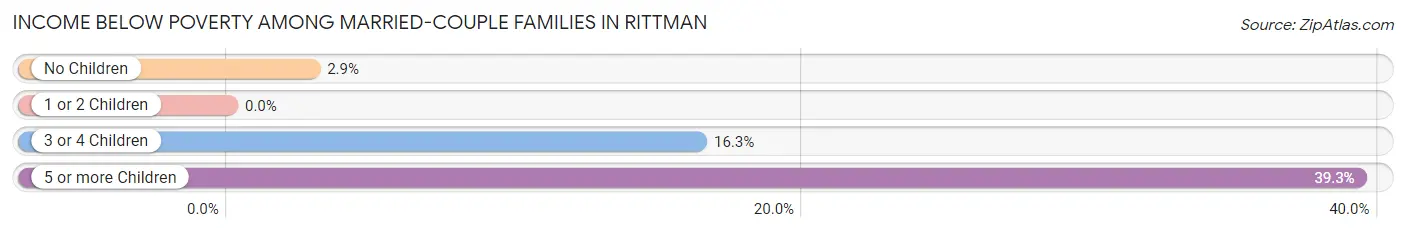
| Children | Above Poverty | Below Poverty |
| No Children | 612 (97.1%) | 18 (2.9%) |
| 1 or 2 Children | 357 (100.0%) | 0 (0.0%) |
| 3 or 4 Children | 82 (83.7%) | 16 (16.3%) |
| 5 or more Children | 34 (60.7%) | 22 (39.3%) |
| Total | 1,085 (95.1%) | 56 (4.9%) |
Income Below Poverty Among Single-Parent Households in Rittman
| Children | Single Father | Single Mother |
| No Children | 0 (0.0%) | 13 (9.3%) |
| 1 or 2 Children | 0 (0.0%) | 0 (0.0%) |
| 3 or 4 Children | 0 (0.0%) | 0 (0.0%) |
| 5 or more Children | 0 (0.0%) | 0 (0.0%) |
| Total | 0 (0.0%) | 13 (4.8%) |
Income Below Poverty Among Married-Couple vs Single-Parent Households in Rittman
The poverty data for Rittman shows that 56 of the married-couple family households (4.9%) and 13 of the single-parent households (3.8%) are living below the poverty level. Within the married-couple family households, those with 5 or more children have the highest poverty rate, with 22 households (39.3%) falling below the poverty line. Among the single-parent households, those with no children have the highest poverty rate, with 13 household (8.2%) living below poverty.
| Children | Married-Couple Families | Single-Parent Households |
| No Children | 18 (2.9%) | 13 (8.2%) |
| 1 or 2 Children | 0 (0.0%) | 0 (0.0%) |
| 3 or 4 Children | 16 (16.3%) | 0 (0.0%) |
| 5 or more Children | 22 (39.3%) | 0 (0.0%) |
| Total | 56 (4.9%) | 13 (3.8%) |
Race in Rittman
The most populous races in Rittman are White / Caucasian (5,690 | 93.9%), Hispanic or Latino (134 | 2.2%), and Some other Race (122 | 2.0%).
| Race | # Population | % Population |
| Asian | 61 | 1.0% |
| Black / African American | 86 | 1.4% |
| Hawaiian / Pacific | 0 | 0.0% |
| Hispanic or Latino | 134 | 2.2% |
| Native / Alaskan | 14 | 0.2% |
| White / Caucasian | 5,690 | 93.9% |
| Two or more Races | 85 | 1.4% |
| Some other Race | 122 | 2.0% |
| Total | 6,058 | 100.0% |
Ancestry in Rittman
The most populous ancestries reported in Rittman are German (1,292 | 21.3%), English (552 | 9.1%), Irish (392 | 6.5%), American (372 | 6.1%), and Polish (248 | 4.1%), together accounting for 47.1% of all Rittman residents.
| Ancestry | # Population | % Population |
| American | 372 | 6.1% |
| Austrian | 6 | 0.1% |
| Bhutanese | 10 | 0.2% |
| British | 55 | 0.9% |
| Celtic | 13 | 0.2% |
| Central American | 11 | 0.2% |
| Cherokee | 2 | 0.0% |
| Croatian | 68 | 1.1% |
| Czech | 95 | 1.6% |
| Dutch | 91 | 1.5% |
| Eastern European | 7 | 0.1% |
| English | 552 | 9.1% |
| European | 166 | 2.7% |
| French | 46 | 0.8% |
| French Canadian | 15 | 0.3% |
| German | 1,292 | 21.3% |
| Greek | 48 | 0.8% |
| Guatemalan | 11 | 0.2% |
| Hungarian | 202 | 3.3% |
| Indian (Asian) | 61 | 1.0% |
| Irish | 392 | 6.5% |
| Italian | 200 | 3.3% |
| Macedonian | 18 | 0.3% |
| Mexican | 6 | 0.1% |
| Northern European | 6 | 0.1% |
| Pennsylvania German | 42 | 0.7% |
| Polish | 248 | 4.1% |
| Puerto Rican | 105 | 1.7% |
| Russian | 13 | 0.2% |
| Scotch-Irish | 22 | 0.4% |
| Scottish | 232 | 3.8% |
| Serbian | 94 | 1.5% |
| Slovak | 71 | 1.2% |
| Slovene | 4 | 0.1% |
| Swedish | 4 | 0.1% |
| Swiss | 172 | 2.8% |
| Welsh | 164 | 2.7% | View All 37 Rows |
Immigrants in Rittman
The most numerous immigrant groups reported in Rittman came from Asia (61 | 1.0%), Malaysia (61 | 1.0%), South Eastern Asia (61 | 1.0%), Eastern Europe (36 | 0.6%), and Europe (36 | 0.6%), together accounting for 4.2% of all Rittman residents.
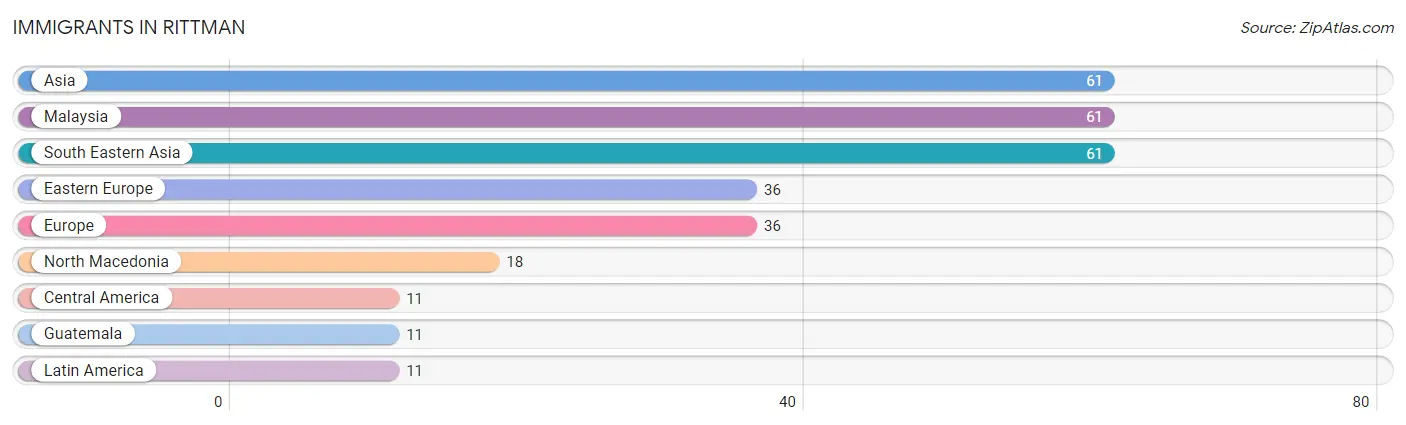
| Immigration Origin | # Population | % Population |
| Asia | 61 | 1.0% |
| Central America | 11 | 0.2% |
| Eastern Europe | 36 | 0.6% |
| Europe | 36 | 0.6% |
| Guatemala | 11 | 0.2% |
| Latin America | 11 | 0.2% |
| Malaysia | 61 | 1.0% |
| North Macedonia | 18 | 0.3% |
| South Eastern Asia | 61 | 1.0% | View All 9 Rows |
Sex and Age in Rittman
Sex and Age in Rittman
The most populous age groups in Rittman are 20 to 24 Years (321 | 9.9%) for men and 60 to 64 Years (277 | 9.9%) for women.
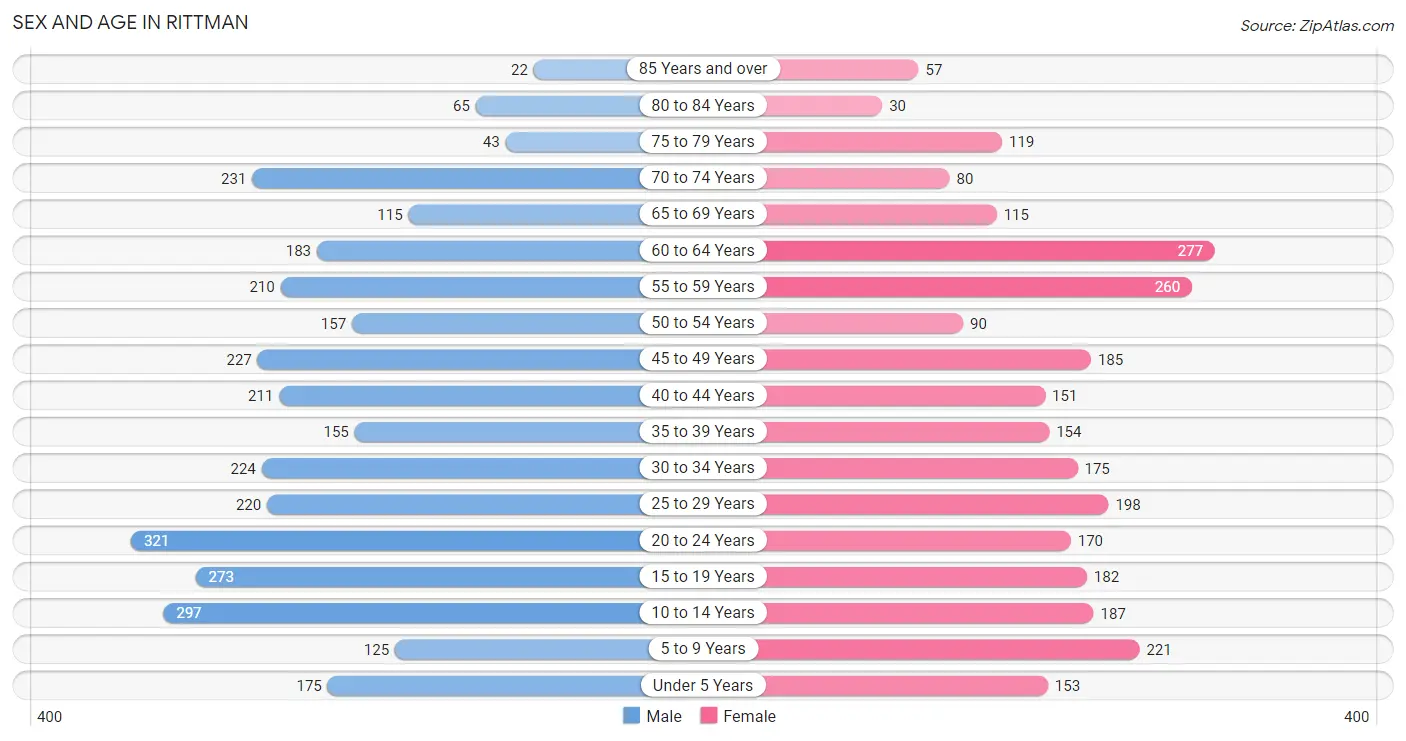
| Age Bracket | Male | Female |
| Under 5 Years | 175 (5.4%) | 153 (5.5%) |
| 5 to 9 Years | 125 (3.8%) | 221 (7.9%) |
| 10 to 14 Years | 297 (9.1%) | 187 (6.7%) |
| 15 to 19 Years | 273 (8.4%) | 182 (6.5%) |
| 20 to 24 Years | 321 (9.9%) | 170 (6.1%) |
| 25 to 29 Years | 220 (6.8%) | 198 (7.1%) |
| 30 to 34 Years | 224 (6.9%) | 175 (6.2%) |
| 35 to 39 Years | 155 (4.8%) | 154 (5.5%) |
| 40 to 44 Years | 211 (6.5%) | 151 (5.4%) |
| 45 to 49 Years | 227 (7.0%) | 185 (6.6%) |
| 50 to 54 Years | 157 (4.8%) | 90 (3.2%) |
| 55 to 59 Years | 210 (6.5%) | 260 (9.3%) |
| 60 to 64 Years | 183 (5.6%) | 277 (9.9%) |
| 65 to 69 Years | 115 (3.5%) | 115 (4.1%) |
| 70 to 74 Years | 231 (7.1%) | 80 (2.9%) |
| 75 to 79 Years | 43 (1.3%) | 119 (4.2%) |
| 80 to 84 Years | 65 (2.0%) | 30 (1.1%) |
| 85 Years and over | 22 (0.7%) | 57 (2.0%) |
| Total | 3,254 (100.0%) | 2,804 (100.0%) |
Families and Households in Rittman
Median Family Size in Rittman
The median family size in Rittman is 3.20 persons per family, with married-couple families (1,141 | 76.8%) accounting for the largest median family size of 3.26 persons per family. On the other hand, single male/father families (76 | 5.1%) represent the smallest median family size with 2.43 persons per family.
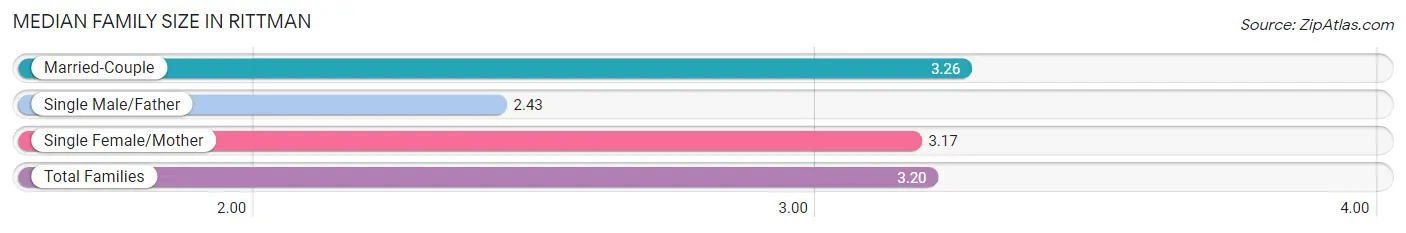
| Family Type | # Families | Family Size |
| Married-Couple | 1,141 (76.8%) | 3.26 |
| Single Male/Father | 76 (5.1%) | 2.43 |
| Single Female/Mother | 269 (18.1%) | 3.17 |
| Total Families | 1,486 (100.0%) | 3.20 |
Median Household Size in Rittman
The median household size in Rittman is 2.49 persons per household, with married-couple households (1,141 | 47.4%) accounting for the largest median household size of 3.29 persons per household. non-family households (921 | 38.3%) represent the smallest median household size with 1.25 persons per household.
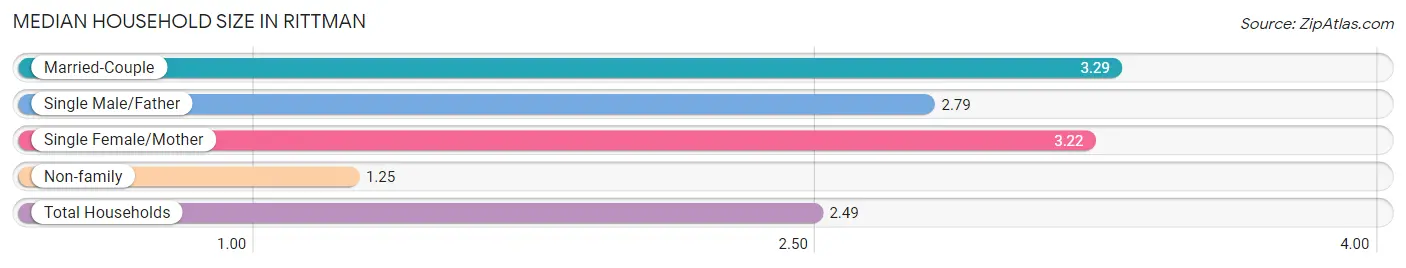
| Household Type | # Households | Household Size |
| Married-Couple | 1,141 (47.4%) | 3.29 |
| Single Male/Father | 76 (3.2%) | 2.79 |
| Single Female/Mother | 269 (11.2%) | 3.22 |
| Non-family | 921 (38.3%) | 1.25 |
| Total Households | 2,407 (100.0%) | 2.49 |
Household Size by Marriage Status in Rittman
Out of a total of 2,407 households in Rittman, 1,486 (61.7%) are family households, while 921 (38.3%) are nonfamily households. The most numerous type of family households are 2-person households, comprising 696, and the most common type of nonfamily households are 1-person households, comprising 724.
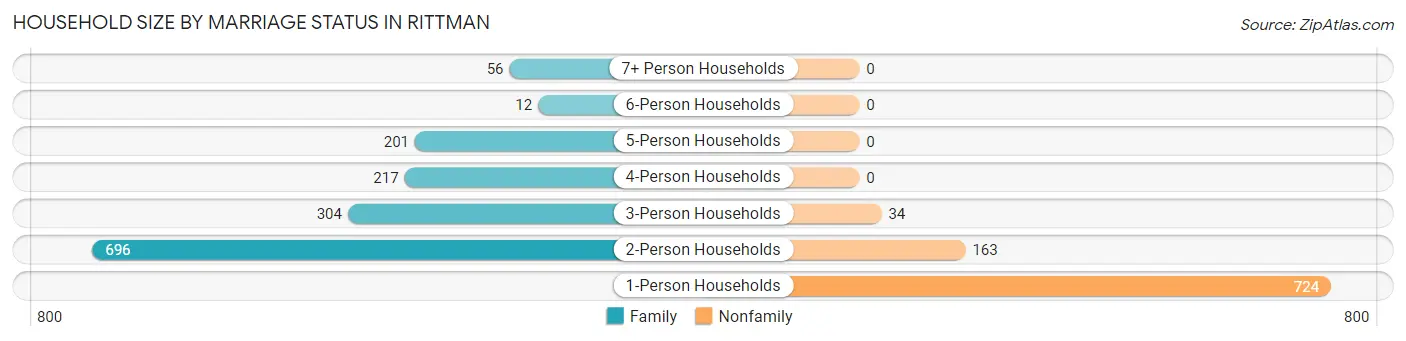
| Household Size | Family Households | Nonfamily Households |
| 1-Person Households | - | 724 (30.1%) |
| 2-Person Households | 696 (28.9%) | 163 (6.8%) |
| 3-Person Households | 304 (12.6%) | 34 (1.4%) |
| 4-Person Households | 217 (9.0%) | 0 (0.0%) |
| 5-Person Households | 201 (8.4%) | 0 (0.0%) |
| 6-Person Households | 12 (0.5%) | 0 (0.0%) |
| 7+ Person Households | 56 (2.3%) | 0 (0.0%) |
| Total | 1,486 (61.7%) | 921 (38.3%) |
Female Fertility in Rittman
Fertility by Age in Rittman
Average fertility rate in Rittman is 44.0 births per 1,000 women. Women in the age bracket of 20 to 34 years have the highest fertility rate with 68.0 births per 1,000 women. Women in the age bracket of 20 to 34 years acount for 67.3% of all women with births.
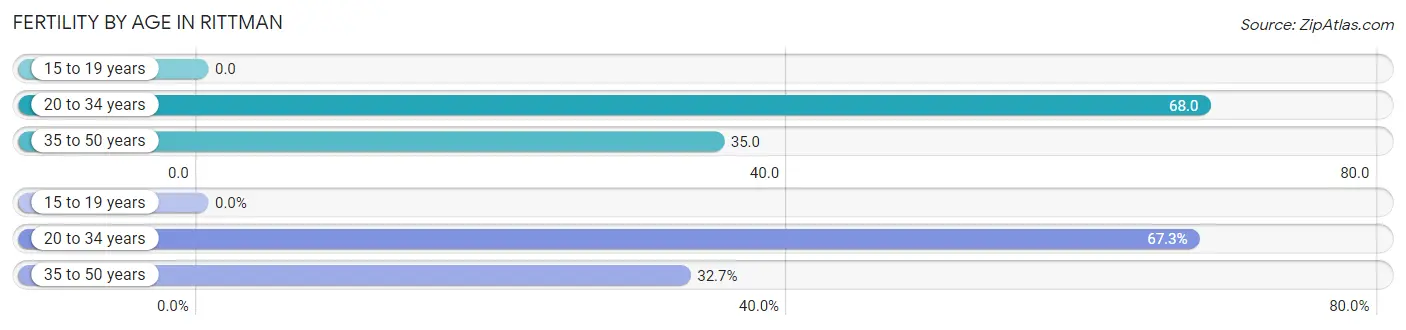
| Age Bracket | Women with Births | Births / 1,000 Women |
| 15 to 19 years | 0 (0.0%) | 0.0 |
| 20 to 34 years | 37 (67.3%) | 68.0 |
| 35 to 50 years | 18 (32.7%) | 35.0 |
| Total | 55 (100.0%) | 44.0 |
Fertility by Age by Marriage Status in Rittman
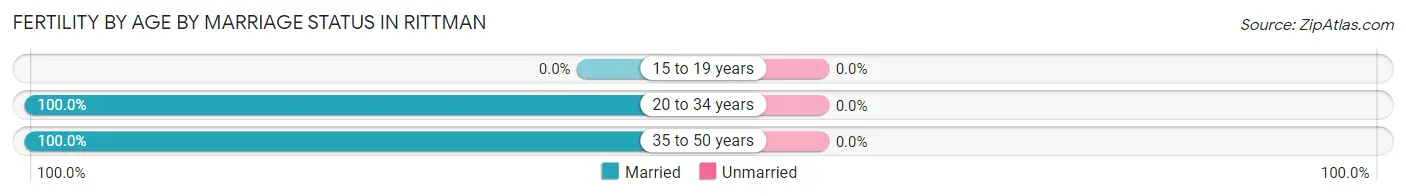
| Age Bracket | Married | Unmarried |
| 15 to 19 years | 0 (0.0%) | 0 (0.0%) |
| 20 to 34 years | 37 (100.0%) | 0 (0.0%) |
| 35 to 50 years | 18 (100.0%) | 0 (0.0%) |
| Total | 55 (100.0%) | 0 (0.0%) |
Fertility by Education in Rittman
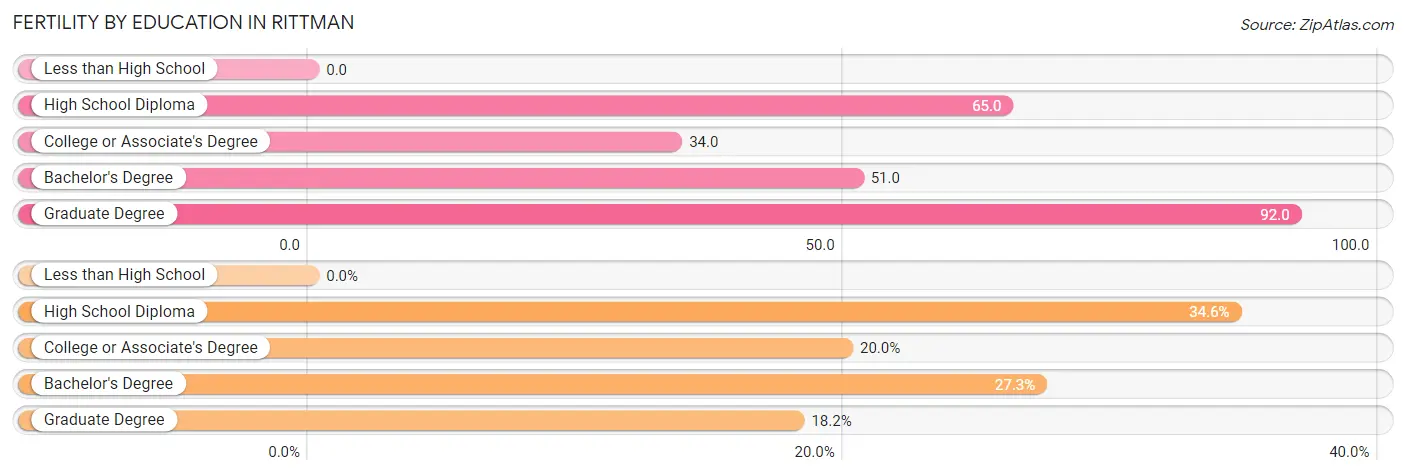
| Educational Attainment | Women with Births | Births / 1,000 Women |
| Less than High School | 0 (0.0%) | 0.0 |
| High School Diploma | 19 (34.5%) | 65.0 |
| College or Associate's Degree | 11 (20.0%) | 34.0 |
| Bachelor's Degree | 15 (27.3%) | 51.0 |
| Graduate Degree | 10 (18.2%) | 92.0 |
| Total | 55 (100.0%) | 44.0 |
Fertility by Education by Marriage Status in Rittman
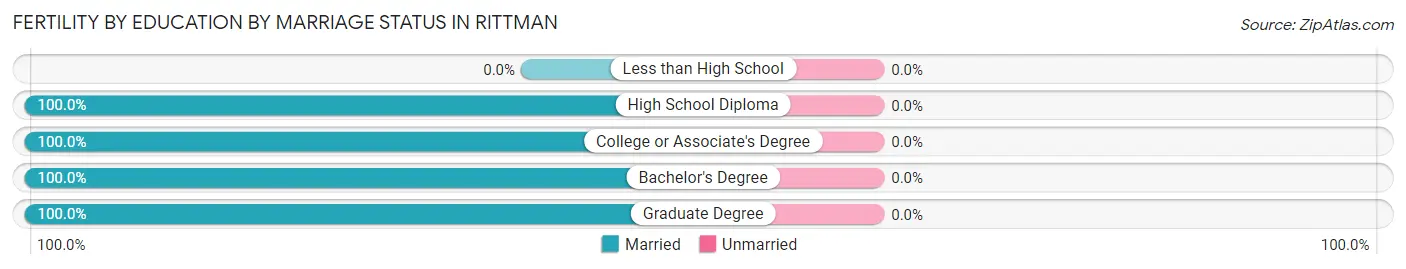
| Educational Attainment | Married | Unmarried |
| Less than High School | 0 (0.0%) | 0 (0.0%) |
| High School Diploma | 19 (100.0%) | 0 (0.0%) |
| College or Associate's Degree | 11 (100.0%) | 0 (0.0%) |
| Bachelor's Degree | 15 (100.0%) | 0 (0.0%) |
| Graduate Degree | 10 (100.0%) | 0 (0.0%) |
| Total | 55 (100.0%) | 0 (0.0%) |
Employment Characteristics in Rittman
Employment by Class of Employer in Rittman
Among the 2,852 employed individuals in Rittman, private company employees (2,239 | 78.5%), local government employees (324 | 11.4%), and not-for-profit organizations (116 | 4.1%) make up the most common classes of employment.
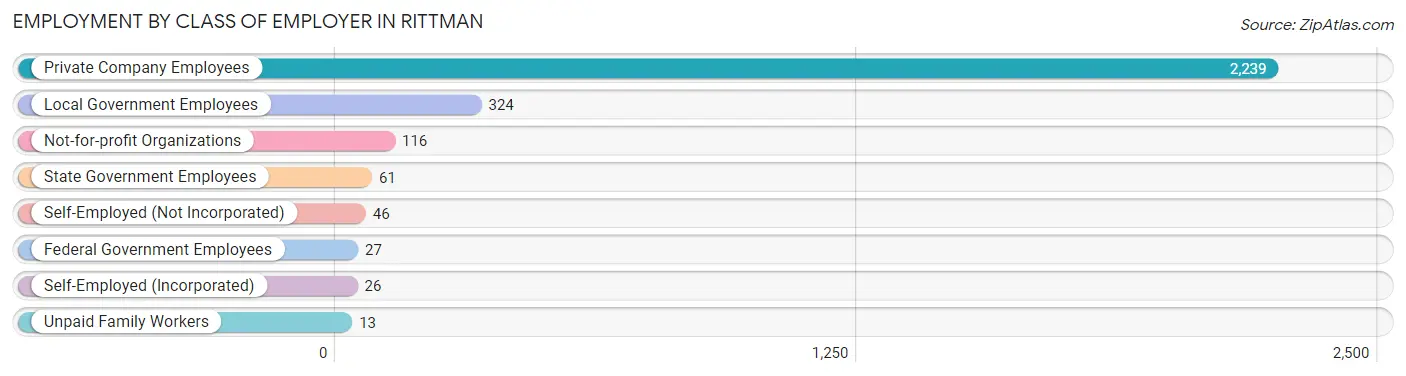
| Employer Class | # Employees | % Employees |
| Private Company Employees | 2,239 | 78.5% |
| Self-Employed (Incorporated) | 26 | 0.9% |
| Self-Employed (Not Incorporated) | 46 | 1.6% |
| Not-for-profit Organizations | 116 | 4.1% |
| Local Government Employees | 324 | 11.4% |
| State Government Employees | 61 | 2.1% |
| Federal Government Employees | 27 | 0.9% |
| Unpaid Family Workers | 13 | 0.5% |
| Total | 2,852 | 100.0% |
Employment Status by Age in Rittman
According to the labor force statistics for Rittman, out of the total population over 16 years of age (4,781), 65.9% or 3,151 individuals are in the labor force, with 7.3% or 230 of them unemployed. The age group with the highest labor force participation rate is 20 to 24 years, with 96.3% or 473 individuals in the labor force. Within the labor force, the 20 to 24 years age range has the highest percentage of unemployed individuals, with 24.3% or 115 of them being unemployed.
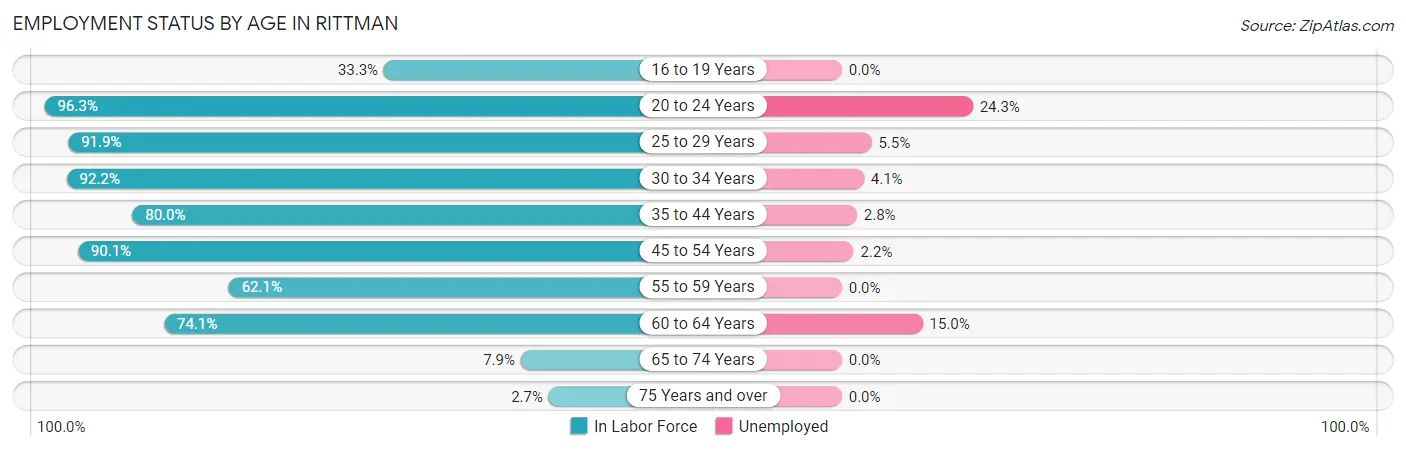
| Age Bracket | In Labor Force | Unemployed |
| 16 to 19 Years | 112 (33.3%) | 0 (0.0%) |
| 20 to 24 Years | 473 (96.3%) | 115 (24.3%) |
| 25 to 29 Years | 384 (91.9%) | 21 (5.5%) |
| 30 to 34 Years | 368 (92.2%) | 15 (4.1%) |
| 35 to 44 Years | 537 (80.0%) | 15 (2.8%) |
| 45 to 54 Years | 594 (90.1%) | 13 (2.2%) |
| 55 to 59 Years | 292 (62.1%) | 0 (0.0%) |
| 60 to 64 Years | 341 (74.1%) | 51 (15.0%) |
| 65 to 74 Years | 43 (7.9%) | 0 (0.0%) |
| 75 Years and over | 9 (2.7%) | 0 (0.0%) |
| Total | 3,151 (65.9%) | 230 (7.3%) |
Employment Status by Educational Attainment in Rittman
According to labor force statistics for Rittman, 81.8% of individuals (2,517) out of the total population between 25 and 64 years of age (3,077) are in the labor force, with 4.6% or 116 of them being unemployed. The group with the highest labor force participation rate are those with the educational attainment of bachelor's degree or higher, with 92.0% or 747 individuals in the labor force. Within the labor force, individuals with high school diploma education have the highest percentage of unemployment, with 9.9% or 94 of them being unemployed.
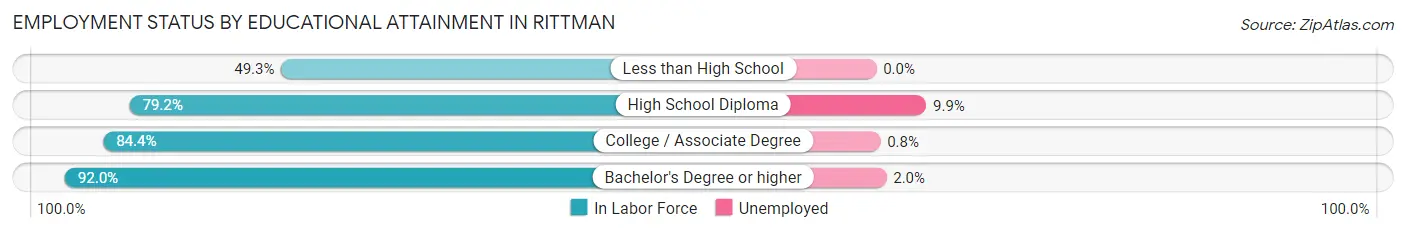
| Educational Attainment | In Labor Force | Unemployed |
| Less than High School | 113 (49.3%) | 0 (0.0%) |
| High School Diploma | 947 (79.2%) | 118 (9.9%) |
| College / Associate Degree | 709 (84.4%) | 7 (0.8%) |
| Bachelor's Degree or higher | 747 (92.0%) | 16 (2.0%) |
| Total | 2,517 (81.8%) | 142 (4.6%) |
Employment Occupations by Sex in Rittman
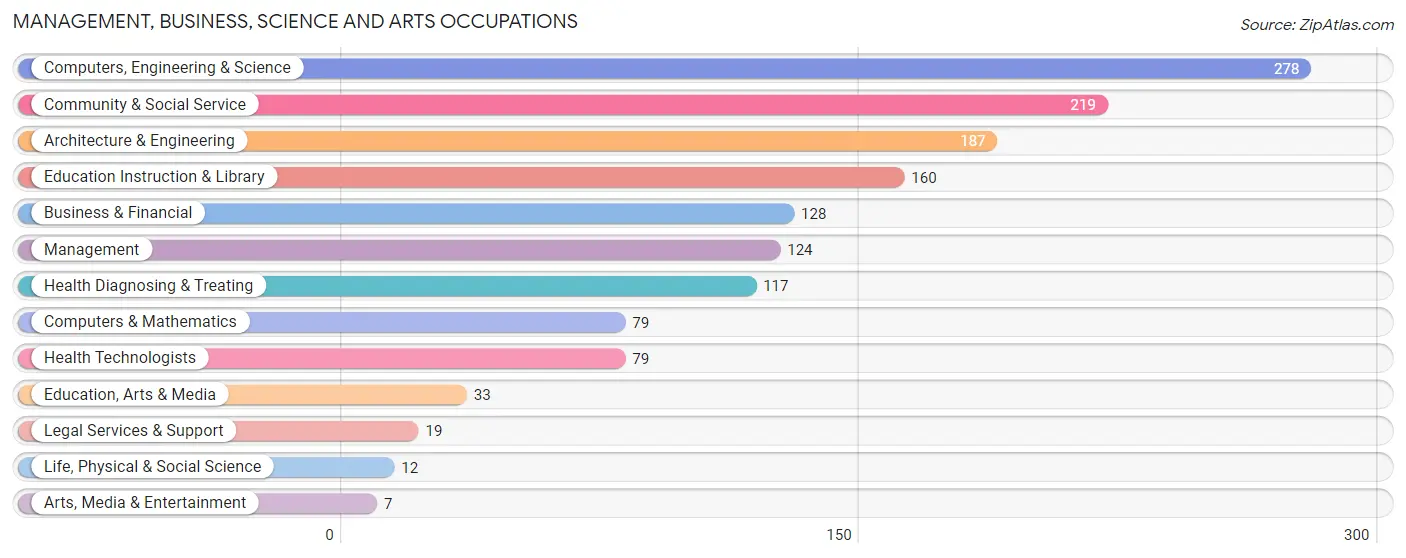
Management, Business, Science and Arts Occupations
The most common Management, Business, Science and Arts occupations in Rittman are Computers, Engineering & Science (278 | 9.5%), Community & Social Service (219 | 7.5%), Architecture & Engineering (187 | 6.4%), Education Instruction & Library (160 | 5.5%), and Business & Financial (128 | 4.4%).
Management, Business, Science and Arts Occupations by Sex
Within the Management, Business, Science and Arts occupations in Rittman, the most male-oriented occupations are Life, Physical & Social Science (100.0%), Legal Services & Support (100.0%), and Arts, Media & Entertainment (100.0%), while the most female-oriented occupations are Business & Financial (71.1%), Health Technologists (69.6%), and Health Diagnosing & Treating (69.2%).
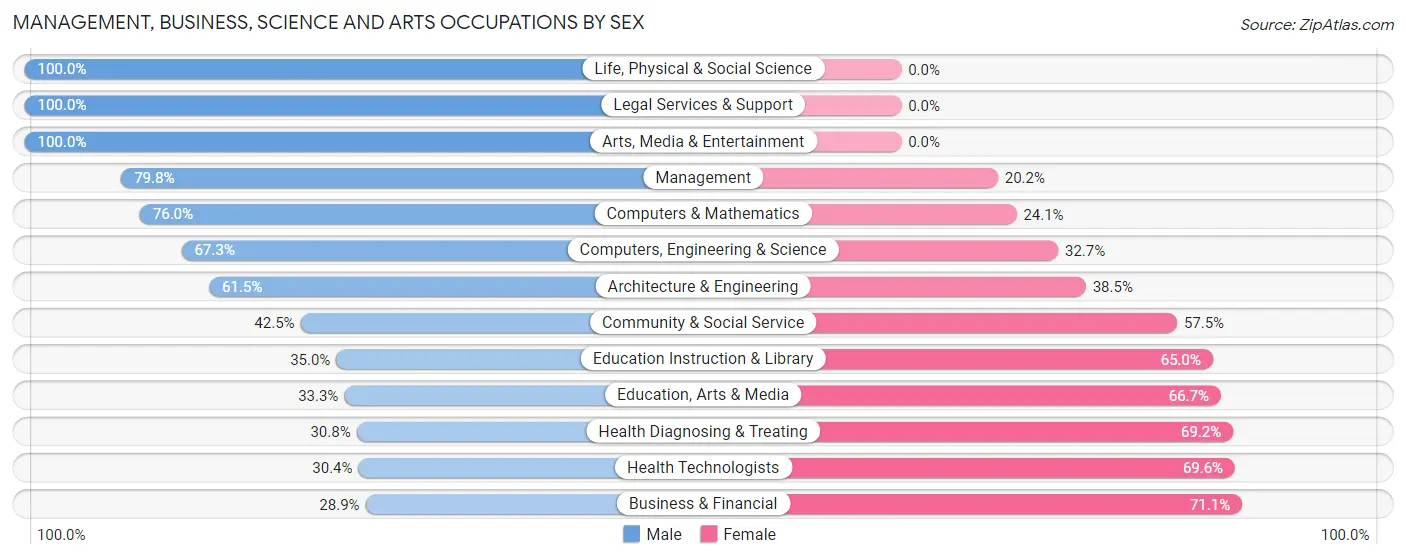
| Occupation | Male | Female |
| Management | 99 (79.8%) | 25 (20.2%) |
| Business & Financial | 37 (28.9%) | 91 (71.1%) |
| Computers, Engineering & Science | 187 (67.3%) | 91 (32.7%) |
| Computers & Mathematics | 60 (75.9%) | 19 (24.0%) |
| Architecture & Engineering | 115 (61.5%) | 72 (38.5%) |
| Life, Physical & Social Science | 12 (100.0%) | 0 (0.0%) |
| Community & Social Service | 93 (42.5%) | 126 (57.5%) |
| Education, Arts & Media | 11 (33.3%) | 22 (66.7%) |
| Legal Services & Support | 19 (100.0%) | 0 (0.0%) |
| Education Instruction & Library | 56 (35.0%) | 104 (65.0%) |
| Arts, Media & Entertainment | 7 (100.0%) | 0 (0.0%) |
| Health Diagnosing & Treating | 36 (30.8%) | 81 (69.2%) |
| Health Technologists | 24 (30.4%) | 55 (69.6%) |
| Total (Category) | 452 (52.2%) | 414 (47.8%) |
| Total (Overall) | 1,690 (57.8%) | 1,233 (42.2%) |
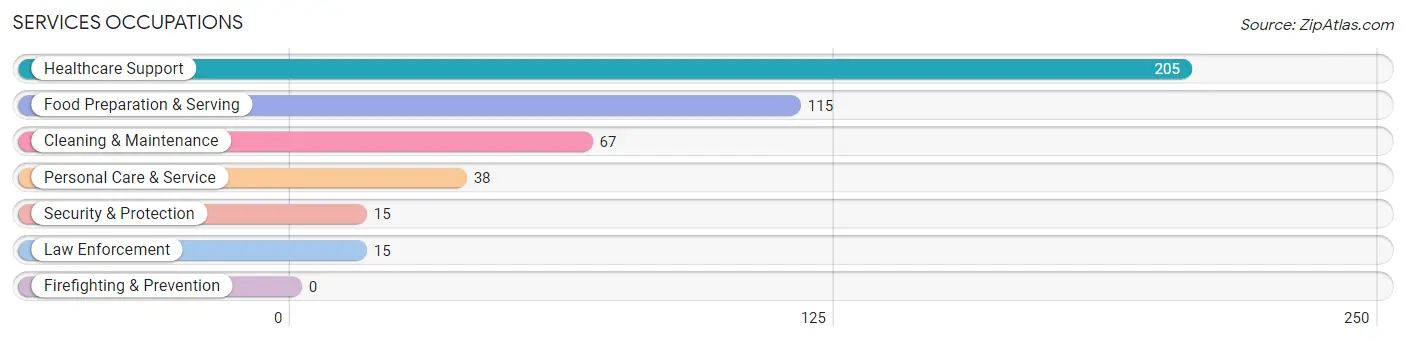
Services Occupations
The most common Services occupations in Rittman are Healthcare Support (205 | 7.0%), Food Preparation & Serving (115 | 3.9%), Cleaning & Maintenance (67 | 2.3%), Personal Care & Service (38 | 1.3%), and Security & Protection (15 | 0.5%).
Services Occupations by Sex
Within the Services occupations in Rittman, the most male-oriented occupations are Security & Protection (100.0%), Law Enforcement (100.0%), and Cleaning & Maintenance (76.1%), while the most female-oriented occupations are Personal Care & Service (100.0%), Healthcare Support (93.7%), and Food Preparation & Serving (58.3%).
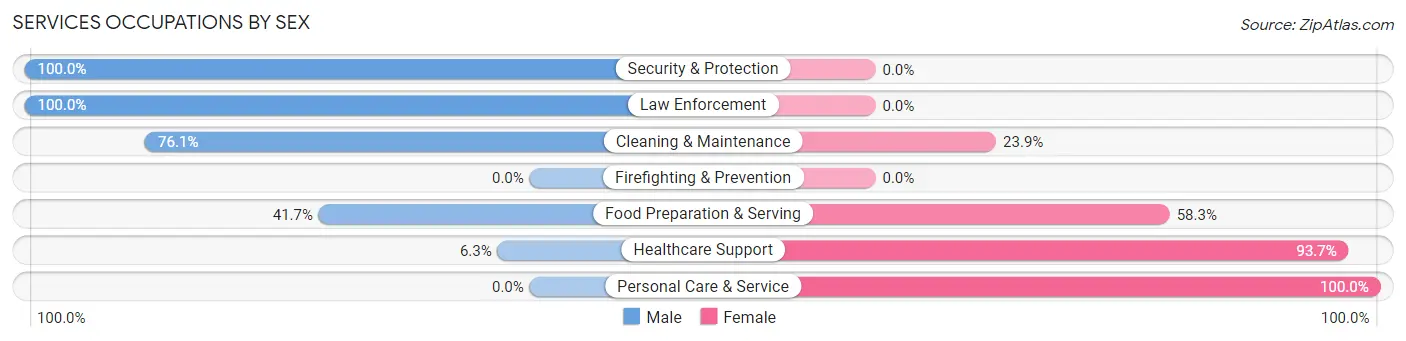
| Occupation | Male | Female |
| Healthcare Support | 13 (6.3%) | 192 (93.7%) |
| Security & Protection | 15 (100.0%) | 0 (0.0%) |
| Firefighting & Prevention | 0 (0.0%) | 0 (0.0%) |
| Law Enforcement | 15 (100.0%) | 0 (0.0%) |
| Food Preparation & Serving | 48 (41.7%) | 67 (58.3%) |
| Cleaning & Maintenance | 51 (76.1%) | 16 (23.9%) |
| Personal Care & Service | 0 (0.0%) | 38 (100.0%) |
| Total (Category) | 127 (28.9%) | 313 (71.1%) |
| Total (Overall) | 1,690 (57.8%) | 1,233 (42.2%) |
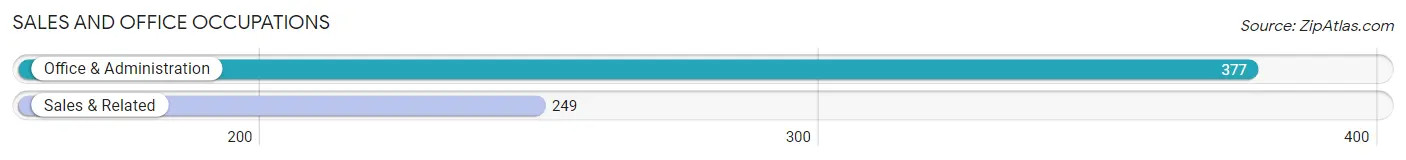
Sales and Office Occupations
The most common Sales and Office occupations in Rittman are Office & Administration (377 | 12.9%), and Sales & Related (249 | 8.5%).
Sales and Office Occupations by Sex
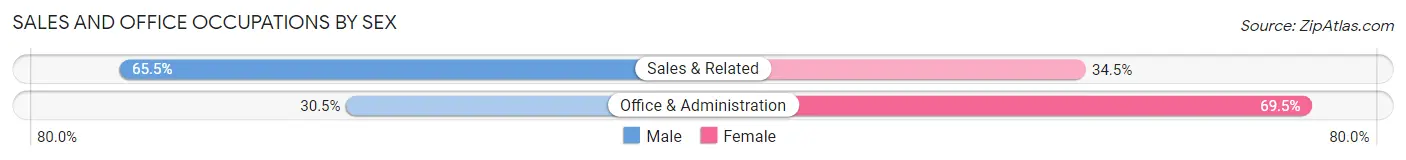
| Occupation | Male | Female |
| Sales & Related | 163 (65.5%) | 86 (34.5%) |
| Office & Administration | 115 (30.5%) | 262 (69.5%) |
| Total (Category) | 278 (44.4%) | 348 (55.6%) |
| Total (Overall) | 1,690 (57.8%) | 1,233 (42.2%) |
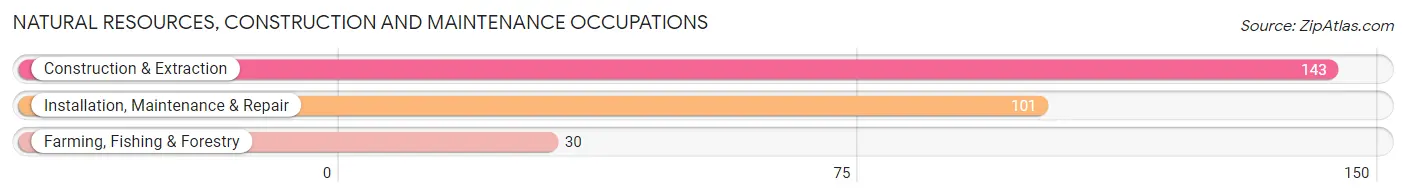
Natural Resources, Construction and Maintenance Occupations
The most common Natural Resources, Construction and Maintenance occupations in Rittman are Construction & Extraction (143 | 4.9%), Installation, Maintenance & Repair (101 | 3.5%), and Farming, Fishing & Forestry (30 | 1.0%).
Natural Resources, Construction and Maintenance Occupations by Sex
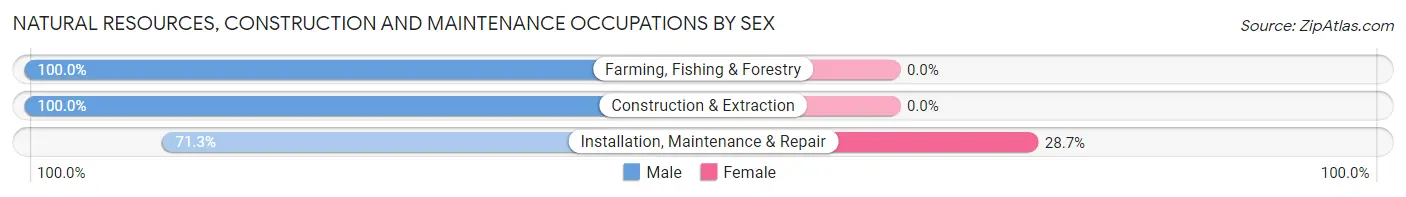
| Occupation | Male | Female |
| Farming, Fishing & Forestry | 30 (100.0%) | 0 (0.0%) |
| Construction & Extraction | 143 (100.0%) | 0 (0.0%) |
| Installation, Maintenance & Repair | 72 (71.3%) | 29 (28.7%) |
| Total (Category) | 245 (89.4%) | 29 (10.6%) |
| Total (Overall) | 1,690 (57.8%) | 1,233 (42.2%) |
Production, Transportation and Moving Occupations
The most common Production, Transportation and Moving occupations in Rittman are Production (465 | 15.9%), Material Moving (208 | 7.1%), and Transportation (44 | 1.5%).
Production, Transportation and Moving Occupations by Sex
| Occupation | Male | Female |
| Production | 406 (87.3%) | 59 (12.7%) |
| Transportation | 24 (54.5%) | 20 (45.5%) |
| Material Moving | 158 (76.0%) | 50 (24.0%) |
| Total (Category) | 588 (82.0%) | 129 (18.0%) |
| Total (Overall) | 1,690 (57.8%) | 1,233 (42.2%) |
Employment Industries by Sex in Rittman
Employment Industries in Rittman
The major employment industries in Rittman include Manufacturing (744 | 25.5%), Health Care & Social Assistance (304 | 10.4%), Retail Trade (296 | 10.1%), Construction (283 | 9.7%), and Finance & Insurance (207 | 7.1%).
Employment Industries by Sex in Rittman
The Rittman industries that see more men than women are Utilities (100.0%), Information (100.0%), and Real Estate, Rental & Leasing (86.0%), whereas the industries that tend to have a higher number of women are Transportation & Warehousing (100.0%), Arts, Entertainment & Recreation (100.0%), and Health Care & Social Assistance (70.4%).
| Industry | Male | Female |
| Agriculture, Fishing & Hunting | 0 (0.0%) | 0 (0.0%) |
| Mining, Quarrying, & Extraction | 0 (0.0%) | 0 (0.0%) |
| Construction | 209 (73.9%) | 74 (26.2%) |
| Manufacturing | 570 (76.6%) | 174 (23.4%) |
| Wholesale Trade | 50 (56.2%) | 39 (43.8%) |
| Retail Trade | 187 (63.2%) | 109 (36.8%) |
| Transportation & Warehousing | 0 (0.0%) | 39 (100.0%) |
| Utilities | 7 (100.0%) | 0 (0.0%) |
| Information | 39 (100.0%) | 0 (0.0%) |
| Finance & Insurance | 116 (56.0%) | 91 (44.0%) |
| Real Estate, Rental & Leasing | 43 (86.0%) | 7 (14.0%) |
| Professional & Scientific | 88 (53.7%) | 76 (46.3%) |
| Enterprise Management | 0 (0.0%) | 0 (0.0%) |
| Administrative & Support | 88 (80.7%) | 21 (19.3%) |
| Educational Services | 81 (40.5%) | 119 (59.5%) |
| Health Care & Social Assistance | 90 (29.6%) | 214 (70.4%) |
| Arts, Entertainment & Recreation | 0 (0.0%) | 31 (100.0%) |
| Accommodation & Food Services | 56 (39.2%) | 87 (60.8%) |
| Public Administration | 34 (45.3%) | 41 (54.7%) |
| Total | 1,690 (57.8%) | 1,233 (42.2%) |
Education in Rittman
School Enrollment in Rittman
The most common levels of schooling among the 1,401 students in Rittman are high school (405 | 28.9%), elementary school (344 | 24.5%), and middle school (305 | 21.8%).
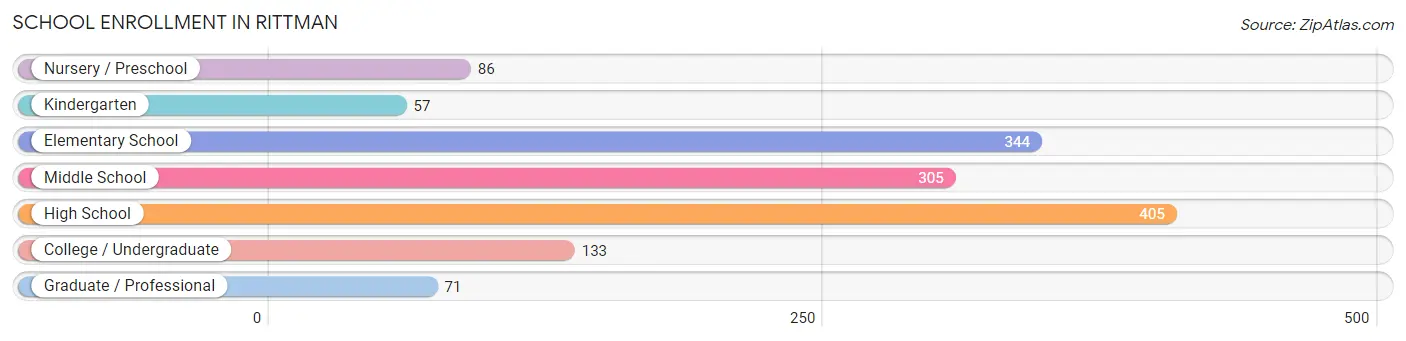
| School Level | # Students | % Students |
| Nursery / Preschool | 86 | 6.1% |
| Kindergarten | 57 | 4.1% |
| Elementary School | 344 | 24.5% |
| Middle School | 305 | 21.8% |
| High School | 405 | 28.9% |
| College / Undergraduate | 133 | 9.5% |
| Graduate / Professional | 71 | 5.1% |
| Total | 1,401 | 100.0% |
School Enrollment by Age by Funding Source in Rittman
Out of a total of 1,401 students who are enrolled in schools in Rittman, 294 (21.0%) attend a private institution, while the remaining 1,107 (79.0%) are enrolled in public schools. The age group of 3 to 4 year olds has the highest likelihood of being enrolled in private schools, with 25 (53.2% in the age bracket) enrolled. Conversely, the age group of 15 to 17 year olds has the lowest likelihood of being enrolled in a private school, with 280 (100.0% in the age bracket) attending a public institution.
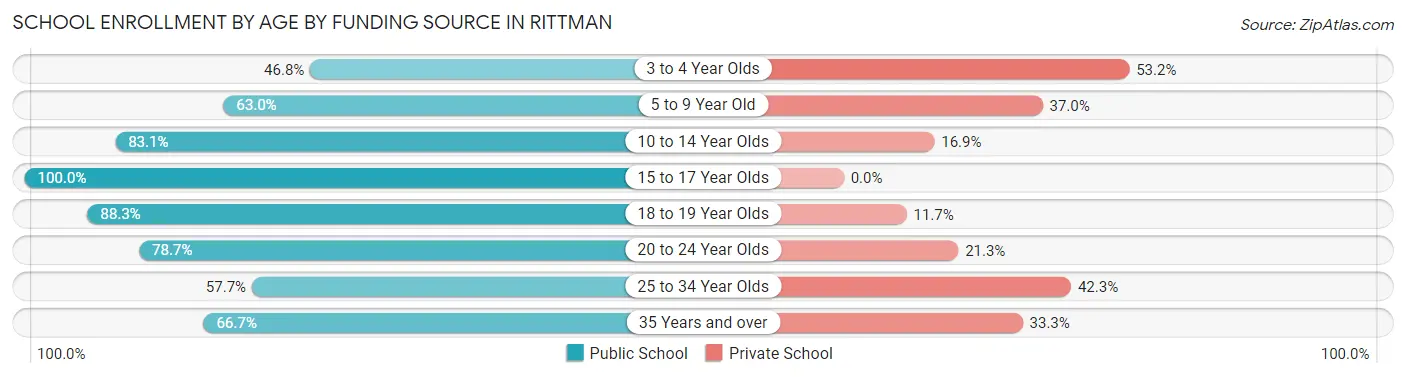
| Age Bracket | Public School | Private School |
| 3 to 4 Year Olds | 22 (46.8%) | 25 (53.2%) |
| 5 to 9 Year Old | 187 (63.0%) | 110 (37.0%) |
| 10 to 14 Year Olds | 389 (83.1%) | 79 (16.9%) |
| 15 to 17 Year Olds | 280 (100.0%) | 0 (0.0%) |
| 18 to 19 Year Olds | 98 (88.3%) | 13 (11.7%) |
| 20 to 24 Year Olds | 59 (78.7%) | 16 (21.3%) |
| 25 to 34 Year Olds | 64 (57.7%) | 47 (42.3%) |
| 35 Years and over | 8 (66.7%) | 4 (33.3%) |
| Total | 1,107 (79.0%) | 294 (21.0%) |
Educational Attainment by Field of Study in Rittman
Business (209 | 23.7%), engineering (195 | 22.1%), education (131 | 14.8%), bio, nature & agricultural (123 | 13.9%), and arts & humanities (83 | 9.4%) are the most common fields of study among 883 individuals in Rittman who have obtained a bachelor's degree or higher.
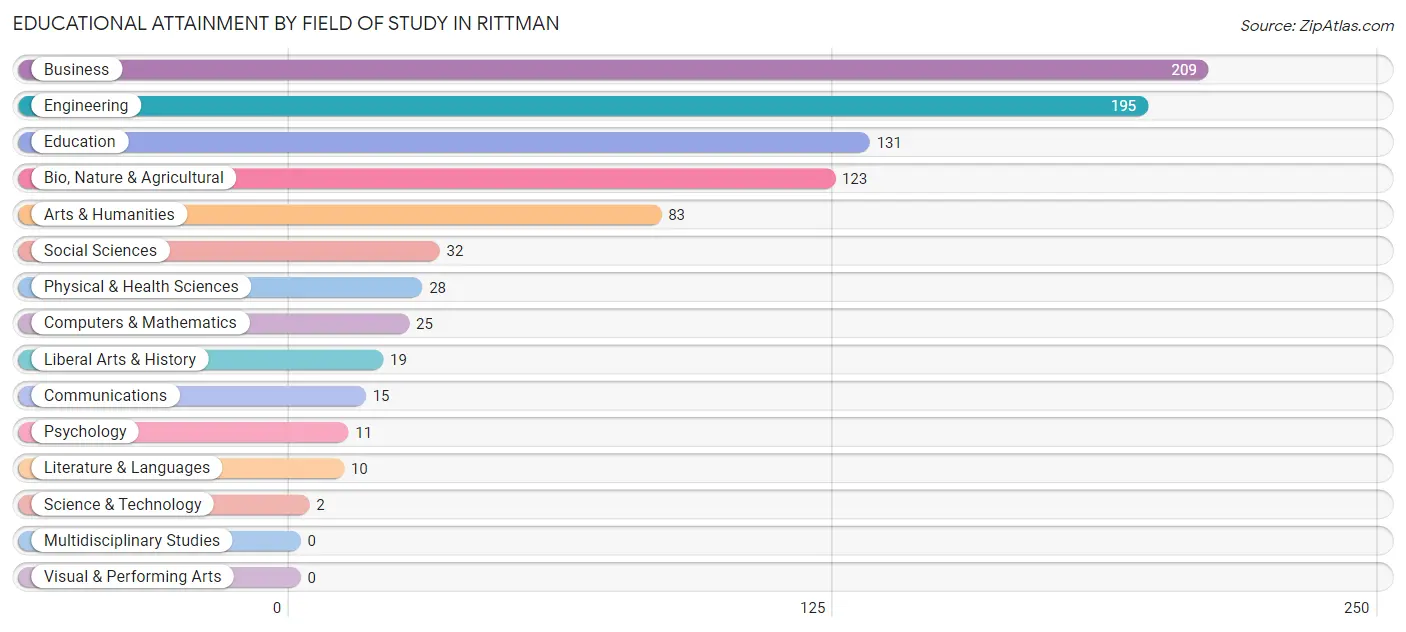
| Field of Study | # Graduates | % Graduates |
| Computers & Mathematics | 25 | 2.8% |
| Bio, Nature & Agricultural | 123 | 13.9% |
| Physical & Health Sciences | 28 | 3.2% |
| Psychology | 11 | 1.3% |
| Social Sciences | 32 | 3.6% |
| Engineering | 195 | 22.1% |
| Multidisciplinary Studies | 0 | 0.0% |
| Science & Technology | 2 | 0.2% |
| Business | 209 | 23.7% |
| Education | 131 | 14.8% |
| Literature & Languages | 10 | 1.1% |
| Liberal Arts & History | 19 | 2.1% |
| Visual & Performing Arts | 0 | 0.0% |
| Communications | 15 | 1.7% |
| Arts & Humanities | 83 | 9.4% |
| Total | 883 | 100.0% |
Transportation & Commute in Rittman
Vehicle Availability by Sex in Rittman
The most prevalent vehicle ownership categories in Rittman are males with 2 vehicles (610, accounting for 36.6%) and females with 2 vehicles (547, making up 51.5%).
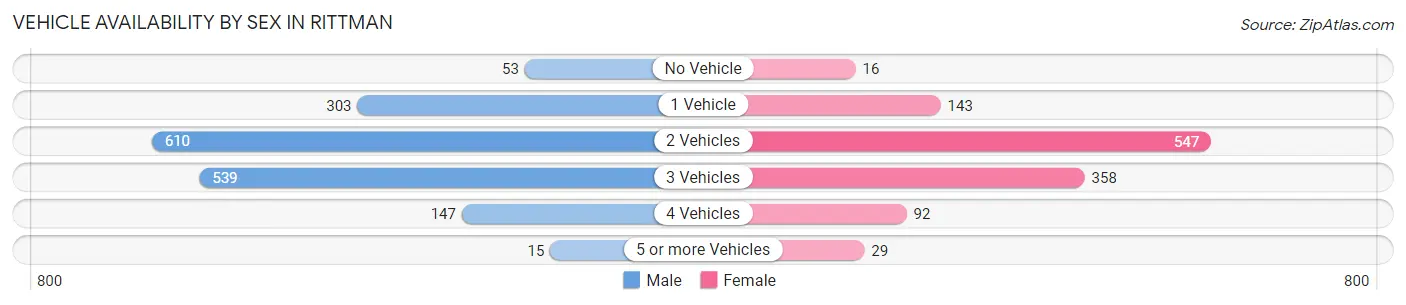
| Vehicles Available | Male | Female |
| No Vehicle | 53 (3.2%) | 16 (1.3%) |
| 1 Vehicle | 303 (18.2%) | 143 (12.1%) |
| 2 Vehicles | 610 (36.6%) | 547 (46.2%) |
| 3 Vehicles | 539 (32.3%) | 358 (30.2%) |
| 4 Vehicles | 147 (8.8%) | 92 (7.8%) |
| 5 or more Vehicles | 15 (0.9%) | 29 (2.5%) |
| Total | 1,667 (100.0%) | 1,185 (100.0%) |
Commute Time in Rittman
The most frequently occuring commute durations in Rittman are 30 to 34 minutes (453 commuters, 16.9%), 5 to 9 minutes (391 commuters, 14.6%), and 15 to 19 minutes (323 commuters, 12.0%).
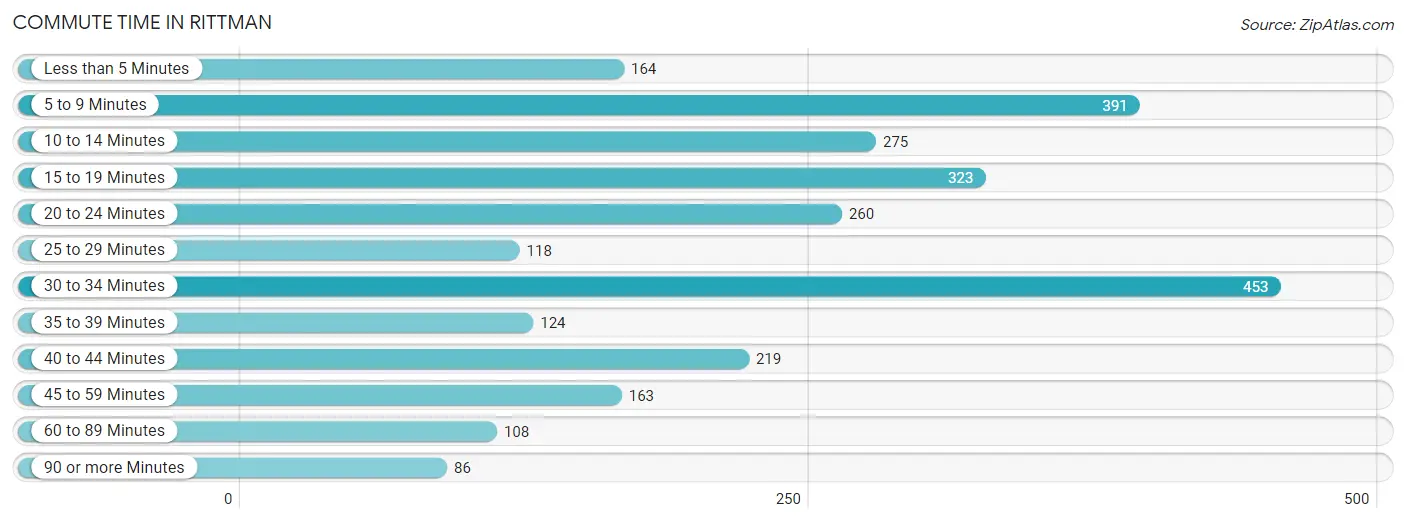
| Commute Time | # Commuters | % Commuters |
| Less than 5 Minutes | 164 | 6.1% |
| 5 to 9 Minutes | 391 | 14.6% |
| 10 to 14 Minutes | 275 | 10.2% |
| 15 to 19 Minutes | 323 | 12.0% |
| 20 to 24 Minutes | 260 | 9.7% |
| 25 to 29 Minutes | 118 | 4.4% |
| 30 to 34 Minutes | 453 | 16.9% |
| 35 to 39 Minutes | 124 | 4.6% |
| 40 to 44 Minutes | 219 | 8.2% |
| 45 to 59 Minutes | 163 | 6.1% |
| 60 to 89 Minutes | 108 | 4.0% |
| 90 or more Minutes | 86 | 3.2% |
Commute Time by Sex in Rittman
The most common commute times in Rittman are 30 to 34 minutes (341 commuters, 21.7%) for males and 5 to 9 minutes (182 commuters, 16.3%) for females.
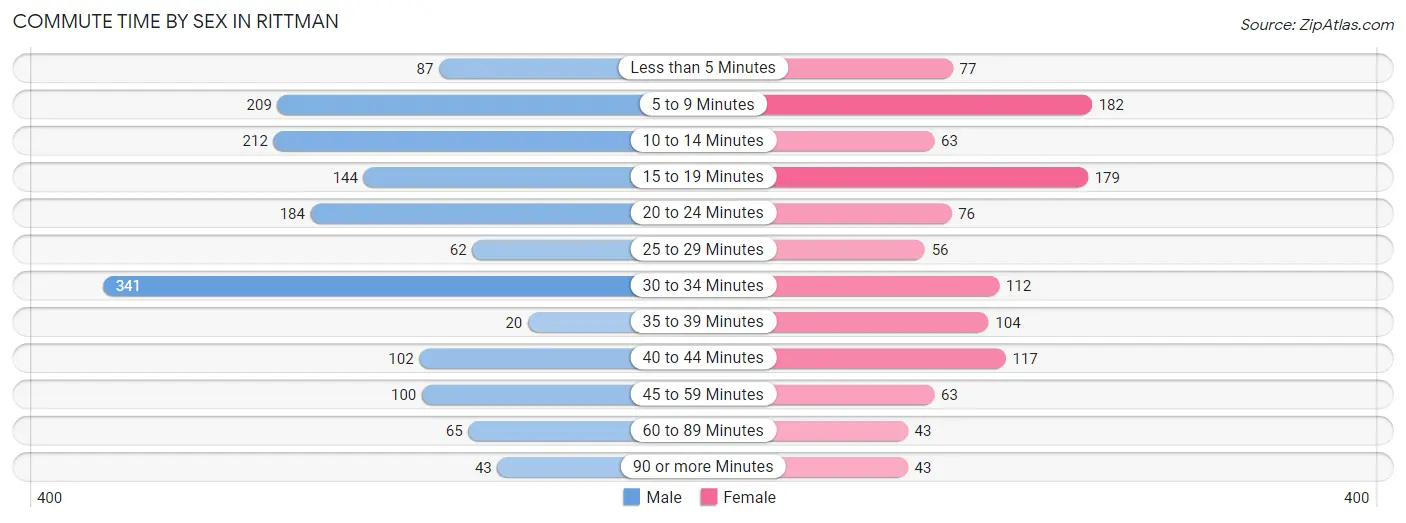
| Commute Time | Male | Female |
| Less than 5 Minutes | 87 (5.5%) | 77 (6.9%) |
| 5 to 9 Minutes | 209 (13.3%) | 182 (16.3%) |
| 10 to 14 Minutes | 212 (13.5%) | 63 (5.7%) |
| 15 to 19 Minutes | 144 (9.2%) | 179 (16.1%) |
| 20 to 24 Minutes | 184 (11.7%) | 76 (6.8%) |
| 25 to 29 Minutes | 62 (4.0%) | 56 (5.0%) |
| 30 to 34 Minutes | 341 (21.7%) | 112 (10.0%) |
| 35 to 39 Minutes | 20 (1.3%) | 104 (9.3%) |
| 40 to 44 Minutes | 102 (6.5%) | 117 (10.5%) |
| 45 to 59 Minutes | 100 (6.4%) | 63 (5.7%) |
| 60 to 89 Minutes | 65 (4.1%) | 43 (3.9%) |
| 90 or more Minutes | 43 (2.7%) | 43 (3.9%) |
Time of Departure to Work by Sex in Rittman
The most frequent times of departure to work in Rittman are 7:30 AM to 7:59 AM (311, 19.8%) for males and 7:30 AM to 7:59 AM (213, 19.1%) for females.
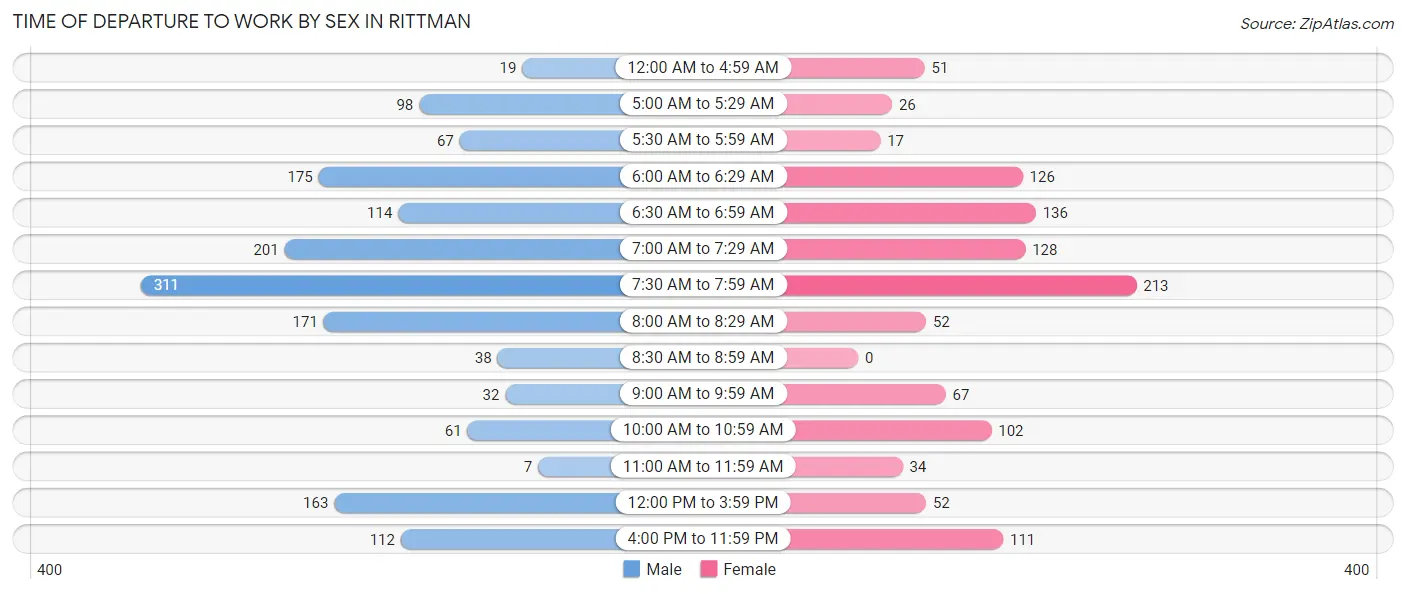
| Time of Departure | Male | Female |
| 12:00 AM to 4:59 AM | 19 (1.2%) | 51 (4.6%) |
| 5:00 AM to 5:29 AM | 98 (6.2%) | 26 (2.3%) |
| 5:30 AM to 5:59 AM | 67 (4.3%) | 17 (1.5%) |
| 6:00 AM to 6:29 AM | 175 (11.2%) | 126 (11.3%) |
| 6:30 AM to 6:59 AM | 114 (7.3%) | 136 (12.2%) |
| 7:00 AM to 7:29 AM | 201 (12.8%) | 128 (11.5%) |
| 7:30 AM to 7:59 AM | 311 (19.8%) | 213 (19.1%) |
| 8:00 AM to 8:29 AM | 171 (10.9%) | 52 (4.7%) |
| 8:30 AM to 8:59 AM | 38 (2.4%) | 0 (0.0%) |
| 9:00 AM to 9:59 AM | 32 (2.0%) | 67 (6.0%) |
| 10:00 AM to 10:59 AM | 61 (3.9%) | 102 (9.1%) |
| 11:00 AM to 11:59 AM | 7 (0.4%) | 34 (3.0%) |
| 12:00 PM to 3:59 PM | 163 (10.4%) | 52 (4.7%) |
| 4:00 PM to 11:59 PM | 112 (7.1%) | 111 (10.0%) |
| Total | 1,569 (100.0%) | 1,115 (100.0%) |
Housing Occupancy in Rittman
Occupancy by Ownership in Rittman
Of the total 2,407 dwellings in Rittman, owner-occupied units account for 1,724 (71.6%), while renter-occupied units make up 683 (28.4%).
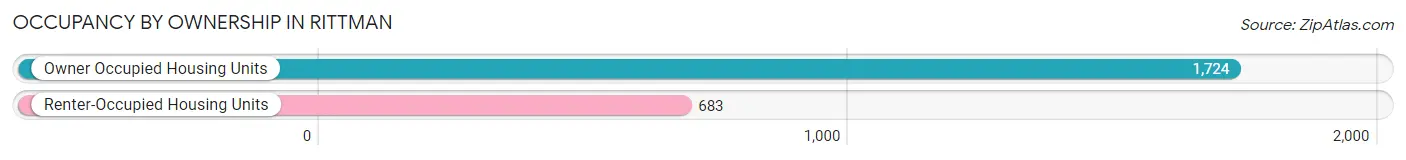
| Occupancy | # Housing Units | % Housing Units |
| Owner Occupied Housing Units | 1,724 | 71.6% |
| Renter-Occupied Housing Units | 683 | 28.4% |
| Total Occupied Housing Units | 2,407 | 100.0% |
Occupancy by Household Size in Rittman
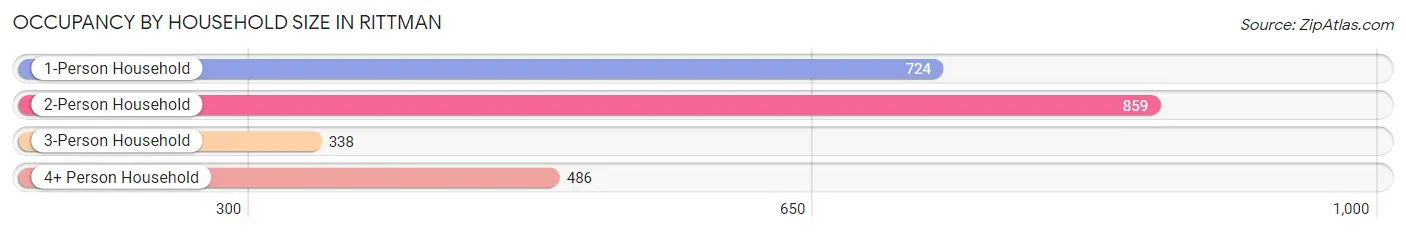
| Household Size | # Housing Units | % Housing Units |
| 1-Person Household | 724 | 30.1% |
| 2-Person Household | 859 | 35.7% |
| 3-Person Household | 338 | 14.0% |
| 4+ Person Household | 486 | 20.2% |
| Total Housing Units | 2,407 | 100.0% |
Occupancy by Ownership by Household Size in Rittman
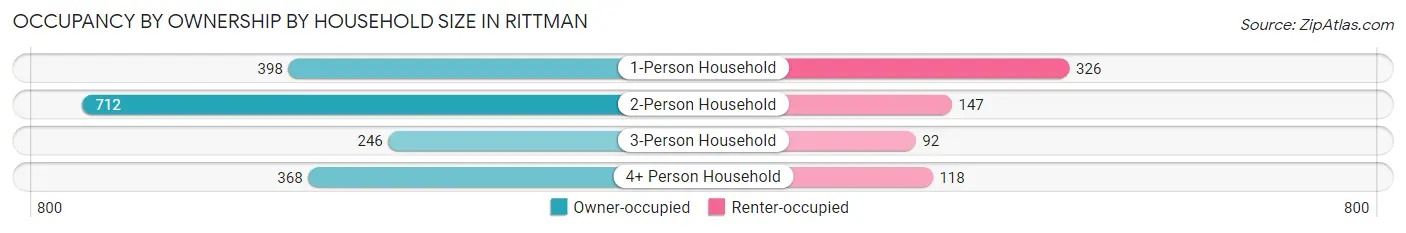
| Household Size | Owner-occupied | Renter-occupied |
| 1-Person Household | 398 (55.0%) | 326 (45.0%) |
| 2-Person Household | 712 (82.9%) | 147 (17.1%) |
| 3-Person Household | 246 (72.8%) | 92 (27.2%) |
| 4+ Person Household | 368 (75.7%) | 118 (24.3%) |
| Total Housing Units | 1,724 (71.6%) | 683 (28.4%) |
Occupancy by Educational Attainment in Rittman
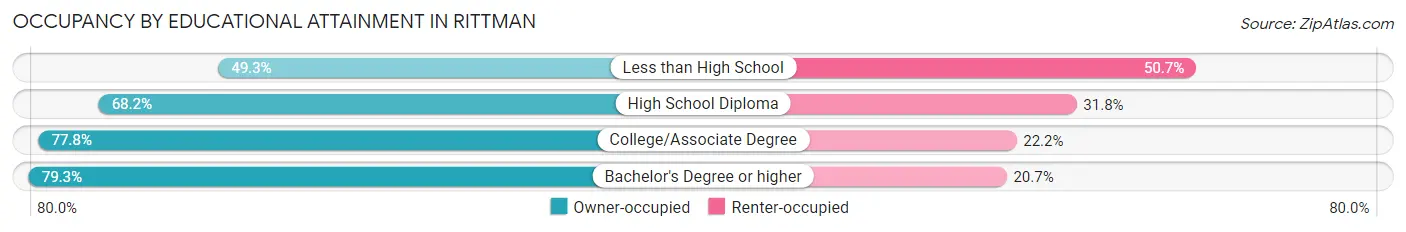
| Household Size | Owner-occupied | Renter-occupied |
| Less than High School | 101 (49.3%) | 104 (50.7%) |
| High School Diploma | 692 (68.2%) | 322 (31.8%) |
| College/Associate Degree | 574 (77.8%) | 164 (22.2%) |
| Bachelor's Degree or higher | 357 (79.3%) | 93 (20.7%) |
Occupancy by Age of Householder in Rittman
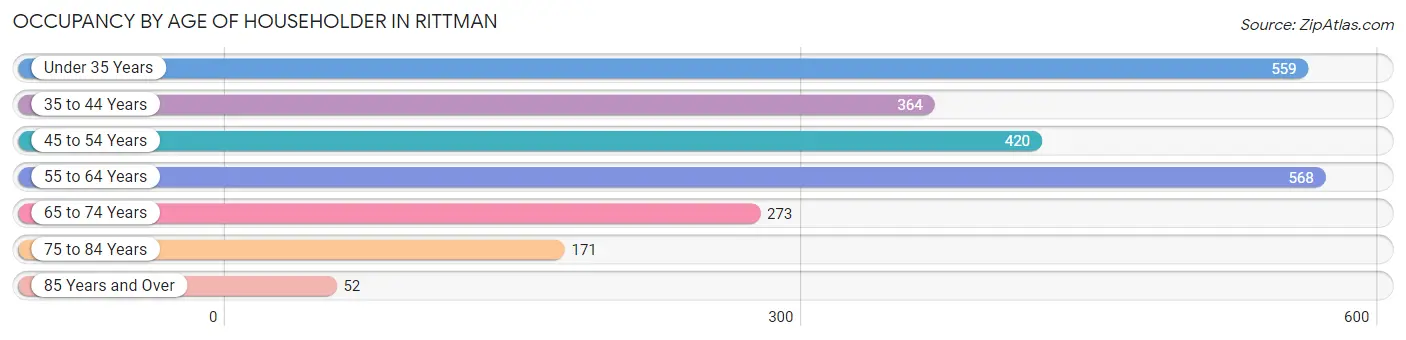
| Age Bracket | # Households | % Households |
| Under 35 Years | 559 | 23.2% |
| 35 to 44 Years | 364 | 15.1% |
| 45 to 54 Years | 420 | 17.4% |
| 55 to 64 Years | 568 | 23.6% |
| 65 to 74 Years | 273 | 11.3% |
| 75 to 84 Years | 171 | 7.1% |
| 85 Years and Over | 52 | 2.2% |
| Total | 2,407 | 100.0% |
Housing Finances in Rittman
Median Income by Occupancy in Rittman
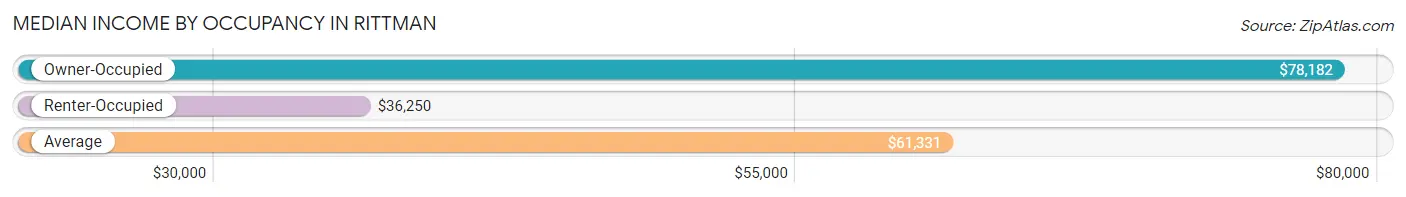
| Occupancy Type | # Households | Median Income |
| Owner-Occupied | 1,724 (71.6%) | $78,182 |
| Renter-Occupied | 683 (28.4%) | $36,250 |
| Average | 2,407 (100.0%) | $61,331 |
Occupancy by Householder Income Bracket in Rittman
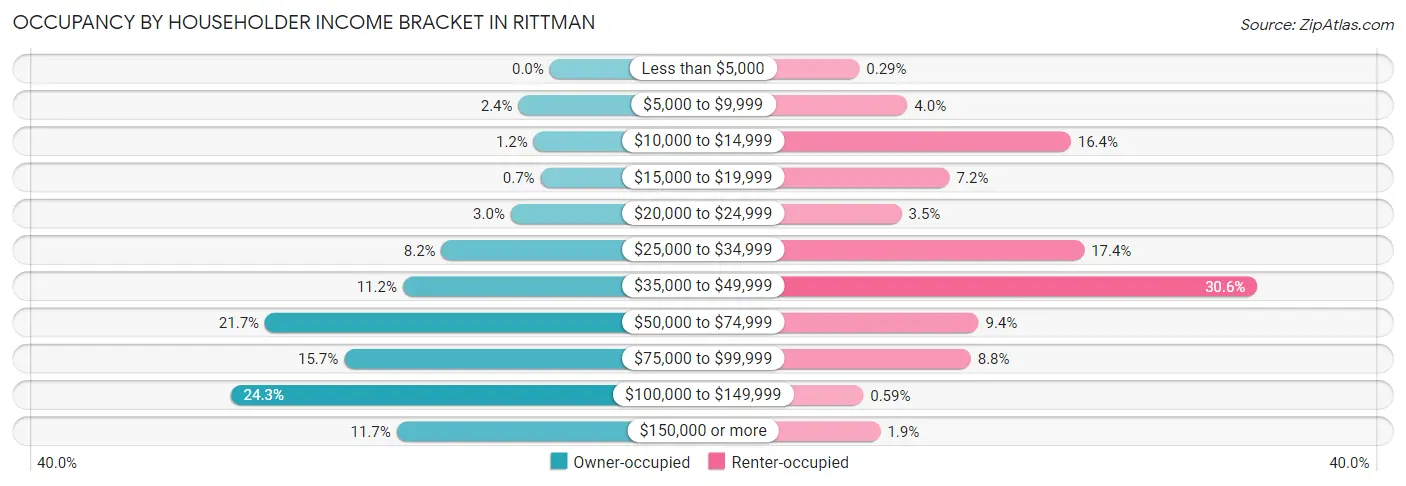
| Income Bracket | Owner-occupied | Renter-occupied |
| Less than $5,000 | 0 (0.0%) | 2 (0.3%) |
| $5,000 to $9,999 | 41 (2.4%) | 27 (4.0%) |
| $10,000 to $14,999 | 21 (1.2%) | 112 (16.4%) |
| $15,000 to $19,999 | 12 (0.7%) | 49 (7.2%) |
| $20,000 to $24,999 | 51 (3.0%) | 24 (3.5%) |
| $25,000 to $34,999 | 142 (8.2%) | 119 (17.4%) |
| $35,000 to $49,999 | 193 (11.2%) | 209 (30.6%) |
| $50,000 to $74,999 | 374 (21.7%) | 64 (9.4%) |
| $75,000 to $99,999 | 270 (15.7%) | 60 (8.8%) |
| $100,000 to $149,999 | 419 (24.3%) | 4 (0.6%) |
| $150,000 or more | 201 (11.7%) | 13 (1.9%) |
| Total | 1,724 (100.0%) | 683 (100.0%) |
Monthly Housing Cost Tiers in Rittman
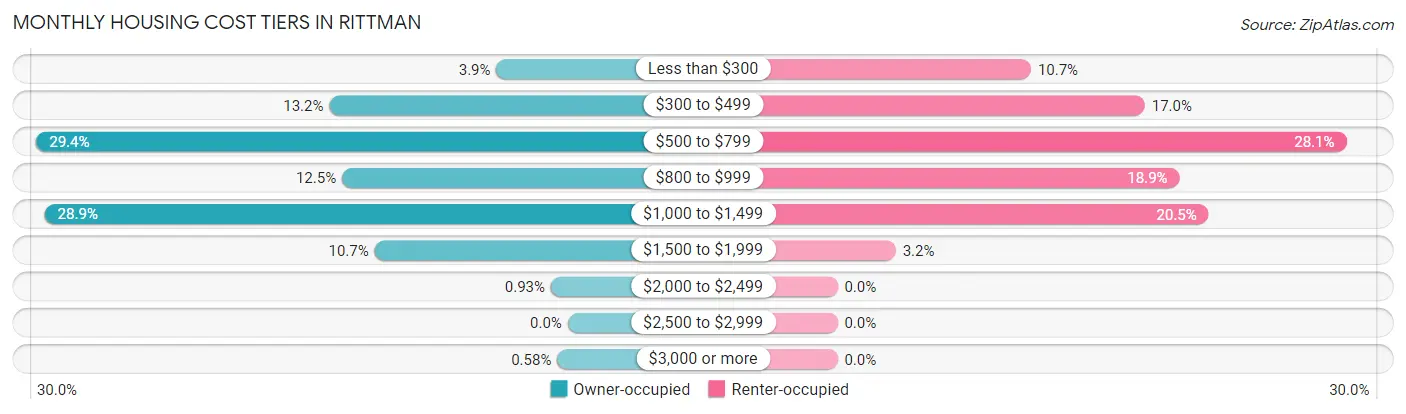
| Monthly Cost | Owner-occupied | Renter-occupied |
| Less than $300 | 68 (3.9%) | 73 (10.7%) |
| $300 to $499 | 227 (13.2%) | 116 (17.0%) |
| $500 to $799 | 506 (29.3%) | 192 (28.1%) |
| $800 to $999 | 215 (12.5%) | 129 (18.9%) |
| $1,000 to $1,499 | 498 (28.9%) | 140 (20.5%) |
| $1,500 to $1,999 | 184 (10.7%) | 22 (3.2%) |
| $2,000 to $2,499 | 16 (0.9%) | 0 (0.0%) |
| $2,500 to $2,999 | 0 (0.0%) | 0 (0.0%) |
| $3,000 or more | 10 (0.6%) | 0 (0.0%) |
| Total | 1,724 (100.0%) | 683 (100.0%) |
Physical Housing Characteristics in Rittman
Housing Structures in Rittman
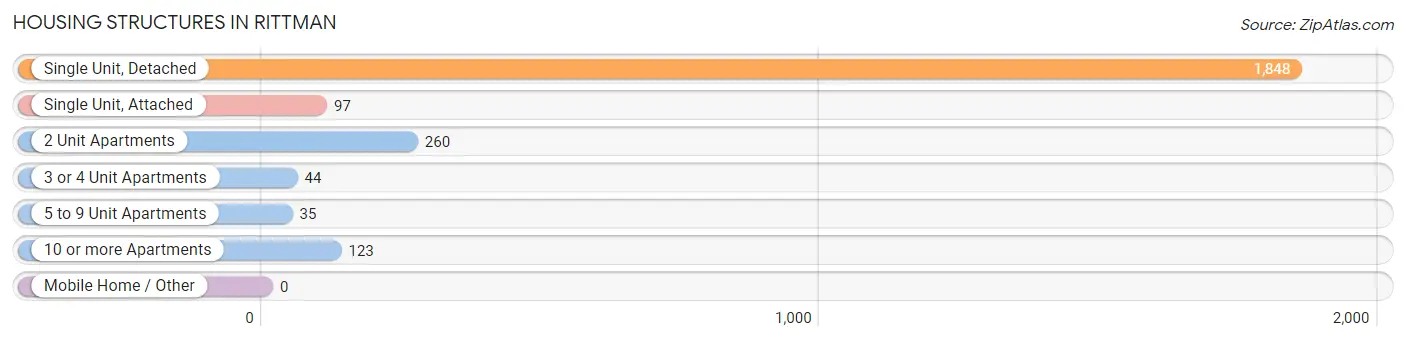
| Structure Type | # Housing Units | % Housing Units |
| Single Unit, Detached | 1,848 | 76.8% |
| Single Unit, Attached | 97 | 4.0% |
| 2 Unit Apartments | 260 | 10.8% |
| 3 or 4 Unit Apartments | 44 | 1.8% |
| 5 to 9 Unit Apartments | 35 | 1.5% |
| 10 or more Apartments | 123 | 5.1% |
| Mobile Home / Other | 0 | 0.0% |
| Total | 2,407 | 100.0% |
Housing Structures by Occupancy in Rittman
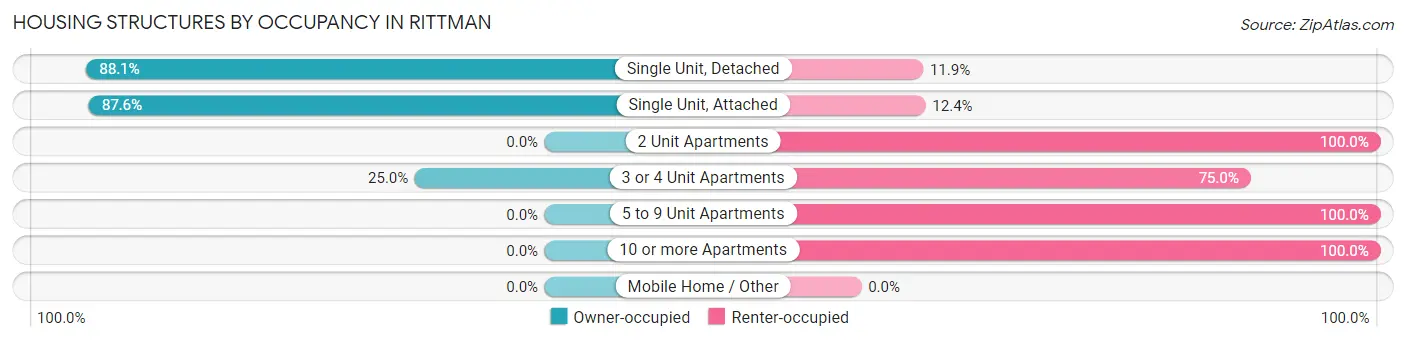
| Structure Type | Owner-occupied | Renter-occupied |
| Single Unit, Detached | 1,628 (88.1%) | 220 (11.9%) |
| Single Unit, Attached | 85 (87.6%) | 12 (12.4%) |
| 2 Unit Apartments | 0 (0.0%) | 260 (100.0%) |
| 3 or 4 Unit Apartments | 11 (25.0%) | 33 (75.0%) |
| 5 to 9 Unit Apartments | 0 (0.0%) | 35 (100.0%) |
| 10 or more Apartments | 0 (0.0%) | 123 (100.0%) |
| Mobile Home / Other | 0 (0.0%) | 0 (0.0%) |
| Total | 1,724 (71.6%) | 683 (28.4%) |
Housing Structures by Number of Rooms in Rittman
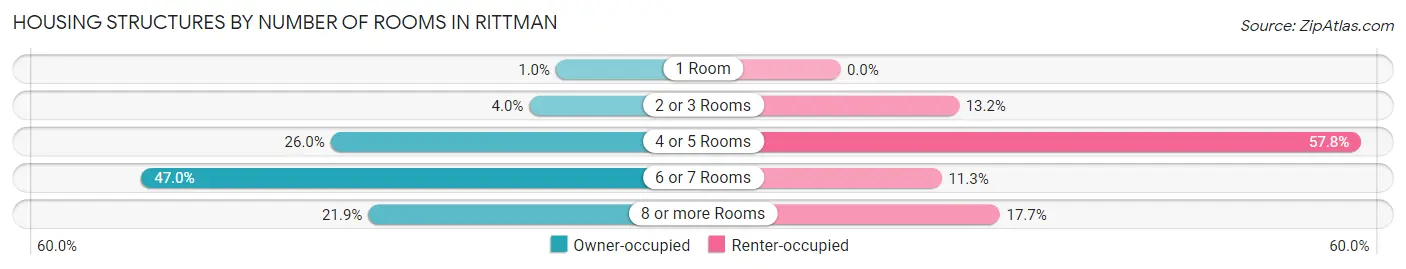
| Number of Rooms | Owner-occupied | Renter-occupied |
| 1 Room | 18 (1.0%) | 0 (0.0%) |
| 2 or 3 Rooms | 69 (4.0%) | 90 (13.2%) |
| 4 or 5 Rooms | 449 (26.0%) | 395 (57.8%) |
| 6 or 7 Rooms | 811 (47.0%) | 77 (11.3%) |
| 8 or more Rooms | 377 (21.9%) | 121 (17.7%) |
| Total | 1,724 (100.0%) | 683 (100.0%) |
Housing Structure by Heating Type in Rittman
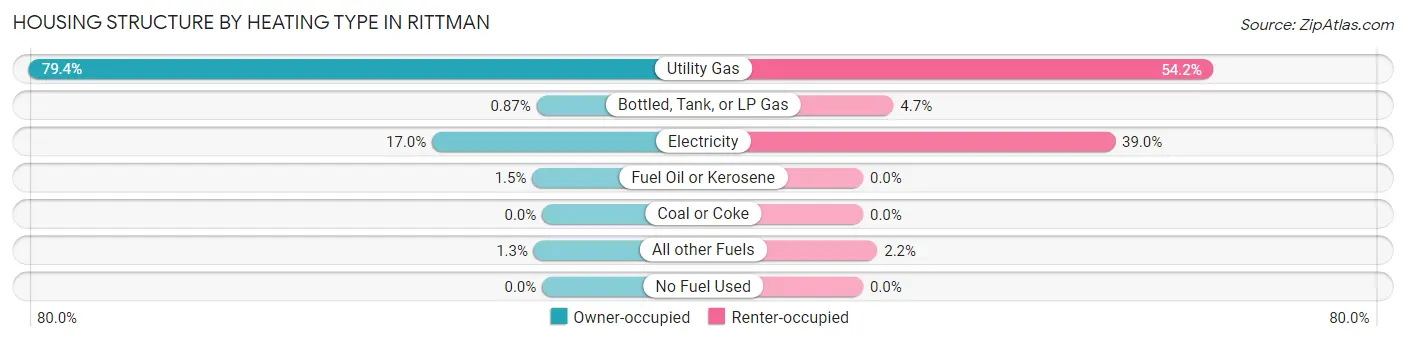
| Heating Type | Owner-occupied | Renter-occupied |
| Utility Gas | 1,368 (79.3%) | 370 (54.2%) |
| Bottled, Tank, or LP Gas | 15 (0.9%) | 32 (4.7%) |
| Electricity | 293 (17.0%) | 266 (39.0%) |
| Fuel Oil or Kerosene | 26 (1.5%) | 0 (0.0%) |
| Coal or Coke | 0 (0.0%) | 0 (0.0%) |
| All other Fuels | 22 (1.3%) | 15 (2.2%) |
| No Fuel Used | 0 (0.0%) | 0 (0.0%) |
| Total | 1,724 (100.0%) | 683 (100.0%) |
Household Vehicle Usage in Rittman
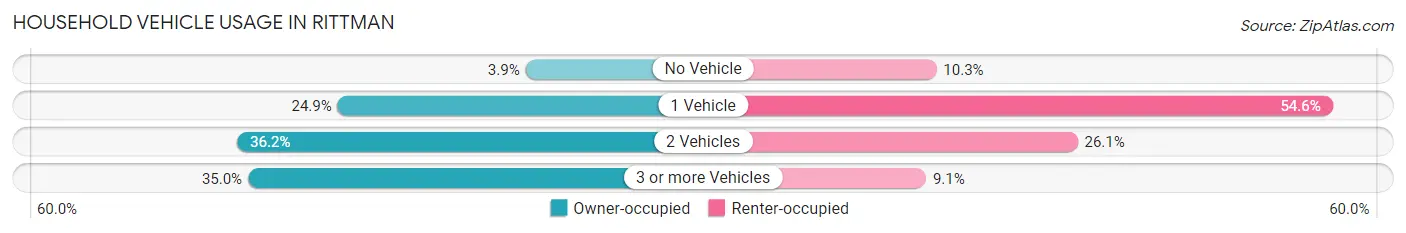
| Vehicles per Household | Owner-occupied | Renter-occupied |
| No Vehicle | 67 (3.9%) | 70 (10.2%) |
| 1 Vehicle | 430 (24.9%) | 373 (54.6%) |
| 2 Vehicles | 624 (36.2%) | 178 (26.1%) |
| 3 or more Vehicles | 603 (35.0%) | 62 (9.1%) |
| Total | 1,724 (100.0%) | 683 (100.0%) |
Real Estate & Mortgages in Rittman
Real Estate and Mortgage Overview in Rittman
| Characteristic | Without Mortgage | With Mortgage |
| Housing Units | 656 | 1,068 |
| Median Property Value | $144,200 | $145,500 |
| Median Household Income | $55,526 | $134 |
| Monthly Housing Costs | $527 | $10 |
| Real Estate Taxes | $1,850 | $30 |
Property Value by Mortgage Status in Rittman
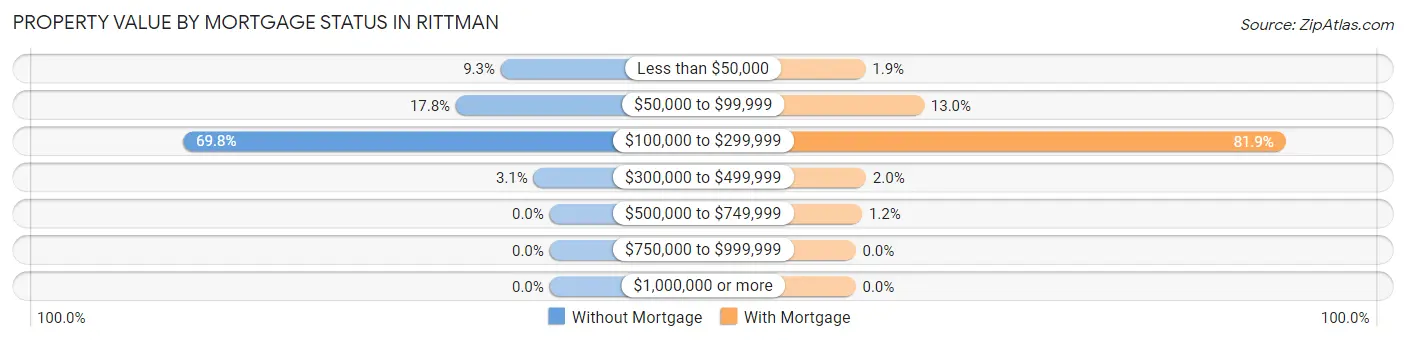
| Property Value | Without Mortgage | With Mortgage |
| Less than $50,000 | 61 (9.3%) | 20 (1.9%) |
| $50,000 to $99,999 | 117 (17.8%) | 139 (13.0%) |
| $100,000 to $299,999 | 458 (69.8%) | 875 (81.9%) |
| $300,000 to $499,999 | 20 (3.0%) | 21 (2.0%) |
| $500,000 to $749,999 | 0 (0.0%) | 13 (1.2%) |
| $750,000 to $999,999 | 0 (0.0%) | 0 (0.0%) |
| $1,000,000 or more | 0 (0.0%) | 0 (0.0%) |
| Total | 656 (100.0%) | 1,068 (100.0%) |
Household Income by Mortgage Status in Rittman
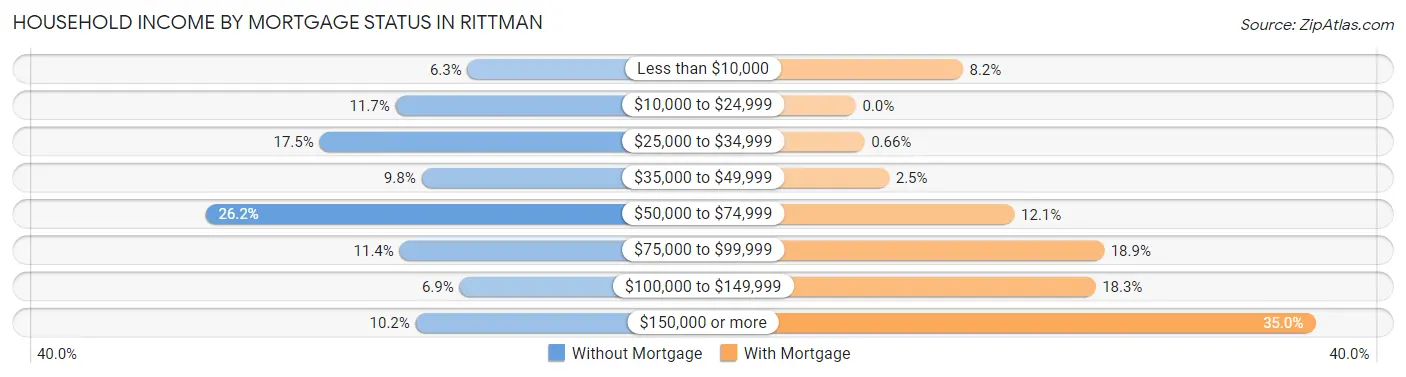
| Household Income | Without Mortgage | With Mortgage |
| Less than $10,000 | 41 (6.2%) | 87 (8.2%) |
| $10,000 to $24,999 | 77 (11.7%) | 0 (0.0%) |
| $25,000 to $34,999 | 115 (17.5%) | 7 (0.7%) |
| $35,000 to $49,999 | 64 (9.8%) | 27 (2.5%) |
| $50,000 to $74,999 | 172 (26.2%) | 129 (12.1%) |
| $75,000 to $99,999 | 75 (11.4%) | 202 (18.9%) |
| $100,000 to $149,999 | 45 (6.9%) | 195 (18.3%) |
| $150,000 or more | 67 (10.2%) | 374 (35.0%) |
| Total | 656 (100.0%) | 1,068 (100.0%) |
Property Value to Household Income Ratio in Rittman
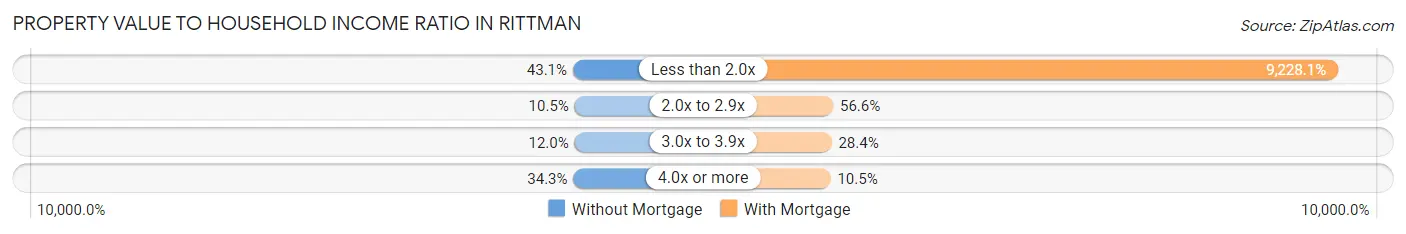
| Value-to-Income Ratio | Without Mortgage | With Mortgage |
| Less than 2.0x | 283 (43.1%) | 98,556 (9,228.1%) |
| 2.0x to 2.9x | 69 (10.5%) | 604 (56.6%) |
| 3.0x to 3.9x | 79 (12.0%) | 303 (28.4%) |
| 4.0x or more | 225 (34.3%) | 112 (10.5%) |
| Total | 656 (100.0%) | 1,068 (100.0%) |
Real Estate Taxes by Mortgage Status in Rittman
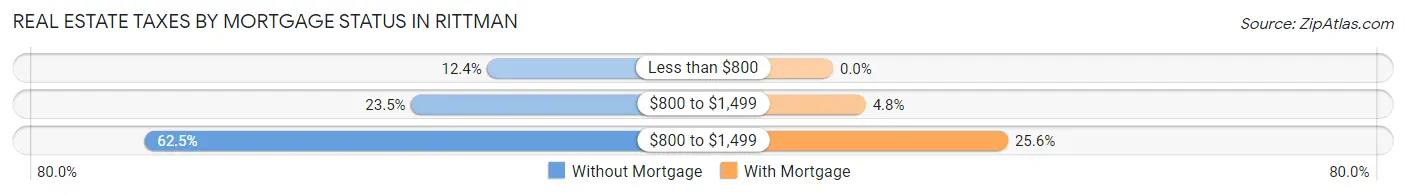
| Property Taxes | Without Mortgage | With Mortgage |
| Less than $800 | 81 (12.3%) | 0 (0.0%) |
| $800 to $1,499 | 154 (23.5%) | 51 (4.8%) |
| $800 to $1,499 | 410 (62.5%) | 273 (25.6%) |
| Total | 656 (100.0%) | 1,068 (100.0%) |
Health & Disability in Rittman
Health Insurance Coverage by Age in Rittman
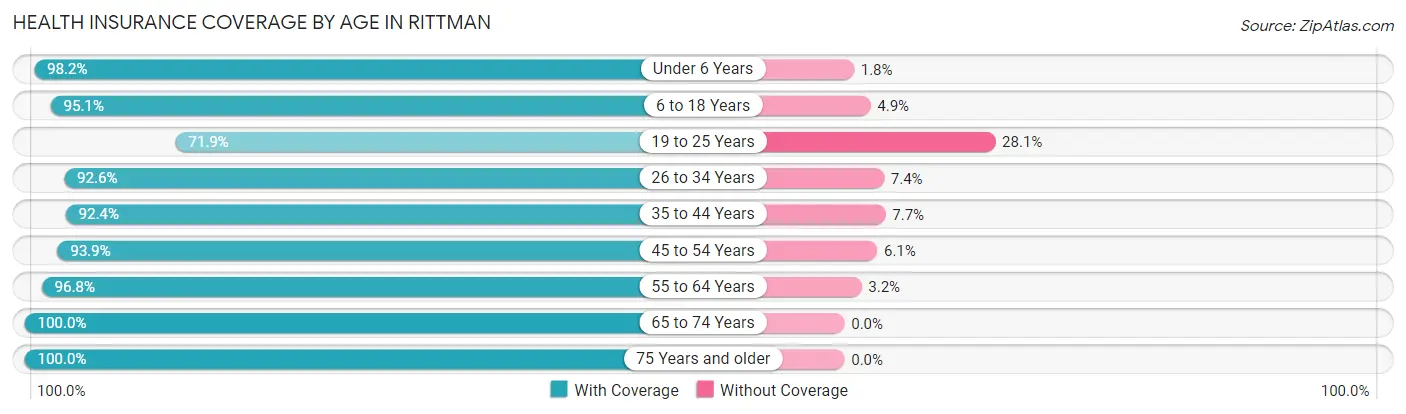
| Age Bracket | With Coverage | Without Coverage |
| Under 6 Years | 388 (98.2%) | 7 (1.8%) |
| 6 to 18 Years | 1,096 (95.1%) | 56 (4.9%) |
| 19 to 25 Years | 442 (71.9%) | 173 (28.1%) |
| 26 to 34 Years | 703 (92.6%) | 56 (7.4%) |
| 35 to 44 Years | 616 (92.3%) | 51 (7.6%) |
| 45 to 54 Years | 615 (93.9%) | 40 (6.1%) |
| 55 to 64 Years | 884 (96.8%) | 29 (3.2%) |
| 65 to 74 Years | 528 (100.0%) | 0 (0.0%) |
| 75 Years and older | 302 (100.0%) | 0 (0.0%) |
| Total | 5,574 (93.1%) | 412 (6.9%) |
Health Insurance Coverage by Citizenship Status in Rittman
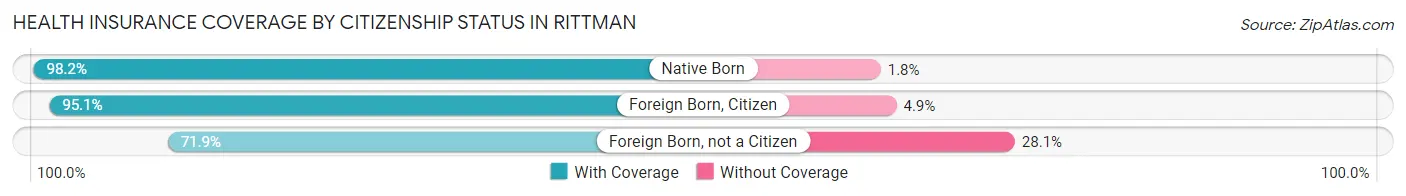
| Citizenship Status | With Coverage | Without Coverage |
| Native Born | 388 (98.2%) | 7 (1.8%) |
| Foreign Born, Citizen | 1,096 (95.1%) | 56 (4.9%) |
| Foreign Born, not a Citizen | 442 (71.9%) | 173 (28.1%) |
Health Insurance Coverage by Household Income in Rittman
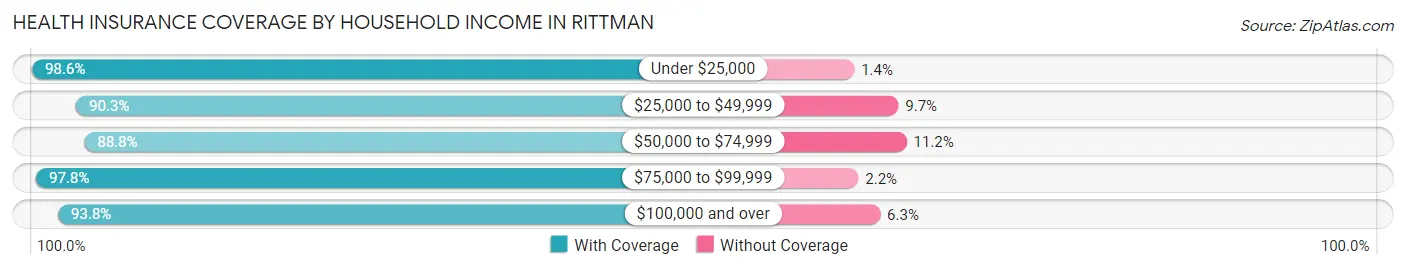
| Household Income | With Coverage | Without Coverage |
| Under $25,000 | 498 (98.6%) | 7 (1.4%) |
| $25,000 to $49,999 | 1,216 (90.3%) | 130 (9.7%) |
| $50,000 to $74,999 | 944 (88.8%) | 119 (11.2%) |
| $75,000 to $99,999 | 861 (97.8%) | 19 (2.2%) |
| $100,000 and over | 2,055 (93.8%) | 137 (6.2%) |
Public vs Private Health Insurance Coverage by Age in Rittman
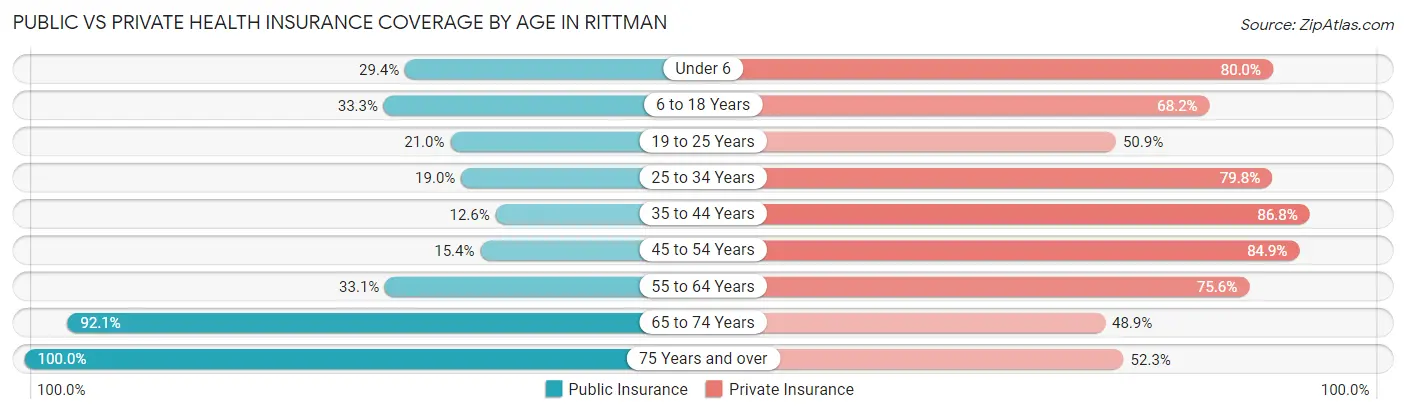
| Age Bracket | Public Insurance | Private Insurance |
| Under 6 | 116 (29.4%) | 316 (80.0%) |
| 6 to 18 Years | 384 (33.3%) | 786 (68.2%) |
| 19 to 25 Years | 129 (21.0%) | 313 (50.9%) |
| 25 to 34 Years | 144 (19.0%) | 606 (79.8%) |
| 35 to 44 Years | 84 (12.6%) | 579 (86.8%) |
| 45 to 54 Years | 101 (15.4%) | 556 (84.9%) |
| 55 to 64 Years | 302 (33.1%) | 690 (75.6%) |
| 65 to 74 Years | 486 (92.0%) | 258 (48.9%) |
| 75 Years and over | 302 (100.0%) | 158 (52.3%) |
| Total | 2,048 (34.2%) | 4,262 (71.2%) |
Disability Status by Sex by Age in Rittman
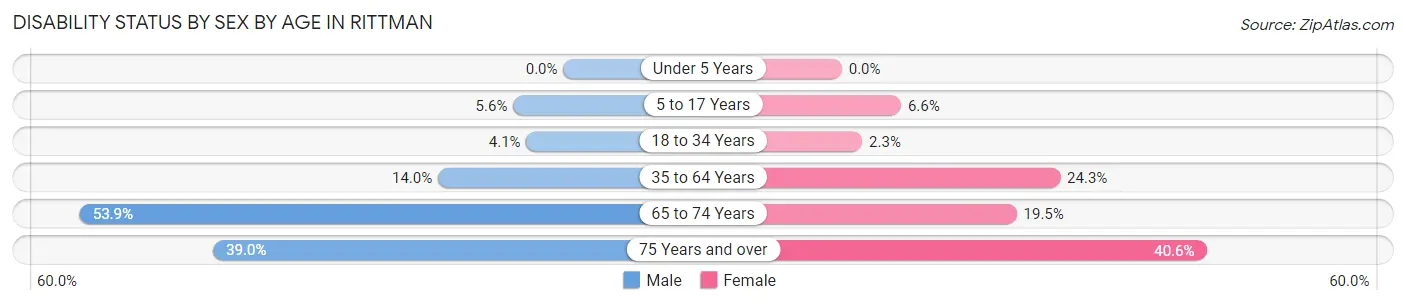
| Age Bracket | Male | Female |
| Under 5 Years | 0 (0.0%) | 0 (0.0%) |
| 5 to 17 Years | 34 (5.6%) | 34 (6.6%) |
| 18 to 34 Years | 35 (4.1%) | 14 (2.3%) |
| 35 to 64 Years | 157 (14.0%) | 270 (24.3%) |
| 65 to 74 Years | 182 (53.8%) | 37 (19.5%) |
| 75 Years and over | 39 (39.0%) | 82 (40.6%) |
Disability Class by Sex by Age in Rittman
Disability Class: Hearing Difficulty
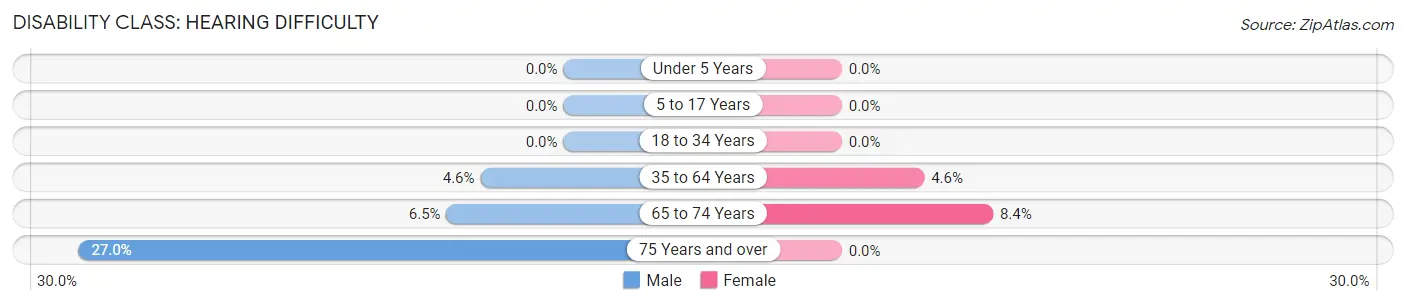
| Age Bracket | Male | Female |
| Under 5 Years | 0 (0.0%) | 0 (0.0%) |
| 5 to 17 Years | 0 (0.0%) | 0 (0.0%) |
| 18 to 34 Years | 0 (0.0%) | 0 (0.0%) |
| 35 to 64 Years | 52 (4.6%) | 51 (4.6%) |
| 65 to 74 Years | 22 (6.5%) | 16 (8.4%) |
| 75 Years and over | 27 (27.0%) | 0 (0.0%) |
Disability Class: Vision Difficulty
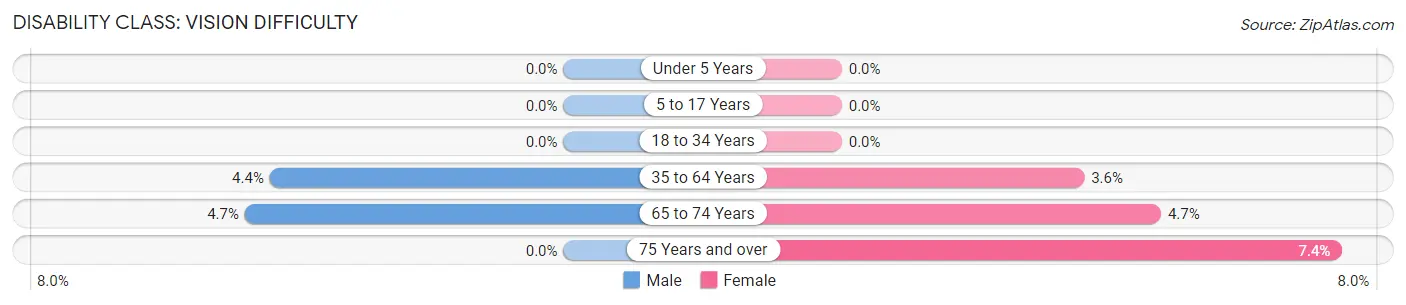
| Age Bracket | Male | Female |
| Under 5 Years | 0 (0.0%) | 0 (0.0%) |
| 5 to 17 Years | 0 (0.0%) | 0 (0.0%) |
| 18 to 34 Years | 0 (0.0%) | 0 (0.0%) |
| 35 to 64 Years | 49 (4.4%) | 40 (3.6%) |
| 65 to 74 Years | 16 (4.7%) | 9 (4.7%) |
| 75 Years and over | 0 (0.0%) | 15 (7.4%) |
Disability Class: Cognitive Difficulty
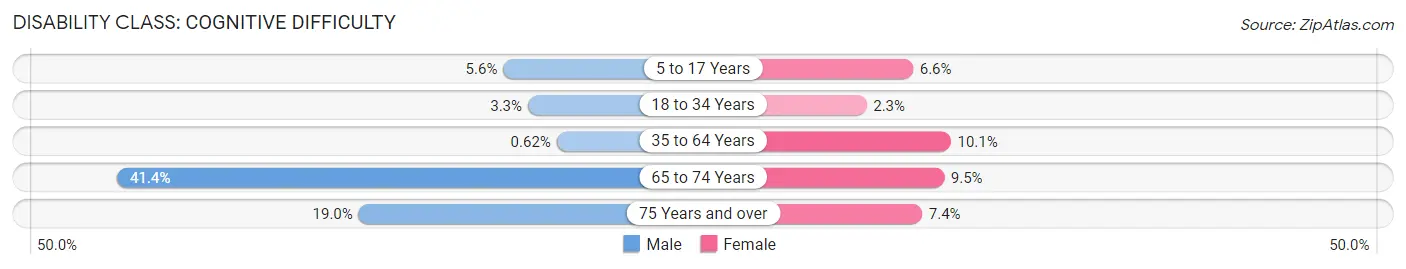
| Age Bracket | Male | Female |
| 5 to 17 Years | 34 (5.6%) | 34 (6.6%) |
| 18 to 34 Years | 28 (3.3%) | 14 (2.3%) |
| 35 to 64 Years | 7 (0.6%) | 112 (10.1%) |
| 65 to 74 Years | 140 (41.4%) | 18 (9.5%) |
| 75 Years and over | 19 (19.0%) | 15 (7.4%) |
Disability Class: Ambulatory Difficulty
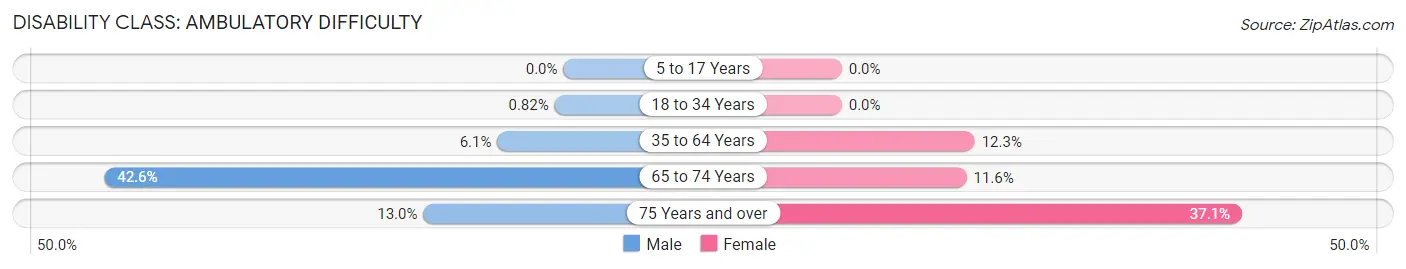
| Age Bracket | Male | Female |
| 5 to 17 Years | 0 (0.0%) | 0 (0.0%) |
| 18 to 34 Years | 7 (0.8%) | 0 (0.0%) |
| 35 to 64 Years | 69 (6.1%) | 137 (12.3%) |
| 65 to 74 Years | 144 (42.6%) | 22 (11.6%) |
| 75 Years and over | 13 (13.0%) | 75 (37.1%) |
Disability Class: Self-Care Difficulty
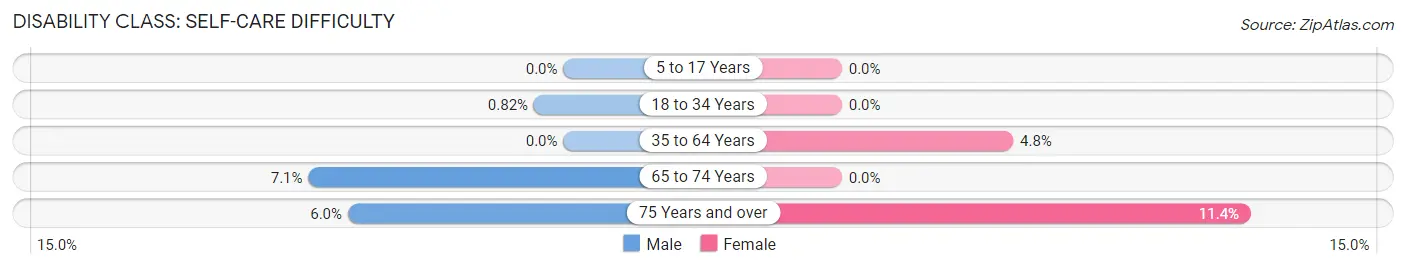
| Age Bracket | Male | Female |
| 5 to 17 Years | 0 (0.0%) | 0 (0.0%) |
| 18 to 34 Years | 7 (0.8%) | 0 (0.0%) |
| 35 to 64 Years | 0 (0.0%) | 53 (4.8%) |
| 65 to 74 Years | 24 (7.1%) | 0 (0.0%) |
| 75 Years and over | 6 (6.0%) | 23 (11.4%) |
Technology Access in Rittman
Computing Device Access in Rittman
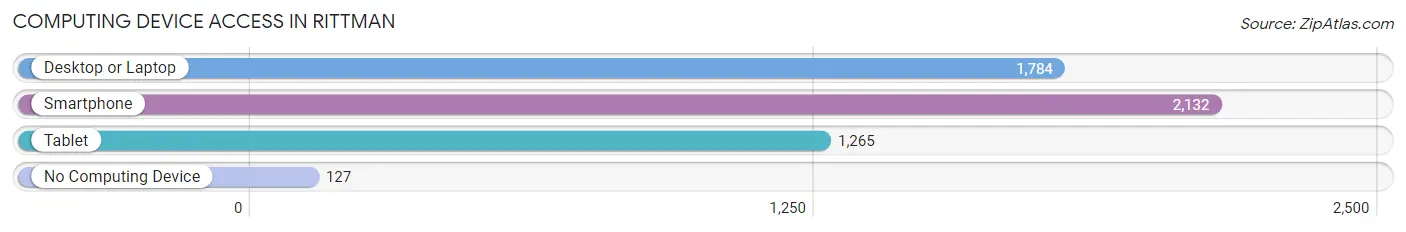
| Device Type | # Households | % Households |
| Desktop or Laptop | 1,784 | 74.1% |
| Smartphone | 2,132 | 88.6% |
| Tablet | 1,265 | 52.6% |
| No Computing Device | 127 | 5.3% |
| Total | 2,407 | 100.0% |
Internet Access in Rittman
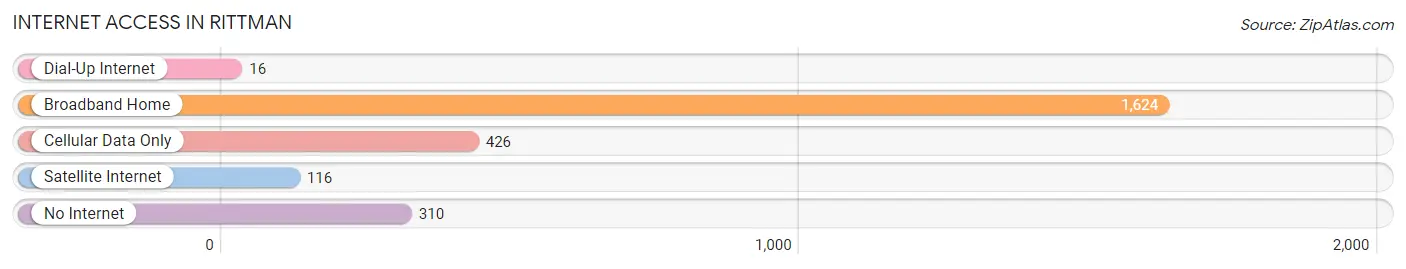
| Internet Type | # Households | % Households |
| Dial-Up Internet | 16 | 0.7% |
| Broadband Home | 1,624 | 67.5% |
| Cellular Data Only | 426 | 17.7% |
| Satellite Internet | 116 | 4.8% |
| No Internet | 310 | 12.9% |
| Total | 2,407 | 100.0% |
Rittman Summary
Rittman is a city located in Wayne County, Ohio, United States. It is situated along the Chippewa River, approximately 25 miles southwest of Akron. The population was 8,491 at the 2010 census.
History
Rittman was founded in 1816 by John Rittman, a German immigrant. The city was originally known as Rittman's Station, and was a stop on the Underground Railroad. In 1846, the village was incorporated as Rittman.
The city was a major center for the production of agricultural equipment in the late 19th and early 20th centuries. The Rittman Foundry and Machine Company, founded in 1876, was the largest employer in the city for many years. The company produced a variety of products, including plows, cultivators, and threshing machines.
Geography
Rittman is located at 40°59'25" North, 81°48'25" West (40.990278, -81.806944). According to the United States Census Bureau, the city has a total area of 4.2 square miles, all land.
Economy
Rittman's economy is largely based on agriculture and manufacturing. The city is home to several large agricultural equipment manufacturers, including Rittman Foundry and Machine Company, which produces plows, cultivators, and threshing machines. The city is also home to several food processing plants, including a Nestle plant that produces ice cream and frozen desserts.
Demographics
As of the census of 2010, there were 8,491 people, 3,521 households, and 2,323 families residing in the city. The population density was 2,019.2 people per square mile. The racial makeup of the city was 95.2% White, 1.2% African American, 0.3% Native American, 0.5% Asian, 0.1% Pacific Islander, 0.7% from other races, and 1.9% from two or more races. Hispanic or Latino of any race were 2.2% of the population.
The median income for a household in the city was $41,945, and the median income for a family was $50,945. Males had a median income of $37,945 versus $27,945 for females. The per capita income for the city was $20,945. About 8.2% of families and 10.2% of the population were below the poverty line, including 14.2% of those under age 18 and 8.2% of those age 65 or over.
Common Questions
What is Per Capita Income in Rittman?
Per Capita income in Rittman is $36,297.
What is the Median Family Income in Rittman?
Median Family Income in Rittman is $88,144.
What is the Median Household income in Rittman?
Median Household Income in Rittman is $61,331.
What is Income or Wage Gap in Rittman?
Income or Wage Gap in Rittman is 21.5%.
Women in Rittman earn 78.5 cents for every dollar earned by a man.
What is Inequality or Gini Index in Rittman?
Inequality or Gini Index in Rittman is 0.48.
What is the Total Population of Rittman?
Total Population of Rittman is 6,058.
What is the Total Male Population of Rittman?
Total Male Population of Rittman is 3,254.
What is the Total Female Population of Rittman?
Total Female Population of Rittman is 2,804.
What is the Ratio of Males per 100 Females in Rittman?
There are 116.05 Males per 100 Females in Rittman.
What is the Ratio of Females per 100 Males in Rittman?
There are 86.17 Females per 100 Males in Rittman.
What is the Median Population Age in Rittman?
Median Population Age in Rittman is 36.5 Years.
What is the Average Family Size in Rittman
Average Family Size in Rittman is 3.2 People.
What is the Average Household Size in Rittman
Average Household Size in Rittman is 2.5 People.
How Large is the Labor Force in Rittman?
There are 3,151 People in the Labor Forcein in Rittman.
What is the Percentage of People in the Labor Force in Rittman?
65.9% of People are in the Labor Force in Rittman.
What is the Unemployment Rate in Rittman?
Unemployment Rate in Rittman is 7.3%.