Berlin, WI Map & Demographics
Berlin Map
Berlin Overview
$28,255
PER CAPITA INCOME
$73,125
AVG FAMILY INCOME
$57,656
AVG HOUSEHOLD INCOME
37.8%
WAGE / INCOME GAP [ % ]
62.2¢/ $1
WAGE / INCOME GAP [ $ ]
0.36
INEQUALITY / GINI INDEX
5,537
TOTAL POPULATION
2,724
MALE POPULATION
2,813
FEMALE POPULATION
96.84
MALES / 100 FEMALES
103.27
FEMALES / 100 MALES
40.3
MEDIAN AGE
2.8
AVG FAMILY SIZE
2.3
AVG HOUSEHOLD SIZE
2,715
LABOR FORCE [ PEOPLE ]
61.3%
PERCENT IN LABOR FORCE
3.3%
UNEMPLOYMENT RATE
Berlin Zip Codes
Berlin Area Codes
Income in Berlin
Income Overview in Berlin
Per Capita Income in Berlin is $28,255, while median incomes of families and households are $73,125 and $57,656 respectively.
| Characteristic | Number | Measure |
| Per Capita Income | 5,537 | $28,255 |
| Median Family Income | 1,480 | $73,125 |
| Mean Family Income | 1,480 | $73,864 |
| Median Household Income | 2,363 | $57,656 |
| Mean Household Income | 2,363 | $65,658 |
| Income Deficit | 1,480 | $0 |
| Wage / Income Gap (%) | 5,537 | 37.78% |
| Wage / Income Gap ($) | 5,537 | 62.22¢ per $1 |
| Gini / Inequality Index | 5,537 | 0.36 |
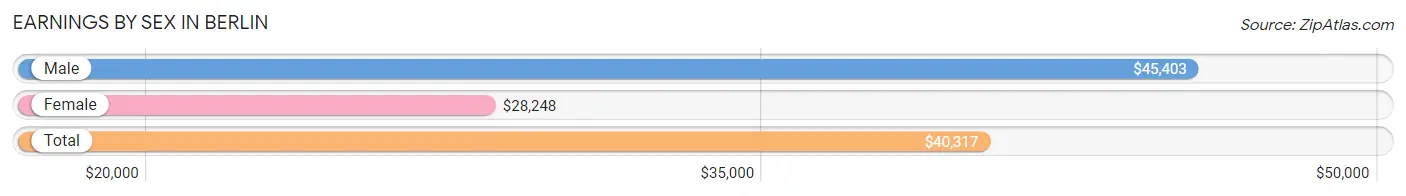
Earnings by Sex in Berlin
Average Earnings in Berlin are $40,317, $45,403 for men and $28,248 for women, a difference of 37.8%.
| Sex | Number | Average Earnings |
| Male | 1,572 (53.8%) | $45,403 |
| Female | 1,350 (46.2%) | $28,248 |
| Total | 2,922 (100.0%) | $40,317 |
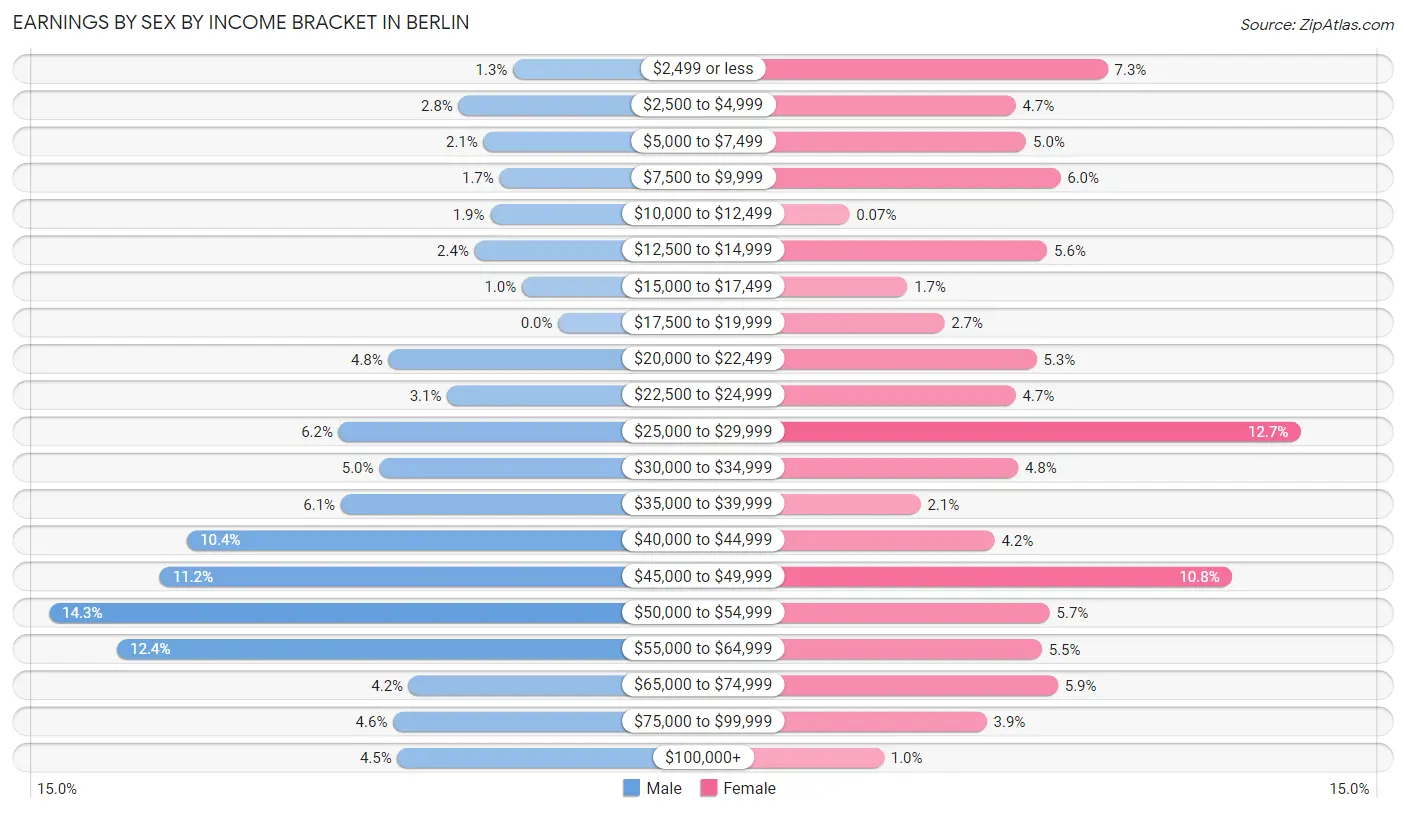
Earnings by Sex by Income Bracket in Berlin
The most common earnings brackets in Berlin are $50,000 to $54,999 for men (225 | 14.3%) and $25,000 to $29,999 for women (172 | 12.7%).
| Income | Male | Female |
| $2,499 or less | 20 (1.3%) | 99 (7.3%) |
| $2,500 to $4,999 | 44 (2.8%) | 64 (4.7%) |
| $5,000 to $7,499 | 33 (2.1%) | 68 (5.0%) |
| $7,500 to $9,999 | 26 (1.7%) | 81 (6.0%) |
| $10,000 to $12,499 | 30 (1.9%) | 1 (0.1%) |
| $12,500 to $14,999 | 37 (2.4%) | 76 (5.6%) |
| $15,000 to $17,499 | 16 (1.0%) | 23 (1.7%) |
| $17,500 to $19,999 | 0 (0.0%) | 37 (2.7%) |
| $20,000 to $22,499 | 75 (4.8%) | 72 (5.3%) |
| $22,500 to $24,999 | 49 (3.1%) | 64 (4.7%) |
| $25,000 to $29,999 | 97 (6.2%) | 172 (12.7%) |
| $30,000 to $34,999 | 79 (5.0%) | 65 (4.8%) |
| $35,000 to $39,999 | 96 (6.1%) | 28 (2.1%) |
| $40,000 to $44,999 | 164 (10.4%) | 56 (4.2%) |
| $45,000 to $49,999 | 176 (11.2%) | 146 (10.8%) |
| $50,000 to $54,999 | 225 (14.3%) | 77 (5.7%) |
| $55,000 to $64,999 | 195 (12.4%) | 74 (5.5%) |
| $65,000 to $74,999 | 66 (4.2%) | 80 (5.9%) |
| $75,000 to $99,999 | 73 (4.6%) | 53 (3.9%) |
| $100,000+ | 71 (4.5%) | 14 (1.0%) |
| Total | 1,572 (100.0%) | 1,350 (100.0%) |
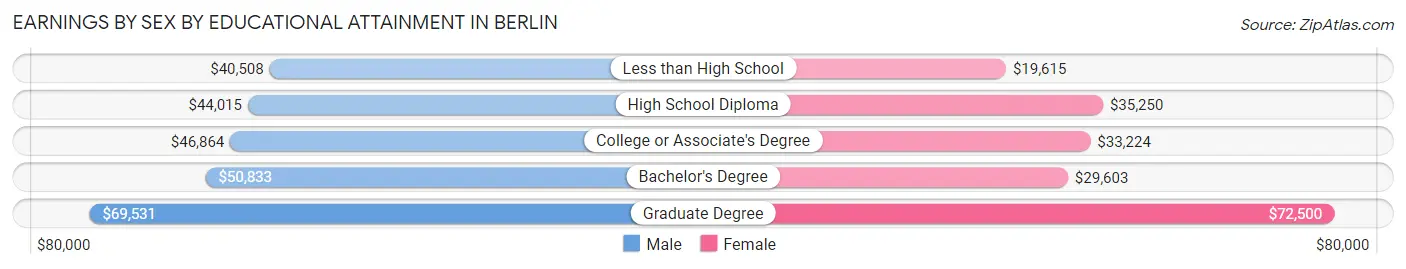
Earnings by Sex by Educational Attainment in Berlin
Average earnings in Berlin are $45,131 for men and $32,829 for women, a difference of 27.3%. Men with an educational attainment of graduate degree enjoy the highest average annual earnings of $69,531, while those with less than high school education earn the least with $40,508. Women with an educational attainment of graduate degree earn the most with the average annual earnings of $72,500, while those with less than high school education have the smallest earnings of $19,615.
| Educational Attainment | Male Income | Female Income |
| Less than High School | $40,508 | $19,615 |
| High School Diploma | $44,015 | $35,250 |
| College or Associate's Degree | $46,864 | $33,224 |
| Bachelor's Degree | $50,833 | $29,603 |
| Graduate Degree | $69,531 | $72,500 |
| Total | $45,131 | $32,829 |
Family Income in Berlin
Family Income Brackets in Berlin
According to the Berlin family income data, there are 397 families falling into the $75,000 to $99,999 income range, which is the most common income bracket and makes up 26.8% of all families.
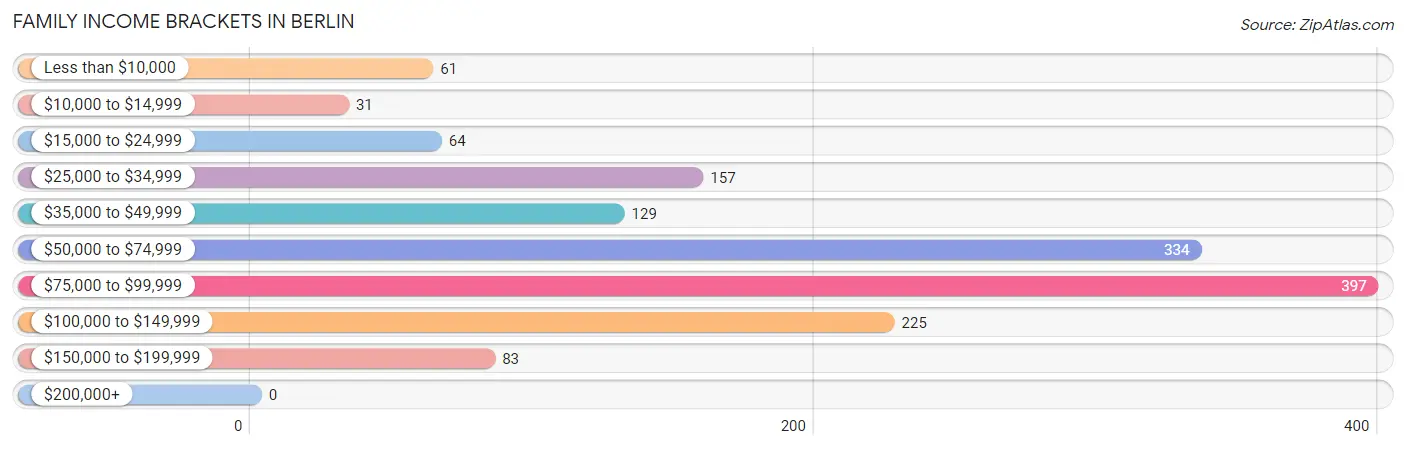
| Income Bracket | # Families | % Families |
| Less than $10,000 | 61 | 4.1% |
| $10,000 to $14,999 | 31 | 2.1% |
| $15,000 to $24,999 | 64 | 4.3% |
| $25,000 to $34,999 | 157 | 10.6% |
| $35,000 to $49,999 | 129 | 8.7% |
| $50,000 to $74,999 | 334 | 22.6% |
| $75,000 to $99,999 | 397 | 26.8% |
| $100,000 to $149,999 | 225 | 15.2% |
| $150,000 to $199,999 | 83 | 5.6% |
| $200,000+ | 0 | 0.0% |
Family Income by Famaliy Size in Berlin
5-person families (97 | 6.6%) account for the highest median family income in Berlin with $77,321 per family, while 2-person families (783 | 52.9%) have the highest median income of $31,756 per family member.
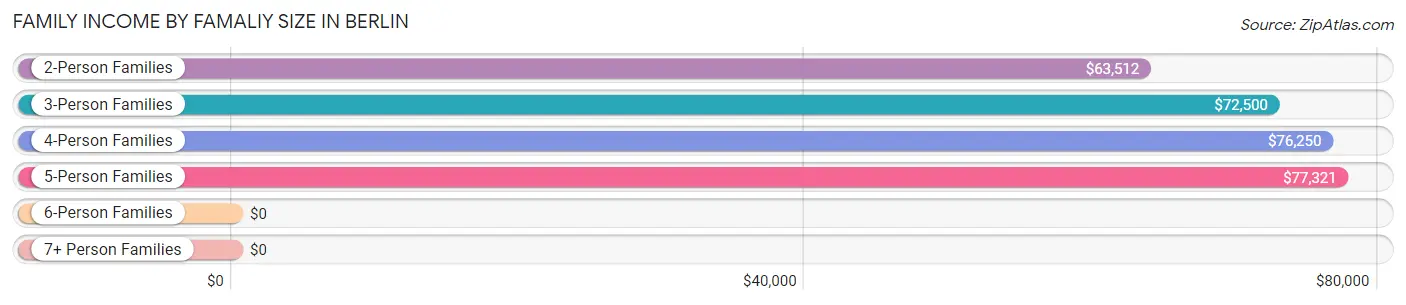
| Income Bracket | # Families | Median Income |
| 2-Person Families | 783 (52.9%) | $63,512 |
| 3-Person Families | 320 (21.6%) | $72,500 |
| 4-Person Families | 209 (14.1%) | $76,250 |
| 5-Person Families | 97 (6.6%) | $77,321 |
| 6-Person Families | 22 (1.5%) | $0 |
| 7+ Person Families | 49 (3.3%) | $0 |
| Total | 1,480 (100.0%) | $73,125 |
Family Income by Number of Earners in Berlin
The median family income in Berlin is $73,125, with families comprising 2 earners (647) having the highest median family income of $96,838, while families with no earners (245) have the lowest median family income of $25,139, accounting for 43.7% and 16.6% of families, respectively.
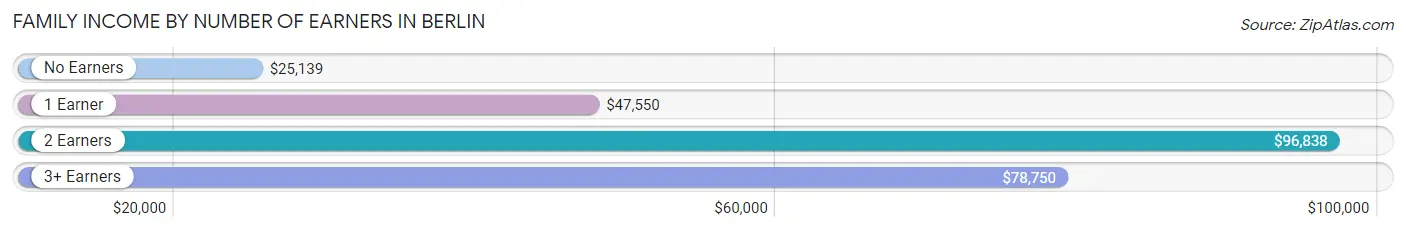
| Number of Earners | # Families | Median Income |
| No Earners | 245 (16.6%) | $25,139 |
| 1 Earner | 449 (30.3%) | $47,550 |
| 2 Earners | 647 (43.7%) | $96,838 |
| 3+ Earners | 139 (9.4%) | $78,750 |
| Total | 1,480 (100.0%) | $73,125 |
Household Income in Berlin
Household Income Brackets in Berlin
With 558 households falling in the category, the $50,000 to $74,999 income range is the most frequent in Berlin, accounting for 23.6% of all households. In contrast, only 19 households (0.8%) fall into the $200,000+ income bracket, making it the least populous group.
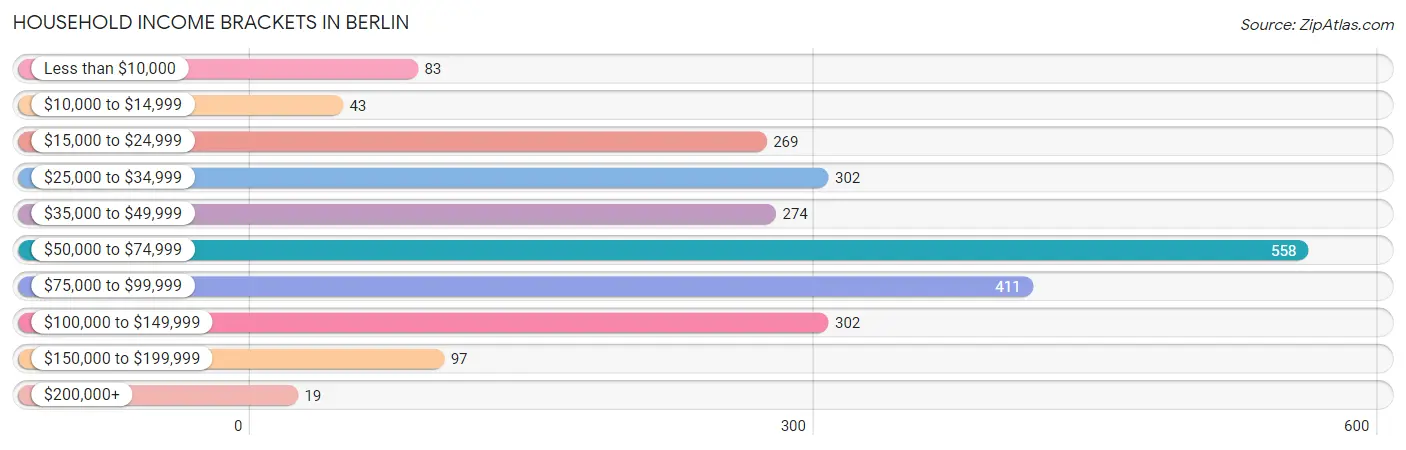
| Income Bracket | # Households | % Households |
| Less than $10,000 | 83 | 3.5% |
| $10,000 to $14,999 | 43 | 1.8% |
| $15,000 to $24,999 | 269 | 11.4% |
| $25,000 to $34,999 | 302 | 12.8% |
| $35,000 to $49,999 | 274 | 11.6% |
| $50,000 to $74,999 | 558 | 23.6% |
| $75,000 to $99,999 | 411 | 17.4% |
| $100,000 to $149,999 | 302 | 12.8% |
| $150,000 to $199,999 | 97 | 4.1% |
| $200,000+ | 19 | 0.8% |
Household Income by Householder Age in Berlin
The median household income in Berlin is $57,656, with the highest median household income of $72,068 found in the 45 to 64 years age bracket for the primary householder. A total of 853 households (36.1%) fall into this category. Meanwhile, the 65+ years age bracket for the primary householder has the lowest median household income of $36,094, with 658 households (27.9%) in this group.
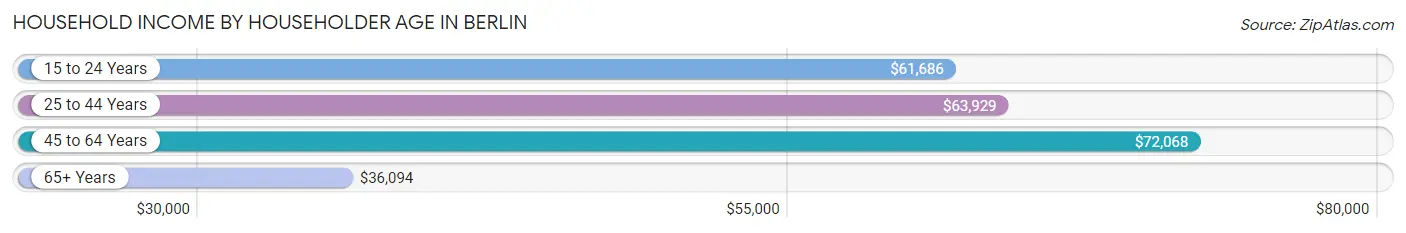
| Income Bracket | # Households | Median Income |
| 15 to 24 Years | 150 (6.4%) | $61,686 |
| 25 to 44 Years | 702 (29.7%) | $63,929 |
| 45 to 64 Years | 853 (36.1%) | $72,068 |
| 65+ Years | 658 (27.9%) | $36,094 |
| Total | 2,363 (100.0%) | $57,656 |
Poverty in Berlin
Income Below Poverty by Sex and Age in Berlin
With 14.0% poverty level for males and 18.1% for females among the residents of Berlin, 5 year old males and 6 to 11 year old females are the most vulnerable to poverty, with 25 males (49.0%) and 94 females (34.8%) in their respective age groups living below the poverty level.
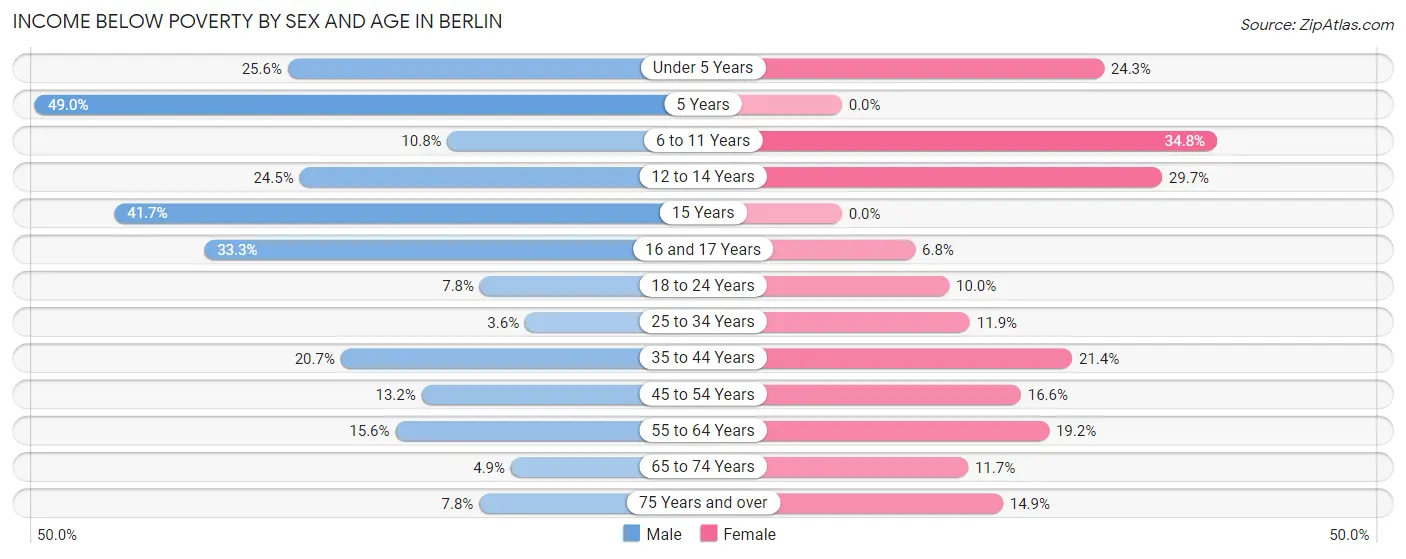
| Age Bracket | Male | Female |
| Under 5 Years | 33 (25.6%) | 18 (24.3%) |
| 5 Years | 25 (49.0%) | 0 (0.0%) |
| 6 to 11 Years | 24 (10.8%) | 94 (34.8%) |
| 12 to 14 Years | 24 (24.5%) | 41 (29.7%) |
| 15 Years | 15 (41.7%) | 0 (0.0%) |
| 16 and 17 Years | 15 (33.3%) | 7 (6.8%) |
| 18 to 24 Years | 20 (7.7%) | 23 (10.0%) |
| 25 to 34 Years | 12 (3.6%) | 39 (11.9%) |
| 35 to 44 Years | 63 (20.7%) | 75 (21.4%) |
| 45 to 54 Years | 50 (13.2%) | 45 (16.6%) |
| 55 to 64 Years | 77 (15.6%) | 75 (19.2%) |
| 65 to 74 Years | 11 (4.9%) | 26 (11.7%) |
| 75 Years and over | 10 (7.8%) | 46 (14.9%) |
| Total | 379 (14.0%) | 489 (18.1%) |
Income Above Poverty by Sex and Age in Berlin
According to the poverty statistics in Berlin, males aged 25 to 34 years and females aged 5 years are the age groups that are most secure financially, with 96.4% of males and 100.0% of females in these age groups living above the poverty line.
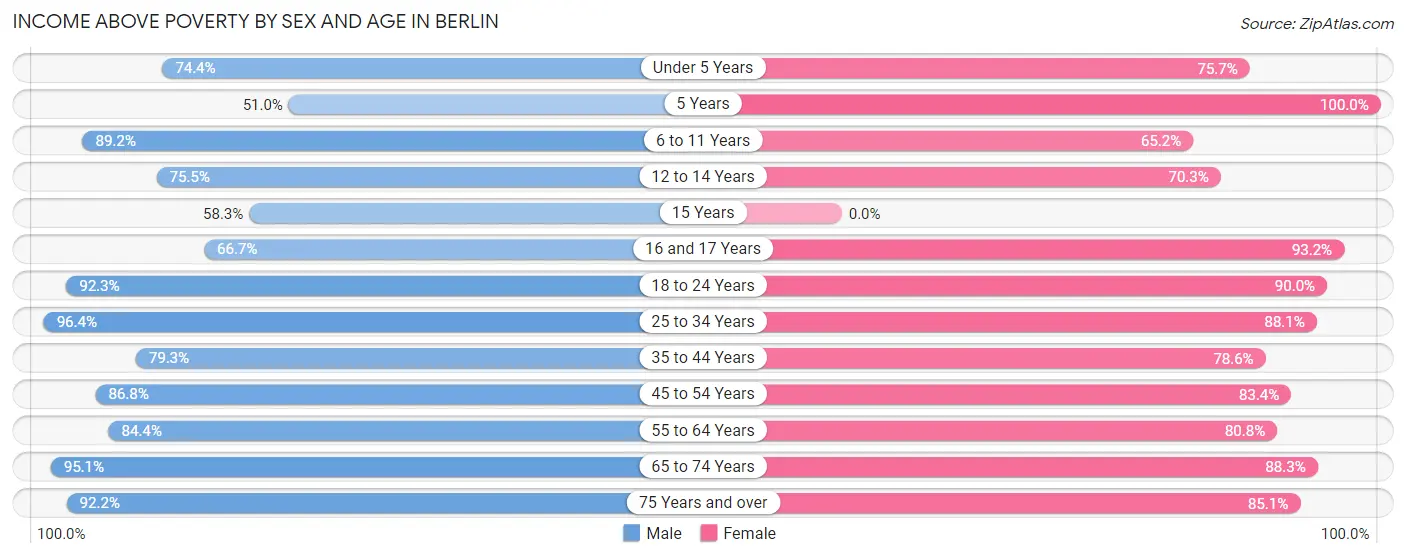
| Age Bracket | Male | Female |
| Under 5 Years | 96 (74.4%) | 56 (75.7%) |
| 5 Years | 26 (51.0%) | 14 (100.0%) |
| 6 to 11 Years | 199 (89.2%) | 176 (65.2%) |
| 12 to 14 Years | 74 (75.5%) | 97 (70.3%) |
| 15 Years | 21 (58.3%) | 0 (0.0%) |
| 16 and 17 Years | 30 (66.7%) | 96 (93.2%) |
| 18 to 24 Years | 238 (92.2%) | 208 (90.0%) |
| 25 to 34 Years | 325 (96.4%) | 289 (88.1%) |
| 35 to 44 Years | 242 (79.3%) | 276 (78.6%) |
| 45 to 54 Years | 330 (86.8%) | 226 (83.4%) |
| 55 to 64 Years | 417 (84.4%) | 315 (80.8%) |
| 65 to 74 Years | 215 (95.1%) | 196 (88.3%) |
| 75 Years and over | 118 (92.2%) | 262 (85.1%) |
| Total | 2,331 (86.0%) | 2,211 (81.9%) |
Income Below Poverty Among Married-Couple Families in Berlin
The poverty statistics for married-couple families in Berlin show that 3.0% or 27 of the total 902 families live below the poverty line. Families with 5 or more children have the highest poverty rate of 100.0%, comprising of 12 families. On the other hand, families with 1 or 2 children have the lowest poverty rate of 0.0%, which includes 0 families.
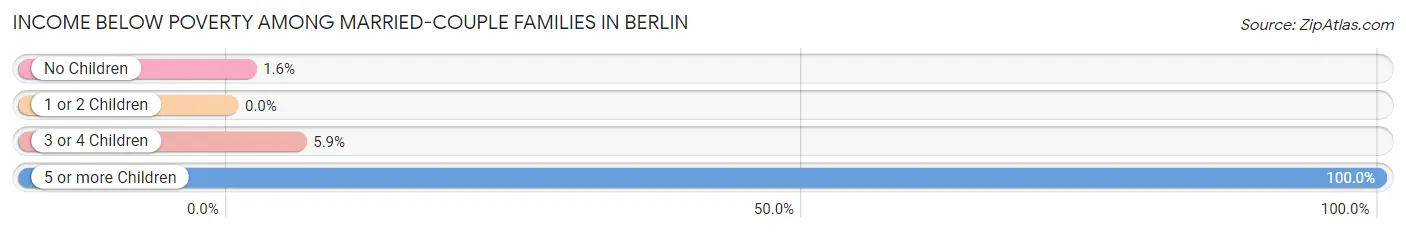
| Children | Above Poverty | Below Poverty |
| No Children | 561 (98.4%) | 9 (1.6%) |
| 1 or 2 Children | 219 (100.0%) | 0 (0.0%) |
| 3 or 4 Children | 95 (94.1%) | 6 (5.9%) |
| 5 or more Children | 0 (0.0%) | 12 (100.0%) |
| Total | 875 (97.0%) | 27 (3.0%) |
Income Below Poverty Among Single-Parent Households in Berlin
According to the poverty data in Berlin, 14.8% or 30 single-father households and 25.0% or 94 single-mother households are living below the poverty line. Among single-father households, those with no children have the highest poverty rate, with 15 households (16.0%) experiencing poverty. Likewise, among single-mother households, those with 3 or 4 children have the highest poverty rate, with 41 households (52.6%) falling below the poverty line.
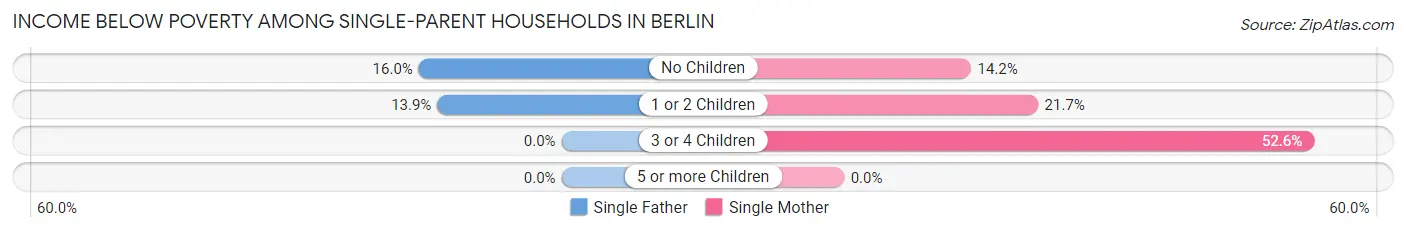
| Children | Single Father | Single Mother |
| No Children | 15 (16.0%) | 22 (14.2%) |
| 1 or 2 Children | 15 (13.9%) | 31 (21.7%) |
| 3 or 4 Children | 0 (0.0%) | 41 (52.6%) |
| 5 or more Children | 0 (0.0%) | 0 (0.0%) |
| Total | 30 (14.8%) | 94 (25.0%) |
Income Below Poverty Among Married-Couple vs Single-Parent Households in Berlin
The poverty data for Berlin shows that 27 of the married-couple family households (3.0%) and 124 of the single-parent households (21.4%) are living below the poverty level. Within the married-couple family households, those with 5 or more children have the highest poverty rate, with 12 households (100.0%) falling below the poverty line. Among the single-parent households, those with 3 or 4 children have the highest poverty rate, with 41 household (52.6%) living below poverty.
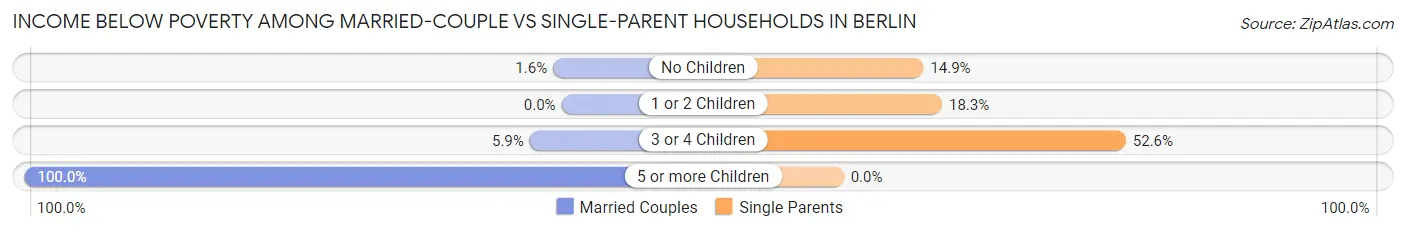
| Children | Married-Couple Families | Single-Parent Households |
| No Children | 9 (1.6%) | 37 (14.9%) |
| 1 or 2 Children | 0 (0.0%) | 46 (18.3%) |
| 3 or 4 Children | 6 (5.9%) | 41 (52.6%) |
| 5 or more Children | 12 (100.0%) | 0 (0.0%) |
| Total | 27 (3.0%) | 124 (21.4%) |
Race in Berlin
The most populous races in Berlin are White / Caucasian (5,151 | 93.0%), Hispanic or Latino (615 | 11.1%), and Two or more Races (176 | 3.2%).
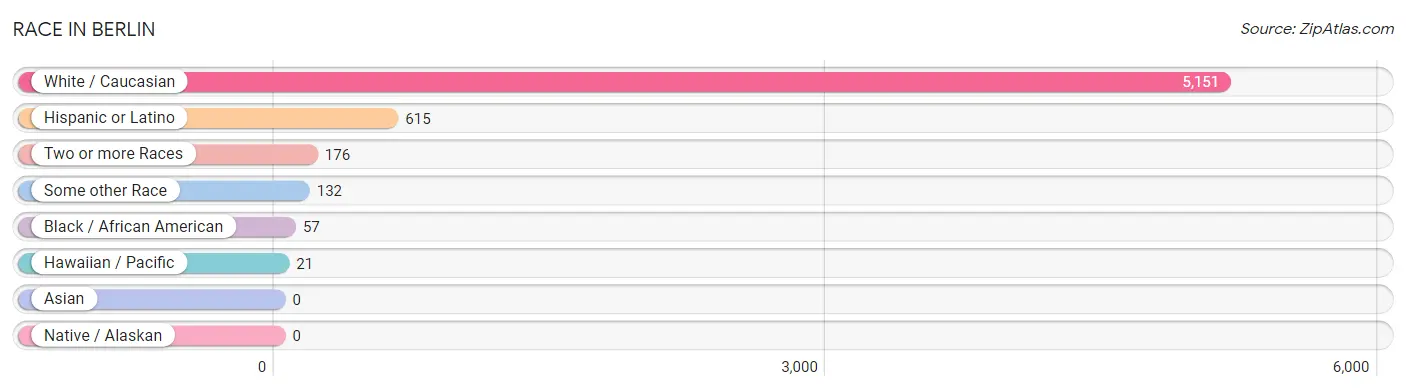
| Race | # Population | % Population |
| Asian | 0 | 0.0% |
| Black / African American | 57 | 1.0% |
| Hawaiian / Pacific | 21 | 0.4% |
| Hispanic or Latino | 615 | 11.1% |
| Native / Alaskan | 0 | 0.0% |
| White / Caucasian | 5,151 | 93.0% |
| Two or more Races | 176 | 3.2% |
| Some other Race | 132 | 2.4% |
| Total | 5,537 | 100.0% |
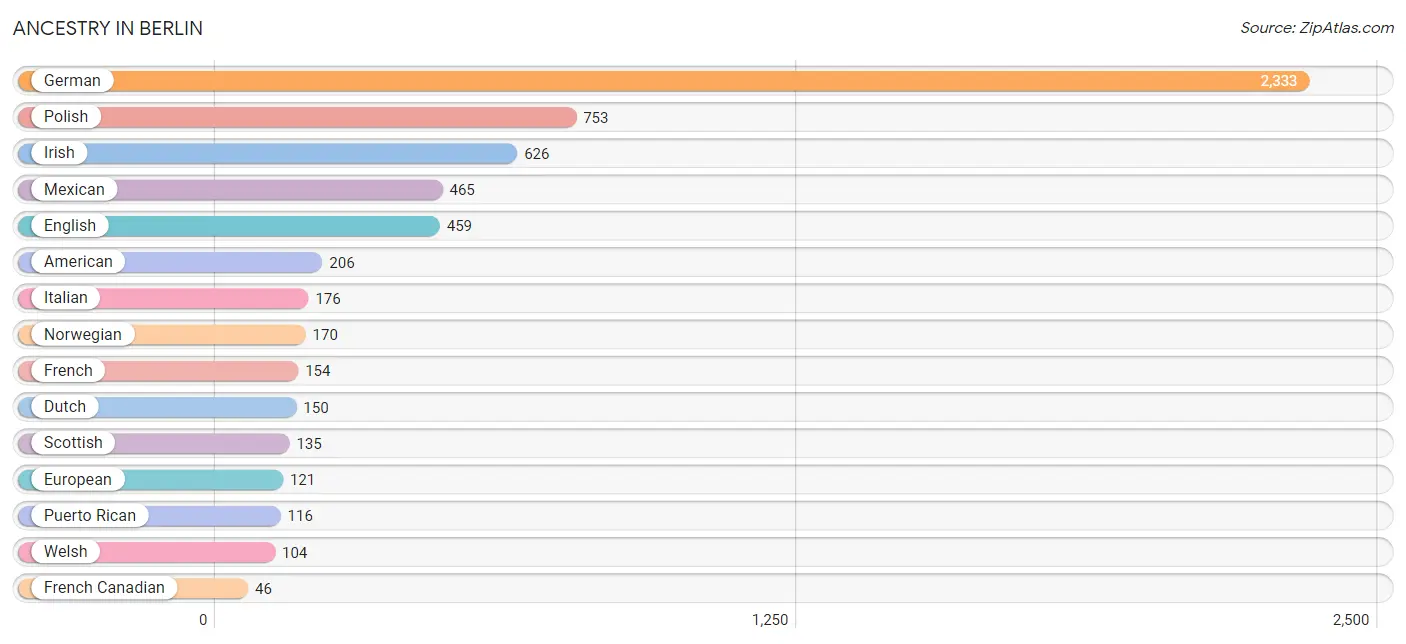
Ancestry in Berlin
The most populous ancestries reported in Berlin are German (2,333 | 42.1%), Polish (753 | 13.6%), Irish (626 | 11.3%), Mexican (465 | 8.4%), and English (459 | 8.3%), together accounting for 83.7% of all Berlin residents.
| Ancestry | # Population | % Population |
| Albanian | 42 | 0.8% |
| American | 206 | 3.7% |
| Austrian | 19 | 0.3% |
| Bangladeshi | 42 | 0.8% |
| Chippewa | 18 | 0.3% |
| Croatian | 4 | 0.1% |
| Cuban | 19 | 0.3% |
| Czech | 39 | 0.7% |
| Czechoslovakian | 9 | 0.2% |
| Danish | 27 | 0.5% |
| Dutch | 150 | 2.7% |
| Eastern European | 25 | 0.4% |
| English | 459 | 8.3% |
| European | 121 | 2.2% |
| Finnish | 6 | 0.1% |
| French | 154 | 2.8% |
| French Canadian | 46 | 0.8% |
| German | 2,333 | 42.1% |
| Hungarian | 6 | 0.1% |
| Irish | 626 | 11.3% |
| Italian | 176 | 3.2% |
| Luxembourger | 16 | 0.3% |
| Mexican | 465 | 8.4% |
| Native Hawaiian | 21 | 0.4% |
| Norwegian | 170 | 3.1% |
| Ottawa | 18 | 0.3% |
| Polish | 753 | 13.6% |
| Puerto Rican | 116 | 2.1% |
| Russian | 10 | 0.2% |
| Scandinavian | 17 | 0.3% |
| Scotch-Irish | 8 | 0.1% |
| Scottish | 135 | 2.4% |
| Slovene | 2 | 0.0% |
| Swedish | 42 | 0.8% |
| Swiss | 20 | 0.4% |
| Welsh | 104 | 1.9% | View All 36 Rows |
Immigrants in Berlin
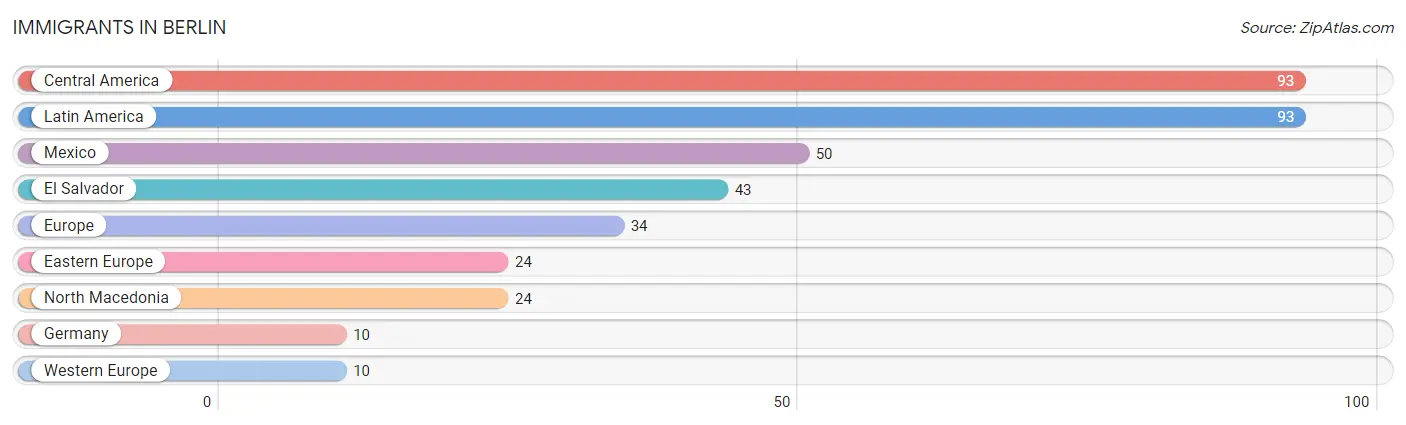
The most numerous immigrant groups reported in Berlin came from Central America (93 | 1.7%), Latin America (93 | 1.7%), Mexico (50 | 0.9%), El Salvador (43 | 0.8%), and Europe (34 | 0.6%), together accounting for 5.7% of all Berlin residents.
| Immigration Origin | # Population | % Population |
| Central America | 93 | 1.7% |
| Eastern Europe | 24 | 0.4% |
| El Salvador | 43 | 0.8% |
| Europe | 34 | 0.6% |
| Germany | 10 | 0.2% |
| Latin America | 93 | 1.7% |
| Mexico | 50 | 0.9% |
| North Macedonia | 24 | 0.4% |
| Western Europe | 10 | 0.2% | View All 9 Rows |
Sex and Age in Berlin
Sex and Age in Berlin
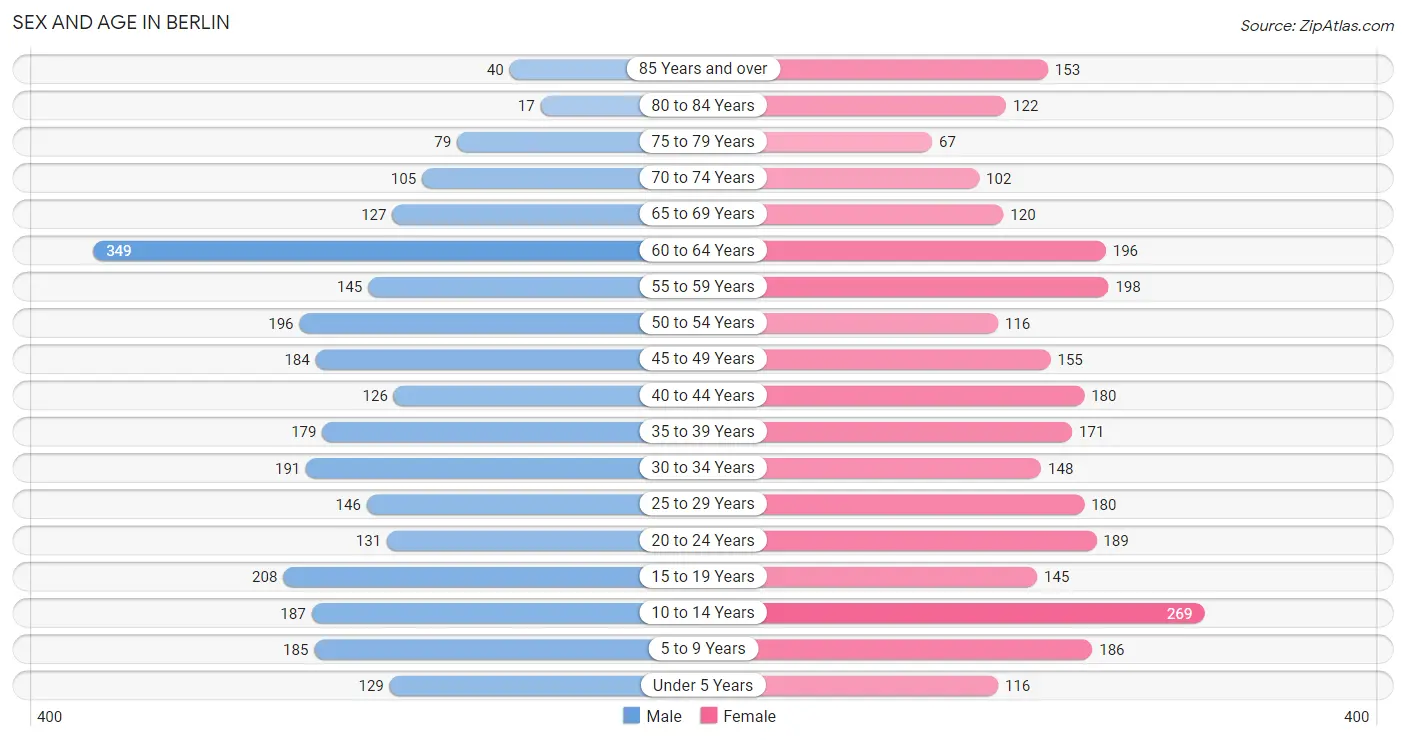
The most populous age groups in Berlin are 60 to 64 Years (349 | 12.8%) for men and 10 to 14 Years (269 | 9.6%) for women.
| Age Bracket | Male | Female |
| Under 5 Years | 129 (4.7%) | 116 (4.1%) |
| 5 to 9 Years | 185 (6.8%) | 186 (6.6%) |
| 10 to 14 Years | 187 (6.9%) | 269 (9.6%) |
| 15 to 19 Years | 208 (7.6%) | 145 (5.1%) |
| 20 to 24 Years | 131 (4.8%) | 189 (6.7%) |
| 25 to 29 Years | 146 (5.4%) | 180 (6.4%) |
| 30 to 34 Years | 191 (7.0%) | 148 (5.3%) |
| 35 to 39 Years | 179 (6.6%) | 171 (6.1%) |
| 40 to 44 Years | 126 (4.6%) | 180 (6.4%) |
| 45 to 49 Years | 184 (6.8%) | 155 (5.5%) |
| 50 to 54 Years | 196 (7.2%) | 116 (4.1%) |
| 55 to 59 Years | 145 (5.3%) | 198 (7.0%) |
| 60 to 64 Years | 349 (12.8%) | 196 (7.0%) |
| 65 to 69 Years | 127 (4.7%) | 120 (4.3%) |
| 70 to 74 Years | 105 (3.8%) | 102 (3.6%) |
| 75 to 79 Years | 79 (2.9%) | 67 (2.4%) |
| 80 to 84 Years | 17 (0.6%) | 122 (4.3%) |
| 85 Years and over | 40 (1.5%) | 153 (5.4%) |
| Total | 2,724 (100.0%) | 2,813 (100.0%) |
Families and Households in Berlin
Median Family Size in Berlin
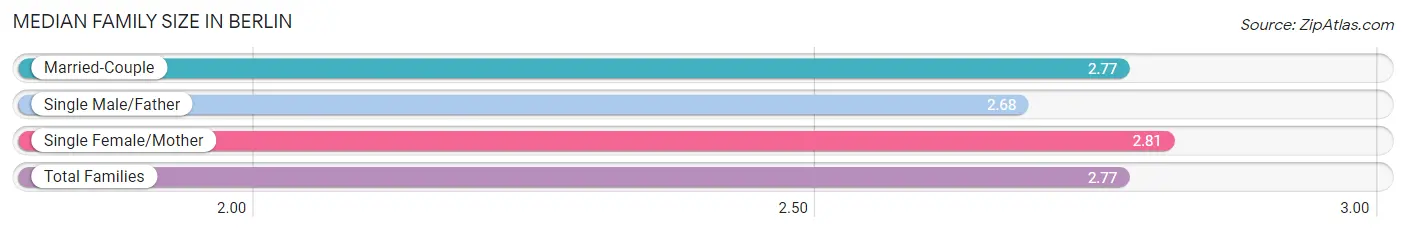
The median family size in Berlin is 2.77 persons per family, with single female/mother families (376 | 25.4%) accounting for the largest median family size of 2.81 persons per family. On the other hand, single male/father families (202 | 13.7%) represent the smallest median family size with 2.68 persons per family.
| Family Type | # Families | Family Size |
| Married-Couple | 902 (61.0%) | 2.77 |
| Single Male/Father | 202 (13.7%) | 2.68 |
| Single Female/Mother | 376 (25.4%) | 2.81 |
| Total Families | 1,480 (100.0%) | 2.77 |
Median Household Size in Berlin
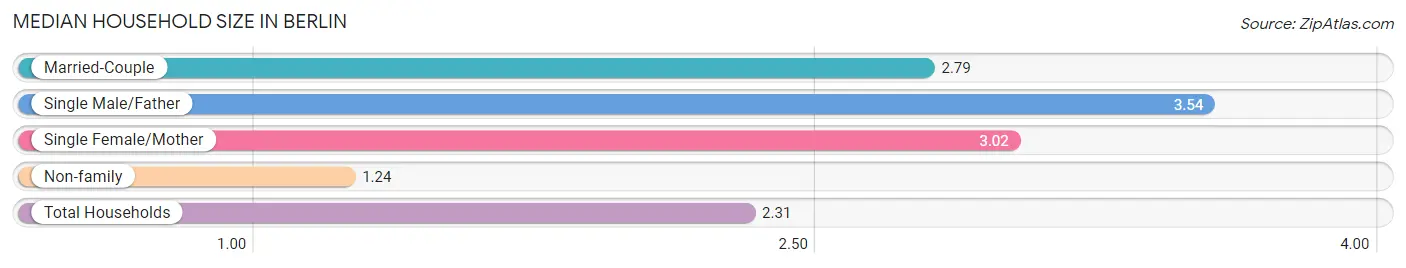
The median household size in Berlin is 2.31 persons per household, with single male/father households (202 | 8.6%) accounting for the largest median household size of 3.54 persons per household. non-family households (883 | 37.4%) represent the smallest median household size with 1.24 persons per household.
| Household Type | # Households | Household Size |
| Married-Couple | 902 (38.2%) | 2.79 |
| Single Male/Father | 202 (8.6%) | 3.54 |
| Single Female/Mother | 376 (15.9%) | 3.02 |
| Non-family | 883 (37.4%) | 1.24 |
| Total Households | 2,363 (100.0%) | 2.31 |
Household Size by Marriage Status in Berlin
Out of a total of 2,363 households in Berlin, 1,480 (62.6%) are family households, while 883 (37.4%) are nonfamily households. The most numerous type of family households are 2-person households, comprising 741, and the most common type of nonfamily households are 1-person households, comprising 706.
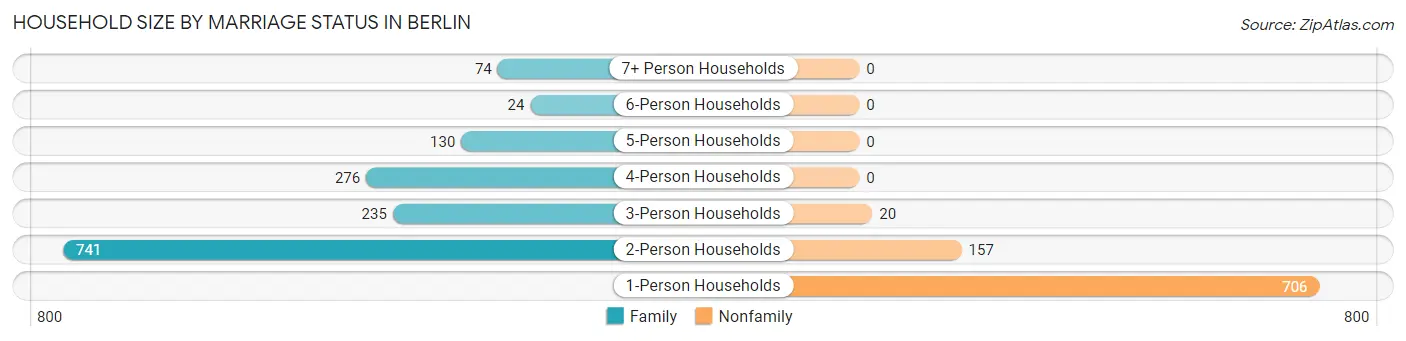
| Household Size | Family Households | Nonfamily Households |
| 1-Person Households | - | 706 (29.9%) |
| 2-Person Households | 741 (31.4%) | 157 (6.6%) |
| 3-Person Households | 235 (9.9%) | 20 (0.9%) |
| 4-Person Households | 276 (11.7%) | 0 (0.0%) |
| 5-Person Households | 130 (5.5%) | 0 (0.0%) |
| 6-Person Households | 24 (1.0%) | 0 (0.0%) |
| 7+ Person Households | 74 (3.1%) | 0 (0.0%) |
| Total | 1,480 (62.6%) | 883 (37.4%) |
Female Fertility in Berlin
Fertility by Age in Berlin
Average fertility rate in Berlin is 8.0 births per 1,000 women. Women in the age bracket of 20 to 34 years have the highest fertility rate with 17.0 births per 1,000 women. Women in the age bracket of 20 to 34 years acount for 100.0% of all women with births.
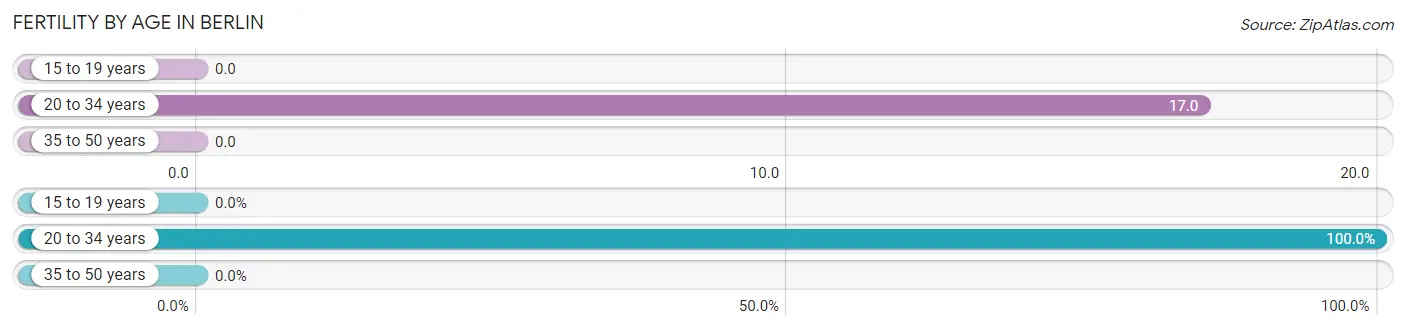
| Age Bracket | Women with Births | Births / 1,000 Women |
| 15 to 19 years | 0 (0.0%) | 0.0 |
| 20 to 34 years | 9 (100.0%) | 17.0 |
| 35 to 50 years | 0 (0.0%) | 0.0 |
| Total | 9 (100.0%) | 8.0 |
Fertility by Age by Marriage Status in Berlin
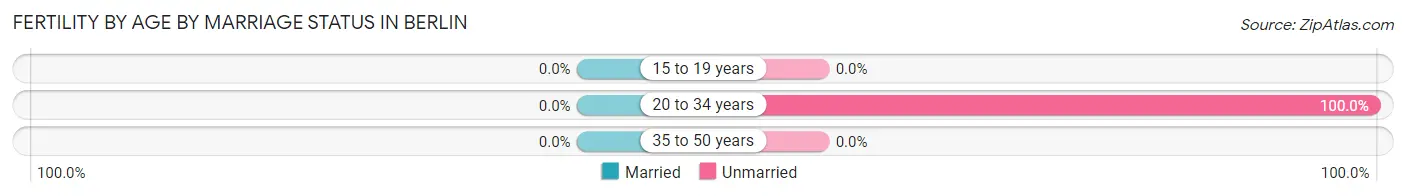
| Age Bracket | Married | Unmarried |
| 15 to 19 years | 0 (0.0%) | 0 (0.0%) |
| 20 to 34 years | 0 (0.0%) | 9 (100.0%) |
| 35 to 50 years | 0 (0.0%) | 0 (0.0%) |
| Total | 0 (0.0%) | 9 (100.0%) |
Fertility by Education in Berlin
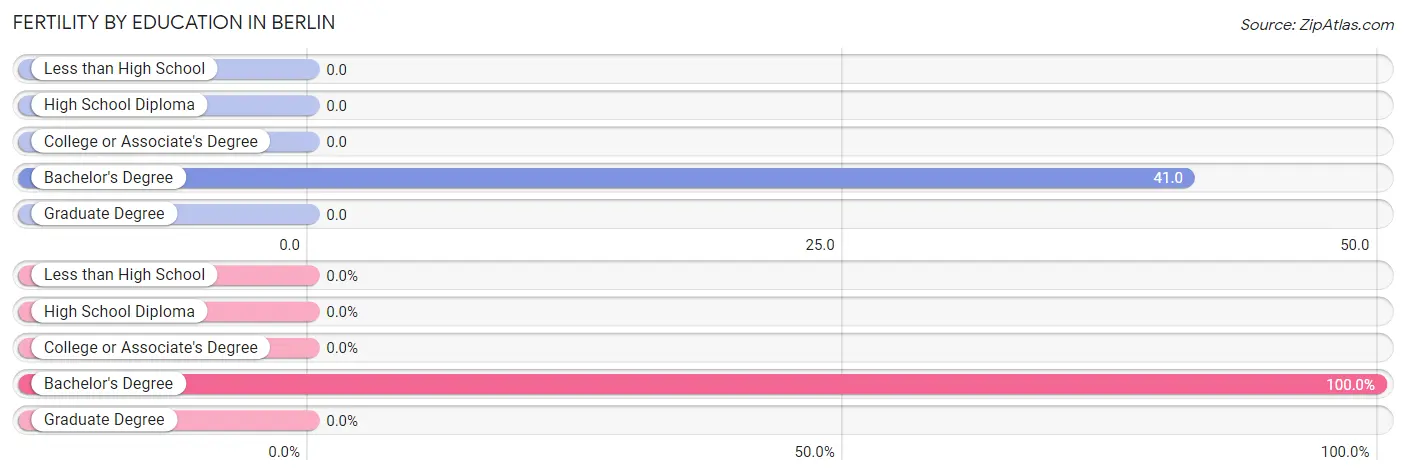
| Educational Attainment | Women with Births | Births / 1,000 Women |
| Less than High School | 0 (0.0%) | 0.0 |
| High School Diploma | 0 (0.0%) | 0.0 |
| College or Associate's Degree | 0 (0.0%) | 0.0 |
| Bachelor's Degree | 9 (100.0%) | 41.0 |
| Graduate Degree | 0 (0.0%) | 0.0 |
| Total | 9 (100.0%) | 8.0 |
Fertility by Education by Marriage Status in Berlin
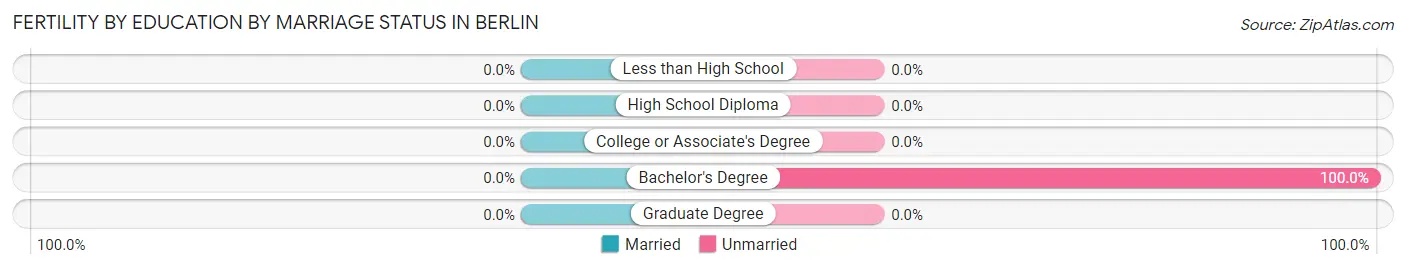
| Educational Attainment | Married | Unmarried |
| Less than High School | 0 (0.0%) | 0 (0.0%) |
| High School Diploma | 0 (0.0%) | 0 (0.0%) |
| College or Associate's Degree | 0 (0.0%) | 0 (0.0%) |
| Bachelor's Degree | 0 (0.0%) | 9 (100.0%) |
| Graduate Degree | 0 (0.0%) | 0 (0.0%) |
| Total | 0 (0.0%) | 9 (100.0%) |
Employment Characteristics in Berlin
Employment by Class of Employer in Berlin
Among the 2,568 employed individuals in Berlin, private company employees (1,840 | 71.7%), not-for-profit organizations (218 | 8.5%), and local government employees (192 | 7.5%) make up the most common classes of employment.
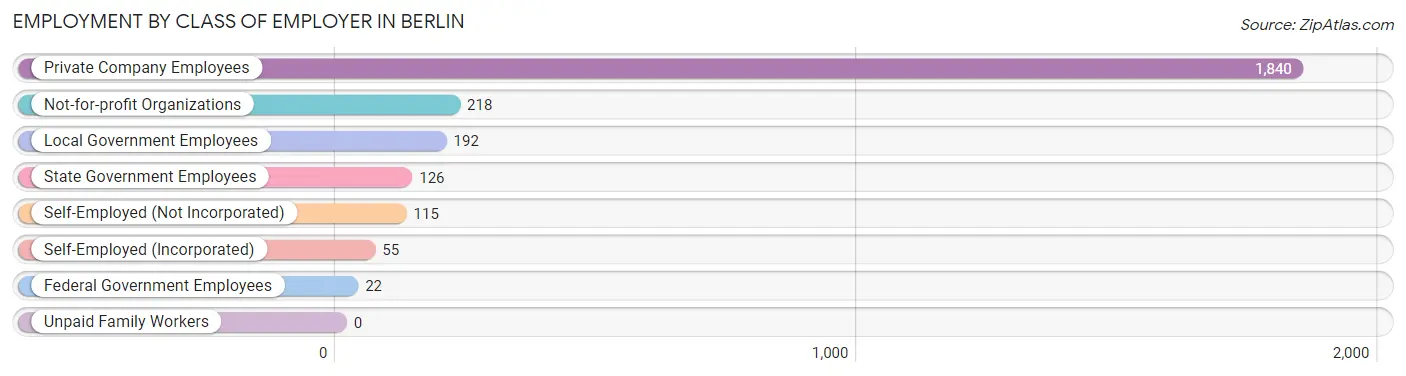
| Employer Class | # Employees | % Employees |
| Private Company Employees | 1,840 | 71.7% |
| Self-Employed (Incorporated) | 55 | 2.1% |
| Self-Employed (Not Incorporated) | 115 | 4.5% |
| Not-for-profit Organizations | 218 | 8.5% |
| Local Government Employees | 192 | 7.5% |
| State Government Employees | 126 | 4.9% |
| Federal Government Employees | 22 | 0.9% |
| Unpaid Family Workers | 0 | 0.0% |
| Total | 2,568 | 100.0% |
Employment Status by Age in Berlin
According to the labor force statistics for Berlin, out of the total population over 16 years of age (4,429), 61.3% or 2,715 individuals are in the labor force, with 3.3% or 90 of them unemployed. The age group with the highest labor force participation rate is 20 to 24 years, with 84.7% or 271 individuals in the labor force. Within the labor force, the 20 to 24 years age range has the highest percentage of unemployed individuals, with 12.9% or 35 of them being unemployed.
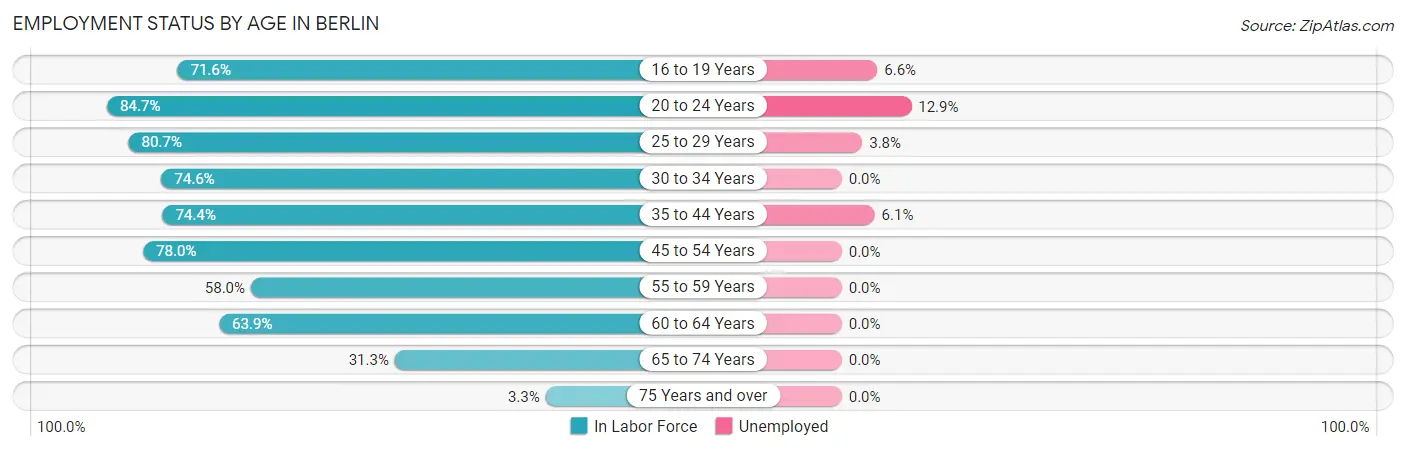
| Age Bracket | In Labor Force | Unemployed |
| 16 to 19 Years | 227 (71.6%) | 15 (6.6%) |
| 20 to 24 Years | 271 (84.7%) | 35 (12.9%) |
| 25 to 29 Years | 263 (80.7%) | 10 (3.8%) |
| 30 to 34 Years | 253 (74.6%) | 0 (0.0%) |
| 35 to 44 Years | 488 (74.4%) | 30 (6.1%) |
| 45 to 54 Years | 508 (78.0%) | 0 (0.0%) |
| 55 to 59 Years | 199 (58.0%) | 0 (0.0%) |
| 60 to 64 Years | 348 (63.9%) | 0 (0.0%) |
| 65 to 74 Years | 142 (31.3%) | 0 (0.0%) |
| 75 Years and over | 16 (3.3%) | 0 (0.0%) |
| Total | 2,715 (61.3%) | 90 (3.3%) |
Employment Status by Educational Attainment in Berlin
According to labor force statistics for Berlin, 72.0% of individuals (2,059) out of the total population between 25 and 64 years of age (2,860) are in the labor force, with 1.9% or 39 of them being unemployed. The group with the highest labor force participation rate are those with the educational attainment of bachelor's degree or higher, with 89.3% or 517 individuals in the labor force. Within the labor force, individuals with less than high school education have the highest percentage of unemployment, with 14.7% or 15 of them being unemployed.
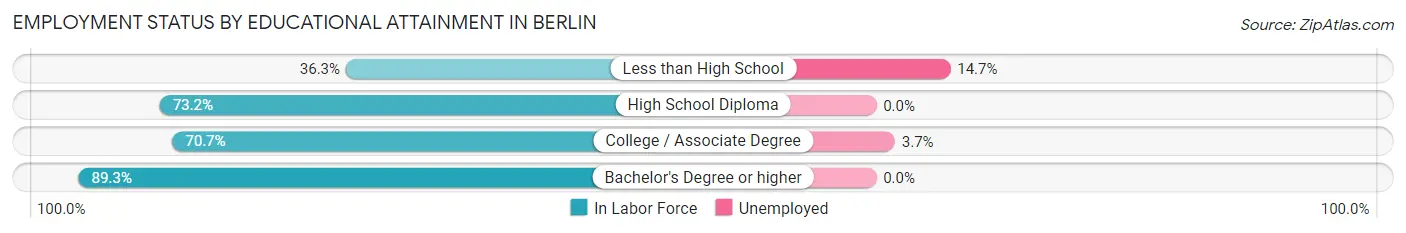
| Educational Attainment | In Labor Force | Unemployed |
| Less than High School | 102 (36.3%) | 41 (14.7%) |
| High School Diploma | 757 (73.2%) | 0 (0.0%) |
| College / Associate Degree | 683 (70.7%) | 36 (3.7%) |
| Bachelor's Degree or higher | 517 (89.3%) | 0 (0.0%) |
| Total | 2,059 (72.0%) | 54 (1.9%) |
Employment Occupations by Sex in Berlin
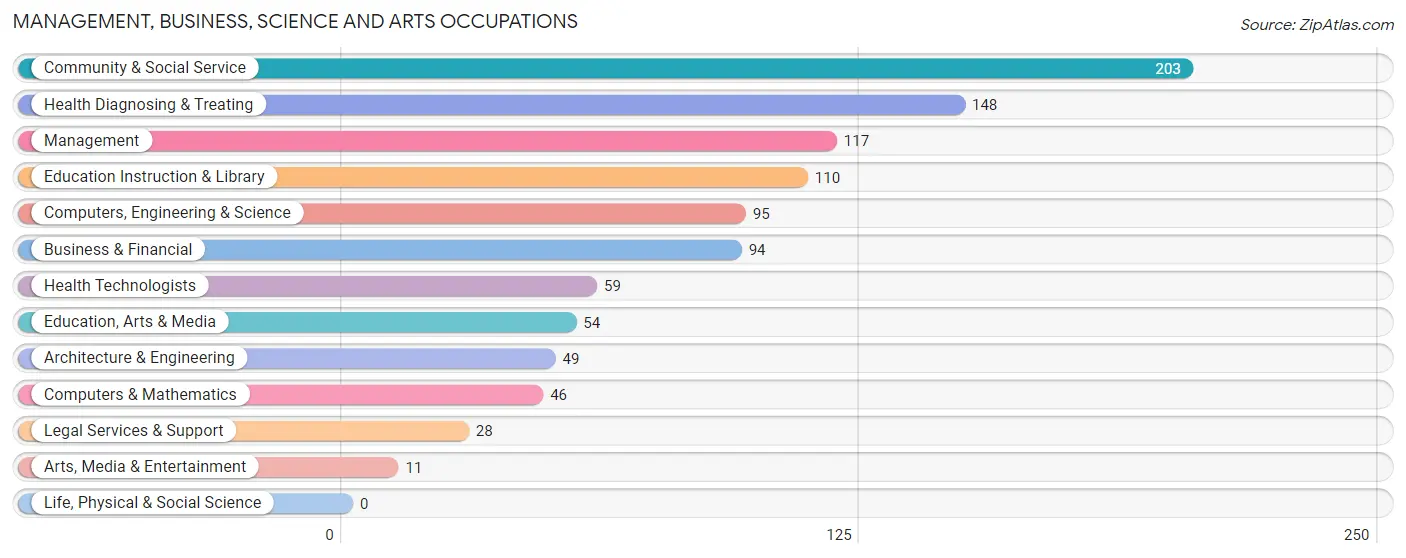
Management, Business, Science and Arts Occupations
The most common Management, Business, Science and Arts occupations in Berlin are Community & Social Service (203 | 7.7%), Health Diagnosing & Treating (148 | 5.6%), Management (117 | 4.5%), Education Instruction & Library (110 | 4.2%), and Computers, Engineering & Science (95 | 3.6%).
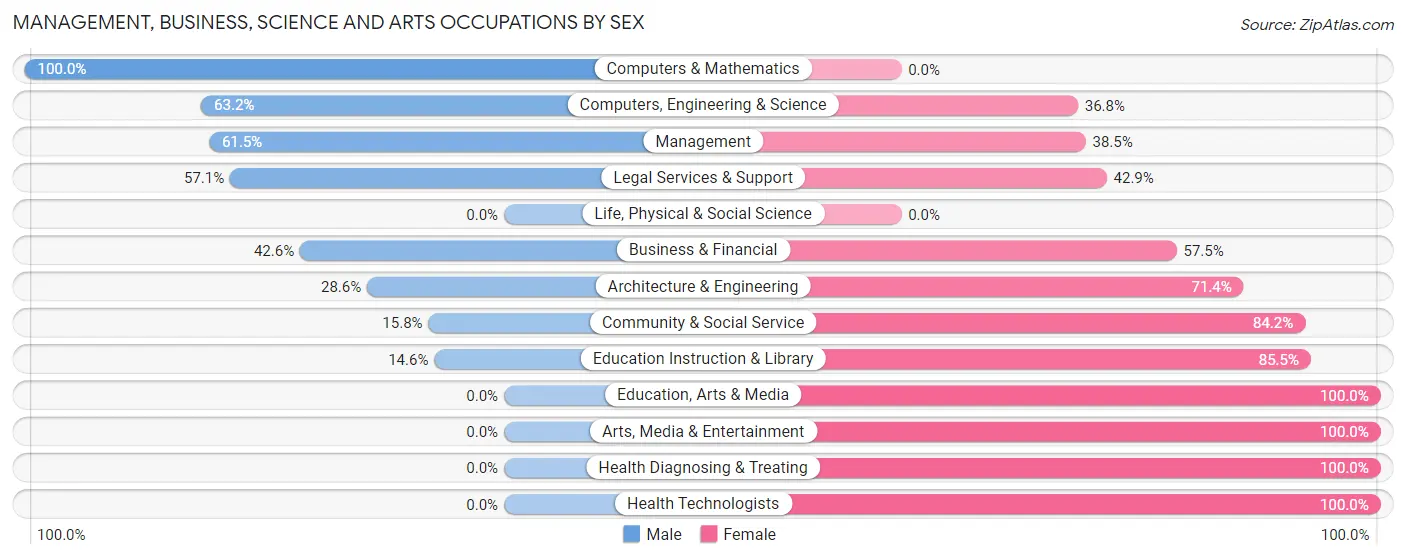
Management, Business, Science and Arts Occupations by Sex
Within the Management, Business, Science and Arts occupations in Berlin, the most male-oriented occupations are Computers & Mathematics (100.0%), Computers, Engineering & Science (63.2%), and Management (61.5%), while the most female-oriented occupations are Education, Arts & Media (100.0%), Arts, Media & Entertainment (100.0%), and Health Diagnosing & Treating (100.0%).
| Occupation | Male | Female |
| Management | 72 (61.5%) | 45 (38.5%) |
| Business & Financial | 40 (42.5%) | 54 (57.5%) |
| Computers, Engineering & Science | 60 (63.2%) | 35 (36.8%) |
| Computers & Mathematics | 46 (100.0%) | 0 (0.0%) |
| Architecture & Engineering | 14 (28.6%) | 35 (71.4%) |
| Life, Physical & Social Science | 0 (0.0%) | 0 (0.0%) |
| Community & Social Service | 32 (15.8%) | 171 (84.2%) |
| Education, Arts & Media | 0 (0.0%) | 54 (100.0%) |
| Legal Services & Support | 16 (57.1%) | 12 (42.9%) |
| Education Instruction & Library | 16 (14.5%) | 94 (85.5%) |
| Arts, Media & Entertainment | 0 (0.0%) | 11 (100.0%) |
| Health Diagnosing & Treating | 0 (0.0%) | 148 (100.0%) |
| Health Technologists | 0 (0.0%) | 59 (100.0%) |
| Total (Category) | 204 (31.0%) | 453 (69.0%) |
| Total (Overall) | 1,389 (52.9%) | 1,236 (47.1%) |
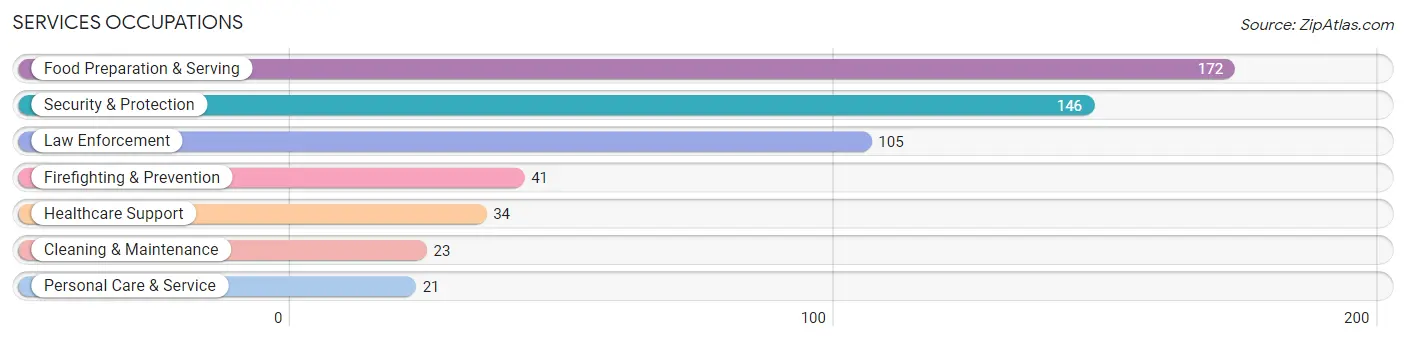
Services Occupations
The most common Services occupations in Berlin are Food Preparation & Serving (172 | 6.6%), Security & Protection (146 | 5.6%), Law Enforcement (105 | 4.0%), Firefighting & Prevention (41 | 1.6%), and Healthcare Support (34 | 1.3%).
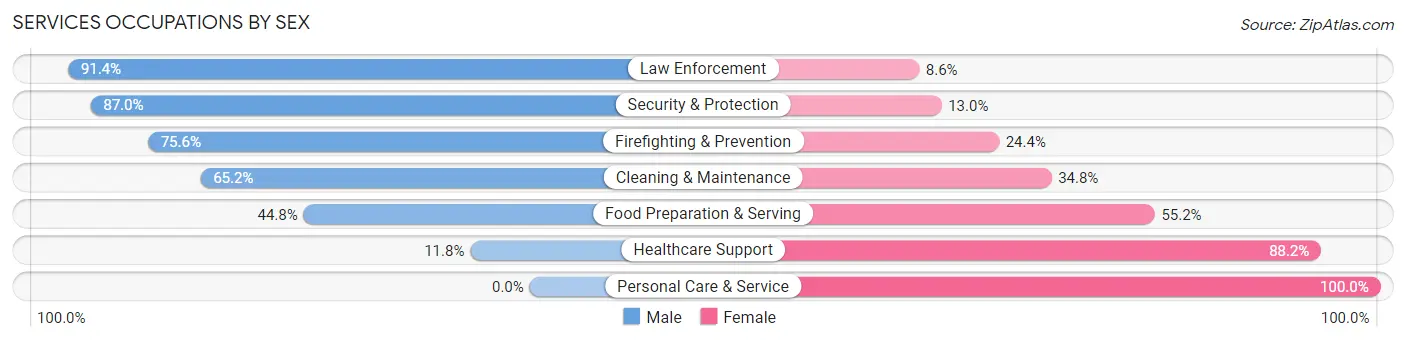
Services Occupations by Sex
Within the Services occupations in Berlin, the most male-oriented occupations are Law Enforcement (91.4%), Security & Protection (87.0%), and Firefighting & Prevention (75.6%), while the most female-oriented occupations are Personal Care & Service (100.0%), Healthcare Support (88.2%), and Food Preparation & Serving (55.2%).
| Occupation | Male | Female |
| Healthcare Support | 4 (11.8%) | 30 (88.2%) |
| Security & Protection | 127 (87.0%) | 19 (13.0%) |
| Firefighting & Prevention | 31 (75.6%) | 10 (24.4%) |
| Law Enforcement | 96 (91.4%) | 9 (8.6%) |
| Food Preparation & Serving | 77 (44.8%) | 95 (55.2%) |
| Cleaning & Maintenance | 15 (65.2%) | 8 (34.8%) |
| Personal Care & Service | 0 (0.0%) | 21 (100.0%) |
| Total (Category) | 223 (56.3%) | 173 (43.7%) |
| Total (Overall) | 1,389 (52.9%) | 1,236 (47.1%) |
Sales and Office Occupations
The most common Sales and Office occupations in Berlin are Sales & Related (354 | 13.5%), and Office & Administration (222 | 8.5%).
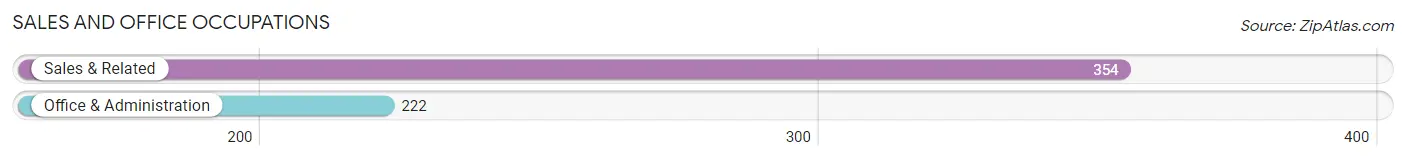
Sales and Office Occupations by Sex

| Occupation | Male | Female |
| Sales & Related | 59 (16.7%) | 295 (83.3%) |
| Office & Administration | 80 (36.0%) | 142 (64.0%) |
| Total (Category) | 139 (24.1%) | 437 (75.9%) |
| Total (Overall) | 1,389 (52.9%) | 1,236 (47.1%) |
Natural Resources, Construction and Maintenance Occupations
The most common Natural Resources, Construction and Maintenance occupations in Berlin are Construction & Extraction (144 | 5.5%), Installation, Maintenance & Repair (126 | 4.8%), and Farming, Fishing & Forestry (3 | 0.1%).
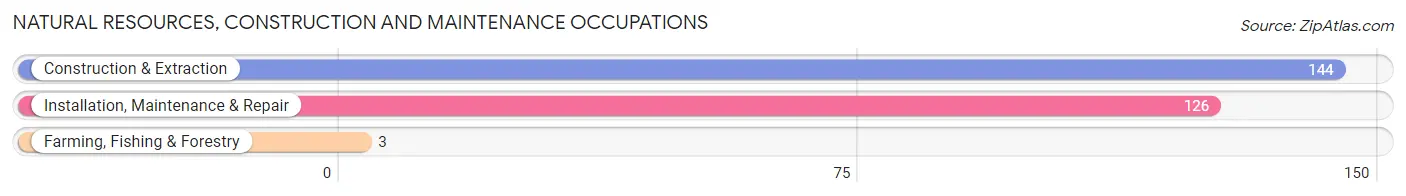
Natural Resources, Construction and Maintenance Occupations by Sex
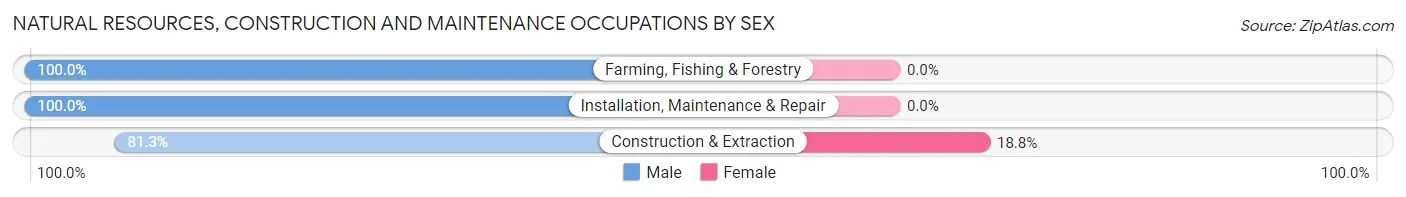
| Occupation | Male | Female |
| Farming, Fishing & Forestry | 3 (100.0%) | 0 (0.0%) |
| Construction & Extraction | 117 (81.2%) | 27 (18.8%) |
| Installation, Maintenance & Repair | 126 (100.0%) | 0 (0.0%) |
| Total (Category) | 246 (90.1%) | 27 (9.9%) |
| Total (Overall) | 1,389 (52.9%) | 1,236 (47.1%) |
Production, Transportation and Moving Occupations
The most common Production, Transportation and Moving occupations in Berlin are Production (417 | 15.9%), Material Moving (257 | 9.8%), and Transportation (49 | 1.9%).
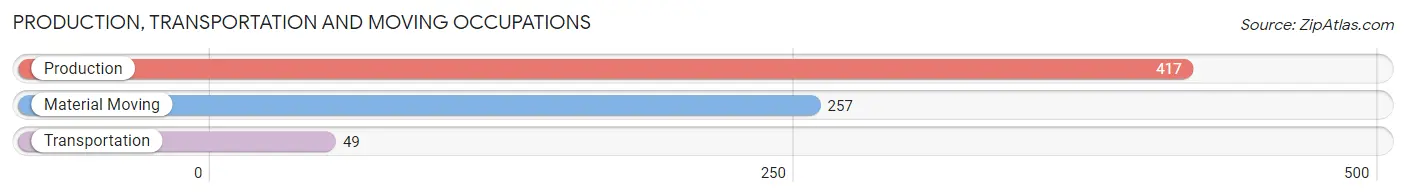
Production, Transportation and Moving Occupations by Sex
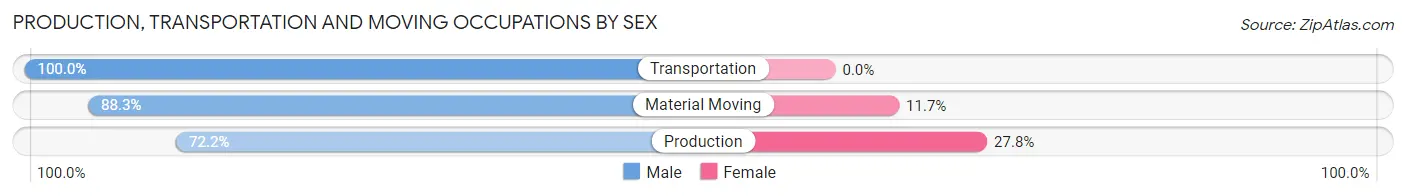
| Occupation | Male | Female |
| Production | 301 (72.2%) | 116 (27.8%) |
| Transportation | 49 (100.0%) | 0 (0.0%) |
| Material Moving | 227 (88.3%) | 30 (11.7%) |
| Total (Category) | 577 (79.8%) | 146 (20.2%) |
| Total (Overall) | 1,389 (52.9%) | 1,236 (47.1%) |
Employment Industries by Sex in Berlin
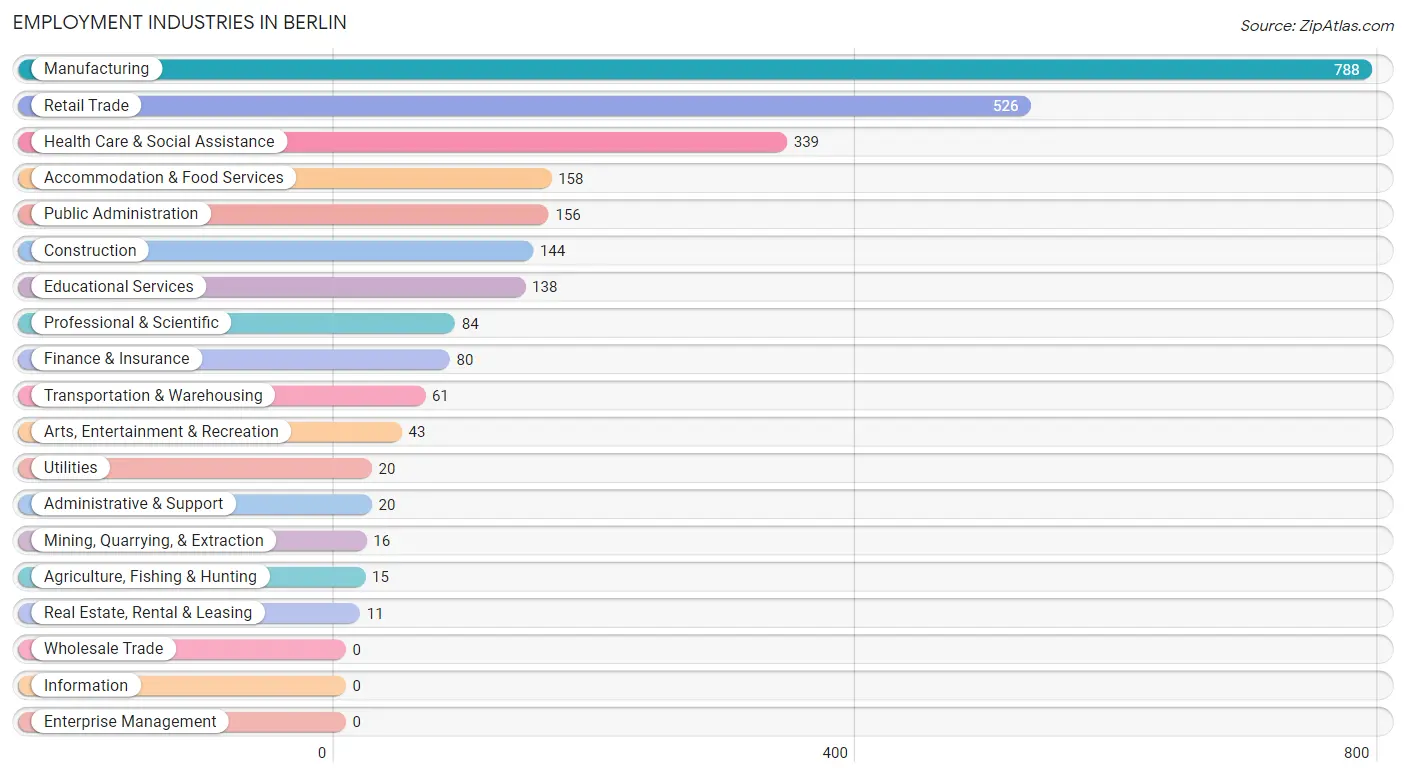
Employment Industries in Berlin
The major employment industries in Berlin include Manufacturing (788 | 30.0%), Retail Trade (526 | 20.0%), Health Care & Social Assistance (339 | 12.9%), Accommodation & Food Services (158 | 6.0%), and Public Administration (156 | 5.9%).
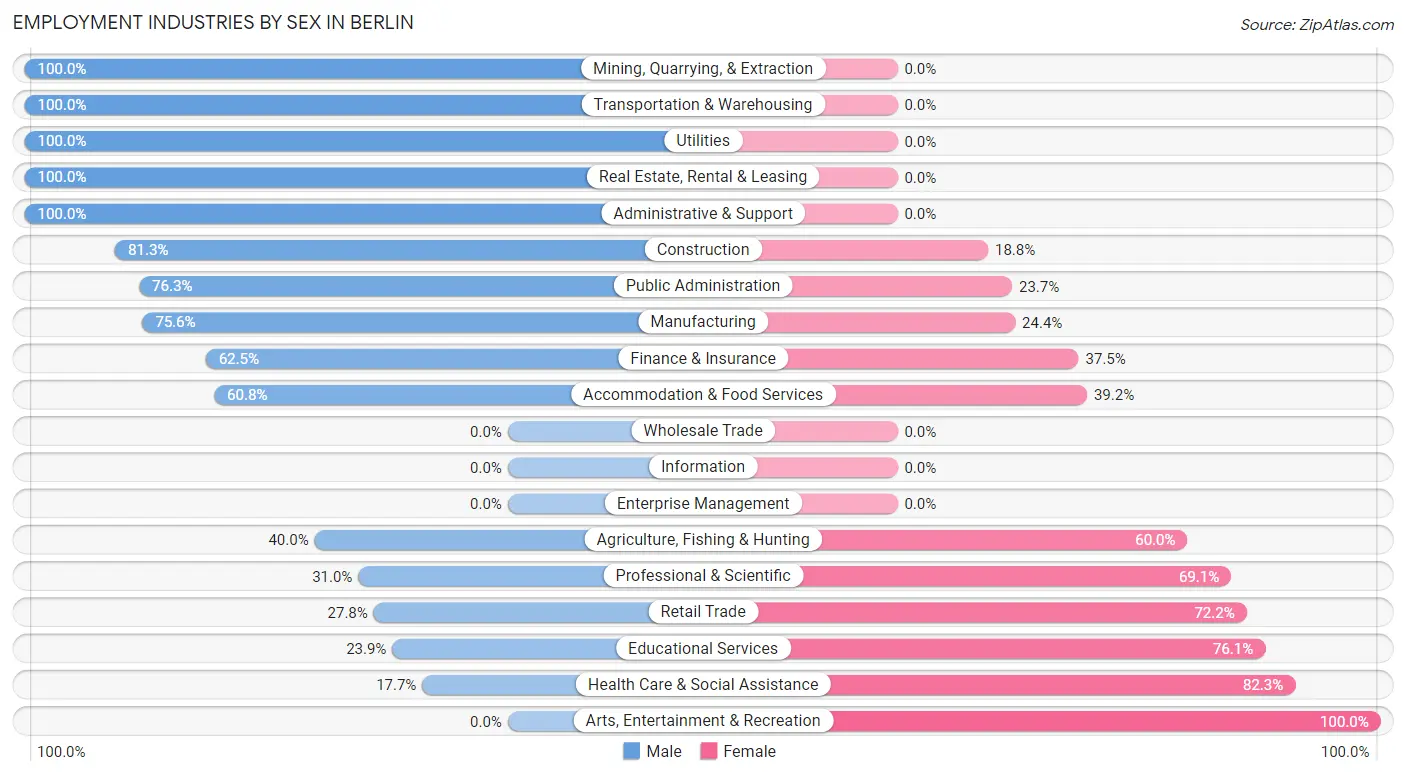
Employment Industries by Sex in Berlin
The Berlin industries that see more men than women are Mining, Quarrying, & Extraction (100.0%), Transportation & Warehousing (100.0%), and Utilities (100.0%), whereas the industries that tend to have a higher number of women are Arts, Entertainment & Recreation (100.0%), Health Care & Social Assistance (82.3%), and Educational Services (76.1%).
| Industry | Male | Female |
| Agriculture, Fishing & Hunting | 6 (40.0%) | 9 (60.0%) |
| Mining, Quarrying, & Extraction | 16 (100.0%) | 0 (0.0%) |
| Construction | 117 (81.2%) | 27 (18.8%) |
| Manufacturing | 596 (75.6%) | 192 (24.4%) |
| Wholesale Trade | 0 (0.0%) | 0 (0.0%) |
| Retail Trade | 146 (27.8%) | 380 (72.2%) |
| Transportation & Warehousing | 61 (100.0%) | 0 (0.0%) |
| Utilities | 20 (100.0%) | 0 (0.0%) |
| Information | 0 (0.0%) | 0 (0.0%) |
| Finance & Insurance | 50 (62.5%) | 30 (37.5%) |
| Real Estate, Rental & Leasing | 11 (100.0%) | 0 (0.0%) |
| Professional & Scientific | 26 (30.9%) | 58 (69.1%) |
| Enterprise Management | 0 (0.0%) | 0 (0.0%) |
| Administrative & Support | 20 (100.0%) | 0 (0.0%) |
| Educational Services | 33 (23.9%) | 105 (76.1%) |
| Health Care & Social Assistance | 60 (17.7%) | 279 (82.3%) |
| Arts, Entertainment & Recreation | 0 (0.0%) | 43 (100.0%) |
| Accommodation & Food Services | 96 (60.8%) | 62 (39.2%) |
| Public Administration | 119 (76.3%) | 37 (23.7%) |
| Total | 1,389 (52.9%) | 1,236 (47.1%) |
Education in Berlin
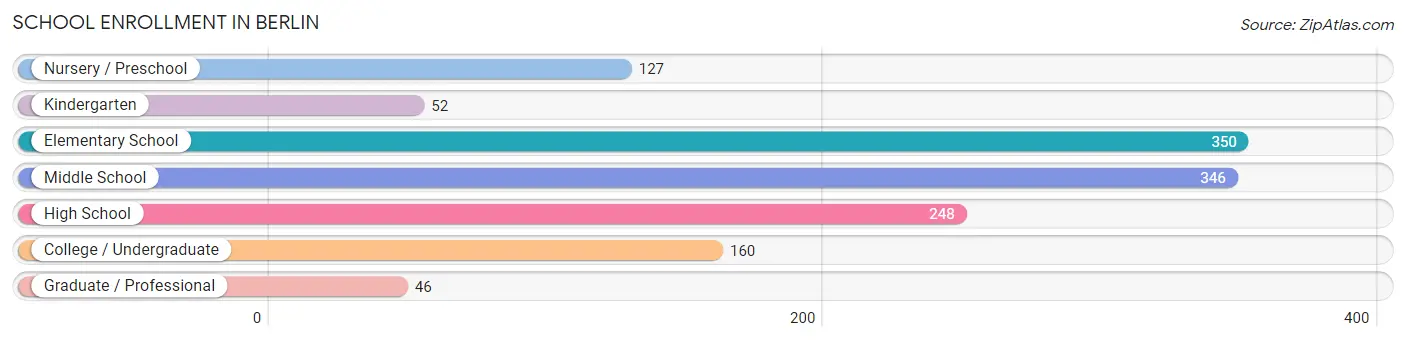
School Enrollment in Berlin
The most common levels of schooling among the 1,329 students in Berlin are elementary school (350 | 26.3%), middle school (346 | 26.0%), and high school (248 | 18.7%).
| School Level | # Students | % Students |
| Nursery / Preschool | 127 | 9.6% |
| Kindergarten | 52 | 3.9% |
| Elementary School | 350 | 26.3% |
| Middle School | 346 | 26.0% |
| High School | 248 | 18.7% |
| College / Undergraduate | 160 | 12.0% |
| Graduate / Professional | 46 | 3.5% |
| Total | 1,329 | 100.0% |
School Enrollment by Age by Funding Source in Berlin
Out of a total of 1,329 students who are enrolled in schools in Berlin, 70 (5.3%) attend a private institution, while the remaining 1,259 (94.7%) are enrolled in public schools. The age group of 5 to 9 year old has the highest likelihood of being enrolled in private schools, with 38 (10.2% in the age bracket) enrolled. Conversely, the age group of 3 to 4 year olds has the lowest likelihood of being enrolled in a private school, with 103 (100.0% in the age bracket) attending a public institution.
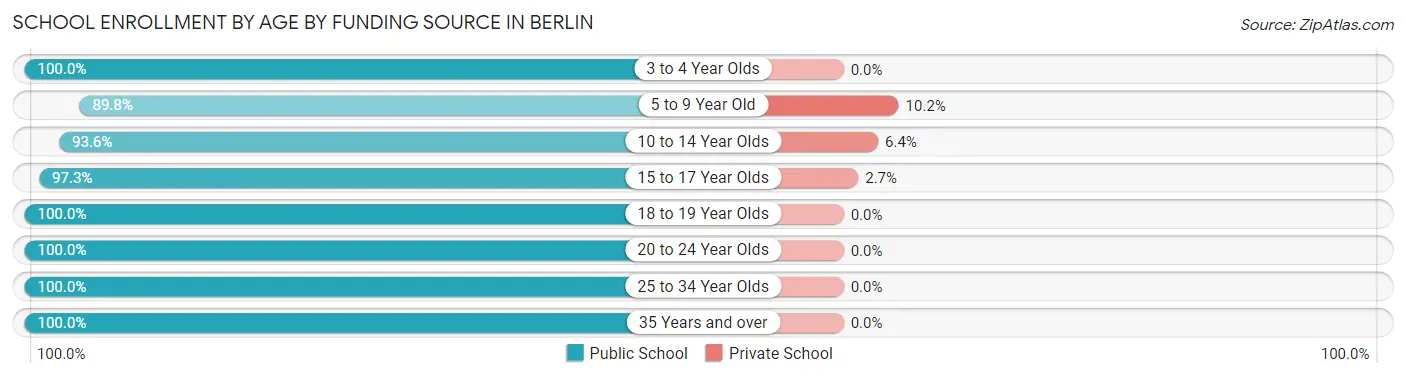
| Age Bracket | Public School | Private School |
| 3 to 4 Year Olds | 103 (100.0%) | 0 (0.0%) |
| 5 to 9 Year Old | 333 (89.8%) | 38 (10.2%) |
| 10 to 14 Year Olds | 408 (93.6%) | 28 (6.4%) |
| 15 to 17 Year Olds | 179 (97.3%) | 5 (2.7%) |
| 18 to 19 Year Olds | 39 (100.0%) | 0 (0.0%) |
| 20 to 24 Year Olds | 95 (100.0%) | 0 (0.0%) |
| 25 to 34 Year Olds | 49 (100.0%) | 0 (0.0%) |
| 35 Years and over | 52 (100.0%) | 0 (0.0%) |
| Total | 1,259 (94.7%) | 70 (5.3%) |
Educational Attainment by Field of Study in Berlin
Education (190 | 23.7%), science & technology (100 | 12.5%), business (86 | 10.7%), bio, nature & agricultural (79 | 9.9%), and psychology (76 | 9.5%) are the most common fields of study among 800 individuals in Berlin who have obtained a bachelor's degree or higher.
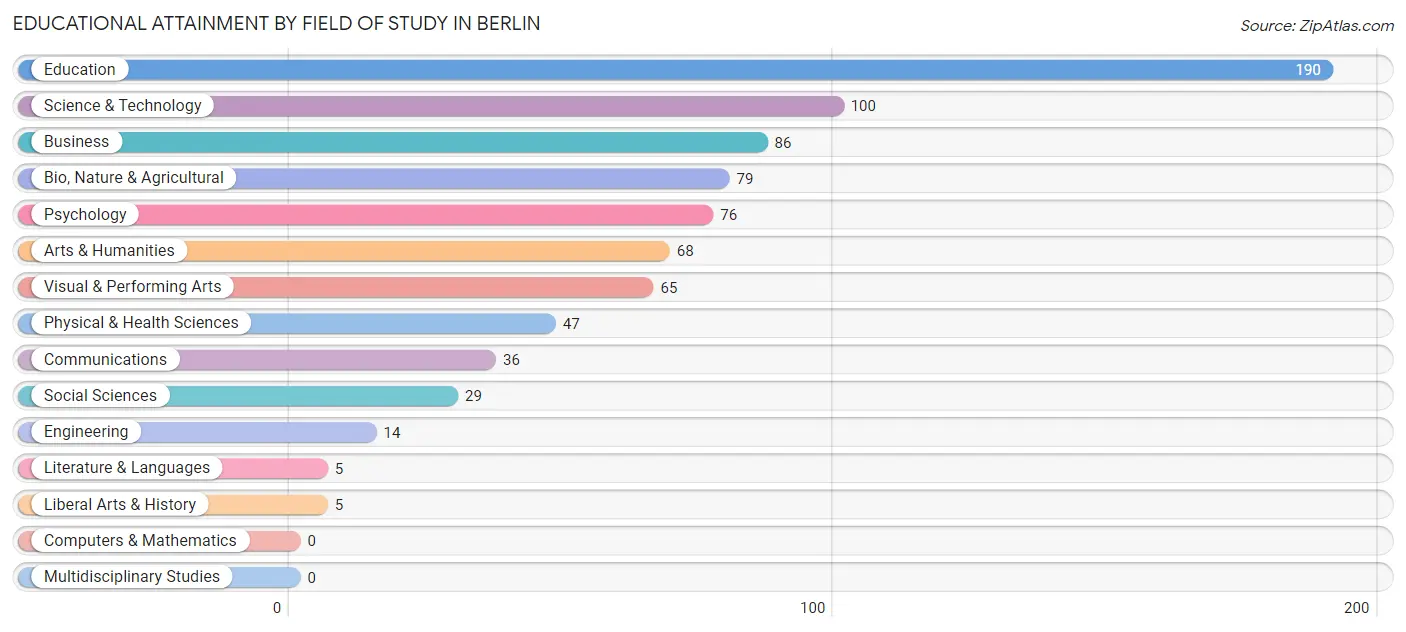
| Field of Study | # Graduates | % Graduates |
| Computers & Mathematics | 0 | 0.0% |
| Bio, Nature & Agricultural | 79 | 9.9% |
| Physical & Health Sciences | 47 | 5.9% |
| Psychology | 76 | 9.5% |
| Social Sciences | 29 | 3.6% |
| Engineering | 14 | 1.8% |
| Multidisciplinary Studies | 0 | 0.0% |
| Science & Technology | 100 | 12.5% |
| Business | 86 | 10.7% |
| Education | 190 | 23.7% |
| Literature & Languages | 5 | 0.6% |
| Liberal Arts & History | 5 | 0.6% |
| Visual & Performing Arts | 65 | 8.1% |
| Communications | 36 | 4.5% |
| Arts & Humanities | 68 | 8.5% |
| Total | 800 | 100.0% |
Transportation & Commute in Berlin
Vehicle Availability by Sex in Berlin
The most prevalent vehicle ownership categories in Berlin are males with 2 vehicles (655, accounting for 47.2%) and females with 2 vehicles (562, making up 56.2%).
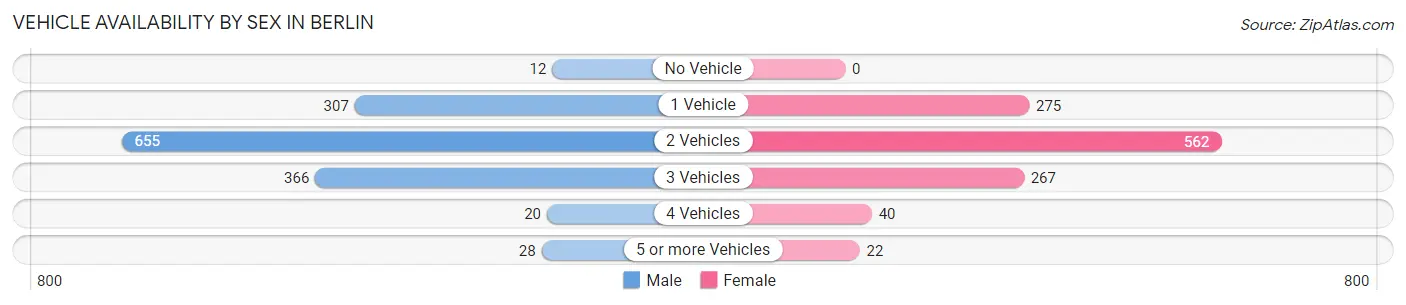
| Vehicles Available | Male | Female |
| No Vehicle | 12 (0.9%) | 0 (0.0%) |
| 1 Vehicle | 307 (22.1%) | 275 (23.6%) |
| 2 Vehicles | 655 (47.2%) | 562 (48.2%) |
| 3 Vehicles | 366 (26.4%) | 267 (22.9%) |
| 4 Vehicles | 20 (1.4%) | 40 (3.4%) |
| 5 or more Vehicles | 28 (2.0%) | 22 (1.9%) |
| Total | 1,388 (100.0%) | 1,166 (100.0%) |
Commute Time in Berlin
The most frequently occuring commute durations in Berlin are 5 to 9 minutes (491 commuters, 19.9%), 20 to 24 minutes (413 commuters, 16.7%), and less than 5 minutes (326 commuters, 13.2%).
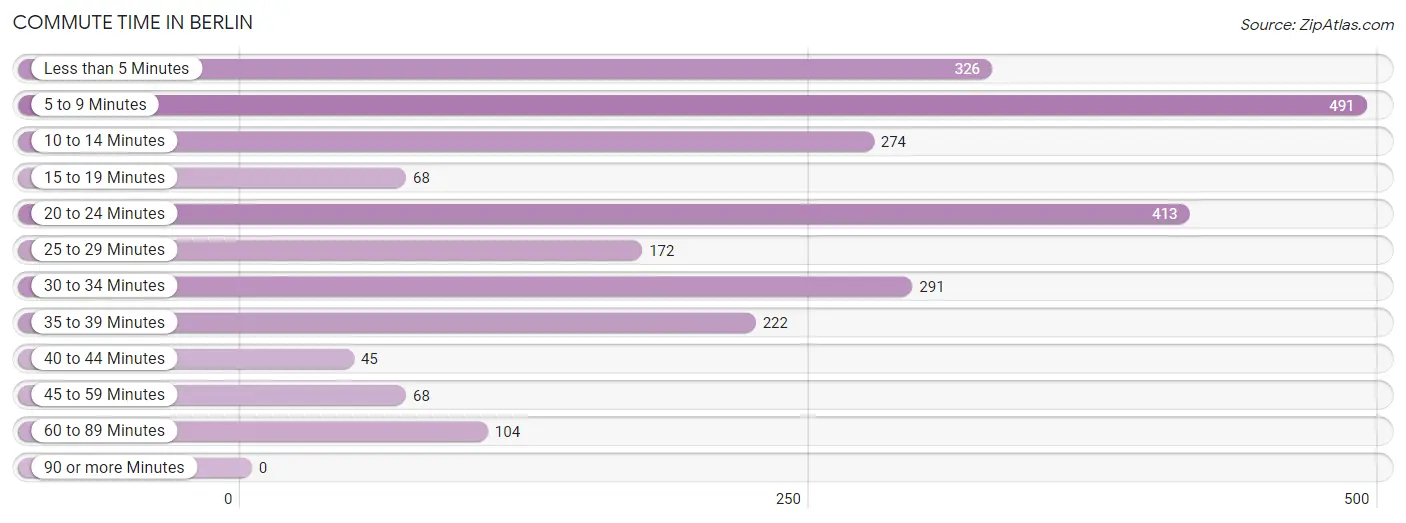
| Commute Time | # Commuters | % Commuters |
| Less than 5 Minutes | 326 | 13.2% |
| 5 to 9 Minutes | 491 | 19.9% |
| 10 to 14 Minutes | 274 | 11.1% |
| 15 to 19 Minutes | 68 | 2.8% |
| 20 to 24 Minutes | 413 | 16.7% |
| 25 to 29 Minutes | 172 | 7.0% |
| 30 to 34 Minutes | 291 | 11.8% |
| 35 to 39 Minutes | 222 | 9.0% |
| 40 to 44 Minutes | 45 | 1.8% |
| 45 to 59 Minutes | 68 | 2.8% |
| 60 to 89 Minutes | 104 | 4.2% |
| 90 or more Minutes | 0 | 0.0% |
Commute Time by Sex in Berlin
The most common commute times in Berlin are 20 to 24 minutes (260 commuters, 19.3%) for males and 5 to 9 minutes (300 commuters, 26.6%) for females.
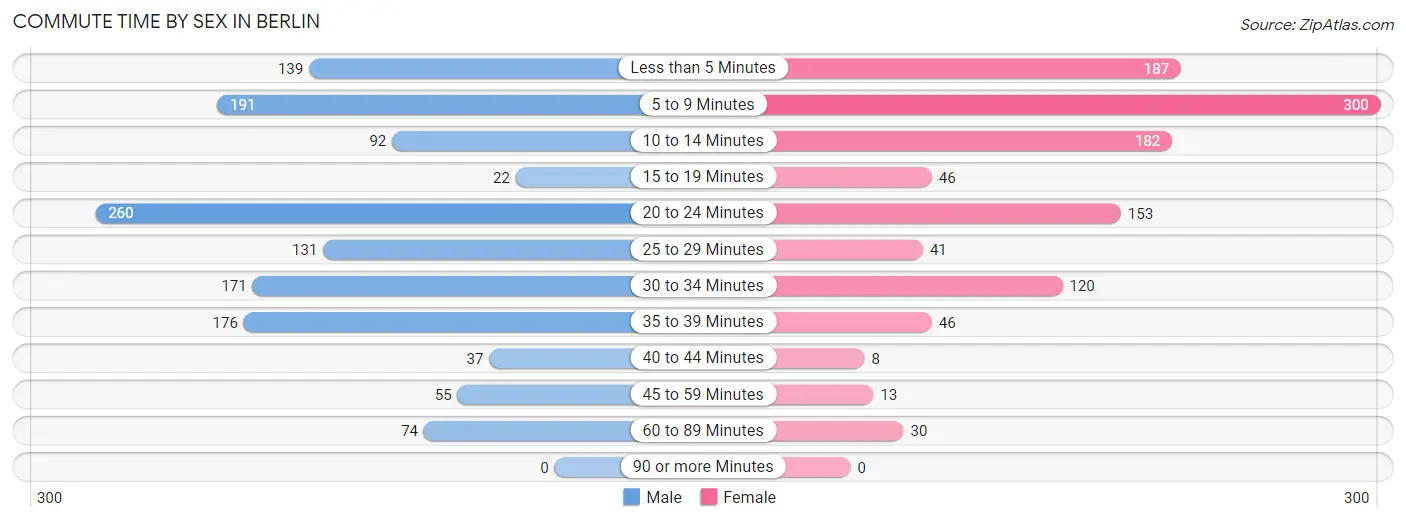
| Commute Time | Male | Female |
| Less than 5 Minutes | 139 (10.3%) | 187 (16.6%) |
| 5 to 9 Minutes | 191 (14.2%) | 300 (26.6%) |
| 10 to 14 Minutes | 92 (6.8%) | 182 (16.2%) |
| 15 to 19 Minutes | 22 (1.6%) | 46 (4.1%) |
| 20 to 24 Minutes | 260 (19.3%) | 153 (13.6%) |
| 25 to 29 Minutes | 131 (9.7%) | 41 (3.6%) |
| 30 to 34 Minutes | 171 (12.7%) | 120 (10.7%) |
| 35 to 39 Minutes | 176 (13.1%) | 46 (4.1%) |
| 40 to 44 Minutes | 37 (2.7%) | 8 (0.7%) |
| 45 to 59 Minutes | 55 (4.1%) | 13 (1.1%) |
| 60 to 89 Minutes | 74 (5.5%) | 30 (2.7%) |
| 90 or more Minutes | 0 (0.0%) | 0 (0.0%) |
Time of Departure to Work by Sex in Berlin
The most frequent times of departure to work in Berlin are 6:00 AM to 6:29 AM (223, 16.5%) for males and 7:30 AM to 7:59 AM (276, 24.5%) for females.
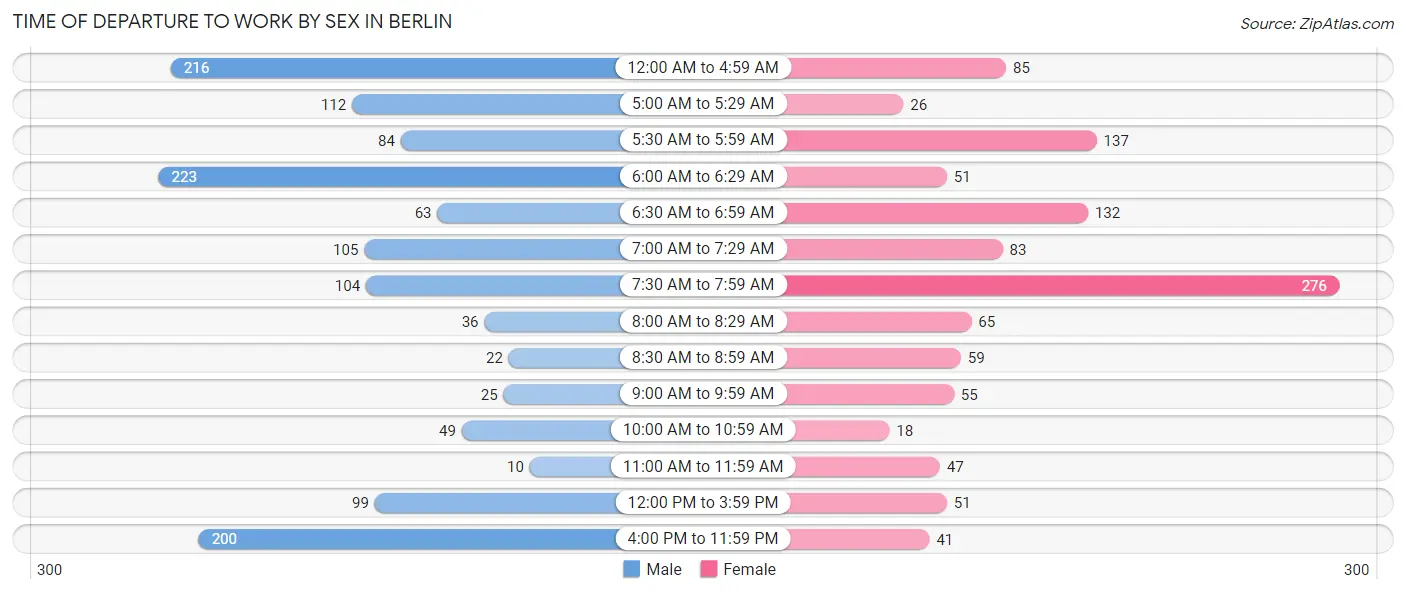
| Time of Departure | Male | Female |
| 12:00 AM to 4:59 AM | 216 (16.0%) | 85 (7.5%) |
| 5:00 AM to 5:29 AM | 112 (8.3%) | 26 (2.3%) |
| 5:30 AM to 5:59 AM | 84 (6.2%) | 137 (12.2%) |
| 6:00 AM to 6:29 AM | 223 (16.5%) | 51 (4.5%) |
| 6:30 AM to 6:59 AM | 63 (4.7%) | 132 (11.7%) |
| 7:00 AM to 7:29 AM | 105 (7.8%) | 83 (7.4%) |
| 7:30 AM to 7:59 AM | 104 (7.7%) | 276 (24.5%) |
| 8:00 AM to 8:29 AM | 36 (2.7%) | 65 (5.8%) |
| 8:30 AM to 8:59 AM | 22 (1.6%) | 59 (5.2%) |
| 9:00 AM to 9:59 AM | 25 (1.8%) | 55 (4.9%) |
| 10:00 AM to 10:59 AM | 49 (3.6%) | 18 (1.6%) |
| 11:00 AM to 11:59 AM | 10 (0.7%) | 47 (4.2%) |
| 12:00 PM to 3:59 PM | 99 (7.3%) | 51 (4.5%) |
| 4:00 PM to 11:59 PM | 200 (14.8%) | 41 (3.6%) |
| Total | 1,348 (100.0%) | 1,126 (100.0%) |
Housing Occupancy in Berlin
Occupancy by Ownership in Berlin
Of the total 2,363 dwellings in Berlin, owner-occupied units account for 1,510 (63.9%), while renter-occupied units make up 853 (36.1%).
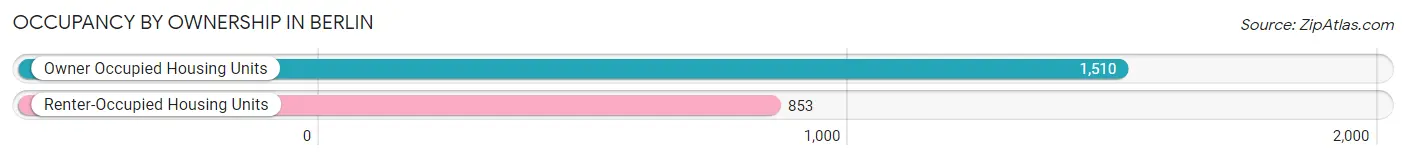
| Occupancy | # Housing Units | % Housing Units |
| Owner Occupied Housing Units | 1,510 | 63.9% |
| Renter-Occupied Housing Units | 853 | 36.1% |
| Total Occupied Housing Units | 2,363 | 100.0% |
Occupancy by Household Size in Berlin
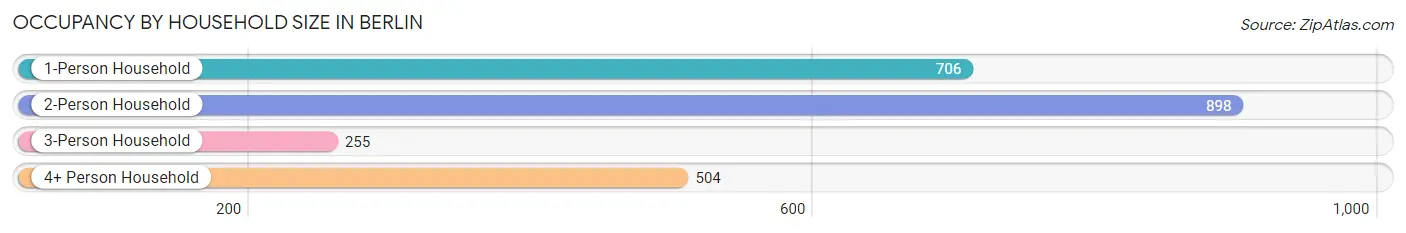
| Household Size | # Housing Units | % Housing Units |
| 1-Person Household | 706 | 29.9% |
| 2-Person Household | 898 | 38.0% |
| 3-Person Household | 255 | 10.8% |
| 4+ Person Household | 504 | 21.3% |
| Total Housing Units | 2,363 | 100.0% |
Occupancy by Ownership by Household Size in Berlin
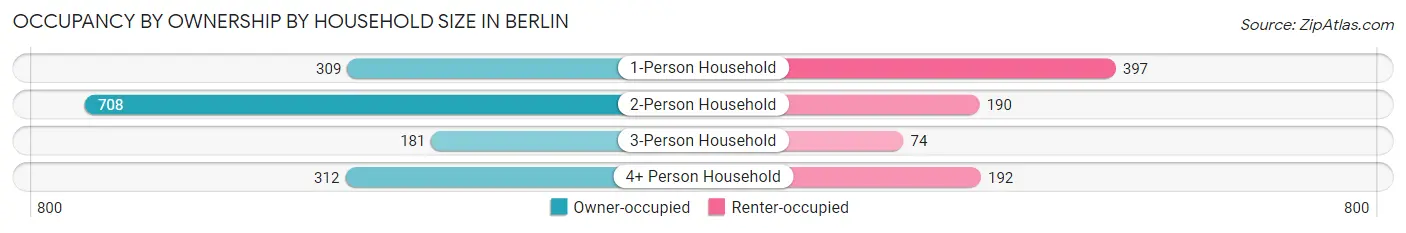
| Household Size | Owner-occupied | Renter-occupied |
| 1-Person Household | 309 (43.8%) | 397 (56.2%) |
| 2-Person Household | 708 (78.8%) | 190 (21.2%) |
| 3-Person Household | 181 (71.0%) | 74 (29.0%) |
| 4+ Person Household | 312 (61.9%) | 192 (38.1%) |
| Total Housing Units | 1,510 (63.9%) | 853 (36.1%) |
Occupancy by Educational Attainment in Berlin
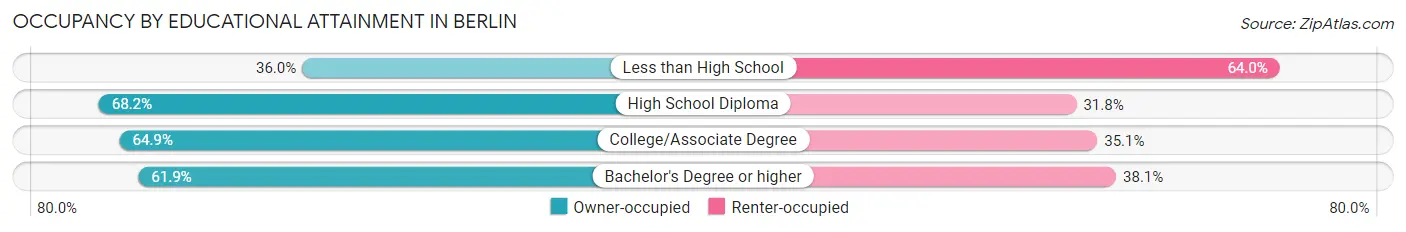
| Household Size | Owner-occupied | Renter-occupied |
| Less than High School | 54 (36.0%) | 96 (64.0%) |
| High School Diploma | 683 (68.2%) | 318 (31.8%) |
| College/Associate Degree | 485 (64.9%) | 262 (35.1%) |
| Bachelor's Degree or higher | 288 (61.9%) | 177 (38.1%) |
Occupancy by Age of Householder in Berlin
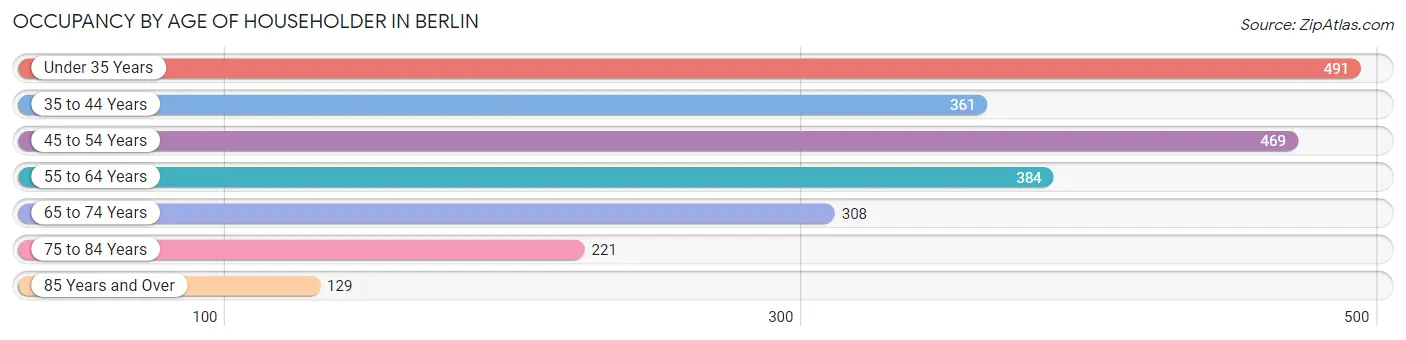
| Age Bracket | # Households | % Households |
| Under 35 Years | 491 | 20.8% |
| 35 to 44 Years | 361 | 15.3% |
| 45 to 54 Years | 469 | 19.9% |
| 55 to 64 Years | 384 | 16.3% |
| 65 to 74 Years | 308 | 13.0% |
| 75 to 84 Years | 221 | 9.3% |
| 85 Years and Over | 129 | 5.5% |
| Total | 2,363 | 100.0% |
Housing Finances in Berlin
Median Income by Occupancy in Berlin
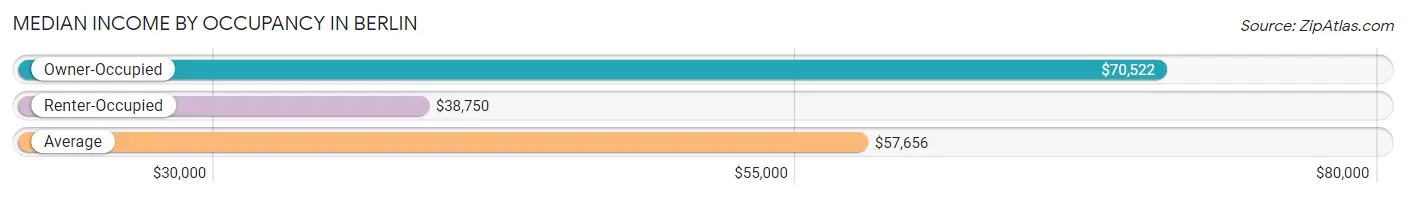
| Occupancy Type | # Households | Median Income |
| Owner-Occupied | 1,510 (63.9%) | $70,522 |
| Renter-Occupied | 853 (36.1%) | $38,750 |
| Average | 2,363 (100.0%) | $57,656 |
Occupancy by Householder Income Bracket in Berlin
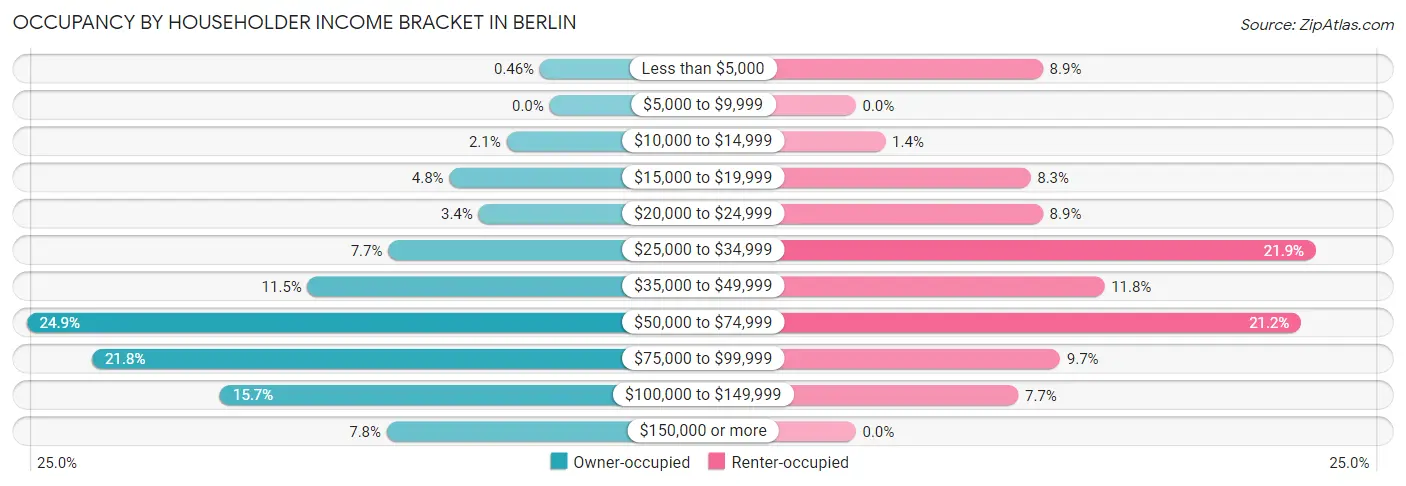
| Income Bracket | Owner-occupied | Renter-occupied |
| Less than $5,000 | 7 (0.5%) | 76 (8.9%) |
| $5,000 to $9,999 | 0 (0.0%) | 0 (0.0%) |
| $10,000 to $14,999 | 31 (2.1%) | 12 (1.4%) |
| $15,000 to $19,999 | 72 (4.8%) | 71 (8.3%) |
| $20,000 to $24,999 | 51 (3.4%) | 76 (8.9%) |
| $25,000 to $34,999 | 116 (7.7%) | 187 (21.9%) |
| $35,000 to $49,999 | 174 (11.5%) | 101 (11.8%) |
| $50,000 to $74,999 | 376 (24.9%) | 181 (21.2%) |
| $75,000 to $99,999 | 329 (21.8%) | 83 (9.7%) |
| $100,000 to $149,999 | 237 (15.7%) | 66 (7.7%) |
| $150,000 or more | 117 (7.7%) | 0 (0.0%) |
| Total | 1,510 (100.0%) | 853 (100.0%) |
Monthly Housing Cost Tiers in Berlin
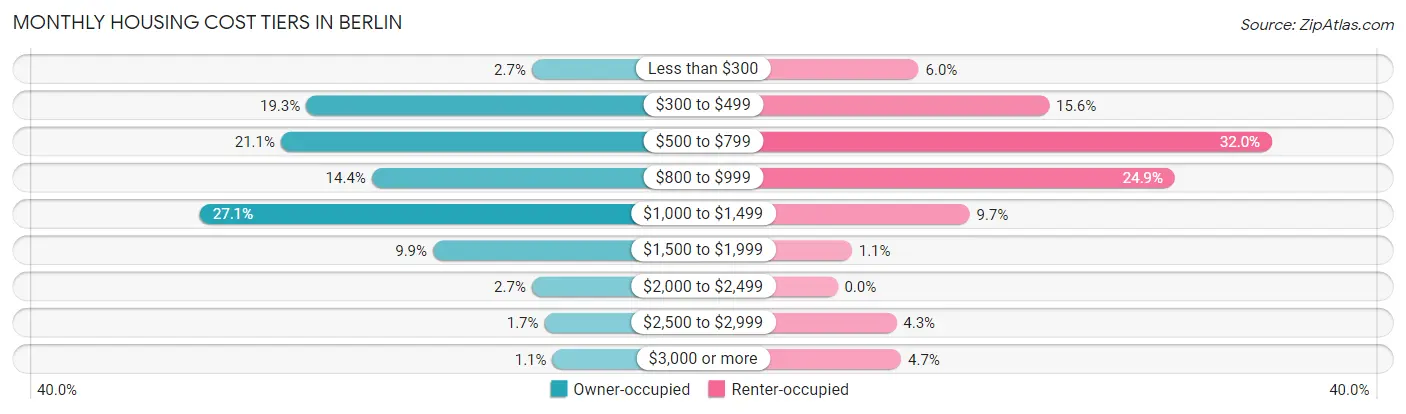
| Monthly Cost | Owner-occupied | Renter-occupied |
| Less than $300 | 40 (2.6%) | 51 (6.0%) |
| $300 to $499 | 291 (19.3%) | 133 (15.6%) |
| $500 to $799 | 319 (21.1%) | 273 (32.0%) |
| $800 to $999 | 218 (14.4%) | 212 (24.8%) |
| $1,000 to $1,499 | 409 (27.1%) | 83 (9.7%) |
| $1,500 to $1,999 | 150 (9.9%) | 9 (1.1%) |
| $2,000 to $2,499 | 40 (2.6%) | 0 (0.0%) |
| $2,500 to $2,999 | 26 (1.7%) | 37 (4.3%) |
| $3,000 or more | 17 (1.1%) | 40 (4.7%) |
| Total | 1,510 (100.0%) | 853 (100.0%) |
Physical Housing Characteristics in Berlin
Housing Structures in Berlin
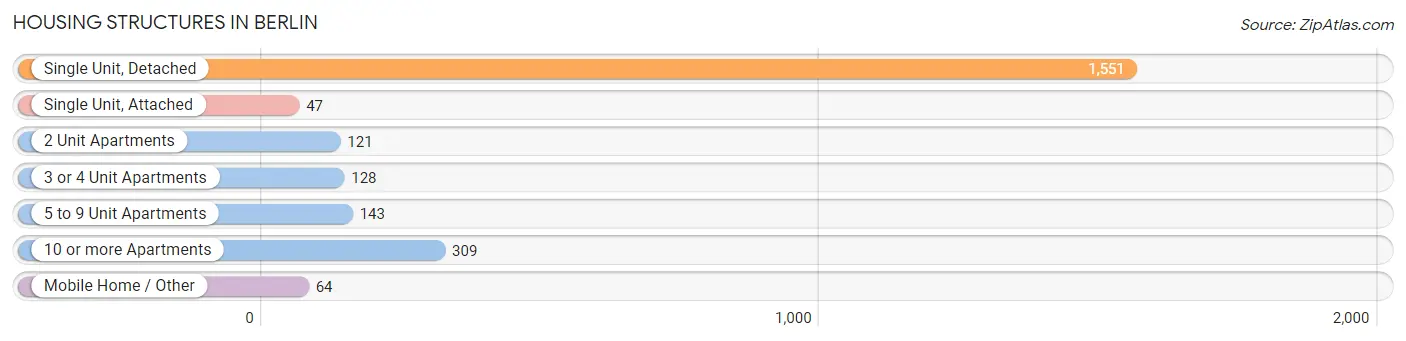
| Structure Type | # Housing Units | % Housing Units |
| Single Unit, Detached | 1,551 | 65.6% |
| Single Unit, Attached | 47 | 2.0% |
| 2 Unit Apartments | 121 | 5.1% |
| 3 or 4 Unit Apartments | 128 | 5.4% |
| 5 to 9 Unit Apartments | 143 | 6.0% |
| 10 or more Apartments | 309 | 13.1% |
| Mobile Home / Other | 64 | 2.7% |
| Total | 2,363 | 100.0% |
Housing Structures by Occupancy in Berlin
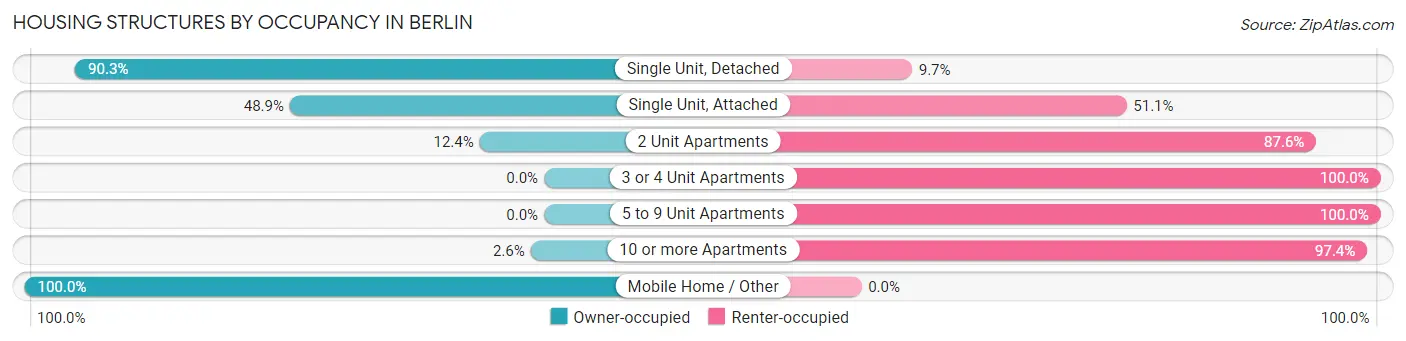
| Structure Type | Owner-occupied | Renter-occupied |
| Single Unit, Detached | 1,400 (90.3%) | 151 (9.7%) |
| Single Unit, Attached | 23 (48.9%) | 24 (51.1%) |
| 2 Unit Apartments | 15 (12.4%) | 106 (87.6%) |
| 3 or 4 Unit Apartments | 0 (0.0%) | 128 (100.0%) |
| 5 to 9 Unit Apartments | 0 (0.0%) | 143 (100.0%) |
| 10 or more Apartments | 8 (2.6%) | 301 (97.4%) |
| Mobile Home / Other | 64 (100.0%) | 0 (0.0%) |
| Total | 1,510 (63.9%) | 853 (36.1%) |
Housing Structures by Number of Rooms in Berlin
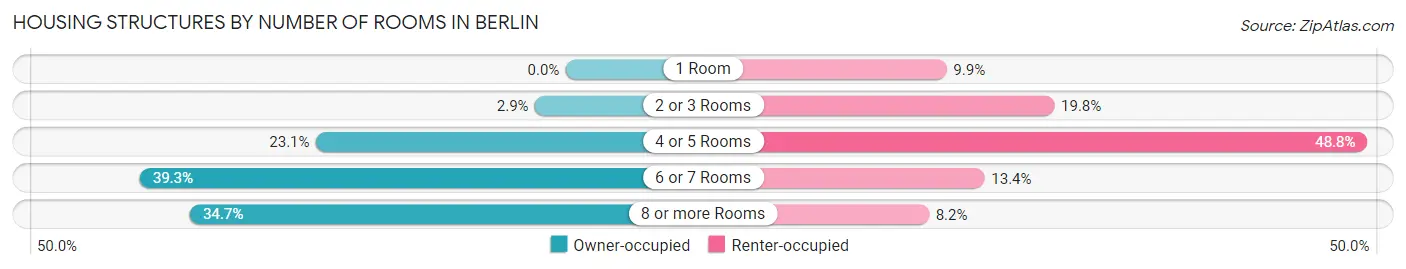
| Number of Rooms | Owner-occupied | Renter-occupied |
| 1 Room | 0 (0.0%) | 84 (9.9%) |
| 2 or 3 Rooms | 43 (2.9%) | 169 (19.8%) |
| 4 or 5 Rooms | 349 (23.1%) | 416 (48.8%) |
| 6 or 7 Rooms | 594 (39.3%) | 114 (13.4%) |
| 8 or more Rooms | 524 (34.7%) | 70 (8.2%) |
| Total | 1,510 (100.0%) | 853 (100.0%) |
Housing Structure by Heating Type in Berlin
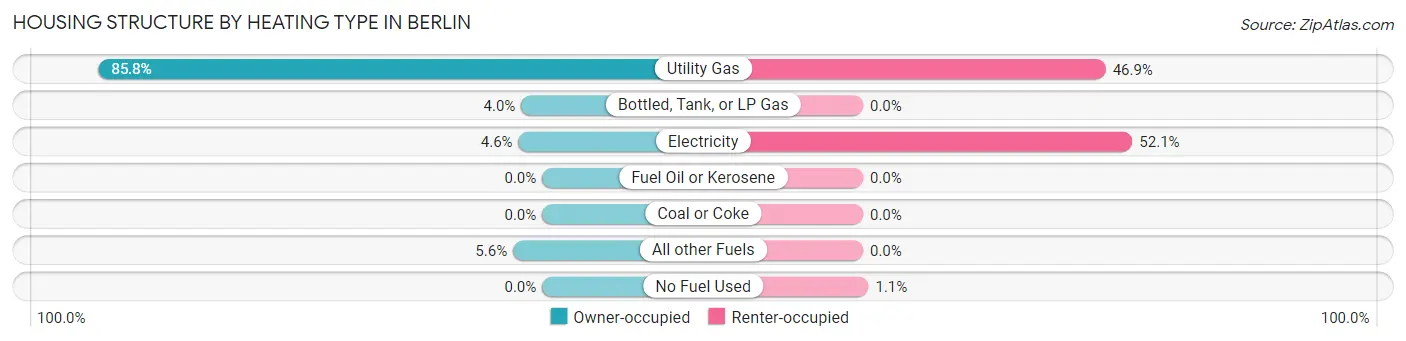
| Heating Type | Owner-occupied | Renter-occupied |
| Utility Gas | 1,295 (85.8%) | 400 (46.9%) |
| Bottled, Tank, or LP Gas | 61 (4.0%) | 0 (0.0%) |
| Electricity | 69 (4.6%) | 444 (52.0%) |
| Fuel Oil or Kerosene | 0 (0.0%) | 0 (0.0%) |
| Coal or Coke | 0 (0.0%) | 0 (0.0%) |
| All other Fuels | 85 (5.6%) | 0 (0.0%) |
| No Fuel Used | 0 (0.0%) | 9 (1.1%) |
| Total | 1,510 (100.0%) | 853 (100.0%) |
Household Vehicle Usage in Berlin
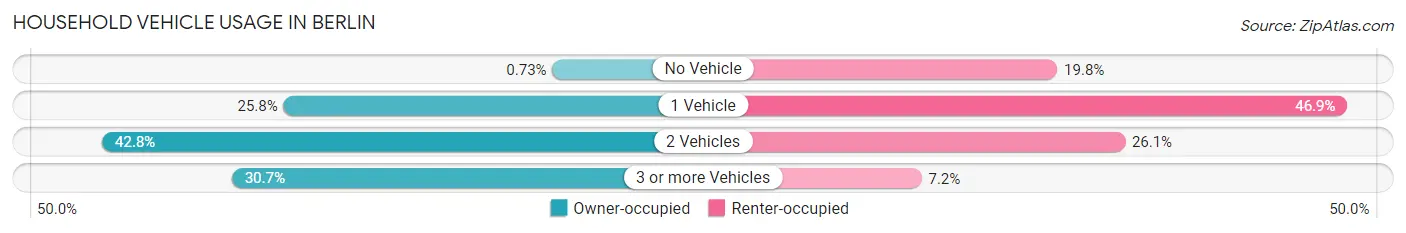
| Vehicles per Household | Owner-occupied | Renter-occupied |
| No Vehicle | 11 (0.7%) | 169 (19.8%) |
| 1 Vehicle | 390 (25.8%) | 400 (46.9%) |
| 2 Vehicles | 646 (42.8%) | 223 (26.1%) |
| 3 or more Vehicles | 463 (30.7%) | 61 (7.1%) |
| Total | 1,510 (100.0%) | 853 (100.0%) |
Real Estate & Mortgages in Berlin
Real Estate and Mortgage Overview in Berlin
| Characteristic | Without Mortgage | With Mortgage |
| Housing Units | 593 | 917 |
| Median Property Value | $126,500 | $142,800 |
| Median Household Income | $49,519 | $95 |
| Monthly Housing Costs | $481 | $17 |
| Real Estate Taxes | $2,279 | $0 |
Property Value by Mortgage Status in Berlin
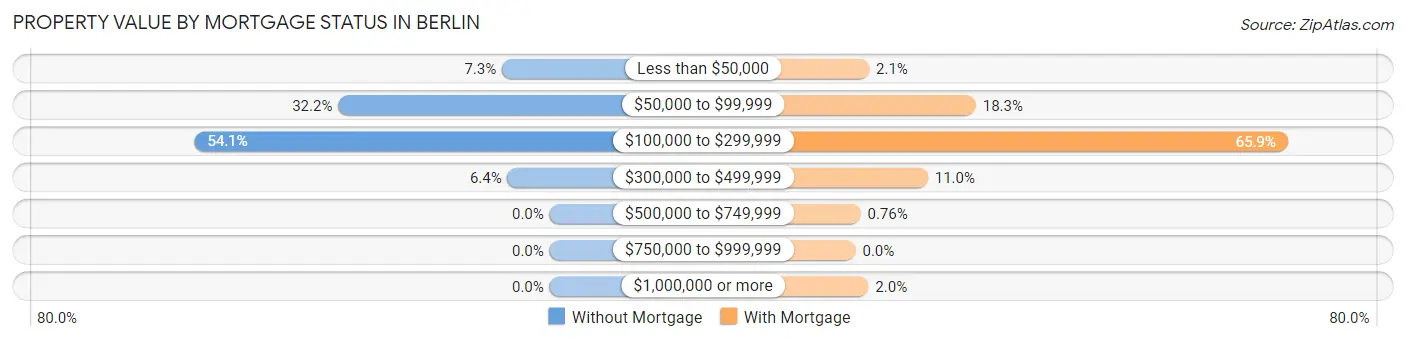
| Property Value | Without Mortgage | With Mortgage |
| Less than $50,000 | 43 (7.2%) | 19 (2.1%) |
| $50,000 to $99,999 | 191 (32.2%) | 168 (18.3%) |
| $100,000 to $299,999 | 321 (54.1%) | 604 (65.9%) |
| $300,000 to $499,999 | 38 (6.4%) | 101 (11.0%) |
| $500,000 to $749,999 | 0 (0.0%) | 7 (0.8%) |
| $750,000 to $999,999 | 0 (0.0%) | 0 (0.0%) |
| $1,000,000 or more | 0 (0.0%) | 18 (2.0%) |
| Total | 593 (100.0%) | 917 (100.0%) |
Household Income by Mortgage Status in Berlin
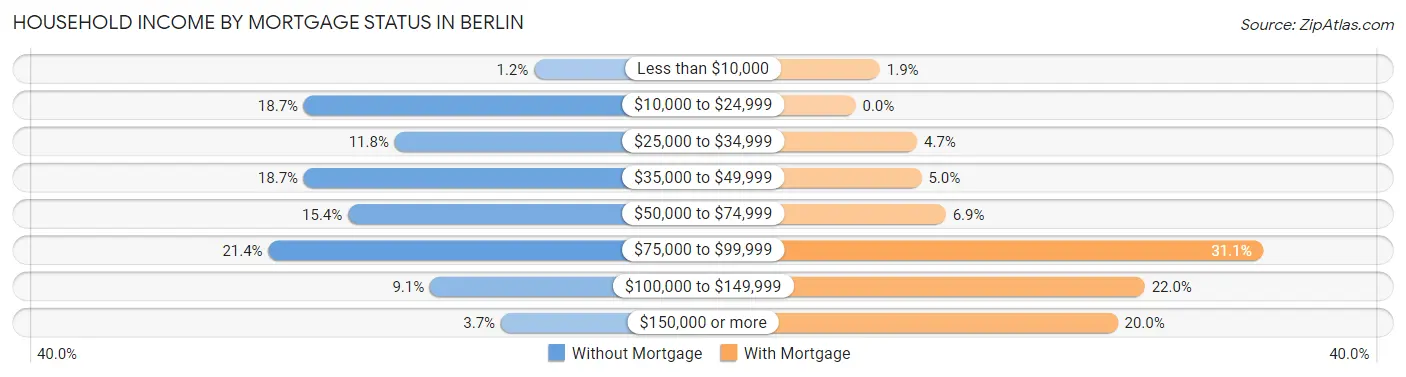
| Household Income | Without Mortgage | With Mortgage |
| Less than $10,000 | 7 (1.2%) | 17 (1.8%) |
| $10,000 to $24,999 | 111 (18.7%) | 0 (0.0%) |
| $25,000 to $34,999 | 70 (11.8%) | 43 (4.7%) |
| $35,000 to $49,999 | 111 (18.7%) | 46 (5.0%) |
| $50,000 to $74,999 | 91 (15.3%) | 63 (6.9%) |
| $75,000 to $99,999 | 127 (21.4%) | 285 (31.1%) |
| $100,000 to $149,999 | 54 (9.1%) | 202 (22.0%) |
| $150,000 or more | 22 (3.7%) | 183 (20.0%) |
| Total | 593 (100.0%) | 917 (100.0%) |
Property Value to Household Income Ratio in Berlin
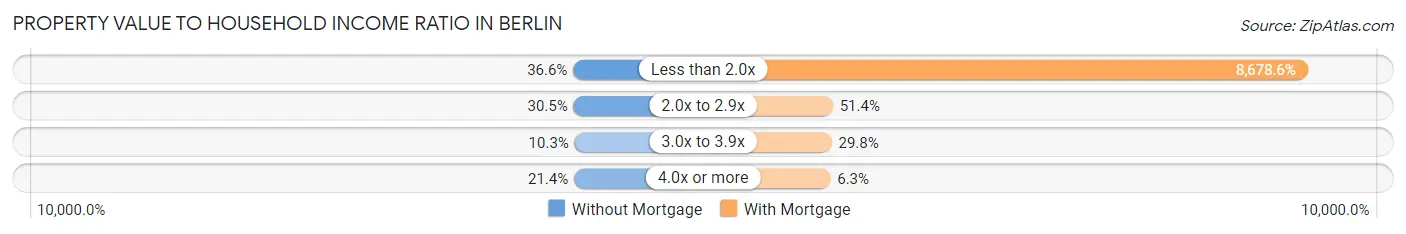
| Value-to-Income Ratio | Without Mortgage | With Mortgage |
| Less than 2.0x | 217 (36.6%) | 79,583 (8,678.6%) |
| 2.0x to 2.9x | 181 (30.5%) | 471 (51.4%) |
| 3.0x to 3.9x | 61 (10.3%) | 273 (29.8%) |
| 4.0x or more | 127 (21.4%) | 58 (6.3%) |
| Total | 593 (100.0%) | 917 (100.0%) |
Real Estate Taxes by Mortgage Status in Berlin
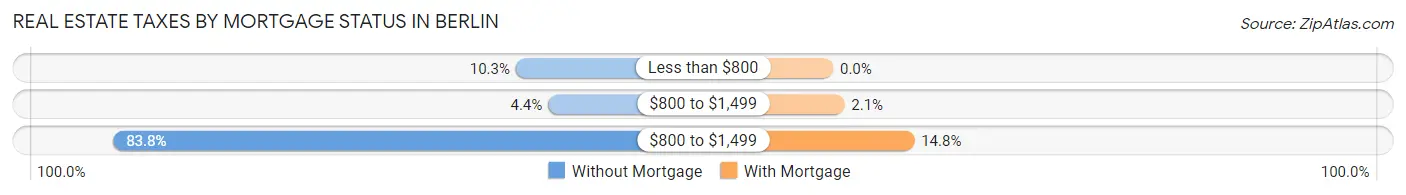
| Property Taxes | Without Mortgage | With Mortgage |
| Less than $800 | 61 (10.3%) | 0 (0.0%) |
| $800 to $1,499 | 26 (4.4%) | 19 (2.1%) |
| $800 to $1,499 | 497 (83.8%) | 136 (14.8%) |
| Total | 593 (100.0%) | 917 (100.0%) |
Health & Disability in Berlin
Health Insurance Coverage by Age in Berlin
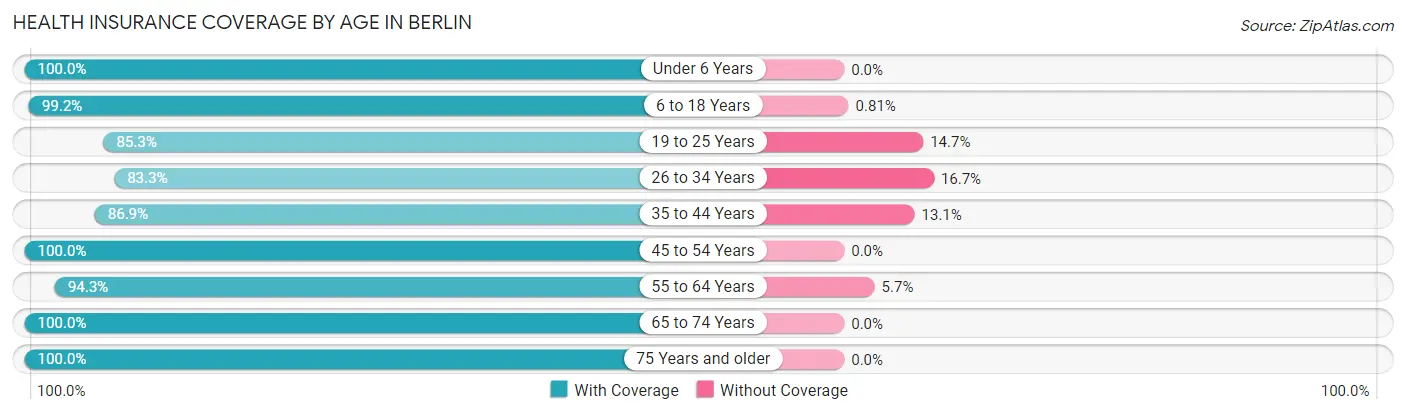
| Age Bracket | With Coverage | Without Coverage |
| Under 6 Years | 310 (100.0%) | 0 (0.0%) |
| 6 to 18 Years | 977 (99.2%) | 8 (0.8%) |
| 19 to 25 Years | 446 (85.3%) | 77 (14.7%) |
| 26 to 34 Years | 493 (83.3%) | 99 (16.7%) |
| 35 to 44 Years | 570 (86.9%) | 86 (13.1%) |
| 45 to 54 Years | 651 (100.0%) | 0 (0.0%) |
| 55 to 64 Years | 834 (94.3%) | 50 (5.7%) |
| 65 to 74 Years | 448 (100.0%) | 0 (0.0%) |
| 75 Years and older | 436 (100.0%) | 0 (0.0%) |
| Total | 5,165 (94.2%) | 320 (5.8%) |
Health Insurance Coverage by Citizenship Status in Berlin
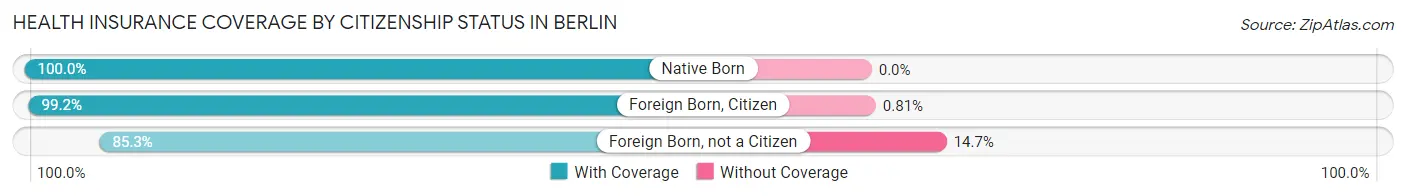
| Citizenship Status | With Coverage | Without Coverage |
| Native Born | 310 (100.0%) | 0 (0.0%) |
| Foreign Born, Citizen | 977 (99.2%) | 8 (0.8%) |
| Foreign Born, not a Citizen | 446 (85.3%) | 77 (14.7%) |
Health Insurance Coverage by Household Income in Berlin
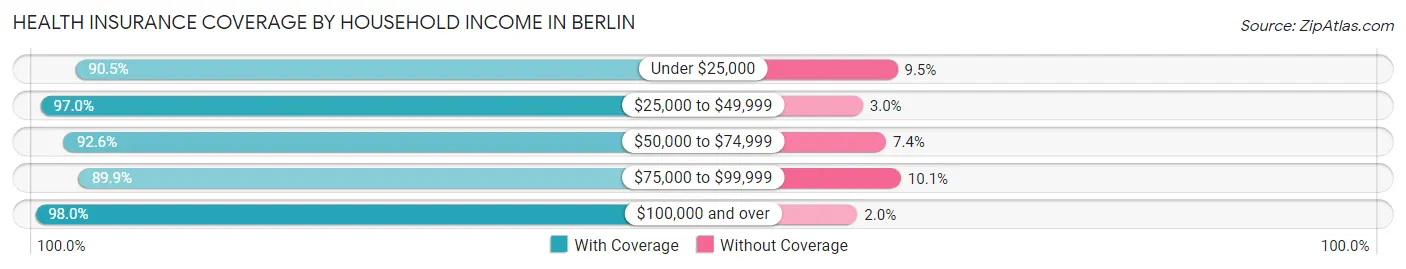
| Household Income | With Coverage | Without Coverage |
| Under $25,000 | 609 (90.5%) | 64 (9.5%) |
| $25,000 to $49,999 | 1,159 (97.0%) | 36 (3.0%) |
| $50,000 to $74,999 | 1,107 (92.6%) | 88 (7.4%) |
| $75,000 to $99,999 | 930 (89.9%) | 105 (10.1%) |
| $100,000 and over | 1,333 (98.0%) | 27 (2.0%) |
Public vs Private Health Insurance Coverage by Age in Berlin
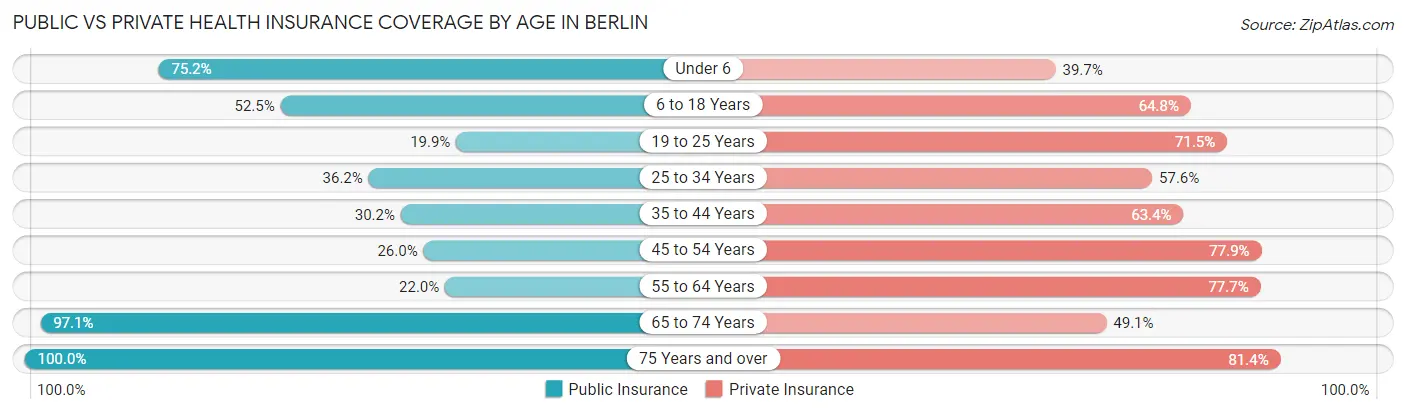
| Age Bracket | Public Insurance | Private Insurance |
| Under 6 | 233 (75.2%) | 123 (39.7%) |
| 6 to 18 Years | 517 (52.5%) | 638 (64.8%) |
| 19 to 25 Years | 104 (19.9%) | 374 (71.5%) |
| 25 to 34 Years | 214 (36.1%) | 341 (57.6%) |
| 35 to 44 Years | 198 (30.2%) | 416 (63.4%) |
| 45 to 54 Years | 169 (26.0%) | 507 (77.9%) |
| 55 to 64 Years | 194 (22.0%) | 687 (77.7%) |
| 65 to 74 Years | 435 (97.1%) | 220 (49.1%) |
| 75 Years and over | 436 (100.0%) | 355 (81.4%) |
| Total | 2,500 (45.6%) | 3,661 (66.7%) |
Disability Status by Sex by Age in Berlin
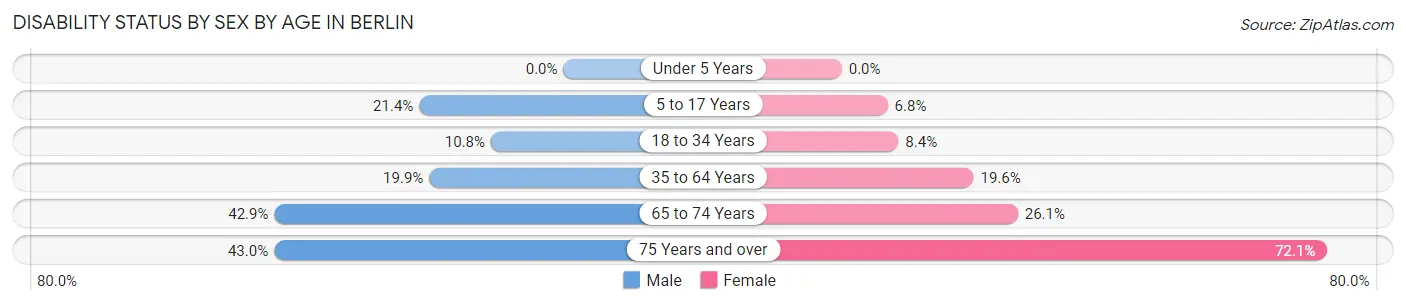
| Age Bracket | Male | Female |
| Under 5 Years | 0 (0.0%) | 0 (0.0%) |
| 5 to 17 Years | 97 (21.4%) | 38 (6.8%) |
| 18 to 34 Years | 64 (10.8%) | 47 (8.4%) |
| 35 to 64 Years | 235 (19.9%) | 198 (19.6%) |
| 65 to 74 Years | 97 (42.9%) | 58 (26.1%) |
| 75 Years and over | 55 (43.0%) | 222 (72.1%) |
Disability Class by Sex by Age in Berlin
Disability Class: Hearing Difficulty
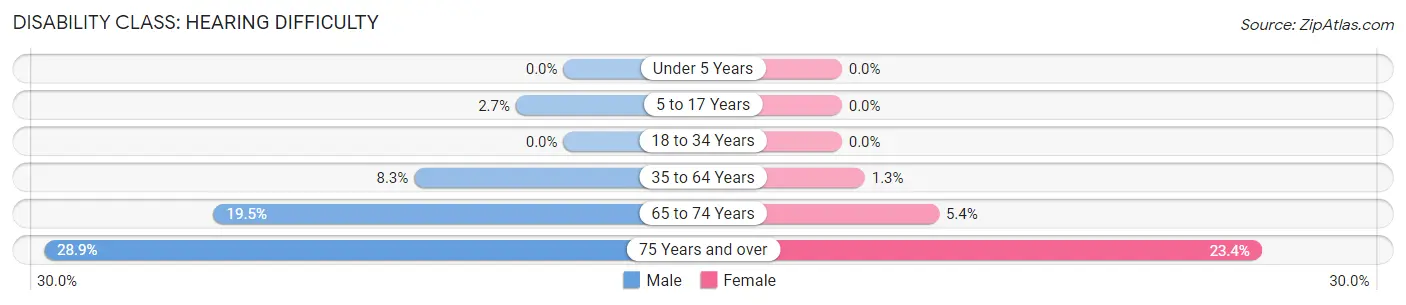
| Age Bracket | Male | Female |
| Under 5 Years | 0 (0.0%) | 0 (0.0%) |
| 5 to 17 Years | 12 (2.6%) | 0 (0.0%) |
| 18 to 34 Years | 0 (0.0%) | 0 (0.0%) |
| 35 to 64 Years | 98 (8.3%) | 13 (1.3%) |
| 65 to 74 Years | 44 (19.5%) | 12 (5.4%) |
| 75 Years and over | 37 (28.9%) | 72 (23.4%) |
Disability Class: Vision Difficulty
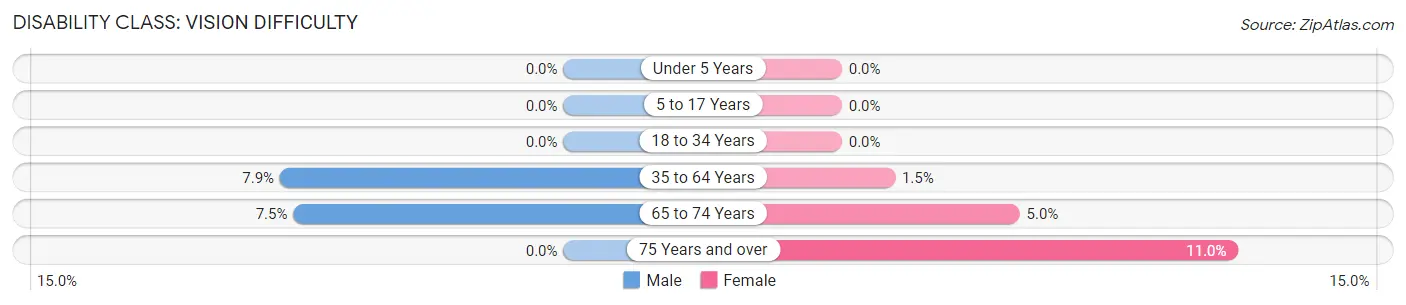
| Age Bracket | Male | Female |
| Under 5 Years | 0 (0.0%) | 0 (0.0%) |
| 5 to 17 Years | 0 (0.0%) | 0 (0.0%) |
| 18 to 34 Years | 0 (0.0%) | 0 (0.0%) |
| 35 to 64 Years | 93 (7.9%) | 15 (1.5%) |
| 65 to 74 Years | 17 (7.5%) | 11 (5.0%) |
| 75 Years and over | 0 (0.0%) | 34 (11.0%) |
Disability Class: Cognitive Difficulty
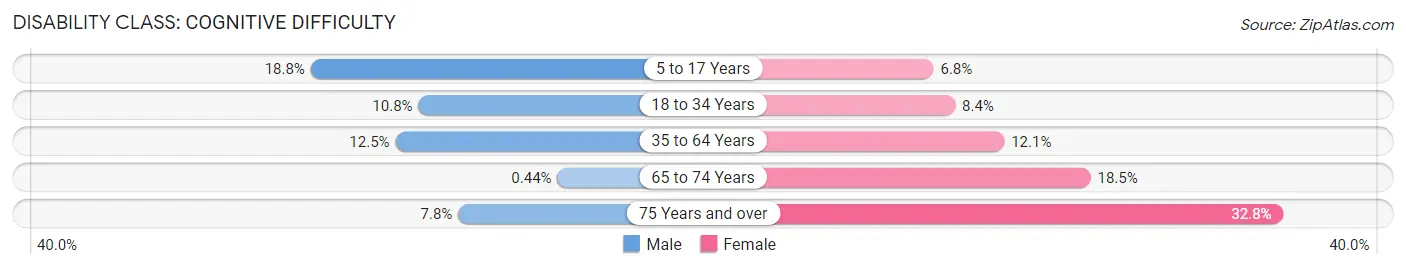
| Age Bracket | Male | Female |
| 5 to 17 Years | 85 (18.8%) | 38 (6.8%) |
| 18 to 34 Years | 64 (10.8%) | 47 (8.4%) |
| 35 to 64 Years | 147 (12.5%) | 122 (12.1%) |
| 65 to 74 Years | 1 (0.4%) | 41 (18.5%) |
| 75 Years and over | 10 (7.8%) | 101 (32.8%) |
Disability Class: Ambulatory Difficulty
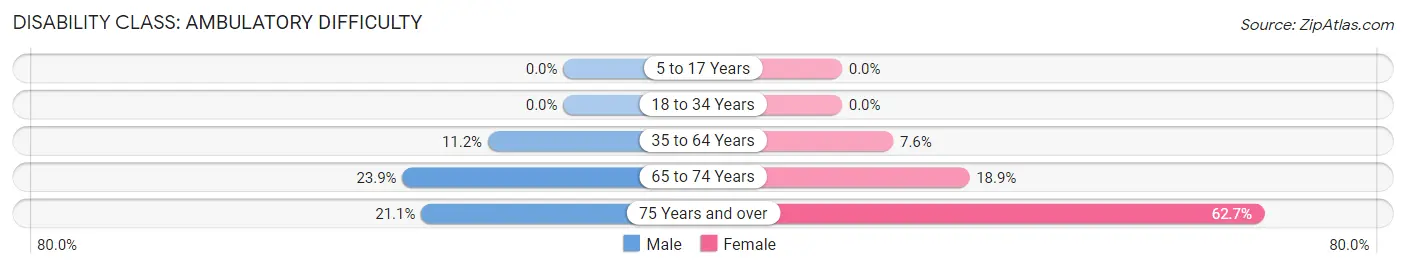
| Age Bracket | Male | Female |
| 5 to 17 Years | 0 (0.0%) | 0 (0.0%) |
| 18 to 34 Years | 0 (0.0%) | 0 (0.0%) |
| 35 to 64 Years | 132 (11.2%) | 77 (7.6%) |
| 65 to 74 Years | 54 (23.9%) | 42 (18.9%) |
| 75 Years and over | 27 (21.1%) | 193 (62.7%) |
Disability Class: Self-Care Difficulty
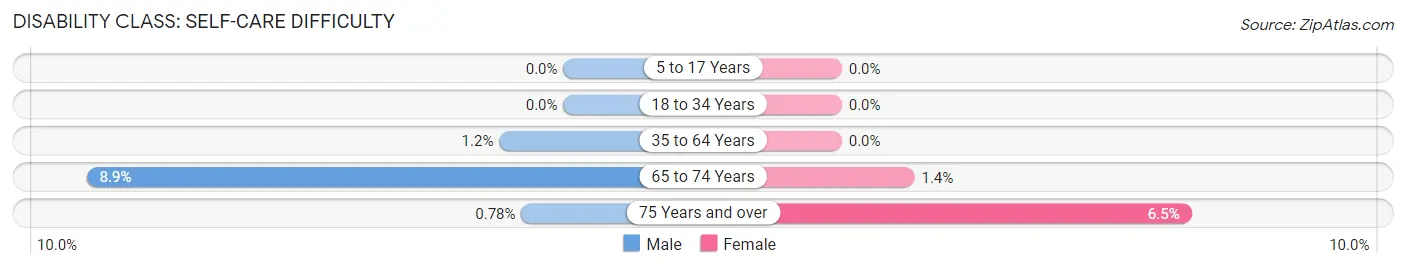
| Age Bracket | Male | Female |
| 5 to 17 Years | 0 (0.0%) | 0 (0.0%) |
| 18 to 34 Years | 0 (0.0%) | 0 (0.0%) |
| 35 to 64 Years | 14 (1.2%) | 0 (0.0%) |
| 65 to 74 Years | 20 (8.8%) | 3 (1.3%) |
| 75 Years and over | 1 (0.8%) | 20 (6.5%) |
Technology Access in Berlin
Computing Device Access in Berlin
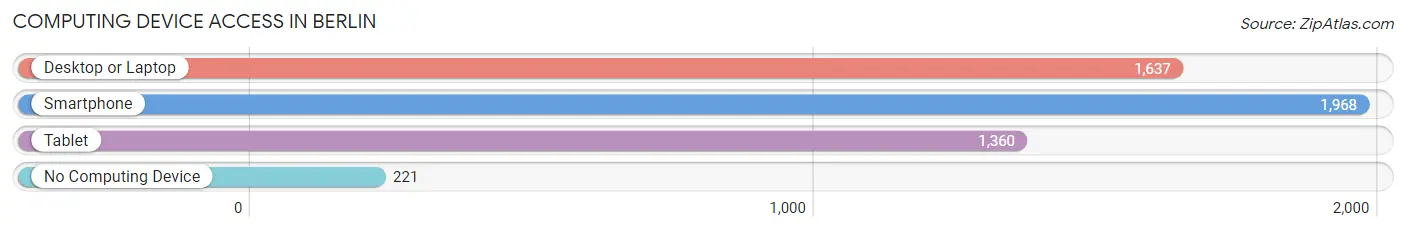
| Device Type | # Households | % Households |
| Desktop or Laptop | 1,637 | 69.3% |
| Smartphone | 1,968 | 83.3% |
| Tablet | 1,360 | 57.6% |
| No Computing Device | 221 | 9.3% |
| Total | 2,363 | 100.0% |
Internet Access in Berlin
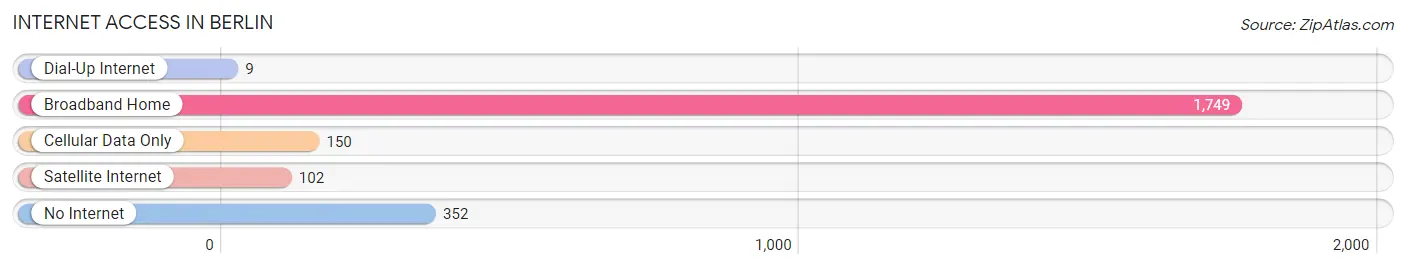
| Internet Type | # Households | % Households |
| Dial-Up Internet | 9 | 0.4% |
| Broadband Home | 1,749 | 74.0% |
| Cellular Data Only | 150 | 6.4% |
| Satellite Internet | 102 | 4.3% |
| No Internet | 352 | 14.9% |
| Total | 2,363 | 100.0% |
Berlin Summary
Berlin, Wisconsin is a city located in Green Lake County, Wisconsin. It is situated on the Fox River and is the county seat of Green Lake County. The city has a population of 5,524 as of the 2020 census.
History
Berlin was founded in 1845 by a group of German immigrants led by John G. Ullrich. The city was named after the German city of Berlin. The city was incorporated in 1856 and was the first city in Green Lake County.
In the late 19th century, Berlin was a major center of the lumber industry. The city was home to several sawmills and lumberyards. The city also had a large number of breweries and distilleries.
Geography
Berlin is located in central Wisconsin, about 50 miles northwest of Madison. The city is situated on the Fox River and is surrounded by rolling hills and farmland. The city has a total area of 4.2 square miles, all of which is land.
Economy
Berlin’s economy is largely based on agriculture and tourism. The city is home to several farms, including dairy farms, vegetable farms, and fruit farms. The city is also home to several tourist attractions, including the Berlin Historical Museum, the Berlin Raceway, and the Berlin Zoo.
The city is also home to several manufacturing companies, including Berlin Plastics, Berlin Packaging, and Berlin Industries.
Demographics
As of the 2020 census, Berlin had a population of 5,524. The racial makeup of the city was 95.3% White, 0.7% African American, 0.3% Native American, 0.7% Asian, 0.1% Pacific Islander, 1.2% from other races, and 1.9% from two or more races. Hispanic or Latino of any race were 3.2% of the population.
The median income for a household in Berlin was $45,938, and the median income for a family was $54,938. The per capita income for the city was $21,938. About 8.3% of families and 10.2% of the population were below the poverty line, including 14.2% of those under age 18 and 6.2% of those age 65 or over.
Berlin is served by the Berlin Area School District, which includes two elementary schools, one middle school, and one high school. The city is also home to several private schools, including St. Paul Lutheran School and St. John Lutheran School.
Berlin is served by the Berlin Municipal Airport, which is located just outside of the city limits. The city is also served by several major highways, including Interstate 41, US Highway 45, and Wisconsin Highway 49.
Common Questions
What is Per Capita Income in Berlin?
Per Capita income in Berlin is $28,255.
What is the Median Family Income in Berlin?
Median Family Income in Berlin is $73,125.
What is the Median Household income in Berlin?
Median Household Income in Berlin is $57,656.
What is Income or Wage Gap in Berlin?
Income or Wage Gap in Berlin is 37.8%.
Women in Berlin earn 62.2 cents for every dollar earned by a man.
What is Inequality or Gini Index in Berlin?
Inequality or Gini Index in Berlin is 0.36.
What is the Total Population of Berlin?
Total Population of Berlin is 5,537.
What is the Total Male Population of Berlin?
Total Male Population of Berlin is 2,724.
What is the Total Female Population of Berlin?
Total Female Population of Berlin is 2,813.
What is the Ratio of Males per 100 Females in Berlin?
There are 96.84 Males per 100 Females in Berlin.
What is the Ratio of Females per 100 Males in Berlin?
There are 103.27 Females per 100 Males in Berlin.
What is the Median Population Age in Berlin?
Median Population Age in Berlin is 40.3 Years.
What is the Average Family Size in Berlin
Average Family Size in Berlin is 2.8 People.
What is the Average Household Size in Berlin
Average Household Size in Berlin is 2.3 People.
How Large is the Labor Force in Berlin?
There are 2,715 People in the Labor Forcein in Berlin.
What is the Percentage of People in the Labor Force in Berlin?
61.3% of People are in the Labor Force in Berlin.
What is the Unemployment Rate in Berlin?
Unemployment Rate in Berlin is 3.3%.