Oakville, CT Map & Demographics
Oakville Map
Oakville Overview
$46,412
PER CAPITA INCOME
$102,083
AVG FAMILY INCOME
$82,701
AVG HOUSEHOLD INCOME
28.8%
WAGE / INCOME GAP [ % ]
71.2¢/ $1
WAGE / INCOME GAP [ $ ]
0.47
INEQUALITY / GINI INDEX
9,387
TOTAL POPULATION
4,606
MALE POPULATION
4,781
FEMALE POPULATION
96.34
MALES / 100 FEMALES
103.80
FEMALES / 100 MALES
45.3
MEDIAN AGE
3.0
AVG FAMILY SIZE
2.4
AVG HOUSEHOLD SIZE
5,381
LABOR FORCE [ PEOPLE ]
68.3%
PERCENT IN LABOR FORCE
2.4%
UNEMPLOYMENT RATE
Oakville Zip Codes
Oakville Area Codes
Income in Oakville
Income Overview in Oakville
Per Capita Income in Oakville is $46,412, while median incomes of families and households are $102,083 and $82,701 respectively.
| Characteristic | Number | Measure |
| Per Capita Income | 9,387 | $46,412 |
| Median Family Income | 2,449 | $102,083 |
| Mean Family Income | 2,449 | $141,734 |
| Median Household Income | 3,856 | $82,701 |
| Mean Household Income | 3,856 | $110,987 |
| Income Deficit | 2,449 | $0 |
| Wage / Income Gap (%) | 9,387 | 28.84% |
| Wage / Income Gap ($) | 9,387 | 71.16¢ per $1 |
| Gini / Inequality Index | 9,387 | 0.47 |
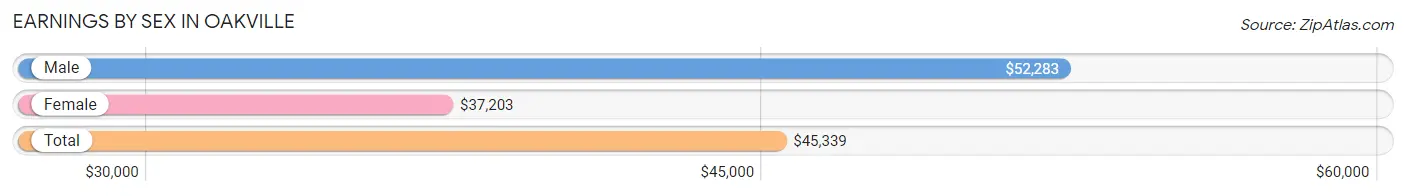
Earnings by Sex in Oakville
Average Earnings in Oakville are $45,339, $52,283 for men and $37,203 for women, a difference of 28.8%.
| Sex | Number | Average Earnings |
| Male | 2,986 (54.2%) | $52,283 |
| Female | 2,518 (45.8%) | $37,203 |
| Total | 5,504 (100.0%) | $45,339 |
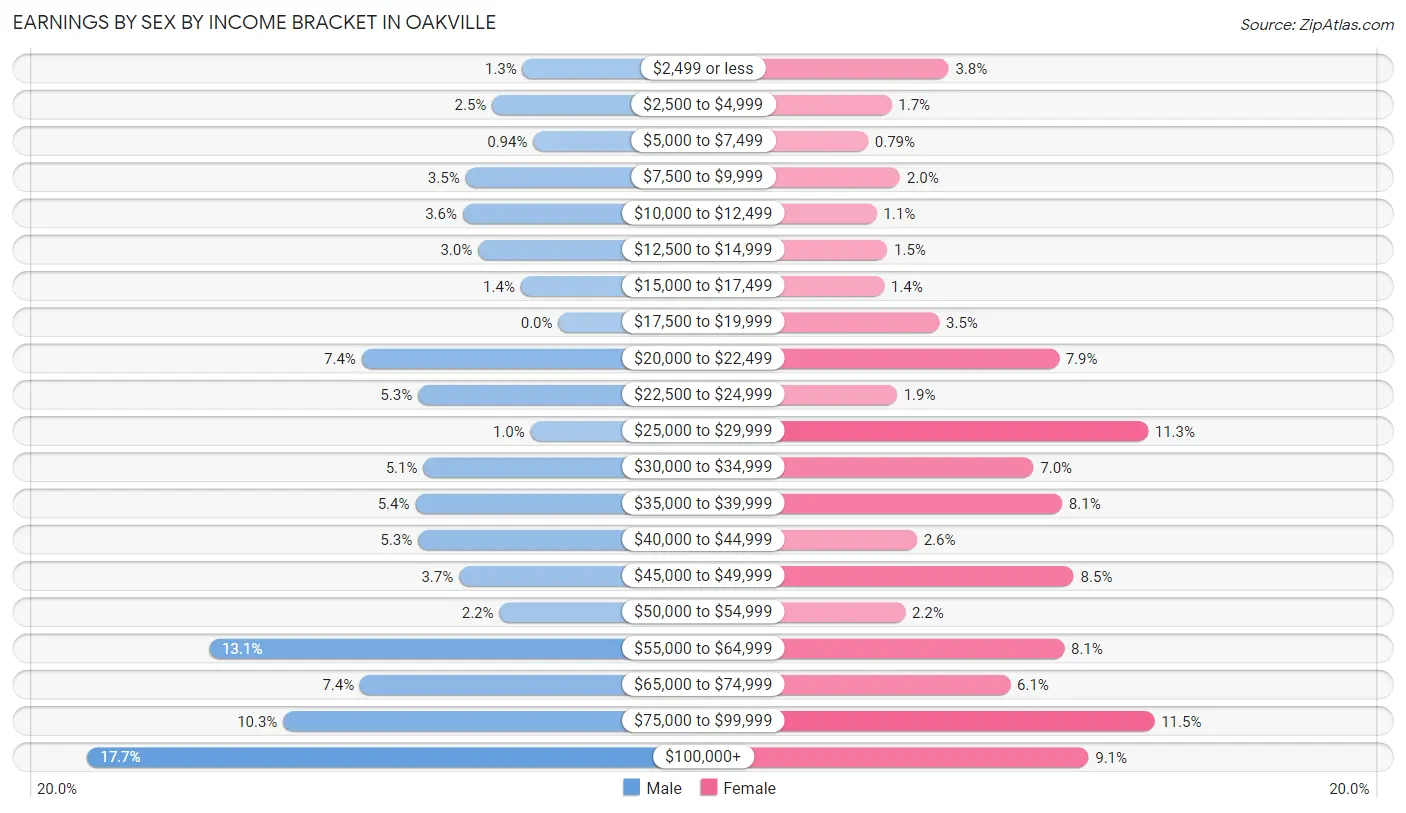
Earnings by Sex by Income Bracket in Oakville
The most common earnings brackets in Oakville are $100,000+ for men (527 | 17.6%) and $75,000 to $99,999 for women (290 | 11.5%).
| Income | Male | Female |
| $2,499 or less | 40 (1.3%) | 96 (3.8%) |
| $2,500 to $4,999 | 74 (2.5%) | 42 (1.7%) |
| $5,000 to $7,499 | 28 (0.9%) | 20 (0.8%) |
| $7,500 to $9,999 | 104 (3.5%) | 50 (2.0%) |
| $10,000 to $12,499 | 107 (3.6%) | 28 (1.1%) |
| $12,500 to $14,999 | 90 (3.0%) | 38 (1.5%) |
| $15,000 to $17,499 | 42 (1.4%) | 35 (1.4%) |
| $17,500 to $19,999 | 0 (0.0%) | 87 (3.5%) |
| $20,000 to $22,499 | 220 (7.4%) | 200 (7.9%) |
| $22,500 to $24,999 | 157 (5.3%) | 47 (1.9%) |
| $25,000 to $29,999 | 31 (1.0%) | 284 (11.3%) |
| $30,000 to $34,999 | 151 (5.1%) | 176 (7.0%) |
| $35,000 to $39,999 | 160 (5.4%) | 203 (8.1%) |
| $40,000 to $44,999 | 157 (5.3%) | 66 (2.6%) |
| $45,000 to $49,999 | 111 (3.7%) | 214 (8.5%) |
| $50,000 to $54,999 | 66 (2.2%) | 55 (2.2%) |
| $55,000 to $64,999 | 391 (13.1%) | 205 (8.1%) |
| $65,000 to $74,999 | 222 (7.4%) | 154 (6.1%) |
| $75,000 to $99,999 | 308 (10.3%) | 290 (11.5%) |
| $100,000+ | 527 (17.6%) | 228 (9.0%) |
| Total | 2,986 (100.0%) | 2,518 (100.0%) |
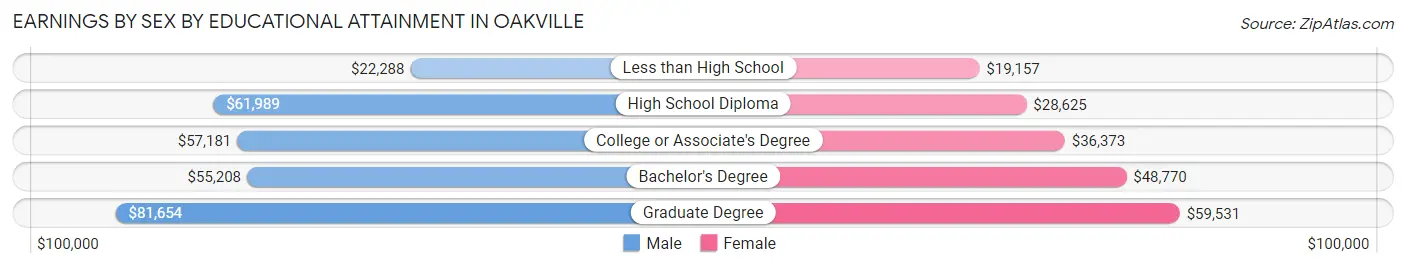
Earnings by Sex by Educational Attainment in Oakville
Average earnings in Oakville are $58,821 for men and $45,233 for women, a difference of 23.1%. Men with an educational attainment of graduate degree enjoy the highest average annual earnings of $81,654, while those with less than high school education earn the least with $22,288. Women with an educational attainment of graduate degree earn the most with the average annual earnings of $59,531, while those with less than high school education have the smallest earnings of $19,157.
| Educational Attainment | Male Income | Female Income |
| Less than High School | $22,288 | $19,157 |
| High School Diploma | $61,989 | $28,625 |
| College or Associate's Degree | $57,181 | $36,373 |
| Bachelor's Degree | $55,208 | $48,770 |
| Graduate Degree | $81,654 | $59,531 |
| Total | $58,821 | $45,233 |
Family Income in Oakville
Family Income Brackets in Oakville
According to the Oakville family income data, there are 602 families falling into the $100,000 to $149,999 income range, which is the most common income bracket and makes up 24.6% of all families.
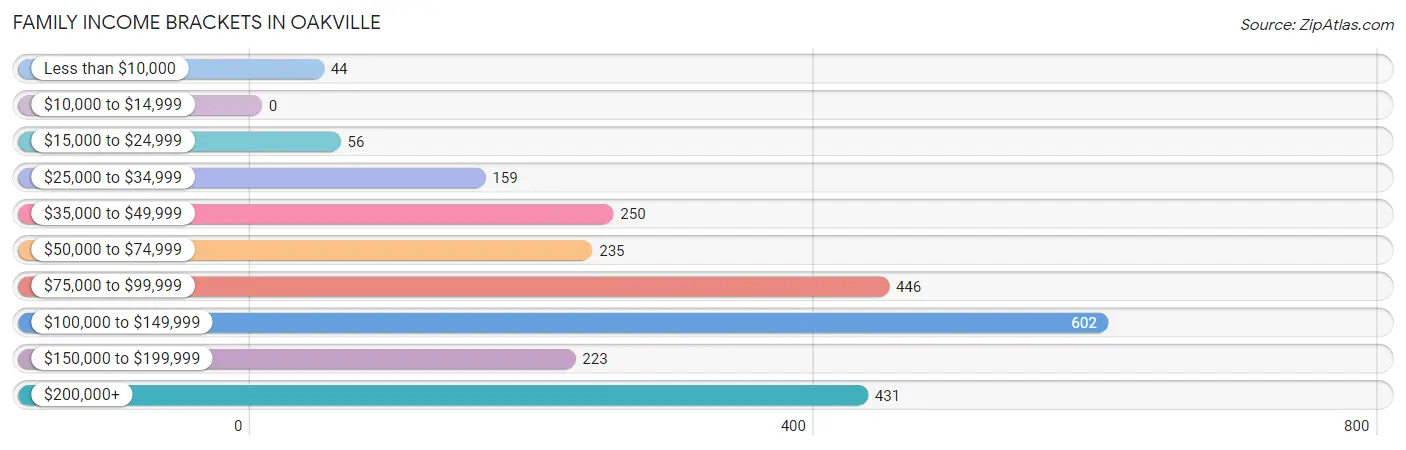
| Income Bracket | # Families | % Families |
| Less than $10,000 | 44 | 1.8% |
| $10,000 to $14,999 | 0 | 0.0% |
| $15,000 to $24,999 | 56 | 2.3% |
| $25,000 to $34,999 | 159 | 6.5% |
| $35,000 to $49,999 | 250 | 10.2% |
| $50,000 to $74,999 | 235 | 9.6% |
| $75,000 to $99,999 | 446 | 18.2% |
| $100,000 to $149,999 | 602 | 24.6% |
| $150,000 to $199,999 | 223 | 9.1% |
| $200,000+ | 431 | 17.6% |
Family Income by Famaliy Size in Oakville
4-person families (477 | 19.5%) account for the highest median family income in Oakville with $144,438 per family, while 2-person families (1,350 | 55.1%) have the highest median income of $42,366 per family member.
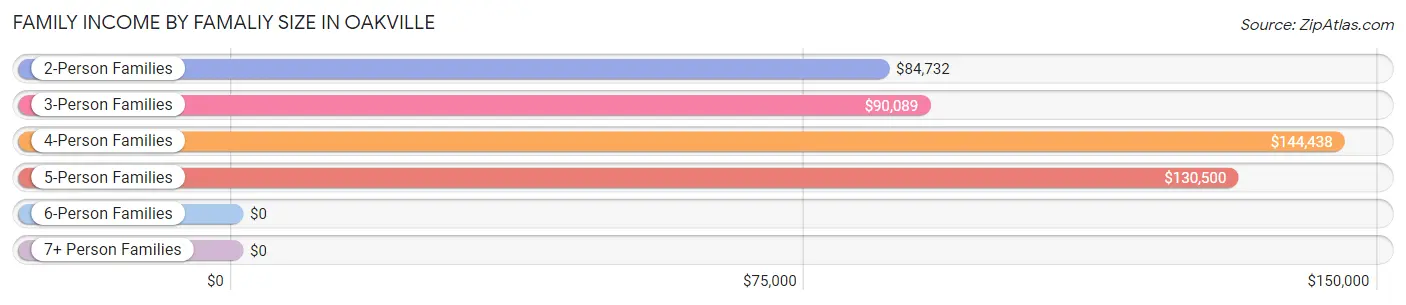
| Income Bracket | # Families | Median Income |
| 2-Person Families | 1,350 (55.1%) | $84,732 |
| 3-Person Families | 371 (15.1%) | $90,089 |
| 4-Person Families | 477 (19.5%) | $144,438 |
| 5-Person Families | 216 (8.8%) | $130,500 |
| 6-Person Families | 14 (0.6%) | $0 |
| 7+ Person Families | 21 (0.9%) | $0 |
| Total | 2,449 (100.0%) | $102,083 |
Family Income by Number of Earners in Oakville
The median family income in Oakville is $102,083, with families comprising 3+ earners (373) having the highest median family income of $175,125, while families with no earners (361) have the lowest median family income of $48,086, accounting for 15.2% and 14.7% of families, respectively.
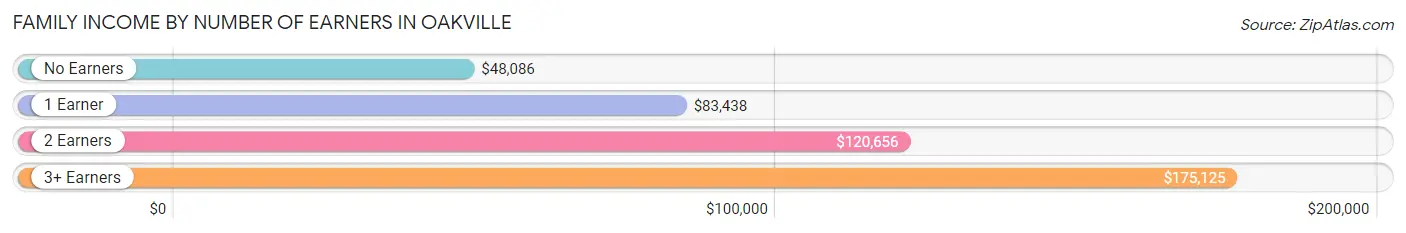
| Number of Earners | # Families | Median Income |
| No Earners | 361 (14.7%) | $48,086 |
| 1 Earner | 639 (26.1%) | $83,438 |
| 2 Earners | 1,076 (43.9%) | $120,656 |
| 3+ Earners | 373 (15.2%) | $175,125 |
| Total | 2,449 (100.0%) | $102,083 |
Household Income in Oakville
Household Income Brackets in Oakville
With 694 households falling in the category, the $75,000 to $99,999 income range is the most frequent in Oakville, accounting for 18.0% of all households. In contrast, only 19 households (0.5%) fall into the $10,000 to $14,999 income bracket, making it the least populous group.
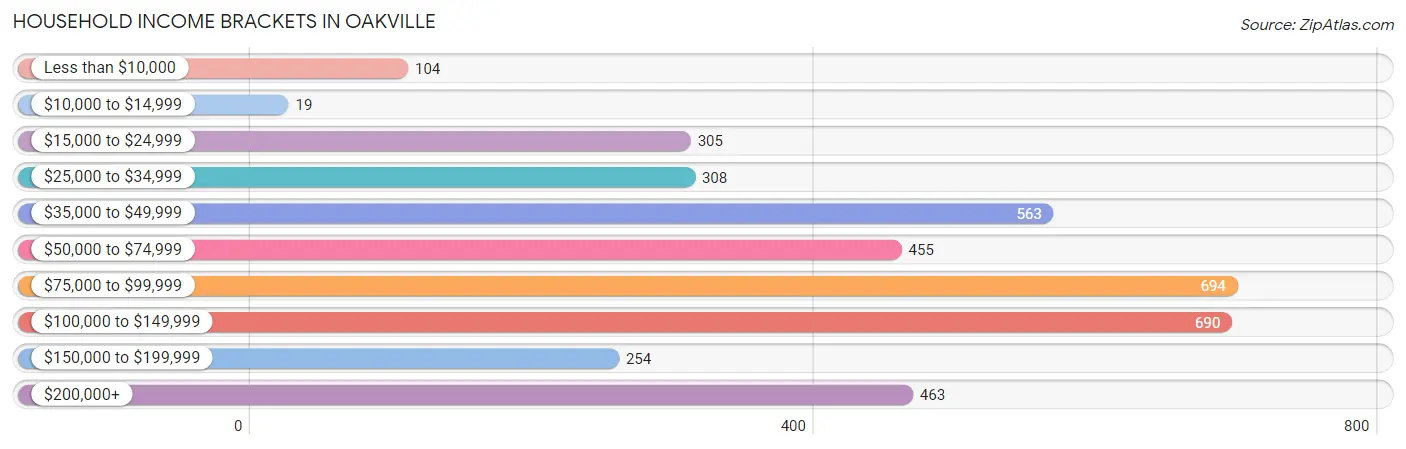
| Income Bracket | # Households | % Households |
| Less than $10,000 | 104 | 2.7% |
| $10,000 to $14,999 | 19 | 0.5% |
| $15,000 to $24,999 | 305 | 7.9% |
| $25,000 to $34,999 | 308 | 8.0% |
| $35,000 to $49,999 | 563 | 14.6% |
| $50,000 to $74,999 | 455 | 11.8% |
| $75,000 to $99,999 | 694 | 18.0% |
| $100,000 to $149,999 | 690 | 17.9% |
| $150,000 to $199,999 | 254 | 6.6% |
| $200,000+ | 463 | 12.0% |
Household Income by Householder Age in Oakville
The median household income in Oakville is $82,701, with the highest median household income of $89,553 found in the 25 to 44 years age bracket for the primary householder. A total of 1,151 households (29.8%) fall into this category. Meanwhile, the 15 to 24 years age bracket for the primary householder has the lowest median household income of $0, with 12 households (0.3%) in this group.
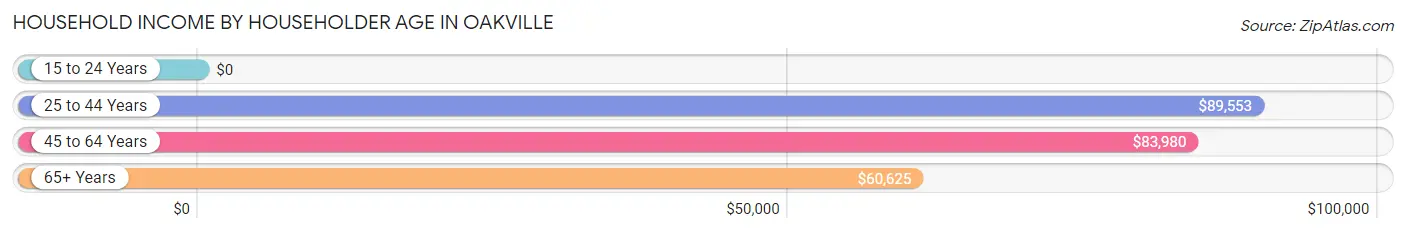
| Income Bracket | # Households | Median Income |
| 15 to 24 Years | 12 (0.3%) | $0 |
| 25 to 44 Years | 1,151 (29.8%) | $89,553 |
| 45 to 64 Years | 1,573 (40.8%) | $83,980 |
| 65+ Years | 1,120 (29.0%) | $60,625 |
| Total | 3,856 (100.0%) | $82,701 |
Poverty in Oakville
Income Below Poverty by Sex and Age in Oakville
With 5.9% poverty level for males and 2.0% for females among the residents of Oakville, 5 year old males and 12 to 14 year old females are the most vulnerable to poverty, with 23 males (100.0%) and 16 females (5.6%) in their respective age groups living below the poverty level.
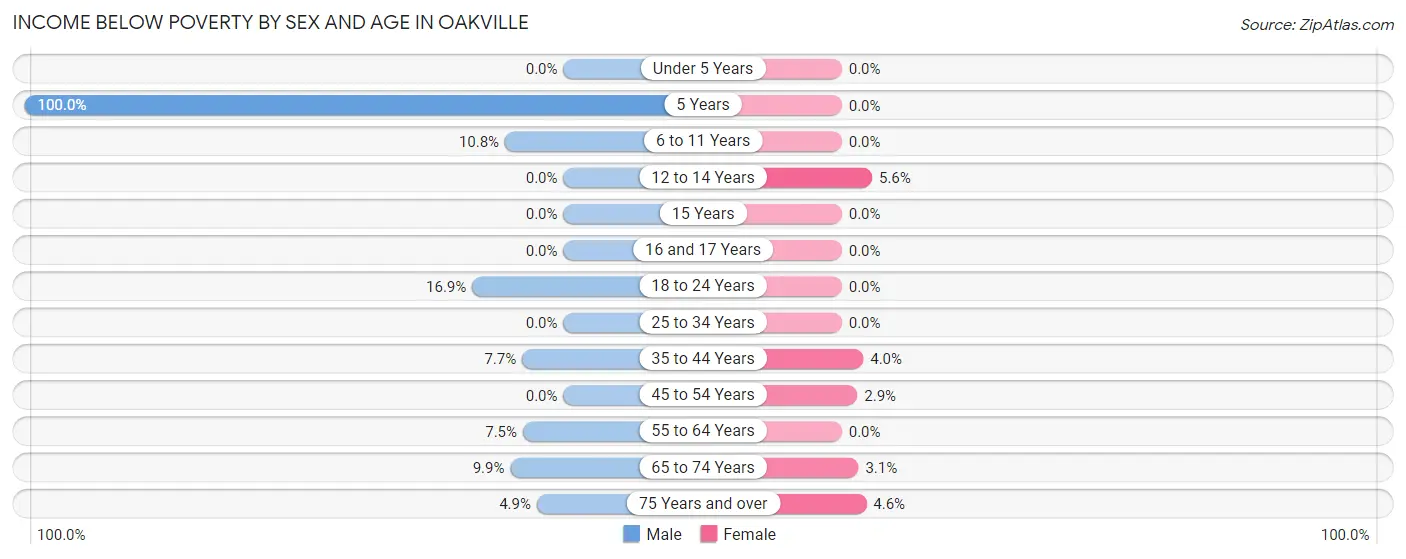
| Age Bracket | Male | Female |
| Under 5 Years | 0 (0.0%) | 0 (0.0%) |
| 5 Years | 23 (100.0%) | 0 (0.0%) |
| 6 to 11 Years | 45 (10.8%) | 0 (0.0%) |
| 12 to 14 Years | 0 (0.0%) | 16 (5.6%) |
| 15 Years | 0 (0.0%) | 0 (0.0%) |
| 16 and 17 Years | 0 (0.0%) | 0 (0.0%) |
| 18 to 24 Years | 52 (16.9%) | 0 (0.0%) |
| 25 to 34 Years | 0 (0.0%) | 0 (0.0%) |
| 35 to 44 Years | 28 (7.7%) | 21 (4.0%) |
| 45 to 54 Years | 0 (0.0%) | 15 (2.9%) |
| 55 to 64 Years | 53 (7.5%) | 0 (0.0%) |
| 65 to 74 Years | 45 (9.9%) | 15 (3.1%) |
| 75 Years and over | 26 (4.9%) | 26 (4.6%) |
| Total | 272 (5.9%) | 93 (2.0%) |
Income Above Poverty by Sex and Age in Oakville
According to the poverty statistics in Oakville, males aged under 5 years and females aged under 5 years are the age groups that are most secure financially, with 100.0% of males and 100.0% of females in these age groups living above the poverty line.
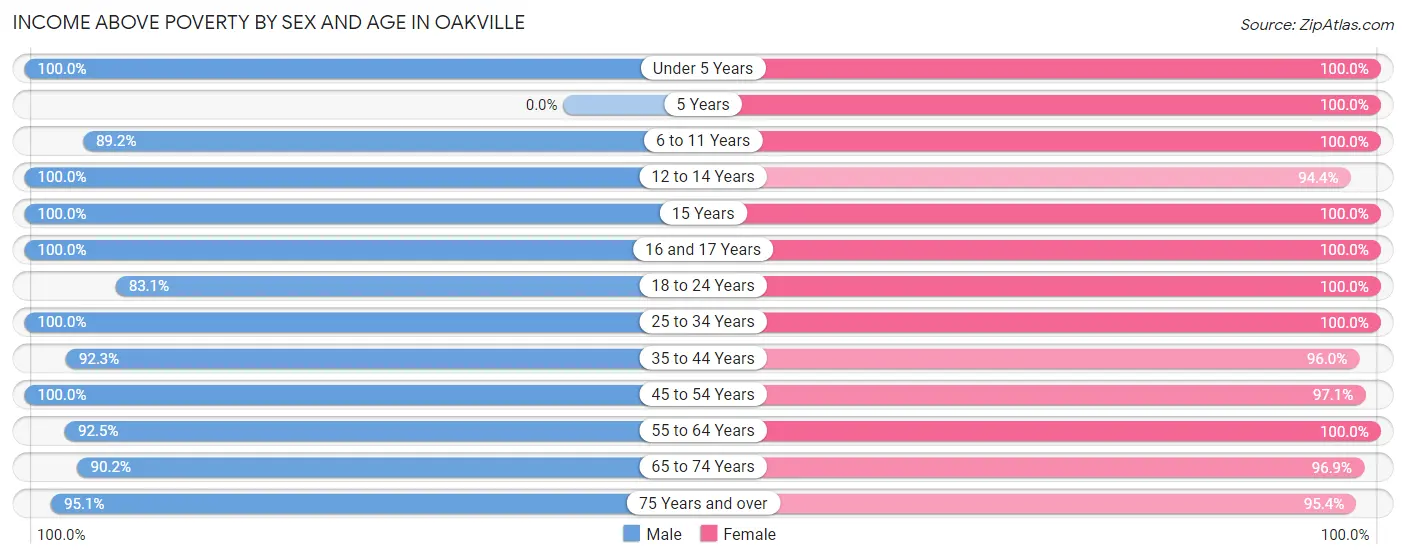
| Age Bracket | Male | Female |
| Under 5 Years | 205 (100.0%) | 174 (100.0%) |
| 5 Years | 0 (0.0%) | 113 (100.0%) |
| 6 to 11 Years | 370 (89.2%) | 197 (100.0%) |
| 12 to 14 Years | 54 (100.0%) | 269 (94.4%) |
| 15 Years | 29 (100.0%) | 14 (100.0%) |
| 16 and 17 Years | 95 (100.0%) | 87 (100.0%) |
| 18 to 24 Years | 255 (83.1%) | 239 (100.0%) |
| 25 to 34 Years | 692 (100.0%) | 835 (100.0%) |
| 35 to 44 Years | 337 (92.3%) | 505 (96.0%) |
| 45 to 54 Years | 706 (100.0%) | 506 (97.1%) |
| 55 to 64 Years | 653 (92.5%) | 689 (100.0%) |
| 65 to 74 Years | 412 (90.1%) | 469 (96.9%) |
| 75 Years and over | 501 (95.1%) | 544 (95.4%) |
| Total | 4,309 (94.1%) | 4,641 (98.0%) |
Income Below Poverty Among Married-Couple Families in Oakville
The poverty statistics for married-couple families in Oakville show that 0.8% or 15 of the total 1,920 families live below the poverty line. Families with no children have the highest poverty rate of 1.2%, comprising of 15 families. On the other hand, families with 1 or 2 children have the lowest poverty rate of 0.0%, which includes 0 families.
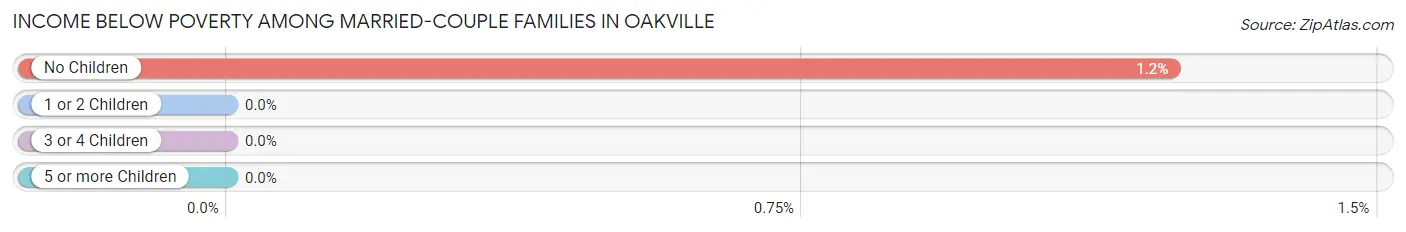
| Children | Above Poverty | Below Poverty |
| No Children | 1,205 (98.8%) | 15 (1.2%) |
| 1 or 2 Children | 571 (100.0%) | 0 (0.0%) |
| 3 or 4 Children | 129 (100.0%) | 0 (0.0%) |
| 5 or more Children | 0 (0.0%) | 0 (0.0%) |
| Total | 1,905 (99.2%) | 15 (0.8%) |
Income Below Poverty Among Single-Parent Households in Oakville
According to the poverty data in Oakville, 8.8% or 15 single-father households and 10.0% or 36 single-mother households are living below the poverty line. Among single-father households, those with 1 or 2 children have the highest poverty rate, with 15 households (30.6%) experiencing poverty. Likewise, among single-mother households, those with 3 or 4 children have the highest poverty rate, with 21 households (100.0%) falling below the poverty line.
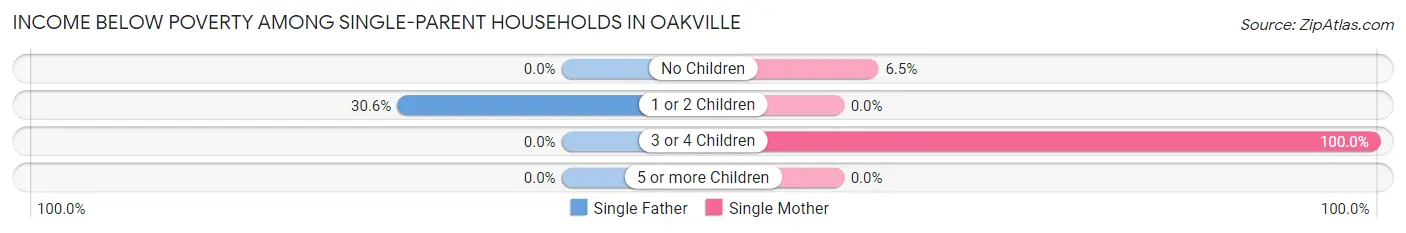
| Children | Single Father | Single Mother |
| No Children | 0 (0.0%) | 15 (6.5%) |
| 1 or 2 Children | 15 (30.6%) | 0 (0.0%) |
| 3 or 4 Children | 0 (0.0%) | 21 (100.0%) |
| 5 or more Children | 0 (0.0%) | 0 (0.0%) |
| Total | 15 (8.8%) | 36 (10.0%) |
Income Below Poverty Among Married-Couple vs Single-Parent Households in Oakville
The poverty data for Oakville shows that 15 of the married-couple family households (0.8%) and 51 of the single-parent households (9.6%) are living below the poverty level. Within the married-couple family households, those with no children have the highest poverty rate, with 15 households (1.2%) falling below the poverty line. Among the single-parent households, those with 3 or 4 children have the highest poverty rate, with 21 household (100.0%) living below poverty.
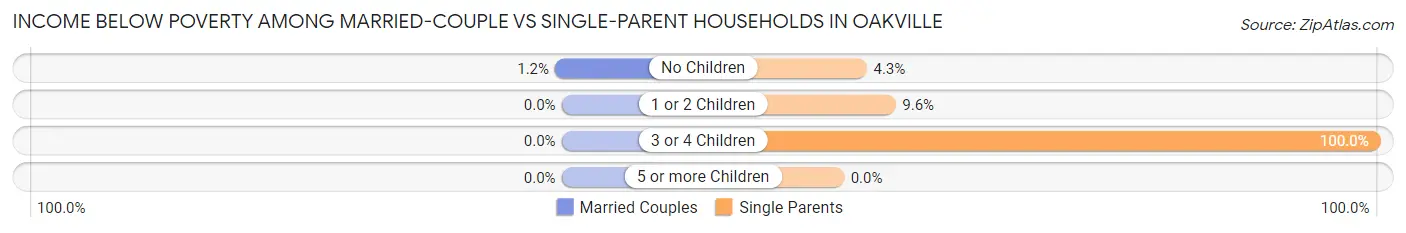
| Children | Married-Couple Families | Single-Parent Households |
| No Children | 15 (1.2%) | 15 (4.3%) |
| 1 or 2 Children | 0 (0.0%) | 15 (9.6%) |
| 3 or 4 Children | 0 (0.0%) | 21 (100.0%) |
| 5 or more Children | 0 (0.0%) | 0 (0.0%) |
| Total | 15 (0.8%) | 51 (9.6%) |
Race in Oakville
The most populous races in Oakville are White / Caucasian (8,413 | 89.6%), Hispanic or Latino (1,380 | 14.7%), and Two or more Races (580 | 6.2%).
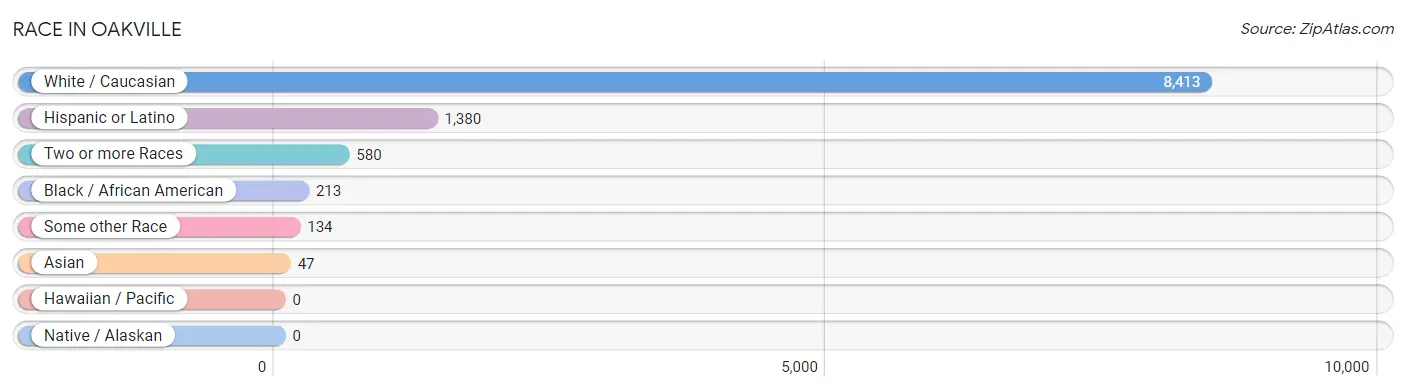
| Race | # Population | % Population |
| Asian | 47 | 0.5% |
| Black / African American | 213 | 2.3% |
| Hawaiian / Pacific | 0 | 0.0% |
| Hispanic or Latino | 1,380 | 14.7% |
| Native / Alaskan | 0 | 0.0% |
| White / Caucasian | 8,413 | 89.6% |
| Two or more Races | 580 | 6.2% |
| Some other Race | 134 | 1.4% |
| Total | 9,387 | 100.0% |
Ancestry in Oakville
The most populous ancestries reported in Oakville are Italian (2,719 | 29.0%), Irish (1,310 | 14.0%), German (853 | 9.1%), French (793 | 8.5%), and Central American (569 | 6.1%), together accounting for 66.5% of all Oakville residents.
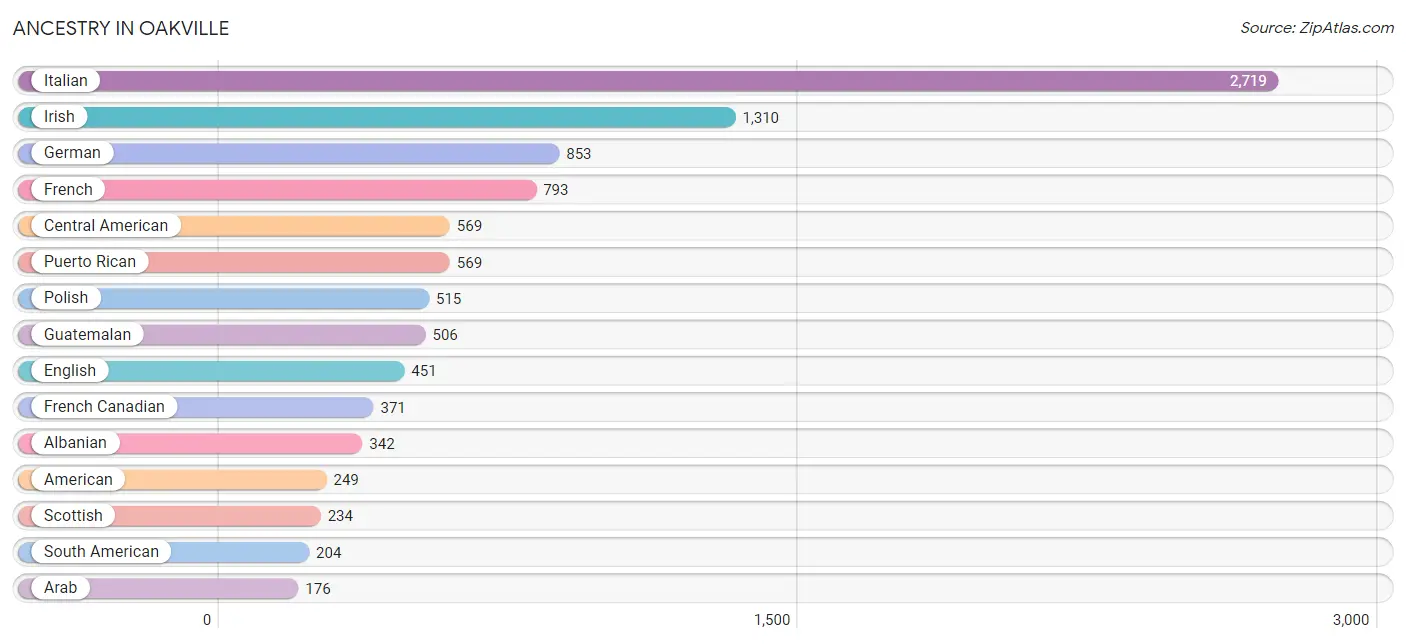
| Ancestry | # Population | % Population |
| Albanian | 342 | 3.6% |
| American | 249 | 2.6% |
| Arab | 176 | 1.9% |
| Argentinean | 23 | 0.3% |
| Bhutanese | 30 | 0.3% |
| Brazilian | 37 | 0.4% |
| British | 20 | 0.2% |
| British West Indian | 30 | 0.3% |
| Burmese | 81 | 0.9% |
| Canadian | 109 | 1.2% |
| Central American | 569 | 6.1% |
| Choctaw | 9 | 0.1% |
| Colombian | 148 | 1.6% |
| Croatian | 14 | 0.2% |
| Czech | 16 | 0.2% |
| Czechoslovakian | 45 | 0.5% |
| Dominican | 38 | 0.4% |
| Dutch | 1 | 0.0% |
| Egyptian | 143 | 1.5% |
| English | 451 | 4.8% |
| European | 59 | 0.6% |
| French | 793 | 8.5% |
| French Canadian | 371 | 4.0% |
| German | 853 | 9.1% |
| Greek | 11 | 0.1% |
| Guatemalan | 506 | 5.4% |
| Haitian | 63 | 0.7% |
| Honduran | 63 | 0.7% |
| Hungarian | 31 | 0.3% |
| Indian (Asian) | 14 | 0.2% |
| Irish | 1,310 | 14.0% |
| Italian | 2,719 | 29.0% |
| Korean | 33 | 0.4% |
| Lithuanian | 134 | 1.4% |
| Macedonian | 99 | 1.1% |
| Polish | 515 | 5.5% |
| Portuguese | 66 | 0.7% |
| Puerto Rican | 569 | 6.1% |
| Russian | 36 | 0.4% |
| Scotch-Irish | 13 | 0.1% |
| Scottish | 234 | 2.5% |
| Slovak | 64 | 0.7% |
| South American | 204 | 2.2% |
| South American Indian | 168 | 1.8% |
| Swedish | 21 | 0.2% |
| Swiss | 9 | 0.1% |
| Ukrainian | 74 | 0.8% |
| Venezuelan | 33 | 0.4% |
| Welsh | 64 | 0.7% | View All 49 Rows |
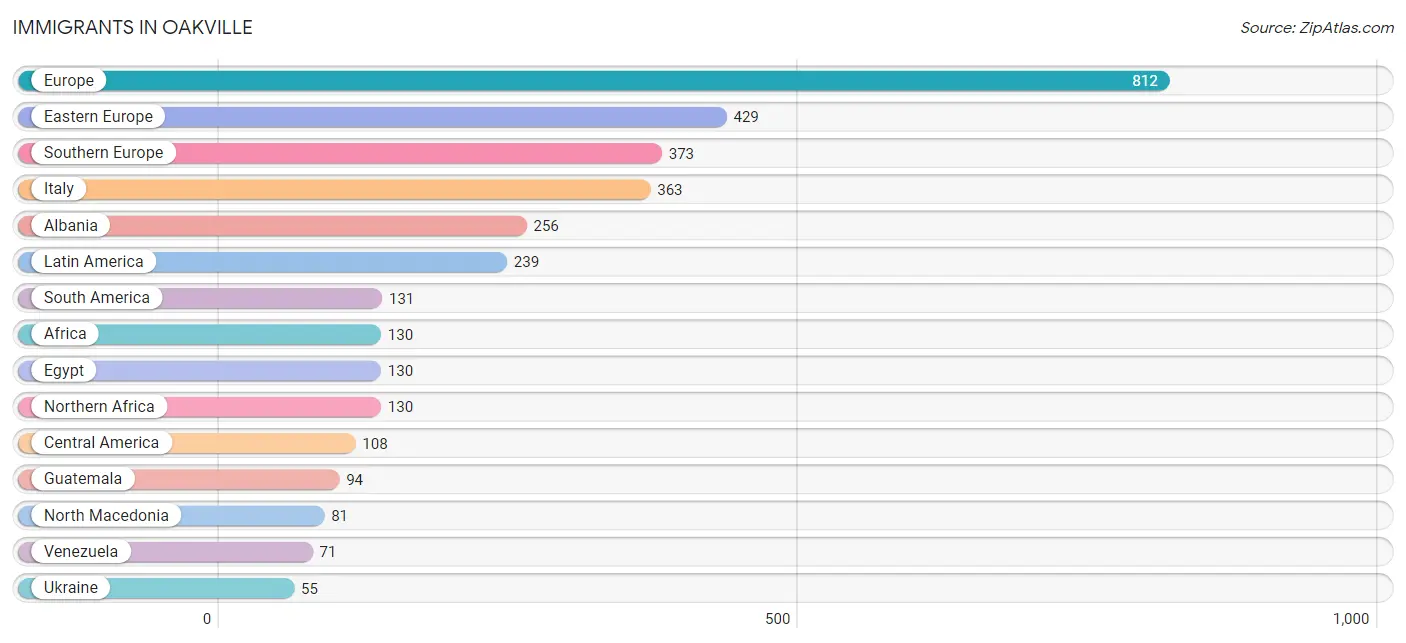
Immigrants in Oakville
The most numerous immigrant groups reported in Oakville came from Europe (812 | 8.6%), Eastern Europe (429 | 4.6%), Southern Europe (373 | 4.0%), Italy (363 | 3.9%), and Albania (256 | 2.7%), together accounting for 23.8% of all Oakville residents.
| Immigration Origin | # Population | % Population |
| Africa | 130 | 1.4% |
| Albania | 256 | 2.7% |
| Argentina | 23 | 0.3% |
| Asia | 33 | 0.4% |
| Australia | 14 | 0.2% |
| Brazil | 37 | 0.4% |
| Canada | 9 | 0.1% |
| Central America | 108 | 1.1% |
| Eastern Europe | 429 | 4.6% |
| Egypt | 130 | 1.4% |
| Europe | 812 | 8.6% |
| Guatemala | 94 | 1.0% |
| Honduras | 14 | 0.2% |
| Italy | 363 | 3.9% |
| Latin America | 239 | 2.5% |
| Lithuania | 9 | 0.1% |
| North Macedonia | 81 | 0.9% |
| Northern Africa | 130 | 1.4% |
| Northern Europe | 10 | 0.1% |
| Oceania | 14 | 0.2% |
| Philippines | 33 | 0.4% |
| Poland | 28 | 0.3% |
| South America | 131 | 1.4% |
| South Eastern Asia | 33 | 0.4% |
| Southern Europe | 373 | 4.0% |
| Ukraine | 55 | 0.6% |
| Venezuela | 71 | 0.8% | View All 27 Rows |
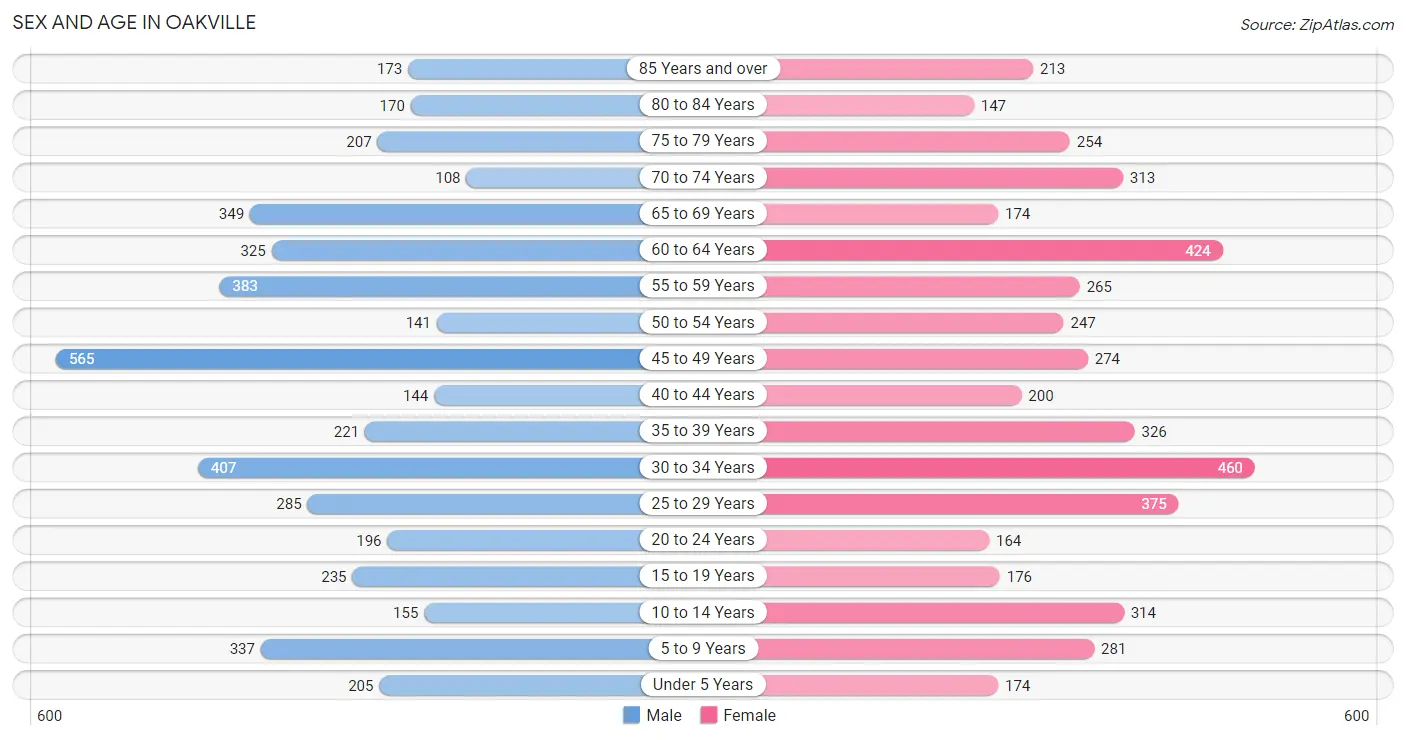
Sex and Age in Oakville
Sex and Age in Oakville
The most populous age groups in Oakville are 45 to 49 Years (565 | 12.3%) for men and 30 to 34 Years (460 | 9.6%) for women.
| Age Bracket | Male | Female |
| Under 5 Years | 205 (4.4%) | 174 (3.6%) |
| 5 to 9 Years | 337 (7.3%) | 281 (5.9%) |
| 10 to 14 Years | 155 (3.4%) | 314 (6.6%) |
| 15 to 19 Years | 235 (5.1%) | 176 (3.7%) |
| 20 to 24 Years | 196 (4.3%) | 164 (3.4%) |
| 25 to 29 Years | 285 (6.2%) | 375 (7.8%) |
| 30 to 34 Years | 407 (8.8%) | 460 (9.6%) |
| 35 to 39 Years | 221 (4.8%) | 326 (6.8%) |
| 40 to 44 Years | 144 (3.1%) | 200 (4.2%) |
| 45 to 49 Years | 565 (12.3%) | 274 (5.7%) |
| 50 to 54 Years | 141 (3.1%) | 247 (5.2%) |
| 55 to 59 Years | 383 (8.3%) | 265 (5.5%) |
| 60 to 64 Years | 325 (7.1%) | 424 (8.9%) |
| 65 to 69 Years | 349 (7.6%) | 174 (3.6%) |
| 70 to 74 Years | 108 (2.3%) | 313 (6.6%) |
| 75 to 79 Years | 207 (4.5%) | 254 (5.3%) |
| 80 to 84 Years | 170 (3.7%) | 147 (3.1%) |
| 85 Years and over | 173 (3.8%) | 213 (4.5%) |
| Total | 4,606 (100.0%) | 4,781 (100.0%) |
Families and Households in Oakville
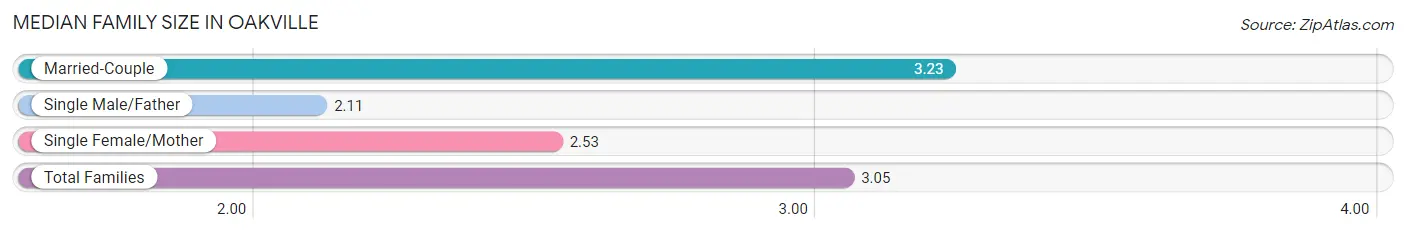
Median Family Size in Oakville
The median family size in Oakville is 3.05 persons per family, with married-couple families (1,920 | 78.4%) accounting for the largest median family size of 3.23 persons per family. On the other hand, single male/father families (170 | 6.9%) represent the smallest median family size with 2.11 persons per family.
| Family Type | # Families | Family Size |
| Married-Couple | 1,920 (78.4%) | 3.23 |
| Single Male/Father | 170 (6.9%) | 2.11 |
| Single Female/Mother | 359 (14.7%) | 2.53 |
| Total Families | 2,449 (100.0%) | 3.05 |
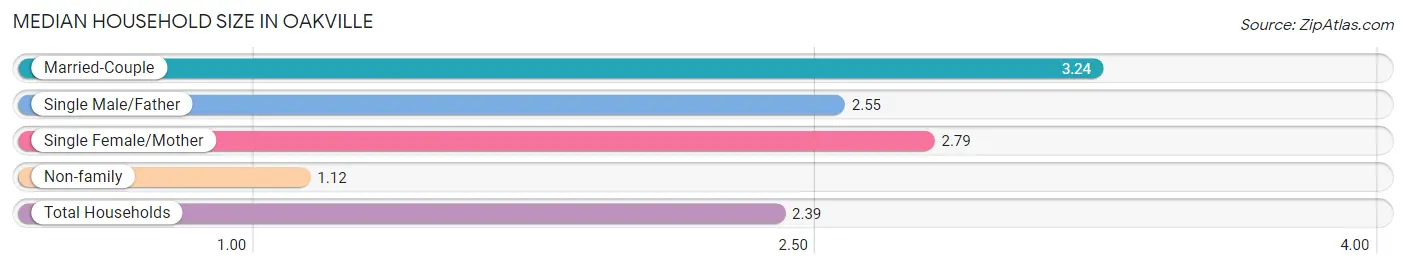
Median Household Size in Oakville
The median household size in Oakville is 2.39 persons per household, with married-couple households (1,920 | 49.8%) accounting for the largest median household size of 3.24 persons per household. non-family households (1,407 | 36.5%) represent the smallest median household size with 1.12 persons per household.
| Household Type | # Households | Household Size |
| Married-Couple | 1,920 (49.8%) | 3.24 |
| Single Male/Father | 170 (4.4%) | 2.55 |
| Single Female/Mother | 359 (9.3%) | 2.79 |
| Non-family | 1,407 (36.5%) | 1.12 |
| Total Households | 3,856 (100.0%) | 2.39 |
Household Size by Marriage Status in Oakville
Out of a total of 3,856 households in Oakville, 2,449 (63.5%) are family households, while 1,407 (36.5%) are nonfamily households. The most numerous type of family households are 2-person households, comprising 1,227, and the most common type of nonfamily households are 1-person households, comprising 1,213.
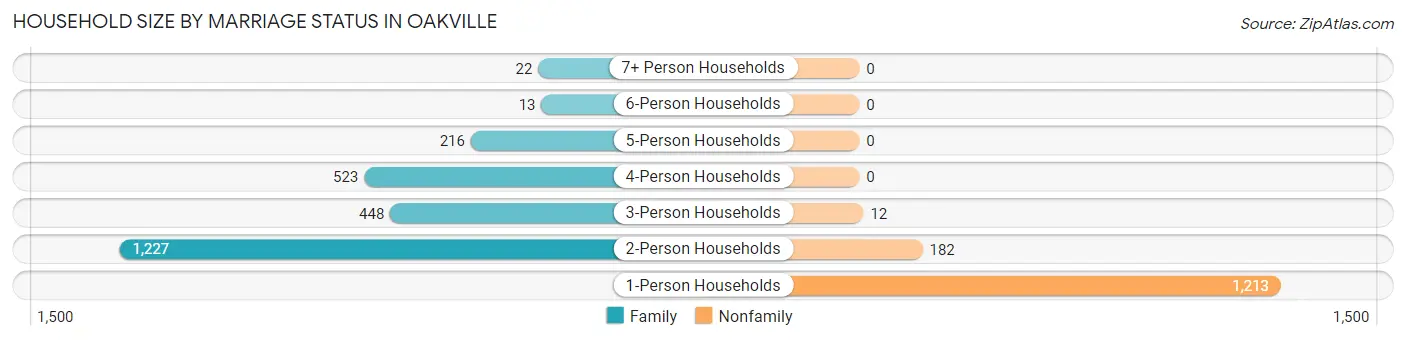
| Household Size | Family Households | Nonfamily Households |
| 1-Person Households | - | 1,213 (31.5%) |
| 2-Person Households | 1,227 (31.8%) | 182 (4.7%) |
| 3-Person Households | 448 (11.6%) | 12 (0.3%) |
| 4-Person Households | 523 (13.6%) | 0 (0.0%) |
| 5-Person Households | 216 (5.6%) | 0 (0.0%) |
| 6-Person Households | 13 (0.3%) | 0 (0.0%) |
| 7+ Person Households | 22 (0.6%) | 0 (0.0%) |
| Total | 2,449 (63.5%) | 1,407 (36.5%) |
Female Fertility in Oakville
Fertility by Age in Oakville
Average fertility rate in Oakville is 16.0 births per 1,000 women. Women in the age bracket of 20 to 34 years have the highest fertility rate with 33.0 births per 1,000 women. Women in the age bracket of 20 to 34 years acount for 100.0% of all women with births.
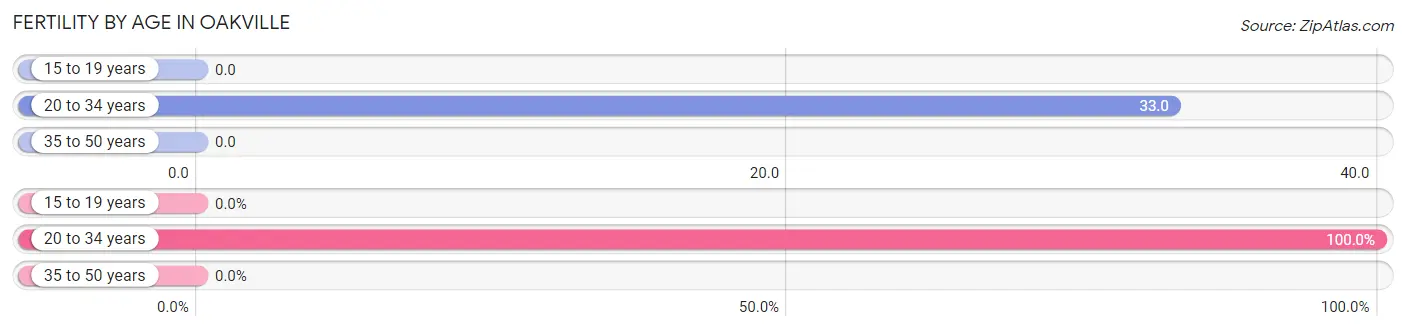
| Age Bracket | Women with Births | Births / 1,000 Women |
| 15 to 19 years | 0 (0.0%) | 0.0 |
| 20 to 34 years | 33 (100.0%) | 33.0 |
| 35 to 50 years | 0 (0.0%) | 0.0 |
| Total | 33 (100.0%) | 16.0 |
Fertility by Age by Marriage Status in Oakville
51.5% of women with births (33) in Oakville are married. The highest percentage of unmarried women with births falls into 20 to 34 years age bracket with 48.5% of them unmarried at the time of birth, while the lowest percentage of unmarried women with births belong to 20 to 34 years age bracket with 48.5% of them unmarried.
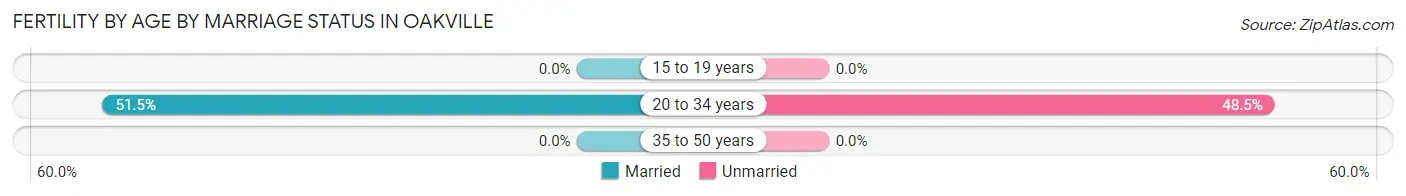
| Age Bracket | Married | Unmarried |
| 15 to 19 years | 0 (0.0%) | 0 (0.0%) |
| 20 to 34 years | 17 (51.5%) | 16 (48.5%) |
| 35 to 50 years | 0 (0.0%) | 0 (0.0%) |
| Total | 17 (51.5%) | 16 (48.5%) |
Fertility by Education in Oakville
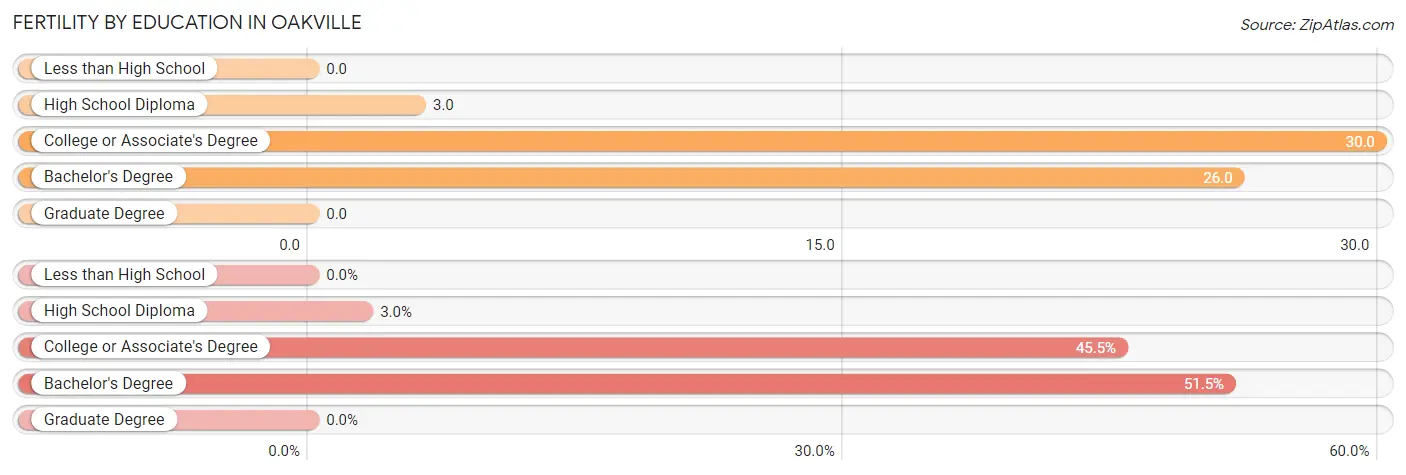
| Educational Attainment | Women with Births | Births / 1,000 Women |
| Less than High School | 0 (0.0%) | 0.0 |
| High School Diploma | 1 (3.0%) | 3.0 |
| College or Associate's Degree | 15 (45.5%) | 30.0 |
| Bachelor's Degree | 17 (51.5%) | 26.0 |
| Graduate Degree | 0 (0.0%) | 0.0 |
| Total | 33 (100.0%) | 16.0 |
Fertility by Education by Marriage Status in Oakville
48.5% of women with births in Oakville are unmarried. Women with the educational attainment of bachelor's degree are most likely to be married with 100.0% of them married at childbirth, while women with the educational attainment of high school diploma are least likely to be married with 100.0% of them unmarried at childbirth.
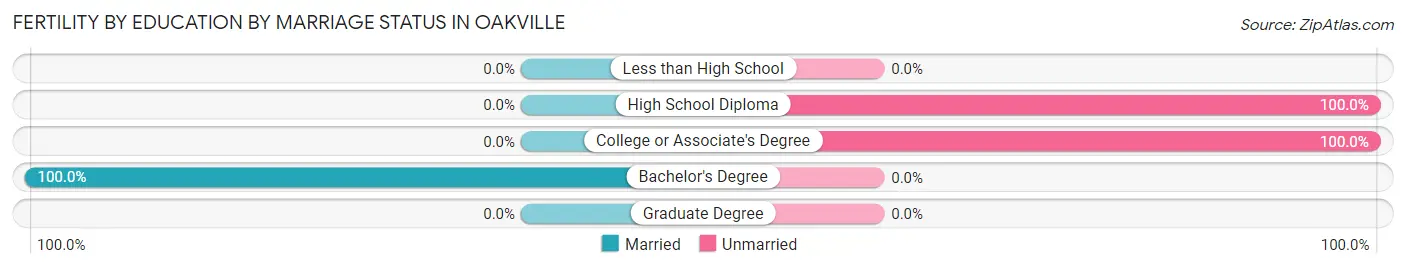
| Educational Attainment | Married | Unmarried |
| Less than High School | 0 (0.0%) | 0 (0.0%) |
| High School Diploma | 0 (0.0%) | 1 (100.0%) |
| College or Associate's Degree | 0 (0.0%) | 15 (100.0%) |
| Bachelor's Degree | 17 (100.0%) | 0 (0.0%) |
| Graduate Degree | 0 (0.0%) | 0 (0.0%) |
| Total | 17 (51.5%) | 16 (48.5%) |
Employment Characteristics in Oakville
Employment by Class of Employer in Oakville
Among the 5,144 employed individuals in Oakville, private company employees (3,529 | 68.6%), not-for-profit organizations (499 | 9.7%), and local government employees (490 | 9.5%) make up the most common classes of employment.
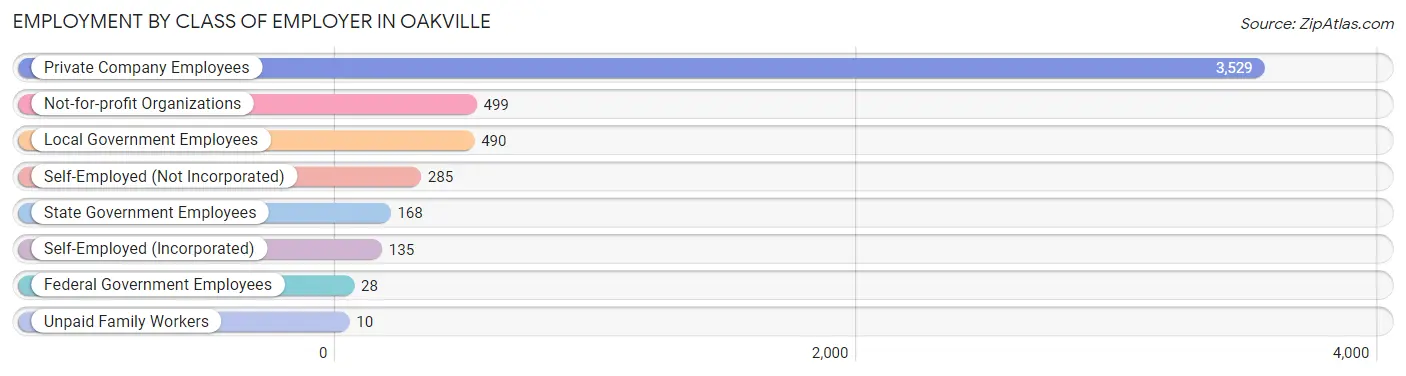
| Employer Class | # Employees | % Employees |
| Private Company Employees | 3,529 | 68.6% |
| Self-Employed (Incorporated) | 135 | 2.6% |
| Self-Employed (Not Incorporated) | 285 | 5.5% |
| Not-for-profit Organizations | 499 | 9.7% |
| Local Government Employees | 490 | 9.5% |
| State Government Employees | 168 | 3.3% |
| Federal Government Employees | 28 | 0.5% |
| Unpaid Family Workers | 10 | 0.2% |
| Total | 5,144 | 100.0% |
Employment Status by Age in Oakville
According to the labor force statistics for Oakville, out of the total population over 16 years of age (7,878), 68.3% or 5,381 individuals are in the labor force, with 2.4% or 129 of them unemployed. The age group with the highest labor force participation rate is 30 to 34 years, with 100.0% or 867 individuals in the labor force. Within the labor force, the 75 years and over age range has the highest percentage of unemployed individuals, with 13.8% or 9 of them being unemployed.
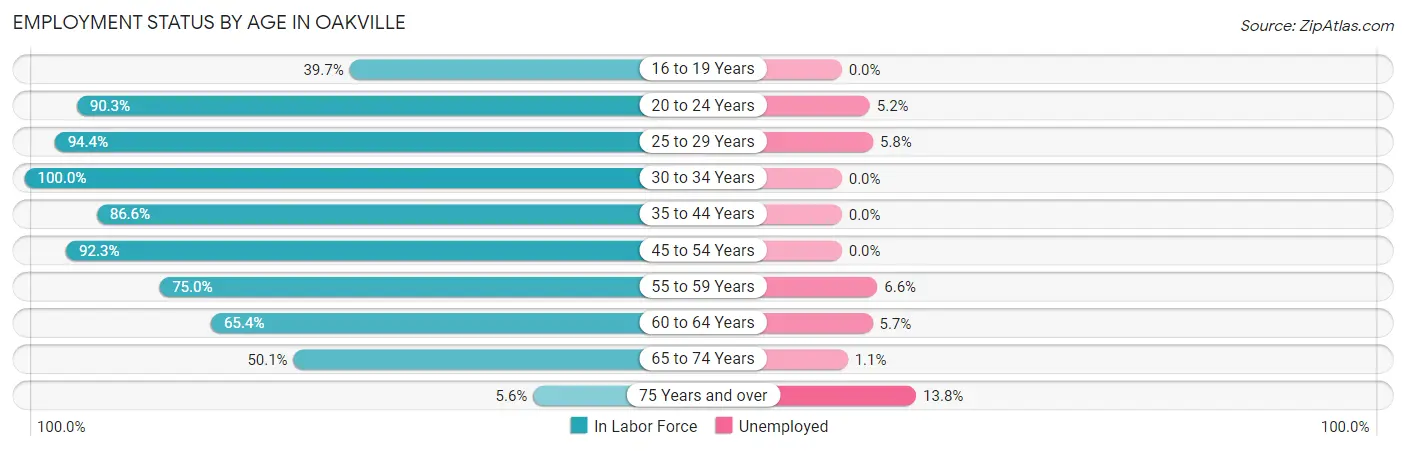
| Age Bracket | In Labor Force | Unemployed |
| 16 to 19 Years | 146 (39.7%) | 0 (0.0%) |
| 20 to 24 Years | 325 (90.3%) | 17 (5.2%) |
| 25 to 29 Years | 623 (94.4%) | 36 (5.8%) |
| 30 to 34 Years | 867 (100.0%) | 0 (0.0%) |
| 35 to 44 Years | 772 (86.6%) | 0 (0.0%) |
| 45 to 54 Years | 1,133 (92.3%) | 0 (0.0%) |
| 55 to 59 Years | 486 (75.0%) | 32 (6.6%) |
| 60 to 64 Years | 490 (65.4%) | 28 (5.7%) |
| 65 to 74 Years | 473 (50.1%) | 5 (1.1%) |
| 75 Years and over | 65 (5.6%) | 9 (13.8%) |
| Total | 5,381 (68.3%) | 129 (2.4%) |
Employment Status by Educational Attainment in Oakville
According to labor force statistics for Oakville, 86.7% of individuals (4,371) out of the total population between 25 and 64 years of age (5,042) are in the labor force, with 2.2% or 96 of them being unemployed. The group with the highest labor force participation rate are those with the educational attainment of bachelor's degree or higher, with 95.1% or 1,525 individuals in the labor force. Within the labor force, individuals with less than high school education have the highest percentage of unemployment, with 10.1% or 28 of them being unemployed.
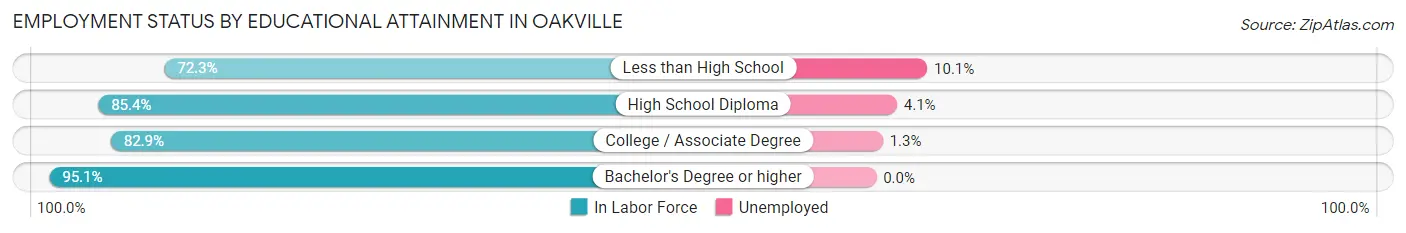
| Educational Attainment | In Labor Force | Unemployed |
| Less than High School | 276 (72.3%) | 39 (10.1%) |
| High School Diploma | 1,230 (85.4%) | 59 (4.1%) |
| College / Associate Degree | 1,340 (82.9%) | 21 (1.3%) |
| Bachelor's Degree or higher | 1,525 (95.1%) | 0 (0.0%) |
| Total | 4,371 (86.7%) | 111 (2.2%) |
Employment Occupations by Sex in Oakville
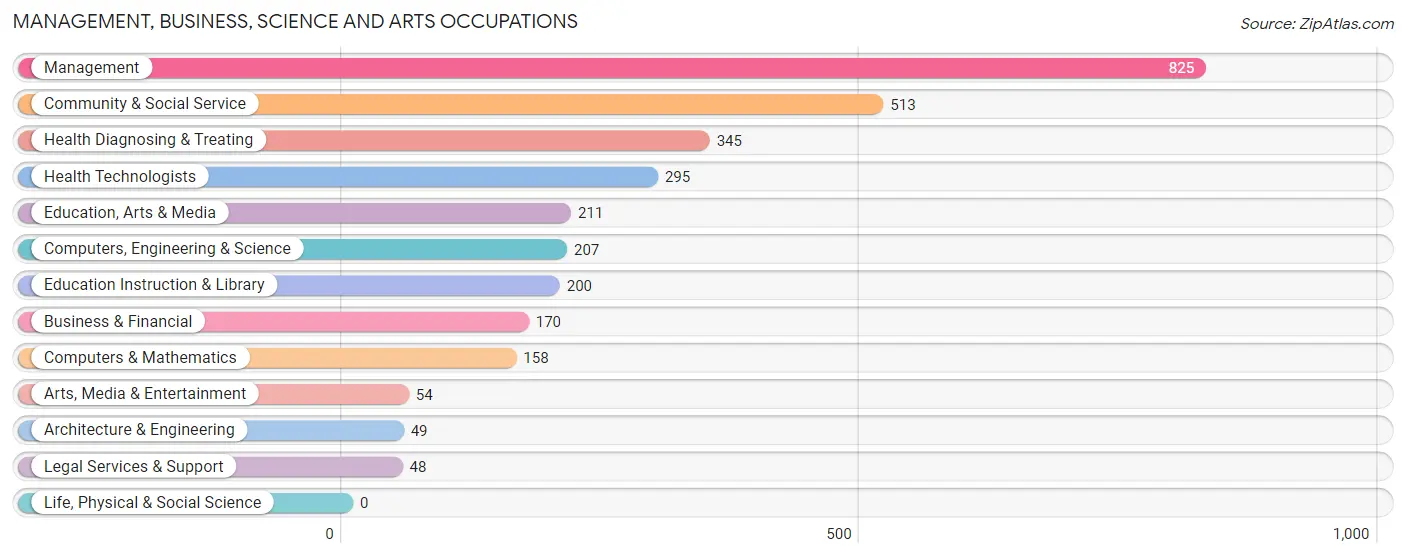
Management, Business, Science and Arts Occupations
The most common Management, Business, Science and Arts occupations in Oakville are Management (825 | 15.7%), Community & Social Service (513 | 9.8%), Health Diagnosing & Treating (345 | 6.6%), Health Technologists (295 | 5.6%), and Education, Arts & Media (211 | 4.0%).
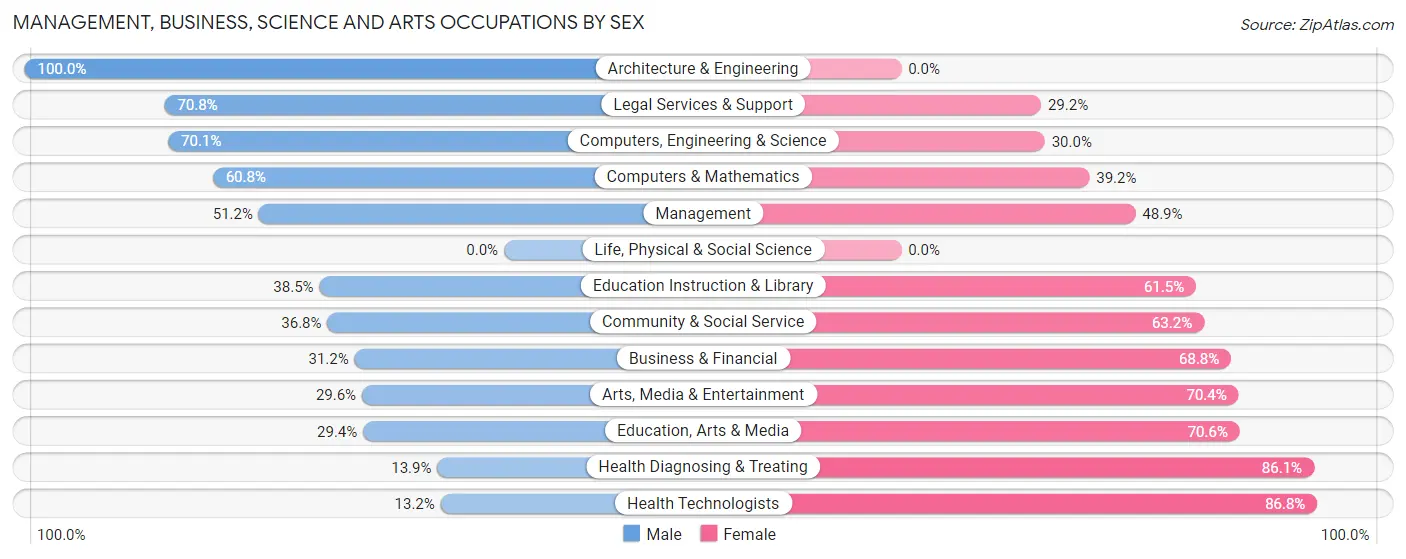
Management, Business, Science and Arts Occupations by Sex
Within the Management, Business, Science and Arts occupations in Oakville, the most male-oriented occupations are Architecture & Engineering (100.0%), Legal Services & Support (70.8%), and Computers, Engineering & Science (70.1%), while the most female-oriented occupations are Health Technologists (86.8%), Health Diagnosing & Treating (86.1%), and Education, Arts & Media (70.6%).
| Occupation | Male | Female |
| Management | 422 (51.1%) | 403 (48.8%) |
| Business & Financial | 53 (31.2%) | 117 (68.8%) |
| Computers, Engineering & Science | 145 (70.1%) | 62 (29.9%) |
| Computers & Mathematics | 96 (60.8%) | 62 (39.2%) |
| Architecture & Engineering | 49 (100.0%) | 0 (0.0%) |
| Life, Physical & Social Science | 0 (0.0%) | 0 (0.0%) |
| Community & Social Service | 189 (36.8%) | 324 (63.2%) |
| Education, Arts & Media | 62 (29.4%) | 149 (70.6%) |
| Legal Services & Support | 34 (70.8%) | 14 (29.2%) |
| Education Instruction & Library | 77 (38.5%) | 123 (61.5%) |
| Arts, Media & Entertainment | 16 (29.6%) | 38 (70.4%) |
| Health Diagnosing & Treating | 48 (13.9%) | 297 (86.1%) |
| Health Technologists | 39 (13.2%) | 256 (86.8%) |
| Total (Category) | 857 (41.6%) | 1,203 (58.4%) |
| Total (Overall) | 2,875 (54.7%) | 2,378 (45.3%) |
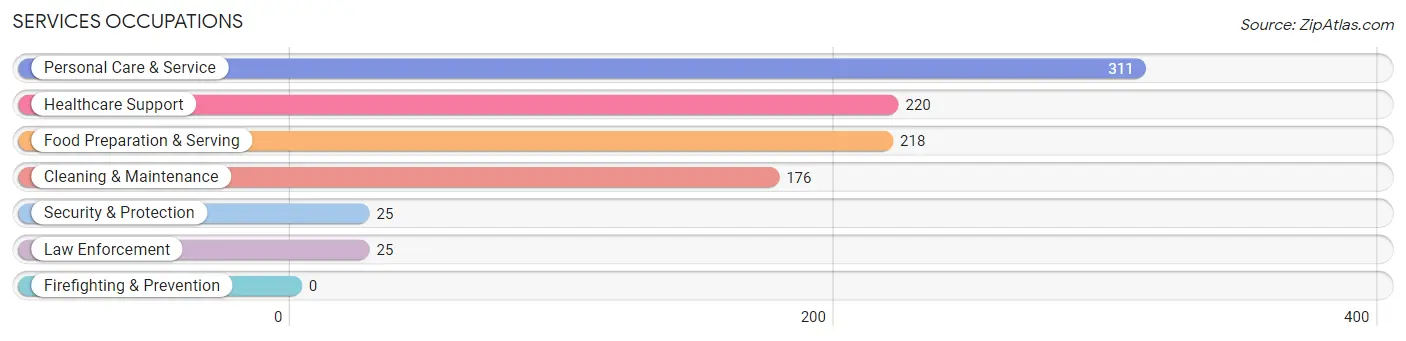
Services Occupations
The most common Services occupations in Oakville are Personal Care & Service (311 | 5.9%), Healthcare Support (220 | 4.2%), Food Preparation & Serving (218 | 4.2%), Cleaning & Maintenance (176 | 3.4%), and Security & Protection (25 | 0.5%).
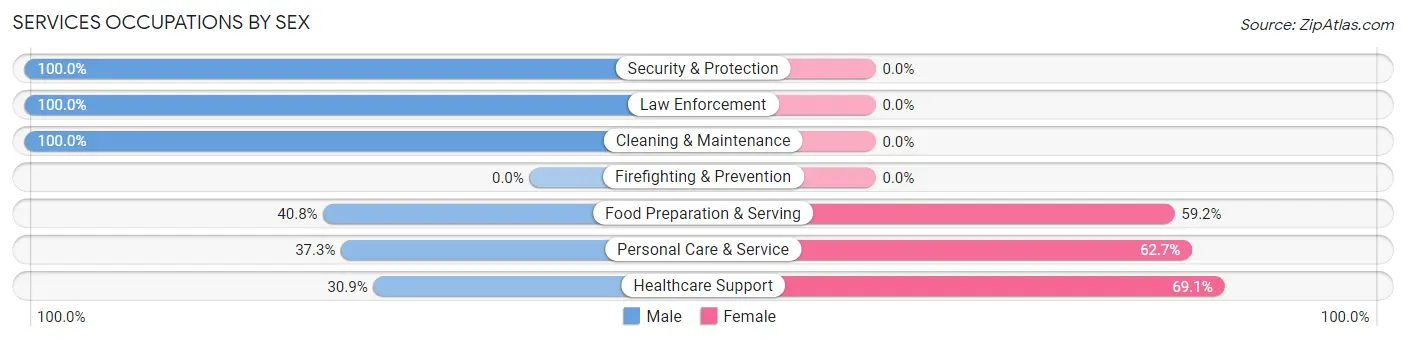
Services Occupations by Sex
Within the Services occupations in Oakville, the most male-oriented occupations are Security & Protection (100.0%), Law Enforcement (100.0%), and Cleaning & Maintenance (100.0%), while the most female-oriented occupations are Healthcare Support (69.1%), Personal Care & Service (62.7%), and Food Preparation & Serving (59.2%).
| Occupation | Male | Female |
| Healthcare Support | 68 (30.9%) | 152 (69.1%) |
| Security & Protection | 25 (100.0%) | 0 (0.0%) |
| Firefighting & Prevention | 0 (0.0%) | 0 (0.0%) |
| Law Enforcement | 25 (100.0%) | 0 (0.0%) |
| Food Preparation & Serving | 89 (40.8%) | 129 (59.2%) |
| Cleaning & Maintenance | 176 (100.0%) | 0 (0.0%) |
| Personal Care & Service | 116 (37.3%) | 195 (62.7%) |
| Total (Category) | 474 (49.9%) | 476 (50.1%) |
| Total (Overall) | 2,875 (54.7%) | 2,378 (45.3%) |
Sales and Office Occupations
The most common Sales and Office occupations in Oakville are Sales & Related (469 | 8.9%), and Office & Administration (432 | 8.2%).
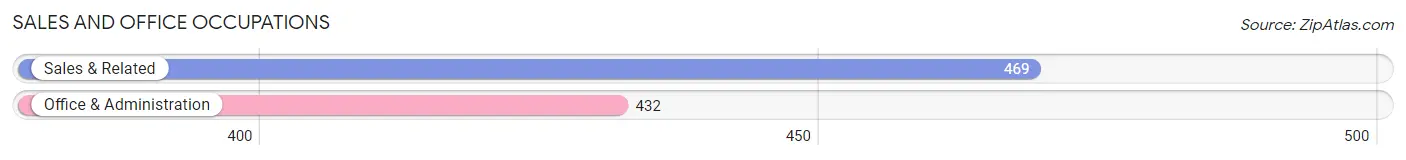
Sales and Office Occupations by Sex
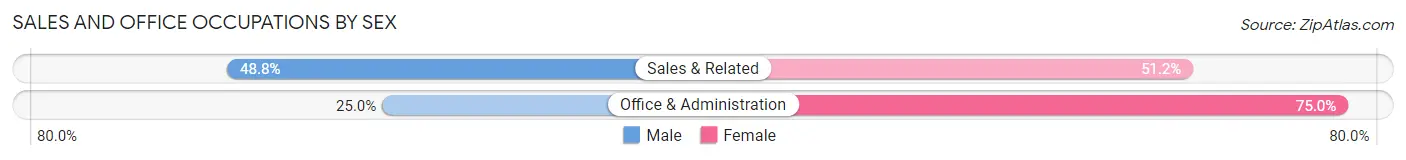
| Occupation | Male | Female |
| Sales & Related | 229 (48.8%) | 240 (51.2%) |
| Office & Administration | 108 (25.0%) | 324 (75.0%) |
| Total (Category) | 337 (37.4%) | 564 (62.6%) |
| Total (Overall) | 2,875 (54.7%) | 2,378 (45.3%) |
Natural Resources, Construction and Maintenance Occupations
The most common Natural Resources, Construction and Maintenance occupations in Oakville are Construction & Extraction (317 | 6.0%), Installation, Maintenance & Repair (248 | 4.7%), and Farming, Fishing & Forestry (173 | 3.3%).
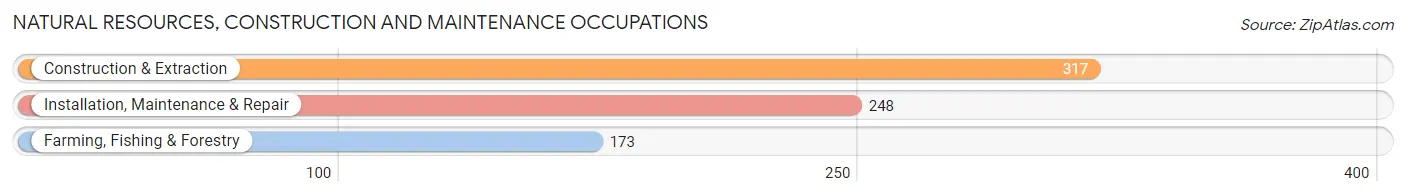
Natural Resources, Construction and Maintenance Occupations by Sex
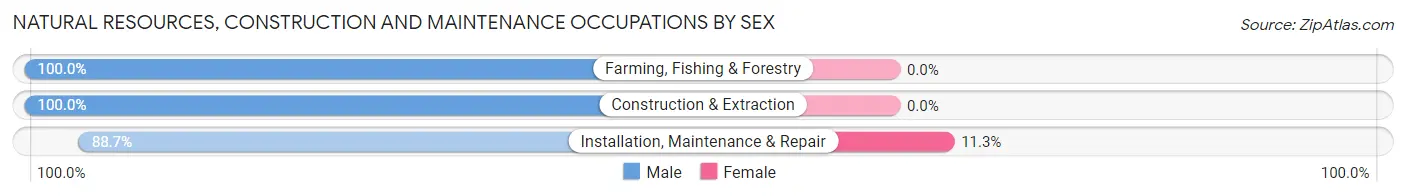
| Occupation | Male | Female |
| Farming, Fishing & Forestry | 173 (100.0%) | 0 (0.0%) |
| Construction & Extraction | 317 (100.0%) | 0 (0.0%) |
| Installation, Maintenance & Repair | 220 (88.7%) | 28 (11.3%) |
| Total (Category) | 710 (96.2%) | 28 (3.8%) |
| Total (Overall) | 2,875 (54.7%) | 2,378 (45.3%) |
Production, Transportation and Moving Occupations
The most common Production, Transportation and Moving occupations in Oakville are Production (351 | 6.7%), Transportation (129 | 2.5%), and Material Moving (124 | 2.4%).
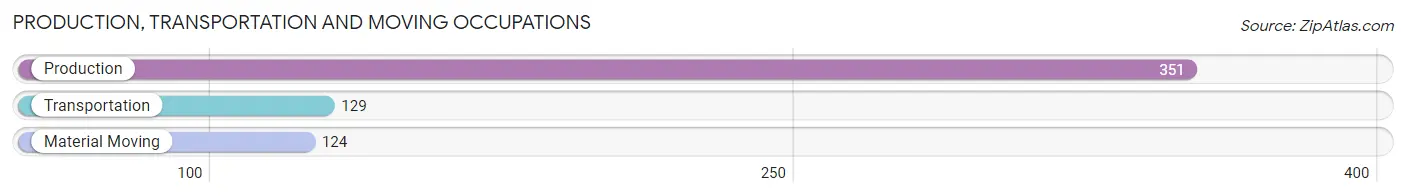
Production, Transportation and Moving Occupations by Sex
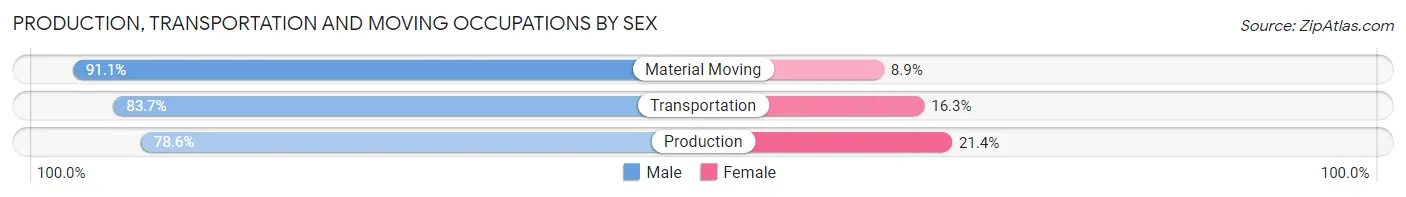
| Occupation | Male | Female |
| Production | 276 (78.6%) | 75 (21.4%) |
| Transportation | 108 (83.7%) | 21 (16.3%) |
| Material Moving | 113 (91.1%) | 11 (8.9%) |
| Total (Category) | 497 (82.3%) | 107 (17.7%) |
| Total (Overall) | 2,875 (54.7%) | 2,378 (45.3%) |
Employment Industries by Sex in Oakville
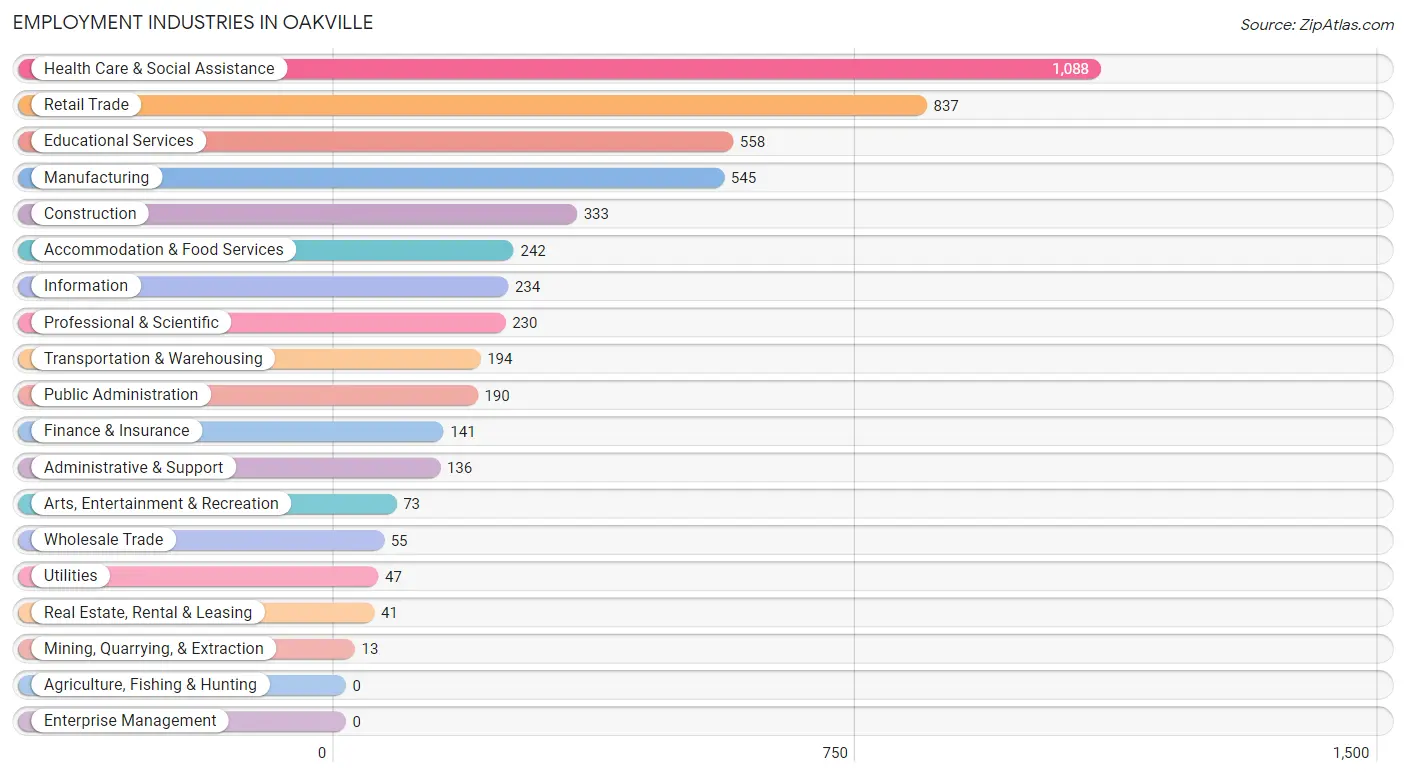
Employment Industries in Oakville
The major employment industries in Oakville include Health Care & Social Assistance (1,088 | 20.7%), Retail Trade (837 | 15.9%), Educational Services (558 | 10.6%), Manufacturing (545 | 10.4%), and Construction (333 | 6.3%).
Employment Industries by Sex in Oakville
The Oakville industries that see more men than women are Mining, Quarrying, & Extraction (100.0%), Wholesale Trade (100.0%), and Utilities (100.0%), whereas the industries that tend to have a higher number of women are Arts, Entertainment & Recreation (78.1%), Health Care & Social Assistance (69.1%), and Educational Services (63.8%).
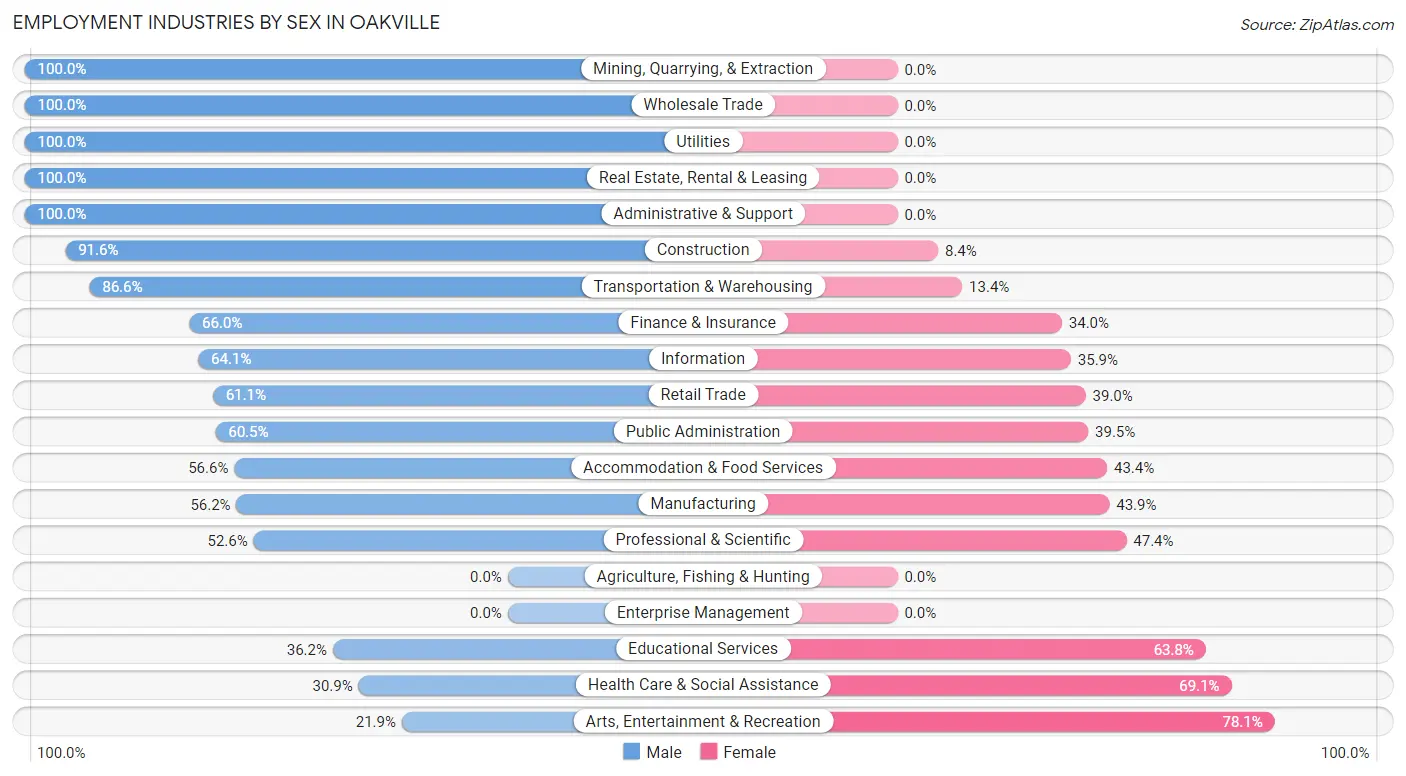
| Industry | Male | Female |
| Agriculture, Fishing & Hunting | 0 (0.0%) | 0 (0.0%) |
| Mining, Quarrying, & Extraction | 13 (100.0%) | 0 (0.0%) |
| Construction | 305 (91.6%) | 28 (8.4%) |
| Manufacturing | 306 (56.1%) | 239 (43.9%) |
| Wholesale Trade | 55 (100.0%) | 0 (0.0%) |
| Retail Trade | 511 (61.1%) | 326 (39.0%) |
| Transportation & Warehousing | 168 (86.6%) | 26 (13.4%) |
| Utilities | 47 (100.0%) | 0 (0.0%) |
| Information | 150 (64.1%) | 84 (35.9%) |
| Finance & Insurance | 93 (66.0%) | 48 (34.0%) |
| Real Estate, Rental & Leasing | 41 (100.0%) | 0 (0.0%) |
| Professional & Scientific | 121 (52.6%) | 109 (47.4%) |
| Enterprise Management | 0 (0.0%) | 0 (0.0%) |
| Administrative & Support | 136 (100.0%) | 0 (0.0%) |
| Educational Services | 202 (36.2%) | 356 (63.8%) |
| Health Care & Social Assistance | 336 (30.9%) | 752 (69.1%) |
| Arts, Entertainment & Recreation | 16 (21.9%) | 57 (78.1%) |
| Accommodation & Food Services | 137 (56.6%) | 105 (43.4%) |
| Public Administration | 115 (60.5%) | 75 (39.5%) |
| Total | 2,875 (54.7%) | 2,378 (45.3%) |
Education in Oakville
School Enrollment in Oakville
The most common levels of schooling among the 1,959 students in Oakville are middle school (432 | 22.1%), elementary school (431 | 22.0%), and high school (365 | 18.6%).
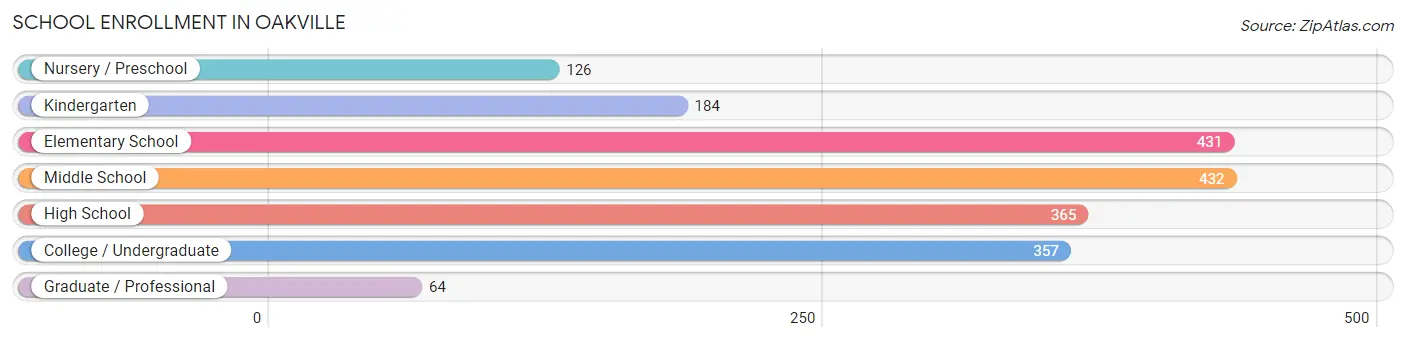
| School Level | # Students | % Students |
| Nursery / Preschool | 126 | 6.4% |
| Kindergarten | 184 | 9.4% |
| Elementary School | 431 | 22.0% |
| Middle School | 432 | 22.1% |
| High School | 365 | 18.6% |
| College / Undergraduate | 357 | 18.2% |
| Graduate / Professional | 64 | 3.3% |
| Total | 1,959 | 100.0% |
School Enrollment by Age by Funding Source in Oakville
Out of a total of 1,959 students who are enrolled in schools in Oakville, 221 (11.3%) attend a private institution, while the remaining 1,738 (88.7%) are enrolled in public schools. The age group of 25 to 34 year olds has the highest likelihood of being enrolled in private schools, with 67 (36.0% in the age bracket) enrolled. Conversely, the age group of 5 to 9 year old has the lowest likelihood of being enrolled in a private school, with 618 (100.0% in the age bracket) attending a public institution.
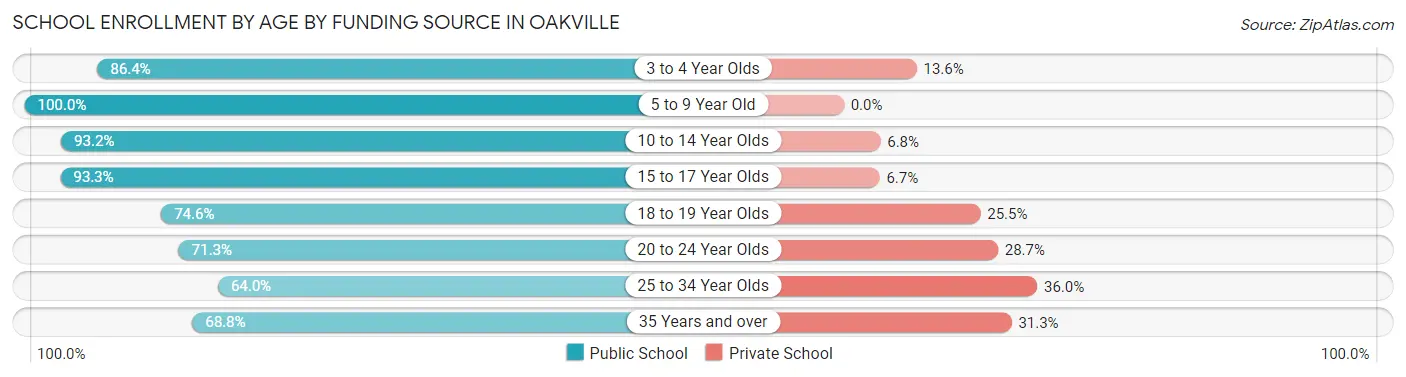
| Age Bracket | Public School | Private School |
| 3 to 4 Year Olds | 121 (86.4%) | 19 (13.6%) |
| 5 to 9 Year Old | 618 (100.0%) | 0 (0.0%) |
| 10 to 14 Year Olds | 437 (93.2%) | 32 (6.8%) |
| 15 to 17 Year Olds | 210 (93.3%) | 15 (6.7%) |
| 18 to 19 Year Olds | 123 (74.6%) | 42 (25.5%) |
| 20 to 24 Year Olds | 77 (71.3%) | 31 (28.7%) |
| 25 to 34 Year Olds | 119 (64.0%) | 67 (36.0%) |
| 35 Years and over | 33 (68.8%) | 15 (31.2%) |
| Total | 1,738 (88.7%) | 221 (11.3%) |
Educational Attainment by Field of Study in Oakville
Science & technology (426 | 18.4%), business (366 | 15.8%), education (348 | 15.0%), arts & humanities (269 | 11.6%), and liberal arts & history (173 | 7.5%) are the most common fields of study among 2,316 individuals in Oakville who have obtained a bachelor's degree or higher.
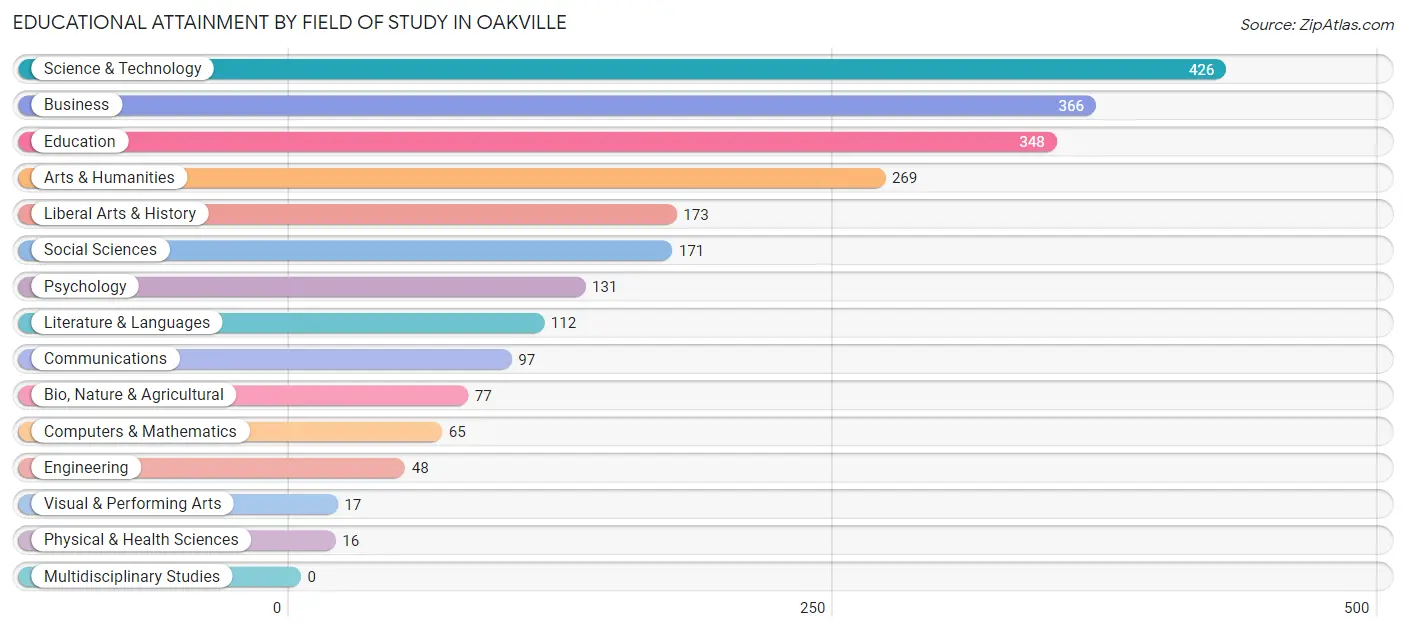
| Field of Study | # Graduates | % Graduates |
| Computers & Mathematics | 65 | 2.8% |
| Bio, Nature & Agricultural | 77 | 3.3% |
| Physical & Health Sciences | 16 | 0.7% |
| Psychology | 131 | 5.7% |
| Social Sciences | 171 | 7.4% |
| Engineering | 48 | 2.1% |
| Multidisciplinary Studies | 0 | 0.0% |
| Science & Technology | 426 | 18.4% |
| Business | 366 | 15.8% |
| Education | 348 | 15.0% |
| Literature & Languages | 112 | 4.8% |
| Liberal Arts & History | 173 | 7.5% |
| Visual & Performing Arts | 17 | 0.7% |
| Communications | 97 | 4.2% |
| Arts & Humanities | 269 | 11.6% |
| Total | 2,316 | 100.0% |
Transportation & Commute in Oakville
Vehicle Availability by Sex in Oakville
The most prevalent vehicle ownership categories in Oakville are males with 2 vehicles (901, accounting for 32.0%) and females with 2 vehicles (802, making up 38.6%).
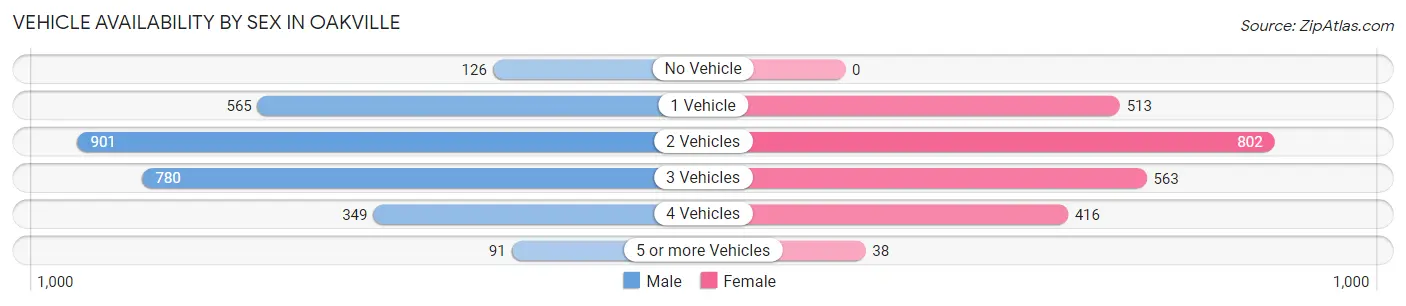
| Vehicles Available | Male | Female |
| No Vehicle | 126 (4.5%) | 0 (0.0%) |
| 1 Vehicle | 565 (20.1%) | 513 (22.0%) |
| 2 Vehicles | 901 (32.0%) | 802 (34.4%) |
| 3 Vehicles | 780 (27.7%) | 563 (24.1%) |
| 4 Vehicles | 349 (12.4%) | 416 (17.8%) |
| 5 or more Vehicles | 91 (3.2%) | 38 (1.6%) |
| Total | 2,812 (100.0%) | 2,332 (100.0%) |
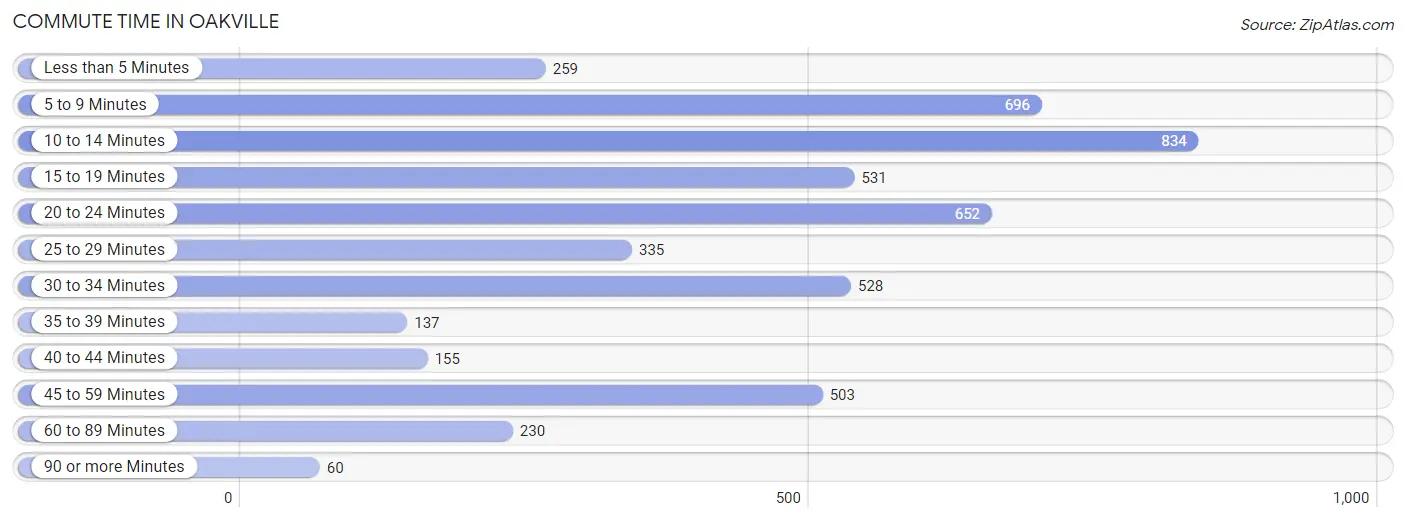
Commute Time in Oakville
The most frequently occuring commute durations in Oakville are 10 to 14 minutes (834 commuters, 17.0%), 5 to 9 minutes (696 commuters, 14.1%), and 20 to 24 minutes (652 commuters, 13.3%).
| Commute Time | # Commuters | % Commuters |
| Less than 5 Minutes | 259 | 5.3% |
| 5 to 9 Minutes | 696 | 14.1% |
| 10 to 14 Minutes | 834 | 17.0% |
| 15 to 19 Minutes | 531 | 10.8% |
| 20 to 24 Minutes | 652 | 13.3% |
| 25 to 29 Minutes | 335 | 6.8% |
| 30 to 34 Minutes | 528 | 10.7% |
| 35 to 39 Minutes | 137 | 2.8% |
| 40 to 44 Minutes | 155 | 3.2% |
| 45 to 59 Minutes | 503 | 10.2% |
| 60 to 89 Minutes | 230 | 4.7% |
| 90 or more Minutes | 60 | 1.2% |
Commute Time by Sex in Oakville
The most common commute times in Oakville are 10 to 14 minutes (440 commuters, 16.1%) for males and 10 to 14 minutes (394 commuters, 18.1%) for females.
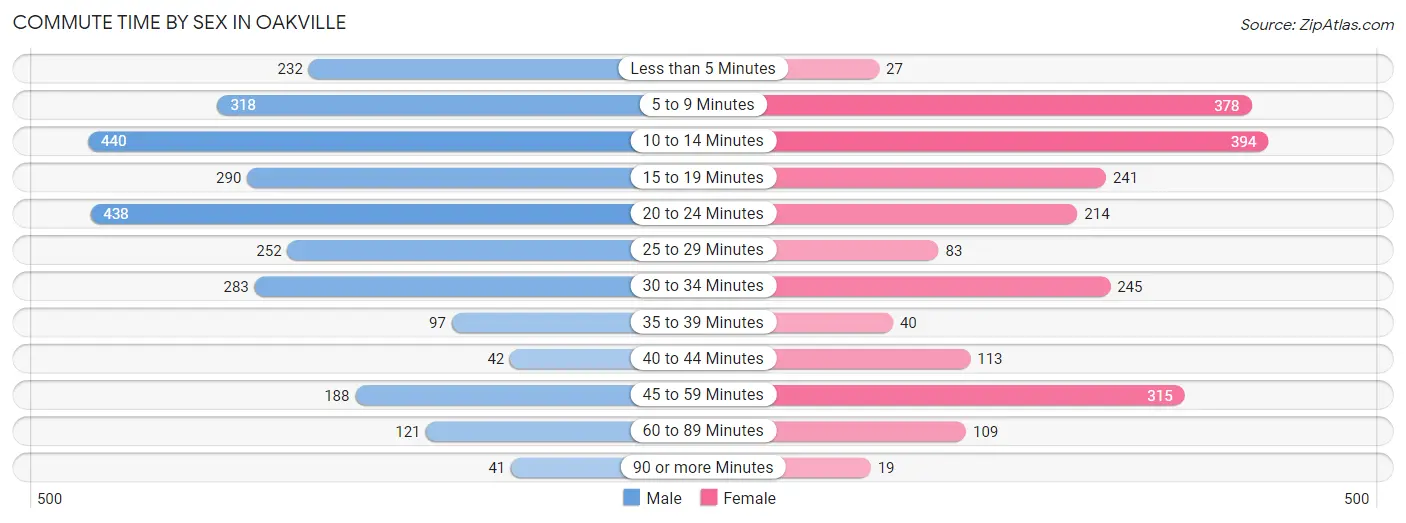
| Commute Time | Male | Female |
| Less than 5 Minutes | 232 (8.5%) | 27 (1.2%) |
| 5 to 9 Minutes | 318 (11.6%) | 378 (17.4%) |
| 10 to 14 Minutes | 440 (16.1%) | 394 (18.1%) |
| 15 to 19 Minutes | 290 (10.6%) | 241 (11.1%) |
| 20 to 24 Minutes | 438 (16.0%) | 214 (9.8%) |
| 25 to 29 Minutes | 252 (9.2%) | 83 (3.8%) |
| 30 to 34 Minutes | 283 (10.3%) | 245 (11.3%) |
| 35 to 39 Minutes | 97 (3.5%) | 40 (1.8%) |
| 40 to 44 Minutes | 42 (1.5%) | 113 (5.2%) |
| 45 to 59 Minutes | 188 (6.9%) | 315 (14.5%) |
| 60 to 89 Minutes | 121 (4.4%) | 109 (5.0%) |
| 90 or more Minutes | 41 (1.5%) | 19 (0.9%) |
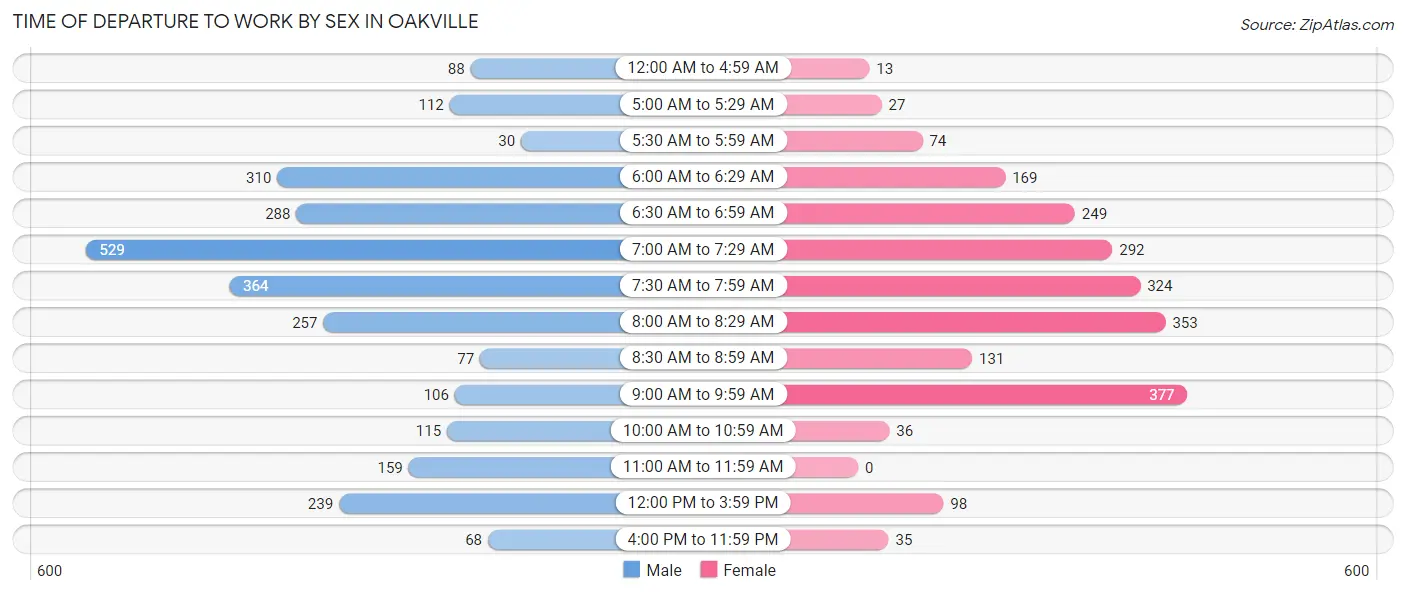
Time of Departure to Work by Sex in Oakville
The most frequent times of departure to work in Oakville are 7:00 AM to 7:29 AM (529, 19.3%) for males and 9:00 AM to 9:59 AM (377, 17.3%) for females.
| Time of Departure | Male | Female |
| 12:00 AM to 4:59 AM | 88 (3.2%) | 13 (0.6%) |
| 5:00 AM to 5:29 AM | 112 (4.1%) | 27 (1.2%) |
| 5:30 AM to 5:59 AM | 30 (1.1%) | 74 (3.4%) |
| 6:00 AM to 6:29 AM | 310 (11.3%) | 169 (7.8%) |
| 6:30 AM to 6:59 AM | 288 (10.5%) | 249 (11.4%) |
| 7:00 AM to 7:29 AM | 529 (19.3%) | 292 (13.4%) |
| 7:30 AM to 7:59 AM | 364 (13.3%) | 324 (14.9%) |
| 8:00 AM to 8:29 AM | 257 (9.4%) | 353 (16.2%) |
| 8:30 AM to 8:59 AM | 77 (2.8%) | 131 (6.0%) |
| 9:00 AM to 9:59 AM | 106 (3.9%) | 377 (17.3%) |
| 10:00 AM to 10:59 AM | 115 (4.2%) | 36 (1.7%) |
| 11:00 AM to 11:59 AM | 159 (5.8%) | 0 (0.0%) |
| 12:00 PM to 3:59 PM | 239 (8.7%) | 98 (4.5%) |
| 4:00 PM to 11:59 PM | 68 (2.5%) | 35 (1.6%) |
| Total | 2,742 (100.0%) | 2,178 (100.0%) |
Housing Occupancy in Oakville
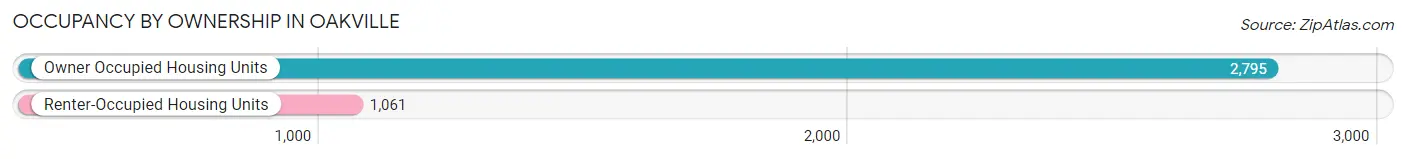
Occupancy by Ownership in Oakville
Of the total 3,856 dwellings in Oakville, owner-occupied units account for 2,795 (72.5%), while renter-occupied units make up 1,061 (27.5%).
| Occupancy | # Housing Units | % Housing Units |
| Owner Occupied Housing Units | 2,795 | 72.5% |
| Renter-Occupied Housing Units | 1,061 | 27.5% |
| Total Occupied Housing Units | 3,856 | 100.0% |
Occupancy by Household Size in Oakville
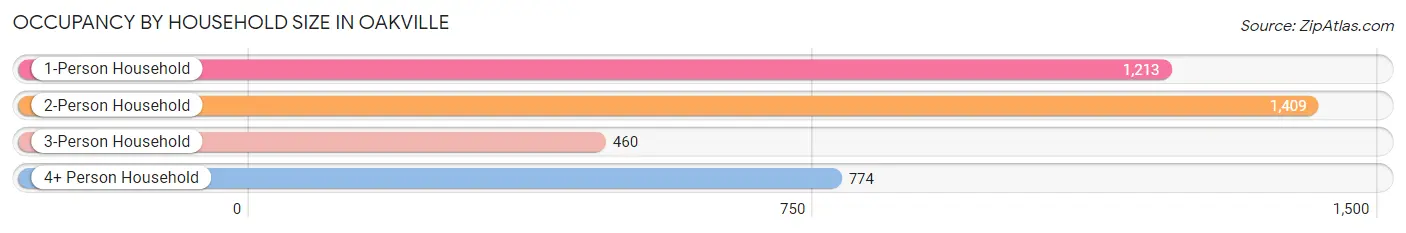
| Household Size | # Housing Units | % Housing Units |
| 1-Person Household | 1,213 | 31.5% |
| 2-Person Household | 1,409 | 36.5% |
| 3-Person Household | 460 | 11.9% |
| 4+ Person Household | 774 | 20.1% |
| Total Housing Units | 3,856 | 100.0% |
Occupancy by Ownership by Household Size in Oakville
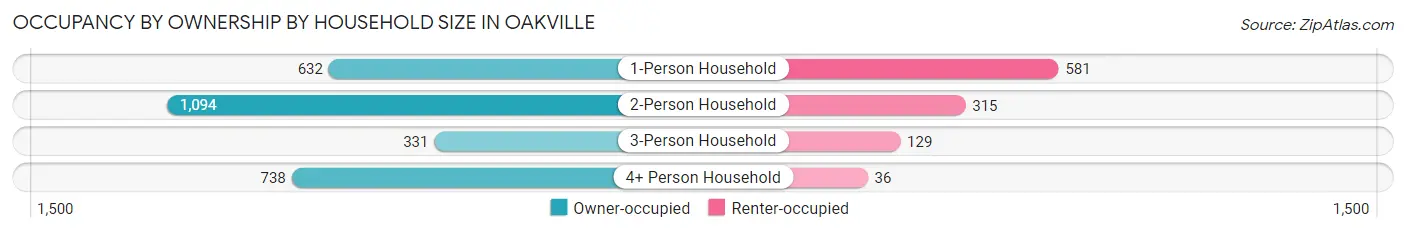
| Household Size | Owner-occupied | Renter-occupied |
| 1-Person Household | 632 (52.1%) | 581 (47.9%) |
| 2-Person Household | 1,094 (77.6%) | 315 (22.4%) |
| 3-Person Household | 331 (72.0%) | 129 (28.0%) |
| 4+ Person Household | 738 (95.4%) | 36 (4.6%) |
| Total Housing Units | 2,795 (72.5%) | 1,061 (27.5%) |
Occupancy by Educational Attainment in Oakville
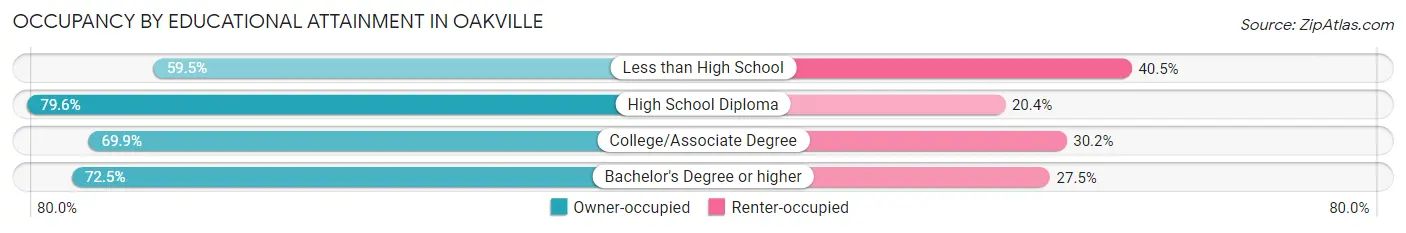
| Household Size | Owner-occupied | Renter-occupied |
| Less than High School | 219 (59.5%) | 149 (40.5%) |
| High School Diploma | 923 (79.6%) | 237 (20.4%) |
| College/Associate Degree | 913 (69.9%) | 394 (30.1%) |
| Bachelor's Degree or higher | 740 (72.5%) | 281 (27.5%) |
Occupancy by Age of Householder in Oakville
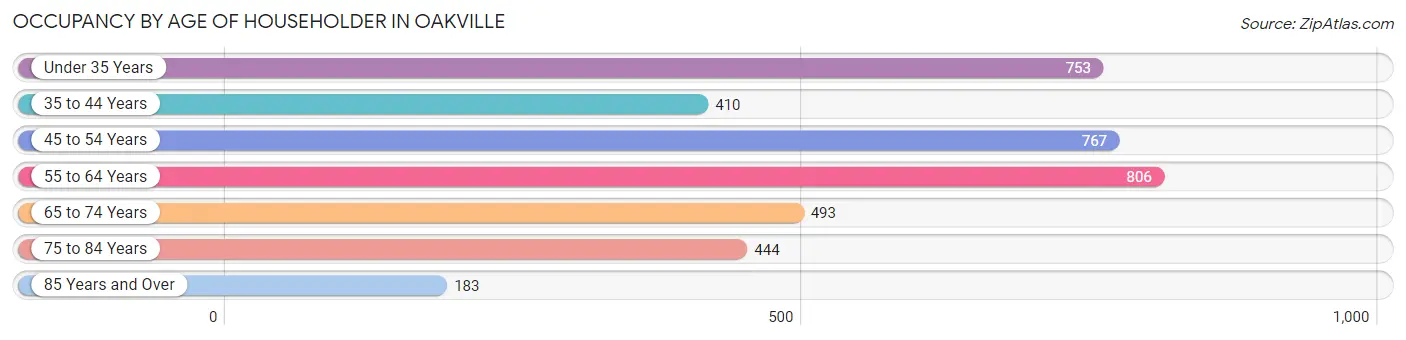
| Age Bracket | # Households | % Households |
| Under 35 Years | 753 | 19.5% |
| 35 to 44 Years | 410 | 10.6% |
| 45 to 54 Years | 767 | 19.9% |
| 55 to 64 Years | 806 | 20.9% |
| 65 to 74 Years | 493 | 12.8% |
| 75 to 84 Years | 444 | 11.5% |
| 85 Years and Over | 183 | 4.8% |
| Total | 3,856 | 100.0% |
Housing Finances in Oakville
Median Income by Occupancy in Oakville
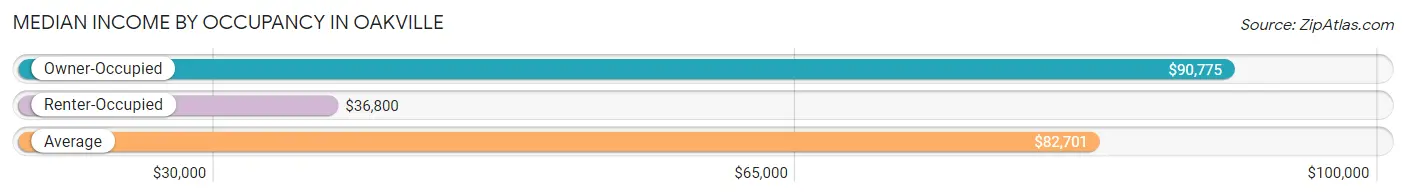
| Occupancy Type | # Households | Median Income |
| Owner-Occupied | 2,795 (72.5%) | $90,775 |
| Renter-Occupied | 1,061 (27.5%) | $36,800 |
| Average | 3,856 (100.0%) | $82,701 |
Occupancy by Householder Income Bracket in Oakville
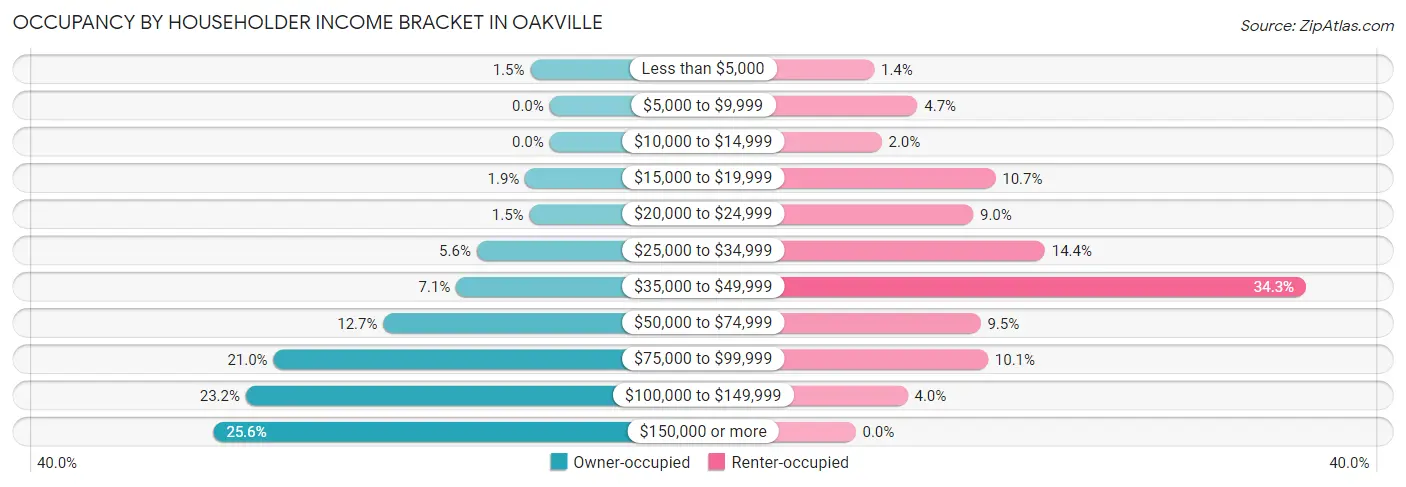
| Income Bracket | Owner-occupied | Renter-occupied |
| Less than $5,000 | 41 (1.5%) | 15 (1.4%) |
| $5,000 to $9,999 | 0 (0.0%) | 50 (4.7%) |
| $10,000 to $14,999 | 0 (0.0%) | 21 (2.0%) |
| $15,000 to $19,999 | 52 (1.9%) | 113 (10.6%) |
| $20,000 to $24,999 | 43 (1.5%) | 95 (8.9%) |
| $25,000 to $34,999 | 155 (5.6%) | 153 (14.4%) |
| $35,000 to $49,999 | 199 (7.1%) | 364 (34.3%) |
| $50,000 to $74,999 | 354 (12.7%) | 101 (9.5%) |
| $75,000 to $99,999 | 588 (21.0%) | 107 (10.1%) |
| $100,000 to $149,999 | 647 (23.2%) | 42 (4.0%) |
| $150,000 or more | 716 (25.6%) | 0 (0.0%) |
| Total | 2,795 (100.0%) | 1,061 (100.0%) |
Monthly Housing Cost Tiers in Oakville
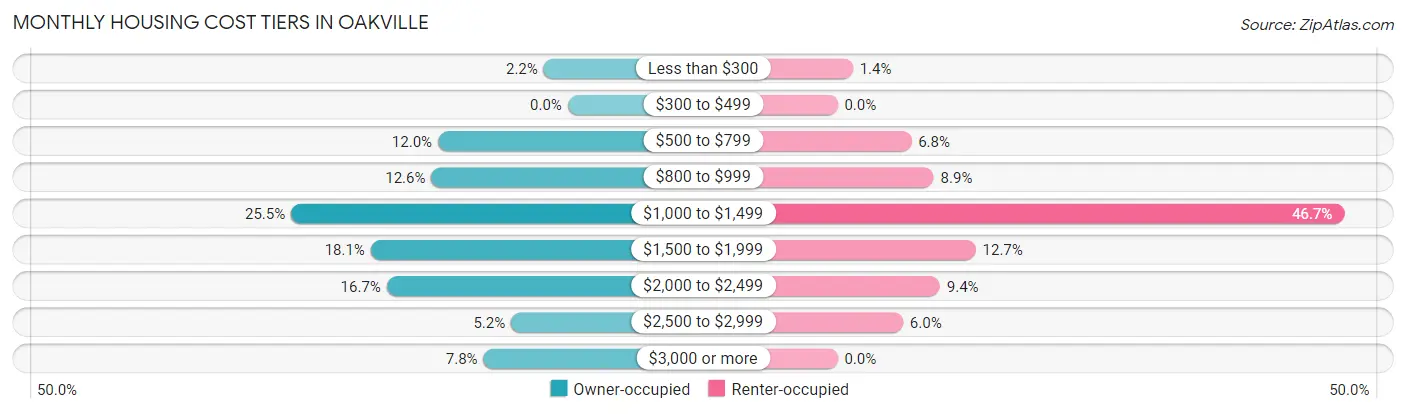
| Monthly Cost | Owner-occupied | Renter-occupied |
| Less than $300 | 62 (2.2%) | 15 (1.4%) |
| $300 to $499 | 0 (0.0%) | 0 (0.0%) |
| $500 to $799 | 334 (11.9%) | 72 (6.8%) |
| $800 to $999 | 351 (12.6%) | 94 (8.9%) |
| $1,000 to $1,499 | 712 (25.5%) | 495 (46.7%) |
| $1,500 to $1,999 | 507 (18.1%) | 135 (12.7%) |
| $2,000 to $2,499 | 466 (16.7%) | 100 (9.4%) |
| $2,500 to $2,999 | 146 (5.2%) | 64 (6.0%) |
| $3,000 or more | 217 (7.8%) | 0 (0.0%) |
| Total | 2,795 (100.0%) | 1,061 (100.0%) |
Physical Housing Characteristics in Oakville
Housing Structures in Oakville
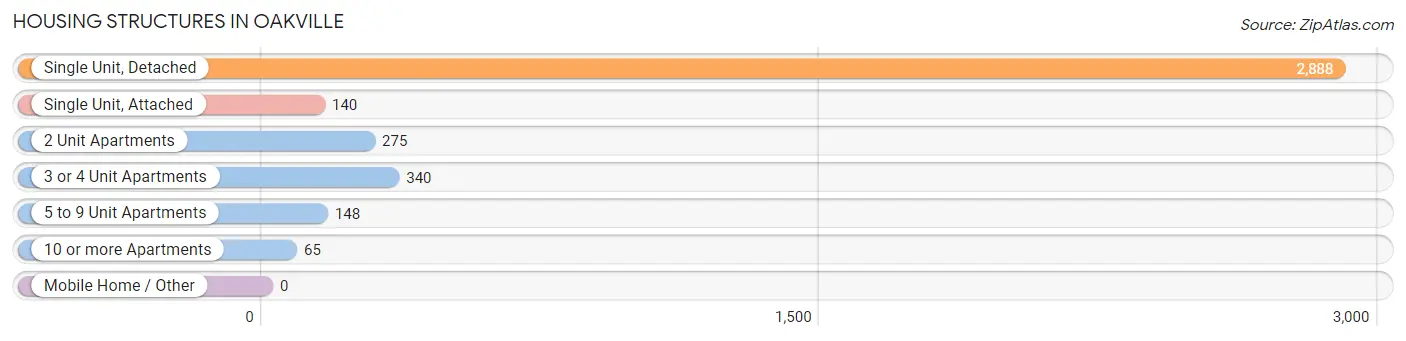
| Structure Type | # Housing Units | % Housing Units |
| Single Unit, Detached | 2,888 | 74.9% |
| Single Unit, Attached | 140 | 3.6% |
| 2 Unit Apartments | 275 | 7.1% |
| 3 or 4 Unit Apartments | 340 | 8.8% |
| 5 to 9 Unit Apartments | 148 | 3.8% |
| 10 or more Apartments | 65 | 1.7% |
| Mobile Home / Other | 0 | 0.0% |
| Total | 3,856 | 100.0% |
Housing Structures by Occupancy in Oakville
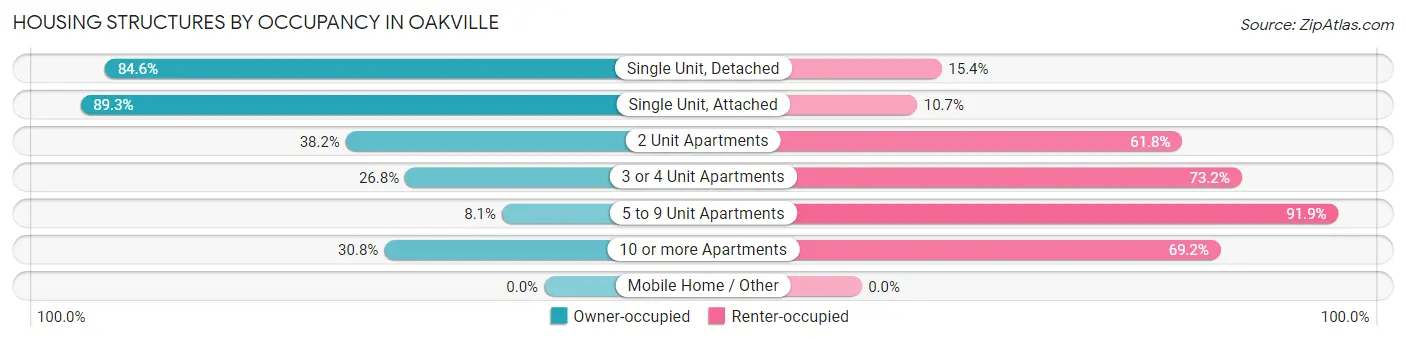
| Structure Type | Owner-occupied | Renter-occupied |
| Single Unit, Detached | 2,442 (84.6%) | 446 (15.4%) |
| Single Unit, Attached | 125 (89.3%) | 15 (10.7%) |
| 2 Unit Apartments | 105 (38.2%) | 170 (61.8%) |
| 3 or 4 Unit Apartments | 91 (26.8%) | 249 (73.2%) |
| 5 to 9 Unit Apartments | 12 (8.1%) | 136 (91.9%) |
| 10 or more Apartments | 20 (30.8%) | 45 (69.2%) |
| Mobile Home / Other | 0 (0.0%) | 0 (0.0%) |
| Total | 2,795 (72.5%) | 1,061 (27.5%) |
Housing Structures by Number of Rooms in Oakville
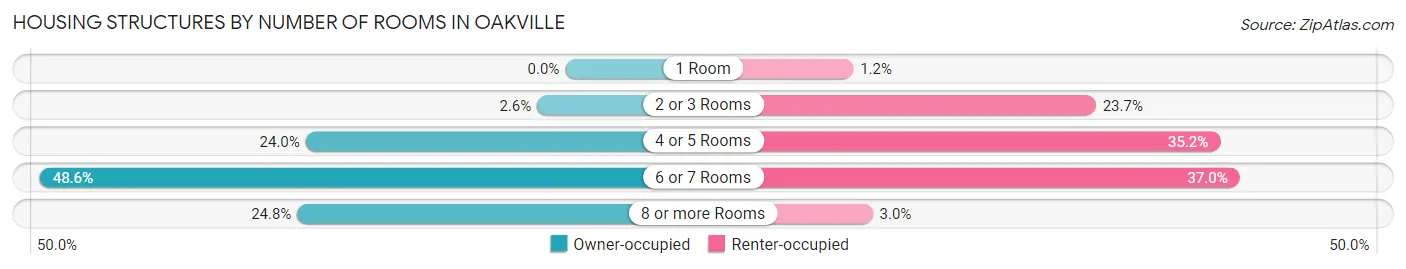
| Number of Rooms | Owner-occupied | Renter-occupied |
| 1 Room | 0 (0.0%) | 13 (1.2%) |
| 2 or 3 Rooms | 73 (2.6%) | 251 (23.7%) |
| 4 or 5 Rooms | 671 (24.0%) | 373 (35.2%) |
| 6 or 7 Rooms | 1,358 (48.6%) | 392 (36.9%) |
| 8 or more Rooms | 693 (24.8%) | 32 (3.0%) |
| Total | 2,795 (100.0%) | 1,061 (100.0%) |
Housing Structure by Heating Type in Oakville
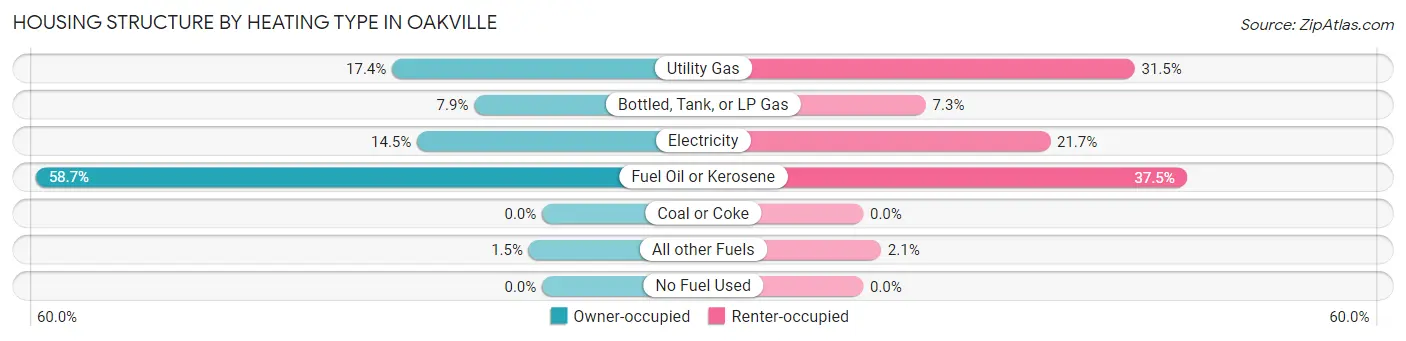
| Heating Type | Owner-occupied | Renter-occupied |
| Utility Gas | 486 (17.4%) | 334 (31.5%) |
| Bottled, Tank, or LP Gas | 220 (7.9%) | 77 (7.3%) |
| Electricity | 405 (14.5%) | 230 (21.7%) |
| Fuel Oil or Kerosene | 1,641 (58.7%) | 398 (37.5%) |
| Coal or Coke | 0 (0.0%) | 0 (0.0%) |
| All other Fuels | 43 (1.5%) | 22 (2.1%) |
| No Fuel Used | 0 (0.0%) | 0 (0.0%) |
| Total | 2,795 (100.0%) | 1,061 (100.0%) |
Household Vehicle Usage in Oakville
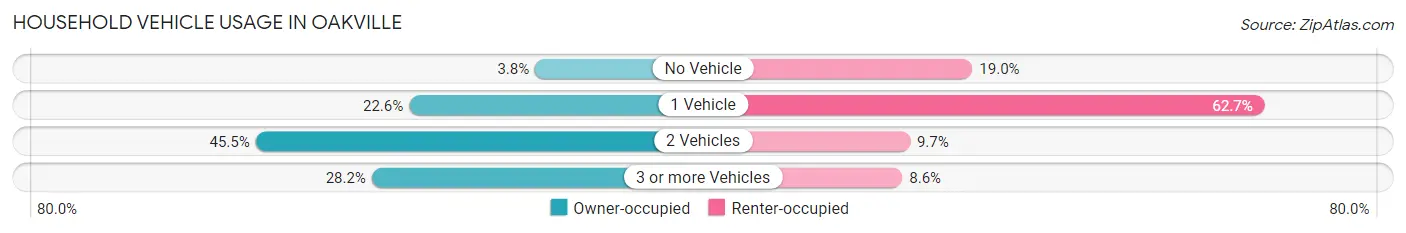
| Vehicles per Household | Owner-occupied | Renter-occupied |
| No Vehicle | 105 (3.8%) | 202 (19.0%) |
| 1 Vehicle | 631 (22.6%) | 665 (62.7%) |
| 2 Vehicles | 1,272 (45.5%) | 103 (9.7%) |
| 3 or more Vehicles | 787 (28.2%) | 91 (8.6%) |
| Total | 2,795 (100.0%) | 1,061 (100.0%) |
Real Estate & Mortgages in Oakville
Real Estate and Mortgage Overview in Oakville
| Characteristic | Without Mortgage | With Mortgage |
| Housing Units | 1,059 | 1,736 |
| Median Property Value | $262,500 | $261,300 |
| Median Household Income | $83,063 | $460 |
| Monthly Housing Costs | $873 | $217 |
| Real Estate Taxes | $4,782 | $52 |
Property Value by Mortgage Status in Oakville
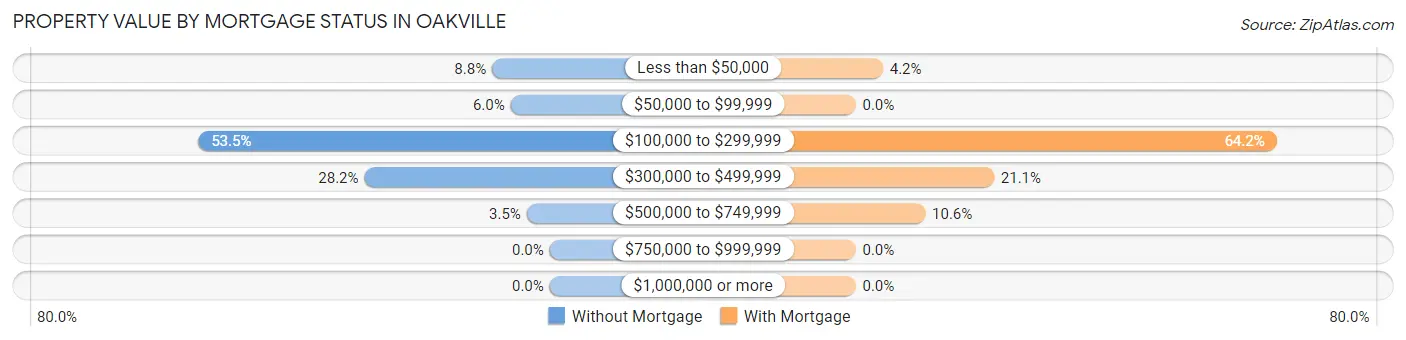
| Property Value | Without Mortgage | With Mortgage |
| Less than $50,000 | 93 (8.8%) | 72 (4.2%) |
| $50,000 to $99,999 | 63 (5.9%) | 0 (0.0%) |
| $100,000 to $299,999 | 567 (53.5%) | 1,114 (64.2%) |
| $300,000 to $499,999 | 299 (28.2%) | 366 (21.1%) |
| $500,000 to $749,999 | 37 (3.5%) | 184 (10.6%) |
| $750,000 to $999,999 | 0 (0.0%) | 0 (0.0%) |
| $1,000,000 or more | 0 (0.0%) | 0 (0.0%) |
| Total | 1,059 (100.0%) | 1,736 (100.0%) |
Household Income by Mortgage Status in Oakville
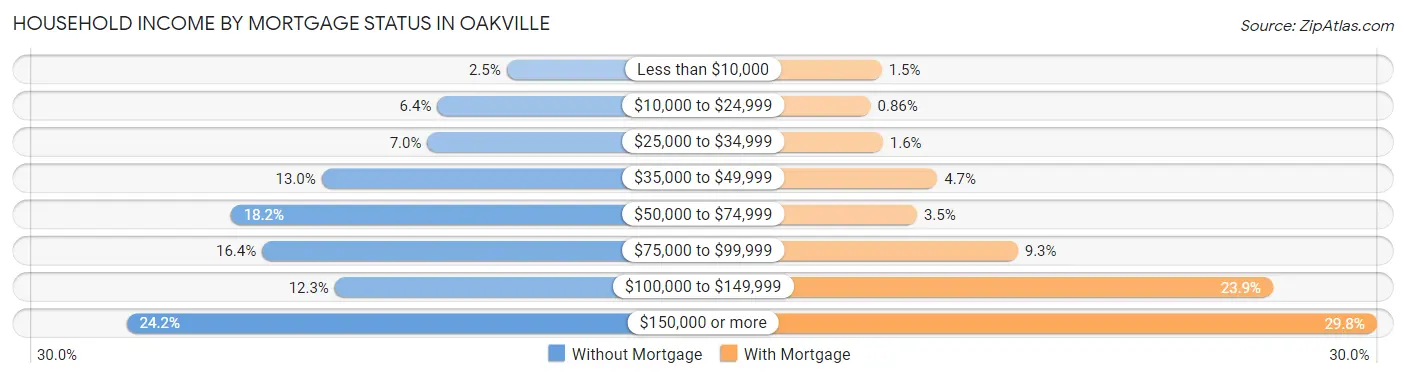
| Household Income | Without Mortgage | With Mortgage |
| Less than $10,000 | 26 (2.5%) | 26 (1.5%) |
| $10,000 to $24,999 | 68 (6.4%) | 15 (0.9%) |
| $25,000 to $34,999 | 74 (7.0%) | 27 (1.6%) |
| $35,000 to $49,999 | 138 (13.0%) | 81 (4.7%) |
| $50,000 to $74,999 | 193 (18.2%) | 61 (3.5%) |
| $75,000 to $99,999 | 174 (16.4%) | 161 (9.3%) |
| $100,000 to $149,999 | 130 (12.3%) | 414 (23.8%) |
| $150,000 or more | 256 (24.2%) | 517 (29.8%) |
| Total | 1,059 (100.0%) | 1,736 (100.0%) |
Property Value to Household Income Ratio in Oakville
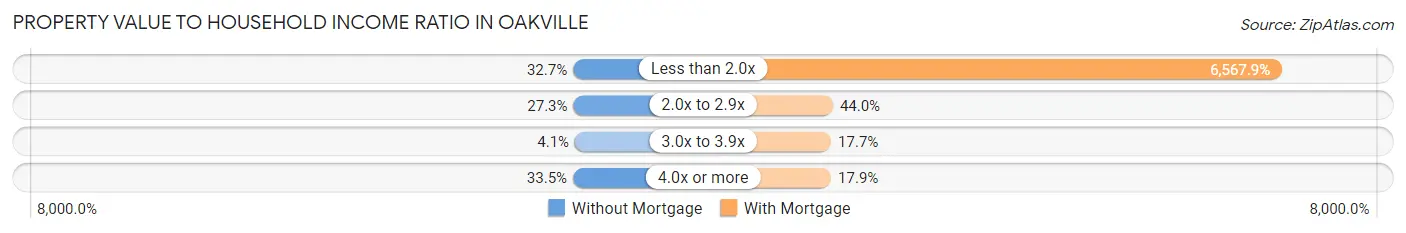
| Value-to-Income Ratio | Without Mortgage | With Mortgage |
| Less than 2.0x | 346 (32.7%) | 114,018 (6,567.9%) |
| 2.0x to 2.9x | 289 (27.3%) | 764 (44.0%) |
| 3.0x to 3.9x | 43 (4.1%) | 307 (17.7%) |
| 4.0x or more | 355 (33.5%) | 311 (17.9%) |
| Total | 1,059 (100.0%) | 1,736 (100.0%) |
Real Estate Taxes by Mortgage Status in Oakville
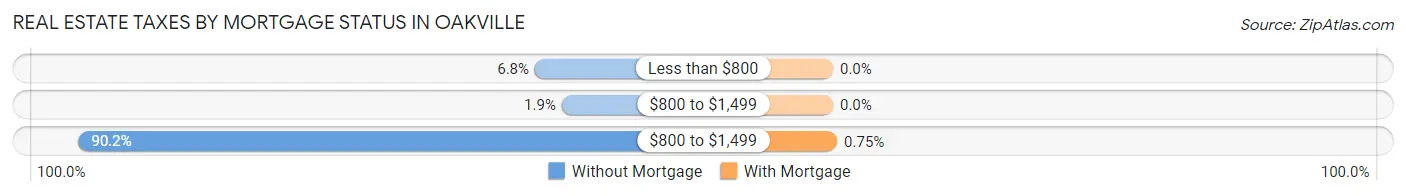
| Property Taxes | Without Mortgage | With Mortgage |
| Less than $800 | 72 (6.8%) | 0 (0.0%) |
| $800 to $1,499 | 20 (1.9%) | 0 (0.0%) |
| $800 to $1,499 | 955 (90.2%) | 13 (0.7%) |
| Total | 1,059 (100.0%) | 1,736 (100.0%) |
Health & Disability in Oakville
Health Insurance Coverage by Age in Oakville
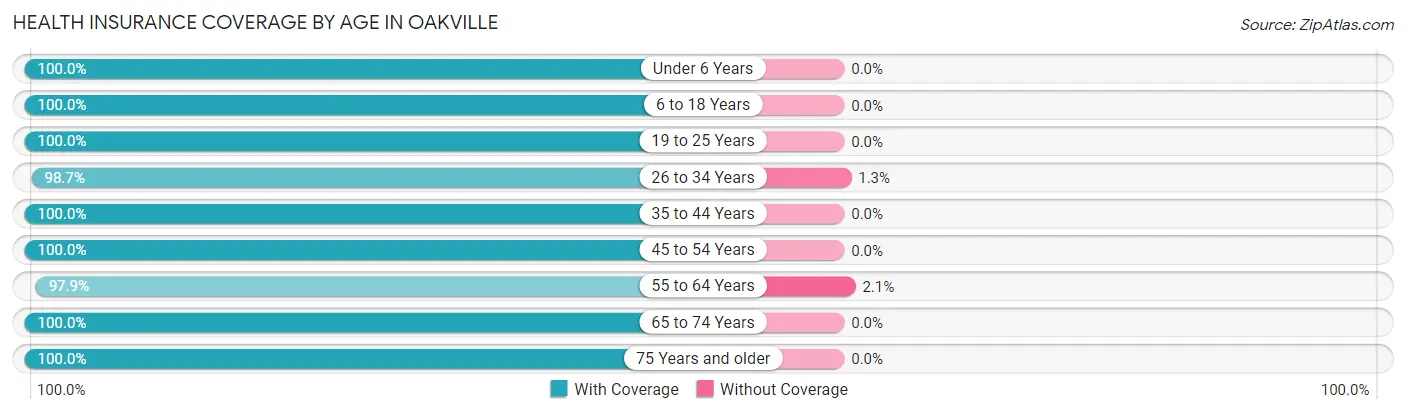
| Age Bracket | With Coverage | Without Coverage |
| Under 6 Years | 515 (100.0%) | 0 (0.0%) |
| 6 to 18 Years | 1,252 (100.0%) | 0 (0.0%) |
| 19 to 25 Years | 540 (100.0%) | 0 (0.0%) |
| 26 to 34 Years | 1,438 (98.7%) | 19 (1.3%) |
| 35 to 44 Years | 891 (100.0%) | 0 (0.0%) |
| 45 to 54 Years | 1,227 (100.0%) | 0 (0.0%) |
| 55 to 64 Years | 1,366 (97.9%) | 29 (2.1%) |
| 65 to 74 Years | 941 (100.0%) | 0 (0.0%) |
| 75 Years and older | 1,097 (100.0%) | 0 (0.0%) |
| Total | 9,267 (99.5%) | 48 (0.5%) |
Health Insurance Coverage by Citizenship Status in Oakville
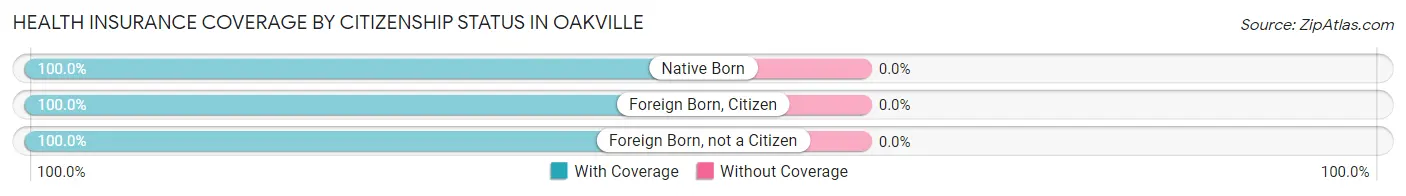
| Citizenship Status | With Coverage | Without Coverage |
| Native Born | 515 (100.0%) | 0 (0.0%) |
| Foreign Born, Citizen | 1,252 (100.0%) | 0 (0.0%) |
| Foreign Born, not a Citizen | 540 (100.0%) | 0 (0.0%) |
Health Insurance Coverage by Household Income in Oakville
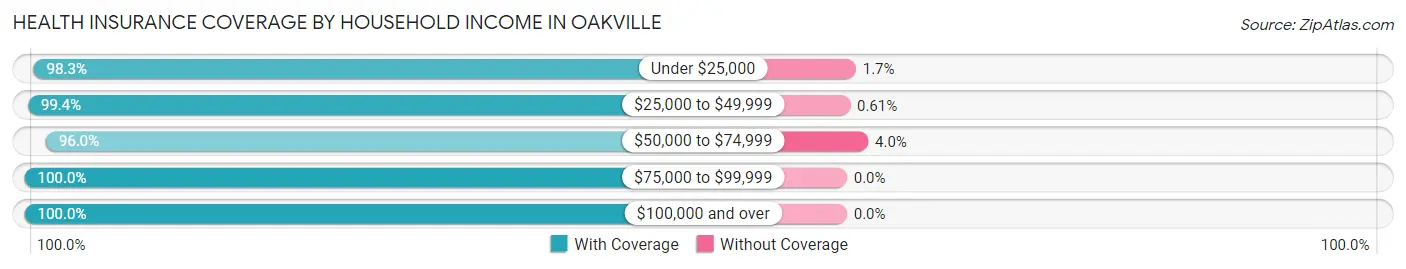
| Household Income | With Coverage | Without Coverage |
| Under $25,000 | 584 (98.3%) | 10 (1.7%) |
| $25,000 to $49,999 | 1,461 (99.4%) | 9 (0.6%) |
| $50,000 to $74,999 | 698 (96.0%) | 29 (4.0%) |
| $75,000 to $99,999 | 1,948 (100.0%) | 0 (0.0%) |
| $100,000 and over | 4,494 (100.0%) | 0 (0.0%) |
Public vs Private Health Insurance Coverage by Age in Oakville
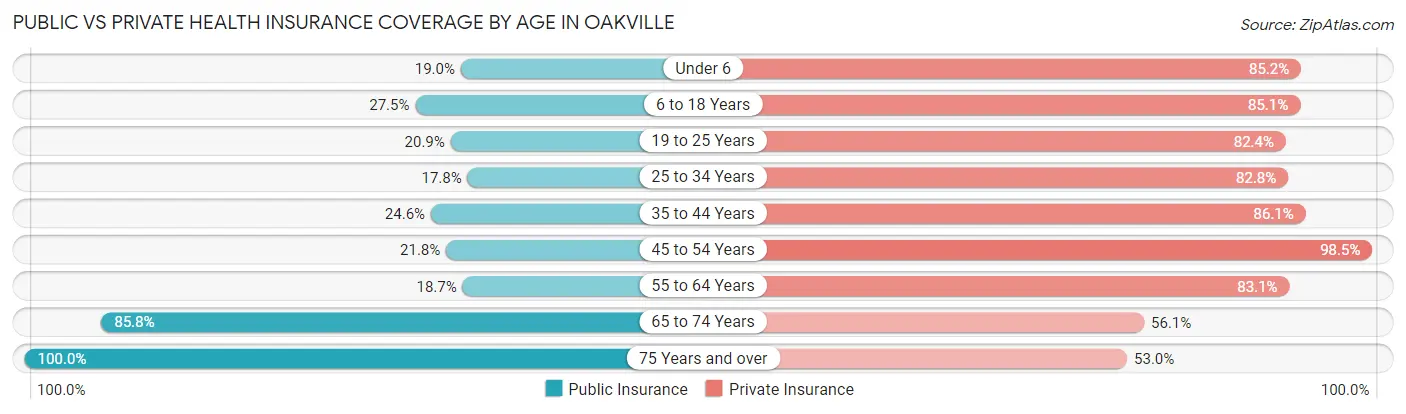
| Age Bracket | Public Insurance | Private Insurance |
| Under 6 | 98 (19.0%) | 439 (85.2%) |
| 6 to 18 Years | 344 (27.5%) | 1,065 (85.1%) |
| 19 to 25 Years | 113 (20.9%) | 445 (82.4%) |
| 25 to 34 Years | 259 (17.8%) | 1,207 (82.8%) |
| 35 to 44 Years | 219 (24.6%) | 767 (86.1%) |
| 45 to 54 Years | 267 (21.8%) | 1,208 (98.5%) |
| 55 to 64 Years | 261 (18.7%) | 1,159 (83.1%) |
| 65 to 74 Years | 807 (85.8%) | 528 (56.1%) |
| 75 Years and over | 1,097 (100.0%) | 581 (53.0%) |
| Total | 3,465 (37.2%) | 7,399 (79.4%) |
Disability Status by Sex by Age in Oakville
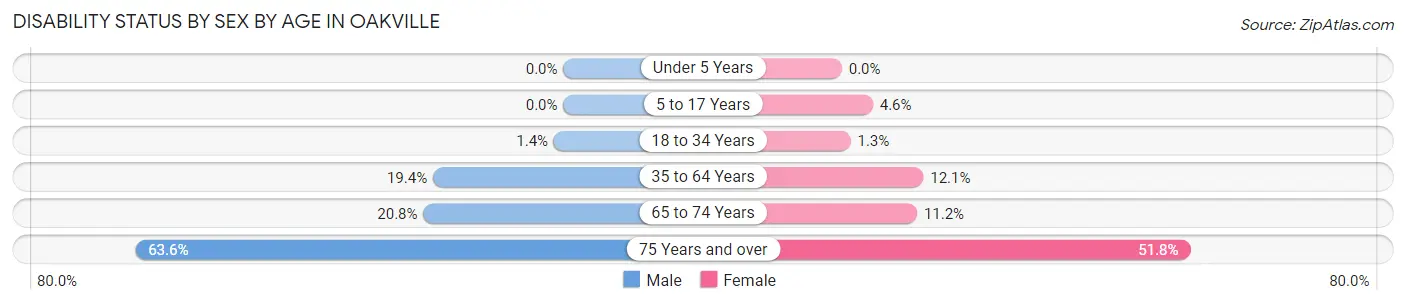
| Age Bracket | Male | Female |
| Under 5 Years | 0 (0.0%) | 0 (0.0%) |
| 5 to 17 Years | 0 (0.0%) | 32 (4.6%) |
| 18 to 34 Years | 14 (1.4%) | 14 (1.3%) |
| 35 to 64 Years | 344 (19.4%) | 210 (12.1%) |
| 65 to 74 Years | 95 (20.8%) | 54 (11.2%) |
| 75 Years and over | 335 (63.6%) | 295 (51.7%) |
Disability Class by Sex by Age in Oakville
Disability Class: Hearing Difficulty
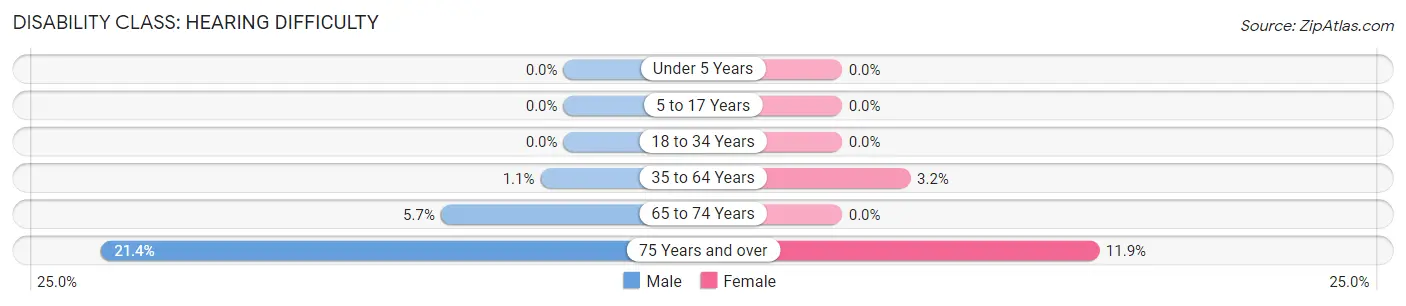
| Age Bracket | Male | Female |
| Under 5 Years | 0 (0.0%) | 0 (0.0%) |
| 5 to 17 Years | 0 (0.0%) | 0 (0.0%) |
| 18 to 34 Years | 0 (0.0%) | 0 (0.0%) |
| 35 to 64 Years | 19 (1.1%) | 55 (3.2%) |
| 65 to 74 Years | 26 (5.7%) | 0 (0.0%) |
| 75 Years and over | 113 (21.4%) | 68 (11.9%) |
Disability Class: Vision Difficulty
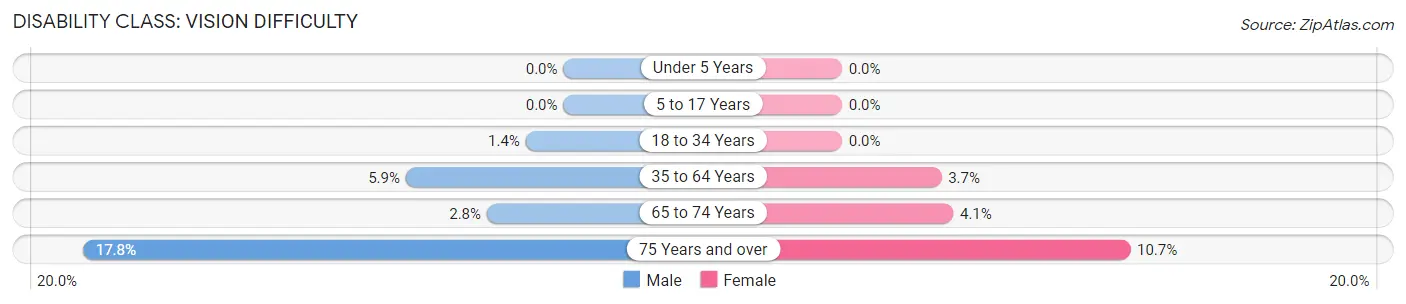
| Age Bracket | Male | Female |
| Under 5 Years | 0 (0.0%) | 0 (0.0%) |
| 5 to 17 Years | 0 (0.0%) | 0 (0.0%) |
| 18 to 34 Years | 14 (1.4%) | 0 (0.0%) |
| 35 to 64 Years | 104 (5.9%) | 64 (3.7%) |
| 65 to 74 Years | 13 (2.8%) | 20 (4.1%) |
| 75 Years and over | 94 (17.8%) | 61 (10.7%) |
Disability Class: Cognitive Difficulty
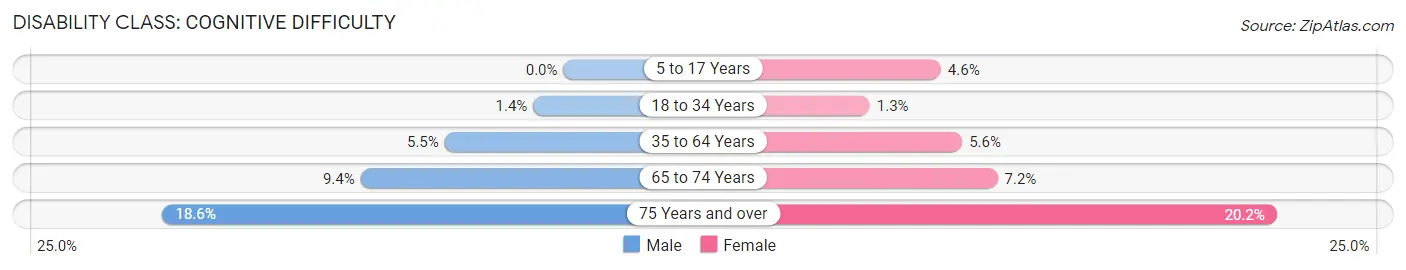
| Age Bracket | Male | Female |
| 5 to 17 Years | 0 (0.0%) | 32 (4.6%) |
| 18 to 34 Years | 14 (1.4%) | 14 (1.3%) |
| 35 to 64 Years | 98 (5.5%) | 97 (5.6%) |
| 65 to 74 Years | 43 (9.4%) | 35 (7.2%) |
| 75 Years and over | 98 (18.6%) | 115 (20.2%) |
Disability Class: Ambulatory Difficulty
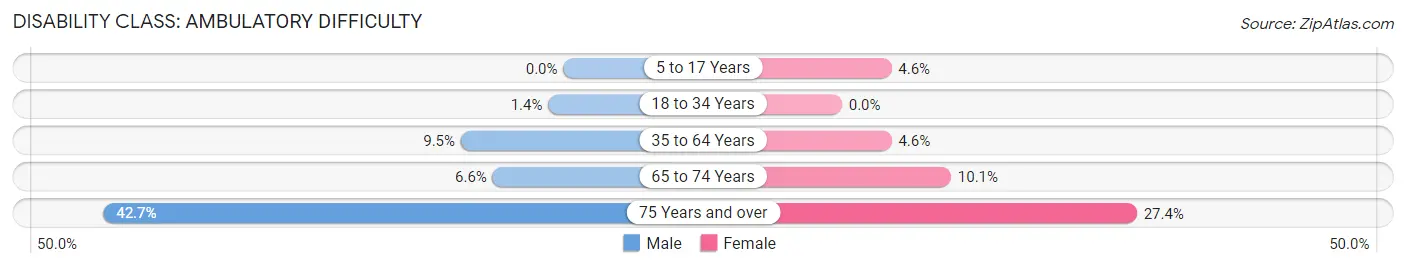
| Age Bracket | Male | Female |
| 5 to 17 Years | 0 (0.0%) | 32 (4.6%) |
| 18 to 34 Years | 14 (1.4%) | 0 (0.0%) |
| 35 to 64 Years | 169 (9.5%) | 80 (4.6%) |
| 65 to 74 Years | 30 (6.6%) | 49 (10.1%) |
| 75 Years and over | 225 (42.7%) | 156 (27.4%) |
Disability Class: Self-Care Difficulty
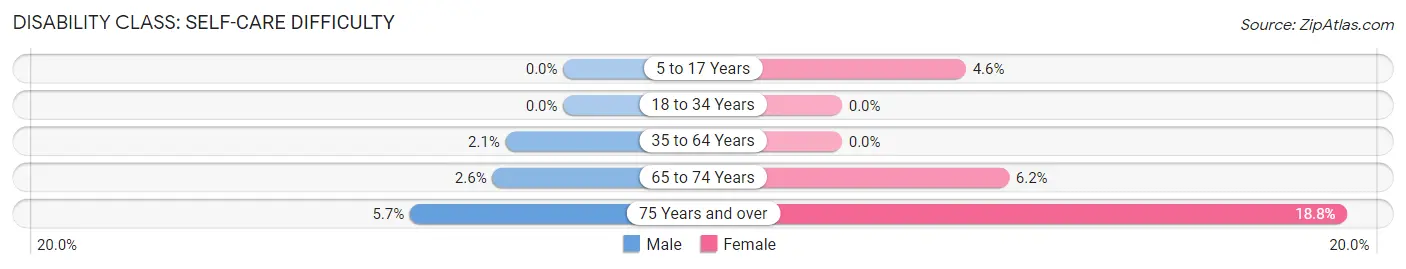
| Age Bracket | Male | Female |
| 5 to 17 Years | 0 (0.0%) | 32 (4.6%) |
| 18 to 34 Years | 0 (0.0%) | 0 (0.0%) |
| 35 to 64 Years | 38 (2.1%) | 0 (0.0%) |
| 65 to 74 Years | 12 (2.6%) | 30 (6.2%) |
| 75 Years and over | 30 (5.7%) | 107 (18.8%) |
Technology Access in Oakville
Computing Device Access in Oakville
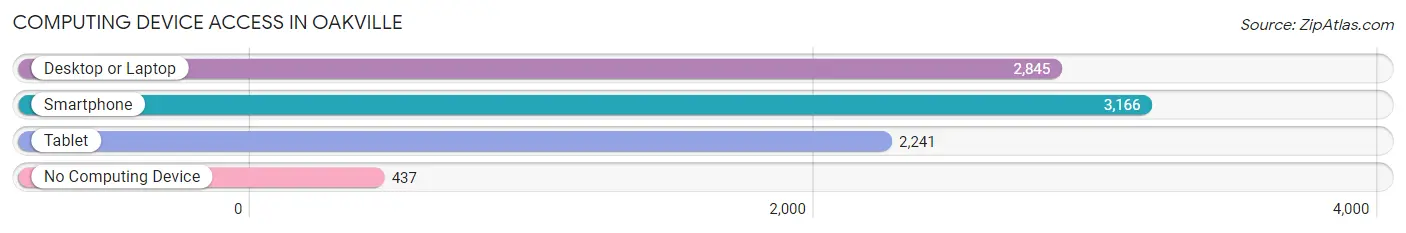
| Device Type | # Households | % Households |
| Desktop or Laptop | 2,845 | 73.8% |
| Smartphone | 3,166 | 82.1% |
| Tablet | 2,241 | 58.1% |
| No Computing Device | 437 | 11.3% |
| Total | 3,856 | 100.0% |
Internet Access in Oakville
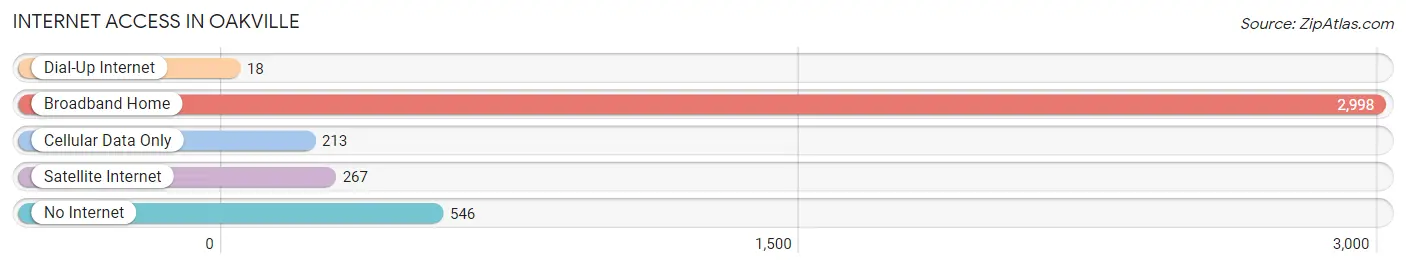
| Internet Type | # Households | % Households |
| Dial-Up Internet | 18 | 0.5% |
| Broadband Home | 2,998 | 77.7% |
| Cellular Data Only | 213 | 5.5% |
| Satellite Internet | 267 | 6.9% |
| No Internet | 546 | 14.2% |
| Total | 3,856 | 100.0% |
Oakville Summary
Oakville is a town located in Litchfield County, Connecticut, United States. The population was 5,945 at the 2010 census. It is part of the town of Watertown and is bordered by the towns of Watertown, Bethlehem, Morris, and Waterbury.
History
The area that is now Oakville was first settled in 1730 by a group of settlers from Waterbury. The town was originally known as "Oak Hill" and was incorporated in 1785. The town was named after the abundance of oak trees in the area.
In the 19th century, Oakville was a thriving agricultural community. The town was home to several mills, including a grist mill, a saw mill, and a paper mill. The town also had a blacksmith shop, a tannery, and a general store.
Geography
Oakville is located in the western part of Litchfield County, Connecticut. It is bordered by the towns of Watertown, Bethlehem, Morris, and Waterbury. The town has a total area of 11.3 square miles, of which 11.2 square miles is land and 0.1 square miles is water.
The terrain of Oakville is mostly hilly and wooded. The highest point in the town is 1,068 feet above sea level. The town is drained by the Naugatuck River, which flows through the center of town.
Economy
Oakville's economy is largely based on agriculture and manufacturing. The town is home to several farms, which produce a variety of crops, including corn, hay, and vegetables. The town also has several small manufacturing businesses, which produce a variety of products, including furniture, paper products, and metal products.
Demographics
As of the 2010 census, there were 5,945 people, 2,310 households, and 1,619 families residing in the town. The population density was 528.3 people per square mile. There were 2,521 housing units at an average density of 224.3 per square mile.
The racial makeup of the town was 96.2% White, 0.7% African American, 0.2% Native American, 0.7% Asian, 0.1% Pacific Islander, 0.7% from other races, and 1.4% from two or more races. Hispanic or Latino of any race were 2.3% of the population.
The median income for a household in the town was $63,958, and the median income for a family was $76,944. The per capita income for the town was $30,945. About 4.2% of families and 5.7% of the population were below the poverty line, including 6.3% of those under age 18 and 4.2% of those age 65 or over.
Common Questions
What is Per Capita Income in Oakville?
Per Capita income in Oakville is $46,412.
What is the Median Family Income in Oakville?
Median Family Income in Oakville is $102,083.
What is the Median Household income in Oakville?
Median Household Income in Oakville is $82,701.
What is Income or Wage Gap in Oakville?
Income or Wage Gap in Oakville is 28.8%.
Women in Oakville earn 71.2 cents for every dollar earned by a man.
What is Inequality or Gini Index in Oakville?
Inequality or Gini Index in Oakville is 0.47.
What is the Total Population of Oakville?
Total Population of Oakville is 9,387.
What is the Total Male Population of Oakville?
Total Male Population of Oakville is 4,606.
What is the Total Female Population of Oakville?
Total Female Population of Oakville is 4,781.
What is the Ratio of Males per 100 Females in Oakville?
There are 96.34 Males per 100 Females in Oakville.
What is the Ratio of Females per 100 Males in Oakville?
There are 103.80 Females per 100 Males in Oakville.
What is the Median Population Age in Oakville?
Median Population Age in Oakville is 45.3 Years.
What is the Average Family Size in Oakville
Average Family Size in Oakville is 3.0 People.
What is the Average Household Size in Oakville
Average Household Size in Oakville is 2.4 People.
How Large is the Labor Force in Oakville?
There are 5,381 People in the Labor Forcein in Oakville.
What is the Percentage of People in the Labor Force in Oakville?
68.3% of People are in the Labor Force in Oakville.
What is the Unemployment Rate in Oakville?
Unemployment Rate in Oakville is 2.4%.