North Plains, OR Map & Demographics
North Plains Map
North Plains Overview
$46,839
PER CAPITA INCOME
$141,184
AVG FAMILY INCOME
$109,559
AVG HOUSEHOLD INCOME
39.8%
WAGE / INCOME GAP [ % ]
60.2¢/ $1
WAGE / INCOME GAP [ $ ]
0.35
INEQUALITY / GINI INDEX
3,365
TOTAL POPULATION
1,738
MALE POPULATION
1,627
FEMALE POPULATION
106.82
MALES / 100 FEMALES
93.61
FEMALES / 100 MALES
36.0
MEDIAN AGE
3.4
AVG FAMILY SIZE
2.6
AVG HOUSEHOLD SIZE
1,881
LABOR FORCE [ PEOPLE ]
70.0%
PERCENT IN LABOR FORCE
6.0%
UNEMPLOYMENT RATE
North Plains Zip Codes
Income in North Plains
Income Overview in North Plains
Per Capita Income in North Plains is $46,839, while median incomes of families and households are $141,184 and $109,559 respectively.
| Characteristic | Number | Measure |
| Per Capita Income | 3,365 | $46,839 |
| Median Family Income | 826 | $141,184 |
| Mean Family Income | 826 | $146,413 |
| Median Household Income | 1,292 | $109,559 |
| Mean Household Income | 1,292 | $119,229 |
| Income Deficit | 826 | $0 |
| Wage / Income Gap (%) | 3,365 | 39.77% |
| Wage / Income Gap ($) | 3,365 | 60.23¢ per $1 |
| Gini / Inequality Index | 3,365 | 0.35 |
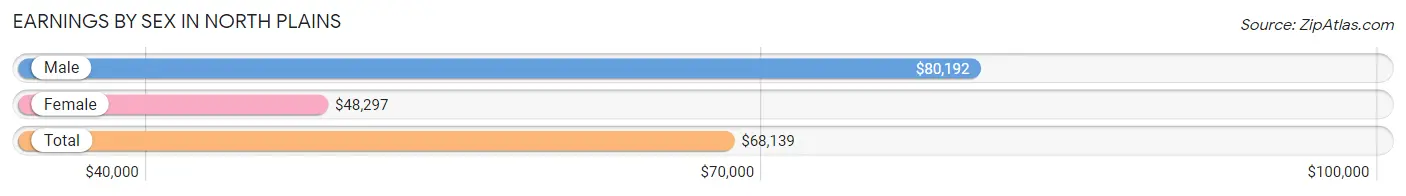
Earnings by Sex in North Plains
Average Earnings in North Plains are $68,139, $80,192 for men and $48,297 for women, a difference of 39.8%.
| Sex | Number | Average Earnings |
| Male | 1,118 (57.2%) | $80,192 |
| Female | 837 (42.8%) | $48,297 |
| Total | 1,955 (100.0%) | $68,139 |
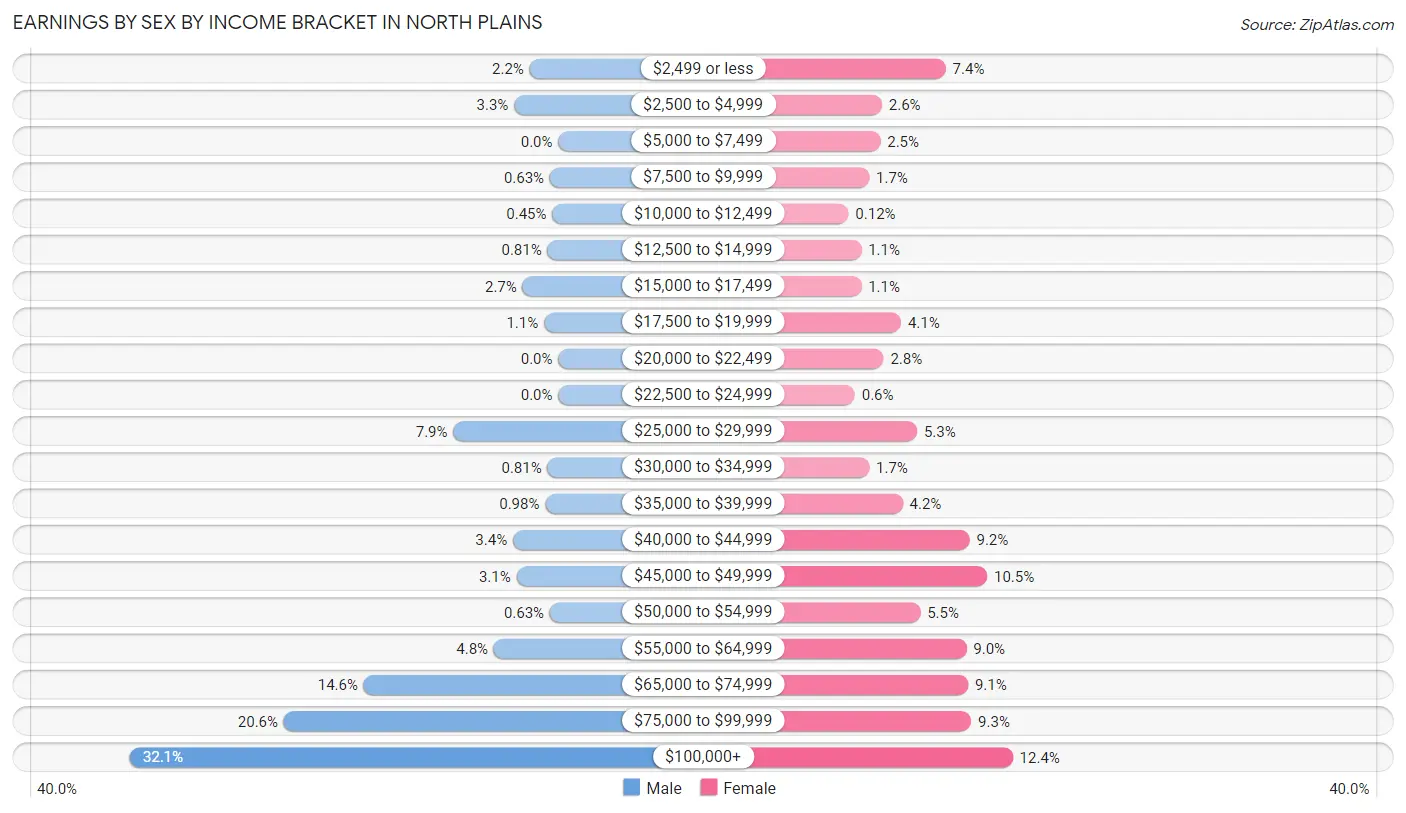
Earnings by Sex by Income Bracket in North Plains
The most common earnings brackets in North Plains are $100,000+ for men (359 | 32.1%) and $100,000+ for women (104 | 12.4%).
| Income | Male | Female |
| $2,499 or less | 24 (2.1%) | 62 (7.4%) |
| $2,500 to $4,999 | 37 (3.3%) | 22 (2.6%) |
| $5,000 to $7,499 | 0 (0.0%) | 21 (2.5%) |
| $7,500 to $9,999 | 7 (0.6%) | 14 (1.7%) |
| $10,000 to $12,499 | 5 (0.4%) | 1 (0.1%) |
| $12,500 to $14,999 | 9 (0.8%) | 9 (1.1%) |
| $15,000 to $17,499 | 30 (2.7%) | 9 (1.1%) |
| $17,500 to $19,999 | 12 (1.1%) | 34 (4.1%) |
| $20,000 to $22,499 | 0 (0.0%) | 23 (2.8%) |
| $22,500 to $24,999 | 0 (0.0%) | 5 (0.6%) |
| $25,000 to $29,999 | 88 (7.9%) | 44 (5.3%) |
| $30,000 to $34,999 | 9 (0.8%) | 14 (1.7%) |
| $35,000 to $39,999 | 11 (1.0%) | 35 (4.2%) |
| $40,000 to $44,999 | 38 (3.4%) | 77 (9.2%) |
| $45,000 to $49,999 | 35 (3.1%) | 88 (10.5%) |
| $50,000 to $54,999 | 7 (0.6%) | 46 (5.5%) |
| $55,000 to $64,999 | 54 (4.8%) | 75 (9.0%) |
| $65,000 to $74,999 | 163 (14.6%) | 76 (9.1%) |
| $75,000 to $99,999 | 230 (20.6%) | 78 (9.3%) |
| $100,000+ | 359 (32.1%) | 104 (12.4%) |
| Total | 1,118 (100.0%) | 837 (100.0%) |
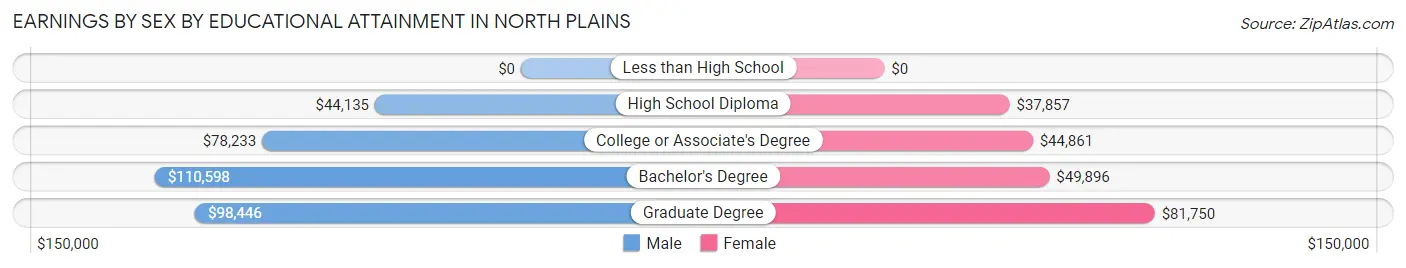
Earnings by Sex by Educational Attainment in North Plains
Average earnings in North Plains are $88,906 for men and $49,634 for women, a difference of 44.2%. Men with an educational attainment of bachelor's degree enjoy the highest average annual earnings of $110,598, while those with high school diploma education earn the least with $44,135. Women with an educational attainment of graduate degree earn the most with the average annual earnings of $81,750, while those with high school diploma education have the smallest earnings of $37,857.
| Educational Attainment | Male Income | Female Income |
| Less than High School | - | - |
| High School Diploma | $44,135 | $37,857 |
| College or Associate's Degree | $78,233 | $44,861 |
| Bachelor's Degree | $110,598 | $49,896 |
| Graduate Degree | $98,446 | $81,750 |
| Total | $88,906 | $49,634 |
Family Income in North Plains
Family Income Brackets in North Plains
According to the North Plains family income data, there are 230 families falling into the $200,000+ income range, which is the most common income bracket and makes up 27.9% of all families.
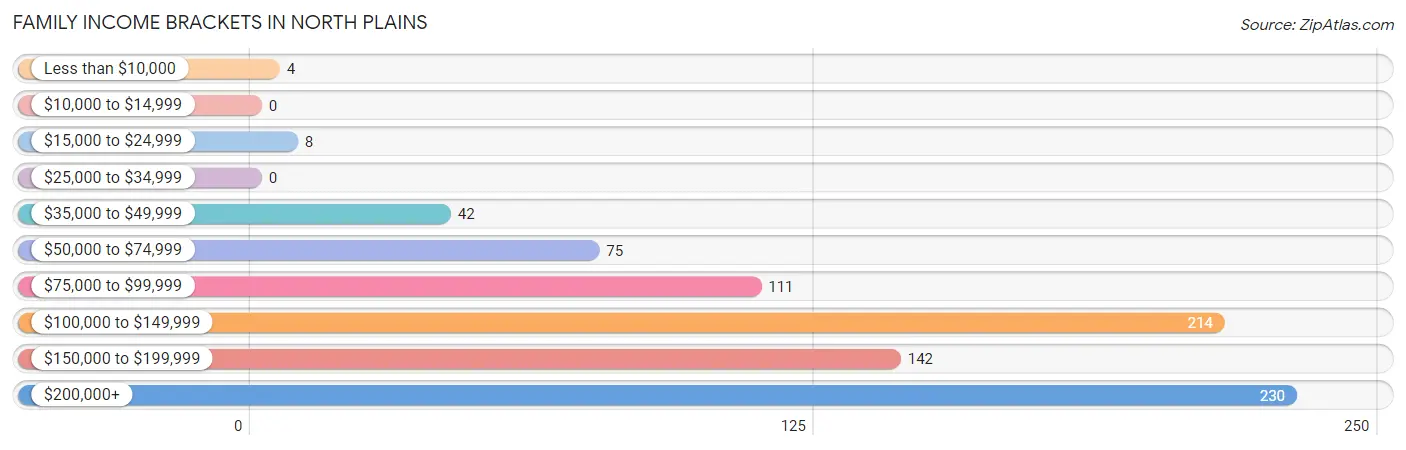
| Income Bracket | # Families | % Families |
| Less than $10,000 | 4 | 0.5% |
| $10,000 to $14,999 | 0 | 0.0% |
| $15,000 to $24,999 | 8 | 1.0% |
| $25,000 to $34,999 | 0 | 0.0% |
| $35,000 to $49,999 | 42 | 5.1% |
| $50,000 to $74,999 | 75 | 9.1% |
| $75,000 to $99,999 | 111 | 13.4% |
| $100,000 to $149,999 | 214 | 25.9% |
| $150,000 to $199,999 | 142 | 17.2% |
| $200,000+ | 230 | 27.8% |
Family Income by Famaliy Size in North Plains
6-person families (42 | 5.1%) account for the highest median family income in North Plains with $227,614 per family, while 2-person families (338 | 40.9%) have the highest median income of $66,042 per family member.
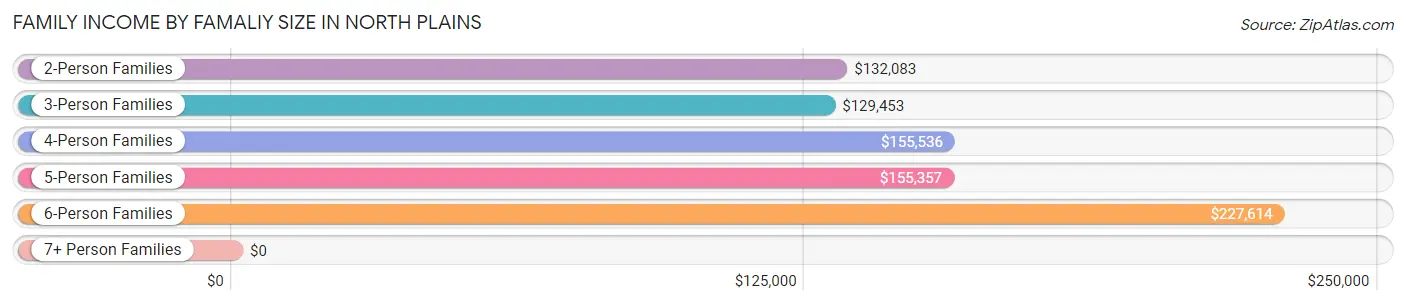
| Income Bracket | # Families | Median Income |
| 2-Person Families | 338 (40.9%) | $132,083 |
| 3-Person Families | 167 (20.2%) | $129,453 |
| 4-Person Families | 203 (24.6%) | $155,536 |
| 5-Person Families | 76 (9.2%) | $155,357 |
| 6-Person Families | 42 (5.1%) | $227,614 |
| 7+ Person Families | 0 (0.0%) | $0 |
| Total | 826 (100.0%) | $141,184 |
Family Income by Number of Earners in North Plains
The median family income in North Plains is $141,184, with families comprising 3+ earners (110) having the highest median family income of $220,500, while families with no earners (41) have the lowest median family income of $42,411, accounting for 13.3% and 5.0% of families, respectively.
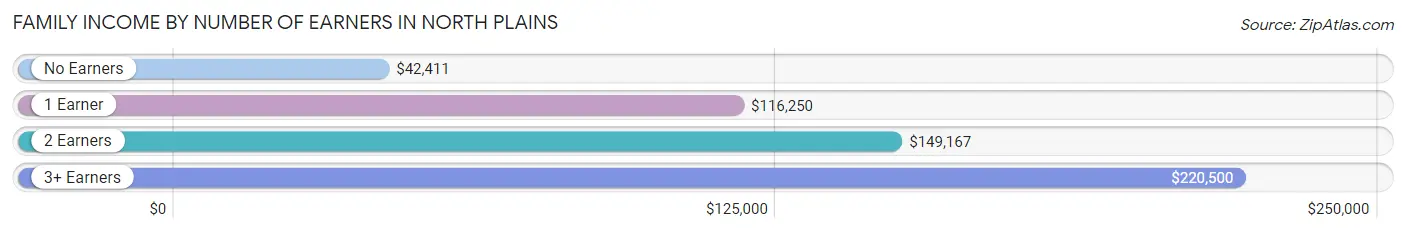
| Number of Earners | # Families | Median Income |
| No Earners | 41 (5.0%) | $42,411 |
| 1 Earner | 193 (23.4%) | $116,250 |
| 2 Earners | 482 (58.4%) | $149,167 |
| 3+ Earners | 110 (13.3%) | $220,500 |
| Total | 826 (100.0%) | $141,184 |
Household Income in North Plains
Household Income Brackets in North Plains
With 286 households falling in the category, the $100,000 to $149,999 income range is the most frequent in North Plains, accounting for 22.1% of all households. In contrast, only 10 households (0.8%) fall into the $10,000 to $14,999 income bracket, making it the least populous group.
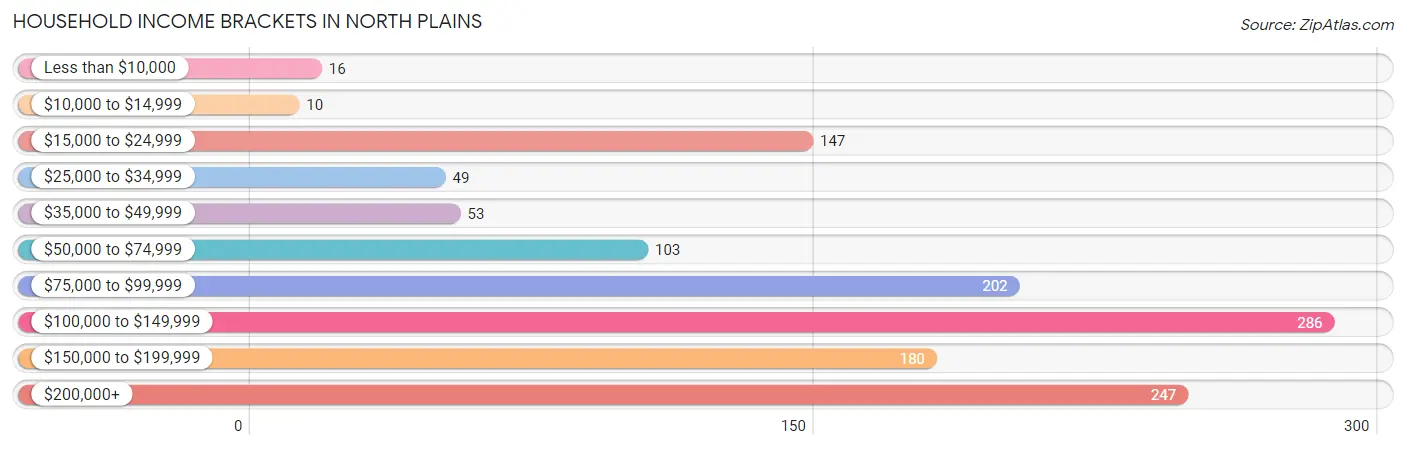
| Income Bracket | # Households | % Households |
| Less than $10,000 | 16 | 1.2% |
| $10,000 to $14,999 | 10 | 0.8% |
| $15,000 to $24,999 | 147 | 11.4% |
| $25,000 to $34,999 | 49 | 3.8% |
| $35,000 to $49,999 | 53 | 4.1% |
| $50,000 to $74,999 | 103 | 8.0% |
| $75,000 to $99,999 | 202 | 15.6% |
| $100,000 to $149,999 | 286 | 22.1% |
| $150,000 to $199,999 | 180 | 13.9% |
| $200,000+ | 247 | 19.1% |
Household Income by Householder Age in North Plains
The median household income in North Plains is $109,559, with the highest median household income of $140,170 found in the 25 to 44 years age bracket for the primary householder. A total of 513 households (39.7%) fall into this category. Meanwhile, the 15 to 24 years age bracket for the primary householder has the lowest median household income of $0, with 16 households (1.2%) in this group.
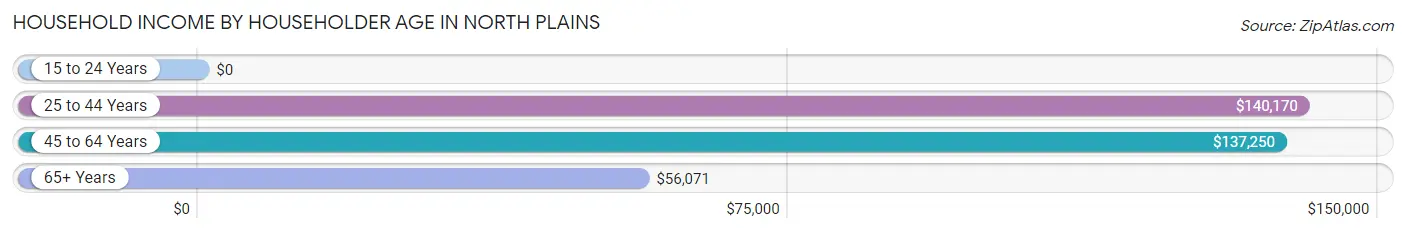
| Income Bracket | # Households | Median Income |
| 15 to 24 Years | 16 (1.2%) | $0 |
| 25 to 44 Years | 513 (39.7%) | $140,170 |
| 45 to 64 Years | 399 (30.9%) | $137,250 |
| 65+ Years | 364 (28.2%) | $56,071 |
| Total | 1,292 (100.0%) | $109,559 |
Poverty in North Plains
Income Below Poverty by Sex and Age in North Plains
With 3.6% poverty level for males and 1.9% for females among the residents of North Plains, 75 year old and over males and 12 to 14 year old females are the most vulnerable to poverty, with 10 males (18.5%) and 1 females (20.0%) in their respective age groups living below the poverty level.
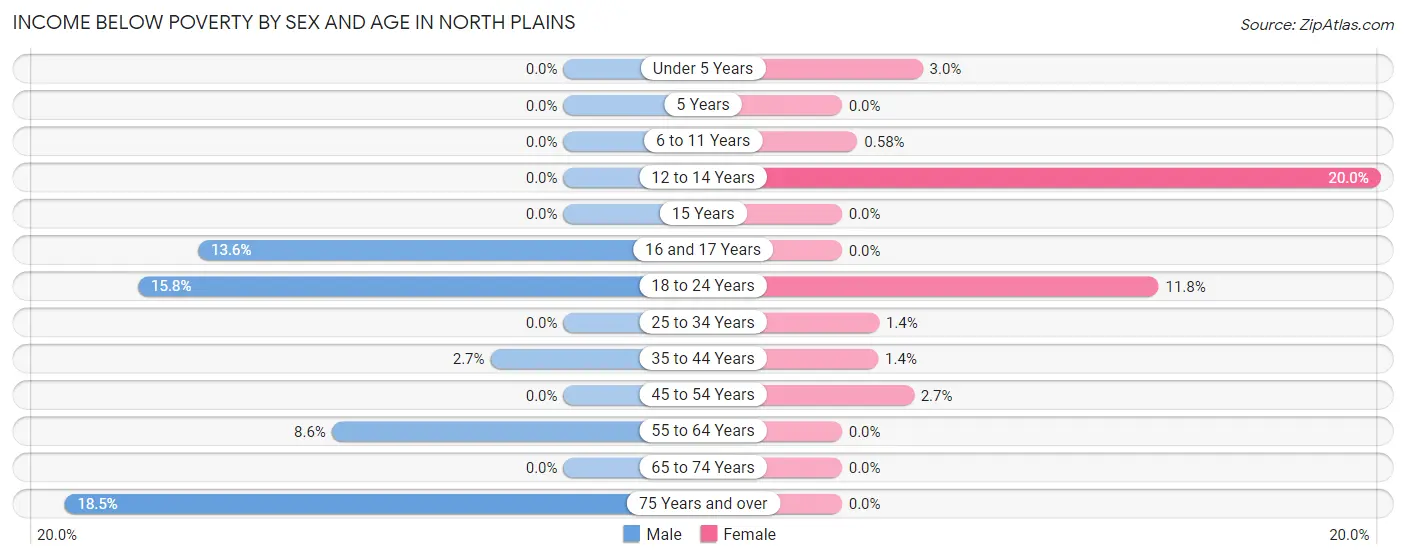
| Age Bracket | Male | Female |
| Under 5 Years | 0 (0.0%) | 3 (3.0%) |
| 5 Years | 0 (0.0%) | 0 (0.0%) |
| 6 to 11 Years | 0 (0.0%) | 1 (0.6%) |
| 12 to 14 Years | 0 (0.0%) | 1 (20.0%) |
| 15 Years | 0 (0.0%) | 0 (0.0%) |
| 16 and 17 Years | 8 (13.6%) | 0 (0.0%) |
| 18 to 24 Years | 21 (15.8%) | 14 (11.8%) |
| 25 to 34 Years | 0 (0.0%) | 4 (1.4%) |
| 35 to 44 Years | 7 (2.7%) | 3 (1.3%) |
| 45 to 54 Years | 0 (0.0%) | 5 (2.7%) |
| 55 to 64 Years | 16 (8.6%) | 0 (0.0%) |
| 65 to 74 Years | 0 (0.0%) | 0 (0.0%) |
| 75 Years and over | 10 (18.5%) | 0 (0.0%) |
| Total | 62 (3.6%) | 31 (1.9%) |
Income Above Poverty by Sex and Age in North Plains
According to the poverty statistics in North Plains, males aged under 5 years and females aged 5 years are the age groups that are most secure financially, with 100.0% of males and 100.0% of females in these age groups living above the poverty line.
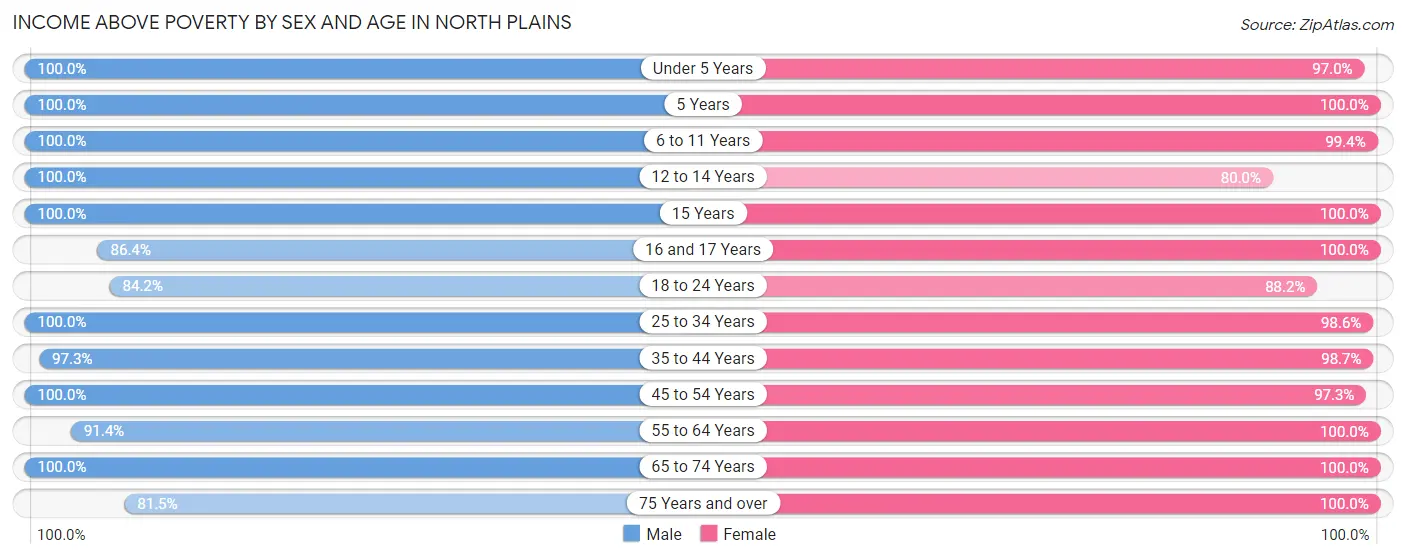
| Age Bracket | Male | Female |
| Under 5 Years | 152 (100.0%) | 97 (97.0%) |
| 5 Years | 16 (100.0%) | 48 (100.0%) |
| 6 to 11 Years | 146 (100.0%) | 170 (99.4%) |
| 12 to 14 Years | 17 (100.0%) | 4 (80.0%) |
| 15 Years | 13 (100.0%) | 6 (100.0%) |
| 16 and 17 Years | 51 (86.4%) | 18 (100.0%) |
| 18 to 24 Years | 112 (84.2%) | 105 (88.2%) |
| 25 to 34 Years | 295 (100.0%) | 286 (98.6%) |
| 35 to 44 Years | 251 (97.3%) | 220 (98.7%) |
| 45 to 54 Years | 193 (100.0%) | 182 (97.3%) |
| 55 to 64 Years | 170 (91.4%) | 189 (100.0%) |
| 65 to 74 Years | 201 (100.0%) | 168 (100.0%) |
| 75 Years and over | 44 (81.5%) | 103 (100.0%) |
| Total | 1,661 (96.4%) | 1,596 (98.1%) |
Income Below Poverty Among Married-Couple Families in North Plains
The poverty statistics for married-couple families in North Plains show that 0.4% or 3 of the total 717 families live below the poverty line. Families with 1 or 2 children have the highest poverty rate of 0.9%, comprising of 3 families. On the other hand, families with no children have the lowest poverty rate of 0.0%, which includes 0 families.
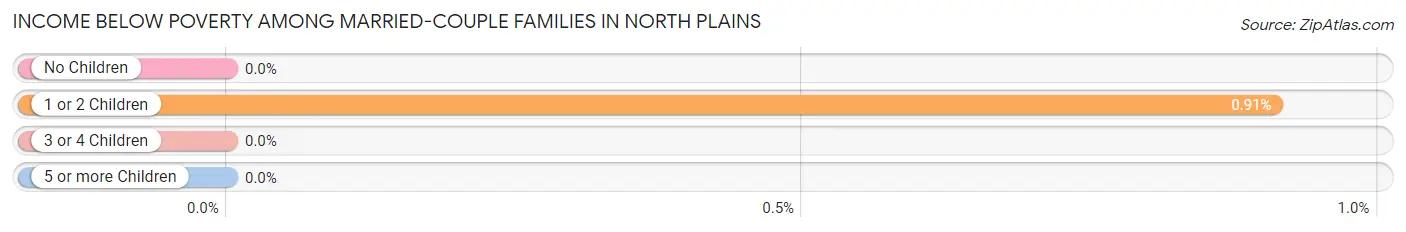
| Children | Above Poverty | Below Poverty |
| No Children | 334 (100.0%) | 0 (0.0%) |
| 1 or 2 Children | 326 (99.1%) | 3 (0.9%) |
| 3 or 4 Children | 54 (100.0%) | 0 (0.0%) |
| 5 or more Children | 0 (0.0%) | 0 (0.0%) |
| Total | 714 (99.6%) | 3 (0.4%) |
Income Below Poverty Among Single-Parent Households in North Plains
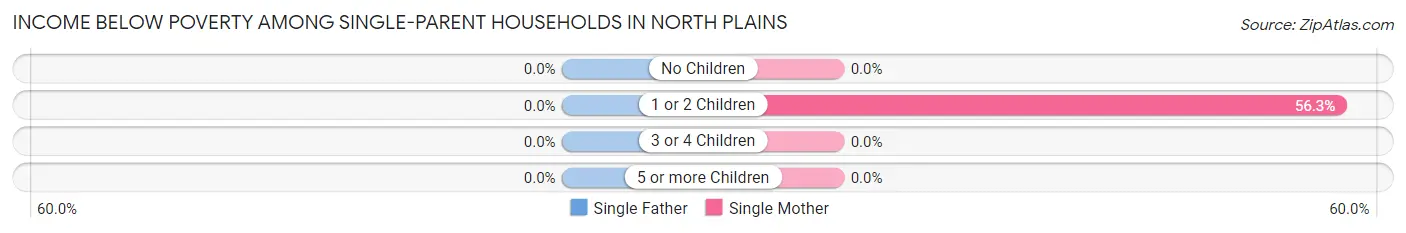
| Children | Single Father | Single Mother |
| No Children | 0 (0.0%) | 0 (0.0%) |
| 1 or 2 Children | 0 (0.0%) | 9 (56.2%) |
| 3 or 4 Children | 0 (0.0%) | 0 (0.0%) |
| 5 or more Children | 0 (0.0%) | 0 (0.0%) |
| Total | 0 (0.0%) | 9 (14.7%) |
Income Below Poverty Among Married-Couple vs Single-Parent Households in North Plains
The poverty data for North Plains shows that 3 of the married-couple family households (0.4%) and 9 of the single-parent households (8.3%) are living below the poverty level. Within the married-couple family households, those with 1 or 2 children have the highest poverty rate, with 3 households (0.9%) falling below the poverty line. Among the single-parent households, those with 1 or 2 children have the highest poverty rate, with 9 household (28.1%) living below poverty.
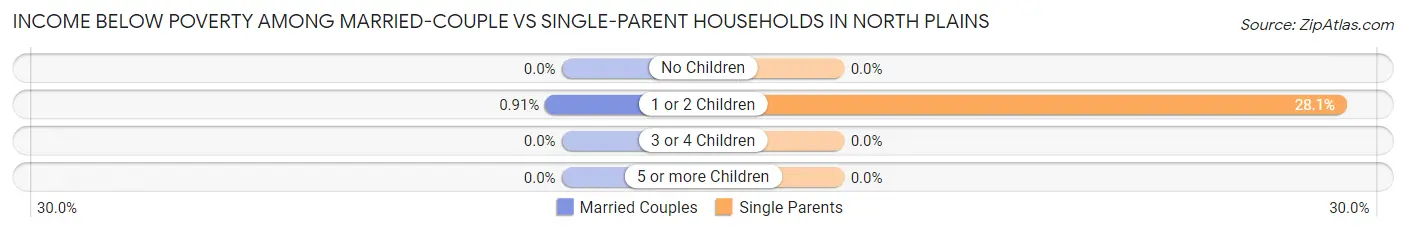
| Children | Married-Couple Families | Single-Parent Households |
| No Children | 0 (0.0%) | 0 (0.0%) |
| 1 or 2 Children | 3 (0.9%) | 9 (28.1%) |
| 3 or 4 Children | 0 (0.0%) | 0 (0.0%) |
| 5 or more Children | 0 (0.0%) | 0 (0.0%) |
| Total | 3 (0.4%) | 9 (8.3%) |
Race in North Plains
The most populous races in North Plains are White / Caucasian (2,383 | 70.8%), Asian (350 | 10.4%), and Hispanic or Latino (324 | 9.6%).
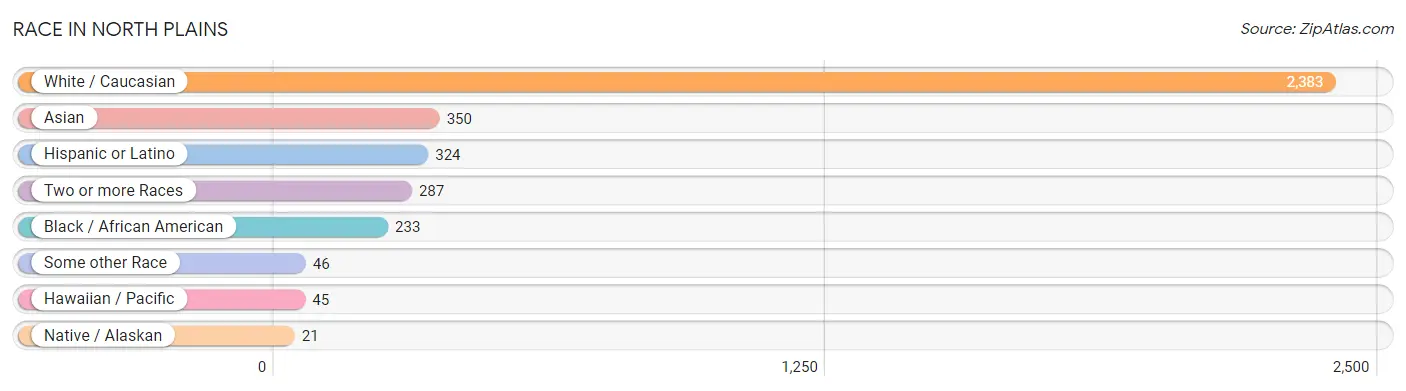
| Race | # Population | % Population |
| Asian | 350 | 10.4% |
| Black / African American | 233 | 6.9% |
| Hawaiian / Pacific | 45 | 1.3% |
| Hispanic or Latino | 324 | 9.6% |
| Native / Alaskan | 21 | 0.6% |
| White / Caucasian | 2,383 | 70.8% |
| Two or more Races | 287 | 8.5% |
| Some other Race | 46 | 1.4% |
| Total | 3,365 | 100.0% |
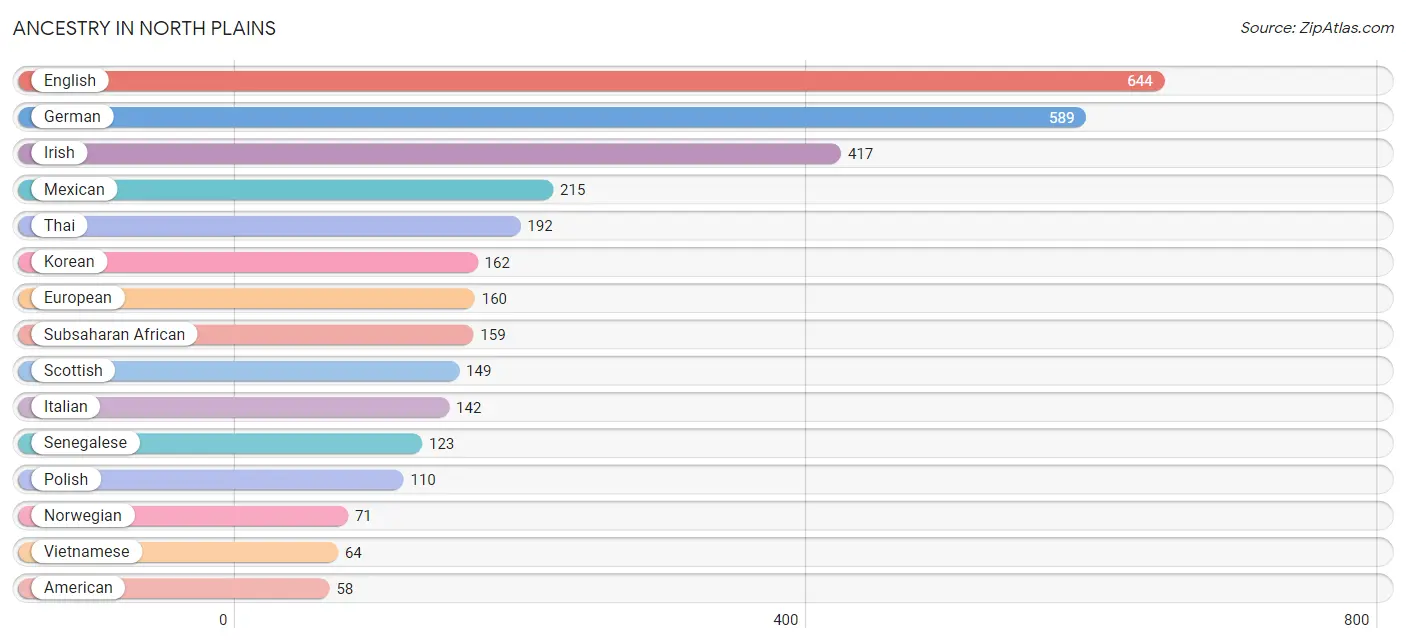
Ancestry in North Plains
The most populous ancestries reported in North Plains are English (644 | 19.1%), German (589 | 17.5%), Irish (417 | 12.4%), Mexican (215 | 6.4%), and Thai (192 | 5.7%), together accounting for 61.1% of all North Plains residents.
| Ancestry | # Population | % Population |
| African | 36 | 1.1% |
| Alsatian | 5 | 0.2% |
| American | 58 | 1.7% |
| Arab | 27 | 0.8% |
| Belgian | 8 | 0.2% |
| Bhutanese | 8 | 0.2% |
| British | 17 | 0.5% |
| Burmese | 21 | 0.6% |
| Canadian | 25 | 0.7% |
| Central American | 28 | 0.8% |
| Cherokee | 5 | 0.2% |
| Chippewa | 11 | 0.3% |
| Choctaw | 7 | 0.2% |
| Croatian | 16 | 0.5% |
| Czech | 5 | 0.2% |
| Danish | 39 | 1.2% |
| Dutch | 33 | 1.0% |
| Eastern European | 39 | 1.2% |
| English | 644 | 19.1% |
| European | 160 | 4.8% |
| Finnish | 4 | 0.1% |
| French | 51 | 1.5% |
| French Canadian | 13 | 0.4% |
| German | 589 | 17.5% |
| Greek | 18 | 0.5% |
| Guamanian / Chamorro | 21 | 0.6% |
| Hungarian | 5 | 0.2% |
| Indian (Asian) | 5 | 0.2% |
| Iranian | 6 | 0.2% |
| Irish | 417 | 12.4% |
| Israeli | 22 | 0.6% |
| Italian | 142 | 4.2% |
| Korean | 162 | 4.8% |
| Lithuanian | 2 | 0.1% |
| Macedonian | 41 | 1.2% |
| Mexican | 215 | 6.4% |
| Native Hawaiian | 45 | 1.3% |
| New Zealander | 28 | 0.8% |
| Northern European | 30 | 0.9% |
| Norwegian | 71 | 2.1% |
| Palestinian | 4 | 0.1% |
| Panamanian | 10 | 0.3% |
| Polish | 110 | 3.3% |
| Puerto Rican | 6 | 0.2% |
| Romanian | 9 | 0.3% |
| Russian | 9 | 0.3% |
| Salvadoran | 18 | 0.5% |
| Scandinavian | 11 | 0.3% |
| Scotch-Irish | 23 | 0.7% |
| Scottish | 149 | 4.4% |
| Senegalese | 123 | 3.7% |
| Sioux | 3 | 0.1% |
| Spaniard | 35 | 1.0% |
| Sri Lankan | 9 | 0.3% |
| Subsaharan African | 159 | 4.7% |
| Swedish | 49 | 1.5% |
| Swiss | 4 | 0.1% |
| Thai | 192 | 5.7% |
| Tlingit-Haida | 6 | 0.2% |
| Ukrainian | 15 | 0.4% |
| Vietnamese | 64 | 1.9% |
| Welsh | 9 | 0.3% |
| Yugoslavian | 5 | 0.2% | View All 63 Rows |
Immigrants in North Plains
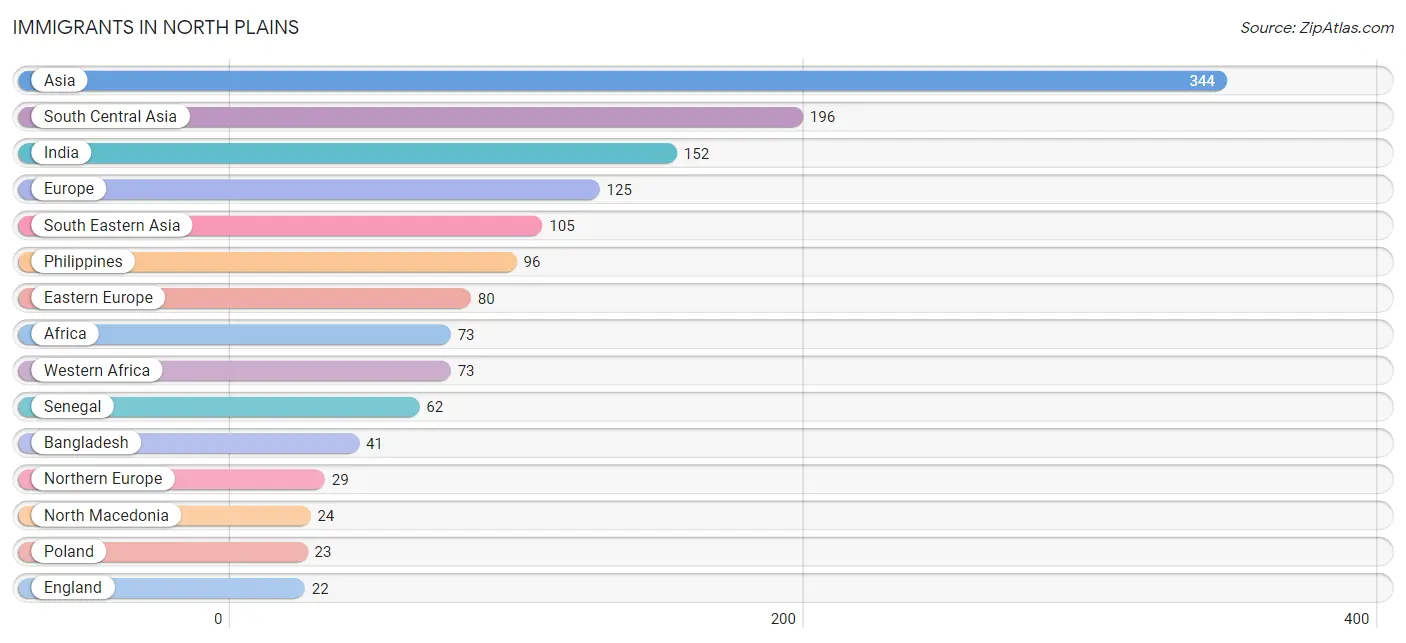
The most numerous immigrant groups reported in North Plains came from Asia (344 | 10.2%), South Central Asia (196 | 5.8%), India (152 | 4.5%), Europe (125 | 3.7%), and South Eastern Asia (105 | 3.1%), together accounting for 27.4% of all North Plains residents.
| Immigration Origin | # Population | % Population |
| Africa | 73 | 2.2% |
| Asia | 344 | 10.2% |
| Australia | 15 | 0.4% |
| Bangladesh | 41 | 1.2% |
| Croatia | 10 | 0.3% |
| Eastern Asia | 21 | 0.6% |
| Eastern Europe | 80 | 2.4% |
| England | 22 | 0.6% |
| Europe | 125 | 3.7% |
| Greece | 10 | 0.3% |
| India | 152 | 4.5% |
| Ireland | 7 | 0.2% |
| Israel | 22 | 0.6% |
| Italy | 6 | 0.2% |
| Kazakhstan | 3 | 0.1% |
| Korea | 21 | 0.6% |
| North Macedonia | 24 | 0.7% |
| Northern Europe | 29 | 0.9% |
| Oceania | 15 | 0.4% |
| Philippines | 96 | 2.9% |
| Poland | 23 | 0.7% |
| Romania | 9 | 0.3% |
| Russia | 9 | 0.3% |
| Senegal | 62 | 1.8% |
| South Central Asia | 196 | 5.8% |
| South Eastern Asia | 105 | 3.1% |
| Southern Europe | 16 | 0.5% |
| Ukraine | 5 | 0.2% |
| Vietnam | 9 | 0.3% |
| Western Africa | 73 | 2.2% |
| Western Asia | 22 | 0.6% | View All 31 Rows |
Sex and Age in North Plains
Sex and Age in North Plains
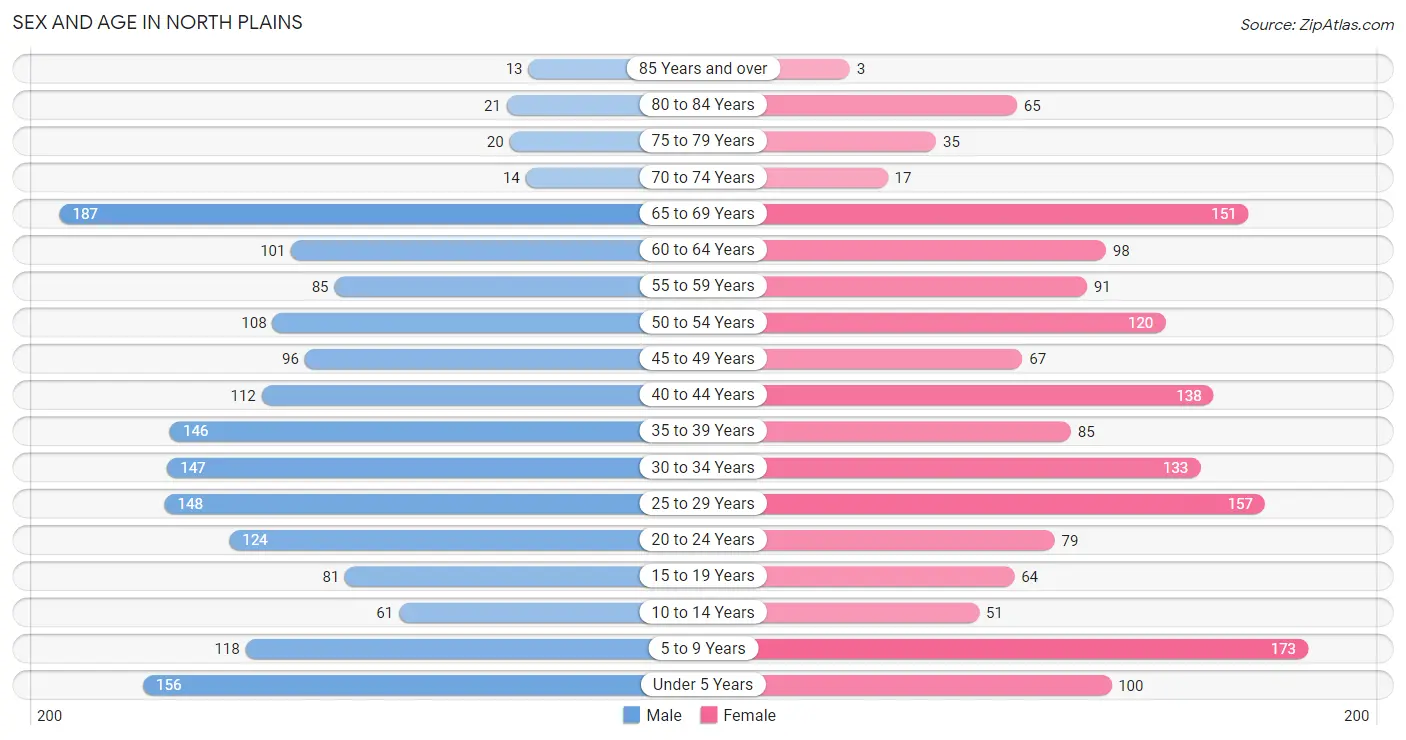
The most populous age groups in North Plains are 65 to 69 Years (187 | 10.8%) for men and 5 to 9 Years (173 | 10.6%) for women.
| Age Bracket | Male | Female |
| Under 5 Years | 156 (9.0%) | 100 (6.1%) |
| 5 to 9 Years | 118 (6.8%) | 173 (10.6%) |
| 10 to 14 Years | 61 (3.5%) | 51 (3.1%) |
| 15 to 19 Years | 81 (4.7%) | 64 (3.9%) |
| 20 to 24 Years | 124 (7.1%) | 79 (4.9%) |
| 25 to 29 Years | 148 (8.5%) | 157 (9.7%) |
| 30 to 34 Years | 147 (8.5%) | 133 (8.2%) |
| 35 to 39 Years | 146 (8.4%) | 85 (5.2%) |
| 40 to 44 Years | 112 (6.4%) | 138 (8.5%) |
| 45 to 49 Years | 96 (5.5%) | 67 (4.1%) |
| 50 to 54 Years | 108 (6.2%) | 120 (7.4%) |
| 55 to 59 Years | 85 (4.9%) | 91 (5.6%) |
| 60 to 64 Years | 101 (5.8%) | 98 (6.0%) |
| 65 to 69 Years | 187 (10.8%) | 151 (9.3%) |
| 70 to 74 Years | 14 (0.8%) | 17 (1.0%) |
| 75 to 79 Years | 20 (1.1%) | 35 (2.1%) |
| 80 to 84 Years | 21 (1.2%) | 65 (4.0%) |
| 85 Years and over | 13 (0.7%) | 3 (0.2%) |
| Total | 1,738 (100.0%) | 1,627 (100.0%) |
Families and Households in North Plains
Median Family Size in North Plains
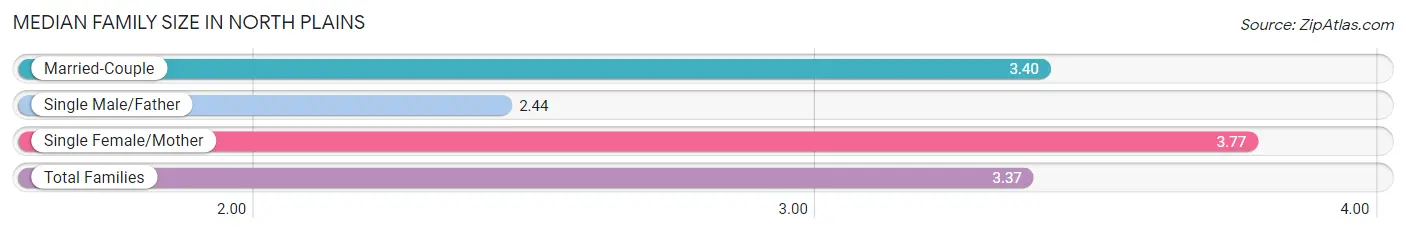
The median family size in North Plains is 3.37 persons per family, with single female/mother families (61 | 7.4%) accounting for the largest median family size of 3.77 persons per family. On the other hand, single male/father families (48 | 5.8%) represent the smallest median family size with 2.44 persons per family.
| Family Type | # Families | Family Size |
| Married-Couple | 717 (86.8%) | 3.40 |
| Single Male/Father | 48 (5.8%) | 2.44 |
| Single Female/Mother | 61 (7.4%) | 3.77 |
| Total Families | 826 (100.0%) | 3.37 |
Median Household Size in North Plains
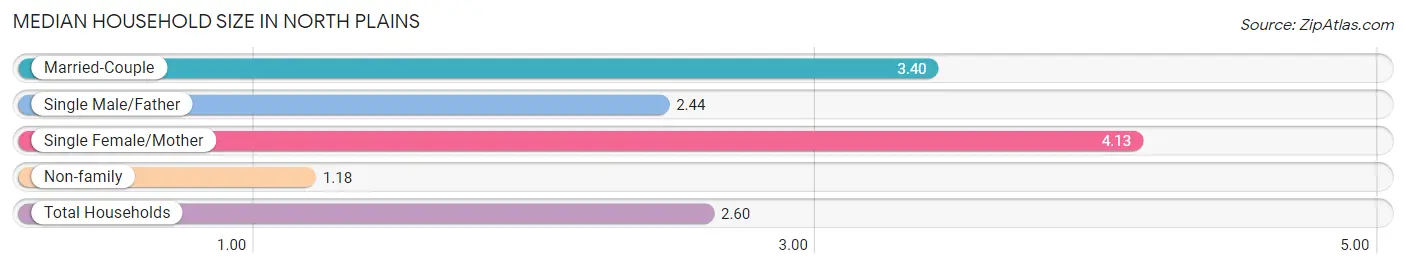
The median household size in North Plains is 2.60 persons per household, with single female/mother households (61 | 4.7%) accounting for the largest median household size of 4.13 persons per household. non-family households (466 | 36.1%) represent the smallest median household size with 1.18 persons per household.
| Household Type | # Households | Household Size |
| Married-Couple | 717 (55.5%) | 3.40 |
| Single Male/Father | 48 (3.7%) | 2.44 |
| Single Female/Mother | 61 (4.7%) | 4.13 |
| Non-family | 466 (36.1%) | 1.18 |
| Total Households | 1,292 (100.0%) | 2.60 |
Household Size by Marriage Status in North Plains
Out of a total of 1,292 households in North Plains, 826 (63.9%) are family households, while 466 (36.1%) are nonfamily households. The most numerous type of family households are 2-person households, comprising 334, and the most common type of nonfamily households are 1-person households, comprising 399.
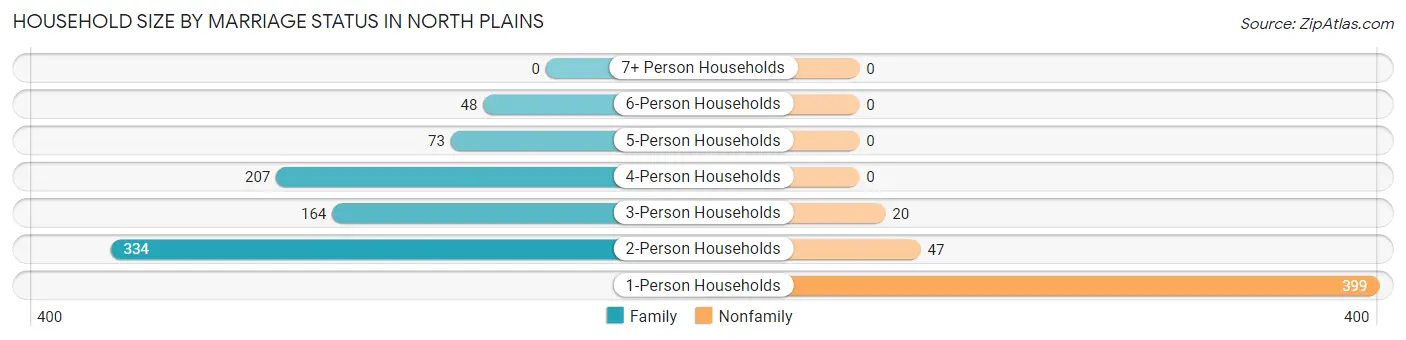
| Household Size | Family Households | Nonfamily Households |
| 1-Person Households | - | 399 (30.9%) |
| 2-Person Households | 334 (25.9%) | 47 (3.6%) |
| 3-Person Households | 164 (12.7%) | 20 (1.5%) |
| 4-Person Households | 207 (16.0%) | 0 (0.0%) |
| 5-Person Households | 73 (5.7%) | 0 (0.0%) |
| 6-Person Households | 48 (3.7%) | 0 (0.0%) |
| 7+ Person Households | 0 (0.0%) | 0 (0.0%) |
| Total | 826 (63.9%) | 466 (36.1%) |
Female Fertility in North Plains
Fertility by Age in North Plains
Average fertility rate in North Plains is 13.0 births per 1,000 women. Women in the age bracket of 35 to 50 years have the highest fertility rate with 16.0 births per 1,000 women. Women in the age bracket of 20 to 34 years acount for 50.0% of all women with births.
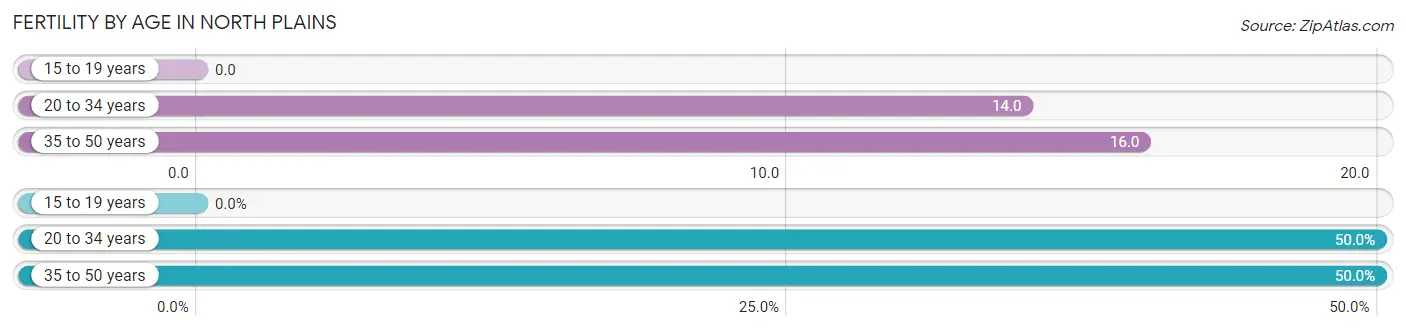
| Age Bracket | Women with Births | Births / 1,000 Women |
| 15 to 19 years | 0 (0.0%) | 0.0 |
| 20 to 34 years | 5 (50.0%) | 14.0 |
| 35 to 50 years | 5 (50.0%) | 16.0 |
| Total | 10 (100.0%) | 13.0 |
Fertility by Age by Marriage Status in North Plains
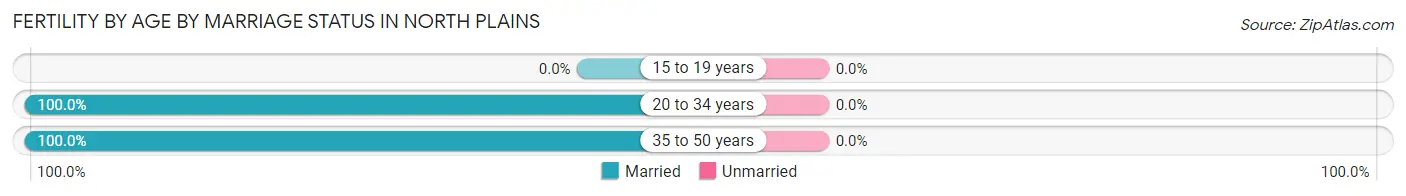
| Age Bracket | Married | Unmarried |
| 15 to 19 years | 0 (0.0%) | 0 (0.0%) |
| 20 to 34 years | 5 (100.0%) | 0 (0.0%) |
| 35 to 50 years | 5 (100.0%) | 0 (0.0%) |
| Total | 10 (100.0%) | 0 (0.0%) |
Fertility by Education in North Plains
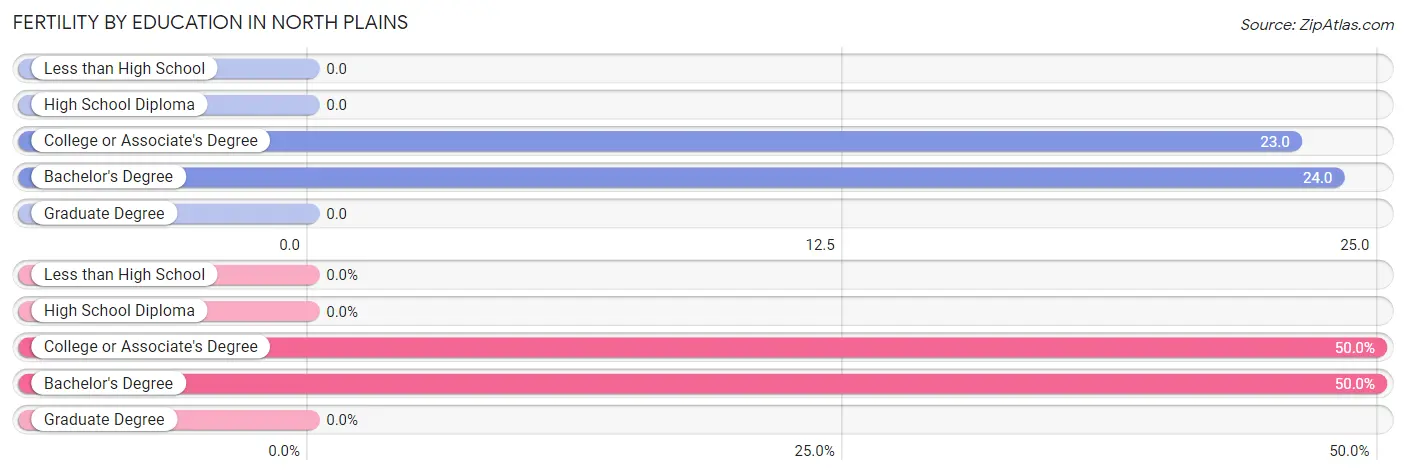
| Educational Attainment | Women with Births | Births / 1,000 Women |
| Less than High School | 0 (0.0%) | 0.0 |
| High School Diploma | 0 (0.0%) | 0.0 |
| College or Associate's Degree | 5 (50.0%) | 23.0 |
| Bachelor's Degree | 5 (50.0%) | 24.0 |
| Graduate Degree | 0 (0.0%) | 0.0 |
| Total | 10 (100.0%) | 13.0 |
Fertility by Education by Marriage Status in North Plains
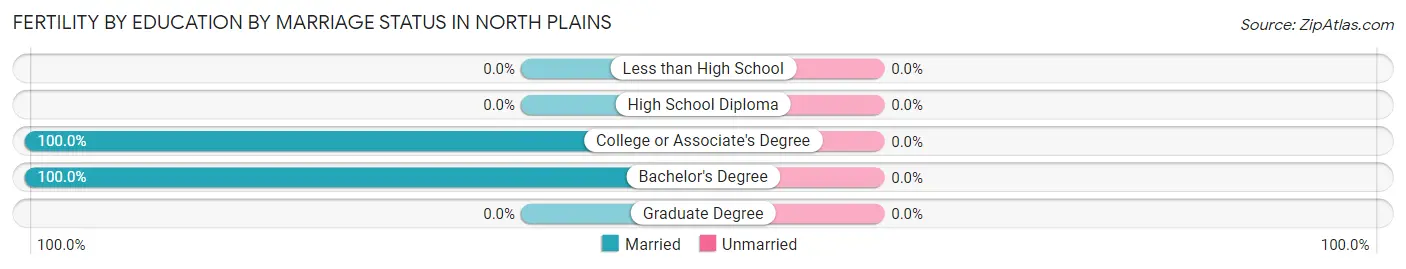
| Educational Attainment | Married | Unmarried |
| Less than High School | 0 (0.0%) | 0 (0.0%) |
| High School Diploma | 0 (0.0%) | 0 (0.0%) |
| College or Associate's Degree | 5 (100.0%) | 0 (0.0%) |
| Bachelor's Degree | 5 (100.0%) | 0 (0.0%) |
| Graduate Degree | 0 (0.0%) | 0 (0.0%) |
| Total | 10 (100.0%) | 0 (0.0%) |
Employment Characteristics in North Plains
Employment by Class of Employer in North Plains
Among the 1,734 employed individuals in North Plains, private company employees (1,323 | 76.3%), local government employees (183 | 10.5%), and not-for-profit organizations (99 | 5.7%) make up the most common classes of employment.
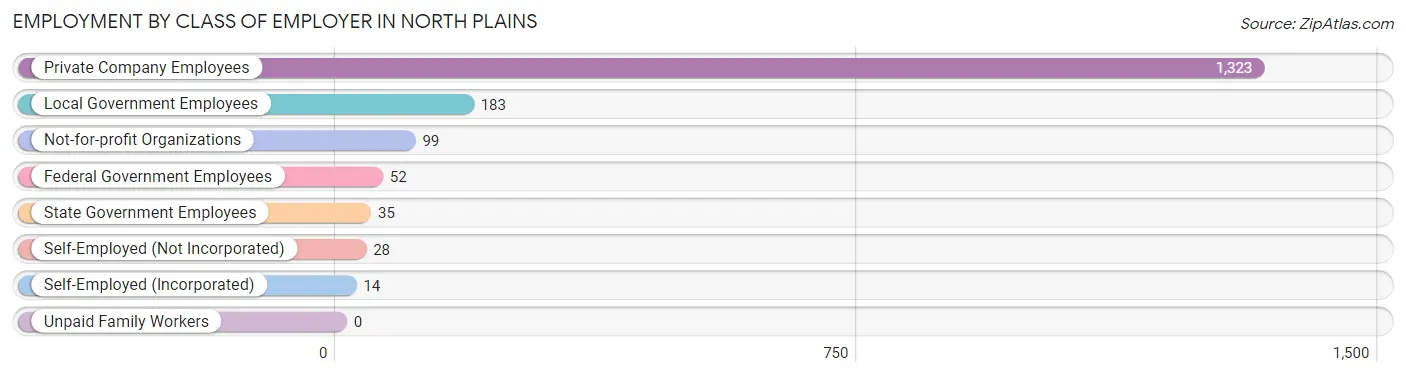
| Employer Class | # Employees | % Employees |
| Private Company Employees | 1,323 | 76.3% |
| Self-Employed (Incorporated) | 14 | 0.8% |
| Self-Employed (Not Incorporated) | 28 | 1.6% |
| Not-for-profit Organizations | 99 | 5.7% |
| Local Government Employees | 183 | 10.5% |
| State Government Employees | 35 | 2.0% |
| Federal Government Employees | 52 | 3.0% |
| Unpaid Family Workers | 0 | 0.0% |
| Total | 1,734 | 100.0% |
Employment Status by Age in North Plains
According to the labor force statistics for North Plains, out of the total population over 16 years of age (2,687), 70.0% or 1,881 individuals are in the labor force, with 6.0% or 113 of them unemployed. The age group with the highest labor force participation rate is 55 to 59 years, with 94.3% or 166 individuals in the labor force. Within the labor force, the 25 to 29 years age range has the highest percentage of unemployed individuals, with 23.8% or 66 of them being unemployed.
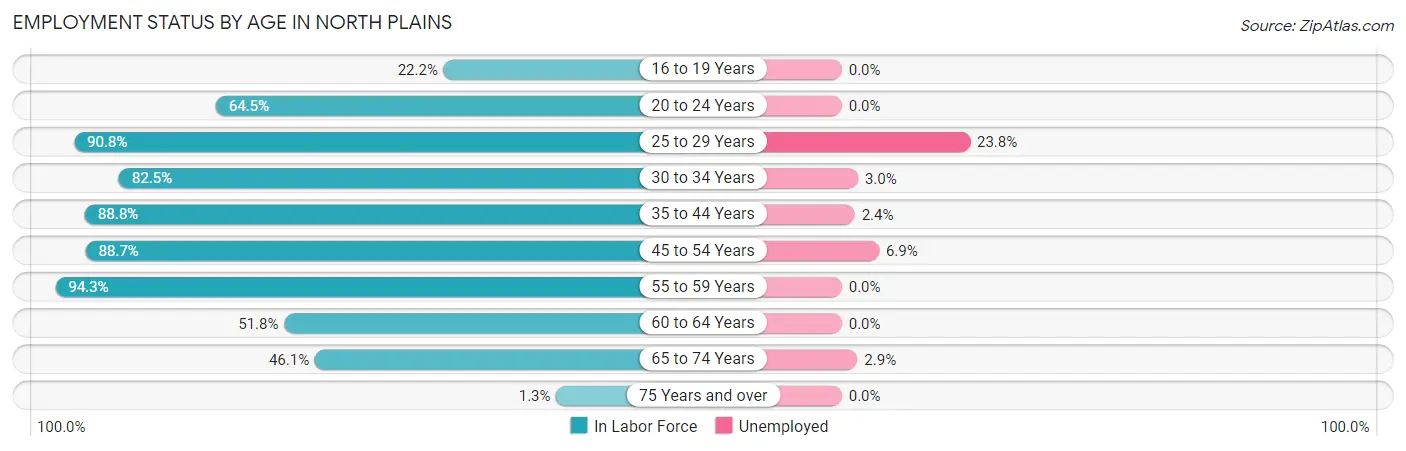
| Age Bracket | In Labor Force | Unemployed |
| 16 to 19 Years | 28 (22.2%) | 0 (0.0%) |
| 20 to 24 Years | 131 (64.5%) | 0 (0.0%) |
| 25 to 29 Years | 277 (90.8%) | 66 (23.8%) |
| 30 to 34 Years | 231 (82.5%) | 7 (3.0%) |
| 35 to 44 Years | 427 (88.8%) | 10 (2.4%) |
| 45 to 54 Years | 347 (88.7%) | 24 (6.9%) |
| 55 to 59 Years | 166 (94.3%) | 0 (0.0%) |
| 60 to 64 Years | 103 (51.8%) | 0 (0.0%) |
| 65 to 74 Years | 170 (46.1%) | 5 (2.9%) |
| 75 Years and over | 2 (1.3%) | 0 (0.0%) |
| Total | 1,881 (70.0%) | 113 (6.0%) |
Employment Status by Educational Attainment in North Plains
According to labor force statistics for North Plains, 84.7% of individuals (1,552) out of the total population between 25 and 64 years of age (1,832) are in the labor force, with 6.9% or 107 of them being unemployed. The group with the highest labor force participation rate are those with the educational attainment of less than high school, with 100.0% or 23 individuals in the labor force. Within the labor force, individuals with college / associate degree education have the highest percentage of unemployment, with 8.7% or 47 of them being unemployed.
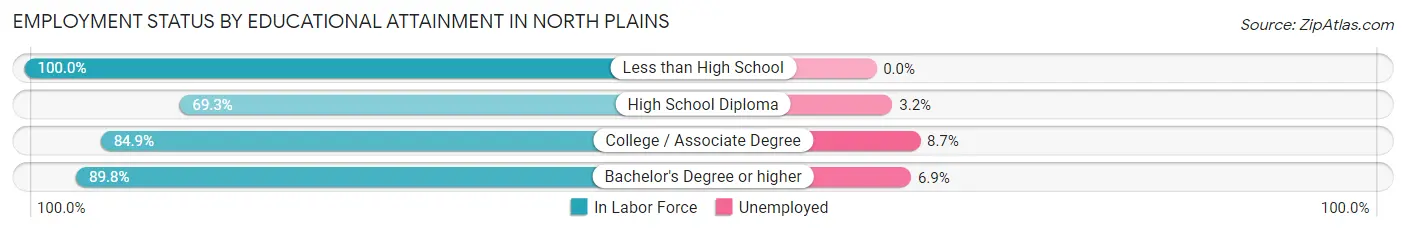
| Educational Attainment | In Labor Force | Unemployed |
| Less than High School | 23 (100.0%) | 0 (0.0%) |
| High School Diploma | 221 (69.3%) | 10 (3.2%) |
| College / Associate Degree | 539 (84.9%) | 55 (8.7%) |
| Bachelor's Degree or higher | 768 (89.8%) | 59 (6.9%) |
| Total | 1,552 (84.7%) | 126 (6.9%) |
Employment Occupations by Sex in North Plains
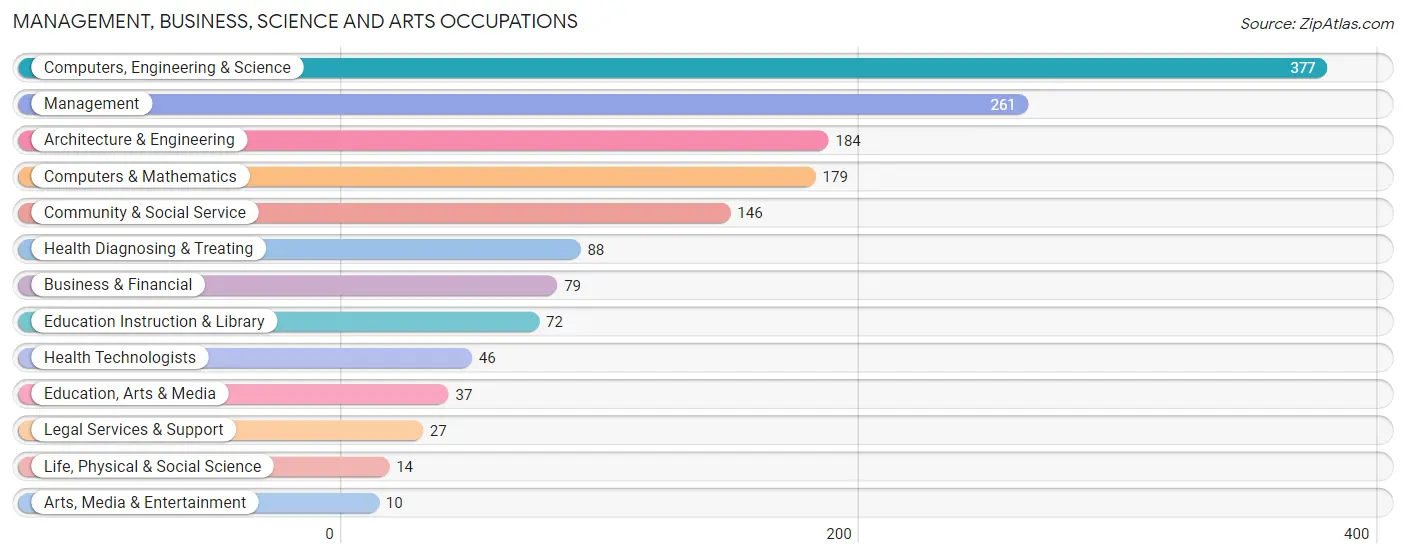
Management, Business, Science and Arts Occupations
The most common Management, Business, Science and Arts occupations in North Plains are Computers, Engineering & Science (377 | 21.4%), Management (261 | 14.8%), Architecture & Engineering (184 | 10.4%), Computers & Mathematics (179 | 10.2%), and Community & Social Service (146 | 8.3%).
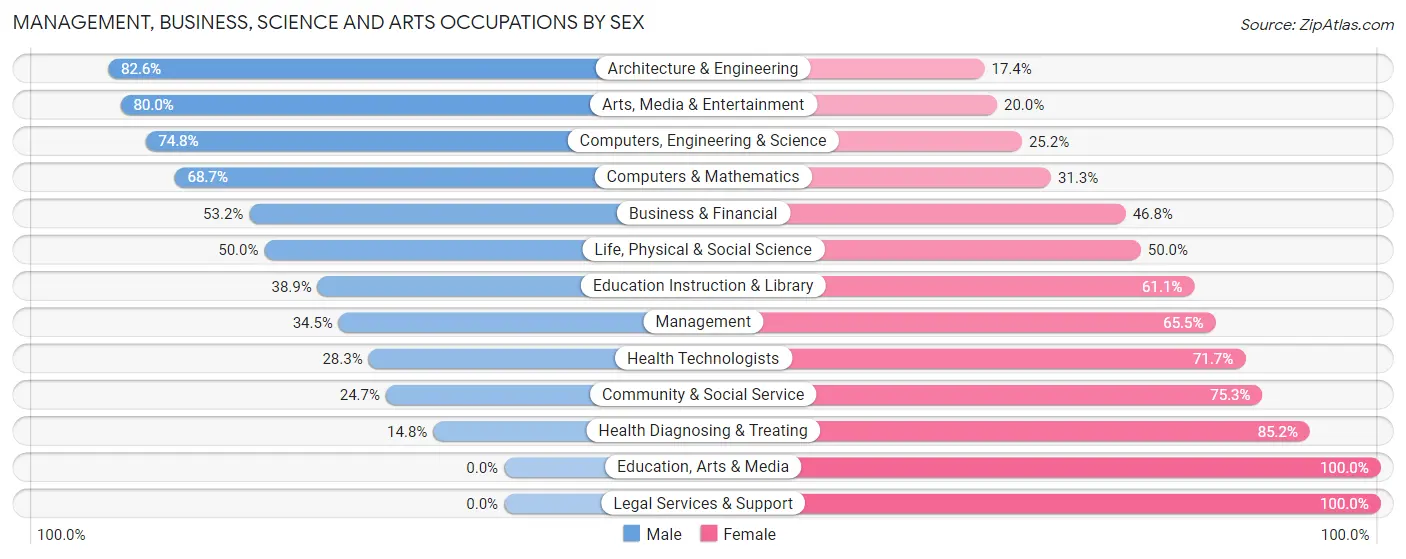
Management, Business, Science and Arts Occupations by Sex
Within the Management, Business, Science and Arts occupations in North Plains, the most male-oriented occupations are Architecture & Engineering (82.6%), Arts, Media & Entertainment (80.0%), and Computers, Engineering & Science (74.8%), while the most female-oriented occupations are Education, Arts & Media (100.0%), Legal Services & Support (100.0%), and Health Diagnosing & Treating (85.2%).
| Occupation | Male | Female |
| Management | 90 (34.5%) | 171 (65.5%) |
| Business & Financial | 42 (53.2%) | 37 (46.8%) |
| Computers, Engineering & Science | 282 (74.8%) | 95 (25.2%) |
| Computers & Mathematics | 123 (68.7%) | 56 (31.3%) |
| Architecture & Engineering | 152 (82.6%) | 32 (17.4%) |
| Life, Physical & Social Science | 7 (50.0%) | 7 (50.0%) |
| Community & Social Service | 36 (24.7%) | 110 (75.3%) |
| Education, Arts & Media | 0 (0.0%) | 37 (100.0%) |
| Legal Services & Support | 0 (0.0%) | 27 (100.0%) |
| Education Instruction & Library | 28 (38.9%) | 44 (61.1%) |
| Arts, Media & Entertainment | 8 (80.0%) | 2 (20.0%) |
| Health Diagnosing & Treating | 13 (14.8%) | 75 (85.2%) |
| Health Technologists | 13 (28.3%) | 33 (71.7%) |
| Total (Category) | 463 (48.7%) | 488 (51.3%) |
| Total (Overall) | 999 (56.7%) | 762 (43.3%) |
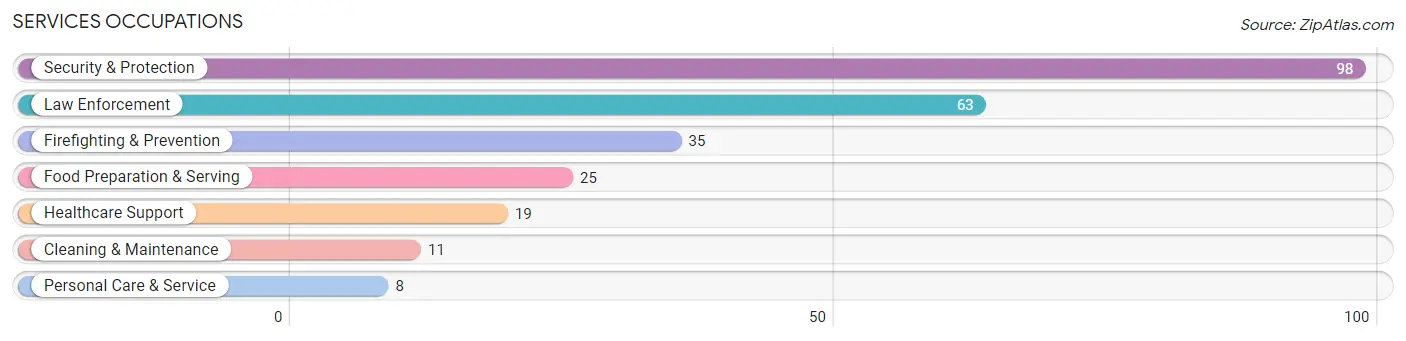
Services Occupations
The most common Services occupations in North Plains are Security & Protection (98 | 5.6%), Law Enforcement (63 | 3.6%), Firefighting & Prevention (35 | 2.0%), Food Preparation & Serving (25 | 1.4%), and Healthcare Support (19 | 1.1%).
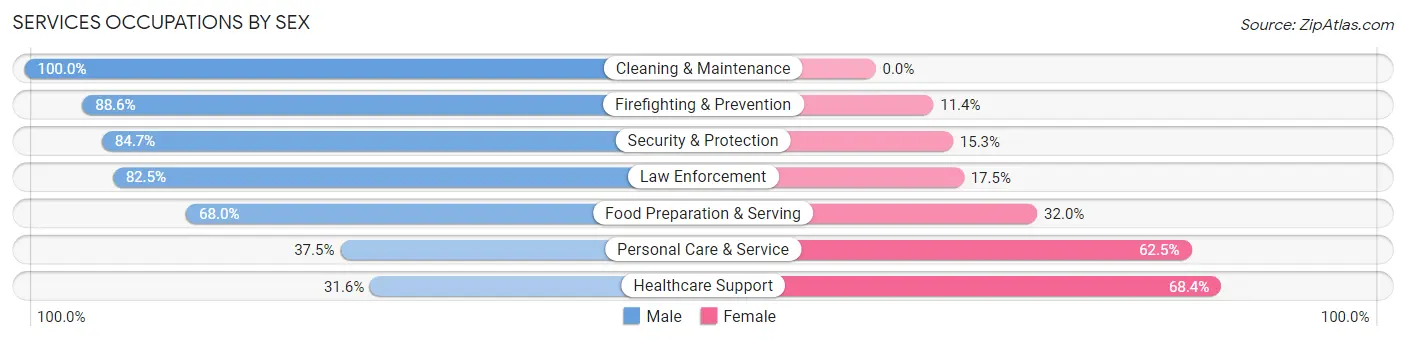
Services Occupations by Sex
Within the Services occupations in North Plains, the most male-oriented occupations are Cleaning & Maintenance (100.0%), Firefighting & Prevention (88.6%), and Security & Protection (84.7%), while the most female-oriented occupations are Healthcare Support (68.4%), Personal Care & Service (62.5%), and Food Preparation & Serving (32.0%).
| Occupation | Male | Female |
| Healthcare Support | 6 (31.6%) | 13 (68.4%) |
| Security & Protection | 83 (84.7%) | 15 (15.3%) |
| Firefighting & Prevention | 31 (88.6%) | 4 (11.4%) |
| Law Enforcement | 52 (82.5%) | 11 (17.5%) |
| Food Preparation & Serving | 17 (68.0%) | 8 (32.0%) |
| Cleaning & Maintenance | 11 (100.0%) | 0 (0.0%) |
| Personal Care & Service | 3 (37.5%) | 5 (62.5%) |
| Total (Category) | 120 (74.5%) | 41 (25.5%) |
| Total (Overall) | 999 (56.7%) | 762 (43.3%) |
Sales and Office Occupations
The most common Sales and Office occupations in North Plains are Sales & Related (166 | 9.4%), and Office & Administration (155 | 8.8%).
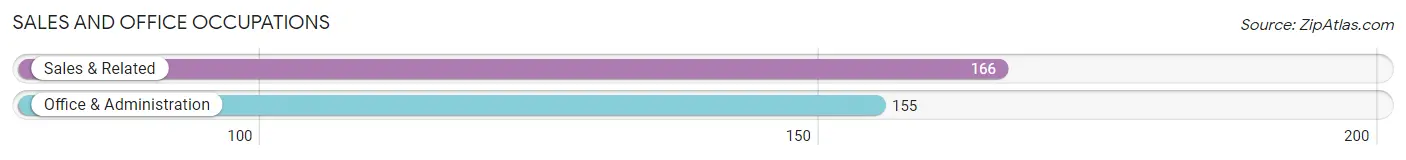
Sales and Office Occupations by Sex
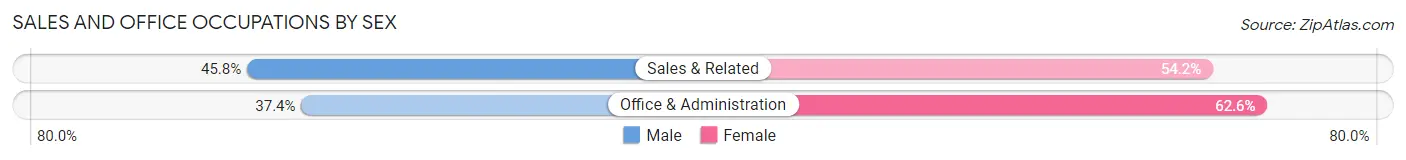
| Occupation | Male | Female |
| Sales & Related | 76 (45.8%) | 90 (54.2%) |
| Office & Administration | 58 (37.4%) | 97 (62.6%) |
| Total (Category) | 134 (41.7%) | 187 (58.3%) |
| Total (Overall) | 999 (56.7%) | 762 (43.3%) |
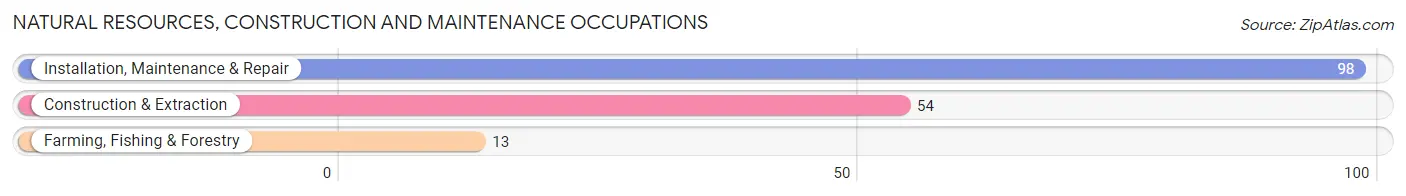
Natural Resources, Construction and Maintenance Occupations
The most common Natural Resources, Construction and Maintenance occupations in North Plains are Installation, Maintenance & Repair (98 | 5.6%), Construction & Extraction (54 | 3.1%), and Farming, Fishing & Forestry (13 | 0.7%).
Natural Resources, Construction and Maintenance Occupations by Sex
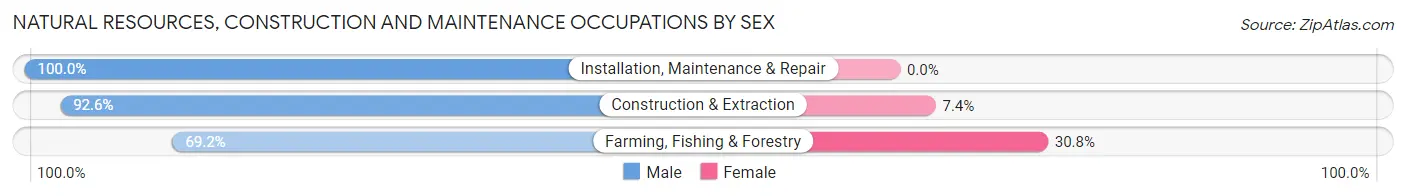
| Occupation | Male | Female |
| Farming, Fishing & Forestry | 9 (69.2%) | 4 (30.8%) |
| Construction & Extraction | 50 (92.6%) | 4 (7.4%) |
| Installation, Maintenance & Repair | 98 (100.0%) | 0 (0.0%) |
| Total (Category) | 157 (95.2%) | 8 (4.9%) |
| Total (Overall) | 999 (56.7%) | 762 (43.3%) |
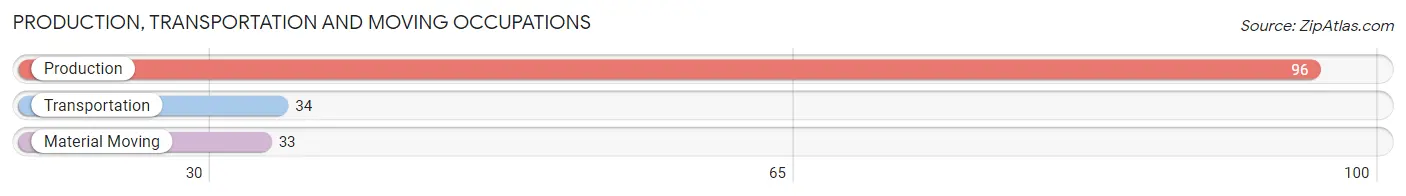
Production, Transportation and Moving Occupations
The most common Production, Transportation and Moving occupations in North Plains are Production (96 | 5.4%), Transportation (34 | 1.9%), and Material Moving (33 | 1.9%).
Production, Transportation and Moving Occupations by Sex
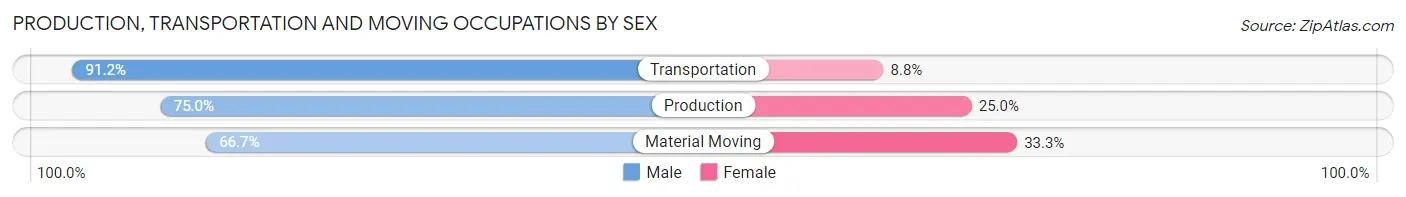
| Occupation | Male | Female |
| Production | 72 (75.0%) | 24 (25.0%) |
| Transportation | 31 (91.2%) | 3 (8.8%) |
| Material Moving | 22 (66.7%) | 11 (33.3%) |
| Total (Category) | 125 (76.7%) | 38 (23.3%) |
| Total (Overall) | 999 (56.7%) | 762 (43.3%) |
Employment Industries by Sex in North Plains
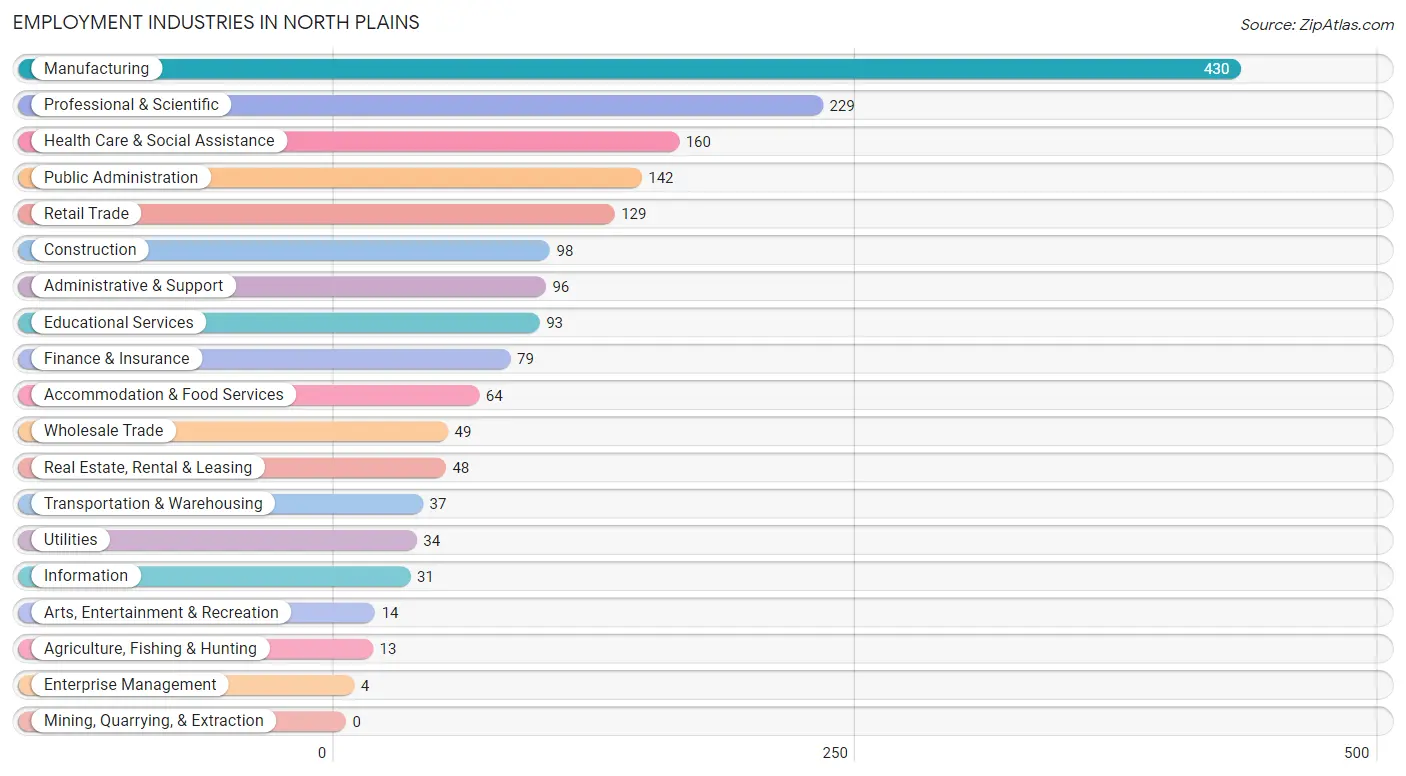
Employment Industries in North Plains
The major employment industries in North Plains include Manufacturing (430 | 24.4%), Professional & Scientific (229 | 13.0%), Health Care & Social Assistance (160 | 9.1%), Public Administration (142 | 8.1%), and Retail Trade (129 | 7.3%).
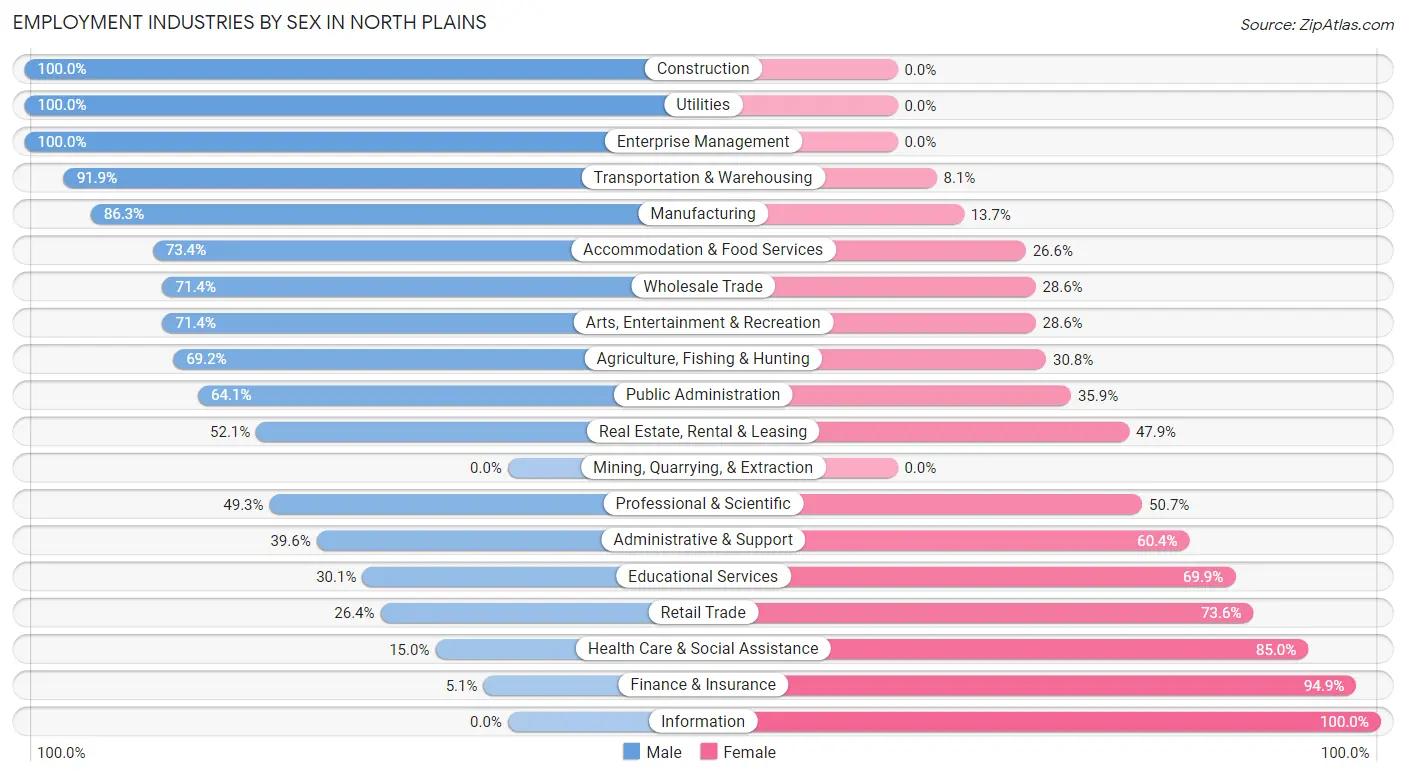
Employment Industries by Sex in North Plains
The North Plains industries that see more men than women are Construction (100.0%), Utilities (100.0%), and Enterprise Management (100.0%), whereas the industries that tend to have a higher number of women are Information (100.0%), Finance & Insurance (94.9%), and Health Care & Social Assistance (85.0%).
| Industry | Male | Female |
| Agriculture, Fishing & Hunting | 9 (69.2%) | 4 (30.8%) |
| Mining, Quarrying, & Extraction | 0 (0.0%) | 0 (0.0%) |
| Construction | 98 (100.0%) | 0 (0.0%) |
| Manufacturing | 371 (86.3%) | 59 (13.7%) |
| Wholesale Trade | 35 (71.4%) | 14 (28.6%) |
| Retail Trade | 34 (26.4%) | 95 (73.6%) |
| Transportation & Warehousing | 34 (91.9%) | 3 (8.1%) |
| Utilities | 34 (100.0%) | 0 (0.0%) |
| Information | 0 (0.0%) | 31 (100.0%) |
| Finance & Insurance | 4 (5.1%) | 75 (94.9%) |
| Real Estate, Rental & Leasing | 25 (52.1%) | 23 (47.9%) |
| Professional & Scientific | 113 (49.3%) | 116 (50.7%) |
| Enterprise Management | 4 (100.0%) | 0 (0.0%) |
| Administrative & Support | 38 (39.6%) | 58 (60.4%) |
| Educational Services | 28 (30.1%) | 65 (69.9%) |
| Health Care & Social Assistance | 24 (15.0%) | 136 (85.0%) |
| Arts, Entertainment & Recreation | 10 (71.4%) | 4 (28.6%) |
| Accommodation & Food Services | 47 (73.4%) | 17 (26.6%) |
| Public Administration | 91 (64.1%) | 51 (35.9%) |
| Total | 999 (56.7%) | 762 (43.3%) |
Education in North Plains
School Enrollment in North Plains
The most common levels of schooling among the 699 students in North Plains are elementary school (194 | 27.8%), college / undergraduate (171 | 24.5%), and nursery / preschool (100 | 14.3%).
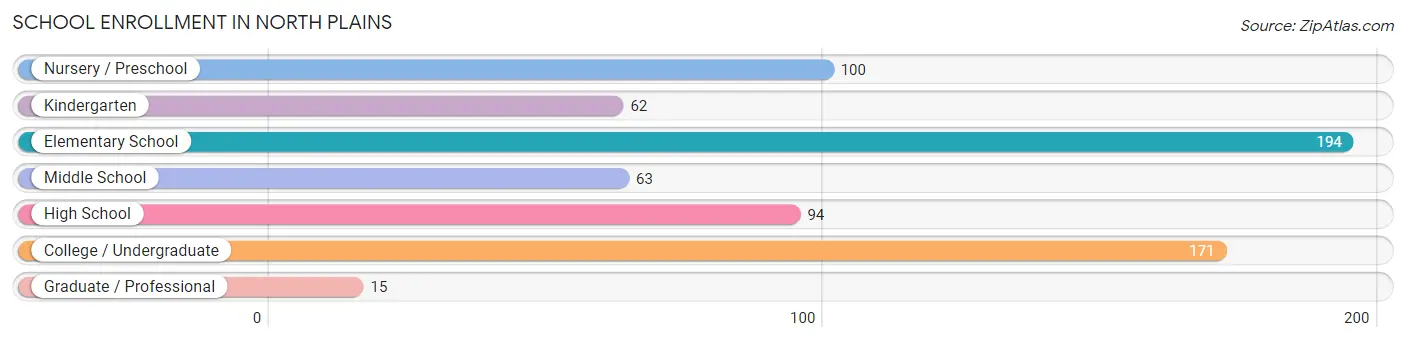
| School Level | # Students | % Students |
| Nursery / Preschool | 100 | 14.3% |
| Kindergarten | 62 | 8.9% |
| Elementary School | 194 | 27.8% |
| Middle School | 63 | 9.0% |
| High School | 94 | 13.5% |
| College / Undergraduate | 171 | 24.5% |
| Graduate / Professional | 15 | 2.1% |
| Total | 699 | 100.0% |
School Enrollment by Age by Funding Source in North Plains
Out of a total of 699 students who are enrolled in schools in North Plains, 185 (26.5%) attend a private institution, while the remaining 514 (73.5%) are enrolled in public schools. The age group of 3 to 4 year olds has the highest likelihood of being enrolled in private schools, with 62 (81.6% in the age bracket) enrolled. Conversely, the age group of 18 to 19 year olds has the lowest likelihood of being enrolled in a private school, with 42 (100.0% in the age bracket) attending a public institution.
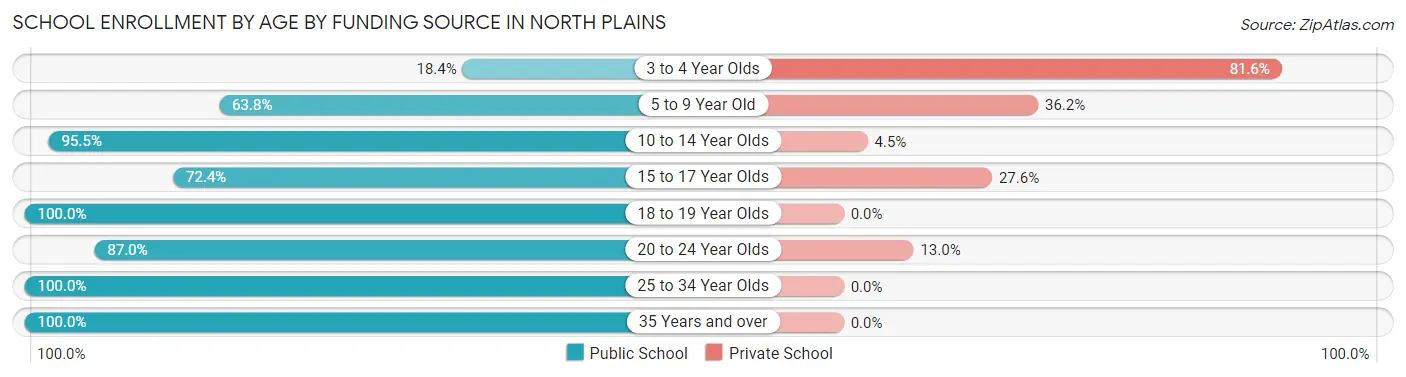
| Age Bracket | Public School | Private School |
| 3 to 4 Year Olds | 14 (18.4%) | 62 (81.6%) |
| 5 to 9 Year Old | 148 (63.8%) | 84 (36.2%) |
| 10 to 14 Year Olds | 107 (95.5%) | 5 (4.5%) |
| 15 to 17 Year Olds | 55 (72.4%) | 21 (27.6%) |
| 18 to 19 Year Olds | 42 (100.0%) | 0 (0.0%) |
| 20 to 24 Year Olds | 87 (87.0%) | 13 (13.0%) |
| 25 to 34 Year Olds | 43 (100.0%) | 0 (0.0%) |
| 35 Years and over | 18 (100.0%) | 0 (0.0%) |
| Total | 514 (73.5%) | 185 (26.5%) |
Educational Attainment by Field of Study in North Plains
Engineering (248 | 22.8%), business (166 | 15.2%), computers & mathematics (126 | 11.6%), visual & performing arts (104 | 9.6%), and science & technology (88 | 8.1%) are the most common fields of study among 1,089 individuals in North Plains who have obtained a bachelor's degree or higher.
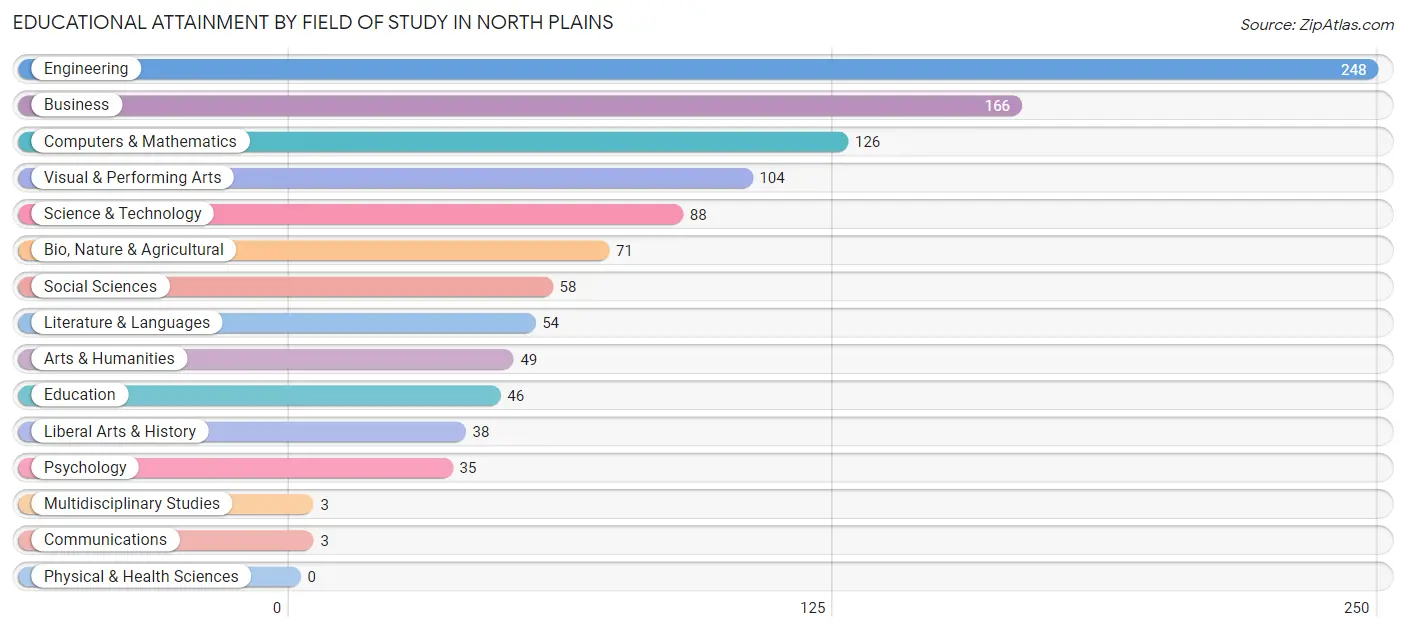
| Field of Study | # Graduates | % Graduates |
| Computers & Mathematics | 126 | 11.6% |
| Bio, Nature & Agricultural | 71 | 6.5% |
| Physical & Health Sciences | 0 | 0.0% |
| Psychology | 35 | 3.2% |
| Social Sciences | 58 | 5.3% |
| Engineering | 248 | 22.8% |
| Multidisciplinary Studies | 3 | 0.3% |
| Science & Technology | 88 | 8.1% |
| Business | 166 | 15.2% |
| Education | 46 | 4.2% |
| Literature & Languages | 54 | 5.0% |
| Liberal Arts & History | 38 | 3.5% |
| Visual & Performing Arts | 104 | 9.6% |
| Communications | 3 | 0.3% |
| Arts & Humanities | 49 | 4.5% |
| Total | 1,089 | 100.0% |
Transportation & Commute in North Plains
Vehicle Availability by Sex in North Plains
The most prevalent vehicle ownership categories in North Plains are males with 2 vehicles (477, accounting for 47.8%) and females with 2 vehicles (431, making up 64.7%).
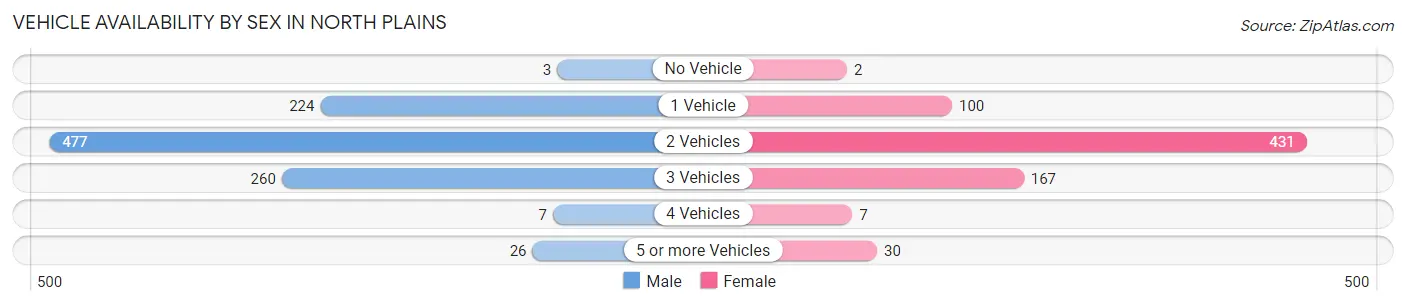
| Vehicles Available | Male | Female |
| No Vehicle | 3 (0.3%) | 2 (0.3%) |
| 1 Vehicle | 224 (22.5%) | 100 (13.6%) |
| 2 Vehicles | 477 (47.8%) | 431 (58.5%) |
| 3 Vehicles | 260 (26.1%) | 167 (22.7%) |
| 4 Vehicles | 7 (0.7%) | 7 (0.9%) |
| 5 or more Vehicles | 26 (2.6%) | 30 (4.1%) |
| Total | 997 (100.0%) | 737 (100.0%) |
Commute Time in North Plains
The most frequently occuring commute durations in North Plains are 15 to 19 minutes (349 commuters, 24.2%), 10 to 14 minutes (250 commuters, 17.4%), and 20 to 24 minutes (224 commuters, 15.6%).
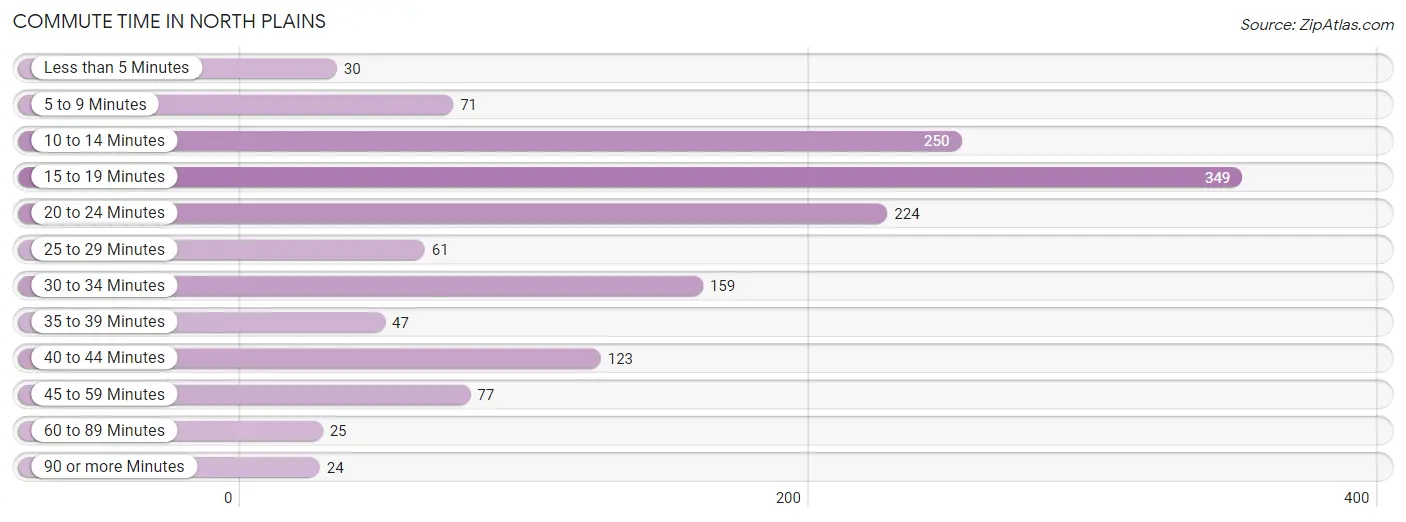
| Commute Time | # Commuters | % Commuters |
| Less than 5 Minutes | 30 | 2.1% |
| 5 to 9 Minutes | 71 | 4.9% |
| 10 to 14 Minutes | 250 | 17.4% |
| 15 to 19 Minutes | 349 | 24.2% |
| 20 to 24 Minutes | 224 | 15.6% |
| 25 to 29 Minutes | 61 | 4.2% |
| 30 to 34 Minutes | 159 | 11.0% |
| 35 to 39 Minutes | 47 | 3.3% |
| 40 to 44 Minutes | 123 | 8.5% |
| 45 to 59 Minutes | 77 | 5.3% |
| 60 to 89 Minutes | 25 | 1.7% |
| 90 or more Minutes | 24 | 1.7% |
Commute Time by Sex in North Plains
The most common commute times in North Plains are 15 to 19 minutes (272 commuters, 30.5%) for males and 10 to 14 minutes (141 commuters, 25.8%) for females.
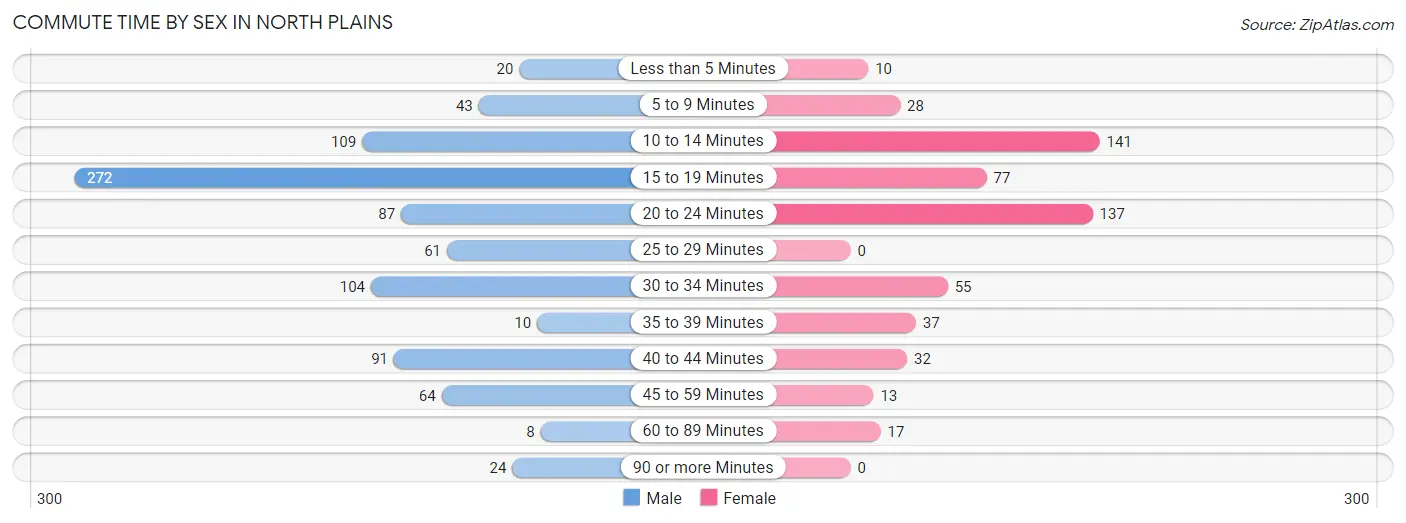
| Commute Time | Male | Female |
| Less than 5 Minutes | 20 (2.2%) | 10 (1.8%) |
| 5 to 9 Minutes | 43 (4.8%) | 28 (5.1%) |
| 10 to 14 Minutes | 109 (12.2%) | 141 (25.8%) |
| 15 to 19 Minutes | 272 (30.5%) | 77 (14.1%) |
| 20 to 24 Minutes | 87 (9.7%) | 137 (25.1%) |
| 25 to 29 Minutes | 61 (6.8%) | 0 (0.0%) |
| 30 to 34 Minutes | 104 (11.7%) | 55 (10.1%) |
| 35 to 39 Minutes | 10 (1.1%) | 37 (6.8%) |
| 40 to 44 Minutes | 91 (10.2%) | 32 (5.9%) |
| 45 to 59 Minutes | 64 (7.2%) | 13 (2.4%) |
| 60 to 89 Minutes | 8 (0.9%) | 17 (3.1%) |
| 90 or more Minutes | 24 (2.7%) | 0 (0.0%) |
Time of Departure to Work by Sex in North Plains
The most frequent times of departure to work in North Plains are 7:00 AM to 7:29 AM (192, 21.5%) for males and 7:00 AM to 7:29 AM (112, 20.5%) for females.
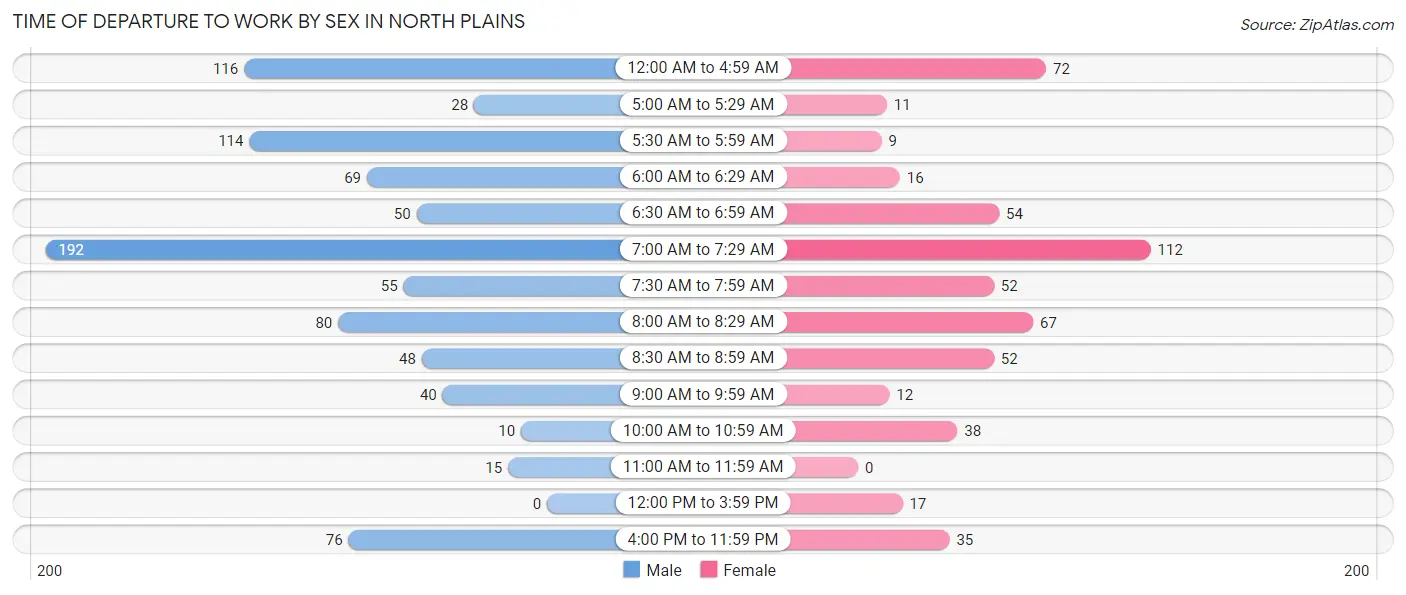
| Time of Departure | Male | Female |
| 12:00 AM to 4:59 AM | 116 (13.0%) | 72 (13.2%) |
| 5:00 AM to 5:29 AM | 28 (3.1%) | 11 (2.0%) |
| 5:30 AM to 5:59 AM | 114 (12.8%) | 9 (1.7%) |
| 6:00 AM to 6:29 AM | 69 (7.7%) | 16 (2.9%) |
| 6:30 AM to 6:59 AM | 50 (5.6%) | 54 (9.9%) |
| 7:00 AM to 7:29 AM | 192 (21.5%) | 112 (20.5%) |
| 7:30 AM to 7:59 AM | 55 (6.2%) | 52 (9.5%) |
| 8:00 AM to 8:29 AM | 80 (9.0%) | 67 (12.2%) |
| 8:30 AM to 8:59 AM | 48 (5.4%) | 52 (9.5%) |
| 9:00 AM to 9:59 AM | 40 (4.5%) | 12 (2.2%) |
| 10:00 AM to 10:59 AM | 10 (1.1%) | 38 (7.0%) |
| 11:00 AM to 11:59 AM | 15 (1.7%) | 0 (0.0%) |
| 12:00 PM to 3:59 PM | 0 (0.0%) | 17 (3.1%) |
| 4:00 PM to 11:59 PM | 76 (8.5%) | 35 (6.4%) |
| Total | 893 (100.0%) | 547 (100.0%) |
Housing Occupancy in North Plains
Occupancy by Ownership in North Plains
Of the total 1,292 dwellings in North Plains, owner-occupied units account for 1,013 (78.4%), while renter-occupied units make up 279 (21.6%).
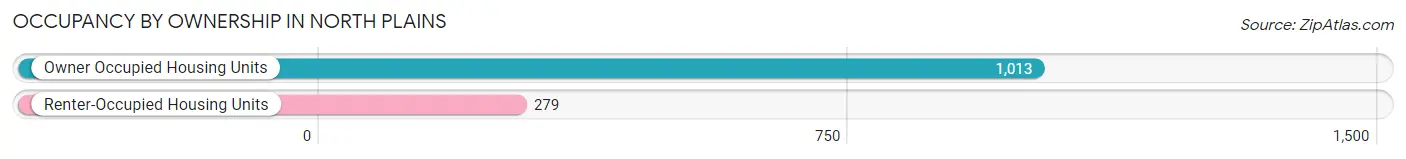
| Occupancy | # Housing Units | % Housing Units |
| Owner Occupied Housing Units | 1,013 | 78.4% |
| Renter-Occupied Housing Units | 279 | 21.6% |
| Total Occupied Housing Units | 1,292 | 100.0% |
Occupancy by Household Size in North Plains
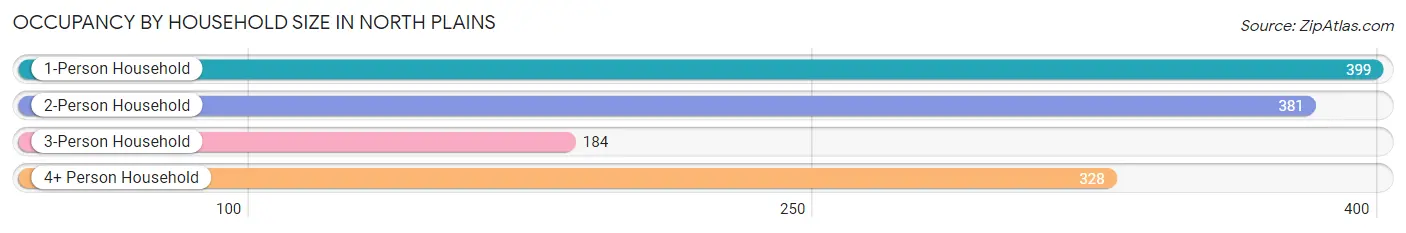
| Household Size | # Housing Units | % Housing Units |
| 1-Person Household | 399 | 30.9% |
| 2-Person Household | 381 | 29.5% |
| 3-Person Household | 184 | 14.2% |
| 4+ Person Household | 328 | 25.4% |
| Total Housing Units | 1,292 | 100.0% |
Occupancy by Ownership by Household Size in North Plains
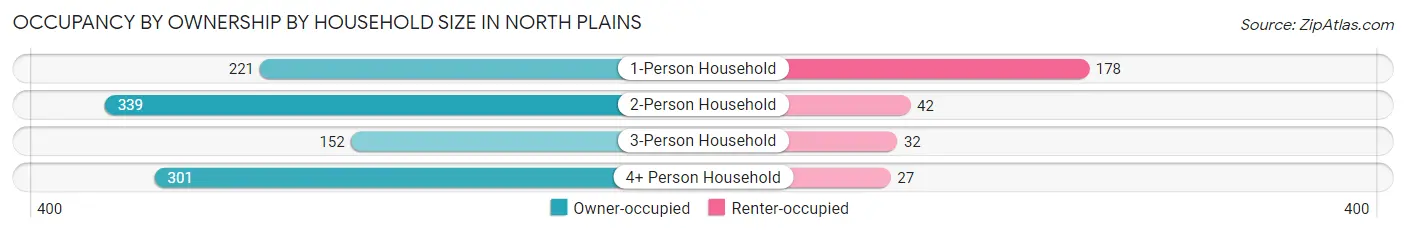
| Household Size | Owner-occupied | Renter-occupied |
| 1-Person Household | 221 (55.4%) | 178 (44.6%) |
| 2-Person Household | 339 (89.0%) | 42 (11.0%) |
| 3-Person Household | 152 (82.6%) | 32 (17.4%) |
| 4+ Person Household | 301 (91.8%) | 27 (8.2%) |
| Total Housing Units | 1,013 (78.4%) | 279 (21.6%) |
Occupancy by Educational Attainment in North Plains
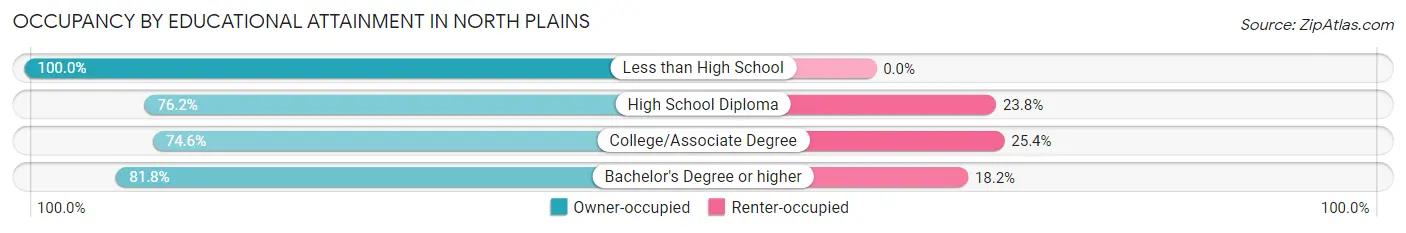
| Household Size | Owner-occupied | Renter-occupied |
| Less than High School | 25 (100.0%) | 0 (0.0%) |
| High School Diploma | 138 (76.2%) | 43 (23.8%) |
| College/Associate Degree | 396 (74.6%) | 135 (25.4%) |
| Bachelor's Degree or higher | 454 (81.8%) | 101 (18.2%) |
Occupancy by Age of Householder in North Plains
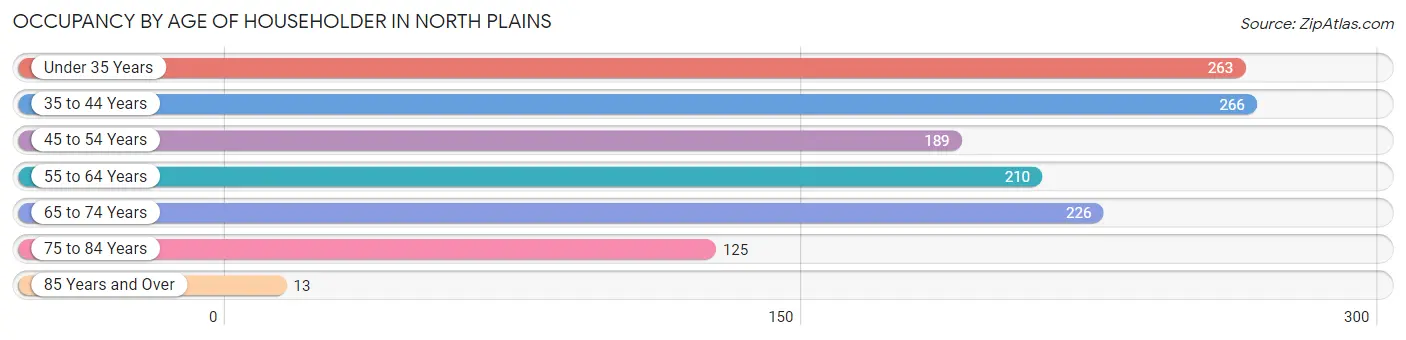
| Age Bracket | # Households | % Households |
| Under 35 Years | 263 | 20.4% |
| 35 to 44 Years | 266 | 20.6% |
| 45 to 54 Years | 189 | 14.6% |
| 55 to 64 Years | 210 | 16.3% |
| 65 to 74 Years | 226 | 17.5% |
| 75 to 84 Years | 125 | 9.7% |
| 85 Years and Over | 13 | 1.0% |
| Total | 1,292 | 100.0% |
Housing Finances in North Plains
Median Income by Occupancy in North Plains
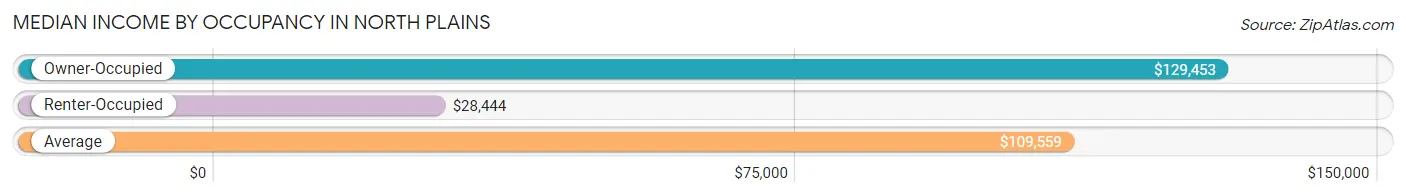
| Occupancy Type | # Households | Median Income |
| Owner-Occupied | 1,013 (78.4%) | $129,453 |
| Renter-Occupied | 279 (21.6%) | $28,444 |
| Average | 1,292 (100.0%) | $109,559 |
Occupancy by Householder Income Bracket in North Plains
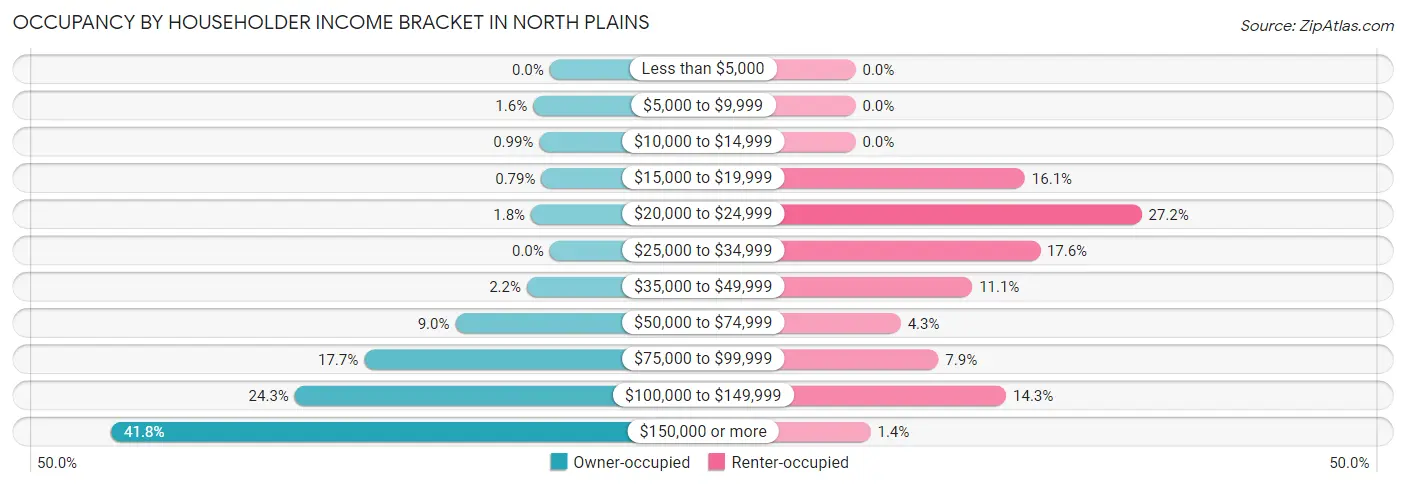
| Income Bracket | Owner-occupied | Renter-occupied |
| Less than $5,000 | 0 (0.0%) | 0 (0.0%) |
| $5,000 to $9,999 | 16 (1.6%) | 0 (0.0%) |
| $10,000 to $14,999 | 10 (1.0%) | 0 (0.0%) |
| $15,000 to $19,999 | 8 (0.8%) | 45 (16.1%) |
| $20,000 to $24,999 | 18 (1.8%) | 76 (27.2%) |
| $25,000 to $34,999 | 0 (0.0%) | 49 (17.6%) |
| $35,000 to $49,999 | 22 (2.2%) | 31 (11.1%) |
| $50,000 to $74,999 | 91 (9.0%) | 12 (4.3%) |
| $75,000 to $99,999 | 179 (17.7%) | 22 (7.9%) |
| $100,000 to $149,999 | 246 (24.3%) | 40 (14.3%) |
| $150,000 or more | 423 (41.8%) | 4 (1.4%) |
| Total | 1,013 (100.0%) | 279 (100.0%) |
Monthly Housing Cost Tiers in North Plains
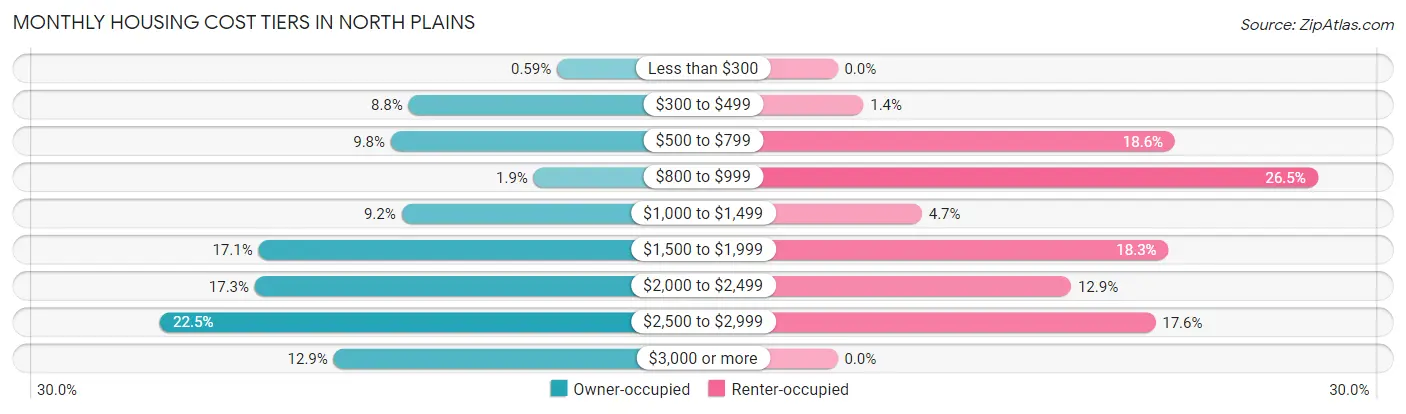
| Monthly Cost | Owner-occupied | Renter-occupied |
| Less than $300 | 6 (0.6%) | 0 (0.0%) |
| $300 to $499 | 89 (8.8%) | 4 (1.4%) |
| $500 to $799 | 99 (9.8%) | 52 (18.6%) |
| $800 to $999 | 19 (1.9%) | 74 (26.5%) |
| $1,000 to $1,499 | 93 (9.2%) | 13 (4.7%) |
| $1,500 to $1,999 | 173 (17.1%) | 51 (18.3%) |
| $2,000 to $2,499 | 175 (17.3%) | 36 (12.9%) |
| $2,500 to $2,999 | 228 (22.5%) | 49 (17.6%) |
| $3,000 or more | 131 (12.9%) | 0 (0.0%) |
| Total | 1,013 (100.0%) | 279 (100.0%) |
Physical Housing Characteristics in North Plains
Housing Structures in North Plains
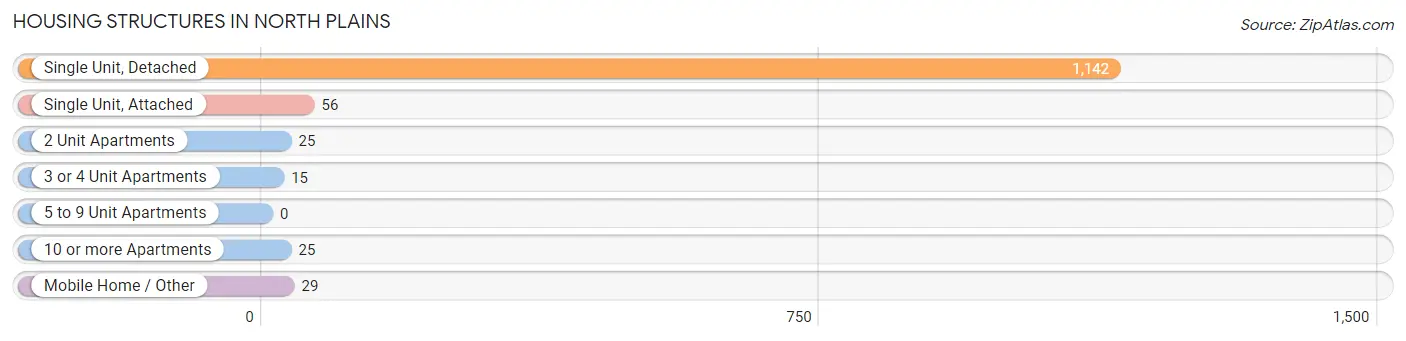
| Structure Type | # Housing Units | % Housing Units |
| Single Unit, Detached | 1,142 | 88.4% |
| Single Unit, Attached | 56 | 4.3% |
| 2 Unit Apartments | 25 | 1.9% |
| 3 or 4 Unit Apartments | 15 | 1.2% |
| 5 to 9 Unit Apartments | 0 | 0.0% |
| 10 or more Apartments | 25 | 1.9% |
| Mobile Home / Other | 29 | 2.2% |
| Total | 1,292 | 100.0% |
Housing Structures by Occupancy in North Plains
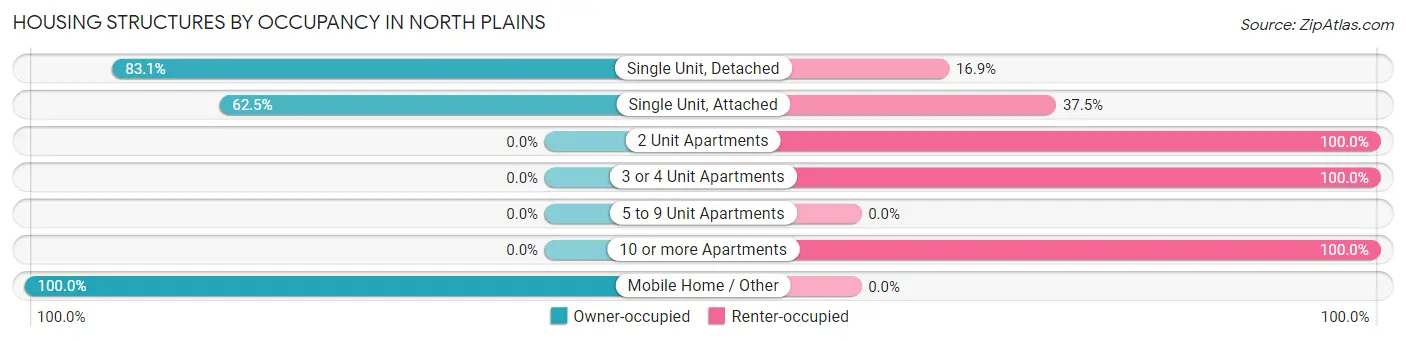
| Structure Type | Owner-occupied | Renter-occupied |
| Single Unit, Detached | 949 (83.1%) | 193 (16.9%) |
| Single Unit, Attached | 35 (62.5%) | 21 (37.5%) |
| 2 Unit Apartments | 0 (0.0%) | 25 (100.0%) |
| 3 or 4 Unit Apartments | 0 (0.0%) | 15 (100.0%) |
| 5 to 9 Unit Apartments | 0 (0.0%) | 0 (0.0%) |
| 10 or more Apartments | 0 (0.0%) | 25 (100.0%) |
| Mobile Home / Other | 29 (100.0%) | 0 (0.0%) |
| Total | 1,013 (78.4%) | 279 (21.6%) |
Housing Structures by Number of Rooms in North Plains
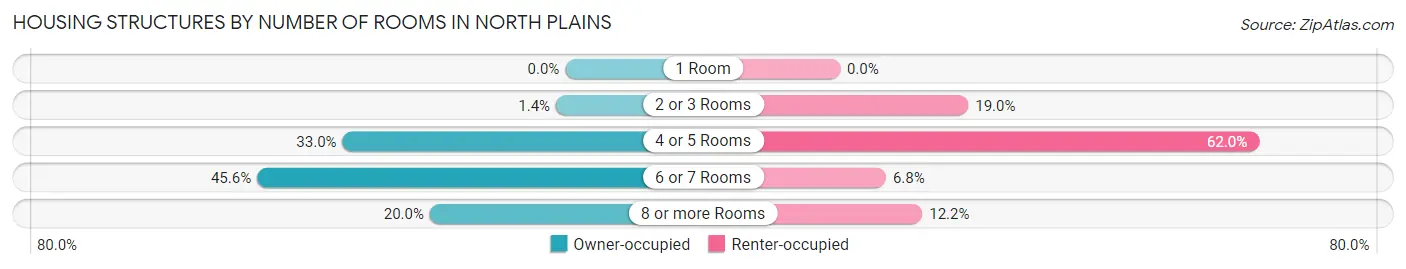
| Number of Rooms | Owner-occupied | Renter-occupied |
| 1 Room | 0 (0.0%) | 0 (0.0%) |
| 2 or 3 Rooms | 14 (1.4%) | 53 (19.0%) |
| 4 or 5 Rooms | 334 (33.0%) | 173 (62.0%) |
| 6 or 7 Rooms | 462 (45.6%) | 19 (6.8%) |
| 8 or more Rooms | 203 (20.0%) | 34 (12.2%) |
| Total | 1,013 (100.0%) | 279 (100.0%) |
Housing Structure by Heating Type in North Plains
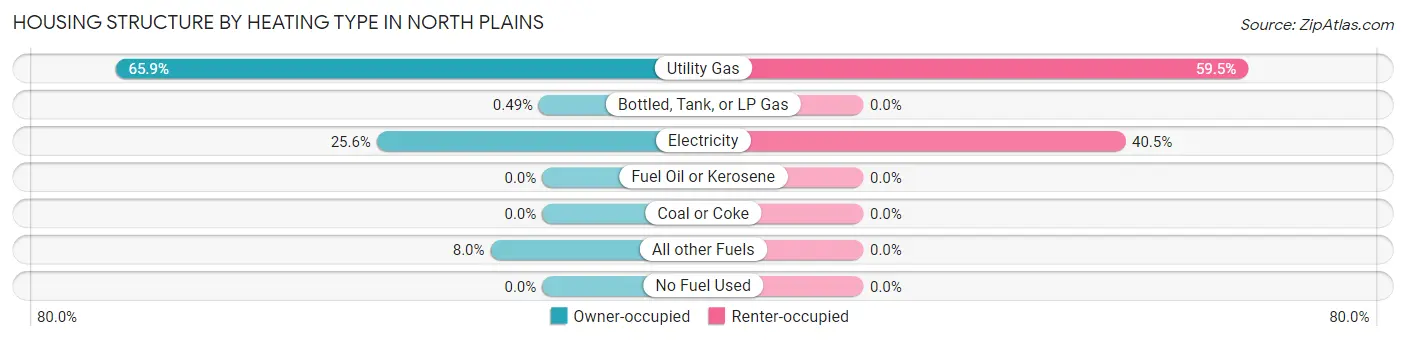
| Heating Type | Owner-occupied | Renter-occupied |
| Utility Gas | 668 (65.9%) | 166 (59.5%) |
| Bottled, Tank, or LP Gas | 5 (0.5%) | 0 (0.0%) |
| Electricity | 259 (25.6%) | 113 (40.5%) |
| Fuel Oil or Kerosene | 0 (0.0%) | 0 (0.0%) |
| Coal or Coke | 0 (0.0%) | 0 (0.0%) |
| All other Fuels | 81 (8.0%) | 0 (0.0%) |
| No Fuel Used | 0 (0.0%) | 0 (0.0%) |
| Total | 1,013 (100.0%) | 279 (100.0%) |
Household Vehicle Usage in North Plains
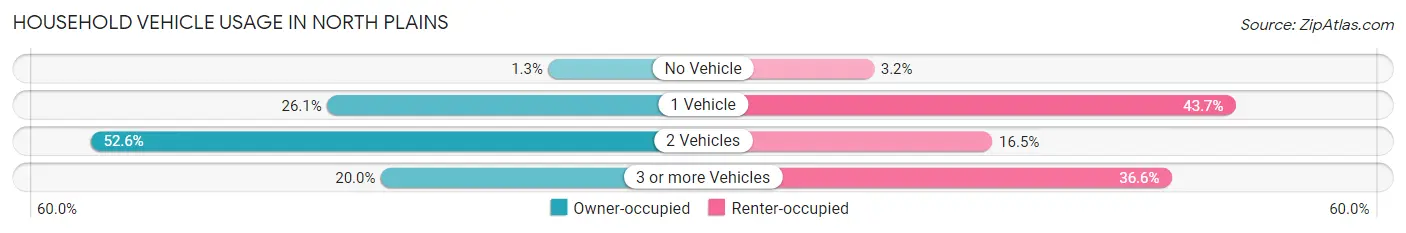
| Vehicles per Household | Owner-occupied | Renter-occupied |
| No Vehicle | 13 (1.3%) | 9 (3.2%) |
| 1 Vehicle | 264 (26.1%) | 122 (43.7%) |
| 2 Vehicles | 533 (52.6%) | 46 (16.5%) |
| 3 or more Vehicles | 203 (20.0%) | 102 (36.6%) |
| Total | 1,013 (100.0%) | 279 (100.0%) |
Real Estate & Mortgages in North Plains
Real Estate and Mortgage Overview in North Plains
| Characteristic | Without Mortgage | With Mortgage |
| Housing Units | 227 | 786 |
| Median Property Value | $442,700 | $489,300 |
| Median Household Income | $125,481 | $358 |
| Monthly Housing Costs | $594 | $131 |
| Real Estate Taxes | $3,104 | $0 |
Property Value by Mortgage Status in North Plains
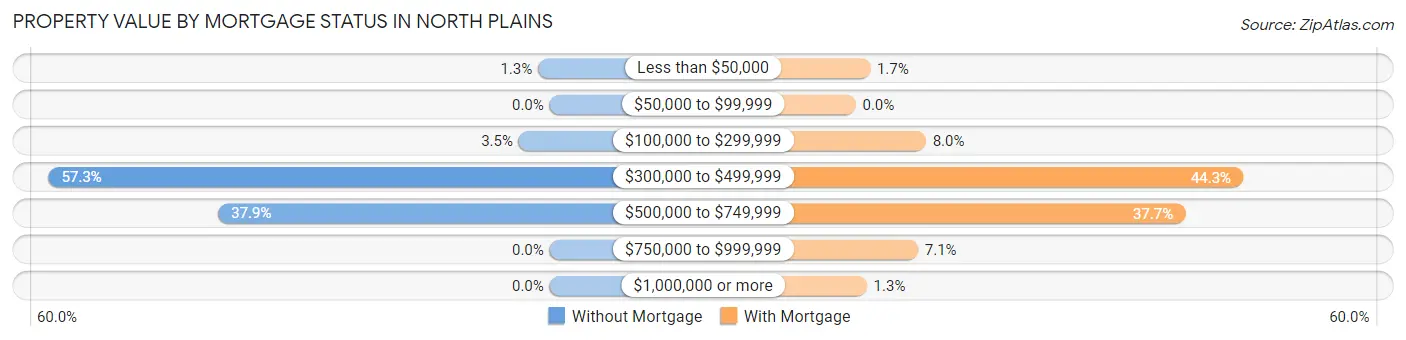
| Property Value | Without Mortgage | With Mortgage |
| Less than $50,000 | 3 (1.3%) | 13 (1.7%) |
| $50,000 to $99,999 | 0 (0.0%) | 0 (0.0%) |
| $100,000 to $299,999 | 8 (3.5%) | 63 (8.0%) |
| $300,000 to $499,999 | 130 (57.3%) | 348 (44.3%) |
| $500,000 to $749,999 | 86 (37.9%) | 296 (37.7%) |
| $750,000 to $999,999 | 0 (0.0%) | 56 (7.1%) |
| $1,000,000 or more | 0 (0.0%) | 10 (1.3%) |
| Total | 227 (100.0%) | 786 (100.0%) |
Household Income by Mortgage Status in North Plains
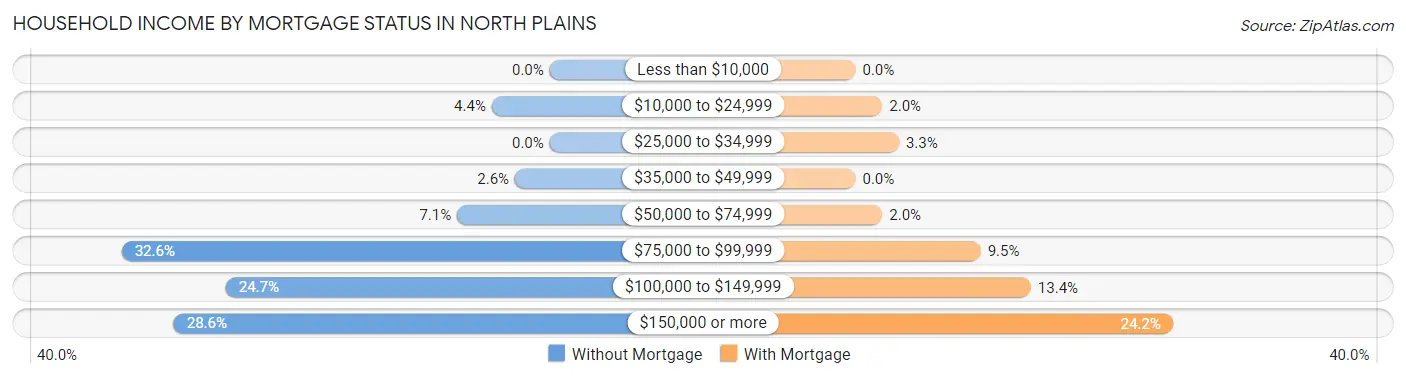
| Household Income | Without Mortgage | With Mortgage |
| Less than $10,000 | 0 (0.0%) | 0 (0.0%) |
| $10,000 to $24,999 | 10 (4.4%) | 16 (2.0%) |
| $25,000 to $34,999 | 0 (0.0%) | 26 (3.3%) |
| $35,000 to $49,999 | 6 (2.6%) | 0 (0.0%) |
| $50,000 to $74,999 | 16 (7.0%) | 16 (2.0%) |
| $75,000 to $99,999 | 74 (32.6%) | 75 (9.5%) |
| $100,000 to $149,999 | 56 (24.7%) | 105 (13.4%) |
| $150,000 or more | 65 (28.6%) | 190 (24.2%) |
| Total | 227 (100.0%) | 786 (100.0%) |
Property Value to Household Income Ratio in North Plains
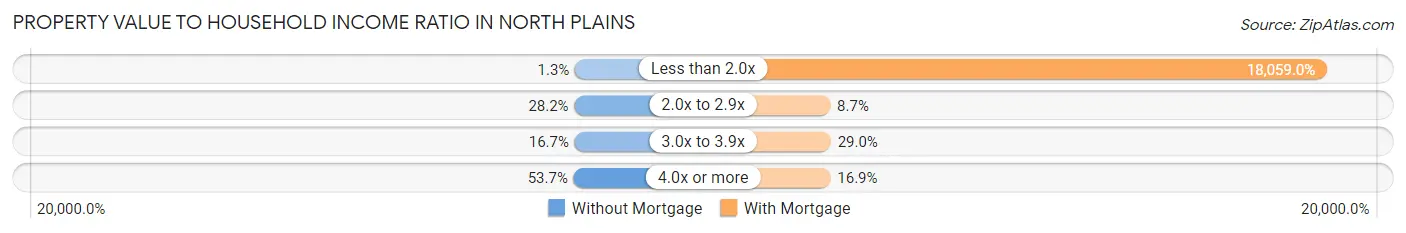
| Value-to-Income Ratio | Without Mortgage | With Mortgage |
| Less than 2.0x | 3 (1.3%) | 141,944 (18,059.0%) |
| 2.0x to 2.9x | 64 (28.2%) | 68 (8.6%) |
| 3.0x to 3.9x | 38 (16.7%) | 228 (29.0%) |
| 4.0x or more | 122 (53.7%) | 133 (16.9%) |
| Total | 227 (100.0%) | 786 (100.0%) |
Real Estate Taxes by Mortgage Status in North Plains
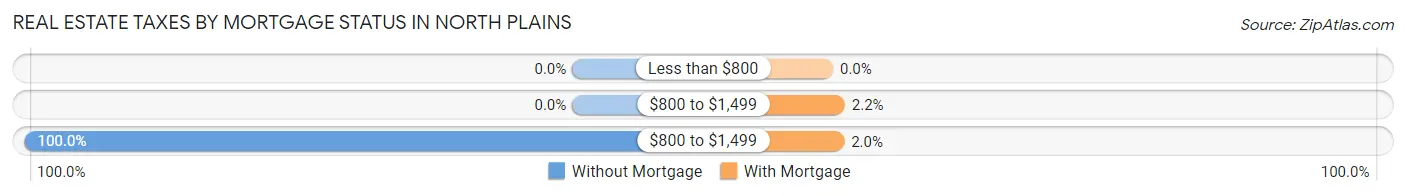
| Property Taxes | Without Mortgage | With Mortgage |
| Less than $800 | 0 (0.0%) | 0 (0.0%) |
| $800 to $1,499 | 0 (0.0%) | 17 (2.2%) |
| $800 to $1,499 | 227 (100.0%) | 16 (2.0%) |
| Total | 227 (100.0%) | 786 (100.0%) |
Health & Disability in North Plains
Health Insurance Coverage by Age in North Plains
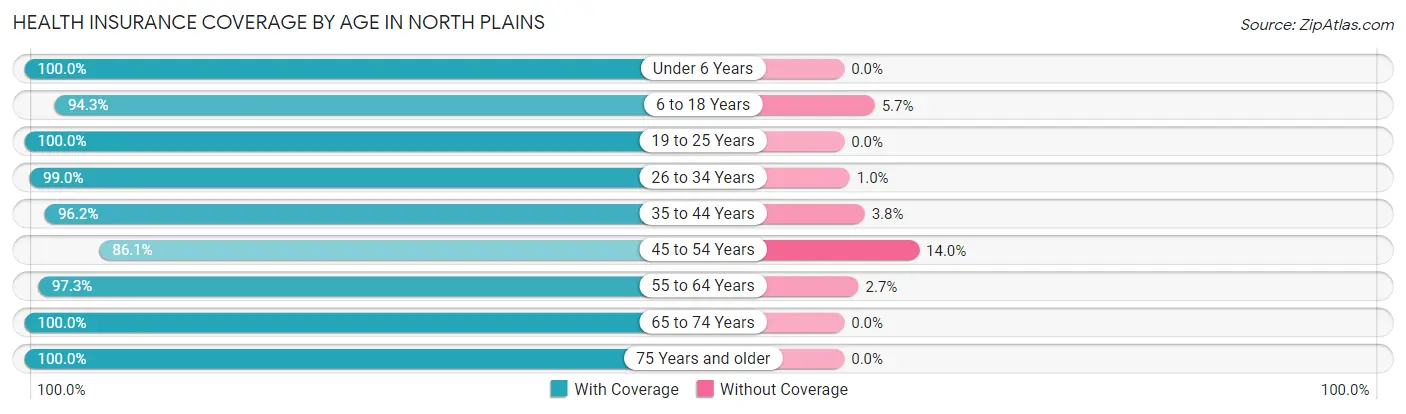
| Age Bracket | With Coverage | Without Coverage |
| Under 6 Years | 320 (100.0%) | 0 (0.0%) |
| 6 to 18 Years | 449 (94.3%) | 27 (5.7%) |
| 19 to 25 Years | 211 (100.0%) | 0 (0.0%) |
| 26 to 34 Years | 579 (99.0%) | 6 (1.0%) |
| 35 to 44 Years | 454 (96.2%) | 18 (3.8%) |
| 45 to 54 Years | 327 (86.1%) | 53 (14.0%) |
| 55 to 64 Years | 365 (97.3%) | 10 (2.7%) |
| 65 to 74 Years | 369 (100.0%) | 0 (0.0%) |
| 75 Years and older | 157 (100.0%) | 0 (0.0%) |
| Total | 3,231 (96.6%) | 114 (3.4%) |
Health Insurance Coverage by Citizenship Status in North Plains
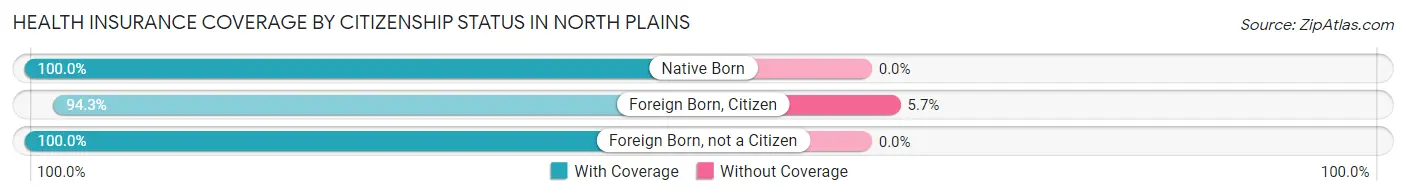
| Citizenship Status | With Coverage | Without Coverage |
| Native Born | 320 (100.0%) | 0 (0.0%) |
| Foreign Born, Citizen | 449 (94.3%) | 27 (5.7%) |
| Foreign Born, not a Citizen | 211 (100.0%) | 0 (0.0%) |
Health Insurance Coverage by Household Income in North Plains
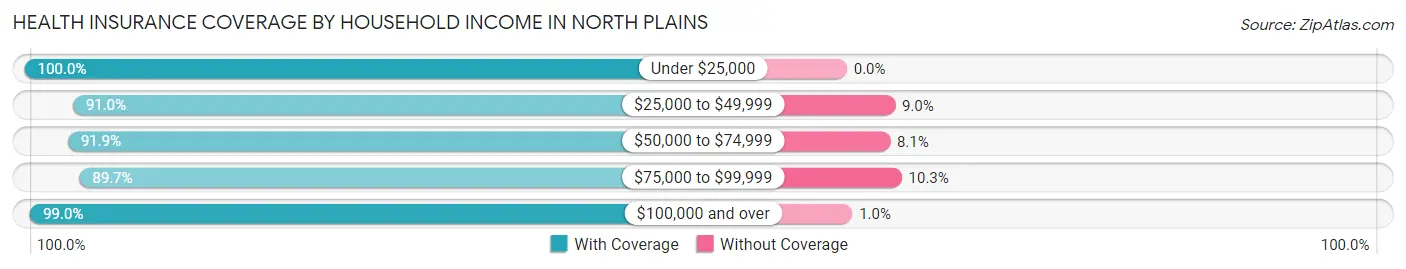
| Household Income | With Coverage | Without Coverage |
| Under $25,000 | 221 (100.0%) | 0 (0.0%) |
| $25,000 to $49,999 | 131 (91.0%) | 13 (9.0%) |
| $50,000 to $74,999 | 216 (91.9%) | 19 (8.1%) |
| $75,000 to $99,999 | 524 (89.7%) | 60 (10.3%) |
| $100,000 and over | 2,139 (99.0%) | 22 (1.0%) |
Public vs Private Health Insurance Coverage by Age in North Plains
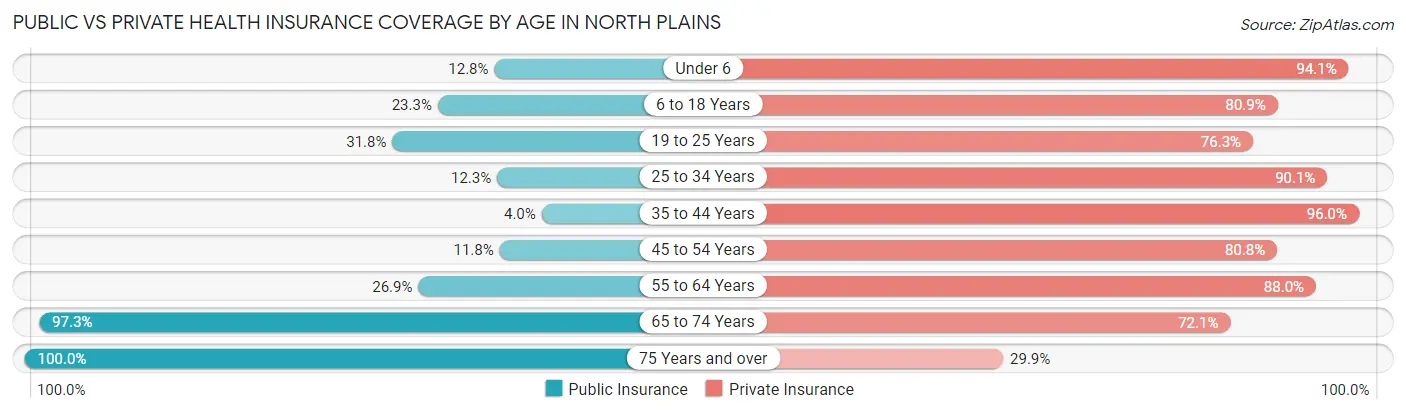
| Age Bracket | Public Insurance | Private Insurance |
| Under 6 | 41 (12.8%) | 301 (94.1%) |
| 6 to 18 Years | 111 (23.3%) | 385 (80.9%) |
| 19 to 25 Years | 67 (31.8%) | 161 (76.3%) |
| 25 to 34 Years | 72 (12.3%) | 527 (90.1%) |
| 35 to 44 Years | 19 (4.0%) | 453 (96.0%) |
| 45 to 54 Years | 45 (11.8%) | 307 (80.8%) |
| 55 to 64 Years | 101 (26.9%) | 330 (88.0%) |
| 65 to 74 Years | 359 (97.3%) | 266 (72.1%) |
| 75 Years and over | 157 (100.0%) | 47 (29.9%) |
| Total | 972 (29.1%) | 2,777 (83.0%) |
Disability Status by Sex by Age in North Plains
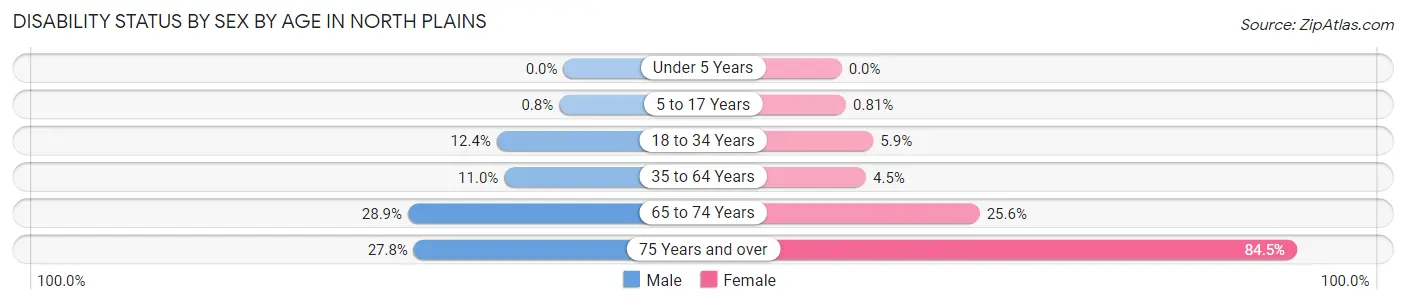
| Age Bracket | Male | Female |
| Under 5 Years | 0 (0.0%) | 0 (0.0%) |
| 5 to 17 Years | 2 (0.8%) | 2 (0.8%) |
| 18 to 34 Years | 53 (12.4%) | 24 (5.9%) |
| 35 to 64 Years | 69 (11.0%) | 27 (4.5%) |
| 65 to 74 Years | 58 (28.9%) | 43 (25.6%) |
| 75 Years and over | 15 (27.8%) | 87 (84.5%) |
Disability Class by Sex by Age in North Plains
Disability Class: Hearing Difficulty
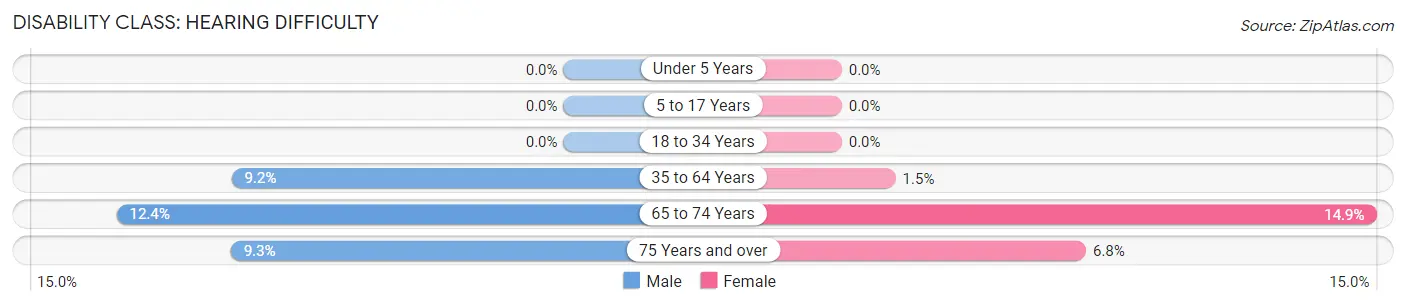
| Age Bracket | Male | Female |
| Under 5 Years | 0 (0.0%) | 0 (0.0%) |
| 5 to 17 Years | 0 (0.0%) | 0 (0.0%) |
| 18 to 34 Years | 0 (0.0%) | 0 (0.0%) |
| 35 to 64 Years | 58 (9.2%) | 9 (1.5%) |
| 65 to 74 Years | 25 (12.4%) | 25 (14.9%) |
| 75 Years and over | 5 (9.3%) | 7 (6.8%) |
Disability Class: Vision Difficulty
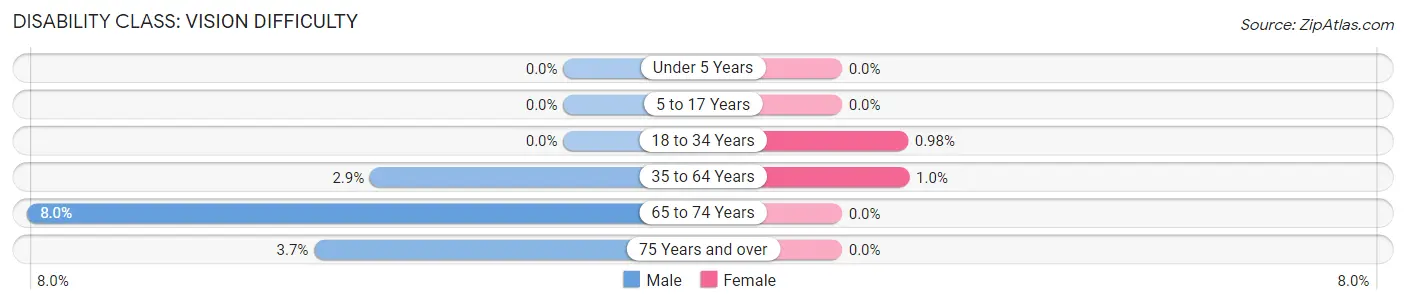
| Age Bracket | Male | Female |
| Under 5 Years | 0 (0.0%) | 0 (0.0%) |
| 5 to 17 Years | 0 (0.0%) | 0 (0.0%) |
| 18 to 34 Years | 0 (0.0%) | 4 (1.0%) |
| 35 to 64 Years | 18 (2.9%) | 6 (1.0%) |
| 65 to 74 Years | 16 (8.0%) | 0 (0.0%) |
| 75 Years and over | 2 (3.7%) | 0 (0.0%) |
Disability Class: Cognitive Difficulty
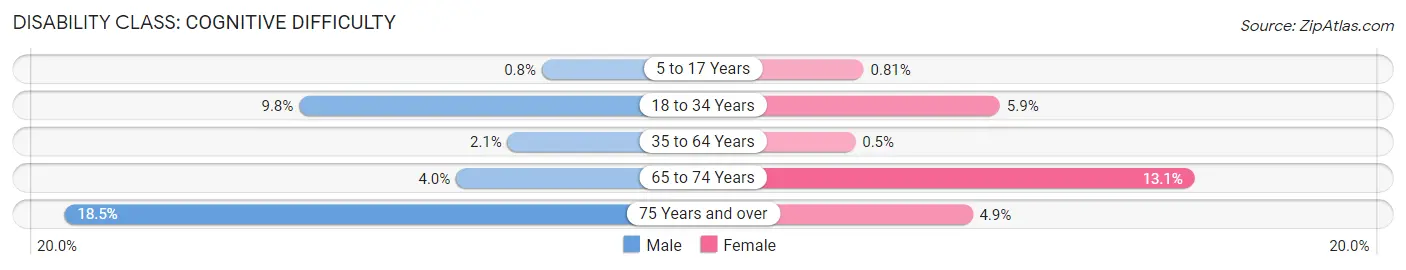
| Age Bracket | Male | Female |
| 5 to 17 Years | 2 (0.8%) | 2 (0.8%) |
| 18 to 34 Years | 42 (9.8%) | 24 (5.9%) |
| 35 to 64 Years | 13 (2.1%) | 3 (0.5%) |
| 65 to 74 Years | 8 (4.0%) | 22 (13.1%) |
| 75 Years and over | 10 (18.5%) | 5 (4.9%) |
Disability Class: Ambulatory Difficulty
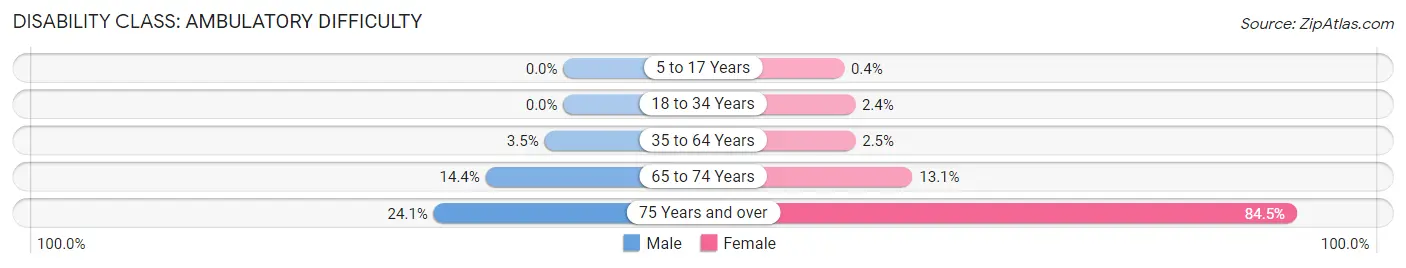
| Age Bracket | Male | Female |
| 5 to 17 Years | 0 (0.0%) | 1 (0.4%) |
| 18 to 34 Years | 0 (0.0%) | 10 (2.4%) |
| 35 to 64 Years | 22 (3.5%) | 15 (2.5%) |
| 65 to 74 Years | 29 (14.4%) | 22 (13.1%) |
| 75 Years and over | 13 (24.1%) | 87 (84.5%) |
Disability Class: Self-Care Difficulty
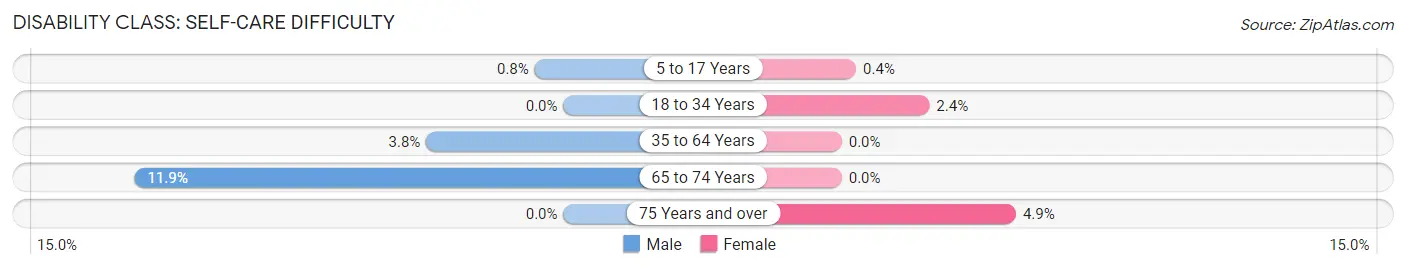
| Age Bracket | Male | Female |
| 5 to 17 Years | 2 (0.8%) | 1 (0.4%) |
| 18 to 34 Years | 0 (0.0%) | 10 (2.4%) |
| 35 to 64 Years | 24 (3.8%) | 0 (0.0%) |
| 65 to 74 Years | 24 (11.9%) | 0 (0.0%) |
| 75 Years and over | 0 (0.0%) | 5 (4.9%) |
Technology Access in North Plains
Computing Device Access in North Plains
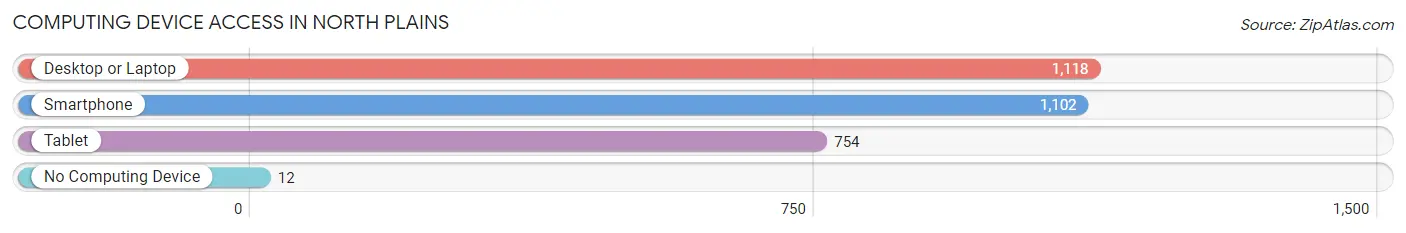
| Device Type | # Households | % Households |
| Desktop or Laptop | 1,118 | 86.5% |
| Smartphone | 1,102 | 85.3% |
| Tablet | 754 | 58.4% |
| No Computing Device | 12 | 0.9% |
| Total | 1,292 | 100.0% |
Internet Access in North Plains
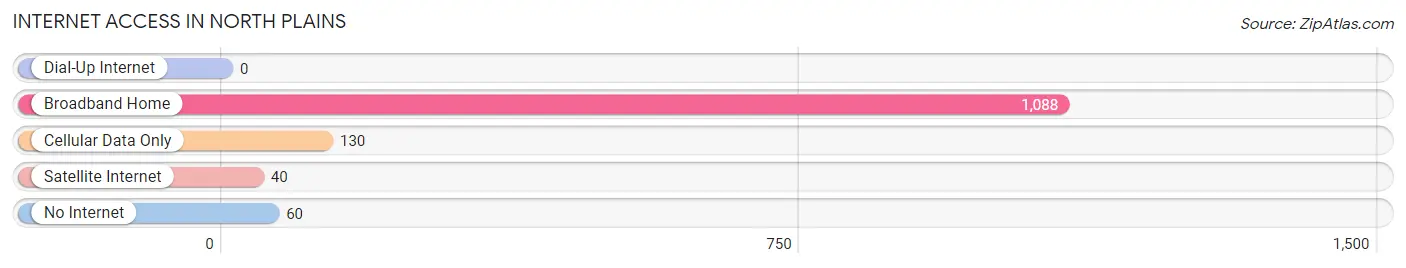
| Internet Type | # Households | % Households |
| Dial-Up Internet | 0 | 0.0% |
| Broadband Home | 1,088 | 84.2% |
| Cellular Data Only | 130 | 10.1% |
| Satellite Internet | 40 | 3.1% |
| No Internet | 60 | 4.6% |
| Total | 1,292 | 100.0% |
North Plains Summary
History
North Plains is a small city located in Washington County, Oregon. It is situated in the Tualatin Valley, about 20 miles west of Portland. The city was founded in 1871 by a group of settlers from the Midwest, who were looking for a place to settle and farm. The city was originally called "North Plains Station" because of its location on the Oregon and California Railroad.
The city was incorporated in 1891 and was named after the nearby North Plains Creek. The city was a small farming community until the 1950s, when the population began to grow due to the influx of people from Portland and other nearby cities. The population continued to grow throughout the 1960s and 1970s, and the city was officially incorporated in 1980.
Geography
North Plains is located in the Tualatin Valley, about 20 miles west of Portland. The city is situated on the banks of the North Plains Creek, which flows through the city and into the Tualatin River. The city is surrounded by rolling hills and is home to several parks and recreational areas. The city is also home to the North Plains Wildlife Refuge, which is a protected area for wildlife and plants.
The climate in North Plains is mild and temperate, with warm summers and cool winters. The average annual temperature is around 50 degrees Fahrenheit. The city receives an average of 37 inches of rain per year, and the average snowfall is around 5 inches.
Economy
North Plains is a small city with a population of just over 5,000 people. The city is home to several small businesses, including a grocery store, a hardware store, and a few restaurants. The city is also home to several industrial and manufacturing businesses, including a plastics factory and a metal fabrication plant.
The city is also home to several farms, which produce a variety of crops, including wheat, corn, and hay. The city is also home to several wineries, which produce a variety of wines.
Demographics
As of the 2010 census, the population of North Plains was 5,068. The racial makeup of the city was 94.3% White, 0.7% African American, 0.3% Native American, 0.7% Asian, 0.1% Pacific Islander, 1.2% from other races, and 2.1% from two or more races. Hispanic or Latino of any race were 4.2% of the population.
The median income for a household in the city was $50,972, and the median income for a family was $60,972. The per capita income for the city was $25,972. About 8.3% of families and 10.2% of the population were below the poverty line, including 14.2% of those under age 18 and 6.2% of those age 65 or over.
Common Questions
What is Per Capita Income in North Plains?
Per Capita income in North Plains is $46,839.
What is the Median Family Income in North Plains?
Median Family Income in North Plains is $141,184.
What is the Median Household income in North Plains?
Median Household Income in North Plains is $109,559.
What is Income or Wage Gap in North Plains?
Income or Wage Gap in North Plains is 39.8%.
Women in North Plains earn 60.2 cents for every dollar earned by a man.
What is Inequality or Gini Index in North Plains?
Inequality or Gini Index in North Plains is 0.35.
What is the Total Population of North Plains?
Total Population of North Plains is 3,365.
What is the Total Male Population of North Plains?
Total Male Population of North Plains is 1,738.
What is the Total Female Population of North Plains?
Total Female Population of North Plains is 1,627.
What is the Ratio of Males per 100 Females in North Plains?
There are 106.82 Males per 100 Females in North Plains.
What is the Ratio of Females per 100 Males in North Plains?
There are 93.61 Females per 100 Males in North Plains.
What is the Median Population Age in North Plains?
Median Population Age in North Plains is 36.0 Years.
What is the Average Family Size in North Plains
Average Family Size in North Plains is 3.4 People.
What is the Average Household Size in North Plains
Average Household Size in North Plains is 2.6 People.
How Large is the Labor Force in North Plains?
There are 1,881 People in the Labor Forcein in North Plains.
What is the Percentage of People in the Labor Force in North Plains?
70.0% of People are in the Labor Force in North Plains.
What is the Unemployment Rate in North Plains?
Unemployment Rate in North Plains is 6.0%.