Breckenridge, CO Map & Demographics
Breckenridge Map
Breckenridge Overview
$55,848
PER CAPITA INCOME
$139,507
AVG FAMILY INCOME
$129,481
AVG HOUSEHOLD INCOME
18.2%
WAGE / INCOME GAP [ % ]
81.8¢/ $1
WAGE / INCOME GAP [ $ ]
0.34
INEQUALITY / GINI INDEX
5,017
TOTAL POPULATION
2,693
MALE POPULATION
2,324
FEMALE POPULATION
115.88
MALES / 100 FEMALES
86.30
FEMALES / 100 MALES
37.2
MEDIAN AGE
2.9
AVG FAMILY SIZE
2.5
AVG HOUSEHOLD SIZE
3,133
LABOR FORCE [ PEOPLE ]
74.7%
PERCENT IN LABOR FORCE
0.6%
UNEMPLOYMENT RATE
Breckenridge Zip Codes
Breckenridge Area Codes
Income in Breckenridge
Income Overview in Breckenridge
Per Capita Income in Breckenridge is $55,848, while median incomes of families and households are $139,507 and $129,481 respectively.
| Characteristic | Number | Measure |
| Per Capita Income | 5,017 | $55,848 |
| Median Family Income | 1,180 | $139,507 |
| Mean Family Income | 1,180 | $157,338 |
| Median Household Income | 1,972 | $129,481 |
| Mean Household Income | 1,972 | $129,276 |
| Income Deficit | 1,180 | $0 |
| Wage / Income Gap (%) | 5,017 | 18.17% |
| Wage / Income Gap ($) | 5,017 | 81.83¢ per $1 |
| Gini / Inequality Index | 5,017 | 0.34 |
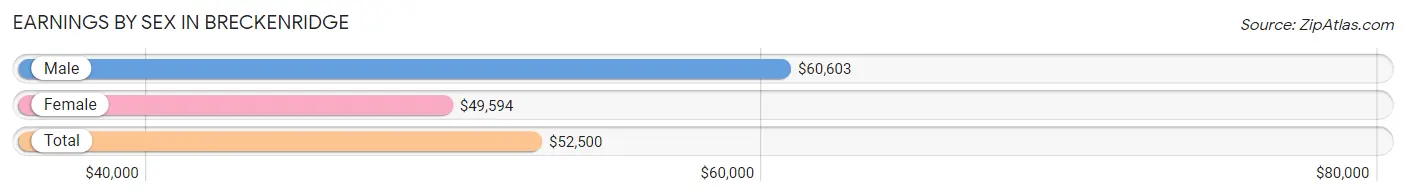
Earnings by Sex in Breckenridge
Average Earnings in Breckenridge are $52,500, $60,603 for men and $49,594 for women, a difference of 18.2%.
| Sex | Number | Average Earnings |
| Male | 1,892 (56.4%) | $60,603 |
| Female | 1,460 (43.6%) | $49,594 |
| Total | 3,352 (100.0%) | $52,500 |
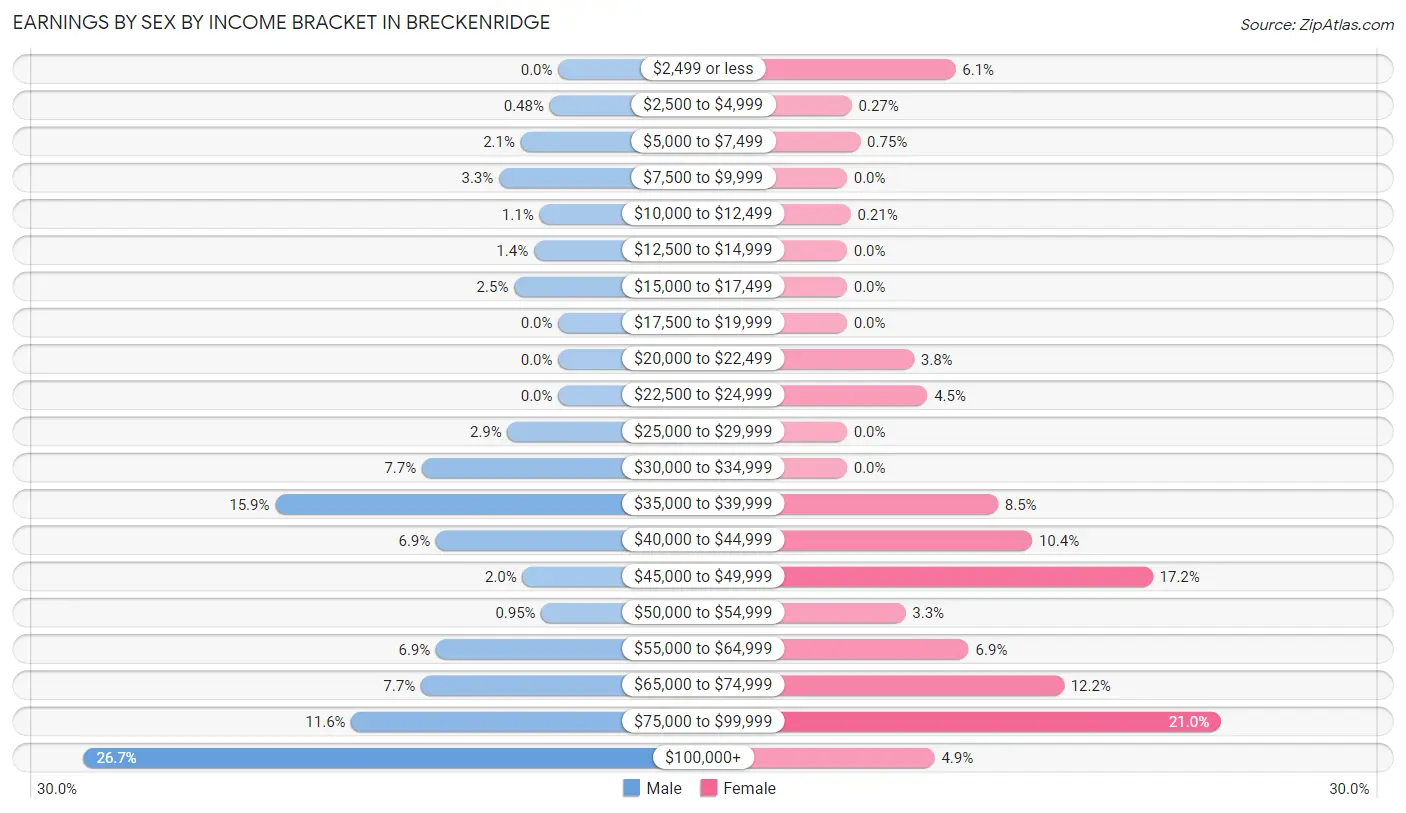
Earnings by Sex by Income Bracket in Breckenridge
The most common earnings brackets in Breckenridge are $100,000+ for men (505 | 26.7%) and $75,000 to $99,999 for women (307 | 21.0%).
| Income | Male | Female |
| $2,499 or less | 0 (0.0%) | 89 (6.1%) |
| $2,500 to $4,999 | 9 (0.5%) | 4 (0.3%) |
| $5,000 to $7,499 | 40 (2.1%) | 11 (0.7%) |
| $7,500 to $9,999 | 63 (3.3%) | 0 (0.0%) |
| $10,000 to $12,499 | 20 (1.1%) | 3 (0.2%) |
| $12,500 to $14,999 | 26 (1.4%) | 0 (0.0%) |
| $15,000 to $17,499 | 47 (2.5%) | 0 (0.0%) |
| $17,500 to $19,999 | 0 (0.0%) | 0 (0.0%) |
| $20,000 to $22,499 | 0 (0.0%) | 55 (3.8%) |
| $22,500 to $24,999 | 0 (0.0%) | 66 (4.5%) |
| $25,000 to $29,999 | 54 (2.9%) | 0 (0.0%) |
| $30,000 to $34,999 | 145 (7.7%) | 0 (0.0%) |
| $35,000 to $39,999 | 301 (15.9%) | 124 (8.5%) |
| $40,000 to $44,999 | 130 (6.9%) | 152 (10.4%) |
| $45,000 to $49,999 | 38 (2.0%) | 251 (17.2%) |
| $50,000 to $54,999 | 18 (0.9%) | 48 (3.3%) |
| $55,000 to $64,999 | 130 (6.9%) | 100 (6.9%) |
| $65,000 to $74,999 | 146 (7.7%) | 178 (12.2%) |
| $75,000 to $99,999 | 220 (11.6%) | 307 (21.0%) |
| $100,000+ | 505 (26.7%) | 72 (4.9%) |
| Total | 1,892 (100.0%) | 1,460 (100.0%) |
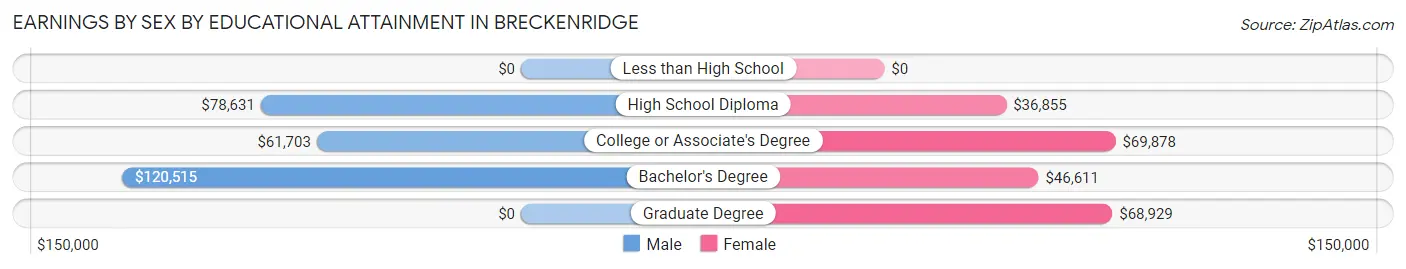
Earnings by Sex by Educational Attainment in Breckenridge
Average earnings in Breckenridge are $65,574 for men and $58,462 for women, a difference of 10.8%. Men with an educational attainment of bachelor's degree enjoy the highest average annual earnings of $120,515, while those with college or associate's degree education earn the least with $61,703. Women with an educational attainment of college or associate's degree earn the most with the average annual earnings of $69,878, while those with high school diploma education have the smallest earnings of $36,855.
| Educational Attainment | Male Income | Female Income |
| Less than High School | - | - |
| High School Diploma | $78,631 | $36,855 |
| College or Associate's Degree | $61,703 | $69,878 |
| Bachelor's Degree | $120,515 | $46,611 |
| Graduate Degree | - | - |
| Total | $65,574 | $58,462 |
Family Income in Breckenridge
Family Income Brackets in Breckenridge
According to the Breckenridge family income data, there are 389 families falling into the $100,000 to $149,999 income range, which is the most common income bracket and makes up 33.0% of all families.
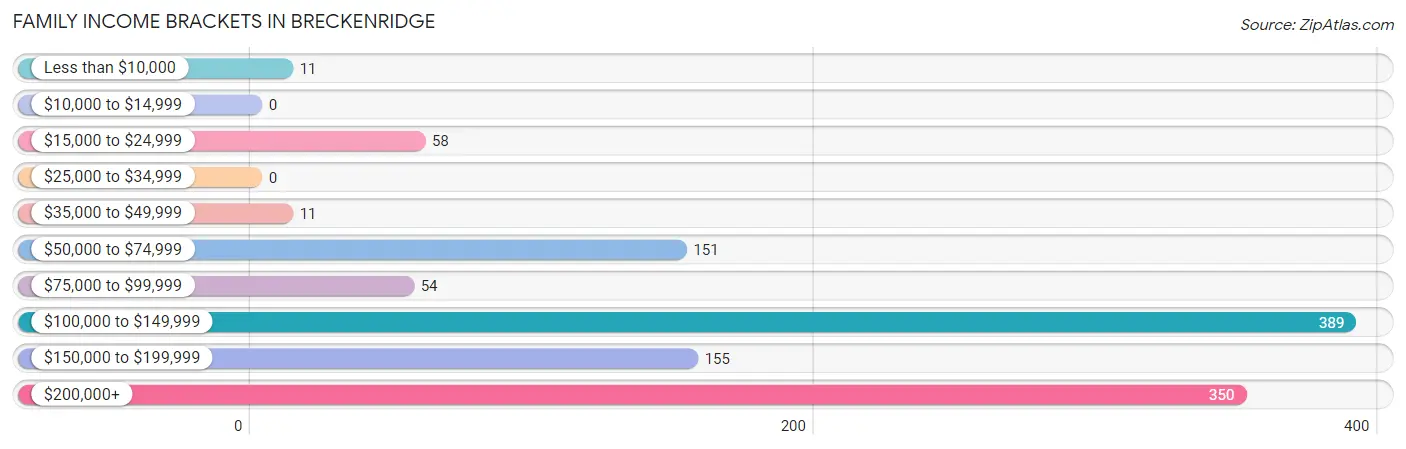
| Income Bracket | # Families | % Families |
| Less than $10,000 | 11 | 0.9% |
| $10,000 to $14,999 | 0 | 0.0% |
| $15,000 to $24,999 | 58 | 4.9% |
| $25,000 to $34,999 | 0 | 0.0% |
| $35,000 to $49,999 | 11 | 0.9% |
| $50,000 to $74,999 | 151 | 12.8% |
| $75,000 to $99,999 | 54 | 4.6% |
| $100,000 to $149,999 | 389 | 33.0% |
| $150,000 to $199,999 | 155 | 13.1% |
| $200,000+ | 350 | 29.7% |
Family Income by Famaliy Size in Breckenridge
3-person families (90 | 7.6%) account for the highest median family income in Breckenridge with $250,001 per family, while 3-person families (90 | 7.6%) have the highest median income of $83,334 per family member.
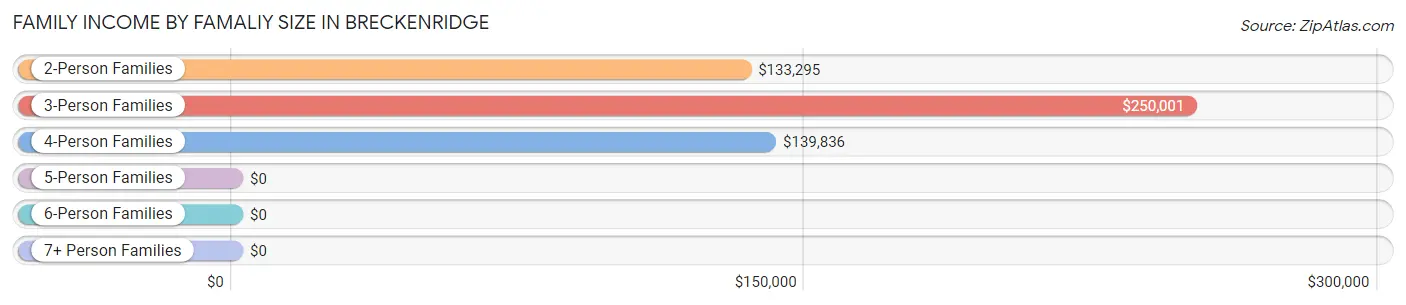
| Income Bracket | # Families | Median Income |
| 2-Person Families | 813 (68.9%) | $133,295 |
| 3-Person Families | 90 (7.6%) | $250,001 |
| 4-Person Families | 242 (20.5%) | $139,836 |
| 5-Person Families | 35 (3.0%) | $0 |
| 6-Person Families | 0 (0.0%) | $0 |
| 7+ Person Families | 0 (0.0%) | $0 |
| Total | 1,180 (100.0%) | $139,507 |
Family Income by Number of Earners in Breckenridge
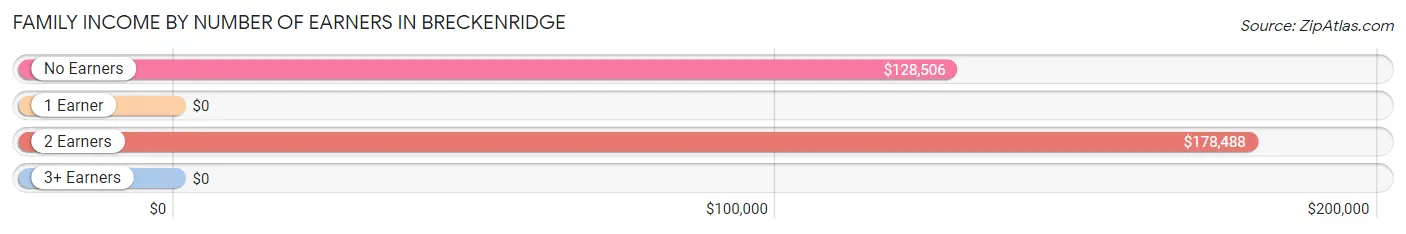
| Number of Earners | # Families | Median Income |
| No Earners | 264 (22.4%) | $128,506 |
| 1 Earner | 210 (17.8%) | $0 |
| 2 Earners | 687 (58.2%) | $178,488 |
| 3+ Earners | 19 (1.6%) | $0 |
| Total | 1,180 (100.0%) | $139,507 |
Household Income in Breckenridge
Household Income Brackets in Breckenridge
With 454 households falling in the category, the $100,000 to $149,999 income range is the most frequent in Breckenridge, accounting for 23.0% of all households.
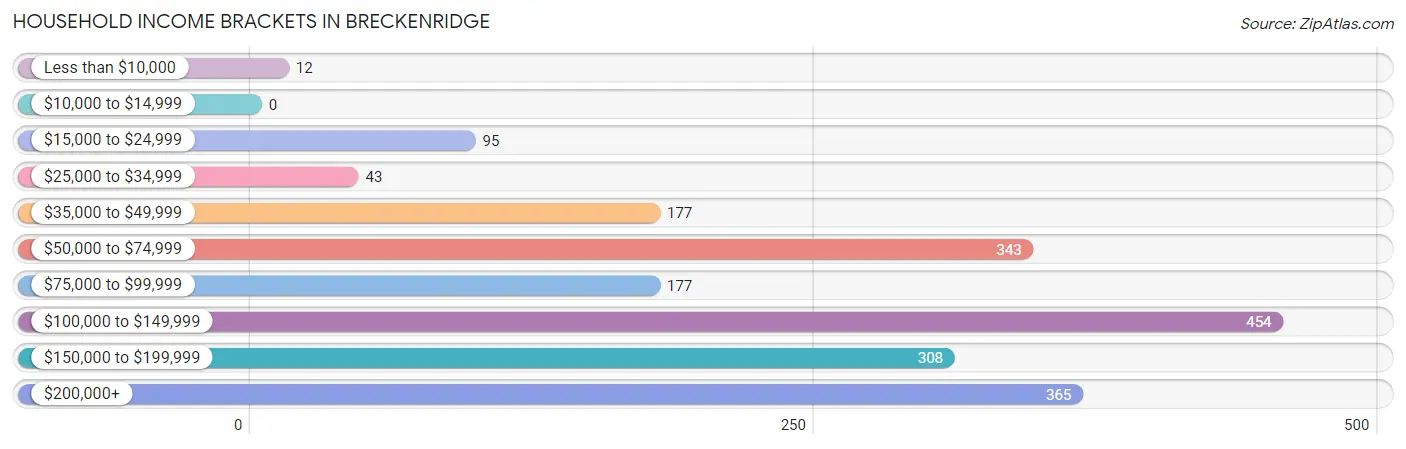
| Income Bracket | # Households | % Households |
| Less than $10,000 | 12 | 0.6% |
| $10,000 to $14,999 | 0 | 0.0% |
| $15,000 to $24,999 | 95 | 4.8% |
| $25,000 to $34,999 | 43 | 2.2% |
| $35,000 to $49,999 | 177 | 9.0% |
| $50,000 to $74,999 | 343 | 17.4% |
| $75,000 to $99,999 | 177 | 9.0% |
| $100,000 to $149,999 | 454 | 23.0% |
| $150,000 to $199,999 | 308 | 15.6% |
| $200,000+ | 365 | 18.5% |
Household Income by Householder Age in Breckenridge
The median household income in Breckenridge is $129,481, with the highest median household income of $167,797 found in the 45 to 64 years age bracket for the primary householder. A total of 362 households (18.4%) fall into this category. Meanwhile, the 15 to 24 years age bracket for the primary householder has the lowest median household income of $0, with 65 households (3.3%) in this group.
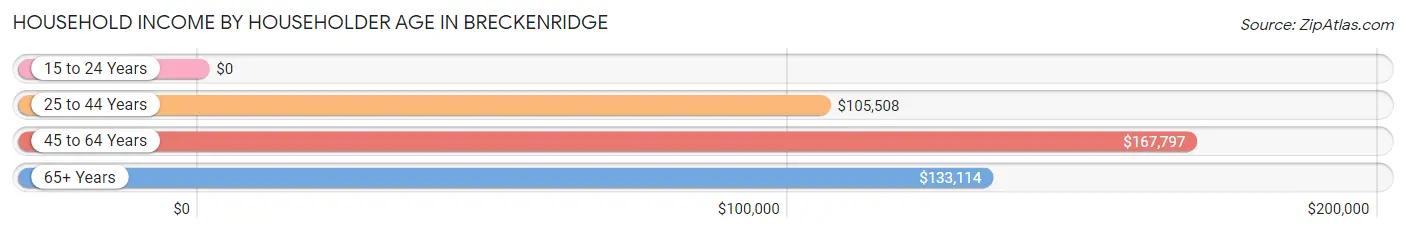
| Income Bracket | # Households | Median Income |
| 15 to 24 Years | 65 (3.3%) | $0 |
| 25 to 44 Years | 1,162 (58.9%) | $105,508 |
| 45 to 64 Years | 362 (18.4%) | $167,797 |
| 65+ Years | 383 (19.4%) | $133,114 |
| Total | 1,972 (100.0%) | $129,481 |
Poverty in Breckenridge
Income Below Poverty by Sex and Age in Breckenridge
With 4.8% poverty level for males and 6.9% for females among the residents of Breckenridge, 55 to 64 year old males and 75 year old and over females are the most vulnerable to poverty, with 14 males (43.8%) and 58 females (34.5%) in their respective age groups living below the poverty level.
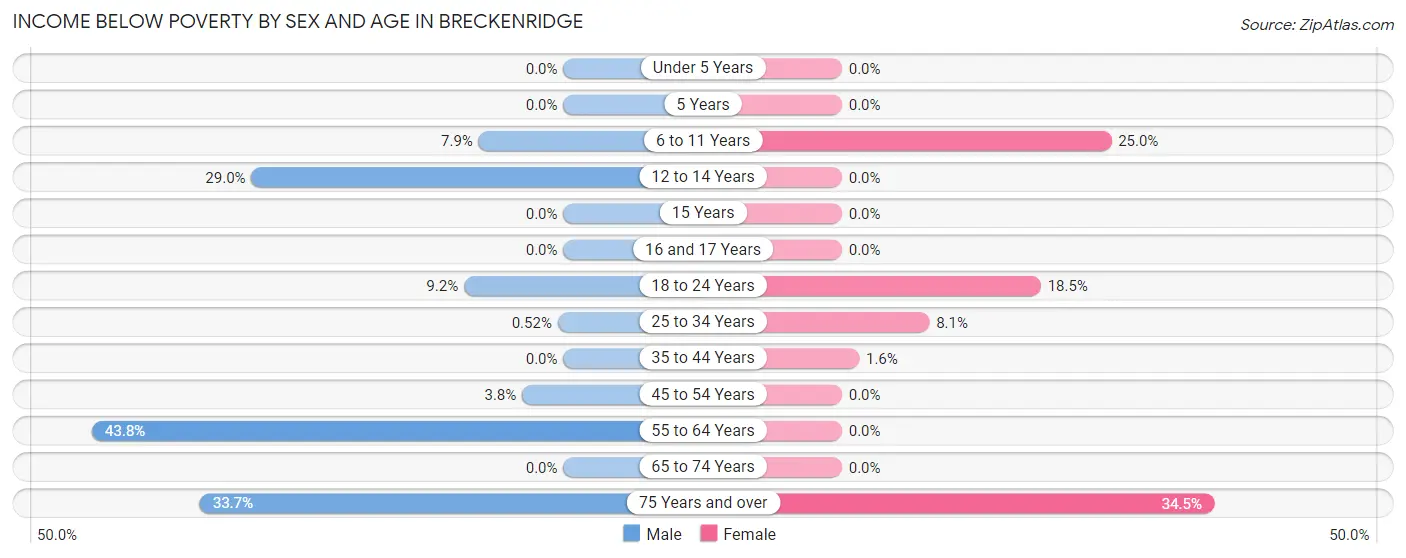
| Age Bracket | Male | Female |
| Under 5 Years | 0 (0.0%) | 0 (0.0%) |
| 5 Years | 0 (0.0%) | 0 (0.0%) |
| 6 to 11 Years | 11 (7.9%) | 17 (25.0%) |
| 12 to 14 Years | 11 (28.9%) | 0 (0.0%) |
| 15 Years | 0 (0.0%) | 0 (0.0%) |
| 16 and 17 Years | 0 (0.0%) | 0 (0.0%) |
| 18 to 24 Years | 20 (9.2%) | 36 (18.5%) |
| 25 to 34 Years | 2 (0.5%) | 39 (8.1%) |
| 35 to 44 Years | 0 (0.0%) | 11 (1.6%) |
| 45 to 54 Years | 15 (3.8%) | 0 (0.0%) |
| 55 to 64 Years | 14 (43.8%) | 0 (0.0%) |
| 65 to 74 Years | 0 (0.0%) | 0 (0.0%) |
| 75 Years and over | 55 (33.7%) | 58 (34.5%) |
| Total | 128 (4.8%) | 161 (6.9%) |
Income Above Poverty by Sex and Age in Breckenridge
According to the poverty statistics in Breckenridge, males aged under 5 years and females aged under 5 years are the age groups that are most secure financially, with 100.0% of males and 100.0% of females in these age groups living above the poverty line.
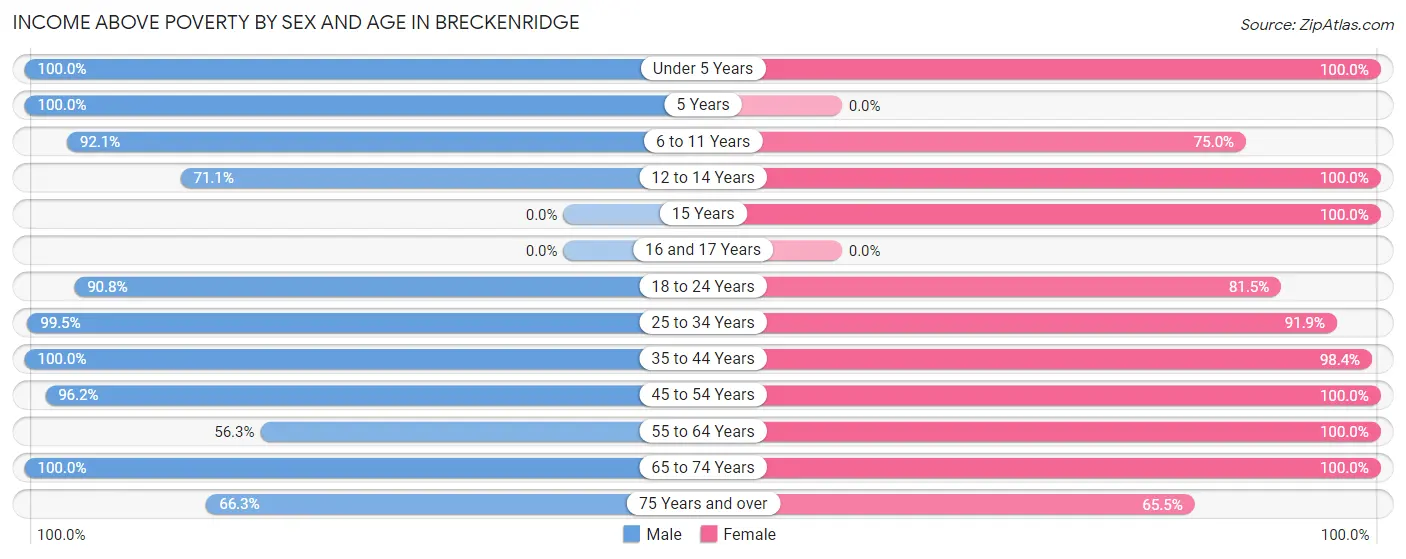
| Age Bracket | Male | Female |
| Under 5 Years | 158 (100.0%) | 116 (100.0%) |
| 5 Years | 111 (100.0%) | 0 (0.0%) |
| 6 to 11 Years | 129 (92.1%) | 51 (75.0%) |
| 12 to 14 Years | 27 (71.1%) | 154 (100.0%) |
| 15 Years | 0 (0.0%) | 38 (100.0%) |
| 16 and 17 Years | 0 (0.0%) | 0 (0.0%) |
| 18 to 24 Years | 197 (90.8%) | 159 (81.5%) |
| 25 to 34 Years | 385 (99.5%) | 442 (91.9%) |
| 35 to 44 Years | 727 (100.0%) | 675 (98.4%) |
| 45 to 54 Years | 377 (96.2%) | 63 (100.0%) |
| 55 to 64 Years | 18 (56.2%) | 120 (100.0%) |
| 65 to 74 Years | 278 (100.0%) | 235 (100.0%) |
| 75 Years and over | 108 (66.3%) | 110 (65.5%) |
| Total | 2,515 (95.2%) | 2,163 (93.1%) |
Income Below Poverty Among Married-Couple Families in Breckenridge
The poverty statistics for married-couple families in Breckenridge show that 5.0% or 58 of the total 1,169 families live below the poverty line. Families with no children have the highest poverty rate of 6.8%, comprising of 58 families. On the other hand, families with 1 or 2 children have the lowest poverty rate of 0.0%, which includes 0 families.
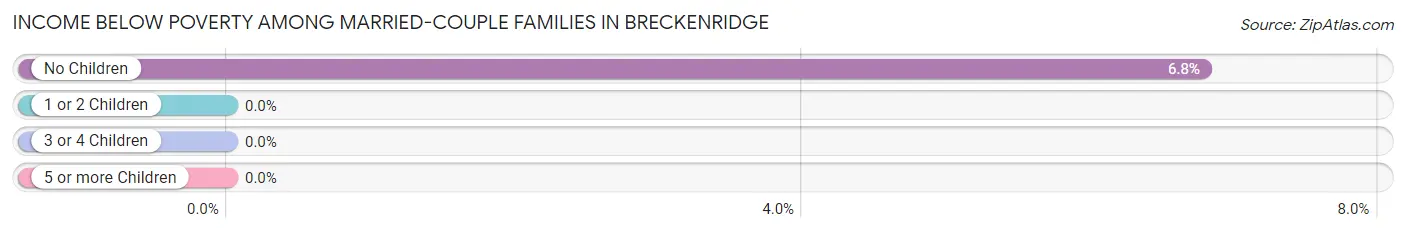
| Children | Above Poverty | Below Poverty |
| No Children | 797 (93.2%) | 58 (6.8%) |
| 1 or 2 Children | 314 (100.0%) | 0 (0.0%) |
| 3 or 4 Children | 0 (0.0%) | 0 (0.0%) |
| 5 or more Children | 0 (0.0%) | 0 (0.0%) |
| Total | 1,111 (95.0%) | 58 (5.0%) |
Income Below Poverty Among Single-Parent Households in Breckenridge
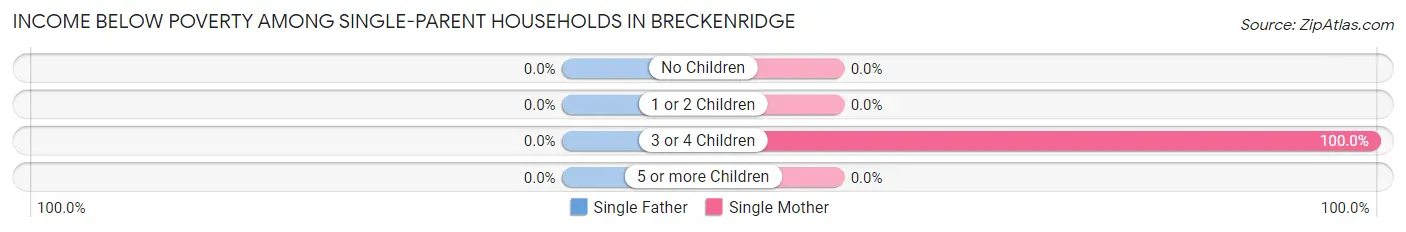
| Children | Single Father | Single Mother |
| No Children | 0 (0.0%) | 0 (0.0%) |
| 1 or 2 Children | 0 (0.0%) | 0 (0.0%) |
| 3 or 4 Children | 0 (0.0%) | 11 (100.0%) |
| 5 or more Children | 0 (0.0%) | 0 (0.0%) |
| Total | 0 (0.0%) | 11 (100.0%) |
Income Below Poverty Among Married-Couple vs Single-Parent Households in Breckenridge
The poverty data for Breckenridge shows that 58 of the married-couple family households (5.0%) and 11 of the single-parent households (100.0%) are living below the poverty level. Within the married-couple family households, those with no children have the highest poverty rate, with 58 households (6.8%) falling below the poverty line. Among the single-parent households, those with 3 or 4 children have the highest poverty rate, with 11 household (100.0%) living below poverty.
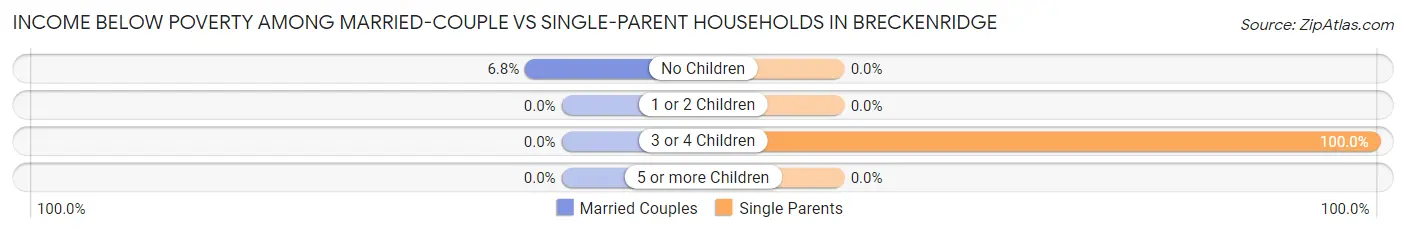
| Children | Married-Couple Families | Single-Parent Households |
| No Children | 58 (6.8%) | 0 (0.0%) |
| 1 or 2 Children | 0 (0.0%) | 0 (0.0%) |
| 3 or 4 Children | 0 (0.0%) | 11 (100.0%) |
| 5 or more Children | 0 (0.0%) | 0 (0.0%) |
| Total | 58 (5.0%) | 11 (100.0%) |
Race in Breckenridge
The most populous races in Breckenridge are White / Caucasian (4,126 | 82.2%), Two or more Races (675 | 13.5%), and Hispanic or Latino (216 | 4.3%).
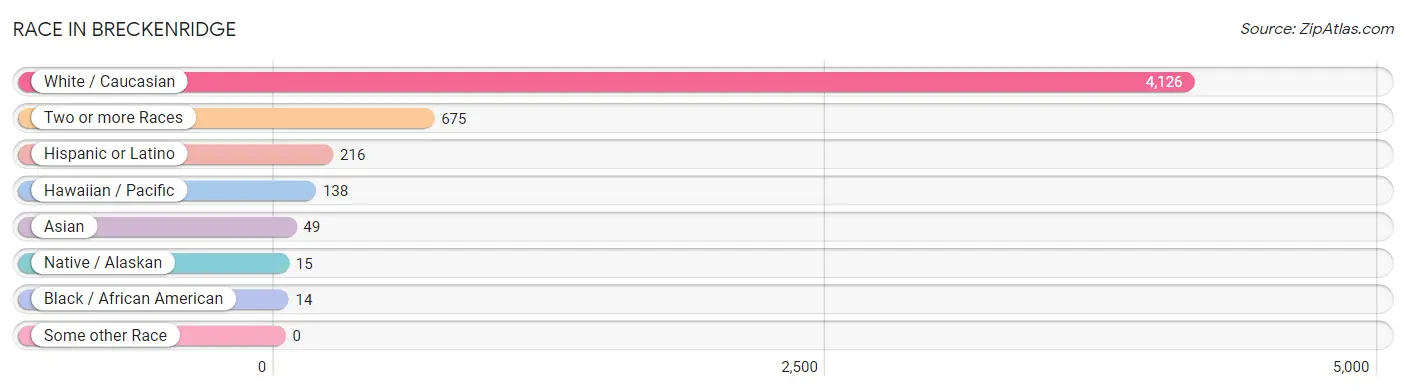
| Race | # Population | % Population |
| Asian | 49 | 1.0% |
| Black / African American | 14 | 0.3% |
| Hawaiian / Pacific | 138 | 2.8% |
| Hispanic or Latino | 216 | 4.3% |
| Native / Alaskan | 15 | 0.3% |
| White / Caucasian | 4,126 | 82.2% |
| Two or more Races | 675 | 13.5% |
| Some other Race | 0 | 0.0% |
| Total | 5,017 | 100.0% |
Ancestry in Breckenridge
The most populous ancestries reported in Breckenridge are German (590 | 11.8%), English (512 | 10.2%), Irish (380 | 7.6%), Polish (307 | 6.1%), and Turkish (222 | 4.4%), together accounting for 40.1% of all Breckenridge residents.
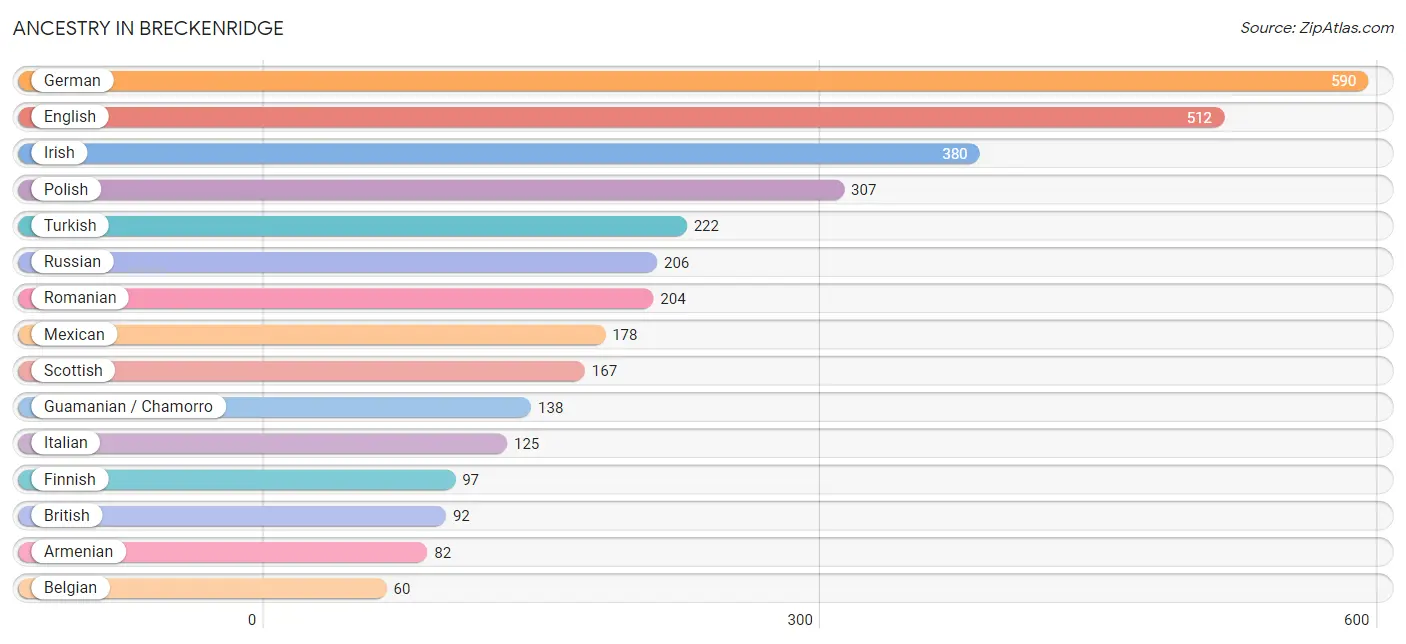
| Ancestry | # Population | % Population |
| American | 39 | 0.8% |
| Arab | 37 | 0.7% |
| Armenian | 82 | 1.6% |
| Barbadian | 2 | 0.0% |
| Belgian | 60 | 1.2% |
| British | 92 | 1.8% |
| Cherokee | 39 | 0.8% |
| Czech | 56 | 1.1% |
| English | 512 | 10.2% |
| European | 26 | 0.5% |
| Finnish | 97 | 1.9% |
| French | 23 | 0.5% |
| German | 590 | 11.8% |
| Guamanian / Chamorro | 138 | 2.8% |
| Hungarian | 31 | 0.6% |
| Indian (Asian) | 49 | 1.0% |
| Irish | 380 | 7.6% |
| Italian | 125 | 2.5% |
| Lebanese | 37 | 0.7% |
| Lithuanian | 50 | 1.0% |
| Macedonian | 26 | 0.5% |
| Mexican | 178 | 3.5% |
| Navajo | 30 | 0.6% |
| Polish | 307 | 6.1% |
| Pueblo | 15 | 0.3% |
| Romanian | 204 | 4.1% |
| Russian | 206 | 4.1% |
| Scotch-Irish | 16 | 0.3% |
| Scottish | 167 | 3.3% |
| Spaniard | 38 | 0.8% |
| Swedish | 14 | 0.3% |
| Turkish | 222 | 4.4% | View All 32 Rows |
Immigrants in Breckenridge
The most numerous immigrant groups reported in Breckenridge came from Latin America (117 | 2.3%), Europe (81 | 1.6%), South America (58 | 1.2%), Central America (57 | 1.1%), and Mexico (57 | 1.1%), together accounting for 7.4% of all Breckenridge residents.
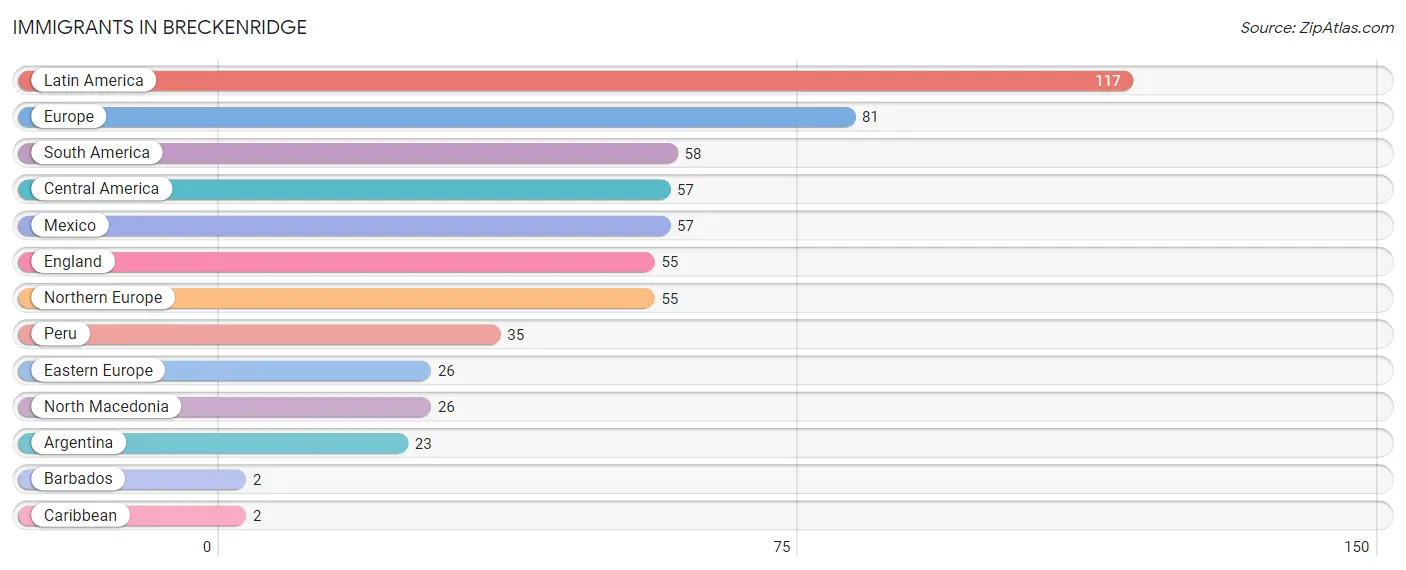
| Immigration Origin | # Population | % Population |
| Argentina | 23 | 0.5% |
| Barbados | 2 | 0.0% |
| Caribbean | 2 | 0.0% |
| Central America | 57 | 1.1% |
| Eastern Europe | 26 | 0.5% |
| England | 55 | 1.1% |
| Europe | 81 | 1.6% |
| Latin America | 117 | 2.3% |
| Mexico | 57 | 1.1% |
| North Macedonia | 26 | 0.5% |
| Northern Europe | 55 | 1.1% |
| Peru | 35 | 0.7% |
| South America | 58 | 1.2% | View All 13 Rows |
Sex and Age in Breckenridge
Sex and Age in Breckenridge
The most populous age groups in Breckenridge are 35 to 39 Years (515 | 19.1%) for men and 35 to 39 Years (578 | 24.9%) for women.
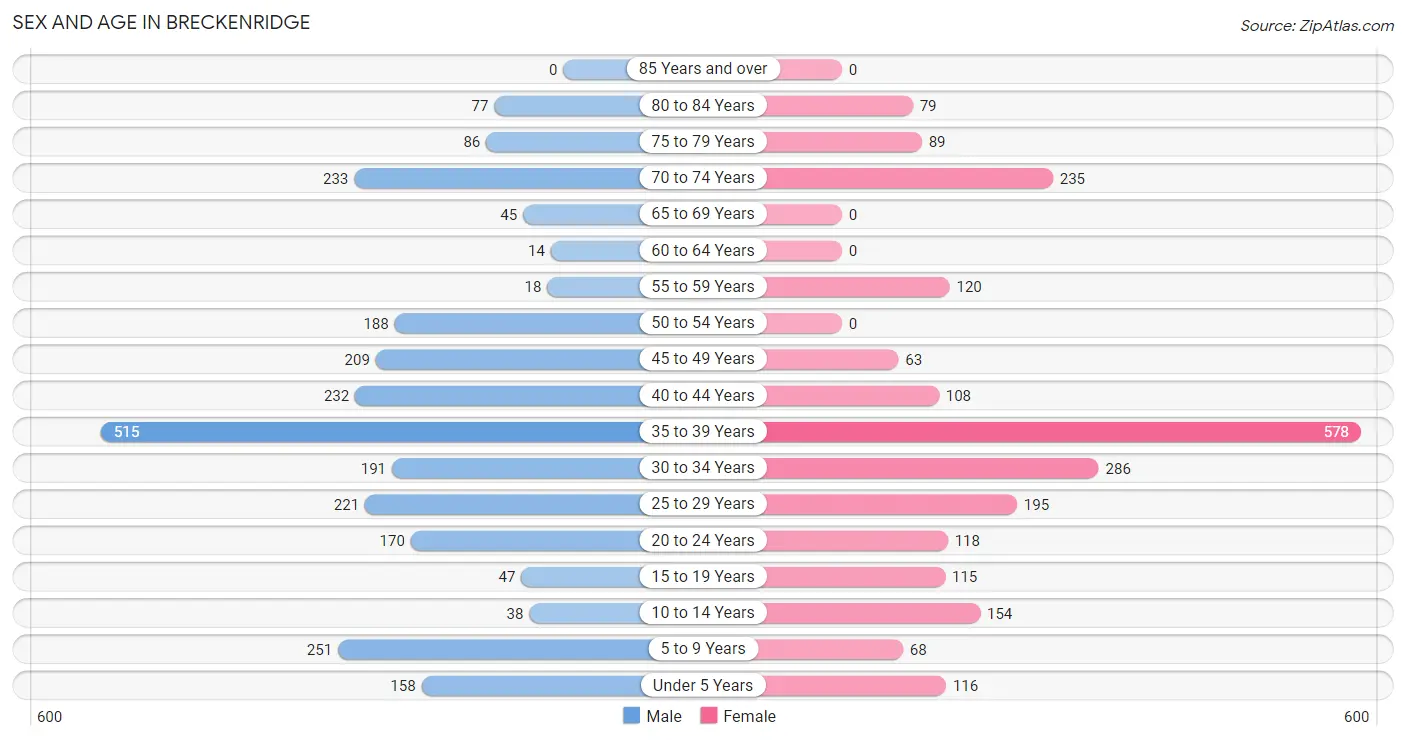
| Age Bracket | Male | Female |
| Under 5 Years | 158 (5.9%) | 116 (5.0%) |
| 5 to 9 Years | 251 (9.3%) | 68 (2.9%) |
| 10 to 14 Years | 38 (1.4%) | 154 (6.6%) |
| 15 to 19 Years | 47 (1.8%) | 115 (5.0%) |
| 20 to 24 Years | 170 (6.3%) | 118 (5.1%) |
| 25 to 29 Years | 221 (8.2%) | 195 (8.4%) |
| 30 to 34 Years | 191 (7.1%) | 286 (12.3%) |
| 35 to 39 Years | 515 (19.1%) | 578 (24.9%) |
| 40 to 44 Years | 232 (8.6%) | 108 (4.6%) |
| 45 to 49 Years | 209 (7.8%) | 63 (2.7%) |
| 50 to 54 Years | 188 (7.0%) | 0 (0.0%) |
| 55 to 59 Years | 18 (0.7%) | 120 (5.2%) |
| 60 to 64 Years | 14 (0.5%) | 0 (0.0%) |
| 65 to 69 Years | 45 (1.7%) | 0 (0.0%) |
| 70 to 74 Years | 233 (8.6%) | 235 (10.1%) |
| 75 to 79 Years | 86 (3.2%) | 89 (3.8%) |
| 80 to 84 Years | 77 (2.9%) | 79 (3.4%) |
| 85 Years and over | 0 (0.0%) | 0 (0.0%) |
| Total | 2,693 (100.0%) | 2,324 (100.0%) |
Families and Households in Breckenridge
Median Family Size in Breckenridge
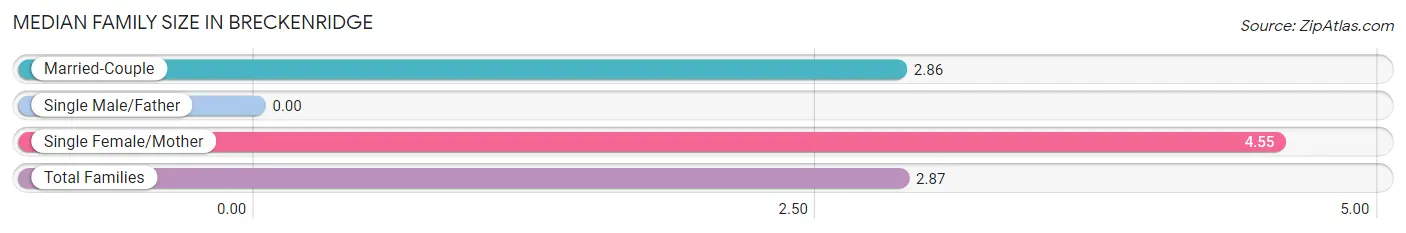
| Family Type | # Families | Family Size |
| Married-Couple | 1,169 (99.1%) | 2.86 |
| Single Male/Father | 0 (0.0%) | - |
| Single Female/Mother | 11 (0.9%) | 4.55 |
| Total Families | 1,180 (100.0%) | 2.87 |
Median Household Size in Breckenridge
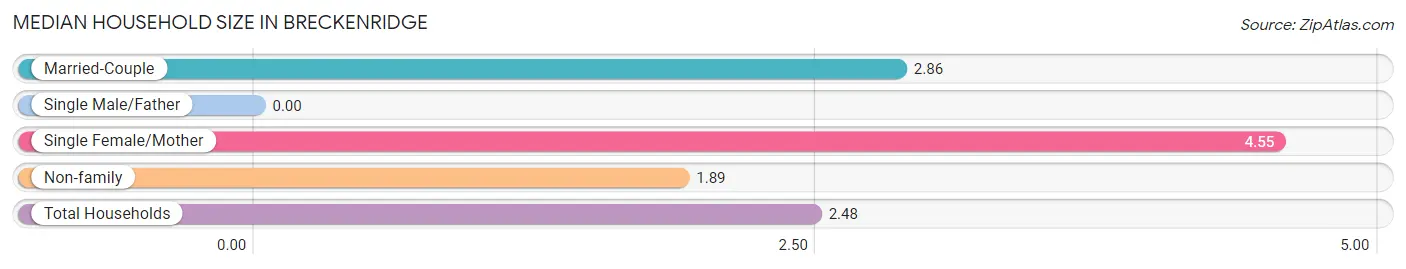
| Household Type | # Households | Household Size |
| Married-Couple | 1,169 (59.3%) | 2.86 |
| Single Male/Father | 0 (0.0%) | - |
| Single Female/Mother | 11 (0.6%) | 4.55 |
| Non-family | 792 (40.2%) | 1.89 |
| Total Households | 1,972 (100.0%) | 2.48 |
Household Size by Marriage Status in Breckenridge
Out of a total of 1,972 households in Breckenridge, 1,180 (59.8%) are family households, while 792 (40.2%) are nonfamily households. The most numerous type of family households are 2-person households, comprising 813, and the most common type of nonfamily households are 1-person households, comprising 554.
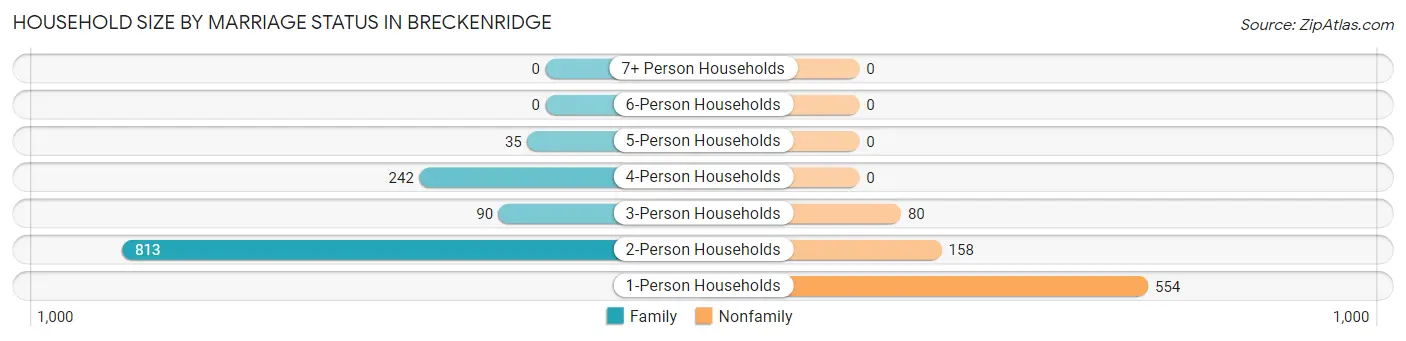
| Household Size | Family Households | Nonfamily Households |
| 1-Person Households | - | 554 (28.1%) |
| 2-Person Households | 813 (41.2%) | 158 (8.0%) |
| 3-Person Households | 90 (4.6%) | 80 (4.1%) |
| 4-Person Households | 242 (12.3%) | 0 (0.0%) |
| 5-Person Households | 35 (1.8%) | 0 (0.0%) |
| 6-Person Households | 0 (0.0%) | 0 (0.0%) |
| 7+ Person Households | 0 (0.0%) | 0 (0.0%) |
| Total | 1,180 (59.8%) | 792 (40.2%) |
Female Fertility in Breckenridge
Fertility by Age in Breckenridge
Average fertility rate in Breckenridge is 50.0 births per 1,000 women. Women in the age bracket of 20 to 34 years have the highest fertility rate with 58.0 births per 1,000 women. Women in the age bracket of 35 to 50 years acount for 52.0% of all women with births.
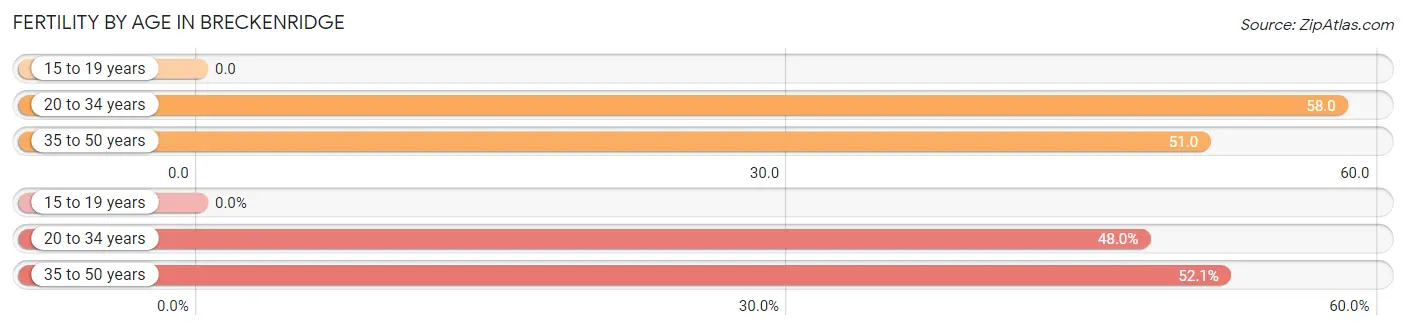
| Age Bracket | Women with Births | Births / 1,000 Women |
| 15 to 19 years | 0 (0.0%) | 0.0 |
| 20 to 34 years | 35 (47.9%) | 58.0 |
| 35 to 50 years | 38 (52.0%) | 51.0 |
| Total | 73 (100.0%) | 50.0 |
Fertility by Age by Marriage Status in Breckenridge
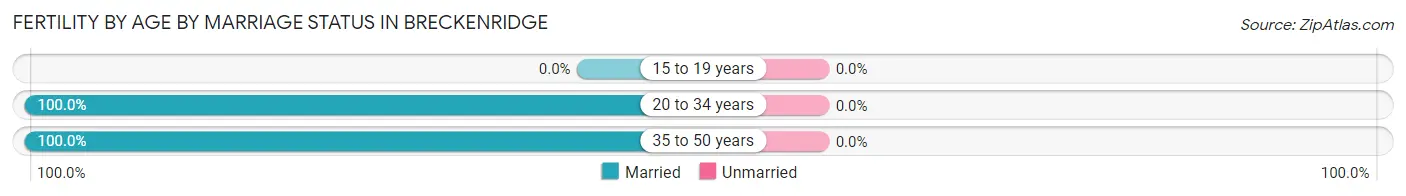
| Age Bracket | Married | Unmarried |
| 15 to 19 years | 0 (0.0%) | 0 (0.0%) |
| 20 to 34 years | 35 (100.0%) | 0 (0.0%) |
| 35 to 50 years | 38 (100.0%) | 0 (0.0%) |
| Total | 73 (100.0%) | 0 (0.0%) |
Fertility by Education in Breckenridge
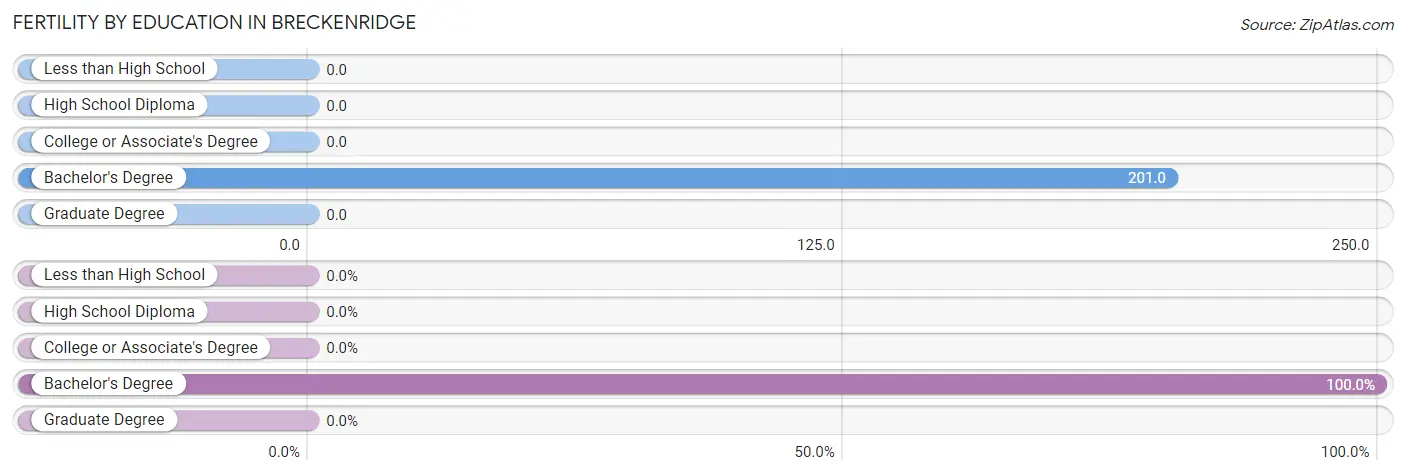
| Educational Attainment | Women with Births | Births / 1,000 Women |
| Less than High School | 0 (0.0%) | 0.0 |
| High School Diploma | 0 (0.0%) | 0.0 |
| College or Associate's Degree | 0 (0.0%) | 0.0 |
| Bachelor's Degree | 73 (100.0%) | 201.0 |
| Graduate Degree | 0 (0.0%) | 0.0 |
| Total | 73 (100.0%) | 50.0 |
Fertility by Education by Marriage Status in Breckenridge
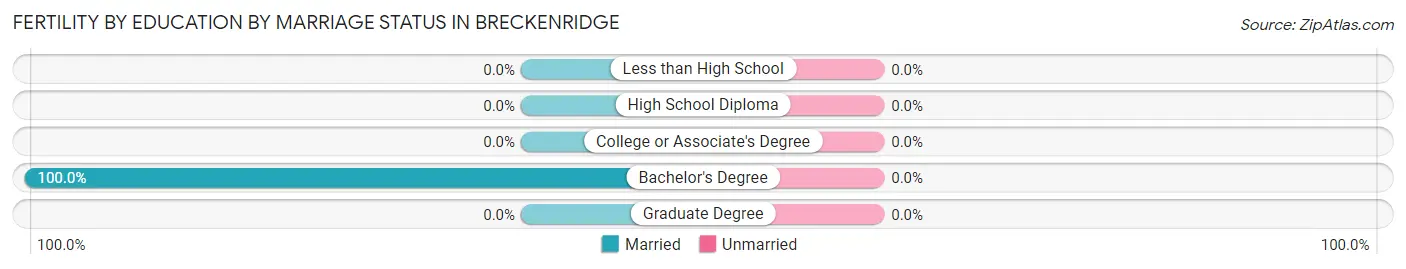
| Educational Attainment | Married | Unmarried |
| Less than High School | 0 (0.0%) | 0 (0.0%) |
| High School Diploma | 0 (0.0%) | 0 (0.0%) |
| College or Associate's Degree | 0 (0.0%) | 0 (0.0%) |
| Bachelor's Degree | 73 (100.0%) | 0 (0.0%) |
| Graduate Degree | 0 (0.0%) | 0 (0.0%) |
| Total | 73 (100.0%) | 0 (0.0%) |
Employment Characteristics in Breckenridge
Employment by Class of Employer in Breckenridge
Among the 2,935 employed individuals in Breckenridge, private company employees (2,044 | 69.6%), state government employees (275 | 9.4%), and self-employed (incorporated) (265 | 9.0%) make up the most common classes of employment.
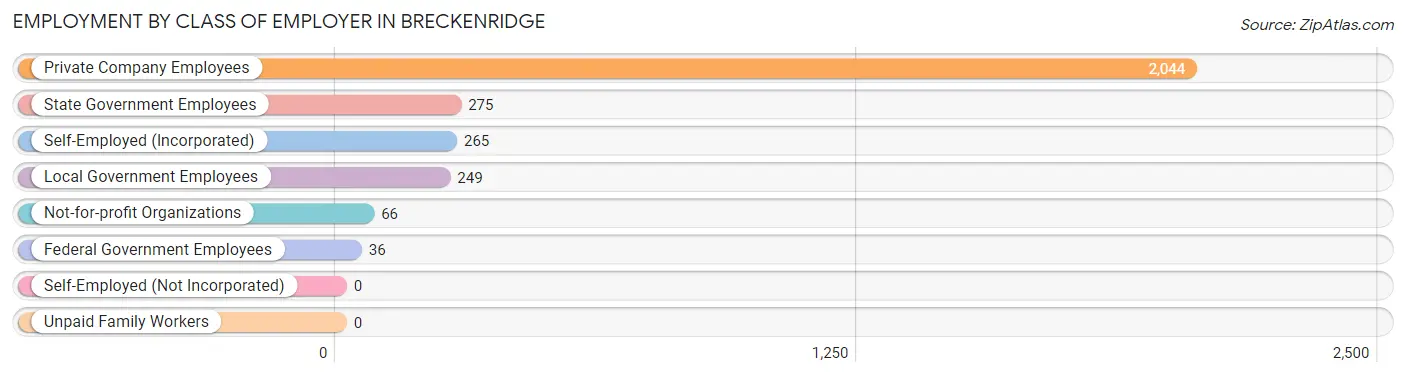
| Employer Class | # Employees | % Employees |
| Private Company Employees | 2,044 | 69.6% |
| Self-Employed (Incorporated) | 265 | 9.0% |
| Self-Employed (Not Incorporated) | 0 | 0.0% |
| Not-for-profit Organizations | 66 | 2.2% |
| Local Government Employees | 249 | 8.5% |
| State Government Employees | 275 | 9.4% |
| Federal Government Employees | 36 | 1.2% |
| Unpaid Family Workers | 0 | 0.0% |
| Total | 2,935 | 100.0% |
Employment Status by Age in Breckenridge
According to the labor force statistics for Breckenridge, out of the total population over 16 years of age (4,194), 74.7% or 3,133 individuals are in the labor force, with 0.6% or 19 of them unemployed. The age group with the highest labor force participation rate is 55 to 59 years, with 100.0% or 138 individuals in the labor force. Within the labor force, the 20 to 24 years age range has the highest percentage of unemployed individuals, with 7.7% or 20 of them being unemployed.
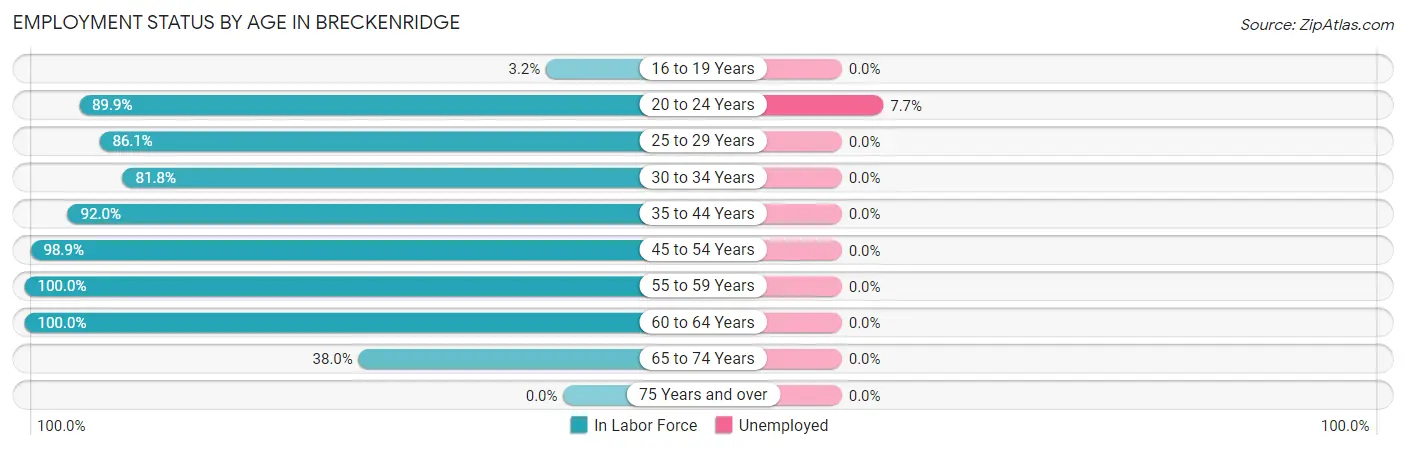
| Age Bracket | In Labor Force | Unemployed |
| 16 to 19 Years | 4 (3.2%) | 0 (0.0%) |
| 20 to 24 Years | 259 (89.9%) | 20 (7.7%) |
| 25 to 29 Years | 358 (86.1%) | 0 (0.0%) |
| 30 to 34 Years | 390 (81.8%) | 0 (0.0%) |
| 35 to 44 Years | 1,318 (92.0%) | 0 (0.0%) |
| 45 to 54 Years | 455 (98.9%) | 0 (0.0%) |
| 55 to 59 Years | 138 (100.0%) | 0 (0.0%) |
| 60 to 64 Years | 14 (100.0%) | 0 (0.0%) |
| 65 to 74 Years | 195 (38.0%) | 0 (0.0%) |
| 75 Years and over | 0 (0.0%) | 0 (0.0%) |
| Total | 3,133 (74.7%) | 19 (0.6%) |
Employment Status by Educational Attainment in Breckenridge
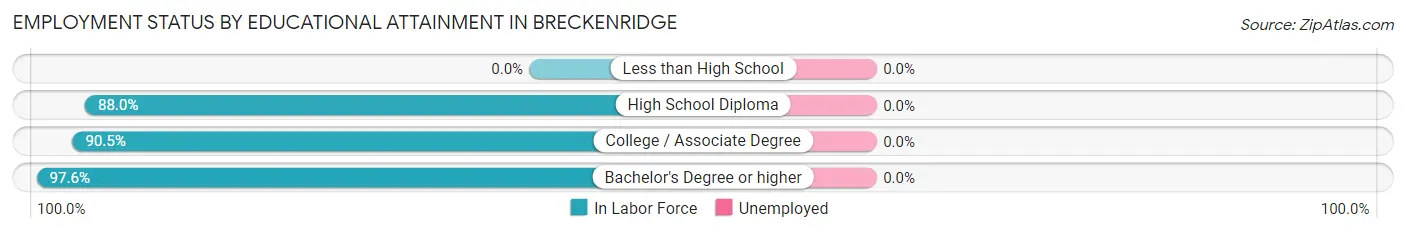
| Educational Attainment | In Labor Force | Unemployed |
| Less than High School | 0 (0.0%) | 0 (0.0%) |
| High School Diploma | 529 (88.0%) | 0 (0.0%) |
| College / Associate Degree | 733 (90.5%) | 0 (0.0%) |
| Bachelor's Degree or higher | 1,411 (97.6%) | 0 (0.0%) |
| Total | 2,674 (91.0%) | 0 (0.0%) |
Employment Occupations by Sex in Breckenridge
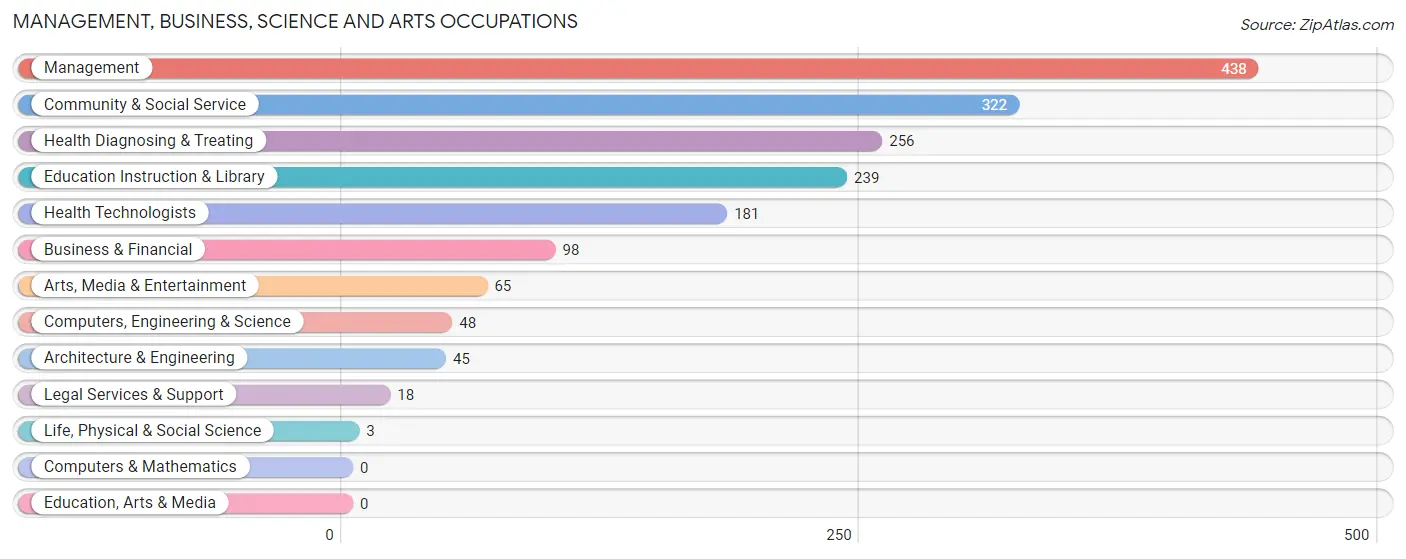
Management, Business, Science and Arts Occupations
The most common Management, Business, Science and Arts occupations in Breckenridge are Management (438 | 14.1%), Community & Social Service (322 | 10.3%), Health Diagnosing & Treating (256 | 8.2%), Education Instruction & Library (239 | 7.7%), and Health Technologists (181 | 5.8%).
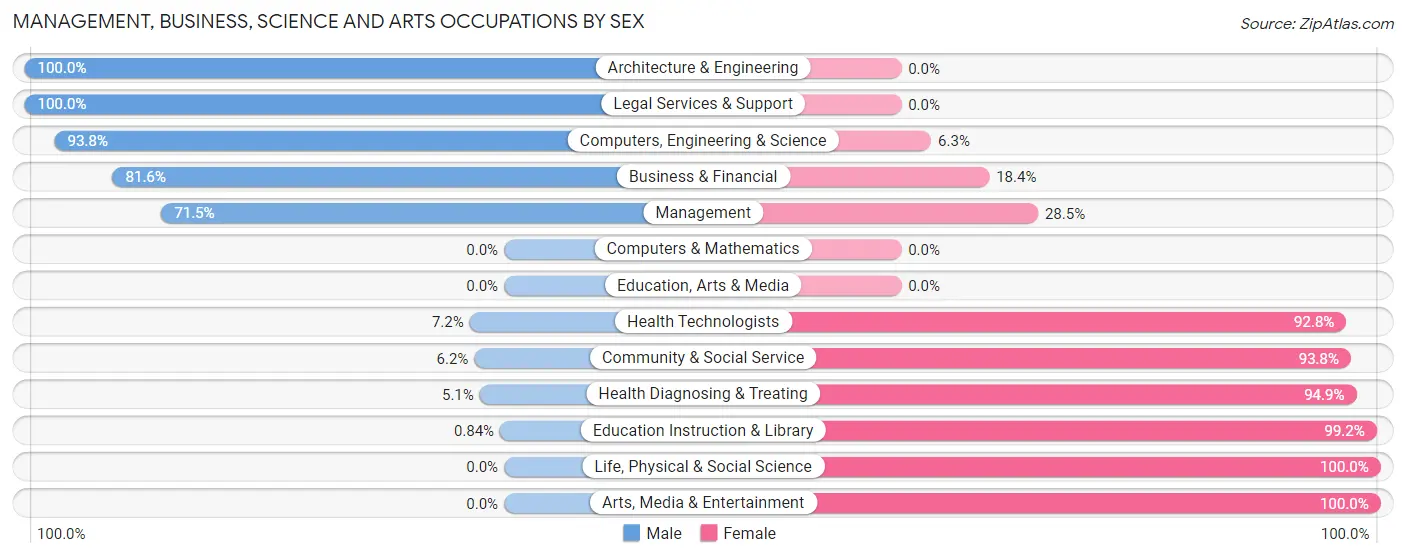
Management, Business, Science and Arts Occupations by Sex
Within the Management, Business, Science and Arts occupations in Breckenridge, the most male-oriented occupations are Architecture & Engineering (100.0%), Legal Services & Support (100.0%), and Computers, Engineering & Science (93.8%), while the most female-oriented occupations are Life, Physical & Social Science (100.0%), Arts, Media & Entertainment (100.0%), and Education Instruction & Library (99.2%).
| Occupation | Male | Female |
| Management | 313 (71.5%) | 125 (28.5%) |
| Business & Financial | 80 (81.6%) | 18 (18.4%) |
| Computers, Engineering & Science | 45 (93.8%) | 3 (6.2%) |
| Computers & Mathematics | 0 (0.0%) | 0 (0.0%) |
| Architecture & Engineering | 45 (100.0%) | 0 (0.0%) |
| Life, Physical & Social Science | 0 (0.0%) | 3 (100.0%) |
| Community & Social Service | 20 (6.2%) | 302 (93.8%) |
| Education, Arts & Media | 0 (0.0%) | 0 (0.0%) |
| Legal Services & Support | 18 (100.0%) | 0 (0.0%) |
| Education Instruction & Library | 2 (0.8%) | 237 (99.2%) |
| Arts, Media & Entertainment | 0 (0.0%) | 65 (100.0%) |
| Health Diagnosing & Treating | 13 (5.1%) | 243 (94.9%) |
| Health Technologists | 13 (7.2%) | 168 (92.8%) |
| Total (Category) | 471 (40.5%) | 691 (59.5%) |
| Total (Overall) | 1,770 (56.9%) | 1,341 (43.1%) |
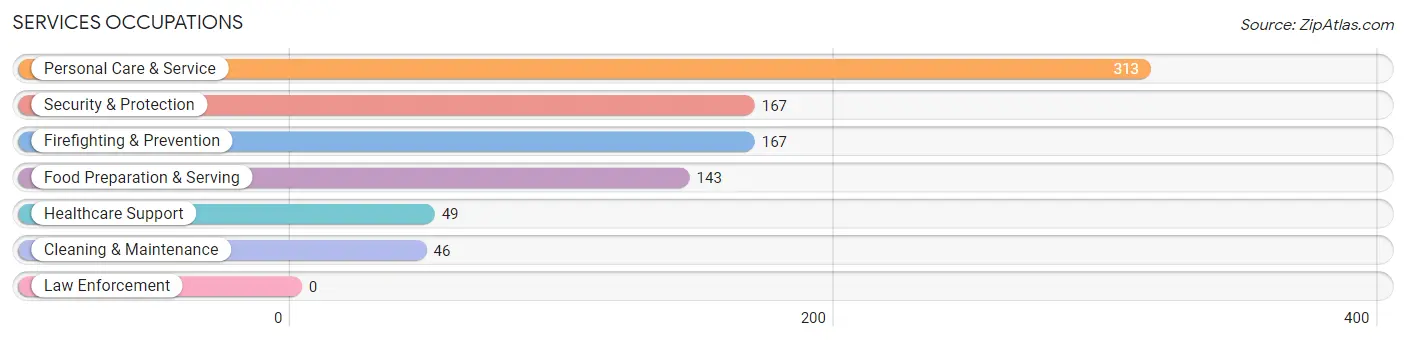
Services Occupations
The most common Services occupations in Breckenridge are Personal Care & Service (313 | 10.1%), Security & Protection (167 | 5.4%), Firefighting & Prevention (167 | 5.4%), Food Preparation & Serving (143 | 4.6%), and Healthcare Support (49 | 1.6%).
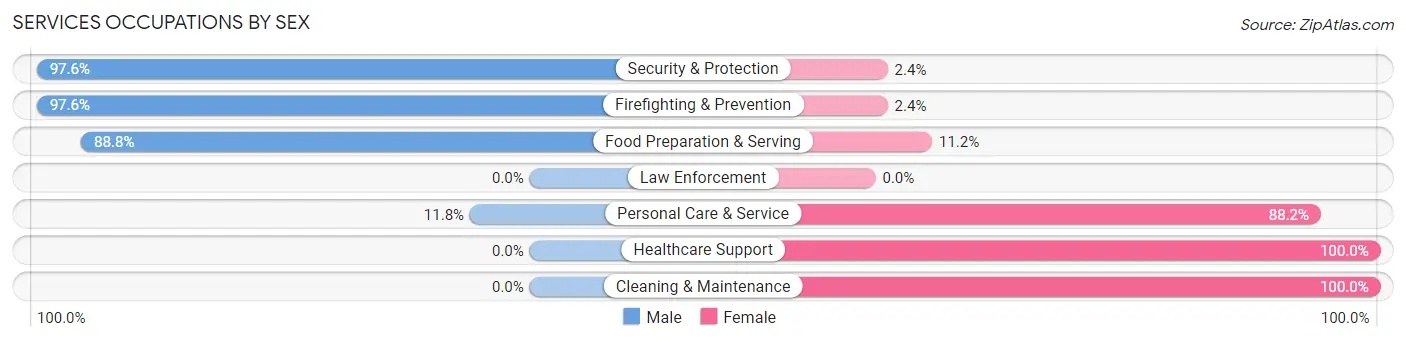
Services Occupations by Sex
Within the Services occupations in Breckenridge, the most male-oriented occupations are Security & Protection (97.6%), Firefighting & Prevention (97.6%), and Food Preparation & Serving (88.8%), while the most female-oriented occupations are Healthcare Support (100.0%), Cleaning & Maintenance (100.0%), and Personal Care & Service (88.2%).
| Occupation | Male | Female |
| Healthcare Support | 0 (0.0%) | 49 (100.0%) |
| Security & Protection | 163 (97.6%) | 4 (2.4%) |
| Firefighting & Prevention | 163 (97.6%) | 4 (2.4%) |
| Law Enforcement | 0 (0.0%) | 0 (0.0%) |
| Food Preparation & Serving | 127 (88.8%) | 16 (11.2%) |
| Cleaning & Maintenance | 0 (0.0%) | 46 (100.0%) |
| Personal Care & Service | 37 (11.8%) | 276 (88.2%) |
| Total (Category) | 327 (45.5%) | 391 (54.5%) |
| Total (Overall) | 1,770 (56.9%) | 1,341 (43.1%) |
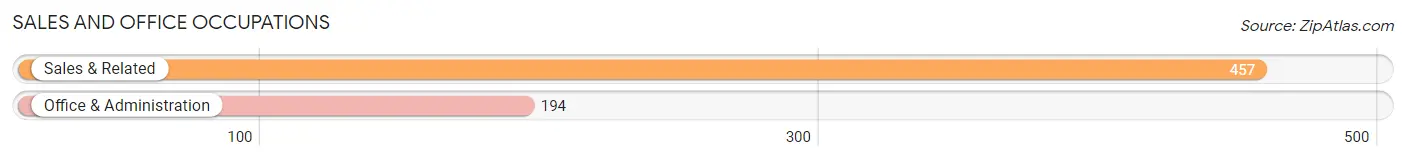
Sales and Office Occupations
The most common Sales and Office occupations in Breckenridge are Sales & Related (457 | 14.7%), and Office & Administration (194 | 6.2%).
Sales and Office Occupations by Sex
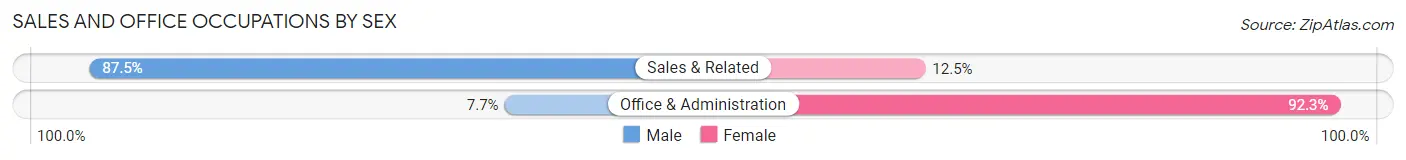
| Occupation | Male | Female |
| Sales & Related | 400 (87.5%) | 57 (12.5%) |
| Office & Administration | 15 (7.7%) | 179 (92.3%) |
| Total (Category) | 415 (63.7%) | 236 (36.2%) |
| Total (Overall) | 1,770 (56.9%) | 1,341 (43.1%) |
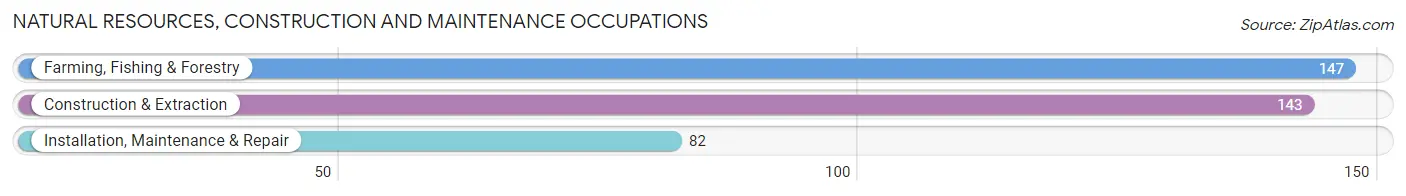
Natural Resources, Construction and Maintenance Occupations
The most common Natural Resources, Construction and Maintenance occupations in Breckenridge are Farming, Fishing & Forestry (147 | 4.7%), Construction & Extraction (143 | 4.6%), and Installation, Maintenance & Repair (82 | 2.6%).
Natural Resources, Construction and Maintenance Occupations by Sex
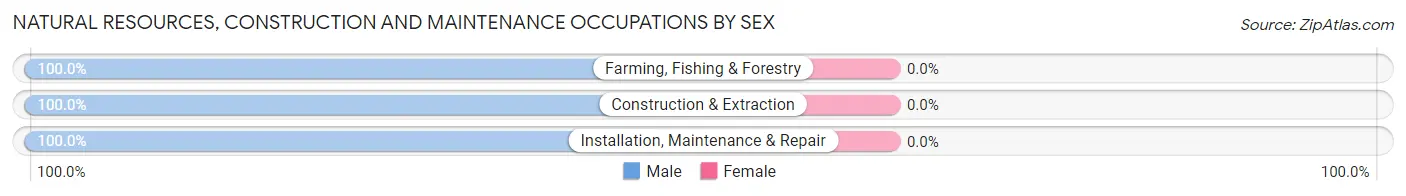
| Occupation | Male | Female |
| Farming, Fishing & Forestry | 147 (100.0%) | 0 (0.0%) |
| Construction & Extraction | 143 (100.0%) | 0 (0.0%) |
| Installation, Maintenance & Repair | 82 (100.0%) | 0 (0.0%) |
| Total (Category) | 372 (100.0%) | 0 (0.0%) |
| Total (Overall) | 1,770 (56.9%) | 1,341 (43.1%) |
Production, Transportation and Moving Occupations
The most common Production, Transportation and Moving occupations in Breckenridge are Material Moving (108 | 3.5%), Transportation (62 | 2.0%), and Production (38 | 1.2%).
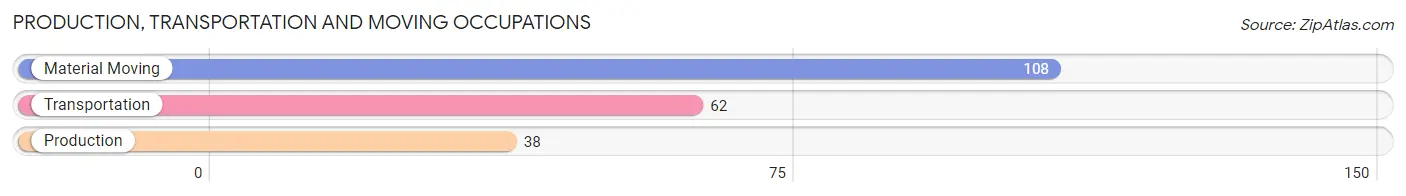
Production, Transportation and Moving Occupations by Sex
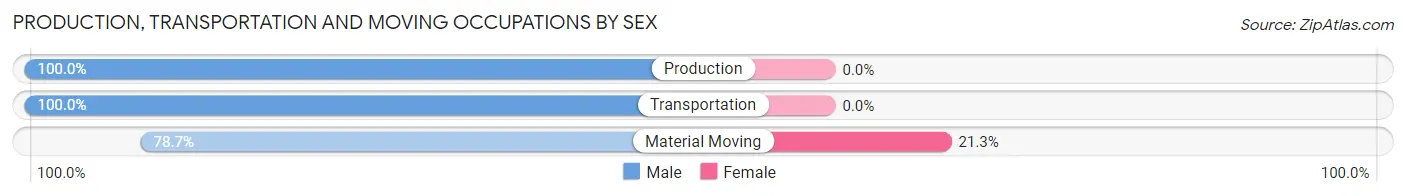
| Occupation | Male | Female |
| Production | 38 (100.0%) | 0 (0.0%) |
| Transportation | 62 (100.0%) | 0 (0.0%) |
| Material Moving | 85 (78.7%) | 23 (21.3%) |
| Total (Category) | 185 (88.9%) | 23 (11.1%) |
| Total (Overall) | 1,770 (56.9%) | 1,341 (43.1%) |
Employment Industries by Sex in Breckenridge
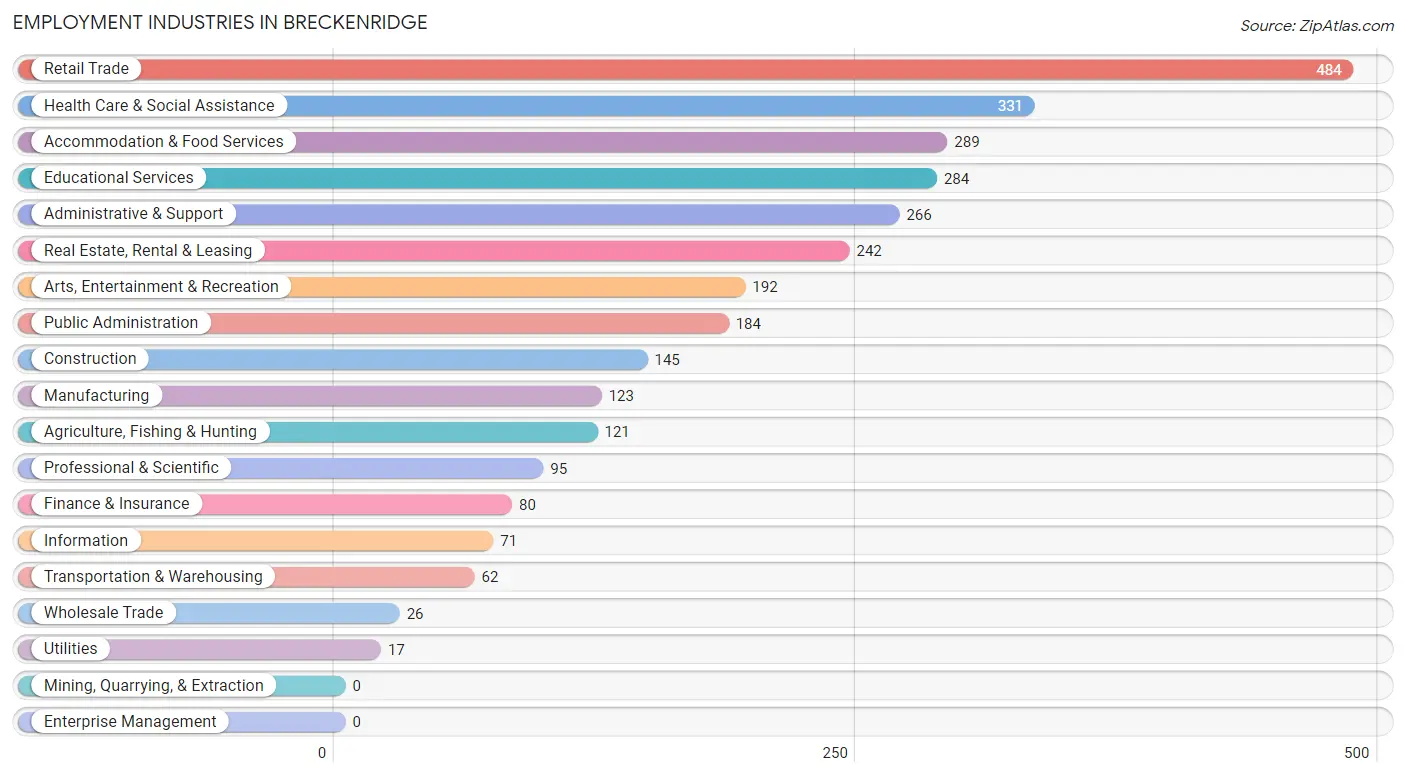
Employment Industries in Breckenridge
The major employment industries in Breckenridge include Retail Trade (484 | 15.6%), Health Care & Social Assistance (331 | 10.6%), Accommodation & Food Services (289 | 9.3%), Educational Services (284 | 9.1%), and Administrative & Support (266 | 8.6%).
Employment Industries by Sex in Breckenridge
The Breckenridge industries that see more men than women are Agriculture, Fishing & Hunting (100.0%), Manufacturing (100.0%), and Wholesale Trade (100.0%), whereas the industries that tend to have a higher number of women are Health Care & Social Assistance (95.5%), Professional & Scientific (81.0%), and Accommodation & Food Services (64.0%).
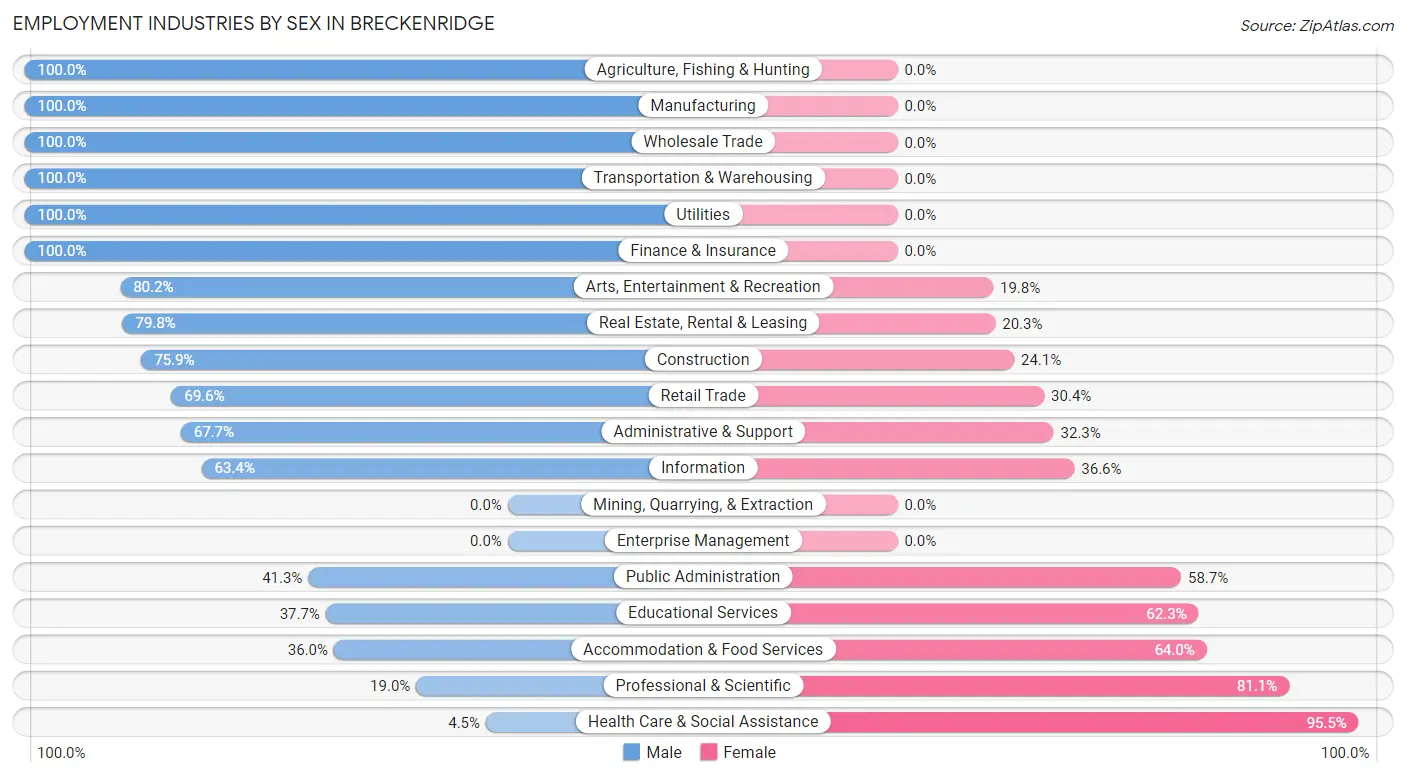
| Industry | Male | Female |
| Agriculture, Fishing & Hunting | 121 (100.0%) | 0 (0.0%) |
| Mining, Quarrying, & Extraction | 0 (0.0%) | 0 (0.0%) |
| Construction | 110 (75.9%) | 35 (24.1%) |
| Manufacturing | 123 (100.0%) | 0 (0.0%) |
| Wholesale Trade | 26 (100.0%) | 0 (0.0%) |
| Retail Trade | 337 (69.6%) | 147 (30.4%) |
| Transportation & Warehousing | 62 (100.0%) | 0 (0.0%) |
| Utilities | 17 (100.0%) | 0 (0.0%) |
| Information | 45 (63.4%) | 26 (36.6%) |
| Finance & Insurance | 80 (100.0%) | 0 (0.0%) |
| Real Estate, Rental & Leasing | 193 (79.7%) | 49 (20.3%) |
| Professional & Scientific | 18 (19.0%) | 77 (81.0%) |
| Enterprise Management | 0 (0.0%) | 0 (0.0%) |
| Administrative & Support | 180 (67.7%) | 86 (32.3%) |
| Educational Services | 107 (37.7%) | 177 (62.3%) |
| Health Care & Social Assistance | 15 (4.5%) | 316 (95.5%) |
| Arts, Entertainment & Recreation | 154 (80.2%) | 38 (19.8%) |
| Accommodation & Food Services | 104 (36.0%) | 185 (64.0%) |
| Public Administration | 76 (41.3%) | 108 (58.7%) |
| Total | 1,770 (56.9%) | 1,341 (43.1%) |
Education in Breckenridge
School Enrollment in Breckenridge
The most common levels of schooling among the 801 students in Breckenridge are elementary school (208 | 26.0%), middle school (192 | 24.0%), and college / undergraduate (173 | 21.6%).
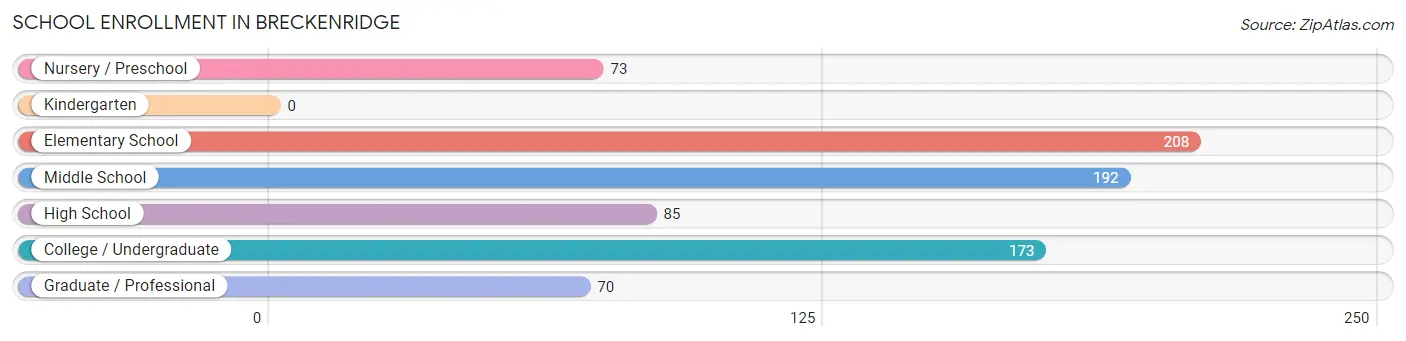
| School Level | # Students | % Students |
| Nursery / Preschool | 73 | 9.1% |
| Kindergarten | 0 | 0.0% |
| Elementary School | 208 | 26.0% |
| Middle School | 192 | 24.0% |
| High School | 85 | 10.6% |
| College / Undergraduate | 173 | 21.6% |
| Graduate / Professional | 70 | 8.7% |
| Total | 801 | 100.0% |
School Enrollment by Age by Funding Source in Breckenridge
Out of a total of 801 students who are enrolled in schools in Breckenridge, 83 (10.4%) attend a private institution, while the remaining 718 (89.6%) are enrolled in public schools. The age group of 35 years and over has the highest likelihood of being enrolled in private schools, with 10 (100.0% in the age bracket) enrolled. Conversely, the age group of 10 to 14 year olds has the lowest likelihood of being enrolled in a private school, with 192 (100.0% in the age bracket) attending a public institution.
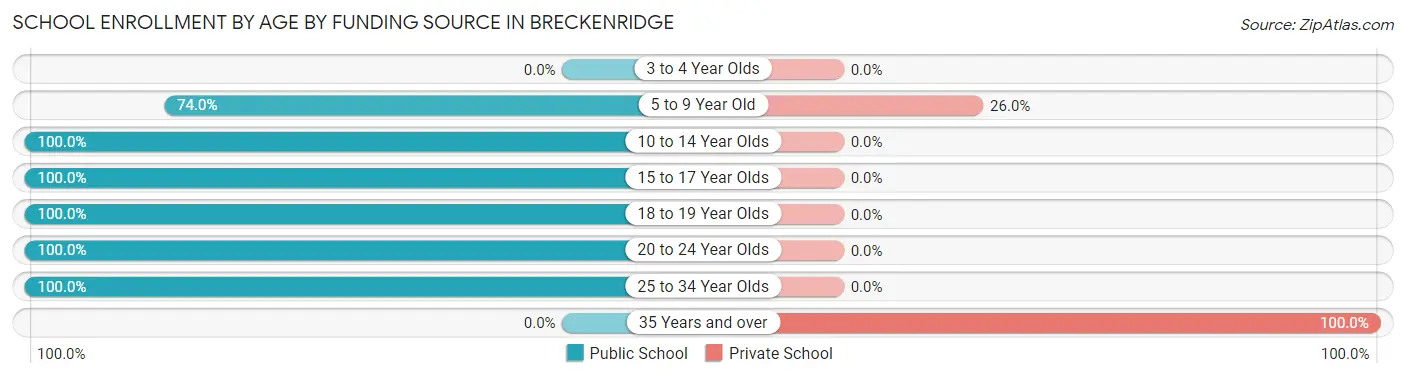
| Age Bracket | Public School | Private School |
| 3 to 4 Year Olds | 0 (0.0%) | 0 (0.0%) |
| 5 to 9 Year Old | 208 (74.0%) | 73 (26.0%) |
| 10 to 14 Year Olds | 192 (100.0%) | 0 (0.0%) |
| 15 to 17 Year Olds | 38 (100.0%) | 0 (0.0%) |
| 18 to 19 Year Olds | 120 (100.0%) | 0 (0.0%) |
| 20 to 24 Year Olds | 29 (100.0%) | 0 (0.0%) |
| 25 to 34 Year Olds | 131 (100.0%) | 0 (0.0%) |
| 35 Years and over | 0 (0.0%) | 10 (100.0%) |
| Total | 718 (89.6%) | 83 (10.4%) |
Educational Attainment by Field of Study in Breckenridge
Communications (295 | 13.0%), business (256 | 11.3%), education (239 | 10.5%), social sciences (238 | 10.5%), and arts & humanities (208 | 9.1%) are the most common fields of study among 2,272 individuals in Breckenridge who have obtained a bachelor's degree or higher.
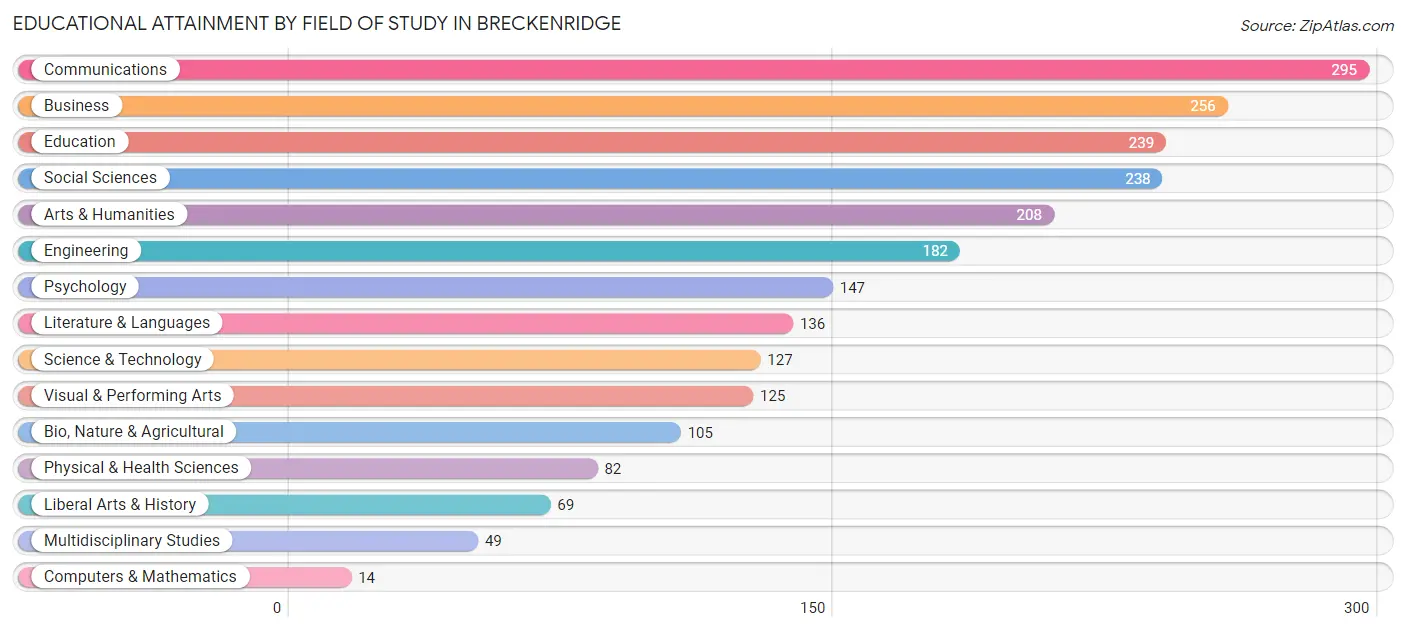
| Field of Study | # Graduates | % Graduates |
| Computers & Mathematics | 14 | 0.6% |
| Bio, Nature & Agricultural | 105 | 4.6% |
| Physical & Health Sciences | 82 | 3.6% |
| Psychology | 147 | 6.5% |
| Social Sciences | 238 | 10.5% |
| Engineering | 182 | 8.0% |
| Multidisciplinary Studies | 49 | 2.2% |
| Science & Technology | 127 | 5.6% |
| Business | 256 | 11.3% |
| Education | 239 | 10.5% |
| Literature & Languages | 136 | 6.0% |
| Liberal Arts & History | 69 | 3.0% |
| Visual & Performing Arts | 125 | 5.5% |
| Communications | 295 | 13.0% |
| Arts & Humanities | 208 | 9.1% |
| Total | 2,272 | 100.0% |
Transportation & Commute in Breckenridge
Vehicle Availability by Sex in Breckenridge
The most prevalent vehicle ownership categories in Breckenridge are males with 2 vehicles (631, accounting for 40.2%) and females with 2 vehicles (553, making up 48.3%).
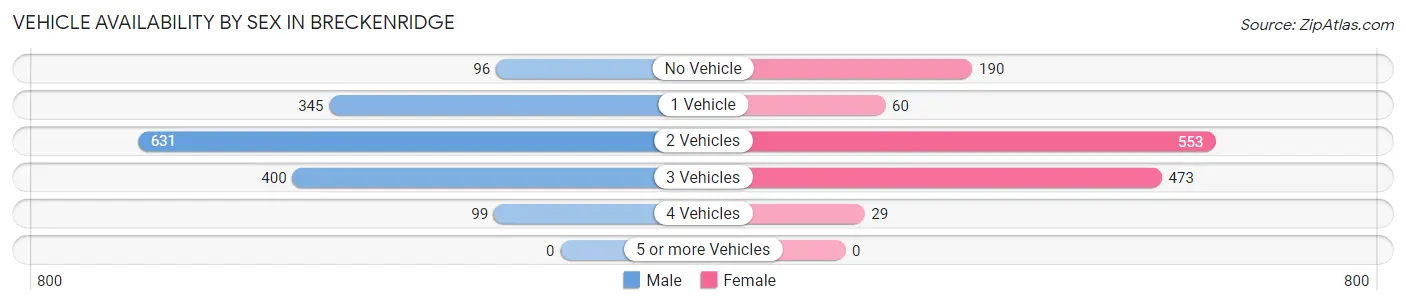
| Vehicles Available | Male | Female |
| No Vehicle | 96 (6.1%) | 190 (14.6%) |
| 1 Vehicle | 345 (22.0%) | 60 (4.6%) |
| 2 Vehicles | 631 (40.2%) | 553 (42.4%) |
| 3 Vehicles | 400 (25.5%) | 473 (36.2%) |
| 4 Vehicles | 99 (6.3%) | 29 (2.2%) |
| 5 or more Vehicles | 0 (0.0%) | 0 (0.0%) |
| Total | 1,571 (100.0%) | 1,305 (100.0%) |
Commute Time in Breckenridge
The most frequently occuring commute durations in Breckenridge are 5 to 9 minutes (615 commuters, 24.4%), 10 to 14 minutes (568 commuters, 22.5%), and 15 to 19 minutes (521 commuters, 20.7%).
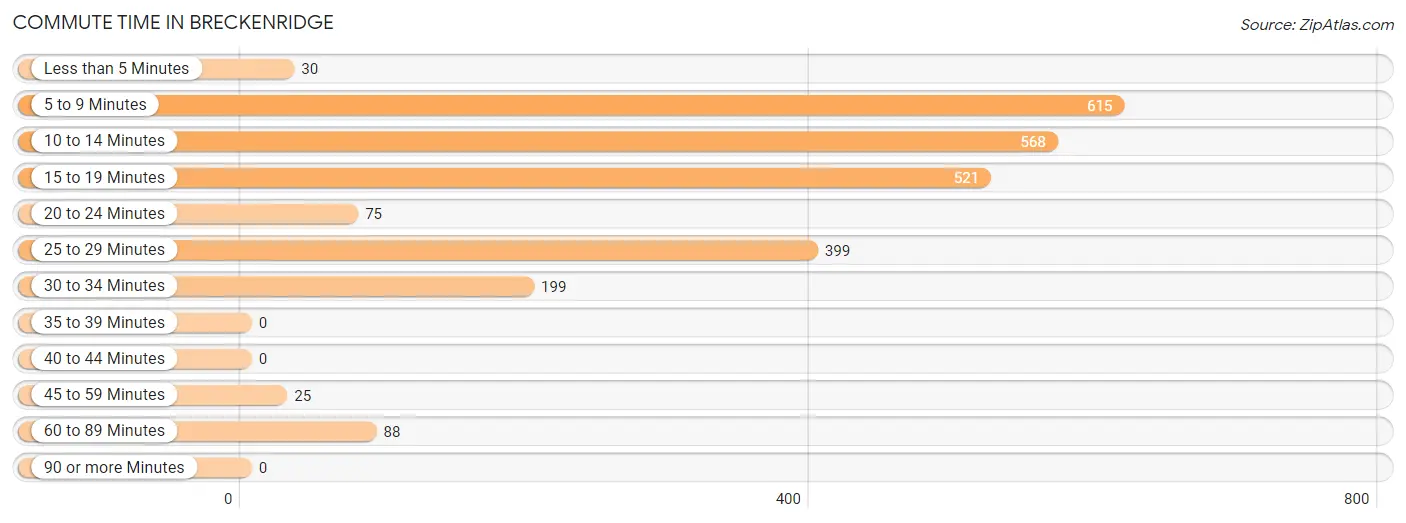
| Commute Time | # Commuters | % Commuters |
| Less than 5 Minutes | 30 | 1.2% |
| 5 to 9 Minutes | 615 | 24.4% |
| 10 to 14 Minutes | 568 | 22.5% |
| 15 to 19 Minutes | 521 | 20.7% |
| 20 to 24 Minutes | 75 | 3.0% |
| 25 to 29 Minutes | 399 | 15.8% |
| 30 to 34 Minutes | 199 | 7.9% |
| 35 to 39 Minutes | 0 | 0.0% |
| 40 to 44 Minutes | 0 | 0.0% |
| 45 to 59 Minutes | 25 | 1.0% |
| 60 to 89 Minutes | 88 | 3.5% |
| 90 or more Minutes | 0 | 0.0% |
Commute Time by Sex in Breckenridge
The most common commute times in Breckenridge are 5 to 9 minutes (469 commuters, 31.3%) for males and 15 to 19 minutes (337 commuters, 33.0%) for females.
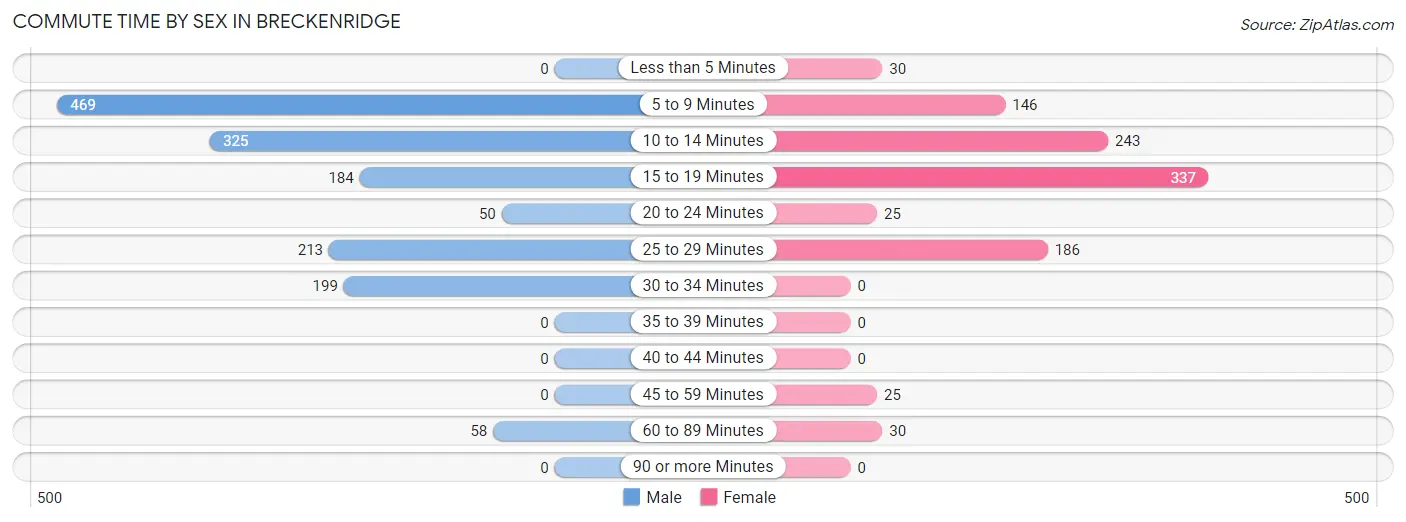
| Commute Time | Male | Female |
| Less than 5 Minutes | 0 (0.0%) | 30 (2.9%) |
| 5 to 9 Minutes | 469 (31.3%) | 146 (14.3%) |
| 10 to 14 Minutes | 325 (21.7%) | 243 (23.8%) |
| 15 to 19 Minutes | 184 (12.3%) | 337 (33.0%) |
| 20 to 24 Minutes | 50 (3.3%) | 25 (2.5%) |
| 25 to 29 Minutes | 213 (14.2%) | 186 (18.2%) |
| 30 to 34 Minutes | 199 (13.3%) | 0 (0.0%) |
| 35 to 39 Minutes | 0 (0.0%) | 0 (0.0%) |
| 40 to 44 Minutes | 0 (0.0%) | 0 (0.0%) |
| 45 to 59 Minutes | 0 (0.0%) | 25 (2.5%) |
| 60 to 89 Minutes | 58 (3.9%) | 30 (2.9%) |
| 90 or more Minutes | 0 (0.0%) | 0 (0.0%) |
Time of Departure to Work by Sex in Breckenridge
The most frequent times of departure to work in Breckenridge are 7:00 AM to 7:29 AM (337, 22.5%) for males and 8:00 AM to 8:29 AM (245, 24.0%) for females.
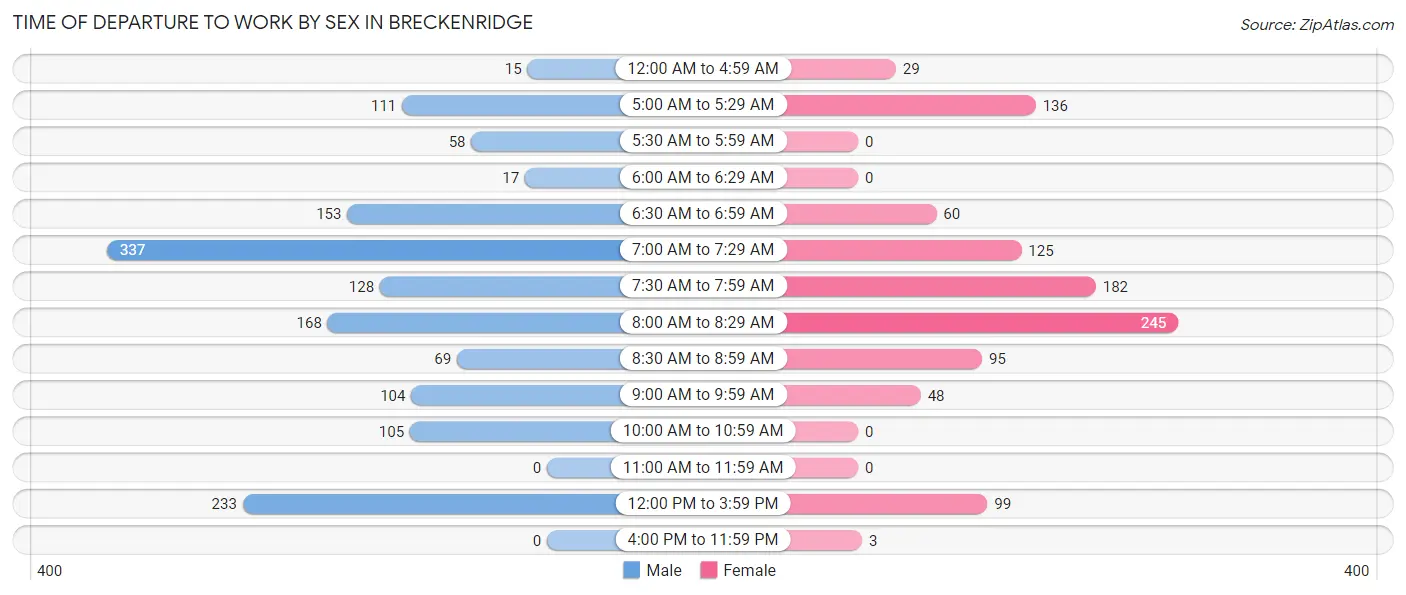
| Time of Departure | Male | Female |
| 12:00 AM to 4:59 AM | 15 (1.0%) | 29 (2.8%) |
| 5:00 AM to 5:29 AM | 111 (7.4%) | 136 (13.3%) |
| 5:30 AM to 5:59 AM | 58 (3.9%) | 0 (0.0%) |
| 6:00 AM to 6:29 AM | 17 (1.1%) | 0 (0.0%) |
| 6:30 AM to 6:59 AM | 153 (10.2%) | 60 (5.9%) |
| 7:00 AM to 7:29 AM | 337 (22.5%) | 125 (12.2%) |
| 7:30 AM to 7:59 AM | 128 (8.5%) | 182 (17.8%) |
| 8:00 AM to 8:29 AM | 168 (11.2%) | 245 (24.0%) |
| 8:30 AM to 8:59 AM | 69 (4.6%) | 95 (9.3%) |
| 9:00 AM to 9:59 AM | 104 (6.9%) | 48 (4.7%) |
| 10:00 AM to 10:59 AM | 105 (7.0%) | 0 (0.0%) |
| 11:00 AM to 11:59 AM | 0 (0.0%) | 0 (0.0%) |
| 12:00 PM to 3:59 PM | 233 (15.5%) | 99 (9.7%) |
| 4:00 PM to 11:59 PM | 0 (0.0%) | 3 (0.3%) |
| Total | 1,498 (100.0%) | 1,022 (100.0%) |
Housing Occupancy in Breckenridge
Occupancy by Ownership in Breckenridge
Of the total 1,972 dwellings in Breckenridge, owner-occupied units account for 1,316 (66.7%), while renter-occupied units make up 656 (33.3%).
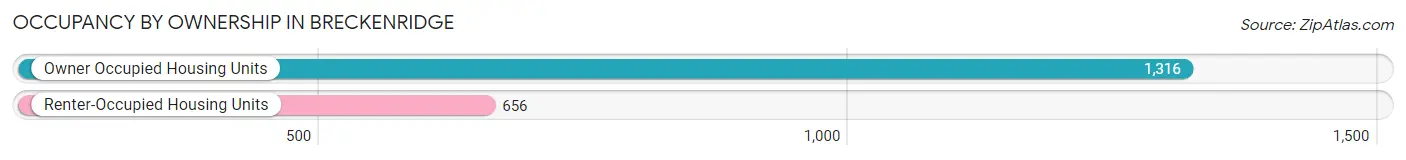
| Occupancy | # Housing Units | % Housing Units |
| Owner Occupied Housing Units | 1,316 | 66.7% |
| Renter-Occupied Housing Units | 656 | 33.3% |
| Total Occupied Housing Units | 1,972 | 100.0% |
Occupancy by Household Size in Breckenridge
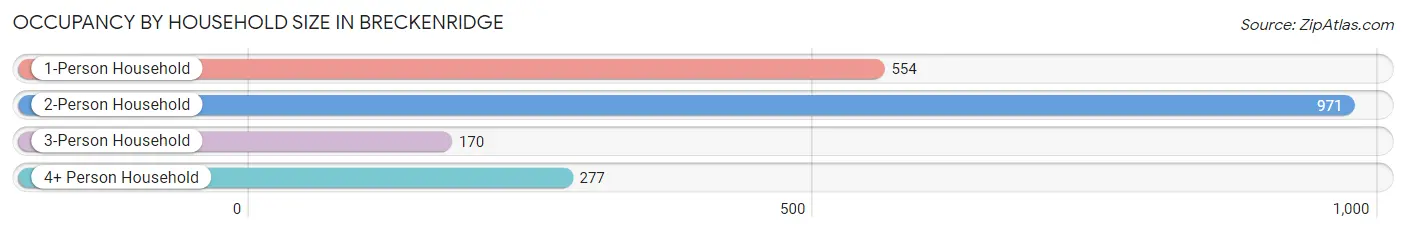
| Household Size | # Housing Units | % Housing Units |
| 1-Person Household | 554 | 28.1% |
| 2-Person Household | 971 | 49.2% |
| 3-Person Household | 170 | 8.6% |
| 4+ Person Household | 277 | 14.1% |
| Total Housing Units | 1,972 | 100.0% |
Occupancy by Ownership by Household Size in Breckenridge
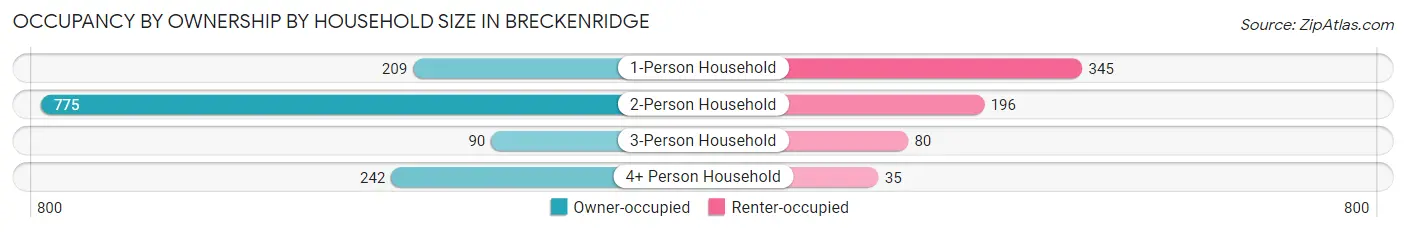
| Household Size | Owner-occupied | Renter-occupied |
| 1-Person Household | 209 (37.7%) | 345 (62.3%) |
| 2-Person Household | 775 (79.8%) | 196 (20.2%) |
| 3-Person Household | 90 (52.9%) | 80 (47.1%) |
| 4+ Person Household | 242 (87.4%) | 35 (12.6%) |
| Total Housing Units | 1,316 (66.7%) | 656 (33.3%) |
Occupancy by Educational Attainment in Breckenridge
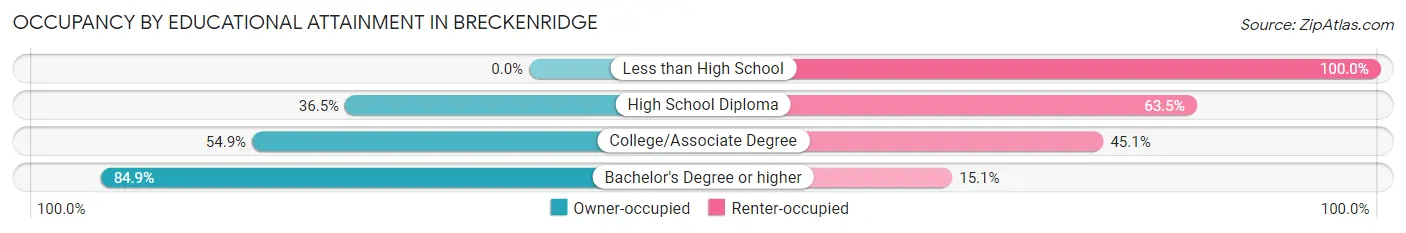
| Household Size | Owner-occupied | Renter-occupied |
| Less than High School | 0 (0.0%) | 23 (100.0%) |
| High School Diploma | 127 (36.5%) | 221 (63.5%) |
| College/Associate Degree | 312 (54.9%) | 256 (45.1%) |
| Bachelor's Degree or higher | 877 (84.9%) | 156 (15.1%) |
Occupancy by Age of Householder in Breckenridge
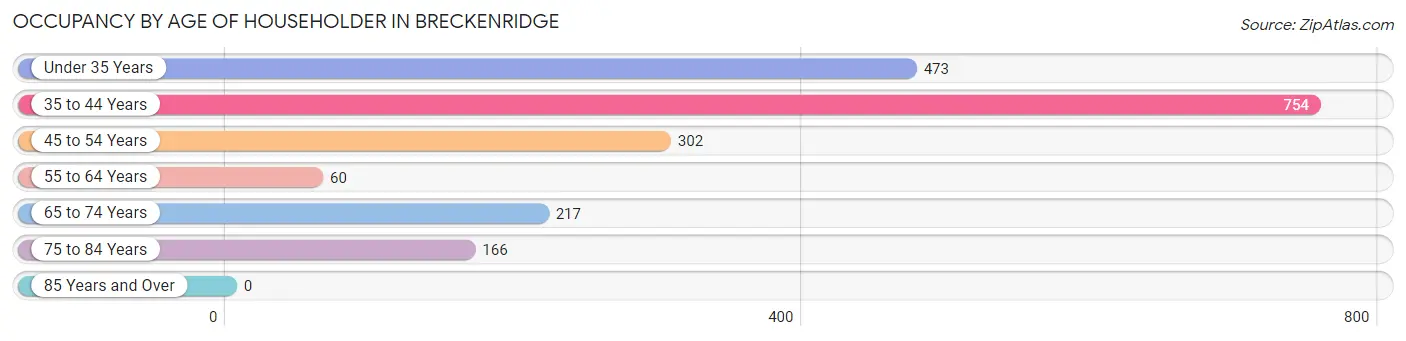
| Age Bracket | # Households | % Households |
| Under 35 Years | 473 | 24.0% |
| 35 to 44 Years | 754 | 38.2% |
| 45 to 54 Years | 302 | 15.3% |
| 55 to 64 Years | 60 | 3.0% |
| 65 to 74 Years | 217 | 11.0% |
| 75 to 84 Years | 166 | 8.4% |
| 85 Years and Over | 0 | 0.0% |
| Total | 1,972 | 100.0% |
Housing Finances in Breckenridge
Median Income by Occupancy in Breckenridge
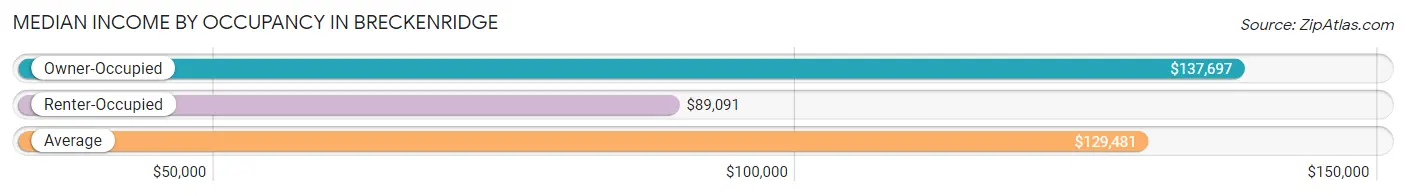
| Occupancy Type | # Households | Median Income |
| Owner-Occupied | 1,316 (66.7%) | $137,697 |
| Renter-Occupied | 656 (33.3%) | $89,091 |
| Average | 1,972 (100.0%) | $129,481 |
Occupancy by Householder Income Bracket in Breckenridge
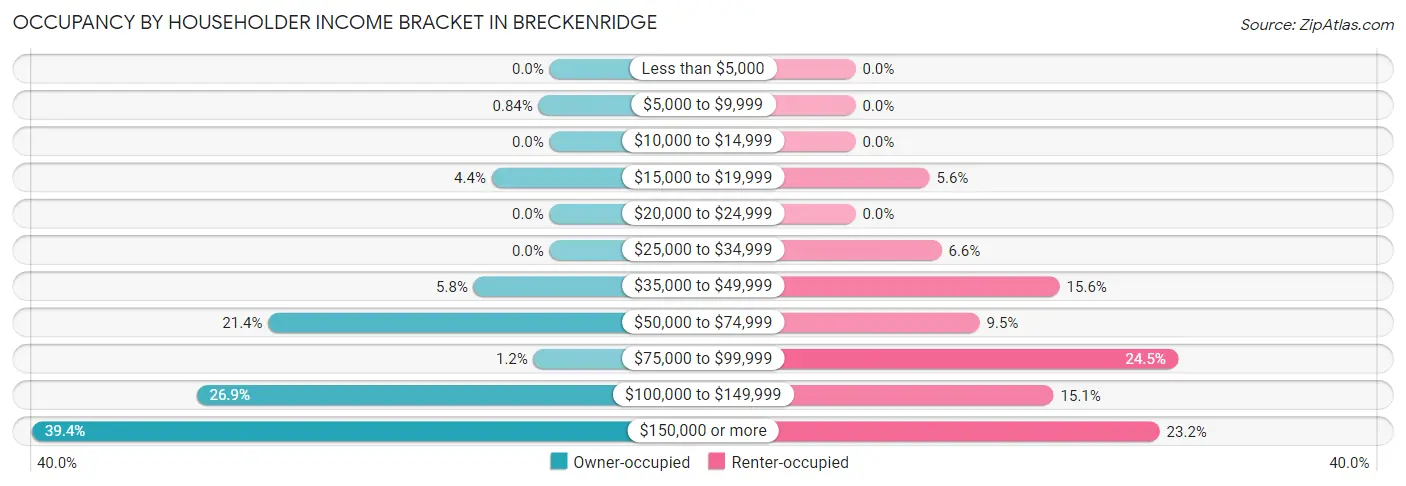
| Income Bracket | Owner-occupied | Renter-occupied |
| Less than $5,000 | 0 (0.0%) | 0 (0.0%) |
| $5,000 to $9,999 | 11 (0.8%) | 0 (0.0%) |
| $10,000 to $14,999 | 0 (0.0%) | 0 (0.0%) |
| $15,000 to $19,999 | 58 (4.4%) | 37 (5.6%) |
| $20,000 to $24,999 | 0 (0.0%) | 0 (0.0%) |
| $25,000 to $34,999 | 0 (0.0%) | 43 (6.6%) |
| $35,000 to $49,999 | 76 (5.8%) | 102 (15.5%) |
| $50,000 to $74,999 | 282 (21.4%) | 62 (9.5%) |
| $75,000 to $99,999 | 16 (1.2%) | 161 (24.5%) |
| $100,000 to $149,999 | 354 (26.9%) | 99 (15.1%) |
| $150,000 or more | 519 (39.4%) | 152 (23.2%) |
| Total | 1,316 (100.0%) | 656 (100.0%) |
Monthly Housing Cost Tiers in Breckenridge
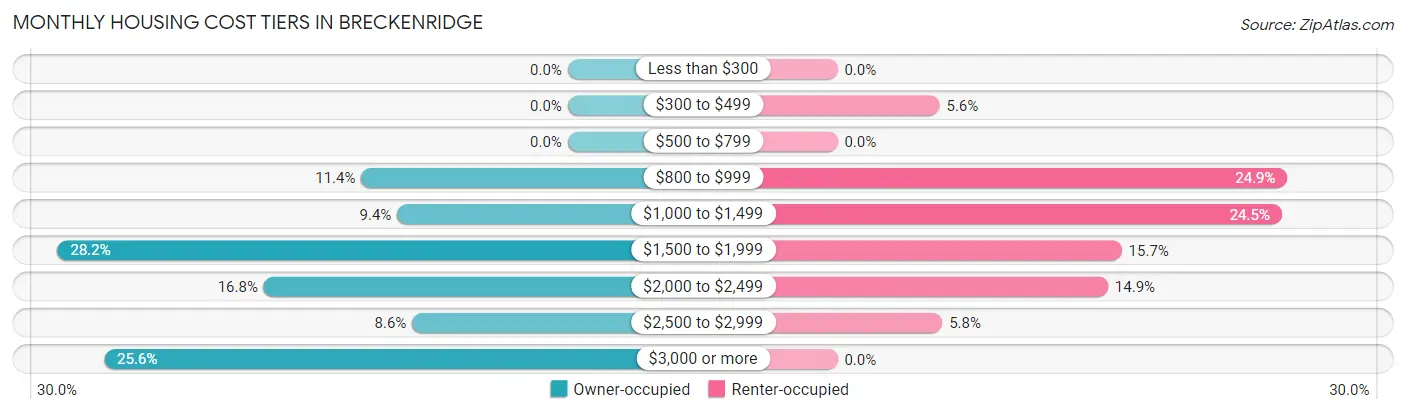
| Monthly Cost | Owner-occupied | Renter-occupied |
| Less than $300 | 0 (0.0%) | 0 (0.0%) |
| $300 to $499 | 0 (0.0%) | 37 (5.6%) |
| $500 to $799 | 0 (0.0%) | 0 (0.0%) |
| $800 to $999 | 150 (11.4%) | 163 (24.8%) |
| $1,000 to $1,499 | 124 (9.4%) | 161 (24.5%) |
| $1,500 to $1,999 | 371 (28.2%) | 103 (15.7%) |
| $2,000 to $2,499 | 221 (16.8%) | 98 (14.9%) |
| $2,500 to $2,999 | 113 (8.6%) | 38 (5.8%) |
| $3,000 or more | 337 (25.6%) | 0 (0.0%) |
| Total | 1,316 (100.0%) | 656 (100.0%) |
Physical Housing Characteristics in Breckenridge
Housing Structures in Breckenridge
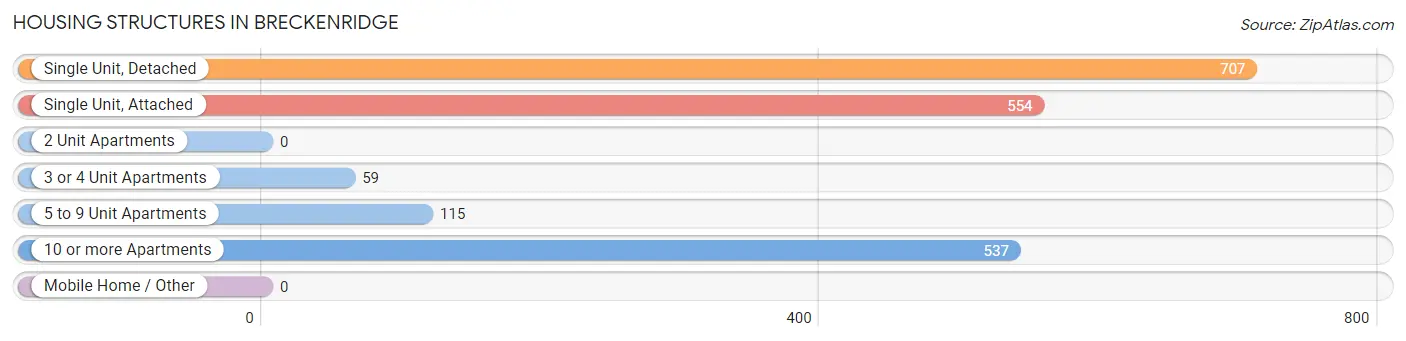
| Structure Type | # Housing Units | % Housing Units |
| Single Unit, Detached | 707 | 35.8% |
| Single Unit, Attached | 554 | 28.1% |
| 2 Unit Apartments | 0 | 0.0% |
| 3 or 4 Unit Apartments | 59 | 3.0% |
| 5 to 9 Unit Apartments | 115 | 5.8% |
| 10 or more Apartments | 537 | 27.2% |
| Mobile Home / Other | 0 | 0.0% |
| Total | 1,972 | 100.0% |
Housing Structures by Occupancy in Breckenridge
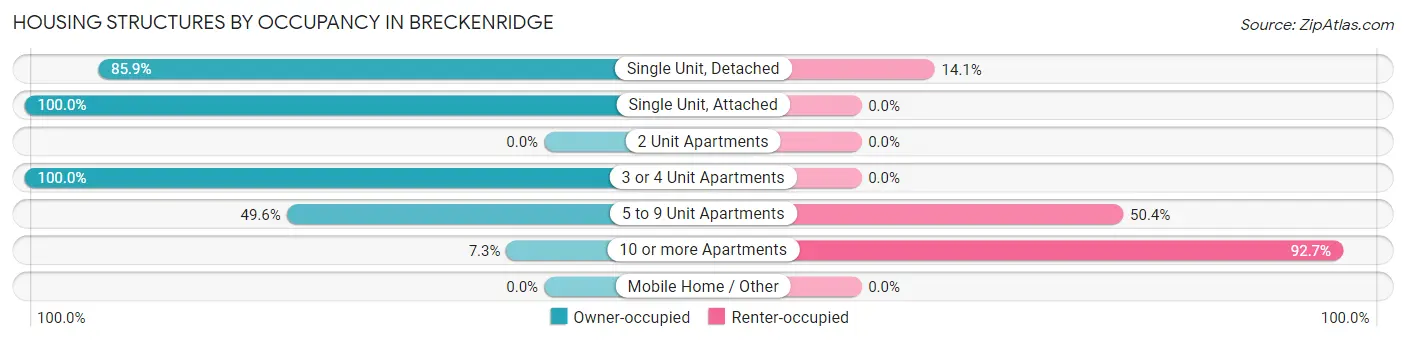
| Structure Type | Owner-occupied | Renter-occupied |
| Single Unit, Detached | 607 (85.9%) | 100 (14.1%) |
| Single Unit, Attached | 554 (100.0%) | 0 (0.0%) |
| 2 Unit Apartments | 0 (0.0%) | 0 (0.0%) |
| 3 or 4 Unit Apartments | 59 (100.0%) | 0 (0.0%) |
| 5 to 9 Unit Apartments | 57 (49.6%) | 58 (50.4%) |
| 10 or more Apartments | 39 (7.3%) | 498 (92.7%) |
| Mobile Home / Other | 0 (0.0%) | 0 (0.0%) |
| Total | 1,316 (66.7%) | 656 (33.3%) |
Housing Structures by Number of Rooms in Breckenridge
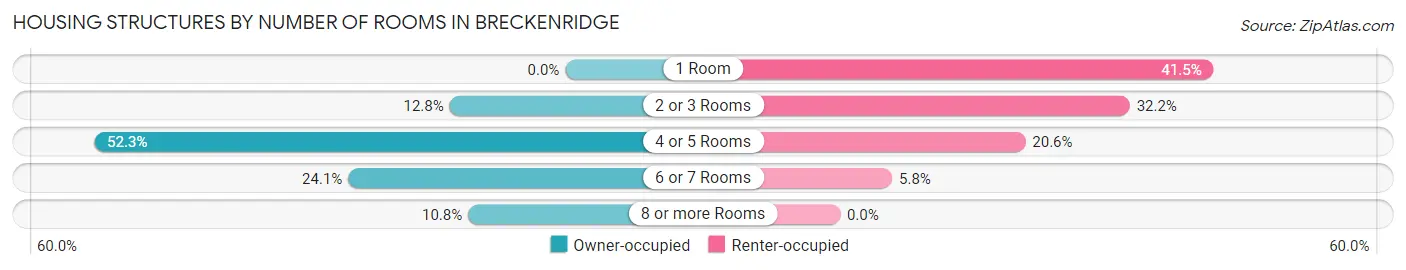
| Number of Rooms | Owner-occupied | Renter-occupied |
| 1 Room | 0 (0.0%) | 272 (41.5%) |
| 2 or 3 Rooms | 169 (12.8%) | 211 (32.2%) |
| 4 or 5 Rooms | 688 (52.3%) | 135 (20.6%) |
| 6 or 7 Rooms | 317 (24.1%) | 38 (5.8%) |
| 8 or more Rooms | 142 (10.8%) | 0 (0.0%) |
| Total | 1,316 (100.0%) | 656 (100.0%) |
Housing Structure by Heating Type in Breckenridge
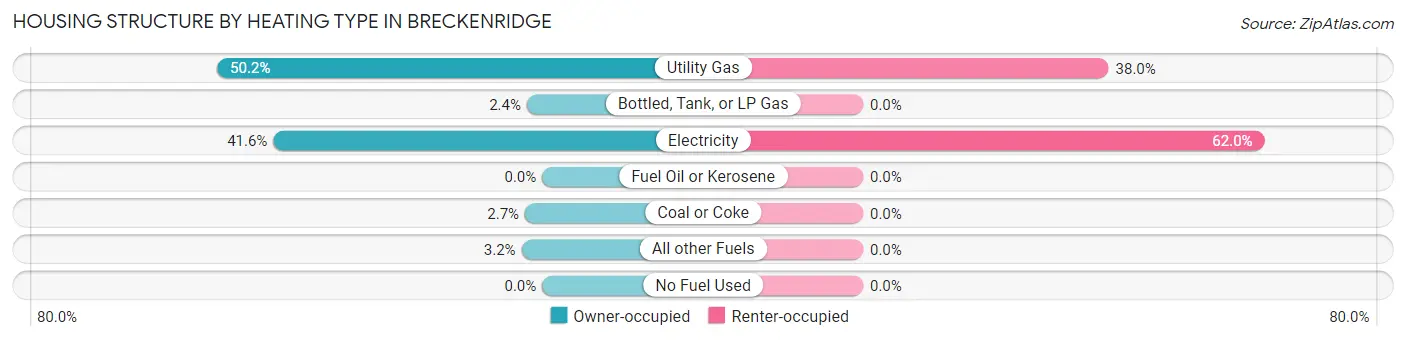
| Heating Type | Owner-occupied | Renter-occupied |
| Utility Gas | 661 (50.2%) | 249 (38.0%) |
| Bottled, Tank, or LP Gas | 31 (2.4%) | 0 (0.0%) |
| Electricity | 547 (41.6%) | 407 (62.0%) |
| Fuel Oil or Kerosene | 0 (0.0%) | 0 (0.0%) |
| Coal or Coke | 35 (2.7%) | 0 (0.0%) |
| All other Fuels | 42 (3.2%) | 0 (0.0%) |
| No Fuel Used | 0 (0.0%) | 0 (0.0%) |
| Total | 1,316 (100.0%) | 656 (100.0%) |
Household Vehicle Usage in Breckenridge
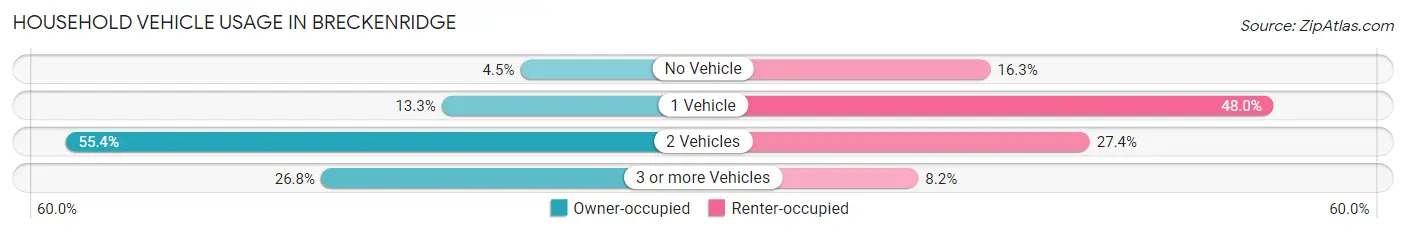
| Vehicles per Household | Owner-occupied | Renter-occupied |
| No Vehicle | 59 (4.5%) | 107 (16.3%) |
| 1 Vehicle | 175 (13.3%) | 315 (48.0%) |
| 2 Vehicles | 729 (55.4%) | 180 (27.4%) |
| 3 or more Vehicles | 353 (26.8%) | 54 (8.2%) |
| Total | 1,316 (100.0%) | 656 (100.0%) |
Real Estate & Mortgages in Breckenridge
Real Estate and Mortgage Overview in Breckenridge
| Characteristic | Without Mortgage | With Mortgage |
| Housing Units | 231 | 1,085 |
| Median Property Value | $1,747,100 | $608,900 |
| Median Household Income | $129,854 | $477 |
| Monthly Housing Costs | $955 | $337 |
| Real Estate Taxes | $7,594 | $59 |
Property Value by Mortgage Status in Breckenridge
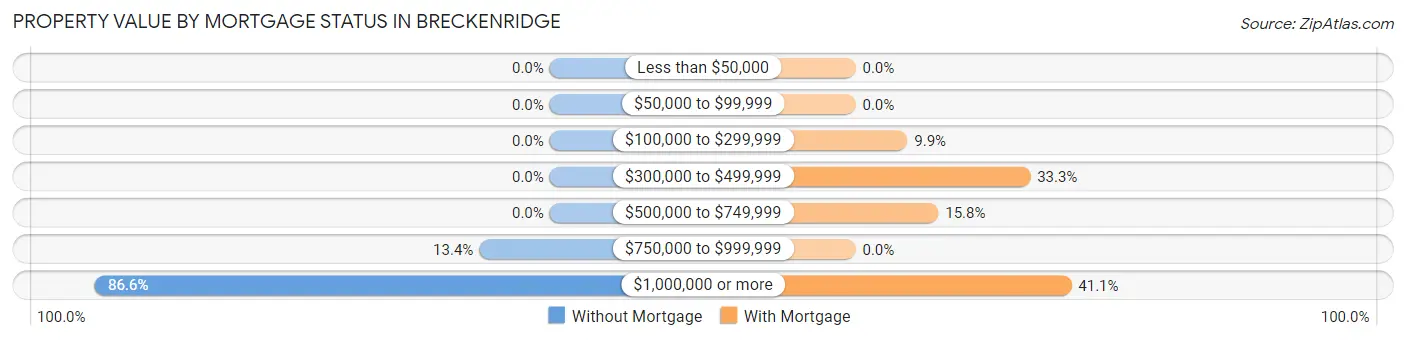
| Property Value | Without Mortgage | With Mortgage |
| Less than $50,000 | 0 (0.0%) | 0 (0.0%) |
| $50,000 to $99,999 | 0 (0.0%) | 0 (0.0%) |
| $100,000 to $299,999 | 0 (0.0%) | 107 (9.9%) |
| $300,000 to $499,999 | 0 (0.0%) | 361 (33.3%) |
| $500,000 to $749,999 | 0 (0.0%) | 171 (15.8%) |
| $750,000 to $999,999 | 31 (13.4%) | 0 (0.0%) |
| $1,000,000 or more | 200 (86.6%) | 446 (41.1%) |
| Total | 231 (100.0%) | 1,085 (100.0%) |
Household Income by Mortgage Status in Breckenridge
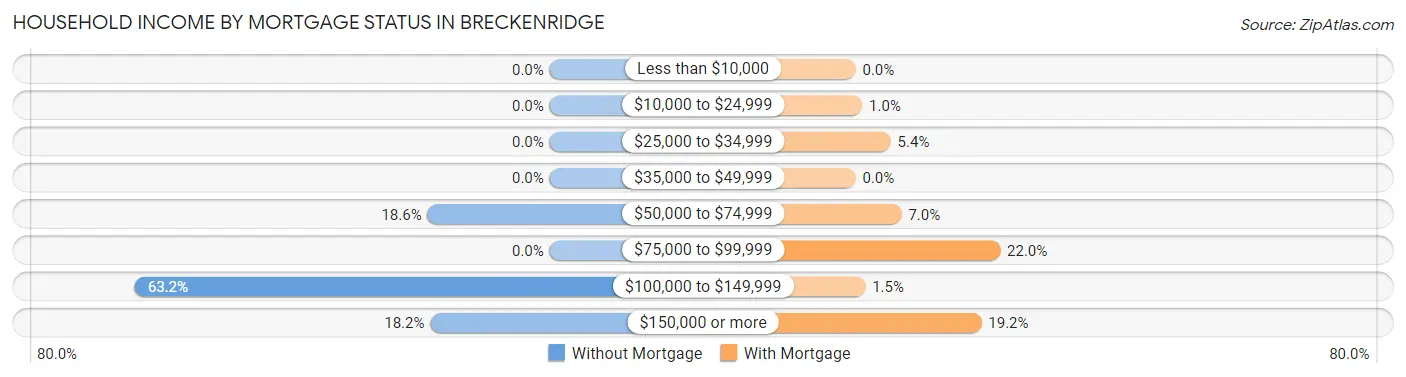
| Household Income | Without Mortgage | With Mortgage |
| Less than $10,000 | 0 (0.0%) | 0 (0.0%) |
| $10,000 to $24,999 | 0 (0.0%) | 11 (1.0%) |
| $25,000 to $34,999 | 0 (0.0%) | 58 (5.3%) |
| $35,000 to $49,999 | 0 (0.0%) | 0 (0.0%) |
| $50,000 to $74,999 | 43 (18.6%) | 76 (7.0%) |
| $75,000 to $99,999 | 0 (0.0%) | 239 (22.0%) |
| $100,000 to $149,999 | 146 (63.2%) | 16 (1.5%) |
| $150,000 or more | 42 (18.2%) | 208 (19.2%) |
| Total | 231 (100.0%) | 1,085 (100.0%) |
Property Value to Household Income Ratio in Breckenridge
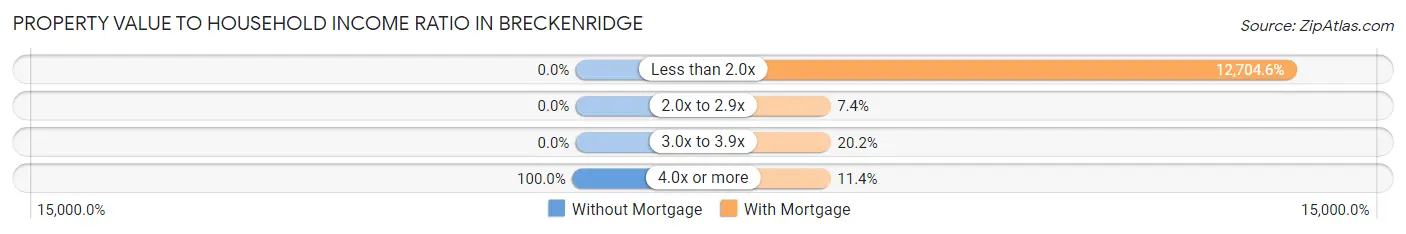
| Value-to-Income Ratio | Without Mortgage | With Mortgage |
| Less than 2.0x | 0 (0.0%) | 137,845 (12,704.6%) |
| 2.0x to 2.9x | 0 (0.0%) | 80 (7.4%) |
| 3.0x to 3.9x | 0 (0.0%) | 219 (20.2%) |
| 4.0x or more | 231 (100.0%) | 124 (11.4%) |
| Total | 231 (100.0%) | 1,085 (100.0%) |
Real Estate Taxes by Mortgage Status in Breckenridge
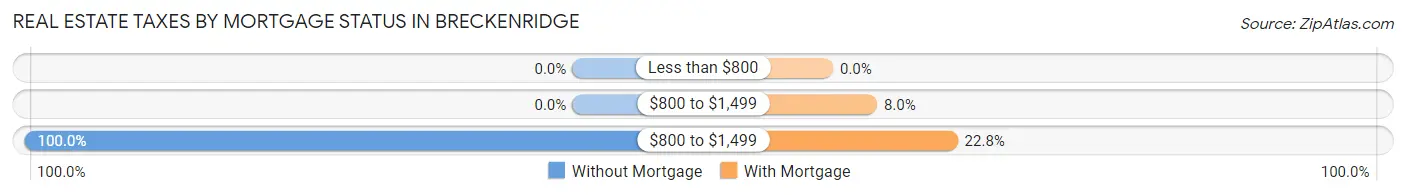
| Property Taxes | Without Mortgage | With Mortgage |
| Less than $800 | 0 (0.0%) | 0 (0.0%) |
| $800 to $1,499 | 0 (0.0%) | 87 (8.0%) |
| $800 to $1,499 | 231 (100.0%) | 247 (22.8%) |
| Total | 231 (100.0%) | 1,085 (100.0%) |
Health & Disability in Breckenridge
Health Insurance Coverage by Age in Breckenridge
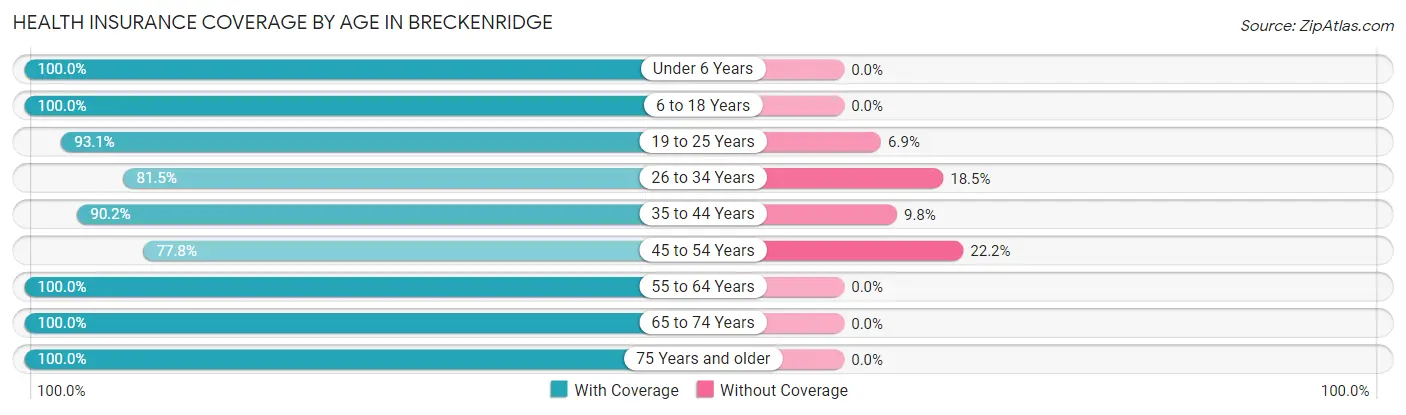
| Age Bracket | With Coverage | Without Coverage |
| Under 6 Years | 385 (100.0%) | 0 (0.0%) |
| 6 to 18 Years | 489 (100.0%) | 0 (0.0%) |
| 19 to 25 Years | 393 (93.1%) | 29 (6.9%) |
| 26 to 34 Years | 658 (81.5%) | 149 (18.5%) |
| 35 to 44 Years | 1,274 (90.2%) | 139 (9.8%) |
| 45 to 54 Years | 354 (77.8%) | 101 (22.2%) |
| 55 to 64 Years | 152 (100.0%) | 0 (0.0%) |
| 65 to 74 Years | 513 (100.0%) | 0 (0.0%) |
| 75 Years and older | 331 (100.0%) | 0 (0.0%) |
| Total | 4,549 (91.6%) | 418 (8.4%) |
Health Insurance Coverage by Citizenship Status in Breckenridge
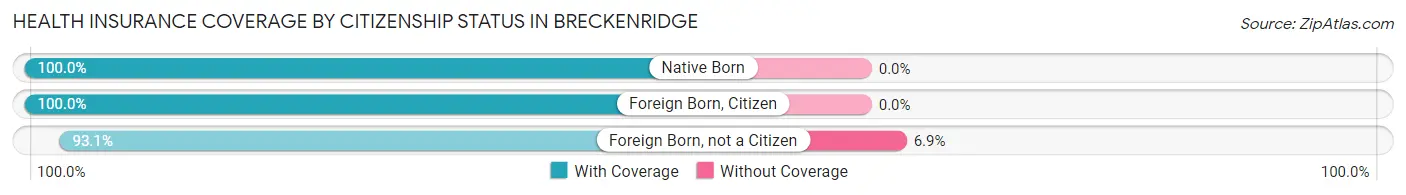
| Citizenship Status | With Coverage | Without Coverage |
| Native Born | 385 (100.0%) | 0 (0.0%) |
| Foreign Born, Citizen | 489 (100.0%) | 0 (0.0%) |
| Foreign Born, not a Citizen | 393 (93.1%) | 29 (6.9%) |
Health Insurance Coverage by Household Income in Breckenridge
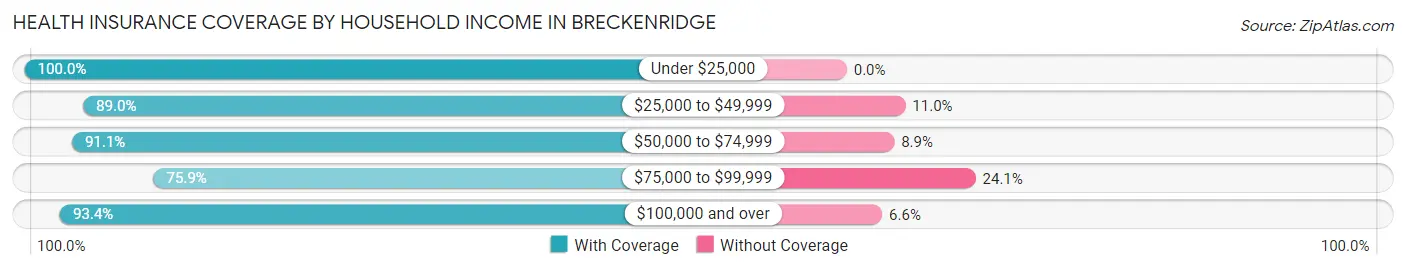
| Household Income | With Coverage | Without Coverage |
| Under $25,000 | 200 (100.0%) | 0 (0.0%) |
| $25,000 to $49,999 | 235 (89.0%) | 29 (11.0%) |
| $50,000 to $74,999 | 595 (91.1%) | 58 (8.9%) |
| $75,000 to $99,999 | 286 (75.9%) | 91 (24.1%) |
| $100,000 and over | 3,167 (93.4%) | 225 (6.6%) |
Public vs Private Health Insurance Coverage by Age in Breckenridge
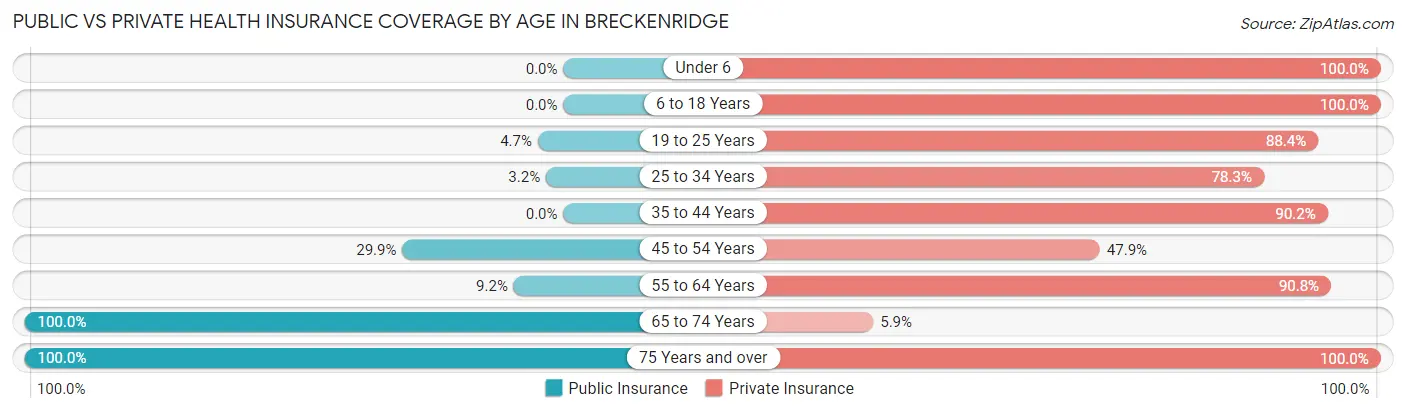
| Age Bracket | Public Insurance | Private Insurance |
| Under 6 | 0 (0.0%) | 385 (100.0%) |
| 6 to 18 Years | 0 (0.0%) | 489 (100.0%) |
| 19 to 25 Years | 20 (4.7%) | 373 (88.4%) |
| 25 to 34 Years | 26 (3.2%) | 632 (78.3%) |
| 35 to 44 Years | 0 (0.0%) | 1,274 (90.2%) |
| 45 to 54 Years | 136 (29.9%) | 218 (47.9%) |
| 55 to 64 Years | 14 (9.2%) | 138 (90.8%) |
| 65 to 74 Years | 513 (100.0%) | 30 (5.9%) |
| 75 Years and over | 331 (100.0%) | 331 (100.0%) |
| Total | 1,040 (20.9%) | 3,870 (77.9%) |
Disability Status by Sex by Age in Breckenridge
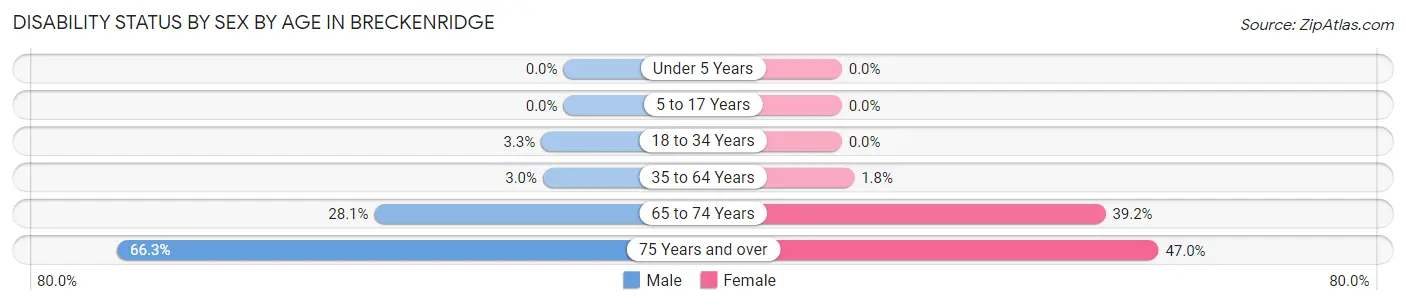
| Age Bracket | Male | Female |
| Under 5 Years | 0 (0.0%) | 0 (0.0%) |
| 5 to 17 Years | 0 (0.0%) | 0 (0.0%) |
| 18 to 34 Years | 20 (3.3%) | 0 (0.0%) |
| 35 to 64 Years | 35 (3.0%) | 16 (1.8%) |
| 65 to 74 Years | 78 (28.1%) | 92 (39.2%) |
| 75 Years and over | 108 (66.3%) | 79 (47.0%) |
Disability Class by Sex by Age in Breckenridge
Disability Class: Hearing Difficulty
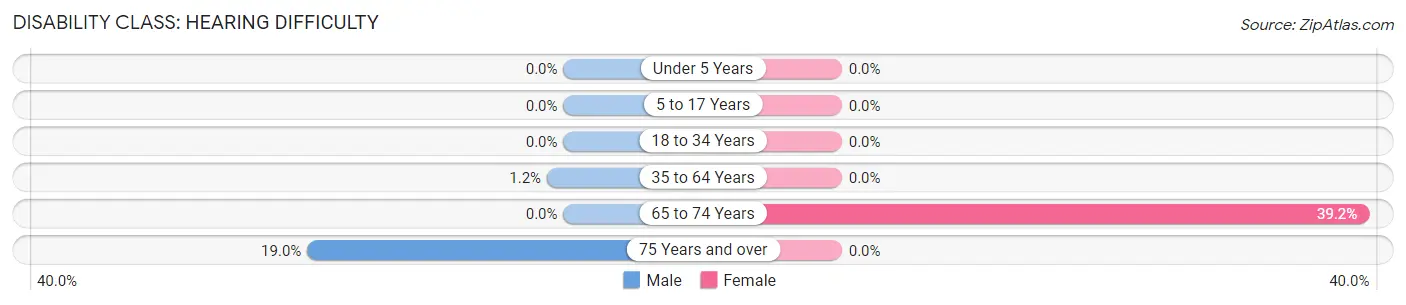
| Age Bracket | Male | Female |
| Under 5 Years | 0 (0.0%) | 0 (0.0%) |
| 5 to 17 Years | 0 (0.0%) | 0 (0.0%) |
| 18 to 34 Years | 0 (0.0%) | 0 (0.0%) |
| 35 to 64 Years | 14 (1.2%) | 0 (0.0%) |
| 65 to 74 Years | 0 (0.0%) | 92 (39.2%) |
| 75 Years and over | 31 (19.0%) | 0 (0.0%) |
Disability Class: Vision Difficulty
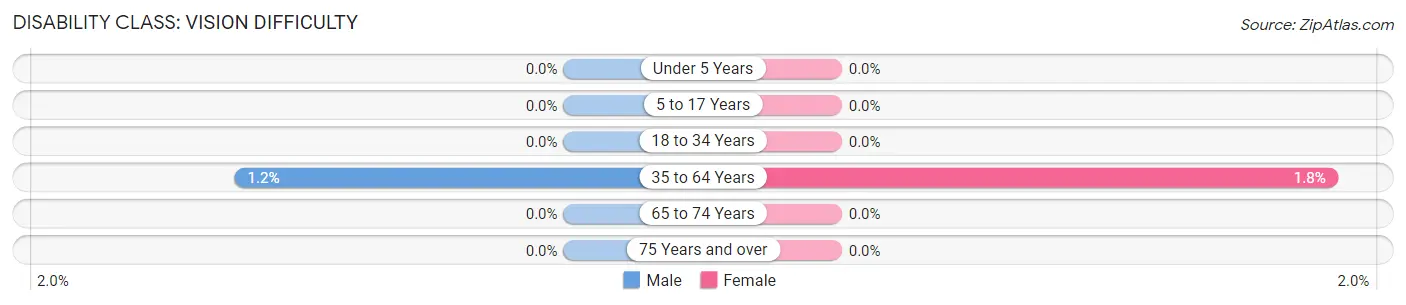
| Age Bracket | Male | Female |
| Under 5 Years | 0 (0.0%) | 0 (0.0%) |
| 5 to 17 Years | 0 (0.0%) | 0 (0.0%) |
| 18 to 34 Years | 0 (0.0%) | 0 (0.0%) |
| 35 to 64 Years | 14 (1.2%) | 16 (1.8%) |
| 65 to 74 Years | 0 (0.0%) | 0 (0.0%) |
| 75 Years and over | 0 (0.0%) | 0 (0.0%) |
Disability Class: Cognitive Difficulty
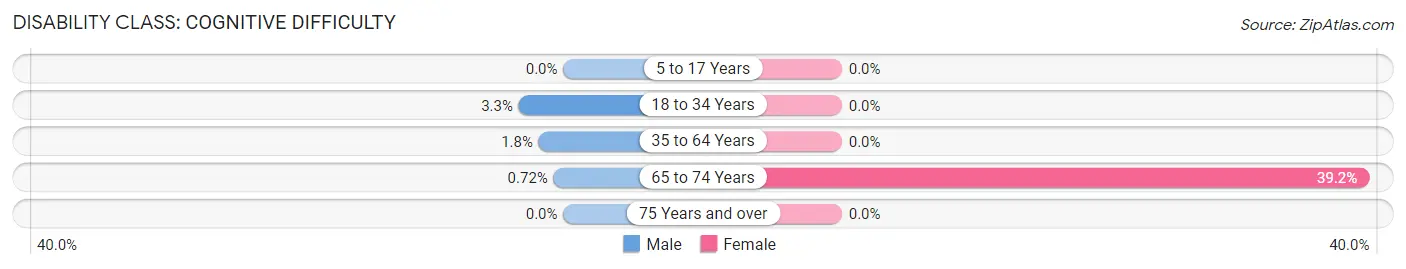
| Age Bracket | Male | Female |
| 5 to 17 Years | 0 (0.0%) | 0 (0.0%) |
| 18 to 34 Years | 20 (3.3%) | 0 (0.0%) |
| 35 to 64 Years | 21 (1.8%) | 0 (0.0%) |
| 65 to 74 Years | 2 (0.7%) | 92 (39.2%) |
| 75 Years and over | 0 (0.0%) | 0 (0.0%) |
Disability Class: Ambulatory Difficulty
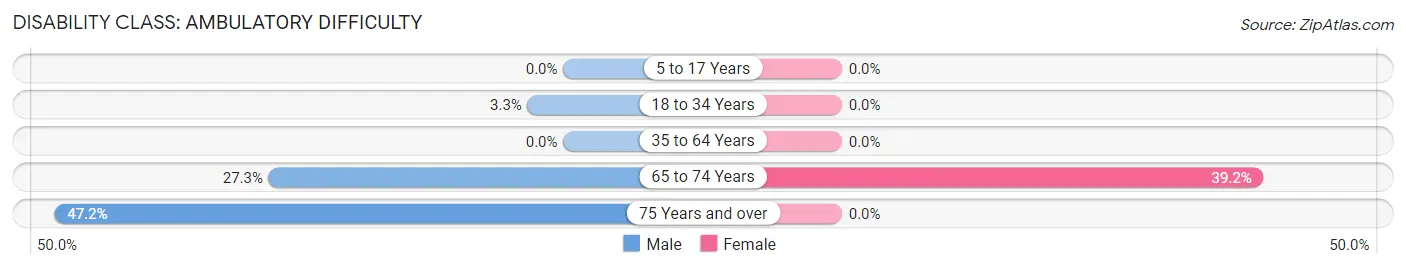
| Age Bracket | Male | Female |
| 5 to 17 Years | 0 (0.0%) | 0 (0.0%) |
| 18 to 34 Years | 20 (3.3%) | 0 (0.0%) |
| 35 to 64 Years | 0 (0.0%) | 0 (0.0%) |
| 65 to 74 Years | 76 (27.3%) | 92 (39.2%) |
| 75 Years and over | 77 (47.2%) | 0 (0.0%) |
Disability Class: Self-Care Difficulty
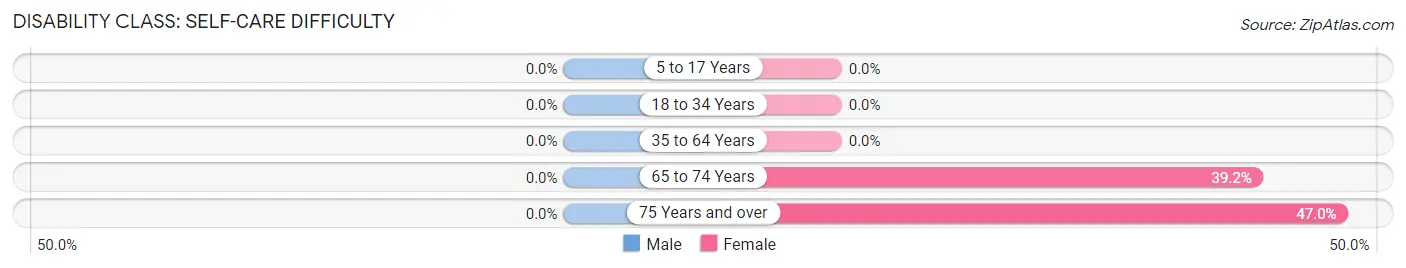
| Age Bracket | Male | Female |
| 5 to 17 Years | 0 (0.0%) | 0 (0.0%) |
| 18 to 34 Years | 0 (0.0%) | 0 (0.0%) |
| 35 to 64 Years | 0 (0.0%) | 0 (0.0%) |
| 65 to 74 Years | 0 (0.0%) | 92 (39.2%) |
| 75 Years and over | 0 (0.0%) | 79 (47.0%) |
Technology Access in Breckenridge
Computing Device Access in Breckenridge
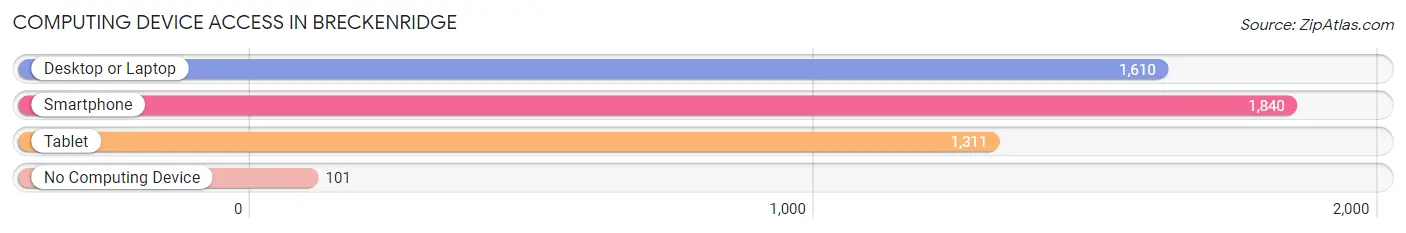
| Device Type | # Households | % Households |
| Desktop or Laptop | 1,610 | 81.6% |
| Smartphone | 1,840 | 93.3% |
| Tablet | 1,311 | 66.5% |
| No Computing Device | 101 | 5.1% |
| Total | 1,972 | 100.0% |
Internet Access in Breckenridge
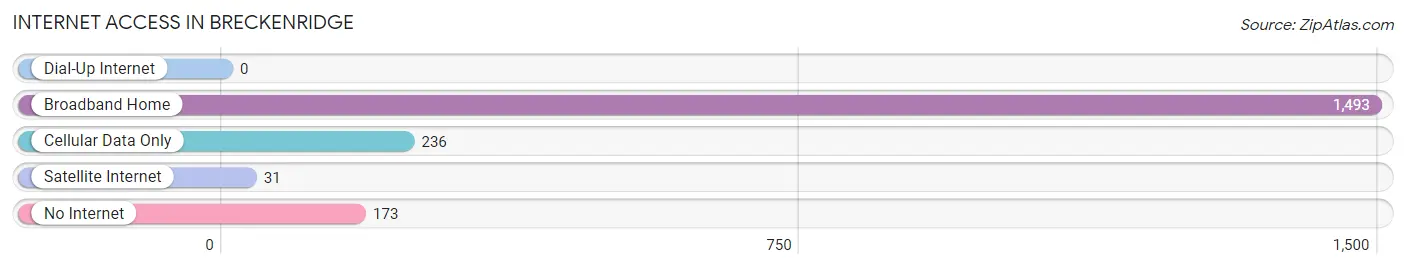
| Internet Type | # Households | % Households |
| Dial-Up Internet | 0 | 0.0% |
| Broadband Home | 1,493 | 75.7% |
| Cellular Data Only | 236 | 12.0% |
| Satellite Internet | 31 | 1.6% |
| No Internet | 173 | 8.8% |
| Total | 1,972 | 100.0% |
Breckenridge Summary
Breckenridge, Colorado is a small mountain town located in Summit County, Colorado. It is situated in the Rocky Mountains, approximately two hours west of Denver. The town is known for its ski resort, which is one of the most popular ski resorts in the United States. Breckenridge is also home to a vibrant arts and culture scene, as well as a variety of outdoor activities.
History
Breckenridge was founded in 1859 during the Colorado Gold Rush. The town was named after John C. Breckinridge, the 14th Vice President of the United States. The town quickly grew as prospectors flocked to the area in search of gold. By the late 1800s, Breckenridge had become a bustling mining town with a population of over 2,000 people.
The town’s fortunes changed in the early 1900s when the gold mines began to run dry. Many of the miners left the area in search of new opportunities. In the 1950s, the town was revitalized when the first ski resort was built. The ski resort quickly became a popular destination for skiers and snowboarders from around the world.
Geography
Breckenridge is located in the Rocky Mountains of Colorado, approximately two hours west of Denver. The town is situated at an elevation of 9,600 feet, making it one of the highest towns in the United States. The town is surrounded by the White River National Forest, which provides a variety of outdoor activities such as hiking, biking, and skiing.
The town is located in a valley surrounded by mountains. The highest peak in the area is Mount Quandary, which stands at 14,265 feet. The town is also located near several other ski resorts, including Copper Mountain, Keystone, and Arapahoe Basin.
Economy
Breckenridge’s economy is largely driven by tourism. The town’s ski resort is one of the most popular ski resorts in the United States, attracting thousands of visitors each year. The town also has a vibrant arts and culture scene, with a variety of galleries, museums, and theaters.
The town also has a thriving retail sector, with a variety of shops and restaurants. The town is also home to several corporate offices, including Vail Resorts, which owns the Breckenridge Ski Resort.
Demographics
As of the 2010 census, the population of Breckenridge was 4,540. The town has a median age of 36.7 years, with a gender ratio of 51.2% female and 48.8% male. The town is predominantly white, with a population that is 94.2% white, 2.2% Hispanic or Latino, 1.2% Asian, and 0.7% African American.
The median household income in Breckenridge is $77,857, and the median home value is $717,400. The town has a low unemployment rate of 2.7%. The town also has a high cost of living, with a cost of living index of 132.7.
Conclusion
Breckenridge, Colorado is a small mountain town located in Summit County, Colorado. The town is known for its ski resort, which is one of the most popular ski resorts in the United States. Breckenridge is also home to a vibrant arts and culture scene, as well as a variety of outdoor activities. The town’s economy is largely driven by tourism, and the town has a median household income of $77,857 and a median home value of $717,400. The town is predominantly white, with a population that is 94.2% white, 2.2% Hispanic or Latino, 1.2% Asian, and 0.7% African American.
Common Questions
What is Per Capita Income in Breckenridge?
Per Capita income in Breckenridge is $55,848.
What is the Median Family Income in Breckenridge?
Median Family Income in Breckenridge is $139,507.
What is the Median Household income in Breckenridge?
Median Household Income in Breckenridge is $129,481.
What is Income or Wage Gap in Breckenridge?
Income or Wage Gap in Breckenridge is 18.2%.
Women in Breckenridge earn 81.8 cents for every dollar earned by a man.
What is Inequality or Gini Index in Breckenridge?
Inequality or Gini Index in Breckenridge is 0.34.
What is the Total Population of Breckenridge?
Total Population of Breckenridge is 5,017.
What is the Total Male Population of Breckenridge?
Total Male Population of Breckenridge is 2,693.
What is the Total Female Population of Breckenridge?
Total Female Population of Breckenridge is 2,324.
What is the Ratio of Males per 100 Females in Breckenridge?
There are 115.88 Males per 100 Females in Breckenridge.
What is the Ratio of Females per 100 Males in Breckenridge?
There are 86.30 Females per 100 Males in Breckenridge.
What is the Median Population Age in Breckenridge?
Median Population Age in Breckenridge is 37.2 Years.
What is the Average Family Size in Breckenridge
Average Family Size in Breckenridge is 2.9 People.
What is the Average Household Size in Breckenridge
Average Household Size in Breckenridge is 2.5 People.
How Large is the Labor Force in Breckenridge?
There are 3,133 People in the Labor Forcein in Breckenridge.
What is the Percentage of People in the Labor Force in Breckenridge?
74.7% of People are in the Labor Force in Breckenridge.
What is the Unemployment Rate in Breckenridge?
Unemployment Rate in Breckenridge is 0.6%.