Derby, CT Map & Demographics
Derby Map
Derby Overview
$40,298
PER CAPITA INCOME
$103,003
AVG FAMILY INCOME
$69,835
AVG HOUSEHOLD INCOME
8.3%
WAGE / INCOME GAP [ % ]
91.7¢/ $1
WAGE / INCOME GAP [ $ ]
0.46
INEQUALITY / GINI INDEX
12,373
TOTAL POPULATION
5,533
MALE POPULATION
6,840
FEMALE POPULATION
80.89
MALES / 100 FEMALES
123.62
FEMALES / 100 MALES
46.0
MEDIAN AGE
2.8
AVG FAMILY SIZE
2.1
AVG HOUSEHOLD SIZE
6,790
LABOR FORCE [ PEOPLE ]
63.8%
PERCENT IN LABOR FORCE
6.1%
UNEMPLOYMENT RATE
Derby Zip Codes
Income in Derby
Income Overview in Derby
Per Capita Income in Derby is $40,298, while median incomes of families and households are $103,003 and $69,835 respectively.
| Characteristic | Number | Measure |
| Per Capita Income | 12,373 | $40,298 |
| Median Family Income | 3,345 | $103,003 |
| Mean Family Income | 3,345 | $108,387 |
| Median Household Income | 5,713 | $69,835 |
| Mean Household Income | 5,713 | $83,410 |
| Income Deficit | 3,345 | $0 |
| Wage / Income Gap (%) | 12,373 | 8.34% |
| Wage / Income Gap ($) | 12,373 | 91.66¢ per $1 |
| Gini / Inequality Index | 12,373 | 0.46 |
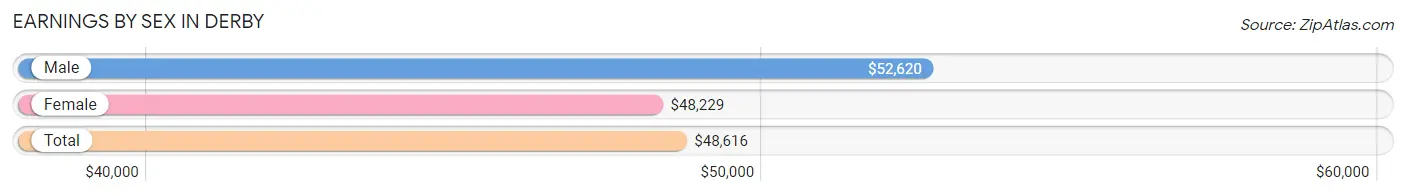
Earnings by Sex in Derby
Average Earnings in Derby are $48,616, $52,620 for men and $48,229 for women, a difference of 8.3%.
| Sex | Number | Average Earnings |
| Male | 3,172 (46.7%) | $52,620 |
| Female | 3,625 (53.3%) | $48,229 |
| Total | 6,797 (100.0%) | $48,616 |
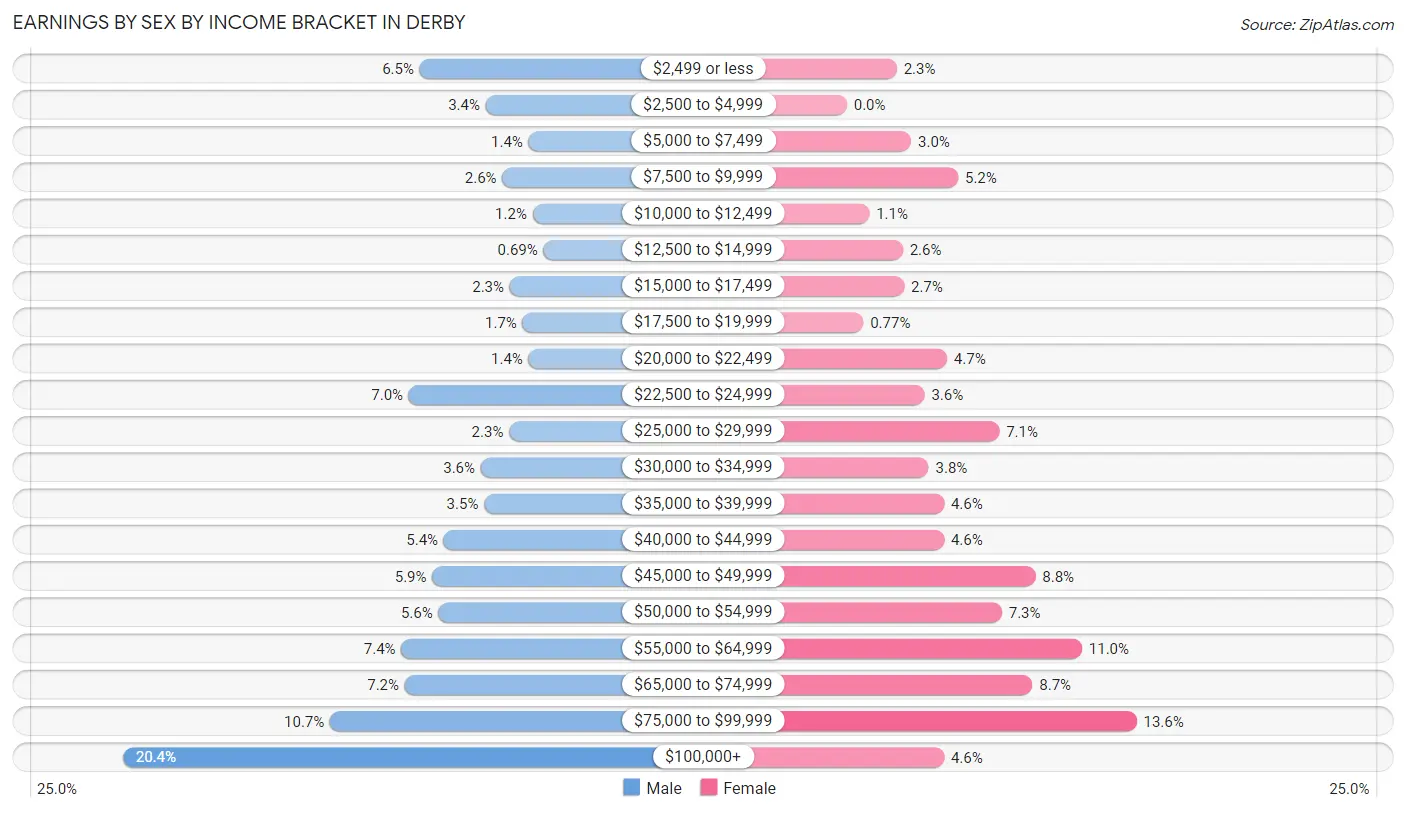
Earnings by Sex by Income Bracket in Derby
The most common earnings brackets in Derby are $100,000+ for men (647 | 20.4%) and $75,000 to $99,999 for women (492 | 13.6%).
| Income | Male | Female |
| $2,499 or less | 206 (6.5%) | 85 (2.3%) |
| $2,500 to $4,999 | 108 (3.4%) | 0 (0.0%) |
| $5,000 to $7,499 | 44 (1.4%) | 109 (3.0%) |
| $7,500 to $9,999 | 83 (2.6%) | 189 (5.2%) |
| $10,000 to $12,499 | 38 (1.2%) | 38 (1.1%) |
| $12,500 to $14,999 | 22 (0.7%) | 95 (2.6%) |
| $15,000 to $17,499 | 72 (2.3%) | 97 (2.7%) |
| $17,500 to $19,999 | 53 (1.7%) | 28 (0.8%) |
| $20,000 to $22,499 | 44 (1.4%) | 170 (4.7%) |
| $22,500 to $24,999 | 222 (7.0%) | 132 (3.6%) |
| $25,000 to $29,999 | 73 (2.3%) | 259 (7.1%) |
| $30,000 to $34,999 | 115 (3.6%) | 139 (3.8%) |
| $35,000 to $39,999 | 110 (3.5%) | 165 (4.5%) |
| $40,000 to $44,999 | 170 (5.4%) | 165 (4.5%) |
| $45,000 to $49,999 | 187 (5.9%) | 320 (8.8%) |
| $50,000 to $54,999 | 178 (5.6%) | 263 (7.3%) |
| $55,000 to $64,999 | 233 (7.3%) | 399 (11.0%) |
| $65,000 to $74,999 | 228 (7.2%) | 315 (8.7%) |
| $75,000 to $99,999 | 339 (10.7%) | 492 (13.6%) |
| $100,000+ | 647 (20.4%) | 165 (4.5%) |
| Total | 3,172 (100.0%) | 3,625 (100.0%) |
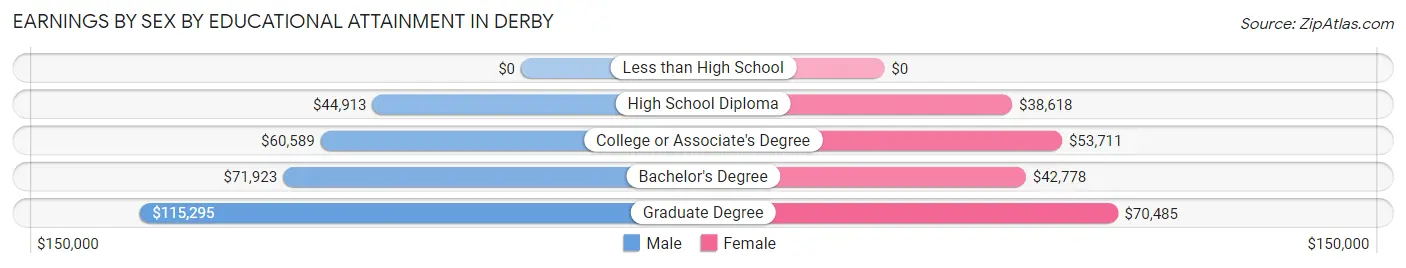
Earnings by Sex by Educational Attainment in Derby
Average earnings in Derby are $54,990 for men and $48,902 for women, a difference of 11.1%. Men with an educational attainment of graduate degree enjoy the highest average annual earnings of $115,295, while those with high school diploma education earn the least with $44,913. Women with an educational attainment of graduate degree earn the most with the average annual earnings of $70,485, while those with high school diploma education have the smallest earnings of $38,618.
| Educational Attainment | Male Income | Female Income |
| Less than High School | - | - |
| High School Diploma | $44,913 | $38,618 |
| College or Associate's Degree | $60,589 | $53,711 |
| Bachelor's Degree | $71,923 | $42,778 |
| Graduate Degree | $115,295 | $70,485 |
| Total | $54,990 | $48,902 |
Family Income in Derby
Family Income Brackets in Derby
According to the Derby family income data, there are 1,097 families falling into the $100,000 to $149,999 income range, which is the most common income bracket and makes up 32.8% of all families. Conversely, the $10,000 to $14,999 income bracket is the least frequent group with only 17 families (0.5%) belonging to this category.
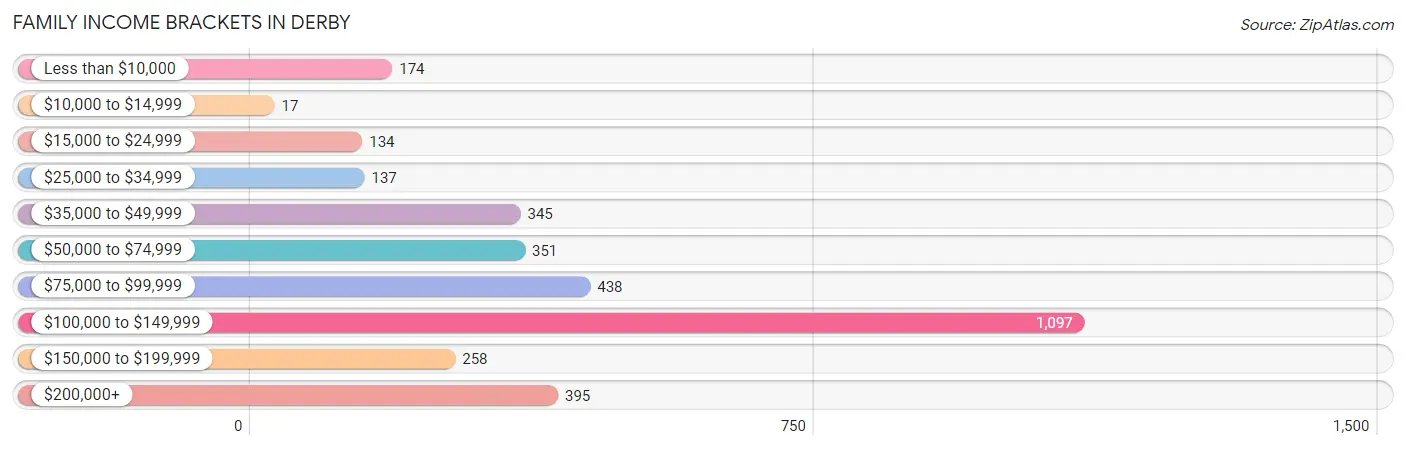
| Income Bracket | # Families | % Families |
| Less than $10,000 | 174 | 5.2% |
| $10,000 to $14,999 | 17 | 0.5% |
| $15,000 to $24,999 | 134 | 4.0% |
| $25,000 to $34,999 | 137 | 4.1% |
| $35,000 to $49,999 | 345 | 10.3% |
| $50,000 to $74,999 | 351 | 10.5% |
| $75,000 to $99,999 | 438 | 13.1% |
| $100,000 to $149,999 | 1,097 | 32.8% |
| $150,000 to $199,999 | 258 | 7.7% |
| $200,000+ | 395 | 11.8% |
Family Income by Famaliy Size in Derby
5-person families (158 | 4.7%) account for the highest median family income in Derby with $133,083 per family, while 2-person families (1,944 | 58.1%) have the highest median income of $54,345 per family member.
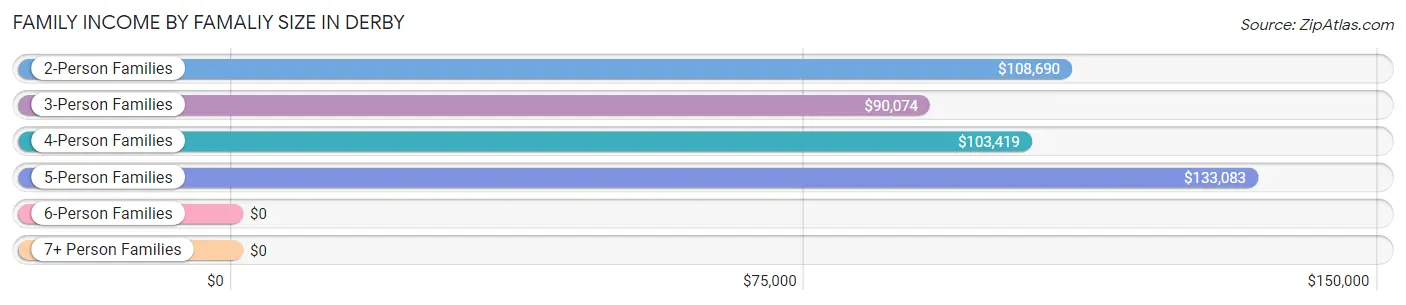
| Income Bracket | # Families | Median Income |
| 2-Person Families | 1,944 (58.1%) | $108,690 |
| 3-Person Families | 775 (23.2%) | $90,074 |
| 4-Person Families | 415 (12.4%) | $103,419 |
| 5-Person Families | 158 (4.7%) | $133,083 |
| 6-Person Families | 34 (1.0%) | $0 |
| 7+ Person Families | 19 (0.6%) | $0 |
| Total | 3,345 (100.0%) | $103,003 |
Family Income by Number of Earners in Derby
The median family income in Derby is $103,003, with families comprising 2 earners (1,521) having the highest median family income of $117,917, while families with no earners (450) have the lowest median family income of $39,600, accounting for 45.5% and 13.5% of families, respectively.
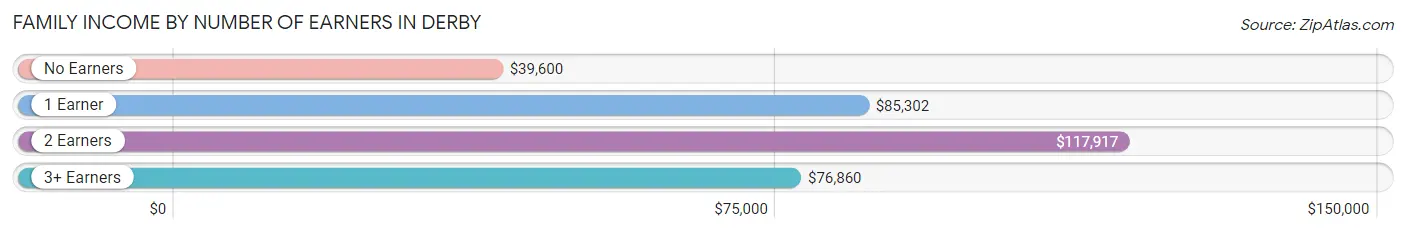
| Number of Earners | # Families | Median Income |
| No Earners | 450 (13.5%) | $39,600 |
| 1 Earner | 1,128 (33.7%) | $85,302 |
| 2 Earners | 1,521 (45.5%) | $117,917 |
| 3+ Earners | 246 (7.3%) | $76,860 |
| Total | 3,345 (100.0%) | $103,003 |
Household Income in Derby
Household Income Brackets in Derby
With 1,188 households falling in the category, the $100,000 to $149,999 income range is the most frequent in Derby, accounting for 20.8% of all households. In contrast, only 348 households (6.1%) fall into the $150,000 to $199,999 income bracket, making it the least populous group.
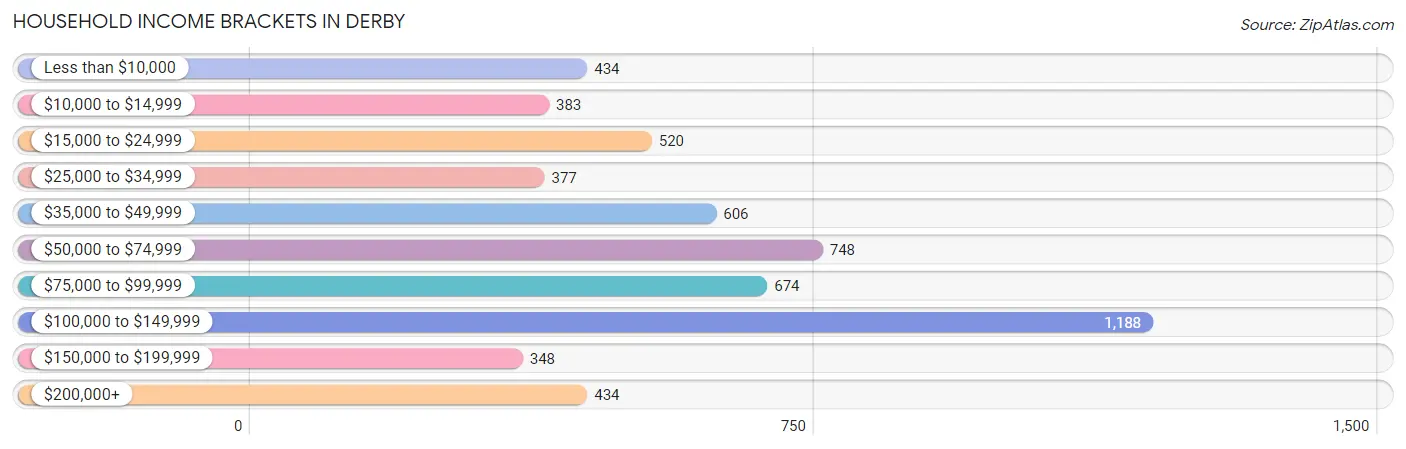
| Income Bracket | # Households | % Households |
| Less than $10,000 | 434 | 7.6% |
| $10,000 to $14,999 | 383 | 6.7% |
| $15,000 to $24,999 | 520 | 9.1% |
| $25,000 to $34,999 | 377 | 6.6% |
| $35,000 to $49,999 | 606 | 10.6% |
| $50,000 to $74,999 | 748 | 13.1% |
| $75,000 to $99,999 | 674 | 11.8% |
| $100,000 to $149,999 | 1,188 | 20.8% |
| $150,000 to $199,999 | 348 | 6.1% |
| $200,000+ | 434 | 7.6% |
Household Income by Householder Age in Derby
The median household income in Derby is $69,835, with the highest median household income of $87,072 found in the 45 to 64 years age bracket for the primary householder. A total of 2,378 households (41.6%) fall into this category. Meanwhile, the 15 to 24 years age bracket for the primary householder has the lowest median household income of $0, with 105 households (1.8%) in this group.
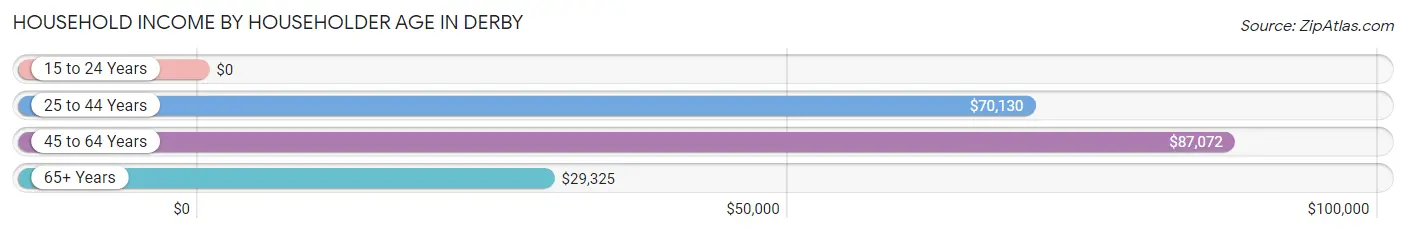
| Income Bracket | # Households | Median Income |
| 15 to 24 Years | 105 (1.8%) | $0 |
| 25 to 44 Years | 1,703 (29.8%) | $70,130 |
| 45 to 64 Years | 2,378 (41.6%) | $87,072 |
| 65+ Years | 1,527 (26.7%) | $29,325 |
| Total | 5,713 (100.0%) | $69,835 |
Poverty in Derby
Income Below Poverty by Sex and Age in Derby
With 12.0% poverty level for males and 14.6% for females among the residents of Derby, 5 year old males and 65 to 74 year old females are the most vulnerable to poverty, with 93 males (78.8%) and 311 females (32.4%) in their respective age groups living below the poverty level.
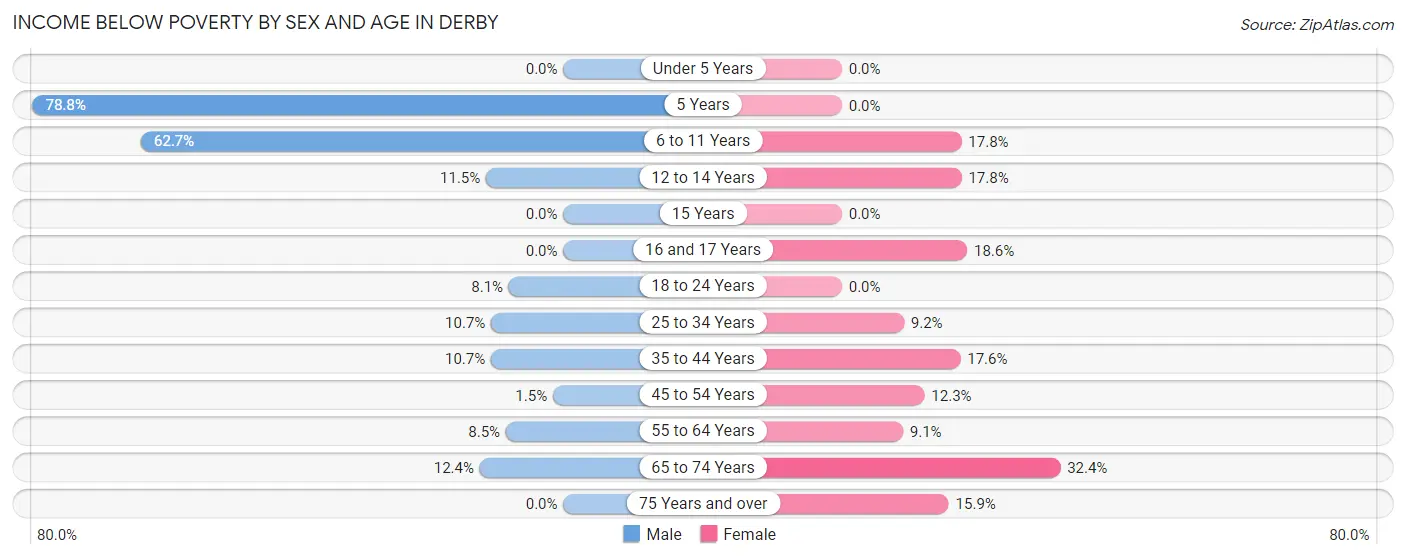
| Age Bracket | Male | Female |
| Under 5 Years | 0 (0.0%) | 0 (0.0%) |
| 5 Years | 93 (78.8%) | 0 (0.0%) |
| 6 to 11 Years | 170 (62.7%) | 38 (17.8%) |
| 12 to 14 Years | 25 (11.5%) | 51 (17.8%) |
| 15 Years | 0 (0.0%) | 0 (0.0%) |
| 16 and 17 Years | 0 (0.0%) | 32 (18.6%) |
| 18 to 24 Years | 24 (8.1%) | 0 (0.0%) |
| 25 to 34 Years | 77 (10.7%) | 106 (9.2%) |
| 35 to 44 Years | 55 (10.7%) | 165 (17.6%) |
| 45 to 54 Years | 12 (1.5%) | 115 (12.3%) |
| 55 to 64 Years | 92 (8.5%) | 92 (9.1%) |
| 65 to 74 Years | 109 (12.4%) | 311 (32.4%) |
| 75 Years and over | 0 (0.0%) | 76 (15.9%) |
| Total | 657 (12.0%) | 986 (14.6%) |
Income Above Poverty by Sex and Age in Derby
According to the poverty statistics in Derby, males aged under 5 years and females aged under 5 years are the age groups that are most secure financially, with 100.0% of males and 100.0% of females in these age groups living above the poverty line.
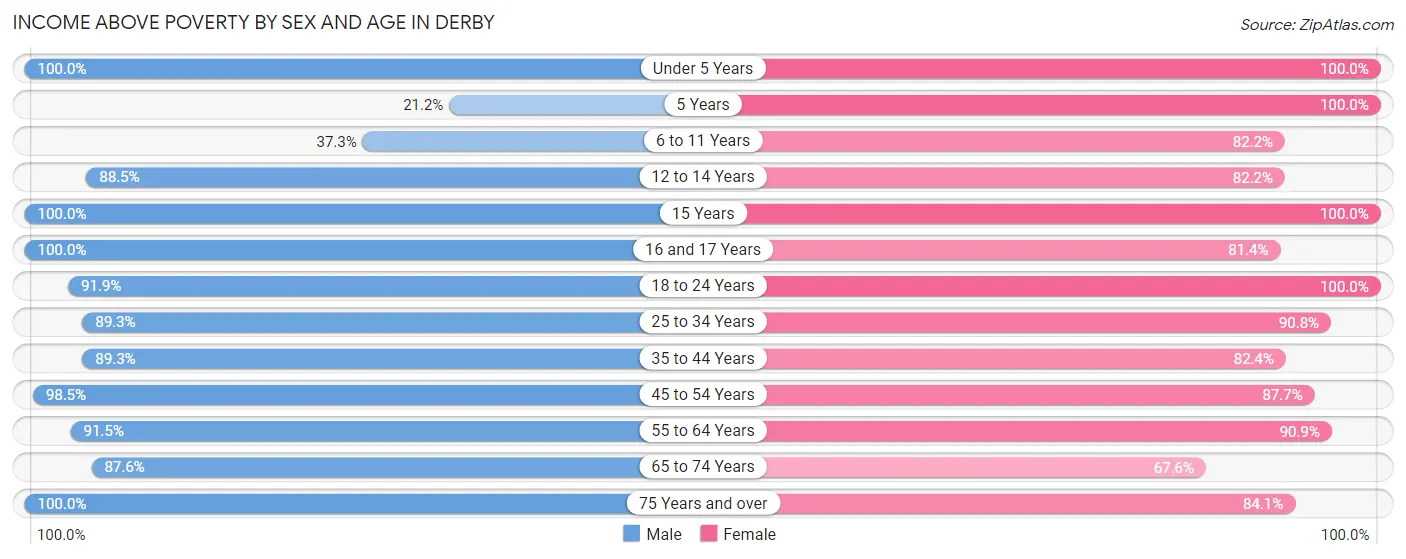
| Age Bracket | Male | Female |
| Under 5 Years | 173 (100.0%) | 241 (100.0%) |
| 5 Years | 25 (21.2%) | 46 (100.0%) |
| 6 to 11 Years | 101 (37.3%) | 176 (82.2%) |
| 12 to 14 Years | 193 (88.5%) | 236 (82.2%) |
| 15 Years | 96 (100.0%) | 47 (100.0%) |
| 16 and 17 Years | 187 (100.0%) | 140 (81.4%) |
| 18 to 24 Years | 273 (91.9%) | 278 (100.0%) |
| 25 to 34 Years | 641 (89.3%) | 1,045 (90.8%) |
| 35 to 44 Years | 457 (89.3%) | 773 (82.4%) |
| 45 to 54 Years | 767 (98.5%) | 822 (87.7%) |
| 55 to 64 Years | 986 (91.5%) | 922 (90.9%) |
| 65 to 74 Years | 769 (87.6%) | 648 (67.6%) |
| 75 Years and over | 162 (100.0%) | 403 (84.1%) |
| Total | 4,830 (88.0%) | 5,777 (85.4%) |
Income Below Poverty Among Married-Couple Families in Derby
The poverty statistics for married-couple families in Derby show that 4.6% or 99 of the total 2,152 families live below the poverty line. Families with 3 or 4 children have the highest poverty rate of 27.9%, comprising of 19 families. On the other hand, families with 1 or 2 children have the lowest poverty rate of 0.0%, which includes 0 families.
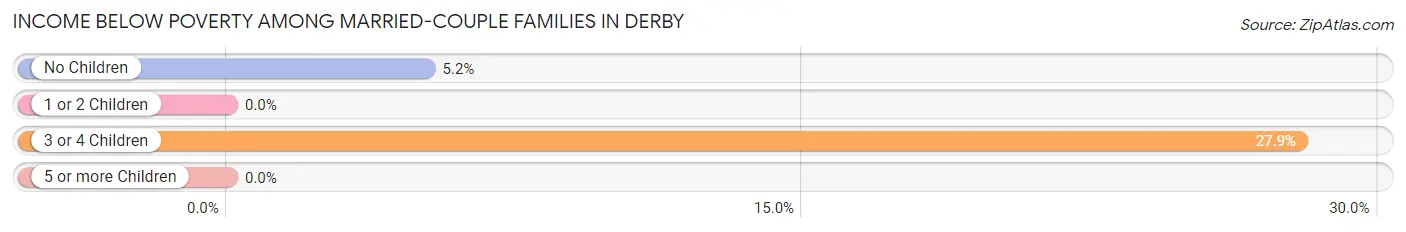
| Children | Above Poverty | Below Poverty |
| No Children | 1,470 (94.8%) | 80 (5.2%) |
| 1 or 2 Children | 534 (100.0%) | 0 (0.0%) |
| 3 or 4 Children | 49 (72.1%) | 19 (27.9%) |
| 5 or more Children | 0 (0.0%) | 0 (0.0%) |
| Total | 2,053 (95.4%) | 99 (4.6%) |
Income Below Poverty Among Single-Parent Households in Derby
According to the poverty data in Derby, 25.0% or 44 single-father households and 16.2% or 165 single-mother households are living below the poverty line. Among single-father households, those with 1 or 2 children have the highest poverty rate, with 44 households (39.6%) experiencing poverty. Likewise, among single-mother households, those with 1 or 2 children have the highest poverty rate, with 149 households (37.6%) falling below the poverty line.
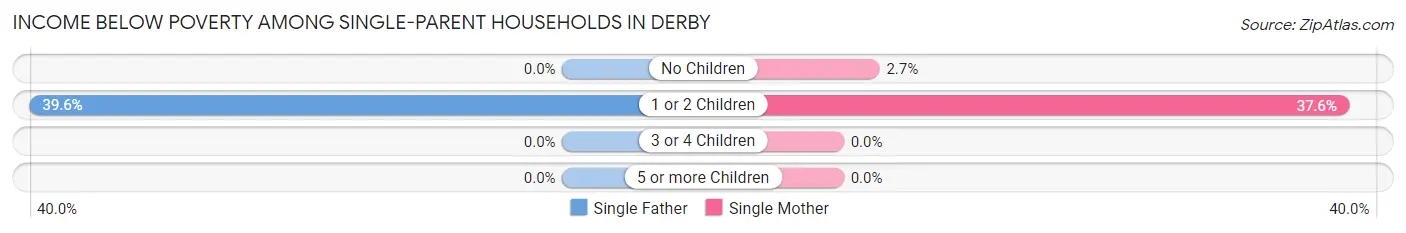
| Children | Single Father | Single Mother |
| No Children | 0 (0.0%) | 16 (2.7%) |
| 1 or 2 Children | 44 (39.6%) | 149 (37.6%) |
| 3 or 4 Children | 0 (0.0%) | 0 (0.0%) |
| 5 or more Children | 0 (0.0%) | 0 (0.0%) |
| Total | 44 (25.0%) | 165 (16.2%) |
Income Below Poverty Among Married-Couple vs Single-Parent Households in Derby
The poverty data for Derby shows that 99 of the married-couple family households (4.6%) and 209 of the single-parent households (17.5%) are living below the poverty level. Within the married-couple family households, those with 3 or 4 children have the highest poverty rate, with 19 households (27.9%) falling below the poverty line. Among the single-parent households, those with 1 or 2 children have the highest poverty rate, with 193 household (38.1%) living below poverty.
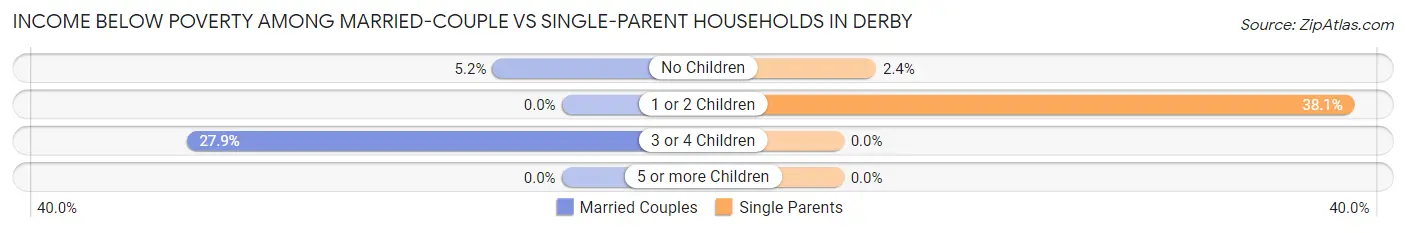
| Children | Married-Couple Families | Single-Parent Households |
| No Children | 80 (5.2%) | 16 (2.4%) |
| 1 or 2 Children | 0 (0.0%) | 193 (38.1%) |
| 3 or 4 Children | 19 (27.9%) | 0 (0.0%) |
| 5 or more Children | 0 (0.0%) | 0 (0.0%) |
| Total | 99 (4.6%) | 209 (17.5%) |
Race in Derby
The most populous races in Derby are White / Caucasian (8,399 | 67.9%), Hispanic or Latino (2,852 | 23.1%), and Black / African American (1,709 | 13.8%).
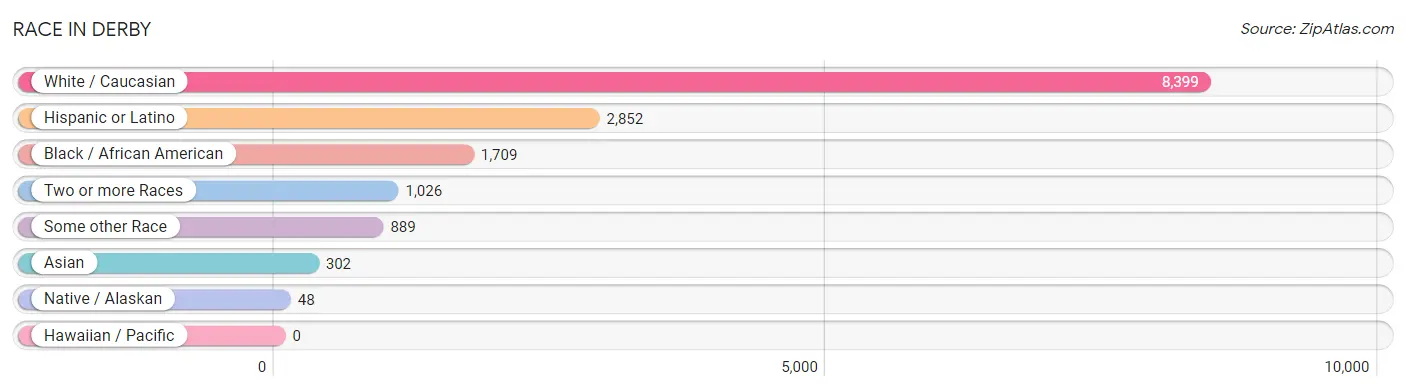
| Race | # Population | % Population |
| Asian | 302 | 2.4% |
| Black / African American | 1,709 | 13.8% |
| Hawaiian / Pacific | 0 | 0.0% |
| Hispanic or Latino | 2,852 | 23.1% |
| Native / Alaskan | 48 | 0.4% |
| White / Caucasian | 8,399 | 67.9% |
| Two or more Races | 1,026 | 8.3% |
| Some other Race | 889 | 7.2% |
| Total | 12,373 | 100.0% |
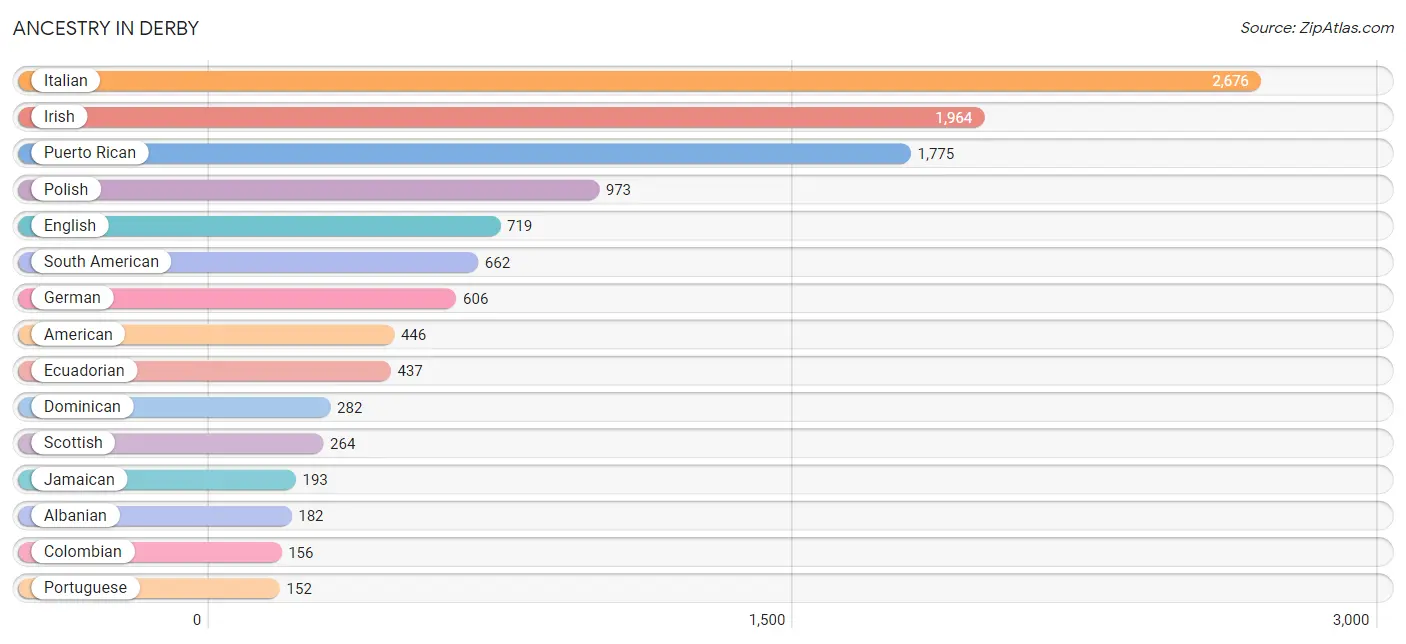
Ancestry in Derby
The most populous ancestries reported in Derby are Italian (2,676 | 21.6%), Irish (1,964 | 15.9%), Puerto Rican (1,775 | 14.3%), Polish (973 | 7.9%), and English (719 | 5.8%), together accounting for 65.5% of all Derby residents.
| Ancestry | # Population | % Population |
| African | 1 | 0.0% |
| Albanian | 182 | 1.5% |
| American | 446 | 3.6% |
| Blackfeet | 38 | 0.3% |
| Brazilian | 50 | 0.4% |
| Burmese | 20 | 0.2% |
| Canadian | 14 | 0.1% |
| Cape Verdean | 16 | 0.1% |
| Central American | 81 | 0.6% |
| Chilean | 69 | 0.6% |
| Colombian | 156 | 1.3% |
| Dominican | 282 | 2.3% |
| Dutch | 17 | 0.1% |
| Eastern European | 2 | 0.0% |
| Ecuadorian | 437 | 3.5% |
| English | 719 | 5.8% |
| European | 8 | 0.1% |
| French | 140 | 1.1% |
| French Canadian | 92 | 0.7% |
| German | 606 | 4.9% |
| Greek | 106 | 0.9% |
| Guatemalan | 81 | 0.6% |
| Haitian | 138 | 1.1% |
| Hungarian | 144 | 1.2% |
| Indian (Asian) | 106 | 0.9% |
| Iranian | 18 | 0.2% |
| Irish | 1,964 | 15.9% |
| Italian | 2,676 | 21.6% |
| Jamaican | 193 | 1.6% |
| Korean | 54 | 0.4% |
| Lithuanian | 55 | 0.4% |
| Macedonian | 48 | 0.4% |
| Mexican | 52 | 0.4% |
| Norwegian | 9 | 0.1% |
| Polish | 973 | 7.9% |
| Portuguese | 152 | 1.2% |
| Puerto Rican | 1,775 | 14.3% |
| Romanian | 48 | 0.4% |
| Russian | 82 | 0.7% |
| Scotch-Irish | 28 | 0.2% |
| Scottish | 264 | 2.1% |
| Slovak | 84 | 0.7% |
| South American | 662 | 5.3% |
| Sri Lankan | 80 | 0.6% |
| Subsaharan African | 17 | 0.1% |
| Swedish | 21 | 0.2% |
| Thai | 104 | 0.8% |
| U.S. Virgin Islander | 16 | 0.1% |
| Ukrainian | 136 | 1.1% | View All 49 Rows |
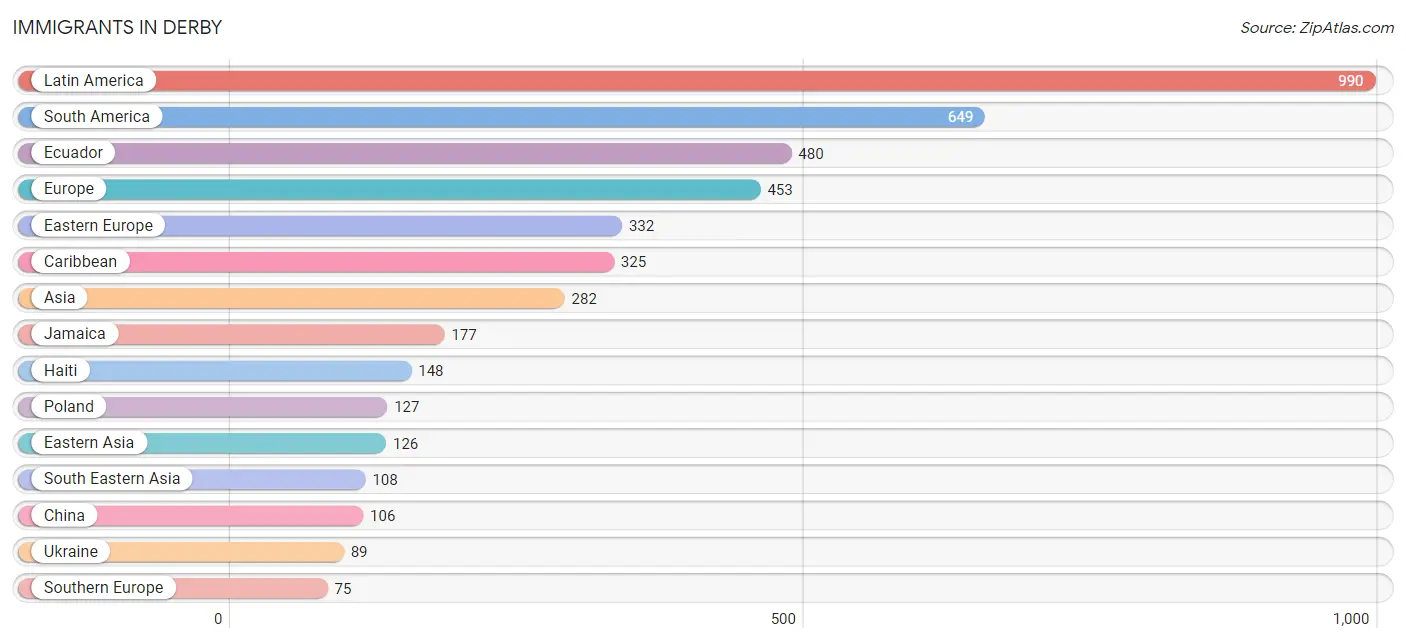
Immigrants in Derby
The most numerous immigrant groups reported in Derby came from Latin America (990 | 8.0%), South America (649 | 5.2%), Ecuador (480 | 3.9%), Europe (453 | 3.7%), and Eastern Europe (332 | 2.7%), together accounting for 23.5% of all Derby residents.
| Immigration Origin | # Population | % Population |
| Africa | 1 | 0.0% |
| Asia | 282 | 2.3% |
| Brazil | 50 | 0.4% |
| Caribbean | 325 | 2.6% |
| Central America | 16 | 0.1% |
| Chile | 69 | 0.6% |
| China | 106 | 0.9% |
| Colombia | 50 | 0.4% |
| Eastern Asia | 126 | 1.0% |
| Eastern Europe | 332 | 2.7% |
| Ecuador | 480 | 3.9% |
| Europe | 453 | 3.7% |
| Germany | 33 | 0.3% |
| Ghana | 1 | 0.0% |
| Guatemala | 16 | 0.1% |
| Haiti | 148 | 1.2% |
| Hong Kong | 27 | 0.2% |
| Hungary | 10 | 0.1% |
| India | 30 | 0.2% |
| Iran | 18 | 0.2% |
| Ireland | 13 | 0.1% |
| Italy | 55 | 0.4% |
| Jamaica | 177 | 1.4% |
| Korea | 20 | 0.2% |
| Latin America | 990 | 8.0% |
| North Macedonia | 48 | 0.4% |
| Northern Europe | 13 | 0.1% |
| Philippines | 54 | 0.4% |
| Poland | 127 | 1.0% |
| Portugal | 20 | 0.2% |
| Romania | 18 | 0.2% |
| South America | 649 | 5.2% |
| South Central Asia | 48 | 0.4% |
| South Eastern Asia | 108 | 0.9% |
| Southern Europe | 75 | 0.6% |
| Taiwan | 21 | 0.2% |
| Ukraine | 89 | 0.7% |
| Vietnam | 54 | 0.4% |
| Western Africa | 1 | 0.0% |
| Western Europe | 33 | 0.3% | View All 40 Rows |
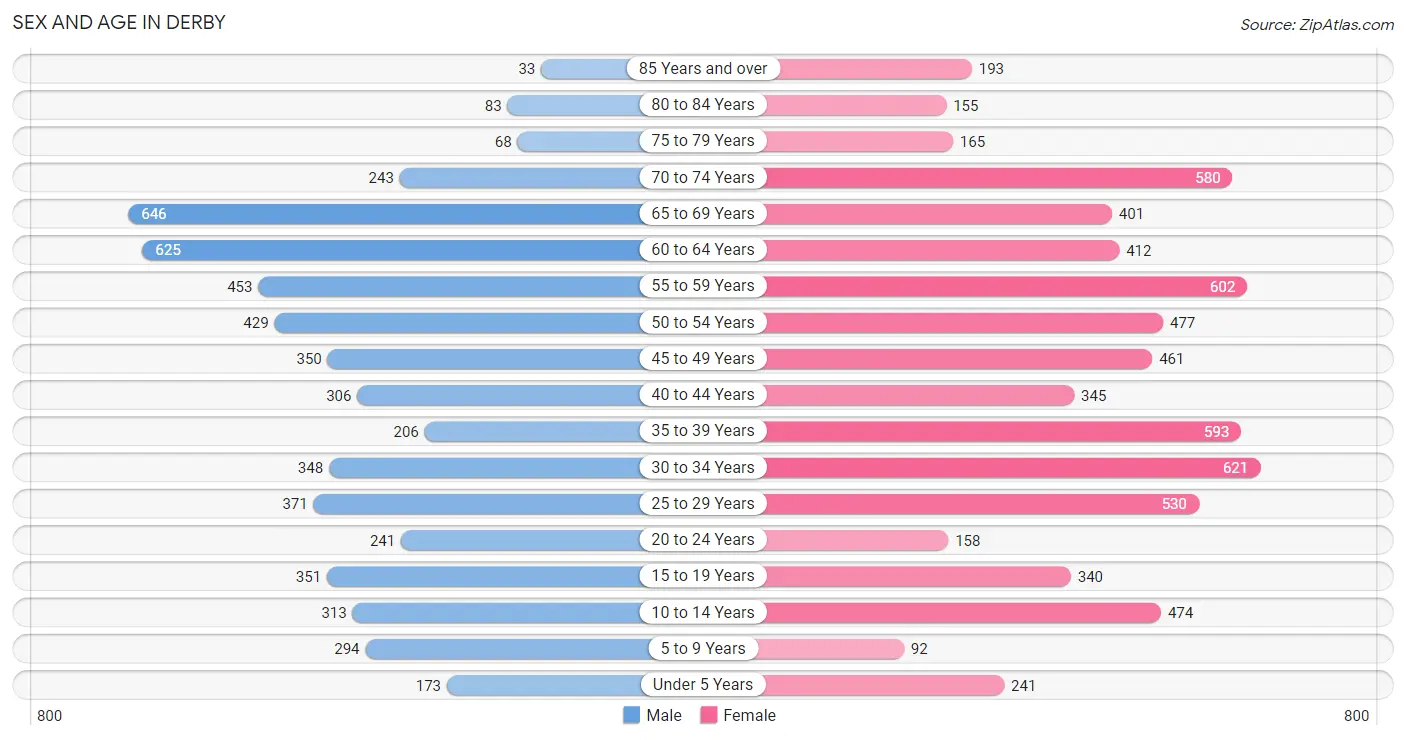
Sex and Age in Derby
Sex and Age in Derby
The most populous age groups in Derby are 65 to 69 Years (646 | 11.7%) for men and 30 to 34 Years (621 | 9.1%) for women.
| Age Bracket | Male | Female |
| Under 5 Years | 173 (3.1%) | 241 (3.5%) |
| 5 to 9 Years | 294 (5.3%) | 92 (1.3%) |
| 10 to 14 Years | 313 (5.7%) | 474 (6.9%) |
| 15 to 19 Years | 351 (6.3%) | 340 (5.0%) |
| 20 to 24 Years | 241 (4.4%) | 158 (2.3%) |
| 25 to 29 Years | 371 (6.7%) | 530 (7.7%) |
| 30 to 34 Years | 348 (6.3%) | 621 (9.1%) |
| 35 to 39 Years | 206 (3.7%) | 593 (8.7%) |
| 40 to 44 Years | 306 (5.5%) | 345 (5.0%) |
| 45 to 49 Years | 350 (6.3%) | 461 (6.7%) |
| 50 to 54 Years | 429 (7.7%) | 477 (7.0%) |
| 55 to 59 Years | 453 (8.2%) | 602 (8.8%) |
| 60 to 64 Years | 625 (11.3%) | 412 (6.0%) |
| 65 to 69 Years | 646 (11.7%) | 401 (5.9%) |
| 70 to 74 Years | 243 (4.4%) | 580 (8.5%) |
| 75 to 79 Years | 68 (1.2%) | 165 (2.4%) |
| 80 to 84 Years | 83 (1.5%) | 155 (2.3%) |
| 85 Years and over | 33 (0.6%) | 193 (2.8%) |
| Total | 5,533 (100.0%) | 6,840 (100.0%) |
Families and Households in Derby
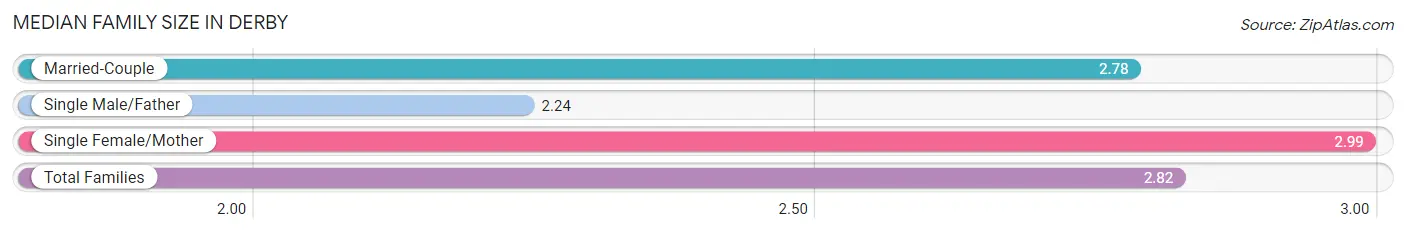
Median Family Size in Derby
The median family size in Derby is 2.82 persons per family, with single female/mother families (1,017 | 30.4%) accounting for the largest median family size of 2.99 persons per family. On the other hand, single male/father families (176 | 5.3%) represent the smallest median family size with 2.24 persons per family.
| Family Type | # Families | Family Size |
| Married-Couple | 2,152 (64.3%) | 2.78 |
| Single Male/Father | 176 (5.3%) | 2.24 |
| Single Female/Mother | 1,017 (30.4%) | 2.99 |
| Total Families | 3,345 (100.0%) | 2.82 |
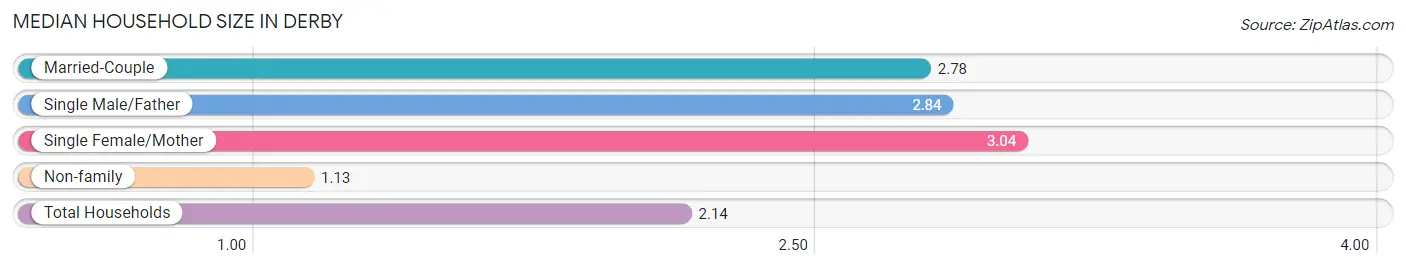
Median Household Size in Derby
The median household size in Derby is 2.14 persons per household, with single female/mother households (1,017 | 17.8%) accounting for the largest median household size of 3.04 persons per household. non-family households (2,368 | 41.4%) represent the smallest median household size with 1.13 persons per household.
| Household Type | # Households | Household Size |
| Married-Couple | 2,152 (37.7%) | 2.78 |
| Single Male/Father | 176 (3.1%) | 2.84 |
| Single Female/Mother | 1,017 (17.8%) | 3.04 |
| Non-family | 2,368 (41.4%) | 1.13 |
| Total Households | 5,713 (100.0%) | 2.14 |
Household Size by Marriage Status in Derby
Out of a total of 5,713 households in Derby, 3,345 (58.6%) are family households, while 2,368 (41.4%) are nonfamily households. The most numerous type of family households are 2-person households, comprising 1,833, and the most common type of nonfamily households are 1-person households, comprising 2,158.
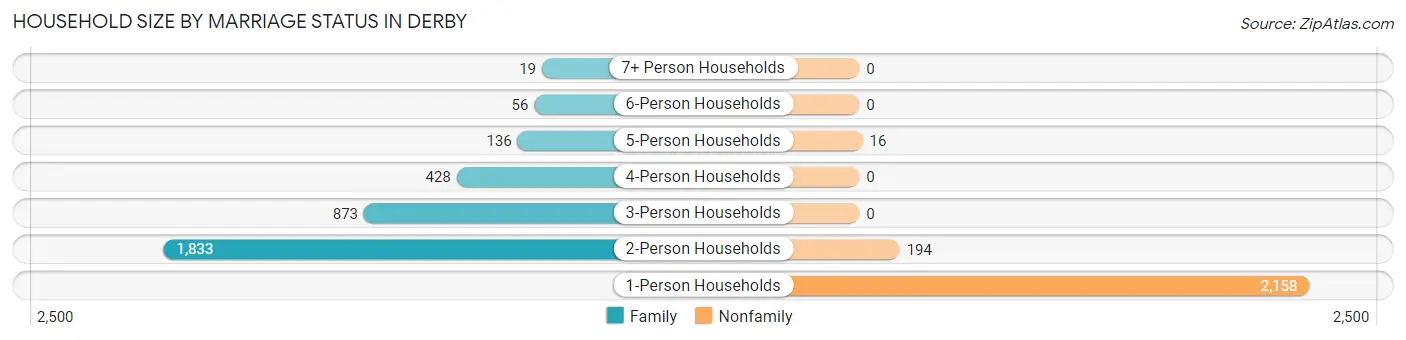
| Household Size | Family Households | Nonfamily Households |
| 1-Person Households | - | 2,158 (37.8%) |
| 2-Person Households | 1,833 (32.1%) | 194 (3.4%) |
| 3-Person Households | 873 (15.3%) | 0 (0.0%) |
| 4-Person Households | 428 (7.5%) | 0 (0.0%) |
| 5-Person Households | 136 (2.4%) | 16 (0.3%) |
| 6-Person Households | 56 (1.0%) | 0 (0.0%) |
| 7+ Person Households | 19 (0.3%) | 0 (0.0%) |
| Total | 3,345 (58.6%) | 2,368 (41.4%) |
Female Fertility in Derby
Fertility by Age in Derby
Average fertility rate in Derby is 52.0 births per 1,000 women. Women in the age bracket of 35 to 50 years have the highest fertility rate with 74.0 births per 1,000 women. Women in the age bracket of 35 to 50 years acount for 66.9% of all women with births.
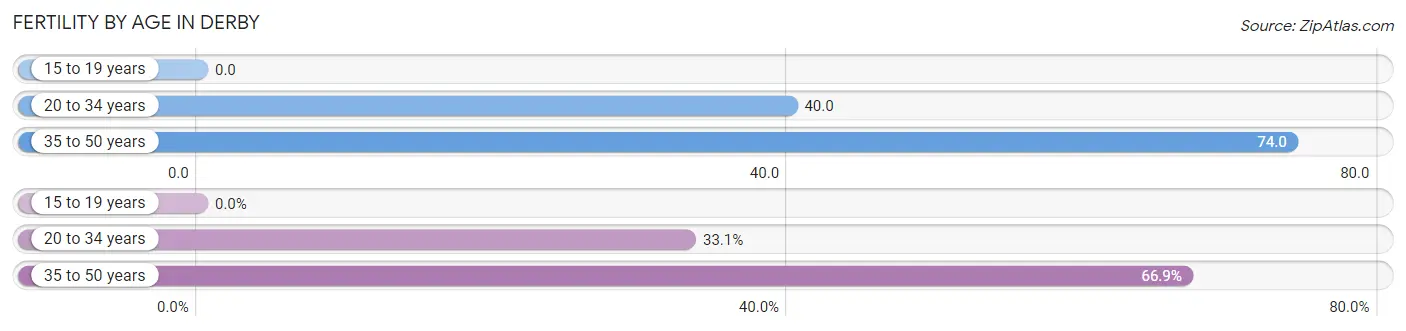
| Age Bracket | Women with Births | Births / 1,000 Women |
| 15 to 19 years | 0 (0.0%) | 0.0 |
| 20 to 34 years | 53 (33.1%) | 40.0 |
| 35 to 50 years | 107 (66.9%) | 74.0 |
| Total | 160 (100.0%) | 52.0 |
Fertility by Age by Marriage Status in Derby
86.3% of women with births (160) in Derby are married. The highest percentage of unmarried women with births falls into 35 to 50 years age bracket with 20.6% of them unmarried at the time of birth, while the lowest percentage of unmarried women with births belong to 20 to 34 years age bracket with 0.0% of them unmarried.
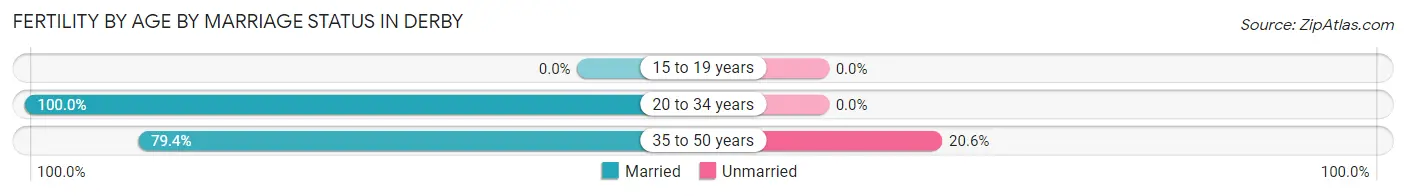
| Age Bracket | Married | Unmarried |
| 15 to 19 years | 0 (0.0%) | 0 (0.0%) |
| 20 to 34 years | 53 (100.0%) | 0 (0.0%) |
| 35 to 50 years | 85 (79.4%) | 22 (20.6%) |
| Total | 138 (86.3%) | 22 (13.8%) |
Fertility by Education in Derby
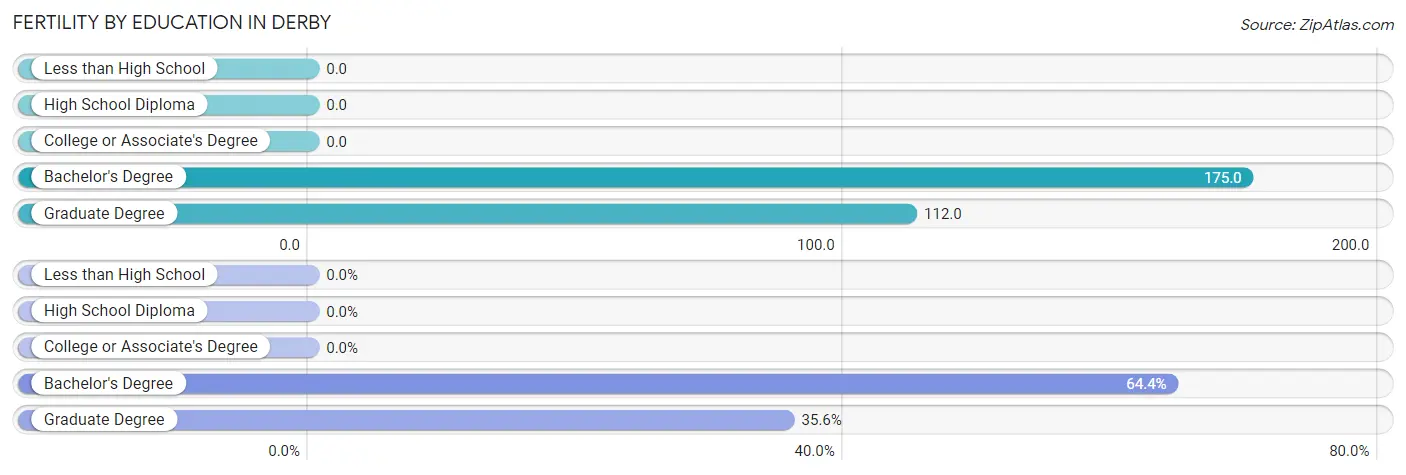
| Educational Attainment | Women with Births | Births / 1,000 Women |
| Less than High School | 0 (0.0%) | 0.0 |
| High School Diploma | 0 (0.0%) | 0.0 |
| College or Associate's Degree | 0 (0.0%) | 0.0 |
| Bachelor's Degree | 103 (64.4%) | 175.0 |
| Graduate Degree | 57 (35.6%) | 112.0 |
| Total | 160 (100.0%) | 52.0 |
Fertility by Education by Marriage Status in Derby
13.8% of women with births in Derby are unmarried. Women with the educational attainment of bachelor's degree are most likely to be married with 100.0% of them married at childbirth, while women with the educational attainment of graduate degree are least likely to be married with 38.6% of them unmarried at childbirth.
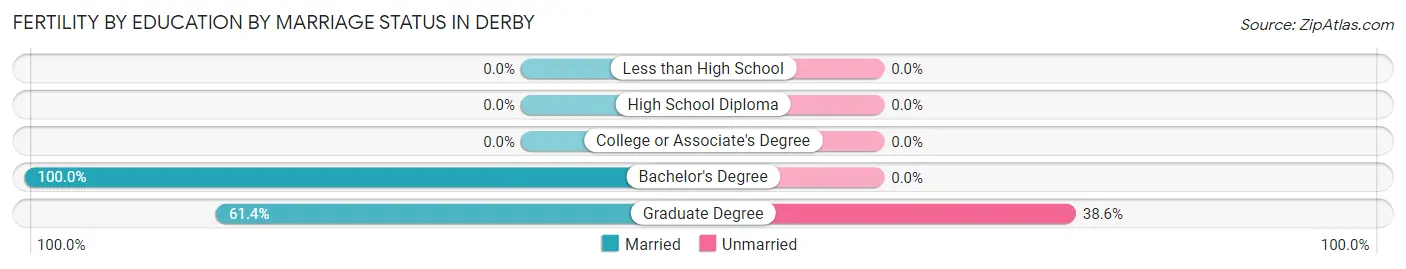
| Educational Attainment | Married | Unmarried |
| Less than High School | 0 (0.0%) | 0 (0.0%) |
| High School Diploma | 0 (0.0%) | 0 (0.0%) |
| College or Associate's Degree | 0 (0.0%) | 0 (0.0%) |
| Bachelor's Degree | 103 (100.0%) | 0 (0.0%) |
| Graduate Degree | 35 (61.4%) | 22 (38.6%) |
| Total | 138 (86.3%) | 22 (13.8%) |
Employment Characteristics in Derby
Employment by Class of Employer in Derby
Among the 6,301 employed individuals in Derby, private company employees (4,128 | 65.5%), not-for-profit organizations (777 | 12.3%), and local government employees (385 | 6.1%) make up the most common classes of employment.
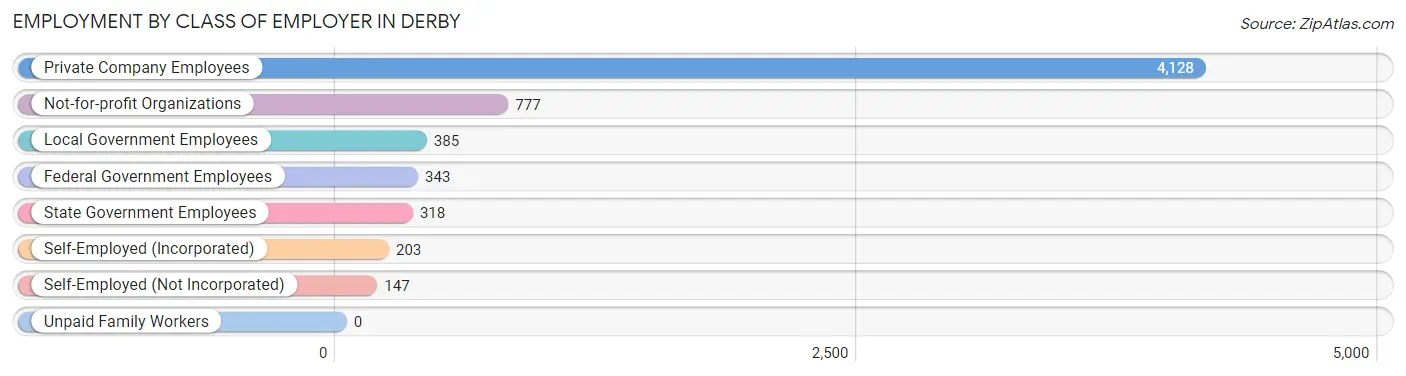
| Employer Class | # Employees | % Employees |
| Private Company Employees | 4,128 | 65.5% |
| Self-Employed (Incorporated) | 203 | 3.2% |
| Self-Employed (Not Incorporated) | 147 | 2.3% |
| Not-for-profit Organizations | 777 | 12.3% |
| Local Government Employees | 385 | 6.1% |
| State Government Employees | 318 | 5.1% |
| Federal Government Employees | 343 | 5.4% |
| Unpaid Family Workers | 0 | 0.0% |
| Total | 6,301 | 100.0% |
Employment Status by Age in Derby
According to the labor force statistics for Derby, out of the total population over 16 years of age (10,643), 63.8% or 6,790 individuals are in the labor force, with 6.1% or 414 of them unemployed. The age group with the highest labor force participation rate is 25 to 29 years, with 97.2% or 876 individuals in the labor force. Within the labor force, the 16 to 19 years age range has the highest percentage of unemployed individuals, with 48.4% or 62 of them being unemployed.
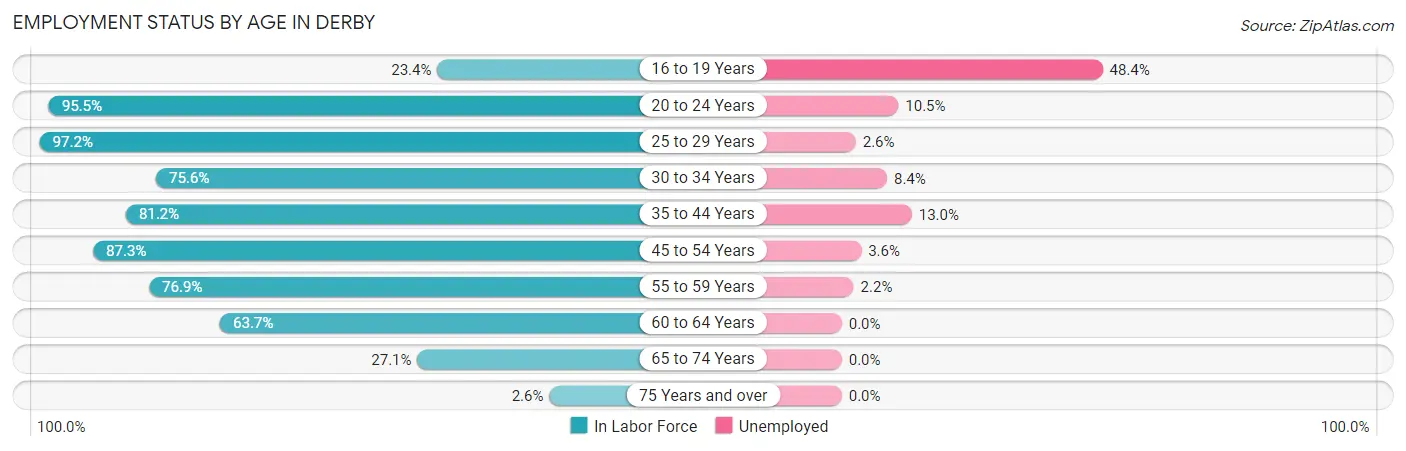
| Age Bracket | In Labor Force | Unemployed |
| 16 to 19 Years | 128 (23.4%) | 62 (48.4%) |
| 20 to 24 Years | 381 (95.5%) | 40 (10.5%) |
| 25 to 29 Years | 876 (97.2%) | 23 (2.6%) |
| 30 to 34 Years | 733 (75.6%) | 62 (8.4%) |
| 35 to 44 Years | 1,177 (81.2%) | 153 (13.0%) |
| 45 to 54 Years | 1,499 (87.3%) | 54 (3.6%) |
| 55 to 59 Years | 811 (76.9%) | 18 (2.2%) |
| 60 to 64 Years | 661 (63.7%) | 0 (0.0%) |
| 65 to 74 Years | 507 (27.1%) | 0 (0.0%) |
| 75 Years and over | 18 (2.6%) | 0 (0.0%) |
| Total | 6,790 (63.8%) | 414 (6.1%) |
Employment Status by Educational Attainment in Derby
According to labor force statistics for Derby, 80.8% of individuals (5,760) out of the total population between 25 and 64 years of age (7,129) are in the labor force, with 5.4% or 311 of them being unemployed. The group with the highest labor force participation rate are those with the educational attainment of bachelor's degree or higher, with 93.0% or 2,109 individuals in the labor force. Within the labor force, individuals with high school diploma education have the highest percentage of unemployment, with 8.7% or 176 of them being unemployed.
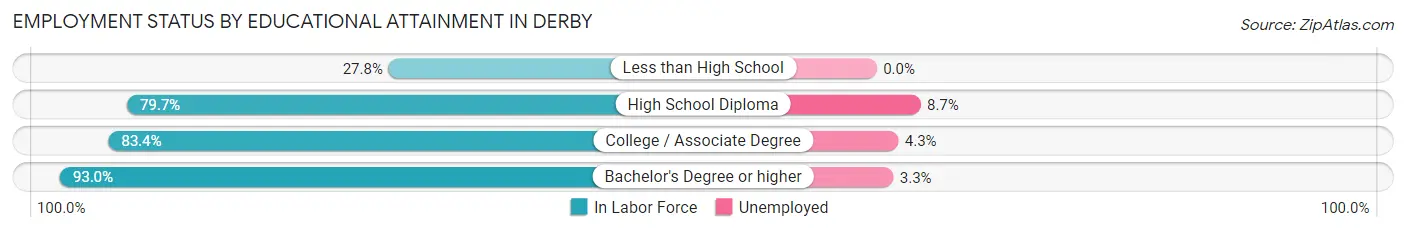
| Educational Attainment | In Labor Force | Unemployed |
| Less than High School | 157 (27.8%) | 0 (0.0%) |
| High School Diploma | 2,020 (79.7%) | 220 (8.7%) |
| College / Associate Degree | 1,470 (83.4%) | 76 (4.3%) |
| Bachelor's Degree or higher | 2,109 (93.0%) | 75 (3.3%) |
| Total | 5,760 (80.8%) | 385 (5.4%) |
Employment Occupations by Sex in Derby
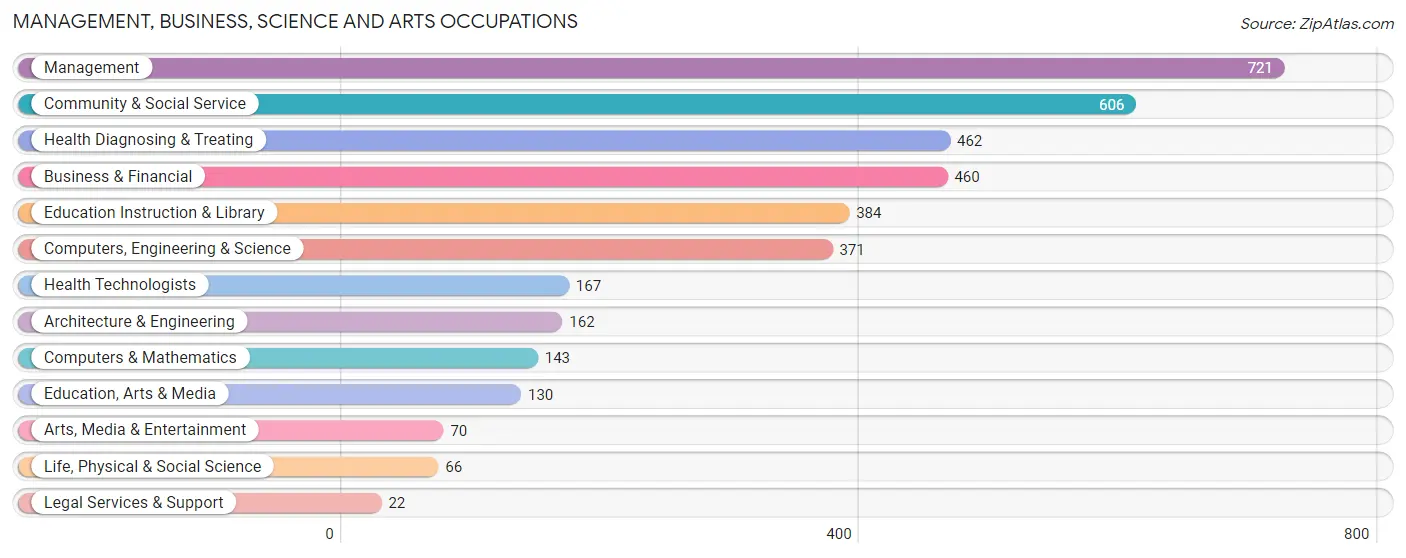
Management, Business, Science and Arts Occupations
The most common Management, Business, Science and Arts occupations in Derby are Management (721 | 11.3%), Community & Social Service (606 | 9.5%), Health Diagnosing & Treating (462 | 7.3%), Business & Financial (460 | 7.2%), and Education Instruction & Library (384 | 6.0%).
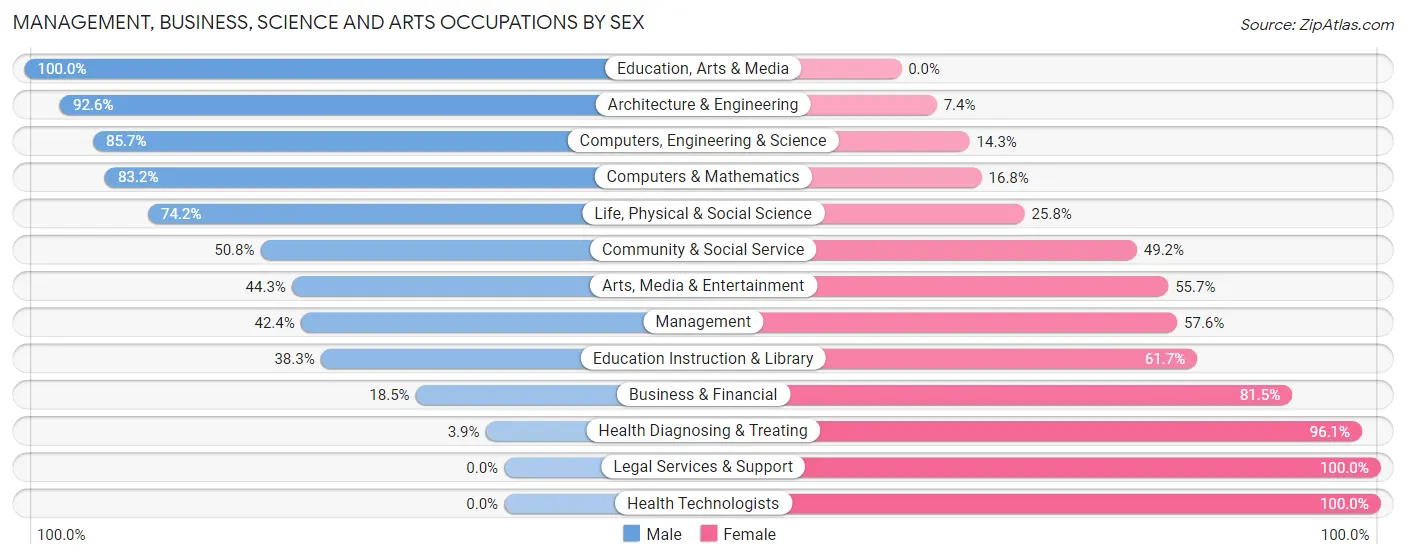
Management, Business, Science and Arts Occupations by Sex
Within the Management, Business, Science and Arts occupations in Derby, the most male-oriented occupations are Education, Arts & Media (100.0%), Architecture & Engineering (92.6%), and Computers, Engineering & Science (85.7%), while the most female-oriented occupations are Legal Services & Support (100.0%), Health Technologists (100.0%), and Health Diagnosing & Treating (96.1%).
| Occupation | Male | Female |
| Management | 306 (42.4%) | 415 (57.6%) |
| Business & Financial | 85 (18.5%) | 375 (81.5%) |
| Computers, Engineering & Science | 318 (85.7%) | 53 (14.3%) |
| Computers & Mathematics | 119 (83.2%) | 24 (16.8%) |
| Architecture & Engineering | 150 (92.6%) | 12 (7.4%) |
| Life, Physical & Social Science | 49 (74.2%) | 17 (25.8%) |
| Community & Social Service | 308 (50.8%) | 298 (49.2%) |
| Education, Arts & Media | 130 (100.0%) | 0 (0.0%) |
| Legal Services & Support | 0 (0.0%) | 22 (100.0%) |
| Education Instruction & Library | 147 (38.3%) | 237 (61.7%) |
| Arts, Media & Entertainment | 31 (44.3%) | 39 (55.7%) |
| Health Diagnosing & Treating | 18 (3.9%) | 444 (96.1%) |
| Health Technologists | 0 (0.0%) | 167 (100.0%) |
| Total (Category) | 1,035 (39.5%) | 1,585 (60.5%) |
| Total (Overall) | 2,874 (45.2%) | 3,491 (54.8%) |
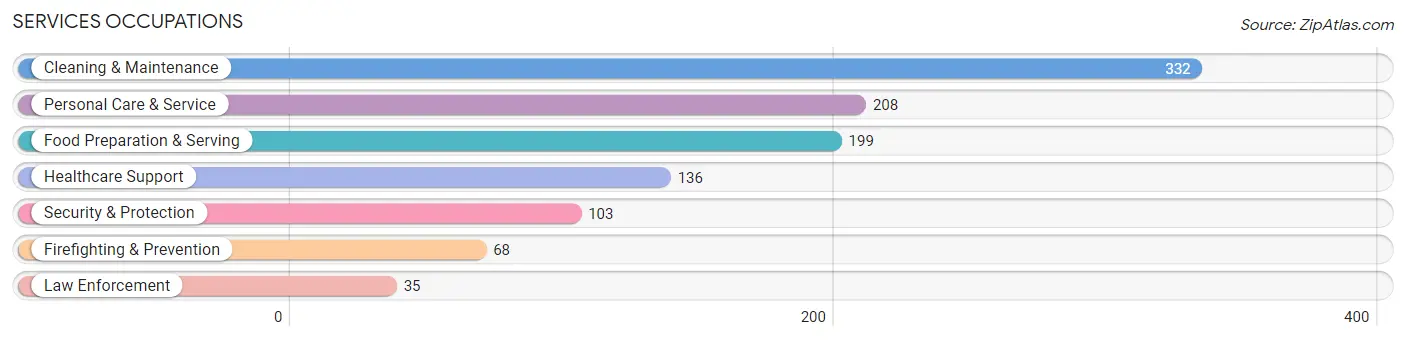
Services Occupations
The most common Services occupations in Derby are Cleaning & Maintenance (332 | 5.2%), Personal Care & Service (208 | 3.3%), Food Preparation & Serving (199 | 3.1%), Healthcare Support (136 | 2.1%), and Security & Protection (103 | 1.6%).
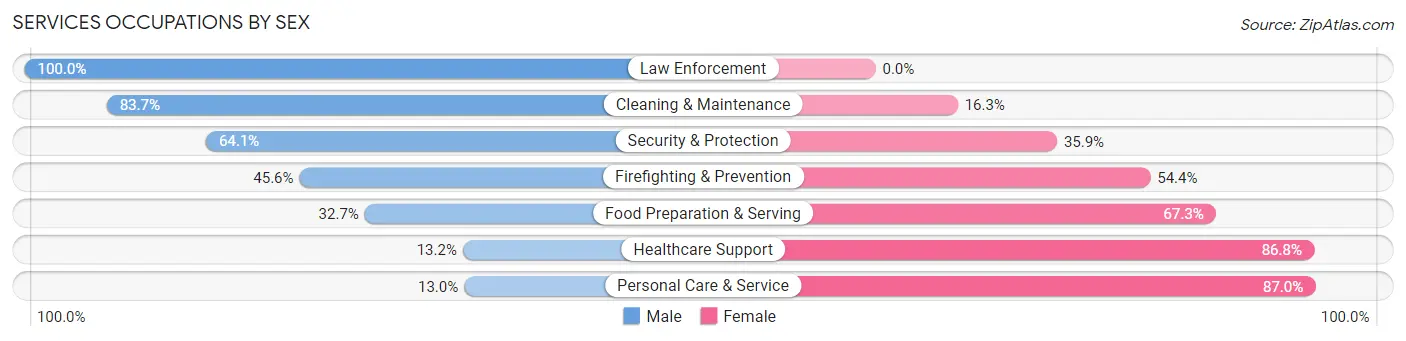
Services Occupations by Sex
Within the Services occupations in Derby, the most male-oriented occupations are Law Enforcement (100.0%), Cleaning & Maintenance (83.7%), and Security & Protection (64.1%), while the most female-oriented occupations are Personal Care & Service (87.0%), Healthcare Support (86.8%), and Food Preparation & Serving (67.3%).
| Occupation | Male | Female |
| Healthcare Support | 18 (13.2%) | 118 (86.8%) |
| Security & Protection | 66 (64.1%) | 37 (35.9%) |
| Firefighting & Prevention | 31 (45.6%) | 37 (54.4%) |
| Law Enforcement | 35 (100.0%) | 0 (0.0%) |
| Food Preparation & Serving | 65 (32.7%) | 134 (67.3%) |
| Cleaning & Maintenance | 278 (83.7%) | 54 (16.3%) |
| Personal Care & Service | 27 (13.0%) | 181 (87.0%) |
| Total (Category) | 454 (46.4%) | 524 (53.6%) |
| Total (Overall) | 2,874 (45.2%) | 3,491 (54.8%) |
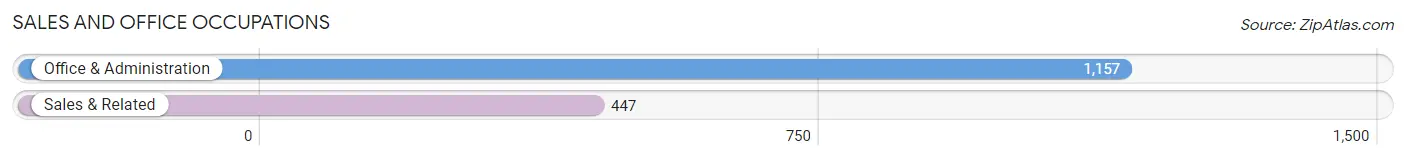
Sales and Office Occupations
The most common Sales and Office occupations in Derby are Office & Administration (1,157 | 18.2%), and Sales & Related (447 | 7.0%).
Sales and Office Occupations by Sex
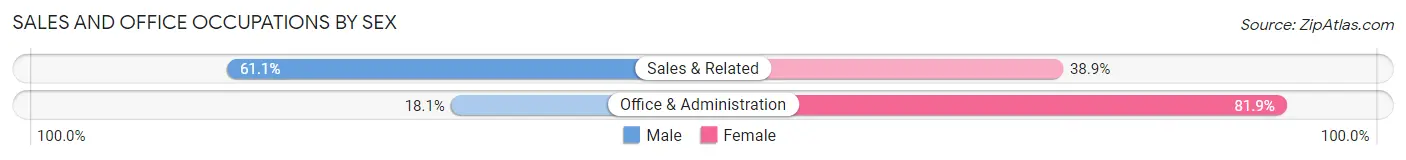
| Occupation | Male | Female |
| Sales & Related | 273 (61.1%) | 174 (38.9%) |
| Office & Administration | 209 (18.1%) | 948 (81.9%) |
| Total (Category) | 482 (30.0%) | 1,122 (70.0%) |
| Total (Overall) | 2,874 (45.2%) | 3,491 (54.8%) |
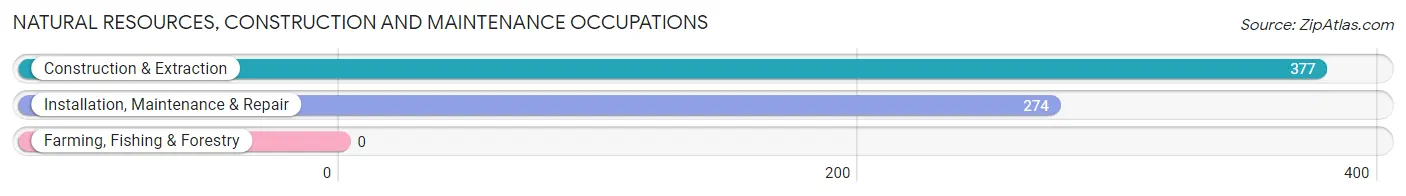
Natural Resources, Construction and Maintenance Occupations
The most common Natural Resources, Construction and Maintenance occupations in Derby are Construction & Extraction (377 | 5.9%), and Installation, Maintenance & Repair (274 | 4.3%).
Natural Resources, Construction and Maintenance Occupations by Sex
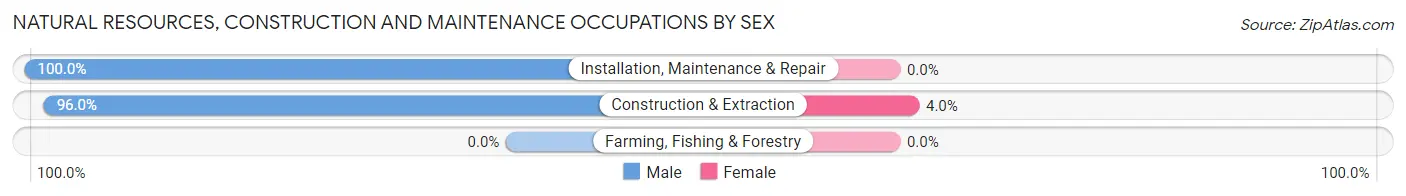
| Occupation | Male | Female |
| Farming, Fishing & Forestry | 0 (0.0%) | 0 (0.0%) |
| Construction & Extraction | 362 (96.0%) | 15 (4.0%) |
| Installation, Maintenance & Repair | 274 (100.0%) | 0 (0.0%) |
| Total (Category) | 636 (97.7%) | 15 (2.3%) |
| Total (Overall) | 2,874 (45.2%) | 3,491 (54.8%) |
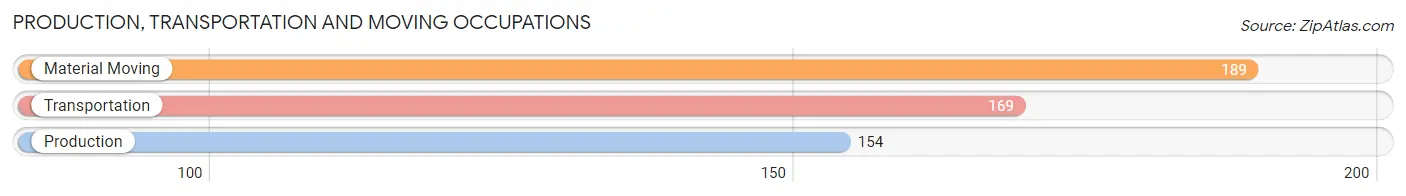
Production, Transportation and Moving Occupations
The most common Production, Transportation and Moving occupations in Derby are Material Moving (189 | 3.0%), Transportation (169 | 2.7%), and Production (154 | 2.4%).
Production, Transportation and Moving Occupations by Sex
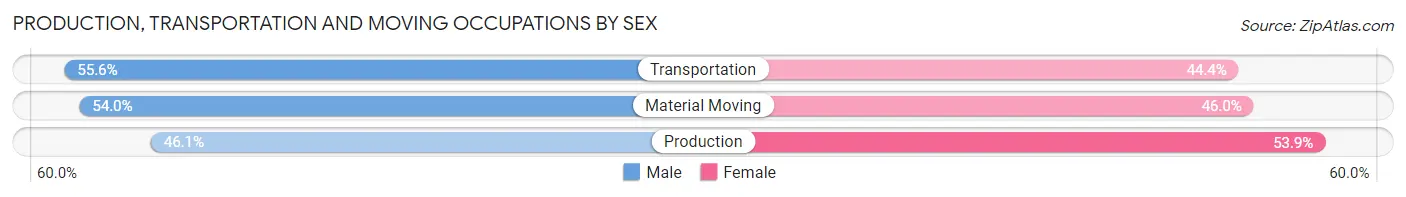
| Occupation | Male | Female |
| Production | 71 (46.1%) | 83 (53.9%) |
| Transportation | 94 (55.6%) | 75 (44.4%) |
| Material Moving | 102 (54.0%) | 87 (46.0%) |
| Total (Category) | 267 (52.1%) | 245 (47.8%) |
| Total (Overall) | 2,874 (45.2%) | 3,491 (54.8%) |
Employment Industries by Sex in Derby
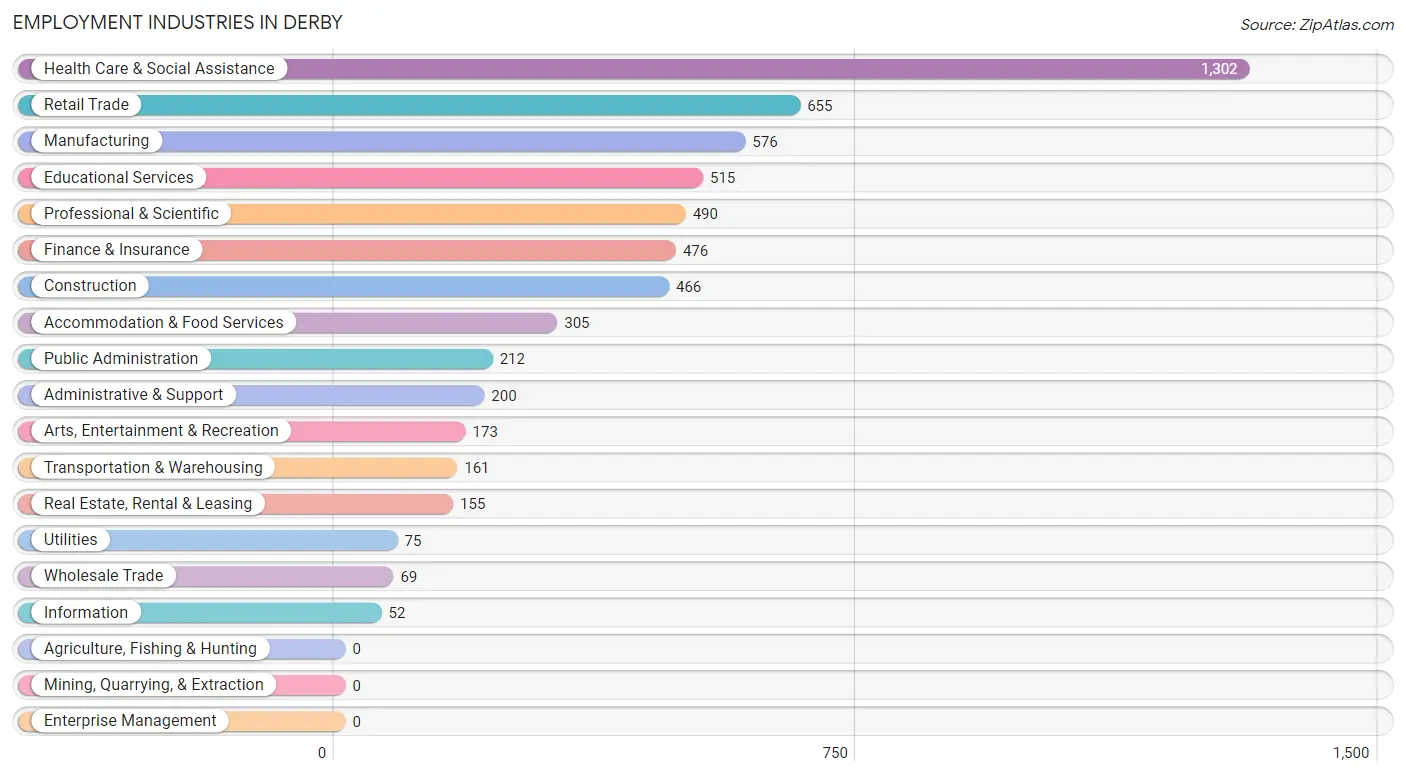
Employment Industries in Derby
The major employment industries in Derby include Health Care & Social Assistance (1,302 | 20.5%), Retail Trade (655 | 10.3%), Manufacturing (576 | 9.0%), Educational Services (515 | 8.1%), and Professional & Scientific (490 | 7.7%).
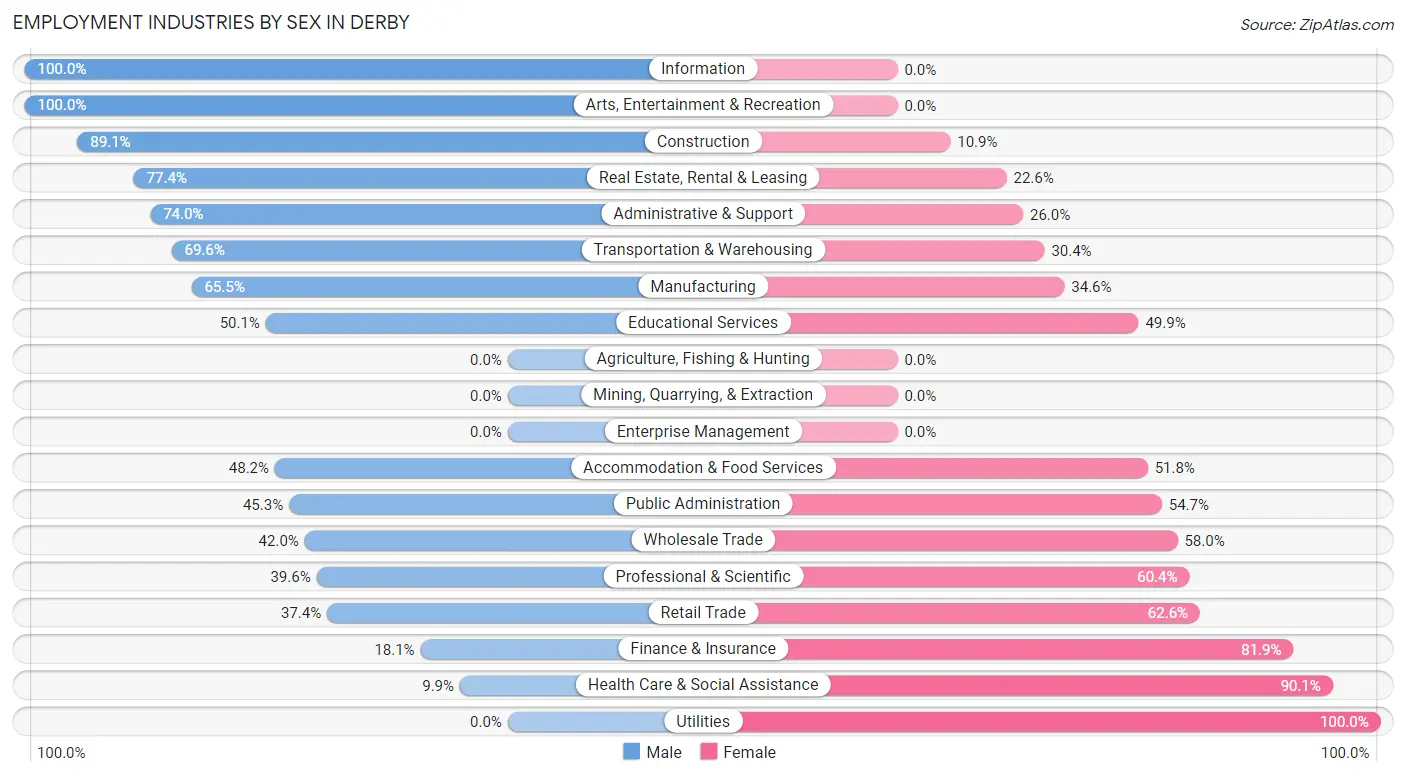
Employment Industries by Sex in Derby
The Derby industries that see more men than women are Information (100.0%), Arts, Entertainment & Recreation (100.0%), and Construction (89.1%), whereas the industries that tend to have a higher number of women are Utilities (100.0%), Health Care & Social Assistance (90.1%), and Finance & Insurance (81.9%).
| Industry | Male | Female |
| Agriculture, Fishing & Hunting | 0 (0.0%) | 0 (0.0%) |
| Mining, Quarrying, & Extraction | 0 (0.0%) | 0 (0.0%) |
| Construction | 415 (89.1%) | 51 (10.9%) |
| Manufacturing | 377 (65.4%) | 199 (34.5%) |
| Wholesale Trade | 29 (42.0%) | 40 (58.0%) |
| Retail Trade | 245 (37.4%) | 410 (62.6%) |
| Transportation & Warehousing | 112 (69.6%) | 49 (30.4%) |
| Utilities | 0 (0.0%) | 75 (100.0%) |
| Information | 52 (100.0%) | 0 (0.0%) |
| Finance & Insurance | 86 (18.1%) | 390 (81.9%) |
| Real Estate, Rental & Leasing | 120 (77.4%) | 35 (22.6%) |
| Professional & Scientific | 194 (39.6%) | 296 (60.4%) |
| Enterprise Management | 0 (0.0%) | 0 (0.0%) |
| Administrative & Support | 148 (74.0%) | 52 (26.0%) |
| Educational Services | 258 (50.1%) | 257 (49.9%) |
| Health Care & Social Assistance | 129 (9.9%) | 1,173 (90.1%) |
| Arts, Entertainment & Recreation | 173 (100.0%) | 0 (0.0%) |
| Accommodation & Food Services | 147 (48.2%) | 158 (51.8%) |
| Public Administration | 96 (45.3%) | 116 (54.7%) |
| Total | 2,874 (45.2%) | 3,491 (54.8%) |
Education in Derby
School Enrollment in Derby
The most common levels of schooling among the 2,563 students in Derby are high school (756 | 29.5%), middle school (653 | 25.5%), and college / undergraduate (372 | 14.5%).
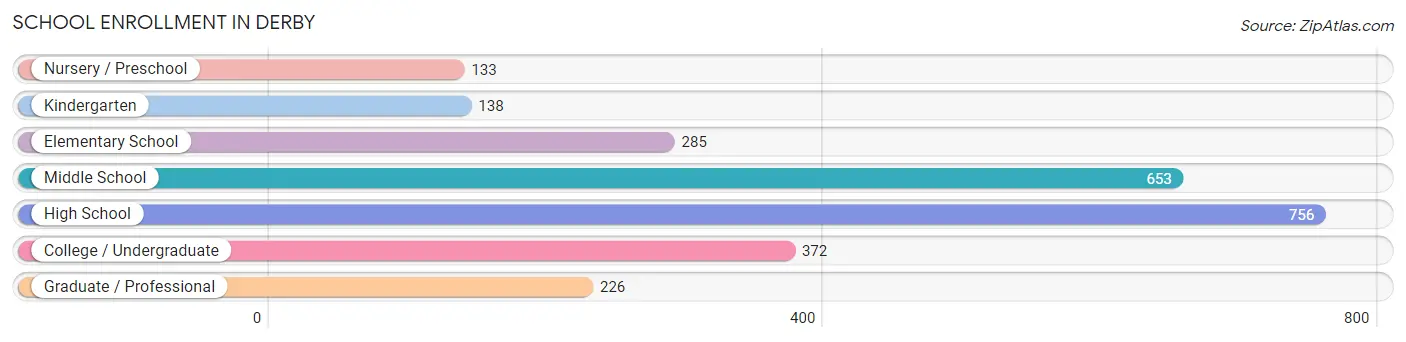
| School Level | # Students | % Students |
| Nursery / Preschool | 133 | 5.2% |
| Kindergarten | 138 | 5.4% |
| Elementary School | 285 | 11.1% |
| Middle School | 653 | 25.5% |
| High School | 756 | 29.5% |
| College / Undergraduate | 372 | 14.5% |
| Graduate / Professional | 226 | 8.8% |
| Total | 2,563 | 100.0% |
School Enrollment by Age by Funding Source in Derby
Out of a total of 2,563 students who are enrolled in schools in Derby, 495 (19.3%) attend a private institution, while the remaining 2,068 (80.7%) are enrolled in public schools. The age group of 35 years and over has the highest likelihood of being enrolled in private schools, with 154 (65.2% in the age bracket) enrolled. Conversely, the age group of 10 to 14 year olds has the lowest likelihood of being enrolled in a private school, with 751 (95.4% in the age bracket) attending a public institution.
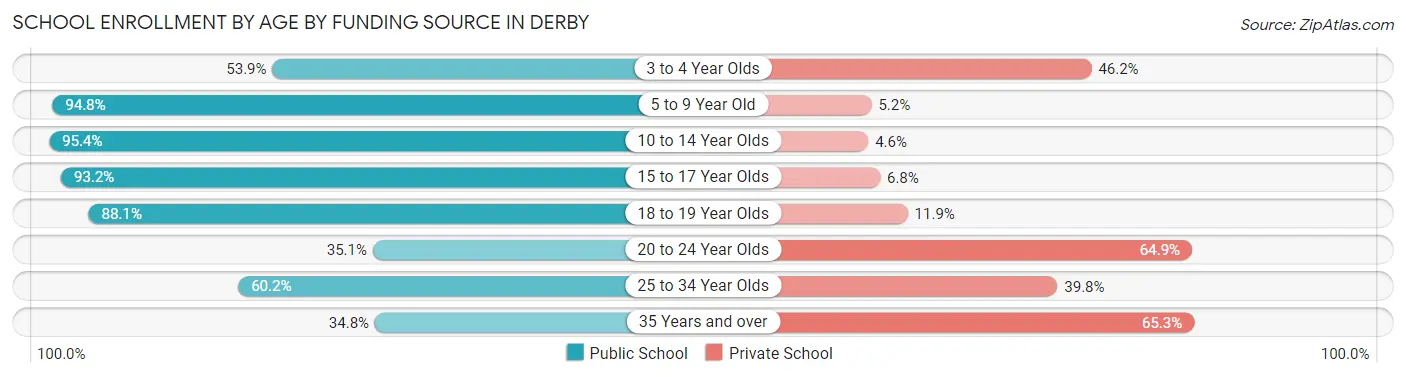
| Age Bracket | Public School | Private School |
| 3 to 4 Year Olds | 49 (53.8%) | 42 (46.2%) |
| 5 to 9 Year Old | 366 (94.8%) | 20 (5.2%) |
| 10 to 14 Year Olds | 751 (95.4%) | 36 (4.6%) |
| 15 to 17 Year Olds | 468 (93.2%) | 34 (6.8%) |
| 18 to 19 Year Olds | 133 (88.1%) | 18 (11.9%) |
| 20 to 24 Year Olds | 39 (35.1%) | 72 (64.9%) |
| 25 to 34 Year Olds | 180 (60.2%) | 119 (39.8%) |
| 35 Years and over | 82 (34.7%) | 154 (65.2%) |
| Total | 2,068 (80.7%) | 495 (19.3%) |
Educational Attainment by Field of Study in Derby
Science & technology (498 | 15.5%), business (486 | 15.2%), engineering (330 | 10.3%), psychology (314 | 9.8%), and communications (272 | 8.5%) are the most common fields of study among 3,206 individuals in Derby who have obtained a bachelor's degree or higher.
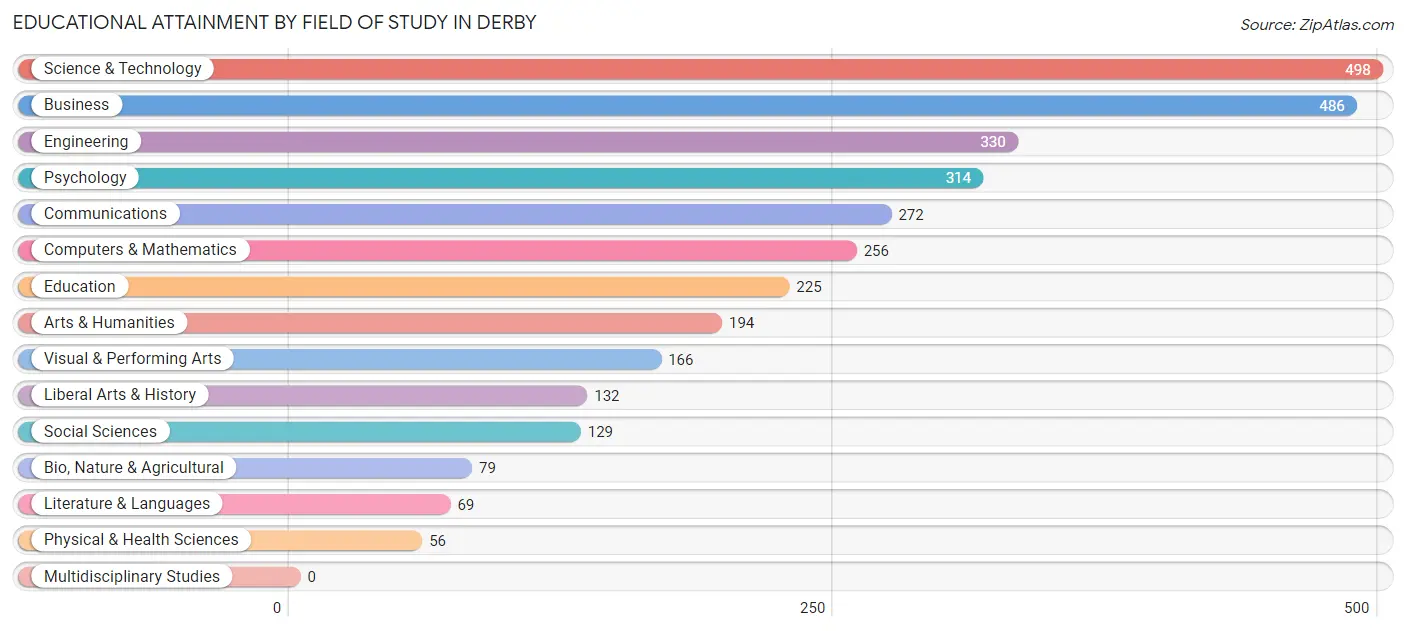
| Field of Study | # Graduates | % Graduates |
| Computers & Mathematics | 256 | 8.0% |
| Bio, Nature & Agricultural | 79 | 2.5% |
| Physical & Health Sciences | 56 | 1.8% |
| Psychology | 314 | 9.8% |
| Social Sciences | 129 | 4.0% |
| Engineering | 330 | 10.3% |
| Multidisciplinary Studies | 0 | 0.0% |
| Science & Technology | 498 | 15.5% |
| Business | 486 | 15.2% |
| Education | 225 | 7.0% |
| Literature & Languages | 69 | 2.1% |
| Liberal Arts & History | 132 | 4.1% |
| Visual & Performing Arts | 166 | 5.2% |
| Communications | 272 | 8.5% |
| Arts & Humanities | 194 | 6.0% |
| Total | 3,206 | 100.0% |
Transportation & Commute in Derby
Vehicle Availability by Sex in Derby
The most prevalent vehicle ownership categories in Derby are males with 2 vehicles (1,364, accounting for 47.3%) and females with 2 vehicles (1,721, making up 40.0%).
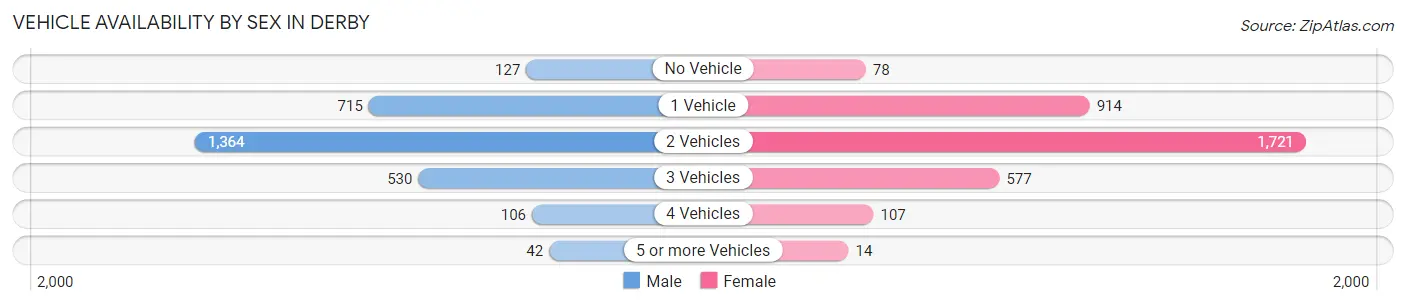
| Vehicles Available | Male | Female |
| No Vehicle | 127 (4.4%) | 78 (2.3%) |
| 1 Vehicle | 715 (24.8%) | 914 (26.8%) |
| 2 Vehicles | 1,364 (47.3%) | 1,721 (50.4%) |
| 3 Vehicles | 530 (18.4%) | 577 (16.9%) |
| 4 Vehicles | 106 (3.7%) | 107 (3.1%) |
| 5 or more Vehicles | 42 (1.5%) | 14 (0.4%) |
| Total | 2,884 (100.0%) | 3,411 (100.0%) |
Commute Time in Derby
The most frequently occuring commute durations in Derby are 20 to 24 minutes (918 commuters, 16.7%), 15 to 19 minutes (745 commuters, 13.5%), and 5 to 9 minutes (676 commuters, 12.3%).
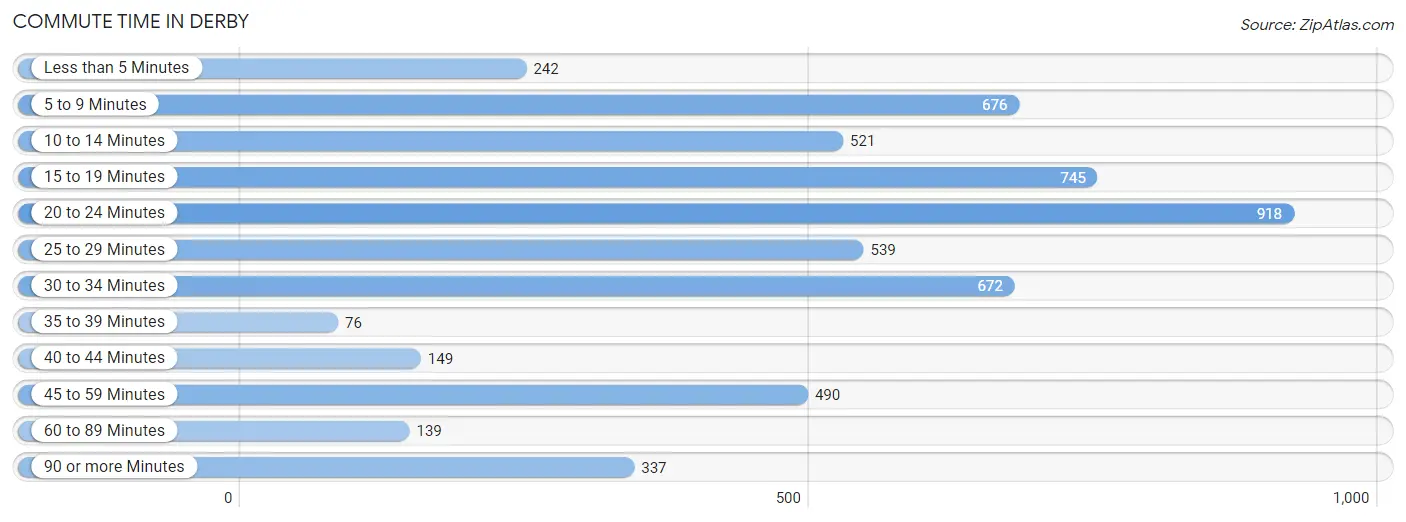
| Commute Time | # Commuters | % Commuters |
| Less than 5 Minutes | 242 | 4.4% |
| 5 to 9 Minutes | 676 | 12.3% |
| 10 to 14 Minutes | 521 | 9.5% |
| 15 to 19 Minutes | 745 | 13.5% |
| 20 to 24 Minutes | 918 | 16.7% |
| 25 to 29 Minutes | 539 | 9.8% |
| 30 to 34 Minutes | 672 | 12.2% |
| 35 to 39 Minutes | 76 | 1.4% |
| 40 to 44 Minutes | 149 | 2.7% |
| 45 to 59 Minutes | 490 | 8.9% |
| 60 to 89 Minutes | 139 | 2.5% |
| 90 or more Minutes | 337 | 6.1% |
Commute Time by Sex in Derby
The most common commute times in Derby are 20 to 24 minutes (367 commuters, 14.7%) for males and 20 to 24 minutes (551 commuters, 18.3%) for females.
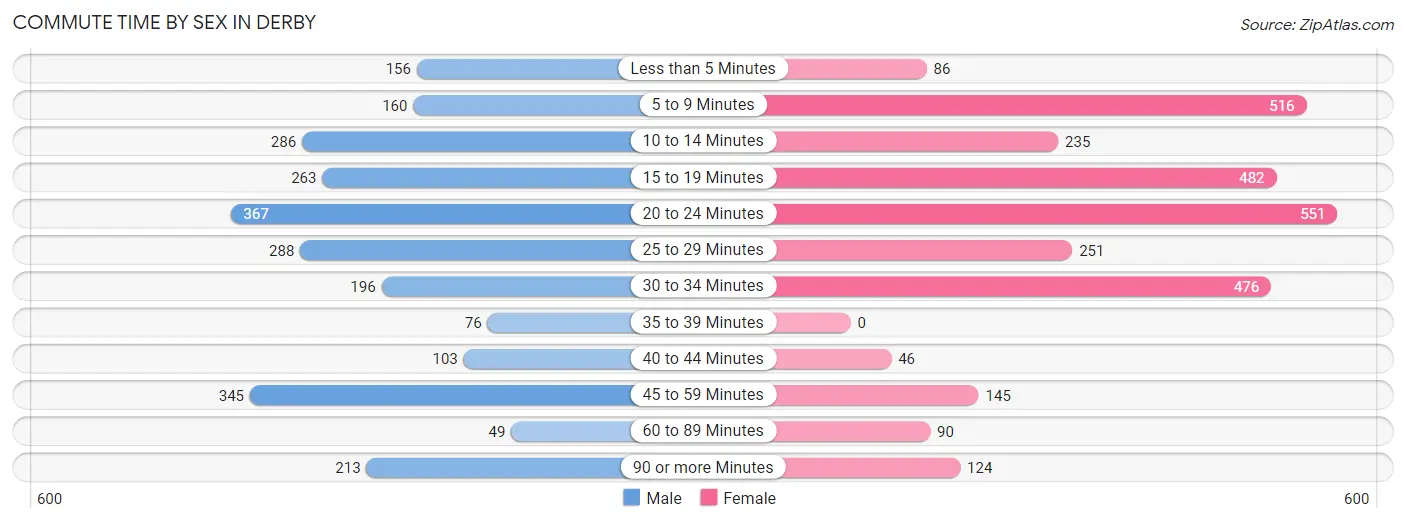
| Commute Time | Male | Female |
| Less than 5 Minutes | 156 (6.2%) | 86 (2.9%) |
| 5 to 9 Minutes | 160 (6.4%) | 516 (17.2%) |
| 10 to 14 Minutes | 286 (11.4%) | 235 (7.8%) |
| 15 to 19 Minutes | 263 (10.5%) | 482 (16.1%) |
| 20 to 24 Minutes | 367 (14.7%) | 551 (18.3%) |
| 25 to 29 Minutes | 288 (11.5%) | 251 (8.4%) |
| 30 to 34 Minutes | 196 (7.8%) | 476 (15.9%) |
| 35 to 39 Minutes | 76 (3.0%) | 0 (0.0%) |
| 40 to 44 Minutes | 103 (4.1%) | 46 (1.5%) |
| 45 to 59 Minutes | 345 (13.8%) | 145 (4.8%) |
| 60 to 89 Minutes | 49 (2.0%) | 90 (3.0%) |
| 90 or more Minutes | 213 (8.5%) | 124 (4.1%) |
Time of Departure to Work by Sex in Derby
The most frequent times of departure to work in Derby are 7:00 AM to 7:29 AM (403, 16.1%) for males and 7:00 AM to 7:29 AM (778, 25.9%) for females.
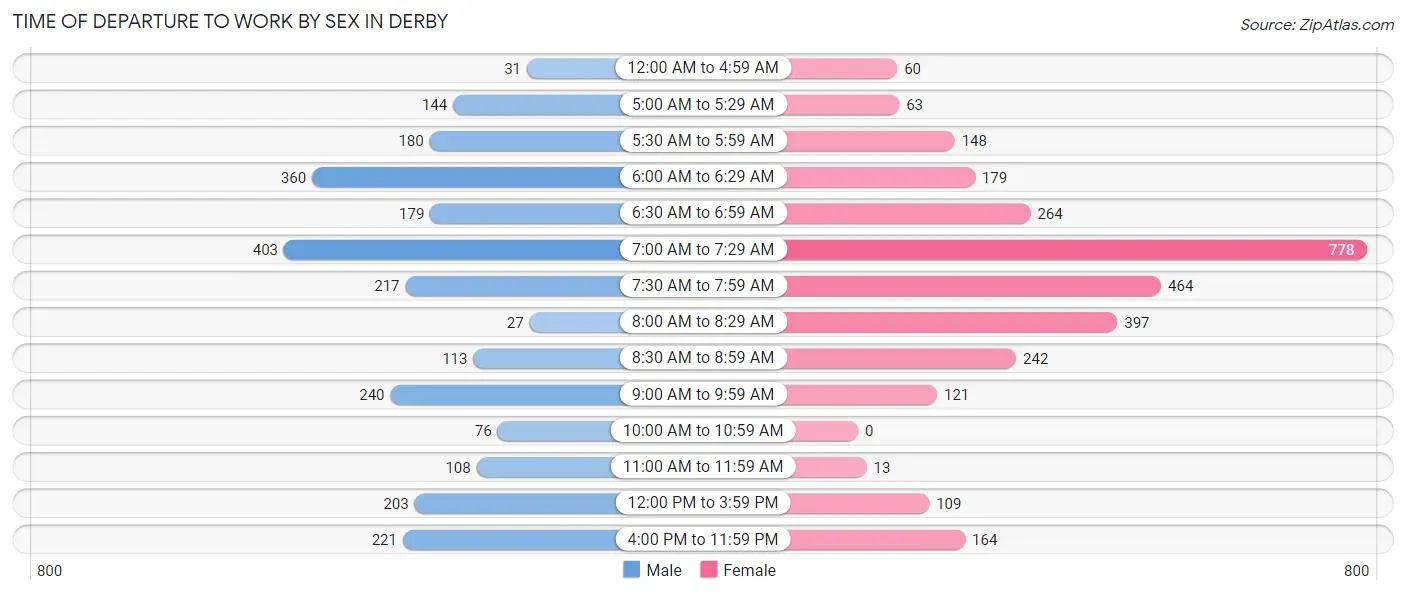
| Time of Departure | Male | Female |
| 12:00 AM to 4:59 AM | 31 (1.2%) | 60 (2.0%) |
| 5:00 AM to 5:29 AM | 144 (5.8%) | 63 (2.1%) |
| 5:30 AM to 5:59 AM | 180 (7.2%) | 148 (4.9%) |
| 6:00 AM to 6:29 AM | 360 (14.4%) | 179 (6.0%) |
| 6:30 AM to 6:59 AM | 179 (7.1%) | 264 (8.8%) |
| 7:00 AM to 7:29 AM | 403 (16.1%) | 778 (25.9%) |
| 7:30 AM to 7:59 AM | 217 (8.7%) | 464 (15.5%) |
| 8:00 AM to 8:29 AM | 27 (1.1%) | 397 (13.2%) |
| 8:30 AM to 8:59 AM | 113 (4.5%) | 242 (8.1%) |
| 9:00 AM to 9:59 AM | 240 (9.6%) | 121 (4.0%) |
| 10:00 AM to 10:59 AM | 76 (3.0%) | 0 (0.0%) |
| 11:00 AM to 11:59 AM | 108 (4.3%) | 13 (0.4%) |
| 12:00 PM to 3:59 PM | 203 (8.1%) | 109 (3.6%) |
| 4:00 PM to 11:59 PM | 221 (8.8%) | 164 (5.5%) |
| Total | 2,502 (100.0%) | 3,002 (100.0%) |
Housing Occupancy in Derby
Occupancy by Ownership in Derby
Of the total 5,713 dwellings in Derby, owner-occupied units account for 3,645 (63.8%), while renter-occupied units make up 2,068 (36.2%).
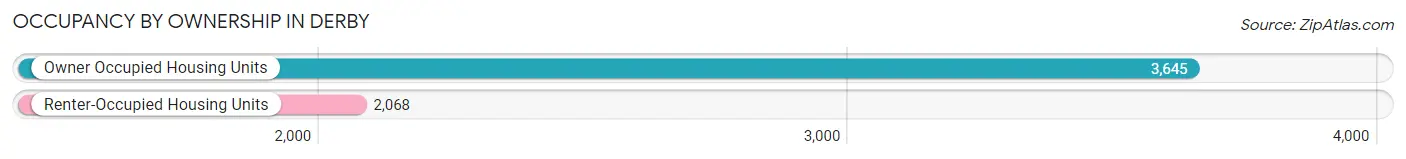
| Occupancy | # Housing Units | % Housing Units |
| Owner Occupied Housing Units | 3,645 | 63.8% |
| Renter-Occupied Housing Units | 2,068 | 36.2% |
| Total Occupied Housing Units | 5,713 | 100.0% |
Occupancy by Household Size in Derby
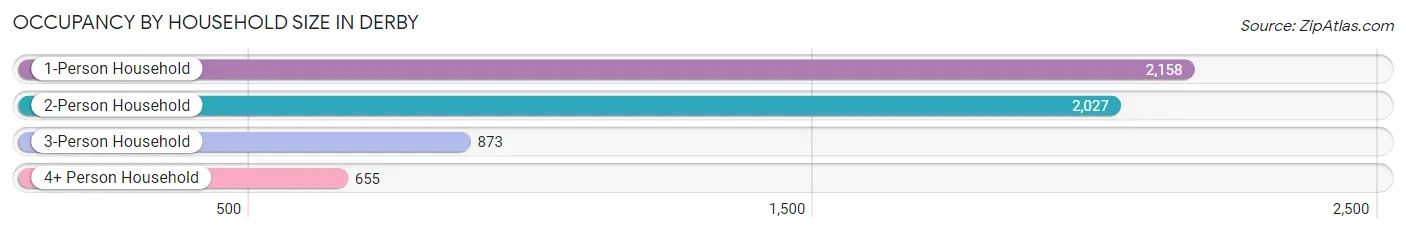
| Household Size | # Housing Units | % Housing Units |
| 1-Person Household | 2,158 | 37.8% |
| 2-Person Household | 2,027 | 35.5% |
| 3-Person Household | 873 | 15.3% |
| 4+ Person Household | 655 | 11.5% |
| Total Housing Units | 5,713 | 100.0% |
Occupancy by Ownership by Household Size in Derby
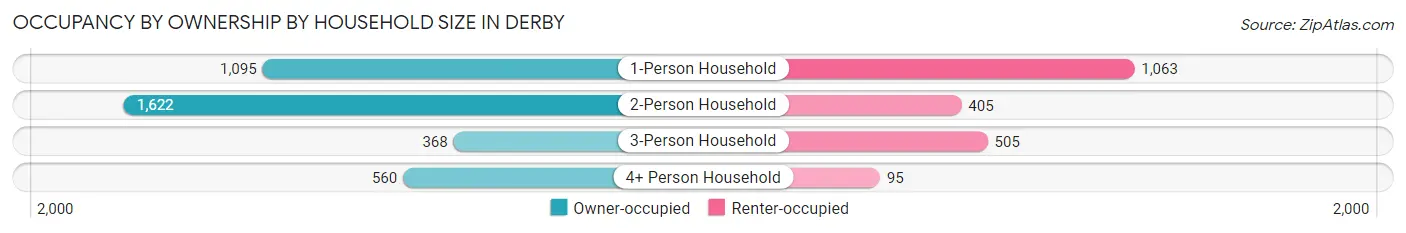
| Household Size | Owner-occupied | Renter-occupied |
| 1-Person Household | 1,095 (50.7%) | 1,063 (49.3%) |
| 2-Person Household | 1,622 (80.0%) | 405 (20.0%) |
| 3-Person Household | 368 (42.1%) | 505 (57.9%) |
| 4+ Person Household | 560 (85.5%) | 95 (14.5%) |
| Total Housing Units | 3,645 (63.8%) | 2,068 (36.2%) |
Occupancy by Educational Attainment in Derby
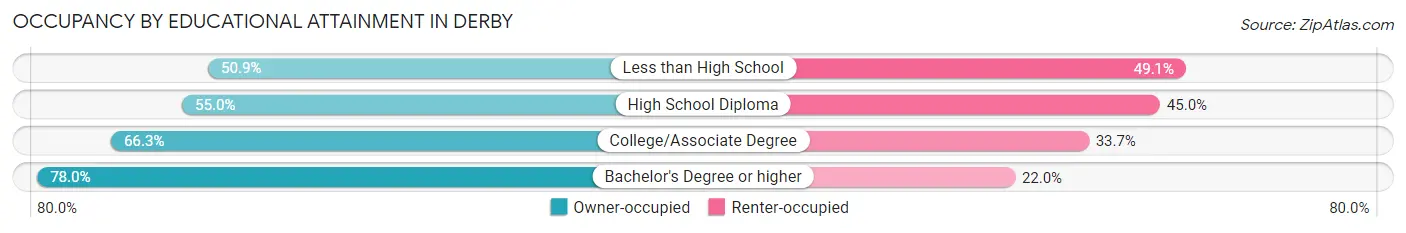
| Household Size | Owner-occupied | Renter-occupied |
| Less than High School | 259 (50.9%) | 250 (49.1%) |
| High School Diploma | 1,165 (55.0%) | 953 (45.0%) |
| College/Associate Degree | 1,052 (66.3%) | 535 (33.7%) |
| Bachelor's Degree or higher | 1,169 (78.0%) | 330 (22.0%) |
Occupancy by Age of Householder in Derby
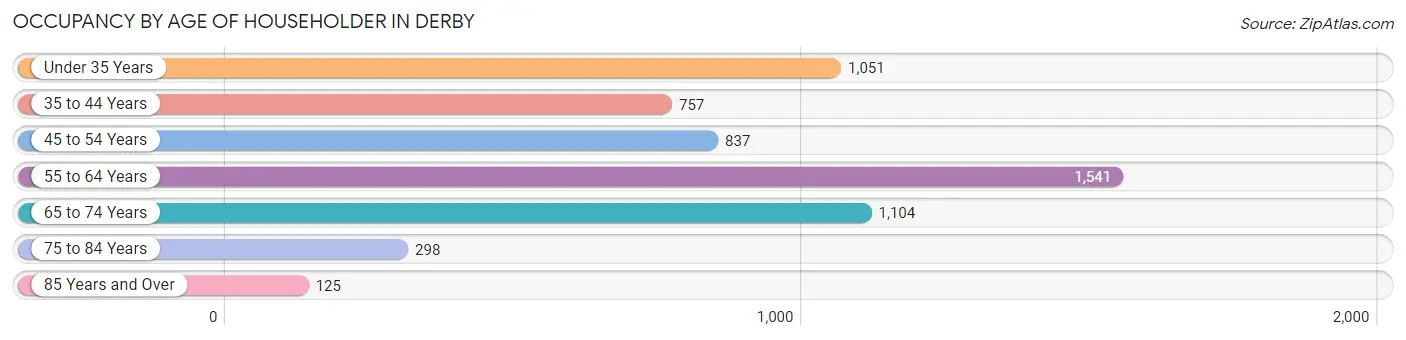
| Age Bracket | # Households | % Households |
| Under 35 Years | 1,051 | 18.4% |
| 35 to 44 Years | 757 | 13.3% |
| 45 to 54 Years | 837 | 14.6% |
| 55 to 64 Years | 1,541 | 27.0% |
| 65 to 74 Years | 1,104 | 19.3% |
| 75 to 84 Years | 298 | 5.2% |
| 85 Years and Over | 125 | 2.2% |
| Total | 5,713 | 100.0% |
Housing Finances in Derby
Median Income by Occupancy in Derby
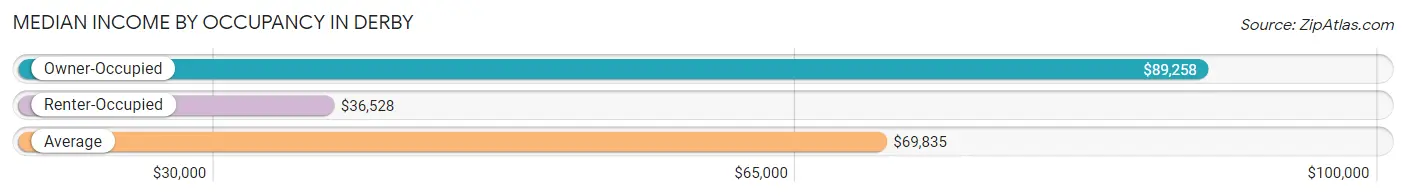
| Occupancy Type | # Households | Median Income |
| Owner-Occupied | 3,645 (63.8%) | $89,258 |
| Renter-Occupied | 2,068 (36.2%) | $36,528 |
| Average | 5,713 (100.0%) | $69,835 |
Occupancy by Householder Income Bracket in Derby
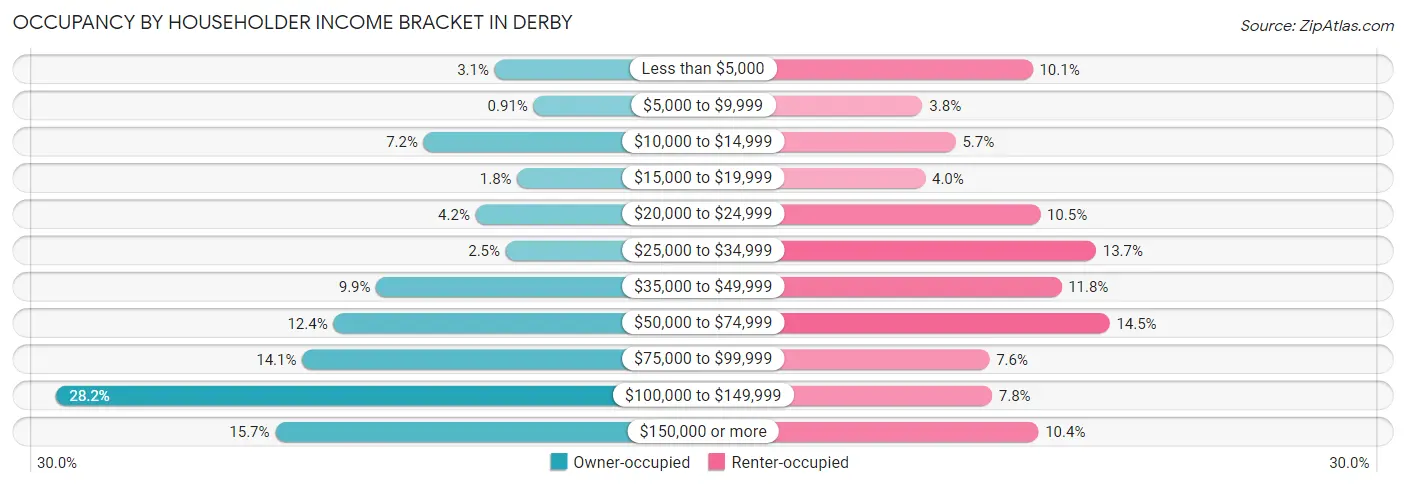
| Income Bracket | Owner-occupied | Renter-occupied |
| Less than $5,000 | 114 (3.1%) | 209 (10.1%) |
| $5,000 to $9,999 | 33 (0.9%) | 79 (3.8%) |
| $10,000 to $14,999 | 262 (7.2%) | 118 (5.7%) |
| $15,000 to $19,999 | 67 (1.8%) | 82 (4.0%) |
| $20,000 to $24,999 | 154 (4.2%) | 218 (10.5%) |
| $25,000 to $34,999 | 91 (2.5%) | 284 (13.7%) |
| $35,000 to $49,999 | 361 (9.9%) | 243 (11.7%) |
| $50,000 to $74,999 | 450 (12.3%) | 300 (14.5%) |
| $75,000 to $99,999 | 515 (14.1%) | 158 (7.6%) |
| $100,000 to $149,999 | 1,027 (28.2%) | 161 (7.8%) |
| $150,000 or more | 571 (15.7%) | 216 (10.4%) |
| Total | 3,645 (100.0%) | 2,068 (100.0%) |
Monthly Housing Cost Tiers in Derby
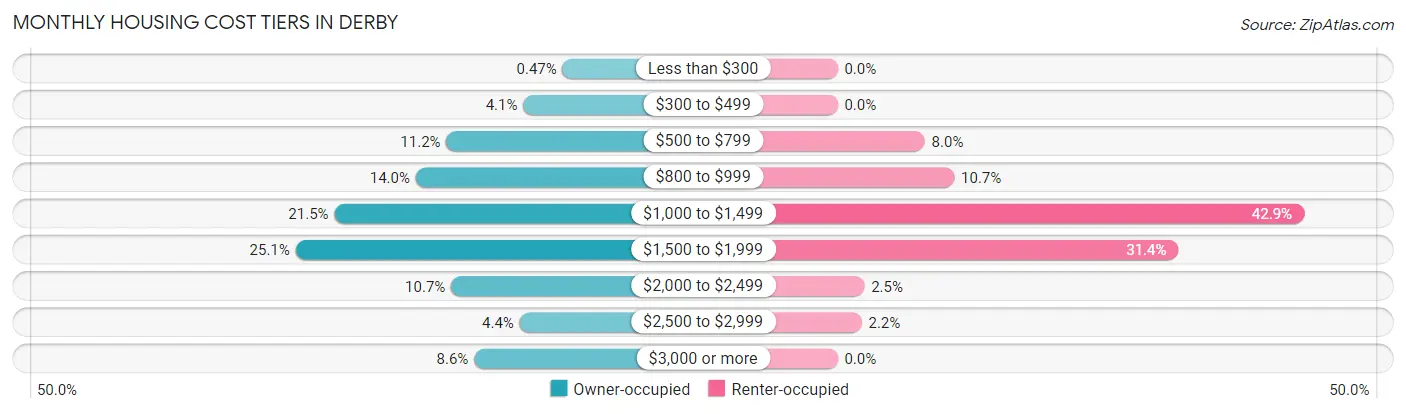
| Monthly Cost | Owner-occupied | Renter-occupied |
| Less than $300 | 17 (0.5%) | 0 (0.0%) |
| $300 to $499 | 149 (4.1%) | 0 (0.0%) |
| $500 to $799 | 407 (11.2%) | 166 (8.0%) |
| $800 to $999 | 510 (14.0%) | 222 (10.7%) |
| $1,000 to $1,499 | 783 (21.5%) | 888 (42.9%) |
| $1,500 to $1,999 | 913 (25.1%) | 649 (31.4%) |
| $2,000 to $2,499 | 391 (10.7%) | 51 (2.5%) |
| $2,500 to $2,999 | 161 (4.4%) | 46 (2.2%) |
| $3,000 or more | 314 (8.6%) | 0 (0.0%) |
| Total | 3,645 (100.0%) | 2,068 (100.0%) |
Physical Housing Characteristics in Derby
Housing Structures in Derby
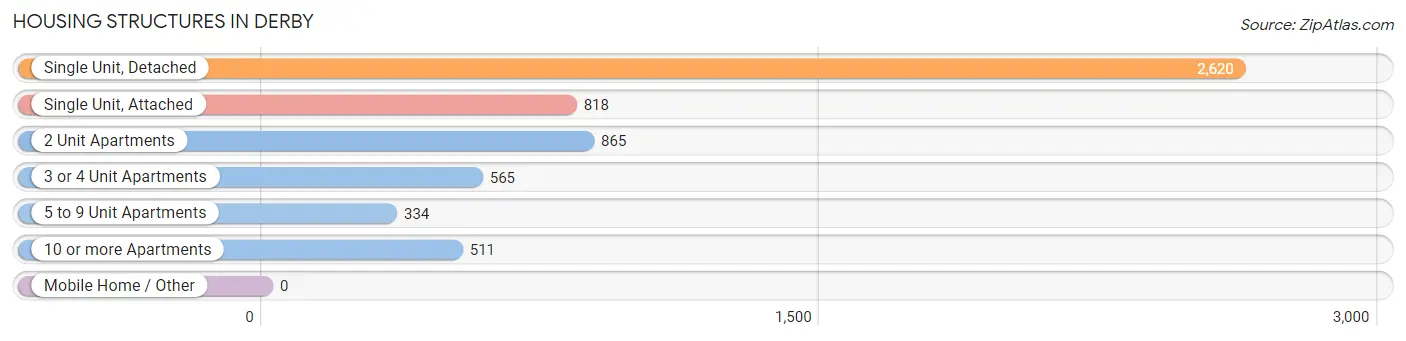
| Structure Type | # Housing Units | % Housing Units |
| Single Unit, Detached | 2,620 | 45.9% |
| Single Unit, Attached | 818 | 14.3% |
| 2 Unit Apartments | 865 | 15.1% |
| 3 or 4 Unit Apartments | 565 | 9.9% |
| 5 to 9 Unit Apartments | 334 | 5.9% |
| 10 or more Apartments | 511 | 8.9% |
| Mobile Home / Other | 0 | 0.0% |
| Total | 5,713 | 100.0% |
Housing Structures by Occupancy in Derby
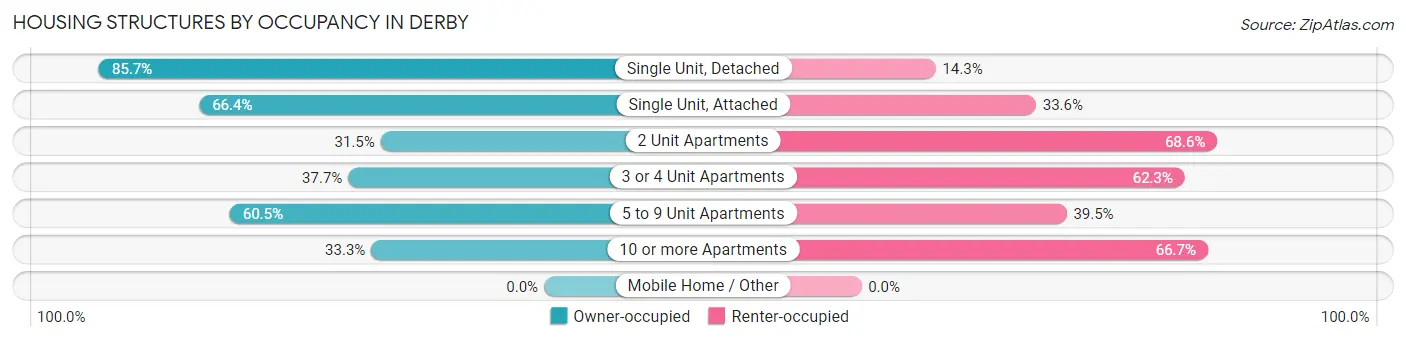
| Structure Type | Owner-occupied | Renter-occupied |
| Single Unit, Detached | 2,245 (85.7%) | 375 (14.3%) |
| Single Unit, Attached | 543 (66.4%) | 275 (33.6%) |
| 2 Unit Apartments | 272 (31.5%) | 593 (68.5%) |
| 3 or 4 Unit Apartments | 213 (37.7%) | 352 (62.3%) |
| 5 to 9 Unit Apartments | 202 (60.5%) | 132 (39.5%) |
| 10 or more Apartments | 170 (33.3%) | 341 (66.7%) |
| Mobile Home / Other | 0 (0.0%) | 0 (0.0%) |
| Total | 3,645 (63.8%) | 2,068 (36.2%) |
Housing Structures by Number of Rooms in Derby
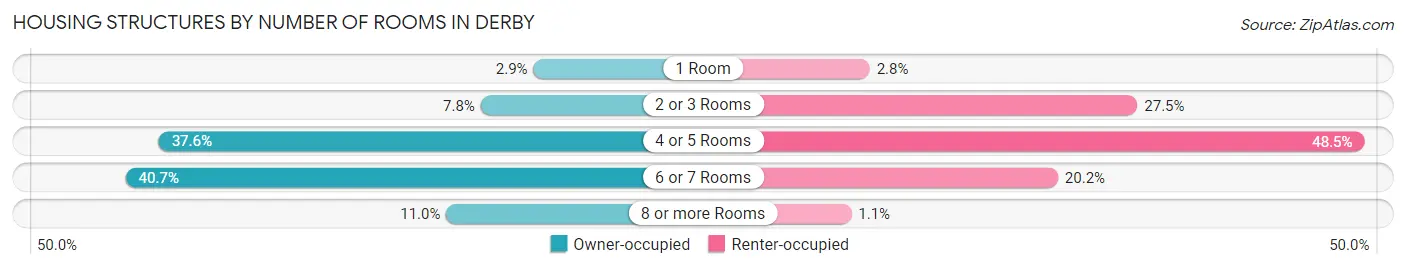
| Number of Rooms | Owner-occupied | Renter-occupied |
| 1 Room | 107 (2.9%) | 57 (2.8%) |
| 2 or 3 Rooms | 285 (7.8%) | 569 (27.5%) |
| 4 or 5 Rooms | 1,370 (37.6%) | 1,003 (48.5%) |
| 6 or 7 Rooms | 1,482 (40.7%) | 417 (20.2%) |
| 8 or more Rooms | 401 (11.0%) | 22 (1.1%) |
| Total | 3,645 (100.0%) | 2,068 (100.0%) |
Housing Structure by Heating Type in Derby
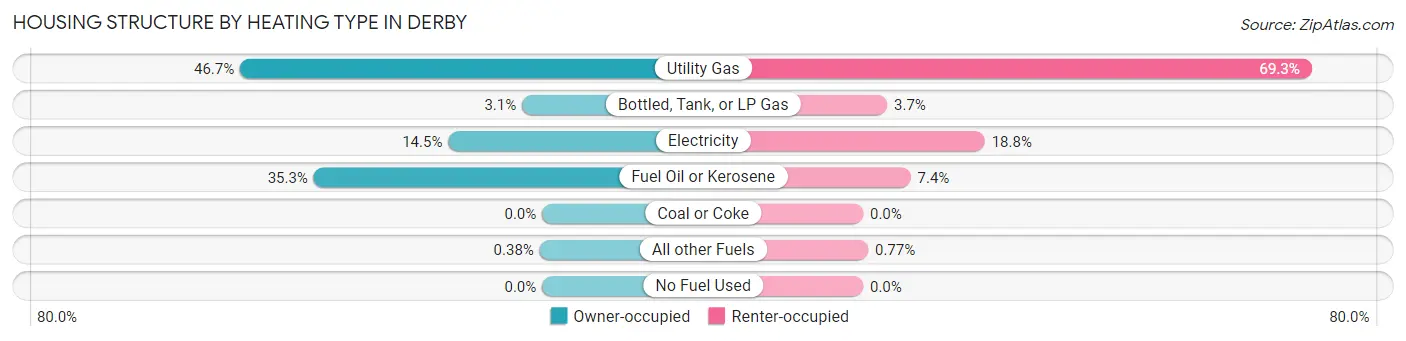
| Heating Type | Owner-occupied | Renter-occupied |
| Utility Gas | 1,702 (46.7%) | 1,434 (69.3%) |
| Bottled, Tank, or LP Gas | 113 (3.1%) | 77 (3.7%) |
| Electricity | 529 (14.5%) | 389 (18.8%) |
| Fuel Oil or Kerosene | 1,287 (35.3%) | 152 (7.3%) |
| Coal or Coke | 0 (0.0%) | 0 (0.0%) |
| All other Fuels | 14 (0.4%) | 16 (0.8%) |
| No Fuel Used | 0 (0.0%) | 0 (0.0%) |
| Total | 3,645 (100.0%) | 2,068 (100.0%) |
Household Vehicle Usage in Derby
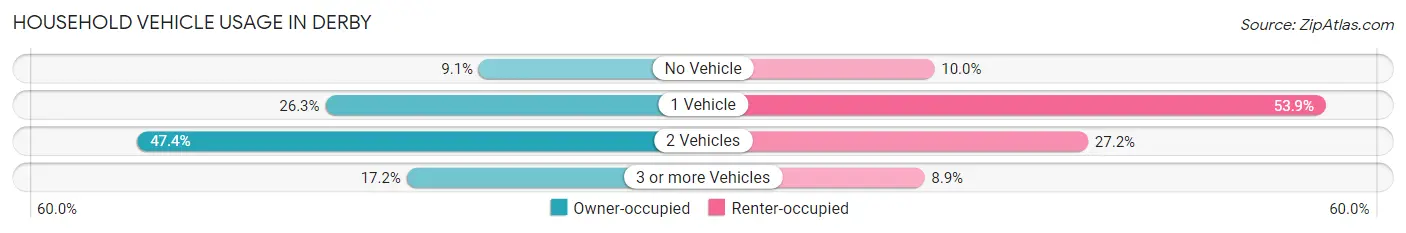
| Vehicles per Household | Owner-occupied | Renter-occupied |
| No Vehicle | 332 (9.1%) | 207 (10.0%) |
| 1 Vehicle | 959 (26.3%) | 1,114 (53.9%) |
| 2 Vehicles | 1,727 (47.4%) | 563 (27.2%) |
| 3 or more Vehicles | 627 (17.2%) | 184 (8.9%) |
| Total | 3,645 (100.0%) | 2,068 (100.0%) |
Real Estate & Mortgages in Derby
Real Estate and Mortgage Overview in Derby
| Characteristic | Without Mortgage | With Mortgage |
| Housing Units | 1,429 | 2,216 |
| Median Property Value | $203,200 | $233,200 |
| Median Household Income | $80,792 | $399 |
| Monthly Housing Costs | $885 | $314 |
| Real Estate Taxes | $4,879 | $0 |
Property Value by Mortgage Status in Derby
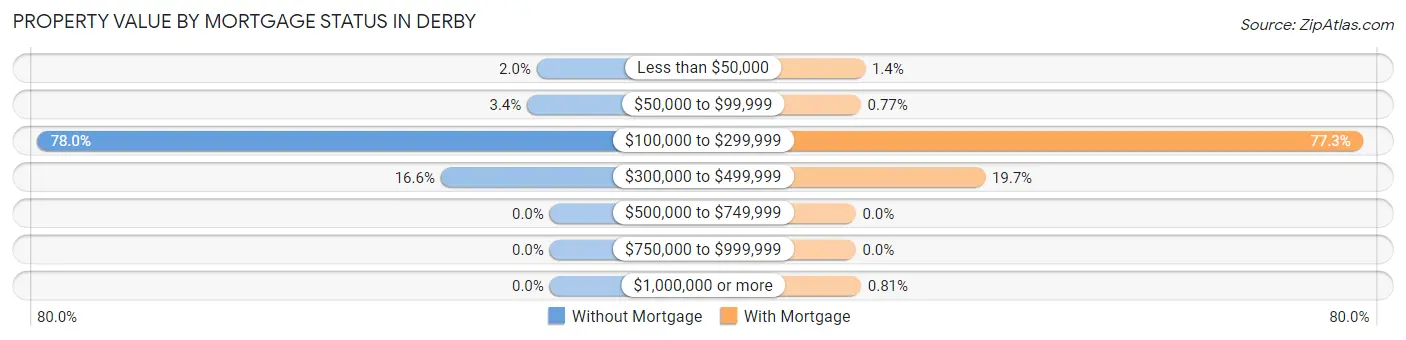
| Property Value | Without Mortgage | With Mortgage |
| Less than $50,000 | 28 (2.0%) | 32 (1.4%) |
| $50,000 to $99,999 | 49 (3.4%) | 17 (0.8%) |
| $100,000 to $299,999 | 1,115 (78.0%) | 1,712 (77.3%) |
| $300,000 to $499,999 | 237 (16.6%) | 437 (19.7%) |
| $500,000 to $749,999 | 0 (0.0%) | 0 (0.0%) |
| $750,000 to $999,999 | 0 (0.0%) | 0 (0.0%) |
| $1,000,000 or more | 0 (0.0%) | 18 (0.8%) |
| Total | 1,429 (100.0%) | 2,216 (100.0%) |
Household Income by Mortgage Status in Derby
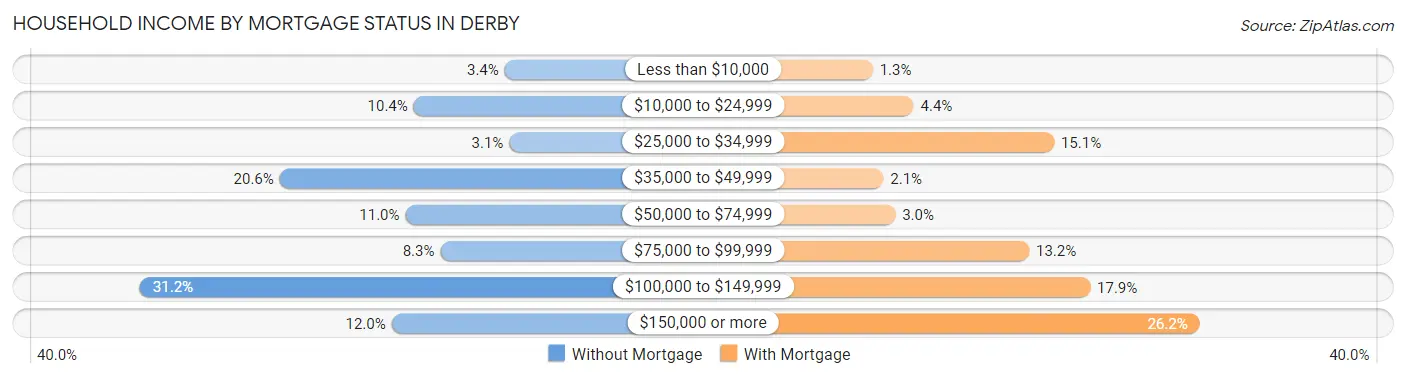
| Household Income | Without Mortgage | With Mortgage |
| Less than $10,000 | 49 (3.4%) | 29 (1.3%) |
| $10,000 to $24,999 | 148 (10.4%) | 98 (4.4%) |
| $25,000 to $34,999 | 44 (3.1%) | 335 (15.1%) |
| $35,000 to $49,999 | 294 (20.6%) | 47 (2.1%) |
| $50,000 to $74,999 | 157 (11.0%) | 67 (3.0%) |
| $75,000 to $99,999 | 119 (8.3%) | 293 (13.2%) |
| $100,000 to $149,999 | 446 (31.2%) | 396 (17.9%) |
| $150,000 or more | 172 (12.0%) | 581 (26.2%) |
| Total | 1,429 (100.0%) | 2,216 (100.0%) |
Property Value to Household Income Ratio in Derby
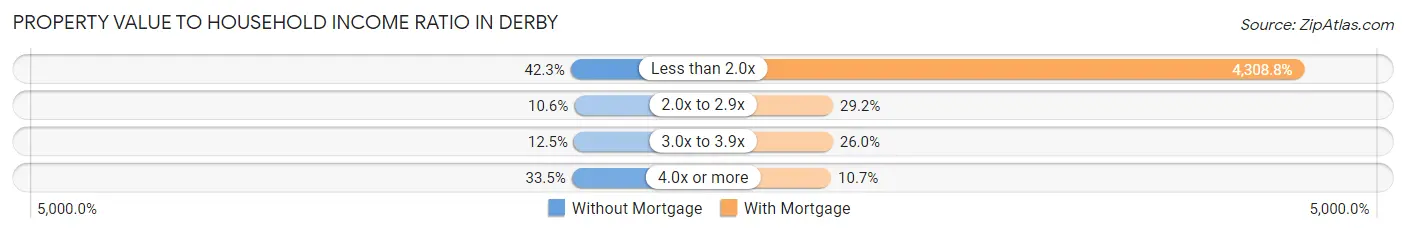
| Value-to-Income Ratio | Without Mortgage | With Mortgage |
| Less than 2.0x | 605 (42.3%) | 95,484 (4,308.8%) |
| 2.0x to 2.9x | 152 (10.6%) | 646 (29.1%) |
| 3.0x to 3.9x | 178 (12.5%) | 577 (26.0%) |
| 4.0x or more | 478 (33.5%) | 237 (10.7%) |
| Total | 1,429 (100.0%) | 2,216 (100.0%) |
Real Estate Taxes by Mortgage Status in Derby
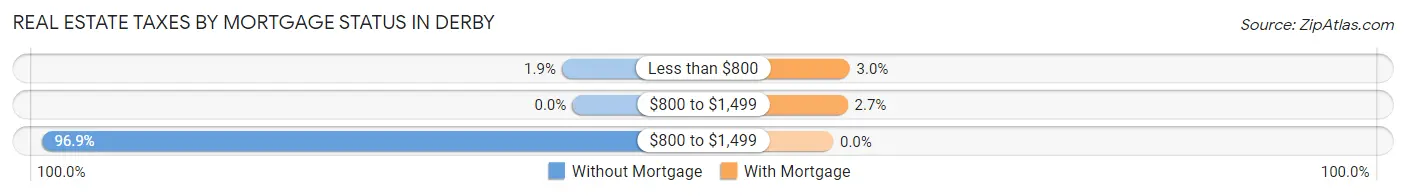
| Property Taxes | Without Mortgage | With Mortgage |
| Less than $800 | 27 (1.9%) | 67 (3.0%) |
| $800 to $1,499 | 0 (0.0%) | 59 (2.7%) |
| $800 to $1,499 | 1,385 (96.9%) | 0 (0.0%) |
| Total | 1,429 (100.0%) | 2,216 (100.0%) |
Health & Disability in Derby
Health Insurance Coverage by Age in Derby
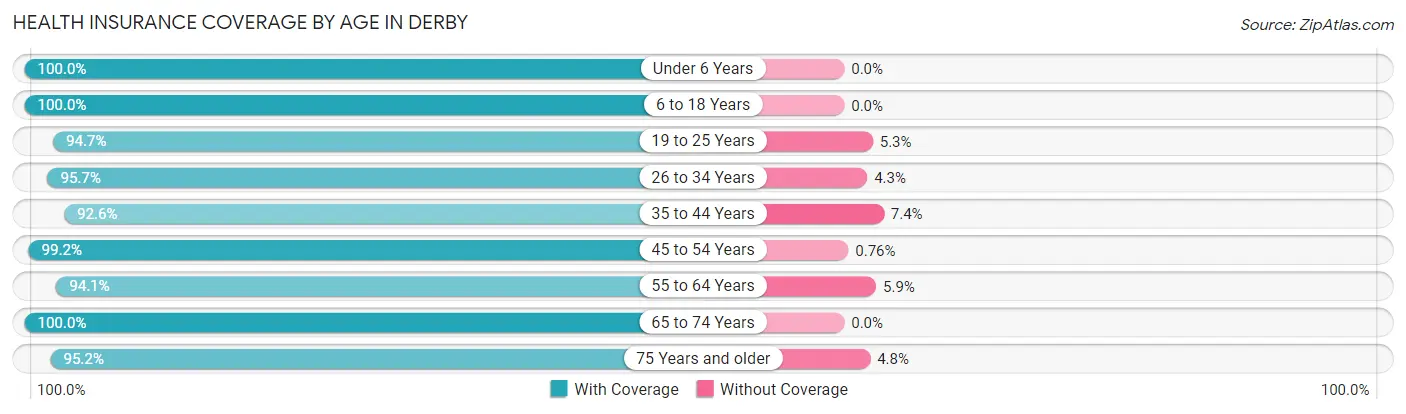
| Age Bracket | With Coverage | Without Coverage |
| Under 6 Years | 578 (100.0%) | 0 (0.0%) |
| 6 to 18 Years | 1,578 (100.0%) | 0 (0.0%) |
| 19 to 25 Years | 677 (94.7%) | 38 (5.3%) |
| 26 to 34 Years | 1,587 (95.7%) | 71 (4.3%) |
| 35 to 44 Years | 1,343 (92.6%) | 107 (7.4%) |
| 45 to 54 Years | 1,703 (99.2%) | 13 (0.8%) |
| 55 to 64 Years | 1,968 (94.1%) | 124 (5.9%) |
| 65 to 74 Years | 1,837 (100.0%) | 0 (0.0%) |
| 75 Years and older | 610 (95.2%) | 31 (4.8%) |
| Total | 11,881 (96.9%) | 384 (3.1%) |
Health Insurance Coverage by Citizenship Status in Derby
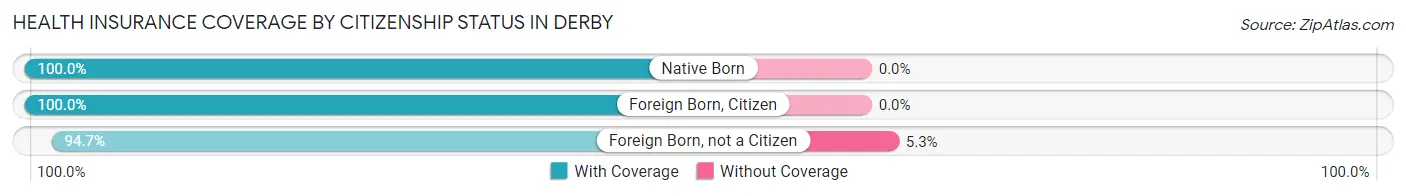
| Citizenship Status | With Coverage | Without Coverage |
| Native Born | 578 (100.0%) | 0 (0.0%) |
| Foreign Born, Citizen | 1,578 (100.0%) | 0 (0.0%) |
| Foreign Born, not a Citizen | 677 (94.7%) | 38 (5.3%) |
Health Insurance Coverage by Household Income in Derby
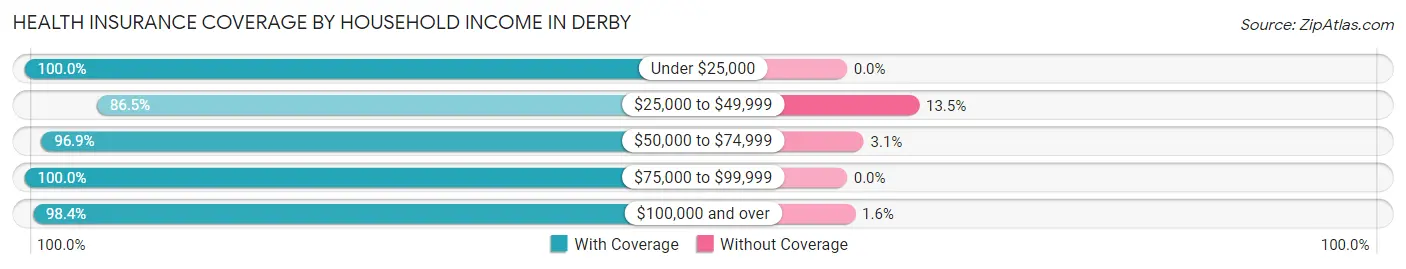
| Household Income | With Coverage | Without Coverage |
| Under $25,000 | 1,831 (100.0%) | 0 (0.0%) |
| $25,000 to $49,999 | 1,552 (86.5%) | 243 (13.5%) |
| $50,000 to $74,999 | 1,727 (96.9%) | 56 (3.1%) |
| $75,000 to $99,999 | 1,367 (100.0%) | 0 (0.0%) |
| $100,000 and over | 5,375 (98.4%) | 85 (1.6%) |
Public vs Private Health Insurance Coverage by Age in Derby
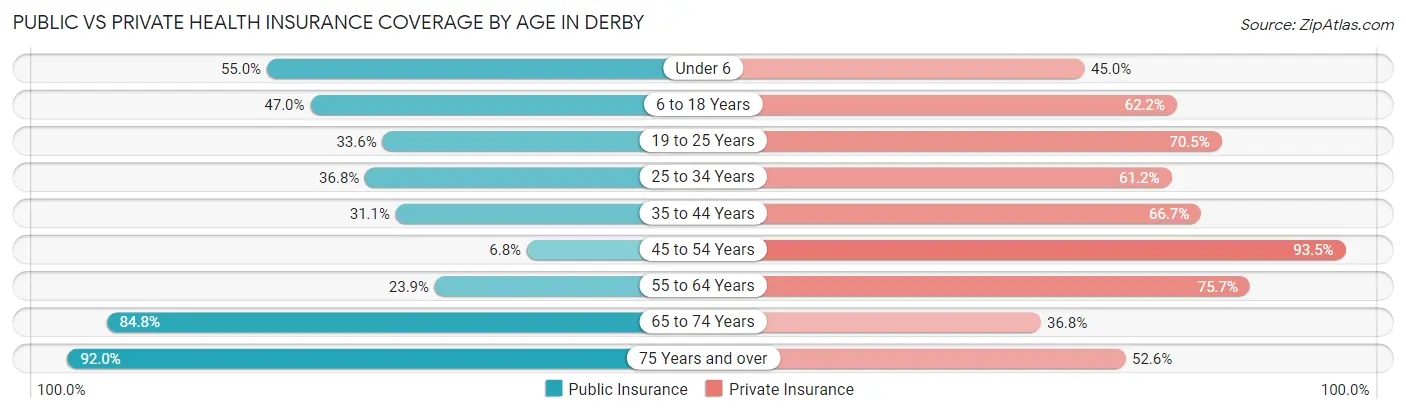
| Age Bracket | Public Insurance | Private Insurance |
| Under 6 | 318 (55.0%) | 260 (45.0%) |
| 6 to 18 Years | 741 (47.0%) | 981 (62.2%) |
| 19 to 25 Years | 240 (33.6%) | 504 (70.5%) |
| 25 to 34 Years | 610 (36.8%) | 1,014 (61.2%) |
| 35 to 44 Years | 451 (31.1%) | 967 (66.7%) |
| 45 to 54 Years | 116 (6.8%) | 1,604 (93.5%) |
| 55 to 64 Years | 499 (23.8%) | 1,584 (75.7%) |
| 65 to 74 Years | 1,557 (84.8%) | 676 (36.8%) |
| 75 Years and over | 590 (92.0%) | 337 (52.6%) |
| Total | 5,122 (41.8%) | 7,927 (64.6%) |
Disability Status by Sex by Age in Derby
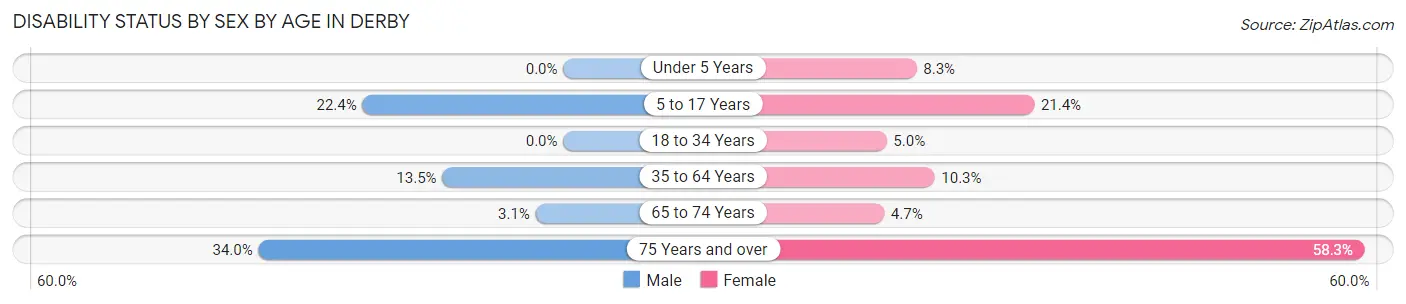
| Age Bracket | Male | Female |
| Under 5 Years | 0 (0.0%) | 20 (8.3%) |
| 5 to 17 Years | 199 (22.4%) | 168 (21.4%) |
| 18 to 34 Years | 0 (0.0%) | 71 (5.0%) |
| 35 to 64 Years | 319 (13.5%) | 298 (10.3%) |
| 65 to 74 Years | 27 (3.1%) | 45 (4.7%) |
| 75 Years and over | 55 (34.0%) | 279 (58.3%) |
Disability Class by Sex by Age in Derby
Disability Class: Hearing Difficulty
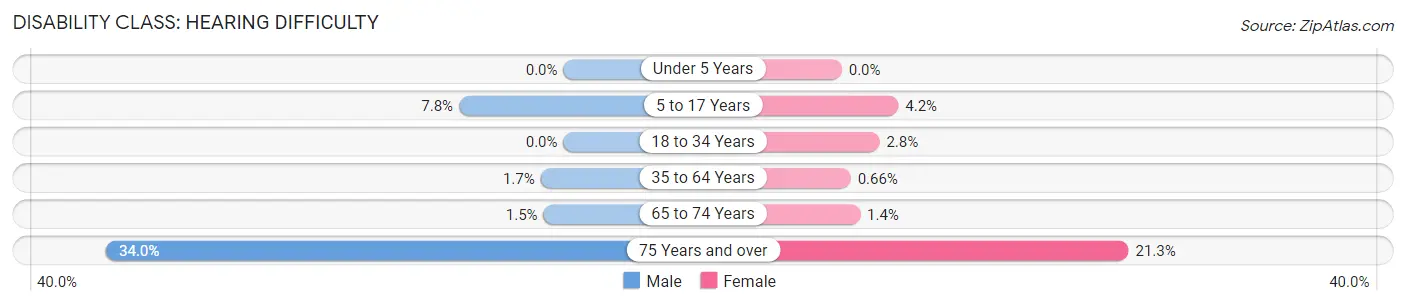
| Age Bracket | Male | Female |
| Under 5 Years | 0 (0.0%) | 0 (0.0%) |
| 5 to 17 Years | 69 (7.7%) | 33 (4.2%) |
| 18 to 34 Years | 0 (0.0%) | 40 (2.8%) |
| 35 to 64 Years | 40 (1.7%) | 19 (0.7%) |
| 65 to 74 Years | 13 (1.5%) | 13 (1.4%) |
| 75 Years and over | 55 (34.0%) | 102 (21.3%) |
Disability Class: Vision Difficulty
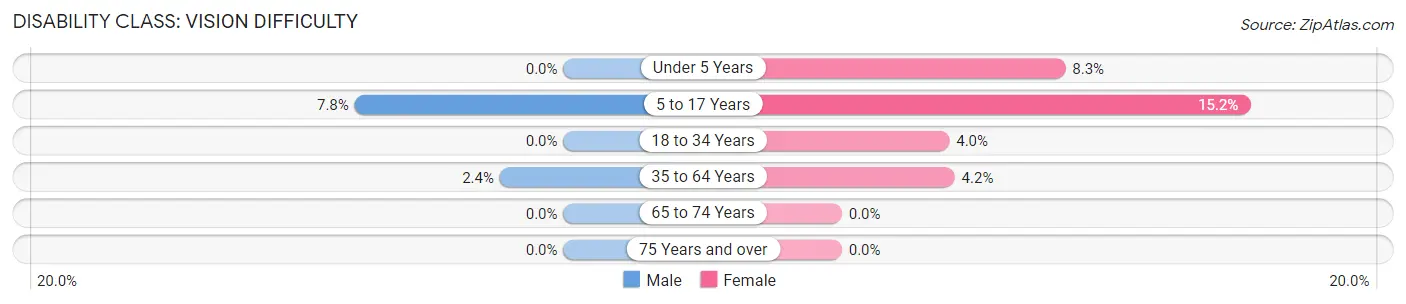
| Age Bracket | Male | Female |
| Under 5 Years | 0 (0.0%) | 20 (8.3%) |
| 5 to 17 Years | 69 (7.7%) | 119 (15.2%) |
| 18 to 34 Years | 0 (0.0%) | 57 (4.0%) |
| 35 to 64 Years | 56 (2.4%) | 121 (4.2%) |
| 65 to 74 Years | 0 (0.0%) | 0 (0.0%) |
| 75 Years and over | 0 (0.0%) | 0 (0.0%) |
Disability Class: Cognitive Difficulty
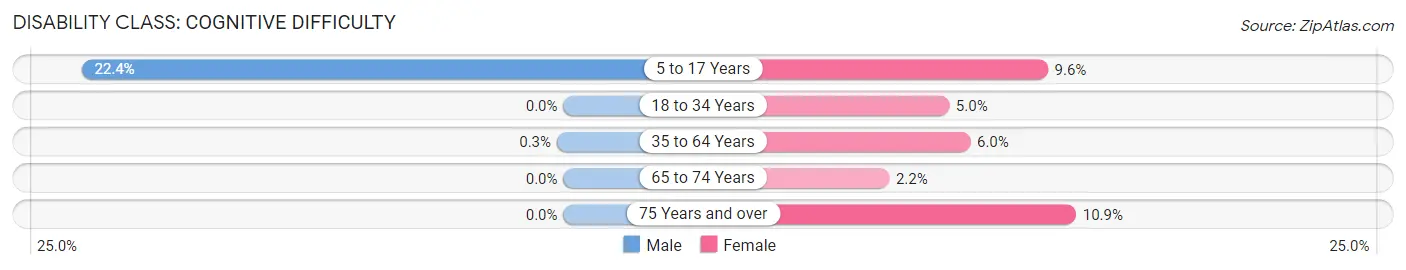
| Age Bracket | Male | Female |
| 5 to 17 Years | 199 (22.4%) | 75 (9.6%) |
| 18 to 34 Years | 0 (0.0%) | 71 (5.0%) |
| 35 to 64 Years | 7 (0.3%) | 172 (5.9%) |
| 65 to 74 Years | 0 (0.0%) | 21 (2.2%) |
| 75 Years and over | 0 (0.0%) | 52 (10.9%) |
Disability Class: Ambulatory Difficulty
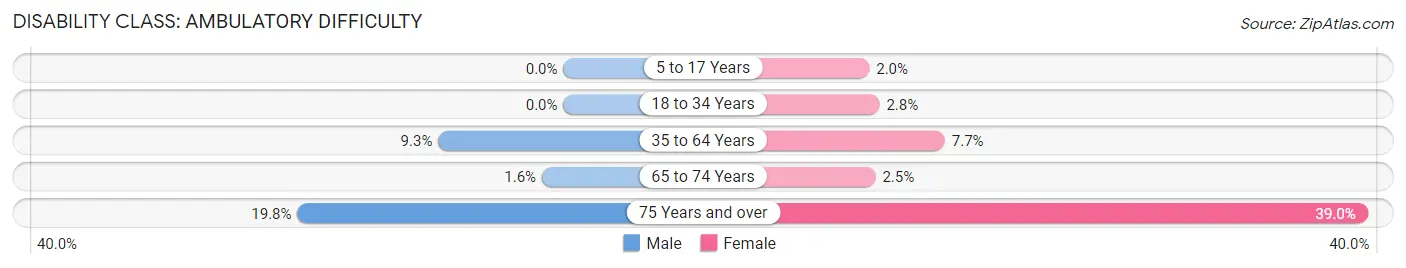
| Age Bracket | Male | Female |
| 5 to 17 Years | 0 (0.0%) | 16 (2.0%) |
| 18 to 34 Years | 0 (0.0%) | 40 (2.8%) |
| 35 to 64 Years | 220 (9.3%) | 221 (7.6%) |
| 65 to 74 Years | 14 (1.6%) | 24 (2.5%) |
| 75 Years and over | 32 (19.8%) | 187 (39.0%) |
Disability Class: Self-Care Difficulty
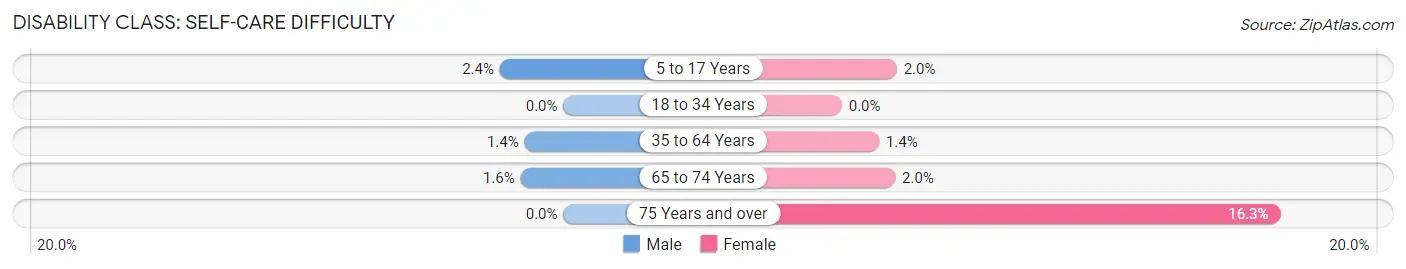
| Age Bracket | Male | Female |
| 5 to 17 Years | 21 (2.4%) | 16 (2.0%) |
| 18 to 34 Years | 0 (0.0%) | 0 (0.0%) |
| 35 to 64 Years | 34 (1.4%) | 40 (1.4%) |
| 65 to 74 Years | 14 (1.6%) | 19 (2.0%) |
| 75 Years and over | 0 (0.0%) | 78 (16.3%) |
Technology Access in Derby
Computing Device Access in Derby
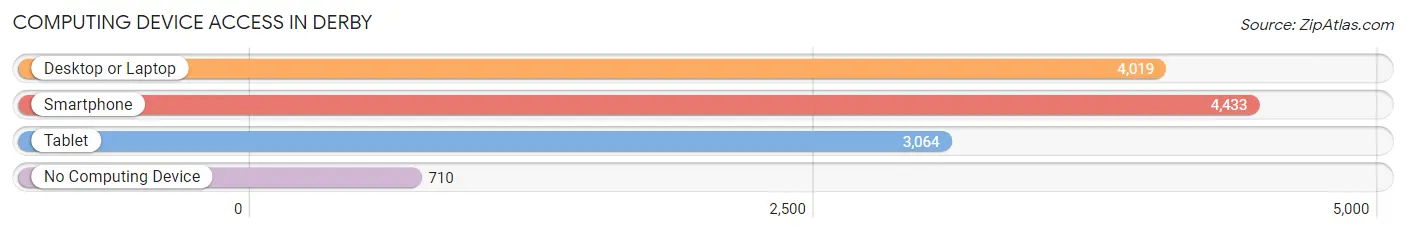
| Device Type | # Households | % Households |
| Desktop or Laptop | 4,019 | 70.4% |
| Smartphone | 4,433 | 77.6% |
| Tablet | 3,064 | 53.6% |
| No Computing Device | 710 | 12.4% |
| Total | 5,713 | 100.0% |
Internet Access in Derby

| Internet Type | # Households | % Households |
| Dial-Up Internet | 0 | 0.0% |
| Broadband Home | 4,230 | 74.0% |
| Cellular Data Only | 666 | 11.7% |
| Satellite Internet | 117 | 2.1% |
| No Internet | 699 | 12.2% |
| Total | 5,713 | 100.0% |
Derby Summary
Derby, Connecticut is a small city located in New Haven County, Connecticut. It is situated on the banks of the Housatonic River and is part of the Greater New Haven metropolitan area. The city has a population of 12,903 as of the 2010 census.
History
Derby was first settled in 1642 by John Wakeman, an English Puritan. The town was originally known as “Pequonnock”, after the Native American tribe that lived in the area. In 1675, the town was renamed “Derby” after the Earl of Derby, who was a prominent figure in the English court.
In the late 1700s, Derby was a major center for the production of hats. The city was home to several hat factories, which employed hundreds of people. The hat industry declined in the early 1900s, and the city’s economy shifted to manufacturing.
Derby was also home to several factories that produced munitions during World War II. After the war, the city’s economy shifted to manufacturing electronics and other products.
Geography
Derby is located in New Haven County, Connecticut. It is situated on the banks of the Housatonic River, which flows through the city. The city is bordered by the towns of Ansonia, Shelton, and Seymour.
The city has a total area of 5.2 square miles, of which 5.1 square miles is land and 0.1 square miles is water. The terrain is mostly flat, with some hills in the northern part of the city.
Economy
Derby’s economy is largely based on manufacturing. The city is home to several factories that produce electronics, medical equipment, and other products. The city is also home to several retail stores, restaurants, and other businesses.
The city’s largest employer is the Ansonia Copper and Brass Company, which employs over 1,000 people. Other major employers include the Derby Public Schools, the Derby Housing Authority, and the Derby Health Center.
Demographics
As of the 2010 census, Derby had a population of 12,903. The racial makeup of the city was 87.3% White, 5.3% African American, 0.5% Native American, 2.2% Asian, 0.1% Pacific Islander, 2.2% from other races, and 2.4% from two or more races. Hispanic or Latino of any race were 8.2% of the population.
The median household income in Derby was $50,945, and the median family income was $60,945. The per capita income for the city was $25,945. About 8.2% of families and 10.2% of the population were below the poverty line, including 14.2% of those under age 18 and 6.2% of those age 65 or over.
Common Questions
What is Per Capita Income in Derby?
Per Capita income in Derby is $40,298.
What is the Median Family Income in Derby?
Median Family Income in Derby is $103,003.
What is the Median Household income in Derby?
Median Household Income in Derby is $69,835.
What is Income or Wage Gap in Derby?
Income or Wage Gap in Derby is 8.3%.
Women in Derby earn 91.7 cents for every dollar earned by a man.
What is Inequality or Gini Index in Derby?
Inequality or Gini Index in Derby is 0.46.
What is the Total Population of Derby?
Total Population of Derby is 12,373.
What is the Total Male Population of Derby?
Total Male Population of Derby is 5,533.
What is the Total Female Population of Derby?
Total Female Population of Derby is 6,840.
What is the Ratio of Males per 100 Females in Derby?
There are 80.89 Males per 100 Females in Derby.
What is the Ratio of Females per 100 Males in Derby?
There are 123.62 Females per 100 Males in Derby.
What is the Median Population Age in Derby?
Median Population Age in Derby is 46.0 Years.
What is the Average Family Size in Derby
Average Family Size in Derby is 2.8 People.
What is the Average Household Size in Derby
Average Household Size in Derby is 2.1 People.
How Large is the Labor Force in Derby?
There are 6,790 People in the Labor Forcein in Derby.
What is the Percentage of People in the Labor Force in Derby?
63.8% of People are in the Labor Force in Derby.
What is the Unemployment Rate in Derby?
Unemployment Rate in Derby is 6.1%.