Northville, MI Map & Demographics
Northville Map
Northville Overview
$76,615
PER CAPITA INCOME
$190,268
AVG FAMILY INCOME
$134,330
AVG HOUSEHOLD INCOME
49.1%
WAGE / INCOME GAP [ % ]
50.9¢/ $1
WAGE / INCOME GAP [ $ ]
0.43
INEQUALITY / GINI INDEX
6,088
TOTAL POPULATION
2,874
MALE POPULATION
3,214
FEMALE POPULATION
89.42
MALES / 100 FEMALES
111.83
FEMALES / 100 MALES
47.7
MEDIAN AGE
2.8
AVG FAMILY SIZE
2.3
AVG HOUSEHOLD SIZE
3,376
LABOR FORCE [ PEOPLE ]
66.9%
PERCENT IN LABOR FORCE
3.4%
UNEMPLOYMENT RATE
Northville Area Codes
Income in Northville
Income Overview in Northville
Per Capita Income in Northville is $76,615, while median incomes of families and households are $190,268 and $134,330 respectively.
| Characteristic | Number | Measure |
| Per Capita Income | 6,088 | $76,615 |
| Median Family Income | 1,767 | $190,268 |
| Mean Family Income | 1,767 | $201,692 |
| Median Household Income | 2,631 | $134,330 |
| Mean Household Income | 2,631 | $174,786 |
| Income Deficit | 1,767 | $0 |
| Wage / Income Gap (%) | 6,088 | 49.11% |
| Wage / Income Gap ($) | 6,088 | 50.89¢ per $1 |
| Gini / Inequality Index | 6,088 | 0.43 |
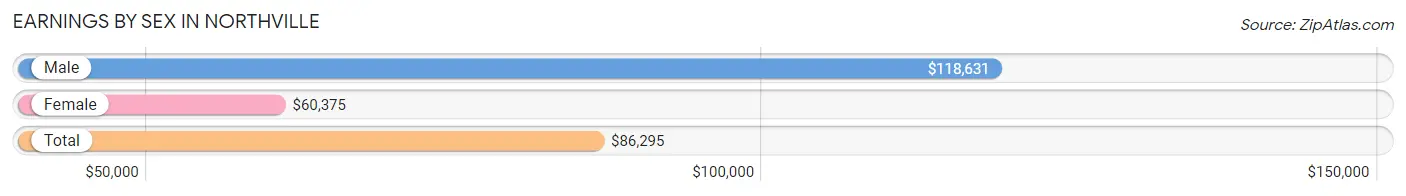
Earnings by Sex in Northville
Average Earnings in Northville are $86,295, $118,631 for men and $60,375 for women, a difference of 49.1%.
| Sex | Number | Average Earnings |
| Male | 1,814 (52.3%) | $118,631 |
| Female | 1,651 (47.6%) | $60,375 |
| Total | 3,465 (100.0%) | $86,295 |
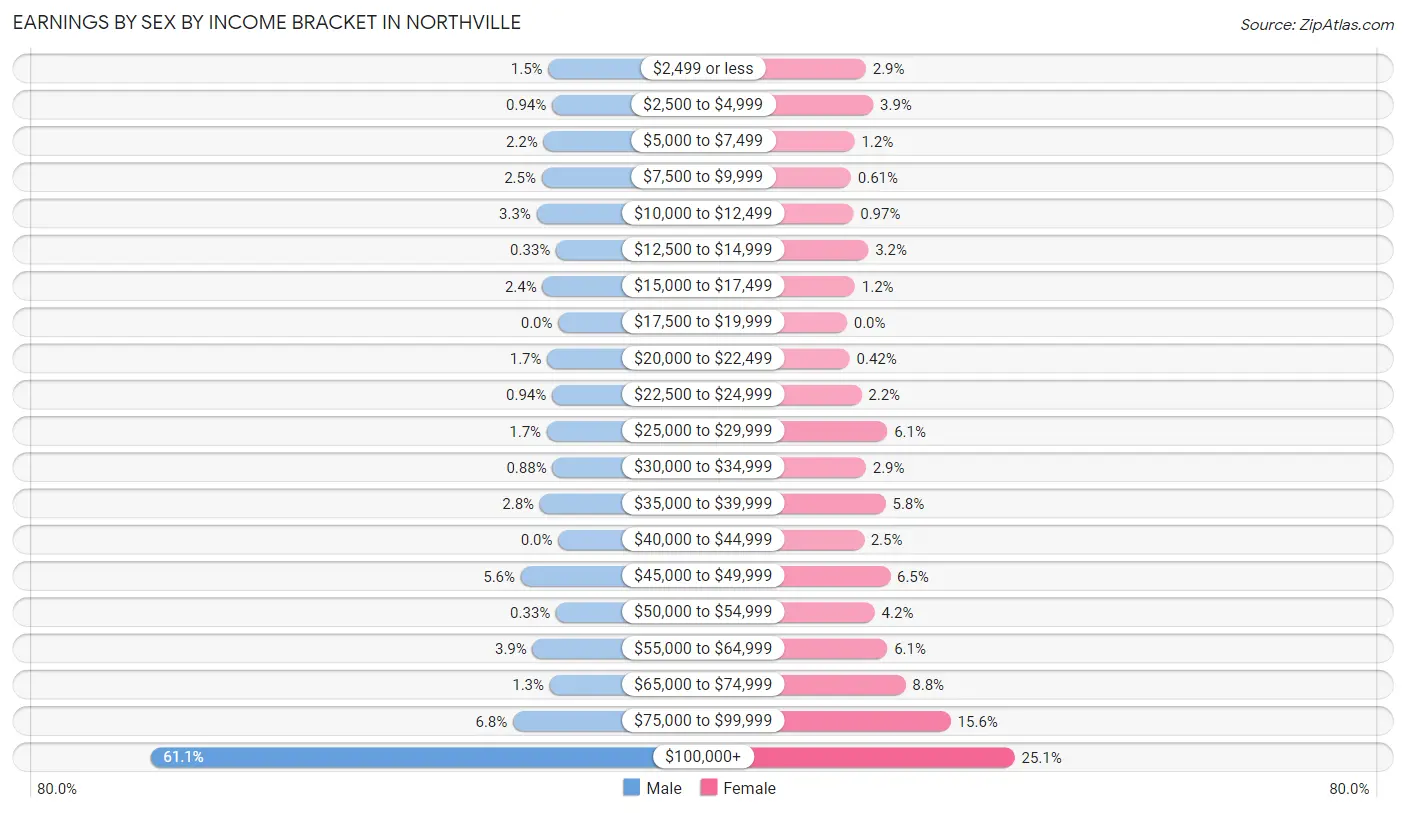
Earnings by Sex by Income Bracket in Northville
The most common earnings brackets in Northville are $100,000+ for men (1,109 | 61.1%) and $100,000+ for women (415 | 25.1%).
| Income | Male | Female |
| $2,499 or less | 27 (1.5%) | 47 (2.9%) |
| $2,500 to $4,999 | 17 (0.9%) | 65 (3.9%) |
| $5,000 to $7,499 | 40 (2.2%) | 19 (1.1%) |
| $7,500 to $9,999 | 45 (2.5%) | 10 (0.6%) |
| $10,000 to $12,499 | 59 (3.3%) | 16 (1.0%) |
| $12,500 to $14,999 | 6 (0.3%) | 53 (3.2%) |
| $15,000 to $17,499 | 43 (2.4%) | 20 (1.2%) |
| $17,500 to $19,999 | 0 (0.0%) | 0 (0.0%) |
| $20,000 to $22,499 | 30 (1.7%) | 7 (0.4%) |
| $22,500 to $24,999 | 17 (0.9%) | 36 (2.2%) |
| $25,000 to $29,999 | 31 (1.7%) | 100 (6.1%) |
| $30,000 to $34,999 | 16 (0.9%) | 47 (2.9%) |
| $35,000 to $39,999 | 50 (2.8%) | 96 (5.8%) |
| $40,000 to $44,999 | 0 (0.0%) | 42 (2.5%) |
| $45,000 to $49,999 | 102 (5.6%) | 107 (6.5%) |
| $50,000 to $54,999 | 6 (0.3%) | 69 (4.2%) |
| $55,000 to $64,999 | 70 (3.9%) | 100 (6.1%) |
| $65,000 to $74,999 | 23 (1.3%) | 145 (8.8%) |
| $75,000 to $99,999 | 123 (6.8%) | 257 (15.6%) |
| $100,000+ | 1,109 (61.1%) | 415 (25.1%) |
| Total | 1,814 (100.0%) | 1,651 (100.0%) |
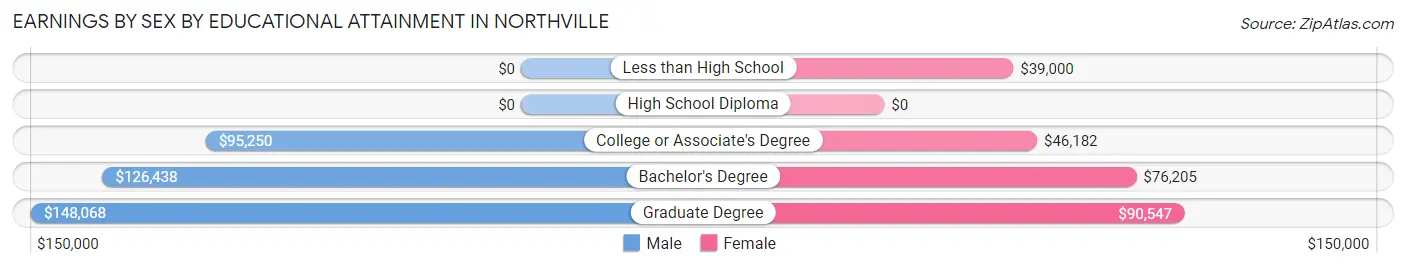
Earnings by Sex by Educational Attainment in Northville
Average earnings in Northville are $124,293 for men and $66,182 for women, a difference of 46.8%. Men with an educational attainment of graduate degree enjoy the highest average annual earnings of $148,068, while those with college or associate's degree education earn the least with $95,250. Women with an educational attainment of graduate degree earn the most with the average annual earnings of $90,547, while those with less than high school education have the smallest earnings of $39,000.
| Educational Attainment | Male Income | Female Income |
| Less than High School | - | - |
| High School Diploma | - | - |
| College or Associate's Degree | $95,250 | $46,182 |
| Bachelor's Degree | $126,438 | $76,205 |
| Graduate Degree | $148,068 | $90,547 |
| Total | $124,293 | $66,182 |
Family Income in Northville
Family Income Brackets in Northville
According to the Northville family income data, there are 808 families falling into the $200,000+ income range, which is the most common income bracket and makes up 45.7% of all families.
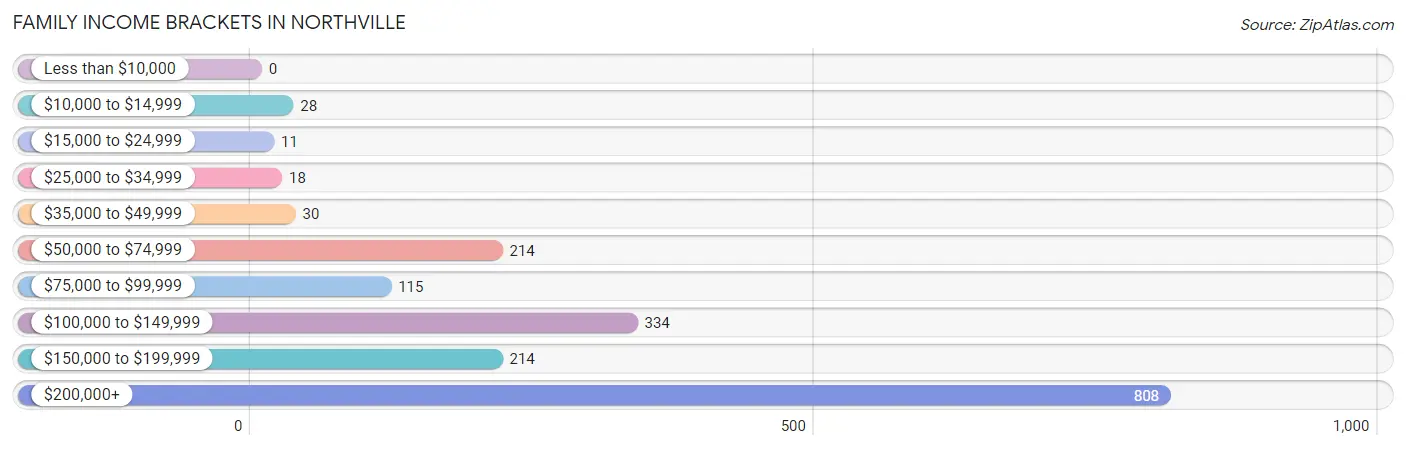
| Income Bracket | # Families | % Families |
| Less than $10,000 | 0 | 0.0% |
| $10,000 to $14,999 | 28 | 1.6% |
| $15,000 to $24,999 | 11 | 0.6% |
| $25,000 to $34,999 | 18 | 1.0% |
| $35,000 to $49,999 | 30 | 1.7% |
| $50,000 to $74,999 | 214 | 12.1% |
| $75,000 to $99,999 | 115 | 6.5% |
| $100,000 to $149,999 | 334 | 18.9% |
| $150,000 to $199,999 | 214 | 12.1% |
| $200,000+ | 808 | 45.7% |
Family Income by Famaliy Size in Northville
5-person families (57 | 3.2%) account for the highest median family income in Northville with $250,001 per family, while 2-person families (943 | 53.4%) have the highest median income of $76,846 per family member.
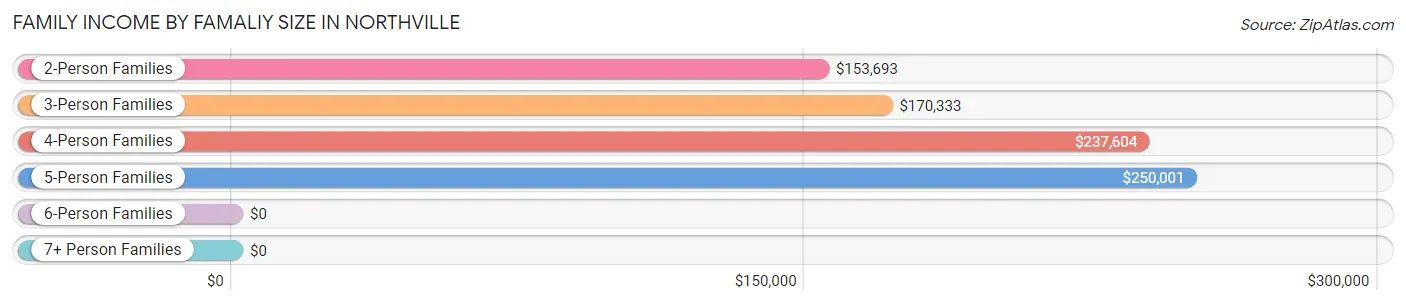
| Income Bracket | # Families | Median Income |
| 2-Person Families | 943 (53.4%) | $153,693 |
| 3-Person Families | 420 (23.8%) | $170,333 |
| 4-Person Families | 318 (18.0%) | $237,604 |
| 5-Person Families | 57 (3.2%) | $250,001 |
| 6-Person Families | 18 (1.0%) | $0 |
| 7+ Person Families | 11 (0.6%) | $0 |
| Total | 1,767 (100.0%) | $190,268 |
Family Income by Number of Earners in Northville
The median family income in Northville is $190,268, with families comprising 2 earners (830) having the highest median family income of $228,148, while families with no earners (195) have the lowest median family income of $73,262, accounting for 47.0% and 11.0% of families, respectively.
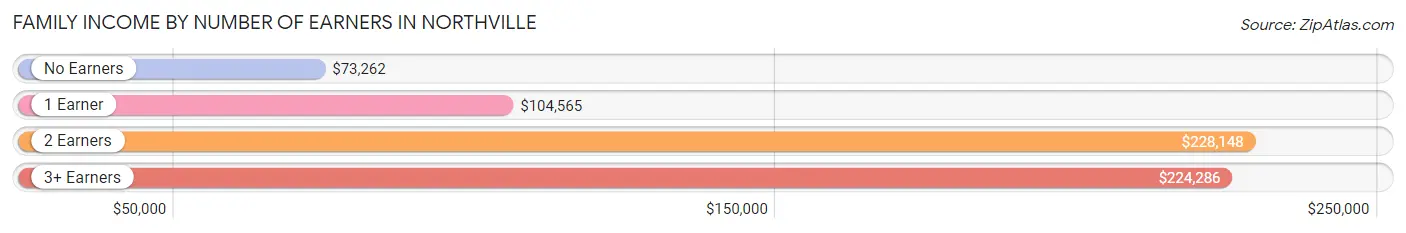
| Number of Earners | # Families | Median Income |
| No Earners | 195 (11.0%) | $73,262 |
| 1 Earner | 600 (34.0%) | $104,565 |
| 2 Earners | 830 (47.0%) | $228,148 |
| 3+ Earners | 142 (8.0%) | $224,286 |
| Total | 1,767 (100.0%) | $190,268 |
Household Income in Northville
Household Income Brackets in Northville
With 892 households falling in the category, the $200,000+ income range is the most frequent in Northville, accounting for 33.9% of all households. In contrast, only 47 households (1.8%) fall into the $10,000 to $14,999 income bracket, making it the least populous group.
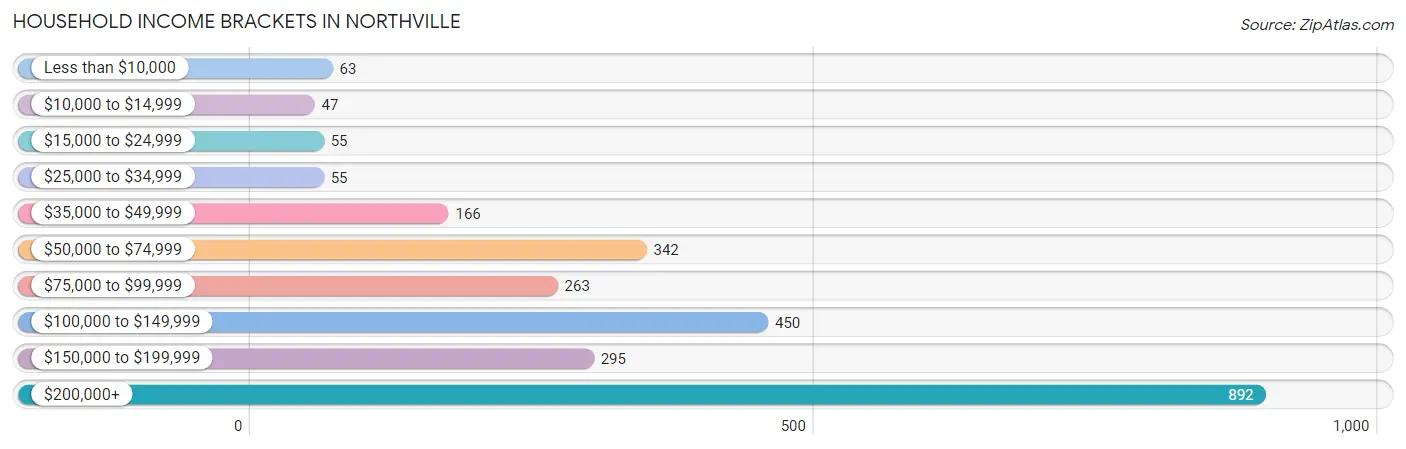
| Income Bracket | # Households | % Households |
| Less than $10,000 | 63 | 2.4% |
| $10,000 to $14,999 | 47 | 1.8% |
| $15,000 to $24,999 | 55 | 2.1% |
| $25,000 to $34,999 | 55 | 2.1% |
| $35,000 to $49,999 | 166 | 6.3% |
| $50,000 to $74,999 | 342 | 13.0% |
| $75,000 to $99,999 | 263 | 10.0% |
| $100,000 to $149,999 | 450 | 17.1% |
| $150,000 to $199,999 | 295 | 11.2% |
| $200,000+ | 892 | 33.9% |
Household Income by Householder Age in Northville
The median household income in Northville is $134,330, with the highest median household income of $205,188 found in the 45 to 64 years age bracket for the primary householder. A total of 1,177 households (44.7%) fall into this category.
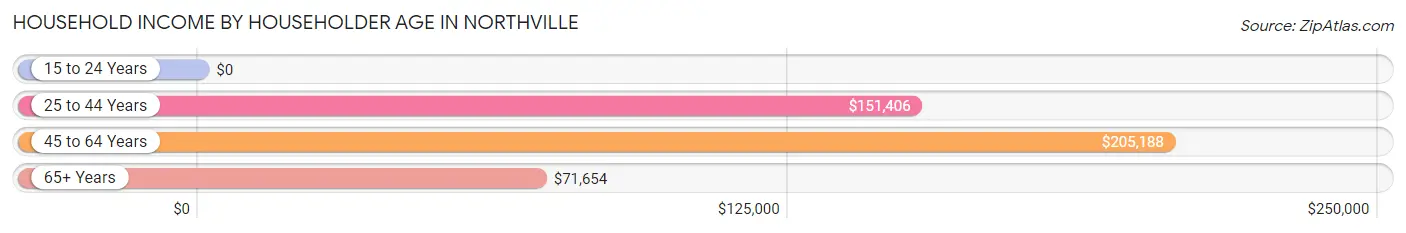
| Income Bracket | # Households | Median Income |
| 15 to 24 Years | 0 (0.0%) | $0 |
| 25 to 44 Years | 657 (25.0%) | $151,406 |
| 45 to 64 Years | 1,177 (44.7%) | $205,188 |
| 65+ Years | 797 (30.3%) | $71,654 |
| Total | 2,631 (100.0%) | $134,330 |
Poverty in Northville
Income Below Poverty by Sex and Age in Northville
With 1.4% poverty level for males and 5.3% for females among the residents of Northville, 15 year old males and 18 to 24 year old females are the most vulnerable to poverty, with 5 males (14.7%) and 15 females (22.7%) in their respective age groups living below the poverty level.
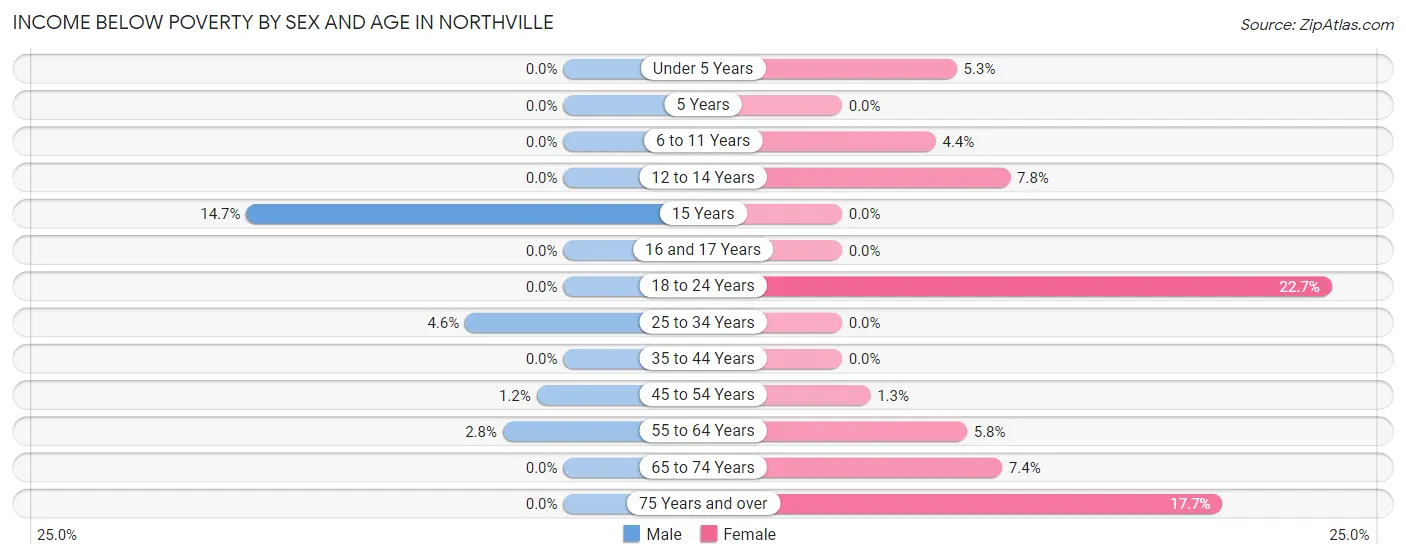
| Age Bracket | Male | Female |
| Under 5 Years | 0 (0.0%) | 9 (5.3%) |
| 5 Years | 0 (0.0%) | 0 (0.0%) |
| 6 to 11 Years | 0 (0.0%) | 10 (4.3%) |
| 12 to 14 Years | 0 (0.0%) | 5 (7.8%) |
| 15 Years | 5 (14.7%) | 0 (0.0%) |
| 16 and 17 Years | 0 (0.0%) | 0 (0.0%) |
| 18 to 24 Years | 0 (0.0%) | 15 (22.7%) |
| 25 to 34 Years | 16 (4.6%) | 0 (0.0%) |
| 35 to 44 Years | 0 (0.0%) | 0 (0.0%) |
| 45 to 54 Years | 5 (1.2%) | 5 (1.3%) |
| 55 to 64 Years | 15 (2.8%) | 44 (5.8%) |
| 65 to 74 Years | 0 (0.0%) | 22 (7.4%) |
| 75 Years and over | 0 (0.0%) | 59 (17.7%) |
| Total | 41 (1.4%) | 169 (5.3%) |
Income Above Poverty by Sex and Age in Northville
According to the poverty statistics in Northville, males aged under 5 years and females aged 5 years are the age groups that are most secure financially, with 100.0% of males and 100.0% of females in these age groups living above the poverty line.
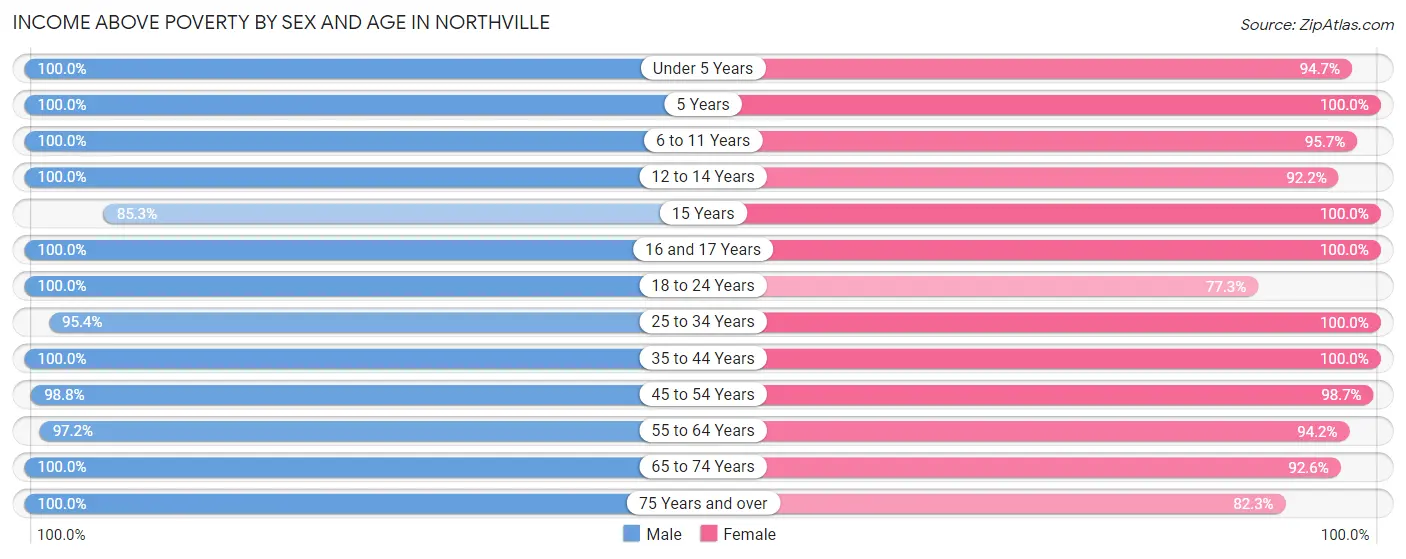
| Age Bracket | Male | Female |
| Under 5 Years | 198 (100.0%) | 160 (94.7%) |
| 5 Years | 36 (100.0%) | 12 (100.0%) |
| 6 to 11 Years | 152 (100.0%) | 220 (95.7%) |
| 12 to 14 Years | 115 (100.0%) | 59 (92.2%) |
| 15 Years | 29 (85.3%) | 31 (100.0%) |
| 16 and 17 Years | 112 (100.0%) | 64 (100.0%) |
| 18 to 24 Years | 174 (100.0%) | 51 (77.3%) |
| 25 to 34 Years | 335 (95.4%) | 367 (100.0%) |
| 35 to 44 Years | 242 (100.0%) | 409 (100.0%) |
| 45 to 54 Years | 397 (98.8%) | 375 (98.7%) |
| 55 to 64 Years | 518 (97.2%) | 714 (94.2%) |
| 65 to 74 Years | 341 (100.0%) | 274 (92.6%) |
| 75 Years and over | 184 (100.0%) | 275 (82.3%) |
| Total | 2,833 (98.6%) | 3,011 (94.7%) |
Income Below Poverty Among Married-Couple Families in Northville
The poverty statistics for married-couple families in Northville show that 0.4% or 5 of the total 1,404 families live below the poverty line. Families with 1 or 2 children have the highest poverty rate of 1.1%, comprising of 5 families. On the other hand, families with no children have the lowest poverty rate of 0.0%, which includes 0 families.
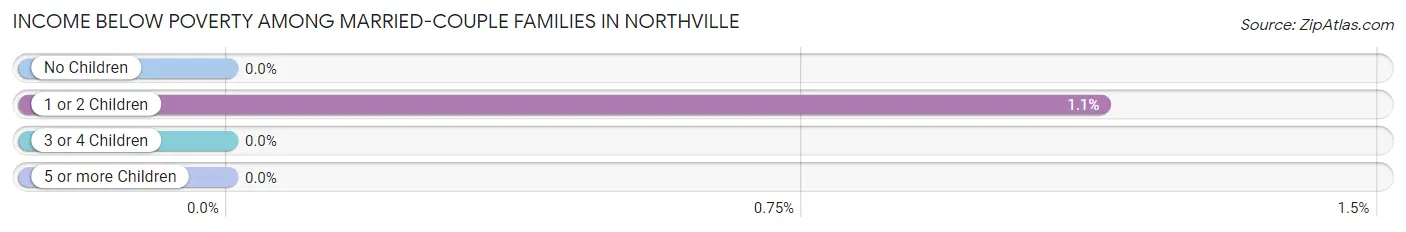
| Children | Above Poverty | Below Poverty |
| No Children | 879 (100.0%) | 0 (0.0%) |
| 1 or 2 Children | 434 (98.9%) | 5 (1.1%) |
| 3 or 4 Children | 86 (100.0%) | 0 (0.0%) |
| 5 or more Children | 0 (0.0%) | 0 (0.0%) |
| Total | 1,399 (99.6%) | 5 (0.4%) |
Income Below Poverty Among Single-Parent Households in Northville
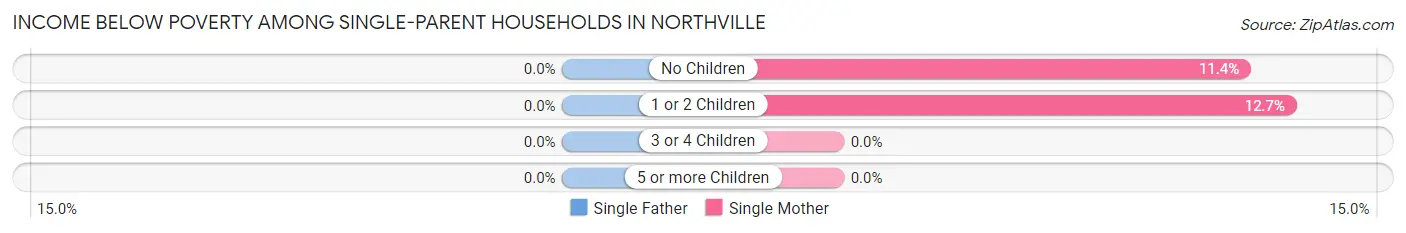
| Children | Single Father | Single Mother |
| No Children | 0 (0.0%) | 19 (11.4%) |
| 1 or 2 Children | 0 (0.0%) | 10 (12.7%) |
| 3 or 4 Children | 0 (0.0%) | 0 (0.0%) |
| 5 or more Children | 0 (0.0%) | 0 (0.0%) |
| Total | 0 (0.0%) | 29 (11.8%) |
Income Below Poverty Among Married-Couple vs Single-Parent Households in Northville
The poverty data for Northville shows that 5 of the married-couple family households (0.4%) and 29 of the single-parent households (8.0%) are living below the poverty level. Within the married-couple family households, those with 1 or 2 children have the highest poverty rate, with 5 households (1.1%) falling below the poverty line. Among the single-parent households, those with no children have the highest poverty rate, with 19 household (9.6%) living below poverty.
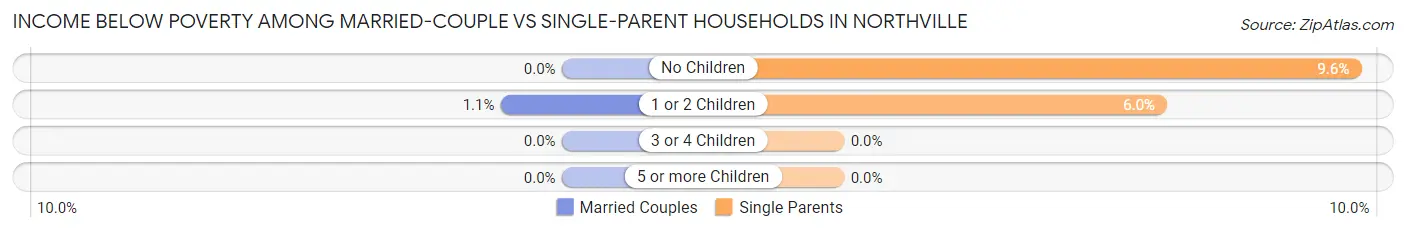
| Children | Married-Couple Families | Single-Parent Households |
| No Children | 0 (0.0%) | 19 (9.6%) |
| 1 or 2 Children | 5 (1.1%) | 10 (6.0%) |
| 3 or 4 Children | 0 (0.0%) | 0 (0.0%) |
| 5 or more Children | 0 (0.0%) | 0 (0.0%) |
| Total | 5 (0.4%) | 29 (8.0%) |
Race in Northville
The most populous races in Northville are White / Caucasian (5,537 | 90.9%), Asian (349 | 5.7%), and Hispanic or Latino (235 | 3.9%).
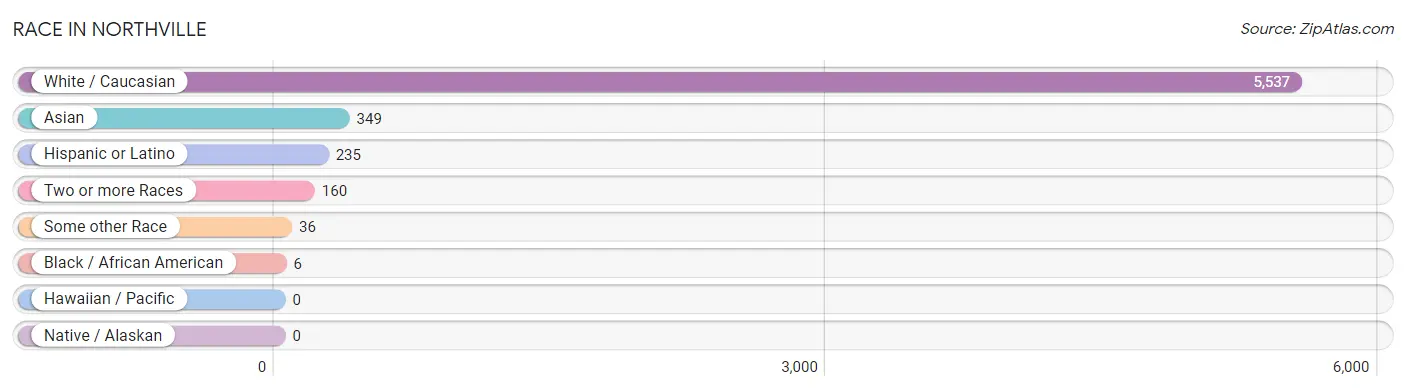
| Race | # Population | % Population |
| Asian | 349 | 5.7% |
| Black / African American | 6 | 0.1% |
| Hawaiian / Pacific | 0 | 0.0% |
| Hispanic or Latino | 235 | 3.9% |
| Native / Alaskan | 0 | 0.0% |
| White / Caucasian | 5,537 | 90.9% |
| Two or more Races | 160 | 2.6% |
| Some other Race | 36 | 0.6% |
| Total | 6,088 | 100.0% |
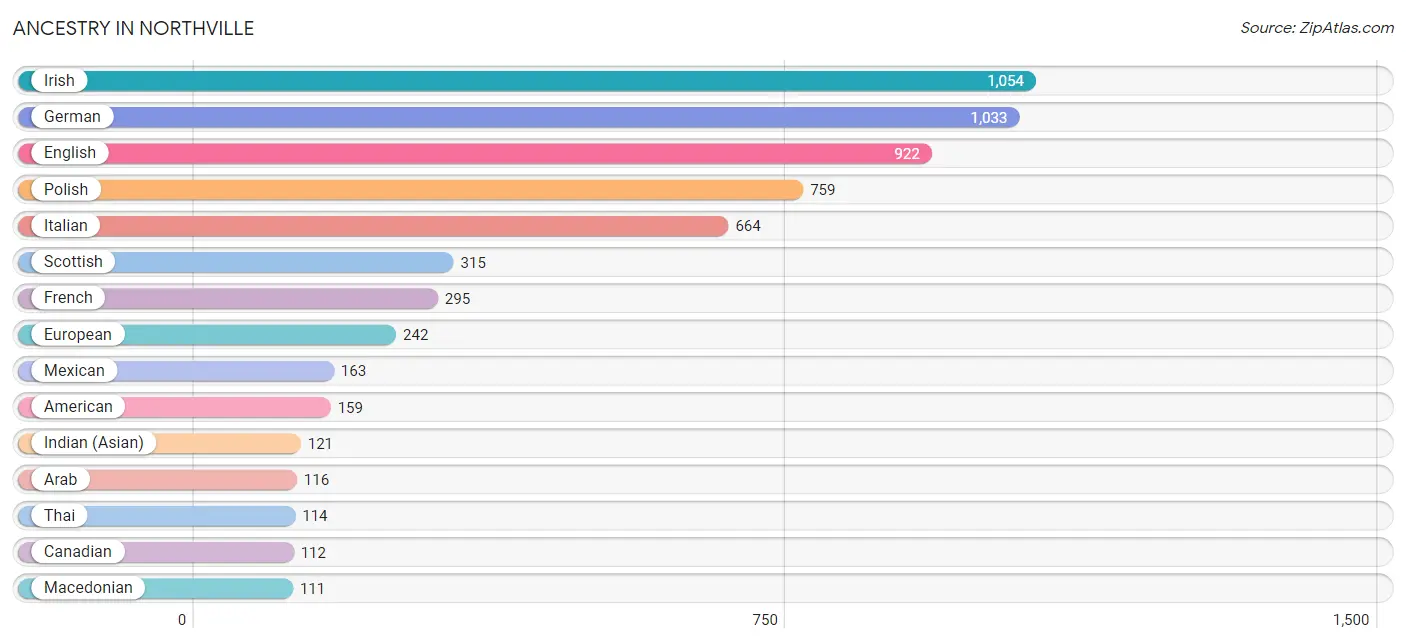
Ancestry in Northville
The most populous ancestries reported in Northville are Irish (1,054 | 17.3%), German (1,033 | 17.0%), English (922 | 15.1%), Polish (759 | 12.5%), and Italian (664 | 10.9%), together accounting for 72.8% of all Northville residents.
| Ancestry | # Population | % Population |
| American | 159 | 2.6% |
| Arab | 116 | 1.9% |
| Armenian | 60 | 1.0% |
| Austrian | 53 | 0.9% |
| Belgian | 10 | 0.2% |
| Bhutanese | 21 | 0.3% |
| Bolivian | 2 | 0.0% |
| British | 40 | 0.7% |
| Canadian | 112 | 1.8% |
| Central American | 8 | 0.1% |
| Chilean | 16 | 0.3% |
| Croatian | 27 | 0.4% |
| Czech | 1 | 0.0% |
| Danish | 36 | 0.6% |
| Dutch | 43 | 0.7% |
| Eastern European | 11 | 0.2% |
| English | 922 | 15.1% |
| European | 242 | 4.0% |
| Finnish | 47 | 0.8% |
| French | 295 | 4.9% |
| French Canadian | 83 | 1.4% |
| German | 1,033 | 17.0% |
| Greek | 57 | 0.9% |
| Hungarian | 47 | 0.8% |
| Indian (Asian) | 121 | 2.0% |
| Iranian | 40 | 0.7% |
| Irish | 1,054 | 17.3% |
| Italian | 664 | 10.9% |
| Korean | 57 | 0.9% |
| Laotian | 15 | 0.3% |
| Latvian | 2 | 0.0% |
| Lebanese | 83 | 1.4% |
| Lithuanian | 15 | 0.3% |
| Macedonian | 111 | 1.8% |
| Maltese | 16 | 0.3% |
| Mexican | 163 | 2.7% |
| Northern European | 5 | 0.1% |
| Norwegian | 49 | 0.8% |
| Panamanian | 8 | 0.1% |
| Polish | 759 | 12.5% |
| Puerto Rican | 5 | 0.1% |
| Romanian | 16 | 0.3% |
| Russian | 44 | 0.7% |
| Scotch-Irish | 56 | 0.9% |
| Scottish | 315 | 5.2% |
| Slavic | 29 | 0.5% |
| Slovak | 26 | 0.4% |
| Slovene | 26 | 0.4% |
| South American | 18 | 0.3% |
| Spaniard | 41 | 0.7% |
| Sri Lankan | 59 | 1.0% |
| Swedish | 30 | 0.5% |
| Swiss | 45 | 0.7% |
| Syrian | 17 | 0.3% |
| Thai | 114 | 1.9% |
| Ukrainian | 93 | 1.5% |
| Welsh | 22 | 0.4% |
| Yugoslavian | 13 | 0.2% | View All 58 Rows |
Immigrants in Northville
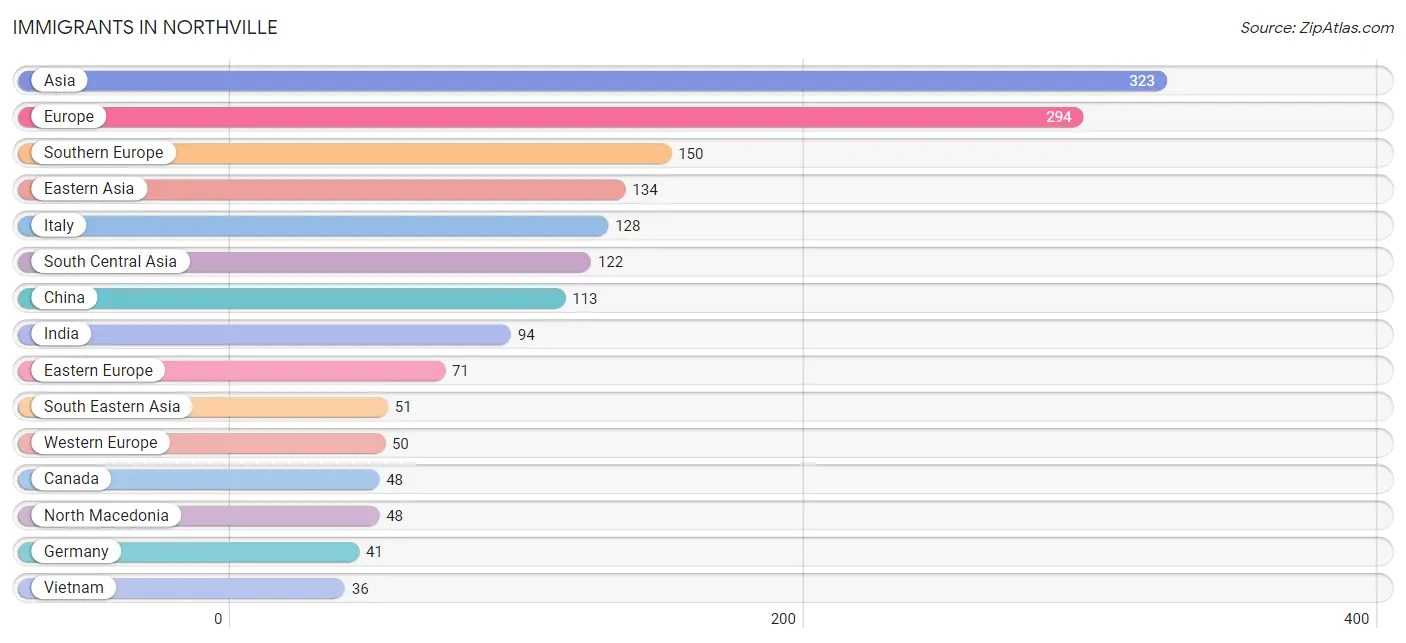
The most numerous immigrant groups reported in Northville came from Asia (323 | 5.3%), Europe (294 | 4.8%), Southern Europe (150 | 2.5%), Eastern Asia (134 | 2.2%), and Italy (128 | 2.1%), together accounting for 16.9% of all Northville residents.
| Immigration Origin | # Population | % Population |
| Asia | 323 | 5.3% |
| Bolivia | 2 | 0.0% |
| Canada | 48 | 0.8% |
| Central America | 8 | 0.1% |
| Chile | 16 | 0.3% |
| China | 113 | 1.9% |
| Eastern Asia | 134 | 2.2% |
| Eastern Europe | 71 | 1.2% |
| England | 7 | 0.1% |
| Europe | 294 | 4.8% |
| France | 9 | 0.2% |
| Germany | 41 | 0.7% |
| Greece | 22 | 0.4% |
| India | 94 | 1.5% |
| Indonesia | 15 | 0.3% |
| Iran | 28 | 0.5% |
| Italy | 128 | 2.1% |
| Japan | 21 | 0.3% |
| Latin America | 26 | 0.4% |
| North Macedonia | 48 | 0.8% |
| Northern Europe | 23 | 0.4% |
| Panama | 8 | 0.1% |
| Romania | 16 | 0.3% |
| Russia | 7 | 0.1% |
| South America | 18 | 0.3% |
| South Central Asia | 122 | 2.0% |
| South Eastern Asia | 51 | 0.8% |
| Southern Europe | 150 | 2.5% |
| Syria | 11 | 0.2% |
| Vietnam | 36 | 0.6% |
| Western Asia | 16 | 0.3% |
| Western Europe | 50 | 0.8% | View All 32 Rows |
Sex and Age in Northville
Sex and Age in Northville
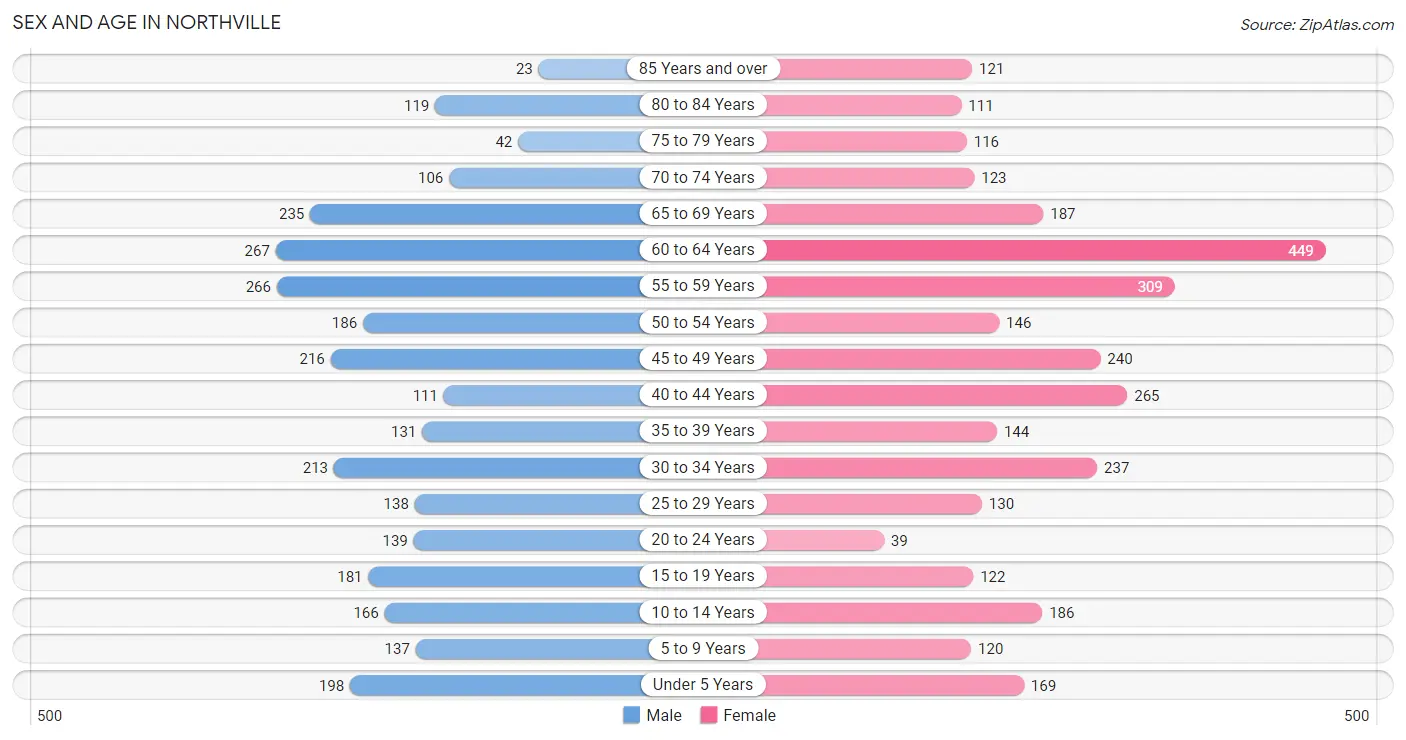
The most populous age groups in Northville are 60 to 64 Years (267 | 9.3%) for men and 60 to 64 Years (449 | 14.0%) for women.
| Age Bracket | Male | Female |
| Under 5 Years | 198 (6.9%) | 169 (5.3%) |
| 5 to 9 Years | 137 (4.8%) | 120 (3.7%) |
| 10 to 14 Years | 166 (5.8%) | 186 (5.8%) |
| 15 to 19 Years | 181 (6.3%) | 122 (3.8%) |
| 20 to 24 Years | 139 (4.8%) | 39 (1.2%) |
| 25 to 29 Years | 138 (4.8%) | 130 (4.0%) |
| 30 to 34 Years | 213 (7.4%) | 237 (7.4%) |
| 35 to 39 Years | 131 (4.6%) | 144 (4.5%) |
| 40 to 44 Years | 111 (3.9%) | 265 (8.3%) |
| 45 to 49 Years | 216 (7.5%) | 240 (7.5%) |
| 50 to 54 Years | 186 (6.5%) | 146 (4.5%) |
| 55 to 59 Years | 266 (9.3%) | 309 (9.6%) |
| 60 to 64 Years | 267 (9.3%) | 449 (14.0%) |
| 65 to 69 Years | 235 (8.2%) | 187 (5.8%) |
| 70 to 74 Years | 106 (3.7%) | 123 (3.8%) |
| 75 to 79 Years | 42 (1.5%) | 116 (3.6%) |
| 80 to 84 Years | 119 (4.1%) | 111 (3.5%) |
| 85 Years and over | 23 (0.8%) | 121 (3.8%) |
| Total | 2,874 (100.0%) | 3,214 (100.0%) |
Families and Households in Northville
Median Family Size in Northville
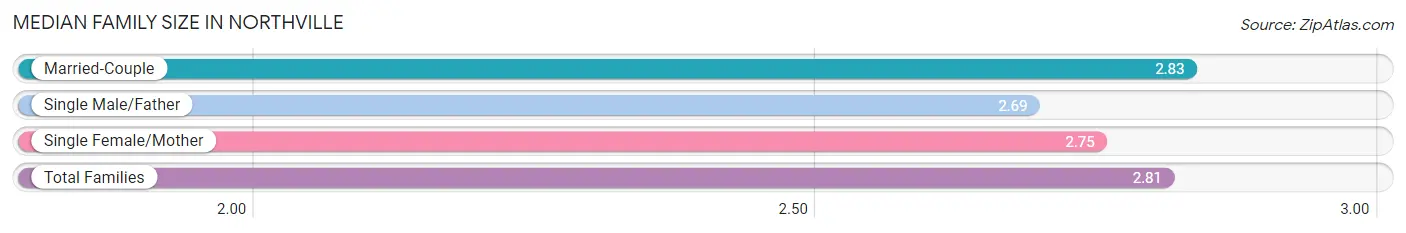
The median family size in Northville is 2.81 persons per family, with married-couple families (1,404 | 79.5%) accounting for the largest median family size of 2.83 persons per family. On the other hand, single male/father families (117 | 6.6%) represent the smallest median family size with 2.69 persons per family.
| Family Type | # Families | Family Size |
| Married-Couple | 1,404 (79.5%) | 2.83 |
| Single Male/Father | 117 (6.6%) | 2.69 |
| Single Female/Mother | 246 (13.9%) | 2.75 |
| Total Families | 1,767 (100.0%) | 2.81 |
Median Household Size in Northville
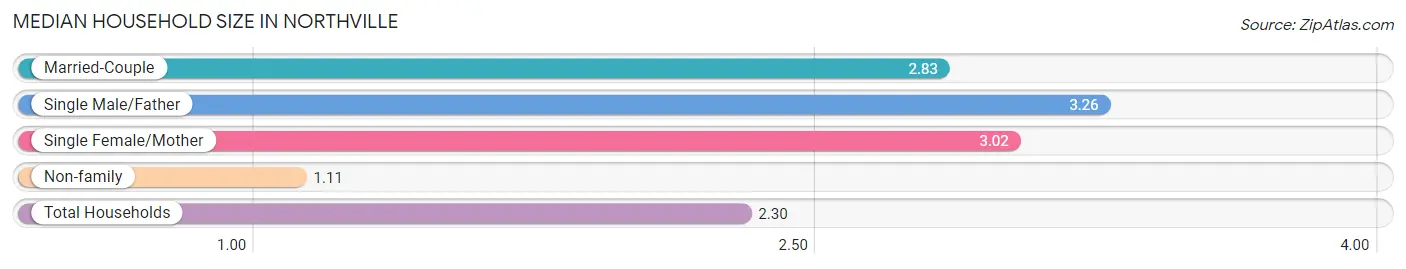
The median household size in Northville is 2.30 persons per household, with single male/father households (117 | 4.4%) accounting for the largest median household size of 3.26 persons per household. non-family households (864 | 32.8%) represent the smallest median household size with 1.11 persons per household.
| Household Type | # Households | Household Size |
| Married-Couple | 1,404 (53.4%) | 2.83 |
| Single Male/Father | 117 (4.4%) | 3.26 |
| Single Female/Mother | 246 (9.3%) | 3.02 |
| Non-family | 864 (32.8%) | 1.11 |
| Total Households | 2,631 (100.0%) | 2.30 |
Household Size by Marriage Status in Northville
Out of a total of 2,631 households in Northville, 1,767 (67.2%) are family households, while 864 (32.8%) are nonfamily households. The most numerous type of family households are 2-person households, comprising 923, and the most common type of nonfamily households are 1-person households, comprising 775.
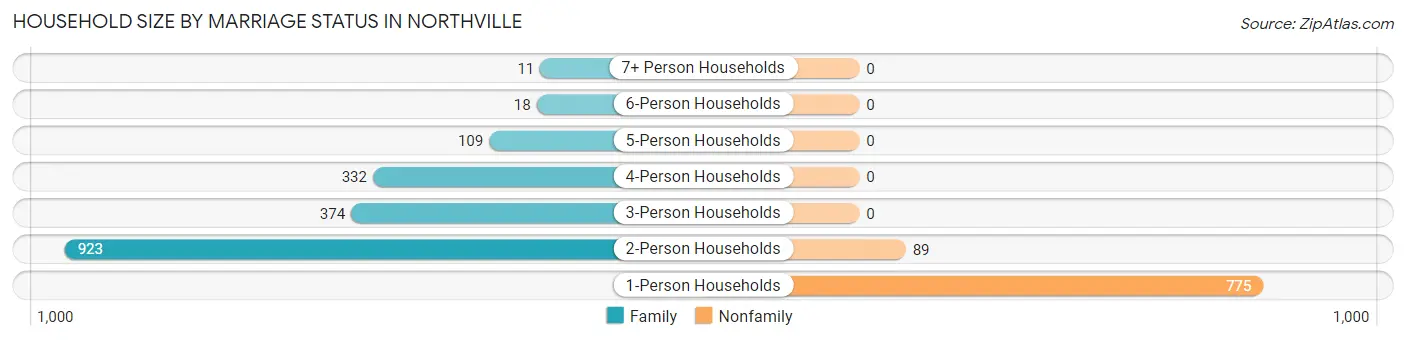
| Household Size | Family Households | Nonfamily Households |
| 1-Person Households | - | 775 (29.5%) |
| 2-Person Households | 923 (35.1%) | 89 (3.4%) |
| 3-Person Households | 374 (14.2%) | 0 (0.0%) |
| 4-Person Households | 332 (12.6%) | 0 (0.0%) |
| 5-Person Households | 109 (4.1%) | 0 (0.0%) |
| 6-Person Households | 18 (0.7%) | 0 (0.0%) |
| 7+ Person Households | 11 (0.4%) | 0 (0.0%) |
| Total | 1,767 (67.2%) | 864 (32.8%) |
Female Fertility in Northville
Fertility by Age in Northville
Average fertility rate in Northville is 54.0 births per 1,000 women. Women in the age bracket of 35 to 50 years have the highest fertility rate with 87.0 births per 1,000 women. Women in the age bracket of 35 to 50 years acount for 89.2% of all women with births.
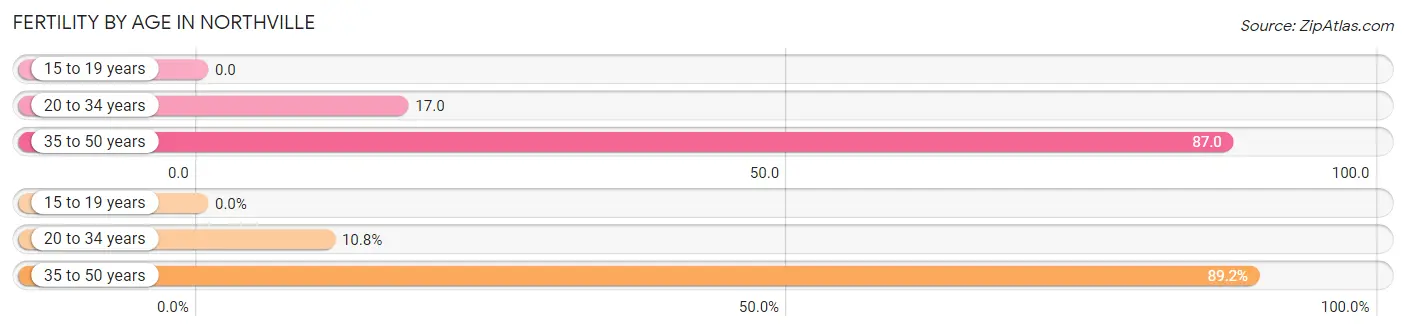
| Age Bracket | Women with Births | Births / 1,000 Women |
| 15 to 19 years | 0 (0.0%) | 0.0 |
| 20 to 34 years | 7 (10.8%) | 17.0 |
| 35 to 50 years | 58 (89.2%) | 87.0 |
| Total | 65 (100.0%) | 54.0 |
Fertility by Age by Marriage Status in Northville
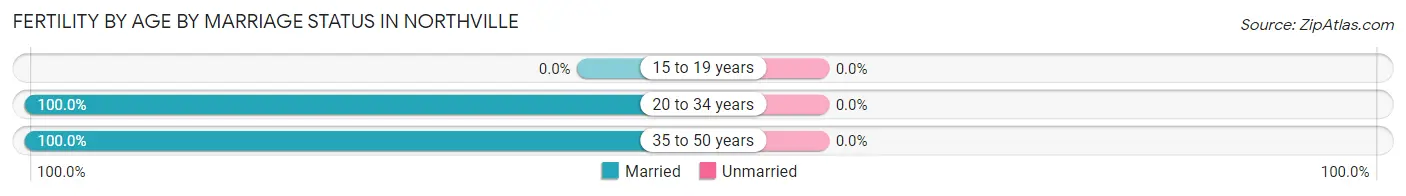
| Age Bracket | Married | Unmarried |
| 15 to 19 years | 0 (0.0%) | 0 (0.0%) |
| 20 to 34 years | 7 (100.0%) | 0 (0.0%) |
| 35 to 50 years | 58 (100.0%) | 0 (0.0%) |
| Total | 65 (100.0%) | 0 (0.0%) |
Fertility by Education in Northville
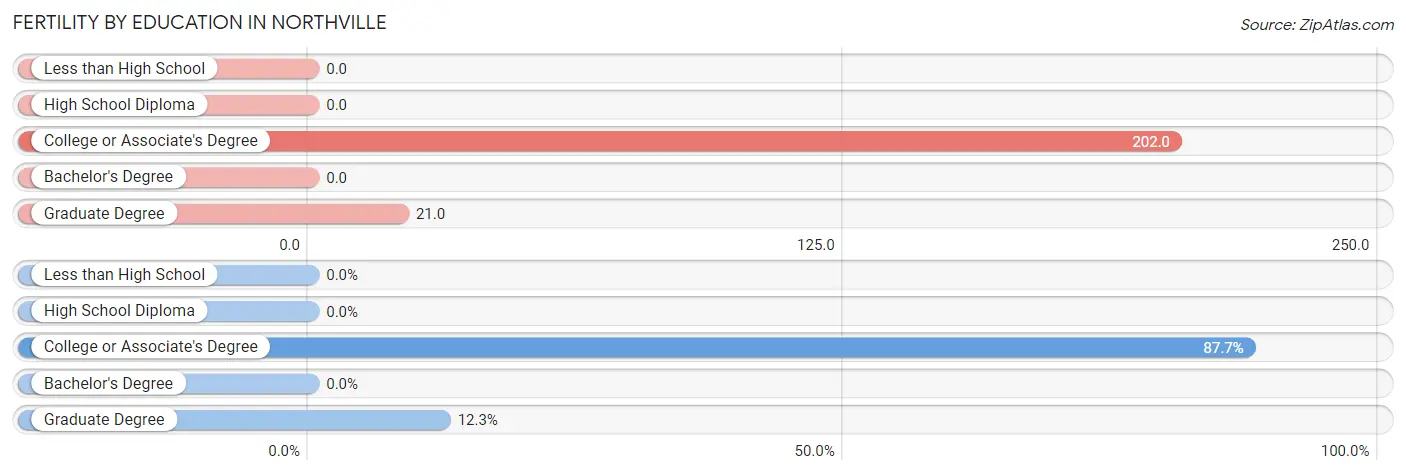
| Educational Attainment | Women with Births | Births / 1,000 Women |
| Less than High School | 0 (0.0%) | 0.0 |
| High School Diploma | 0 (0.0%) | 0.0 |
| College or Associate's Degree | 57 (87.7%) | 202.0 |
| Bachelor's Degree | 0 (0.0%) | 0.0 |
| Graduate Degree | 8 (12.3%) | 21.0 |
| Total | 65 (100.0%) | 54.0 |
Fertility by Education by Marriage Status in Northville
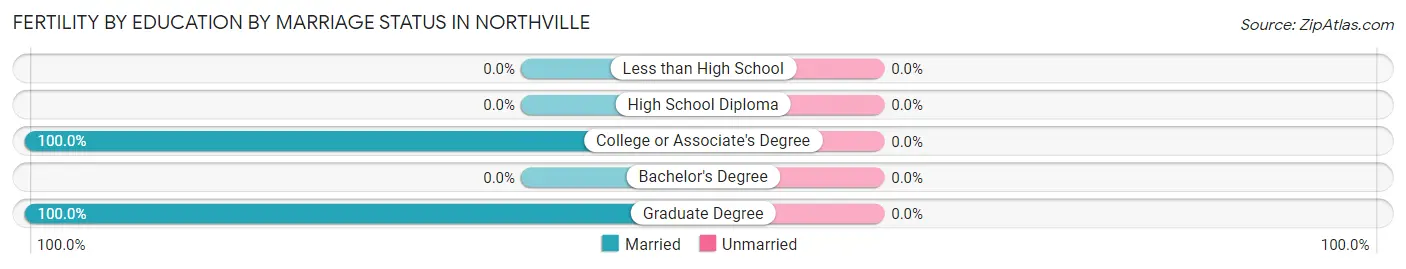
| Educational Attainment | Married | Unmarried |
| Less than High School | 0 (0.0%) | 0 (0.0%) |
| High School Diploma | 0 (0.0%) | 0 (0.0%) |
| College or Associate's Degree | 57 (100.0%) | 0 (0.0%) |
| Bachelor's Degree | 0 (0.0%) | 0 (0.0%) |
| Graduate Degree | 8 (100.0%) | 0 (0.0%) |
| Total | 65 (100.0%) | 0 (0.0%) |
Employment Characteristics in Northville
Employment by Class of Employer in Northville
Among the 3,223 employed individuals in Northville, private company employees (2,400 | 74.5%), not-for-profit organizations (268 | 8.3%), and self-employed (not incorporated) (162 | 5.0%) make up the most common classes of employment.
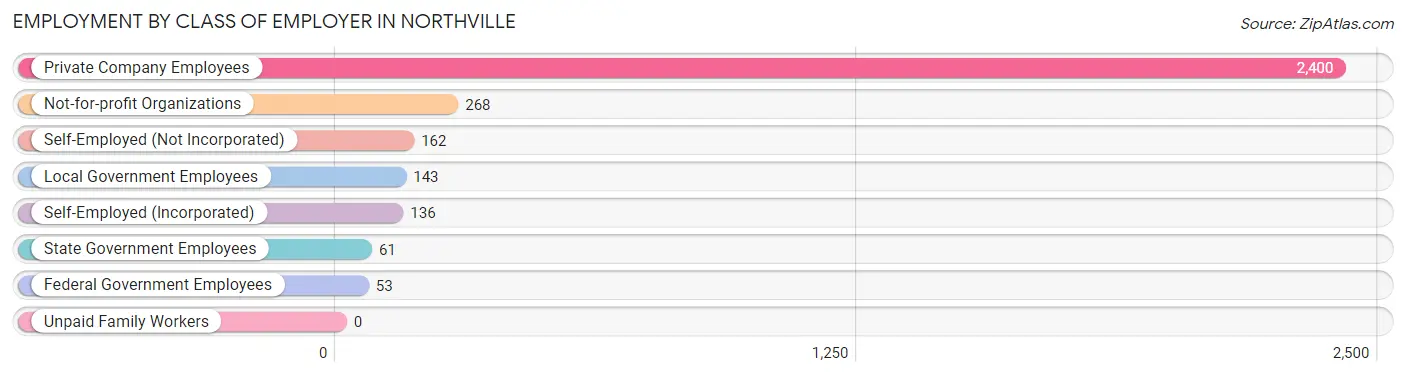
| Employer Class | # Employees | % Employees |
| Private Company Employees | 2,400 | 74.5% |
| Self-Employed (Incorporated) | 136 | 4.2% |
| Self-Employed (Not Incorporated) | 162 | 5.0% |
| Not-for-profit Organizations | 268 | 8.3% |
| Local Government Employees | 143 | 4.4% |
| State Government Employees | 61 | 1.9% |
| Federal Government Employees | 53 | 1.6% |
| Unpaid Family Workers | 0 | 0.0% |
| Total | 3,223 | 100.0% |
Employment Status by Age in Northville
According to the labor force statistics for Northville, out of the total population over 16 years of age (5,047), 66.9% or 3,376 individuals are in the labor force, with 3.4% or 115 of them unemployed. The age group with the highest labor force participation rate is 30 to 34 years, with 92.4% or 416 individuals in the labor force. Within the labor force, the 75 years and over age range has the highest percentage of unemployed individuals, with 67.9% or 36 of them being unemployed.
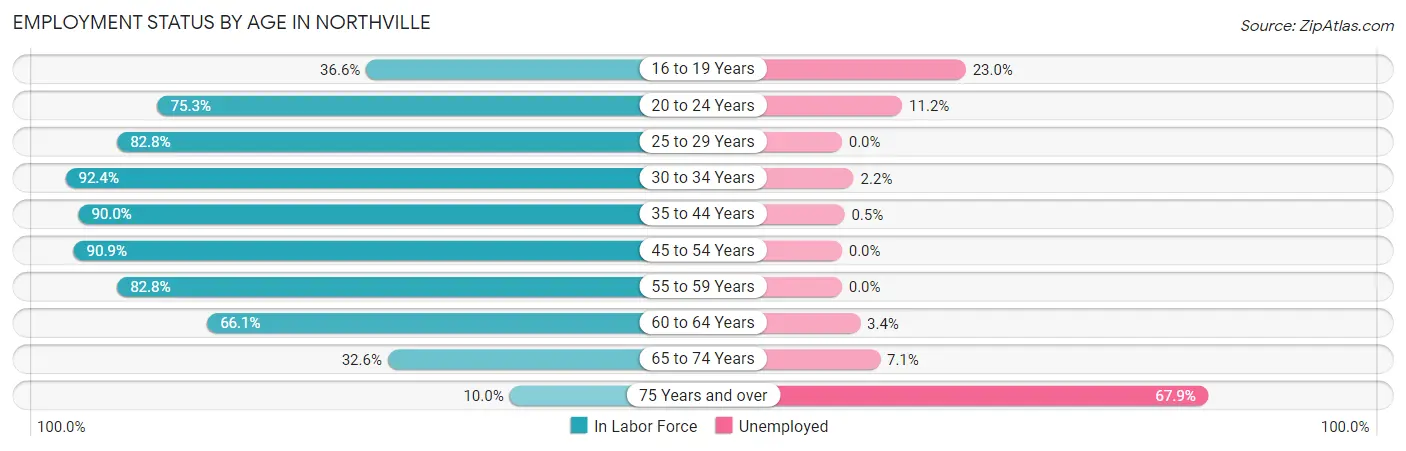
| Age Bracket | In Labor Force | Unemployed |
| 16 to 19 Years | 87 (36.6%) | 20 (23.0%) |
| 20 to 24 Years | 134 (75.3%) | 15 (11.2%) |
| 25 to 29 Years | 222 (82.8%) | 0 (0.0%) |
| 30 to 34 Years | 416 (92.4%) | 9 (2.2%) |
| 35 to 44 Years | 586 (90.0%) | 3 (0.5%) |
| 45 to 54 Years | 716 (90.9%) | 0 (0.0%) |
| 55 to 59 Years | 476 (82.8%) | 0 (0.0%) |
| 60 to 64 Years | 473 (66.1%) | 16 (3.4%) |
| 65 to 74 Years | 212 (32.6%) | 15 (7.1%) |
| 75 Years and over | 53 (10.0%) | 36 (67.9%) |
| Total | 3,376 (66.9%) | 115 (3.4%) |
Employment Status by Educational Attainment in Northville
According to labor force statistics for Northville, 83.8% of individuals (2,889) out of the total population between 25 and 64 years of age (3,448) are in the labor force, with 1.0% or 29 of them being unemployed. The group with the highest labor force participation rate are those with the educational attainment of bachelor's degree or higher, with 87.2% or 2,188 individuals in the labor force. Within the labor force, individuals with high school diploma education have the highest percentage of unemployment, with 9.2% or 8 of them being unemployed.
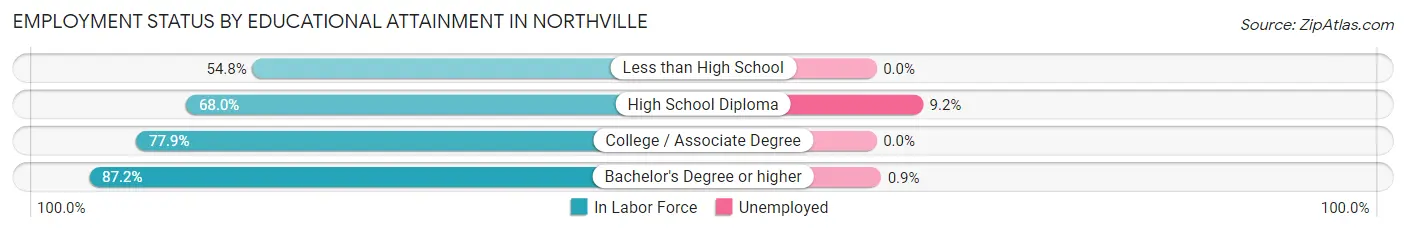
| Educational Attainment | In Labor Force | Unemployed |
| Less than High School | 40 (54.8%) | 0 (0.0%) |
| High School Diploma | 87 (68.0%) | 12 (9.2%) |
| College / Associate Degree | 575 (77.9%) | 0 (0.0%) |
| Bachelor's Degree or higher | 2,188 (87.2%) | 23 (0.9%) |
| Total | 2,889 (83.8%) | 34 (1.0%) |
Employment Occupations by Sex in Northville
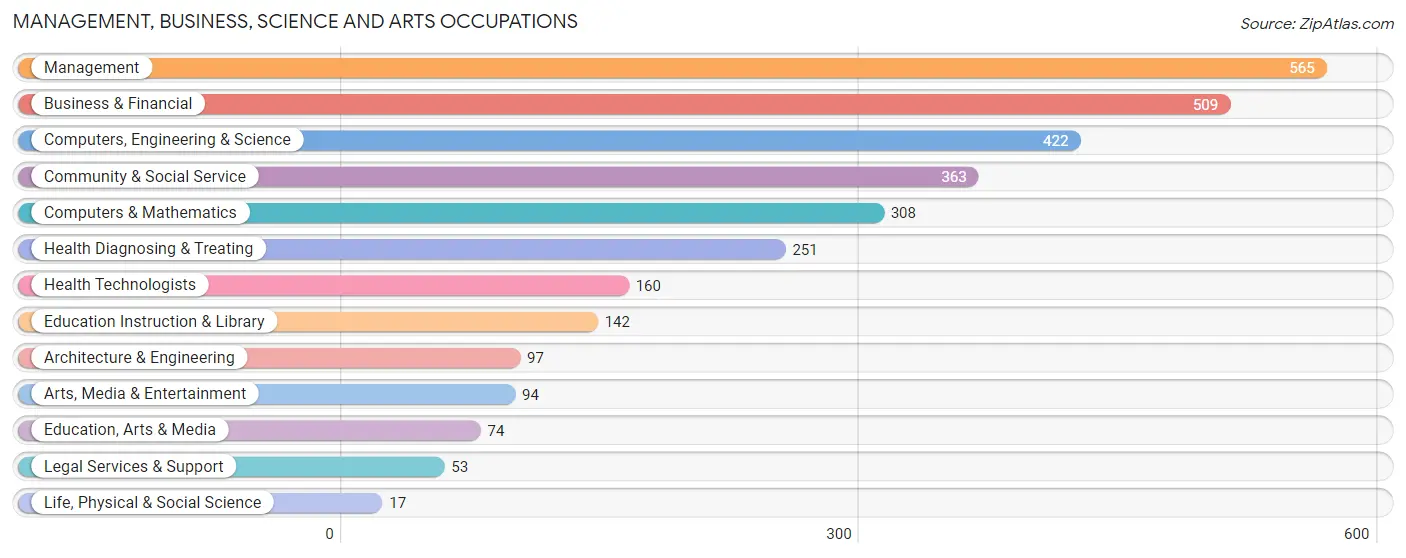
Management, Business, Science and Arts Occupations
The most common Management, Business, Science and Arts occupations in Northville are Management (565 | 17.3%), Business & Financial (509 | 15.6%), Computers, Engineering & Science (422 | 12.9%), Community & Social Service (363 | 11.1%), and Computers & Mathematics (308 | 9.4%).
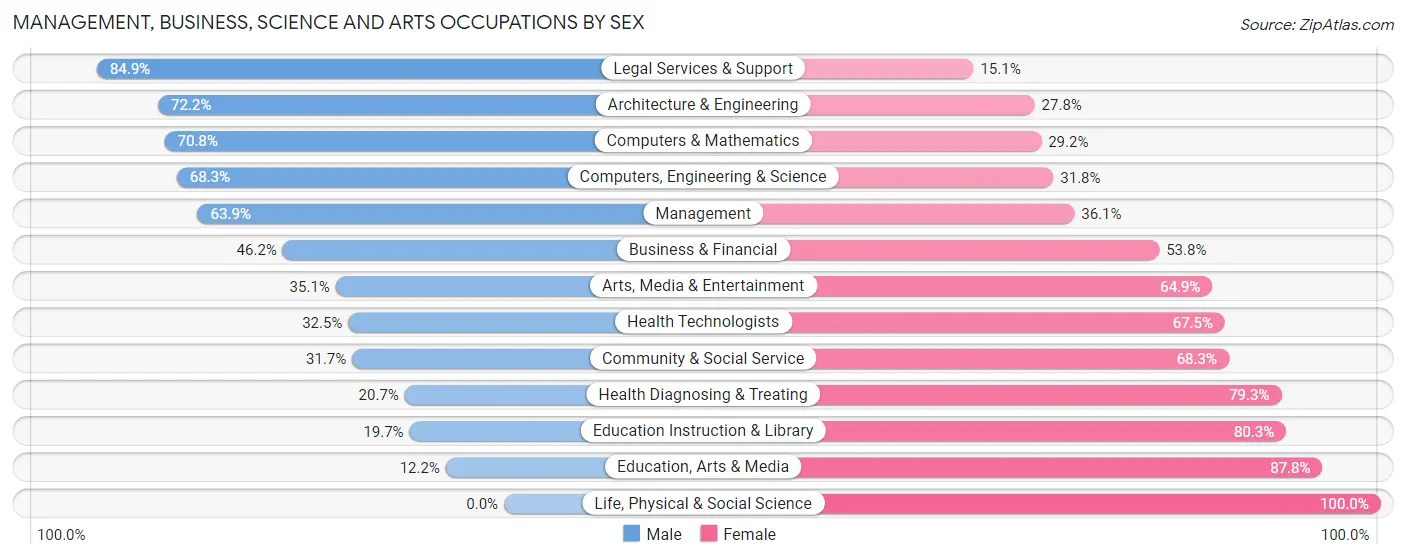
Management, Business, Science and Arts Occupations by Sex
Within the Management, Business, Science and Arts occupations in Northville, the most male-oriented occupations are Legal Services & Support (84.9%), Architecture & Engineering (72.2%), and Computers & Mathematics (70.8%), while the most female-oriented occupations are Life, Physical & Social Science (100.0%), Education, Arts & Media (87.8%), and Education Instruction & Library (80.3%).
| Occupation | Male | Female |
| Management | 361 (63.9%) | 204 (36.1%) |
| Business & Financial | 235 (46.2%) | 274 (53.8%) |
| Computers, Engineering & Science | 288 (68.2%) | 134 (31.8%) |
| Computers & Mathematics | 218 (70.8%) | 90 (29.2%) |
| Architecture & Engineering | 70 (72.2%) | 27 (27.8%) |
| Life, Physical & Social Science | 0 (0.0%) | 17 (100.0%) |
| Community & Social Service | 115 (31.7%) | 248 (68.3%) |
| Education, Arts & Media | 9 (12.2%) | 65 (87.8%) |
| Legal Services & Support | 45 (84.9%) | 8 (15.1%) |
| Education Instruction & Library | 28 (19.7%) | 114 (80.3%) |
| Arts, Media & Entertainment | 33 (35.1%) | 61 (64.9%) |
| Health Diagnosing & Treating | 52 (20.7%) | 199 (79.3%) |
| Health Technologists | 52 (32.5%) | 108 (67.5%) |
| Total (Category) | 1,051 (49.8%) | 1,059 (50.2%) |
| Total (Overall) | 1,715 (52.6%) | 1,546 (47.4%) |
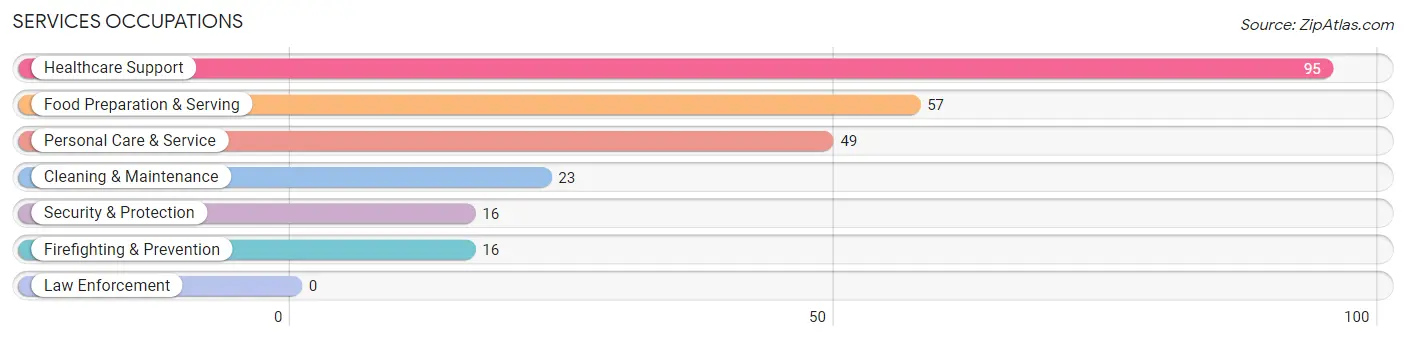
Services Occupations
The most common Services occupations in Northville are Healthcare Support (95 | 2.9%), Food Preparation & Serving (57 | 1.8%), Personal Care & Service (49 | 1.5%), Cleaning & Maintenance (23 | 0.7%), and Security & Protection (16 | 0.5%).
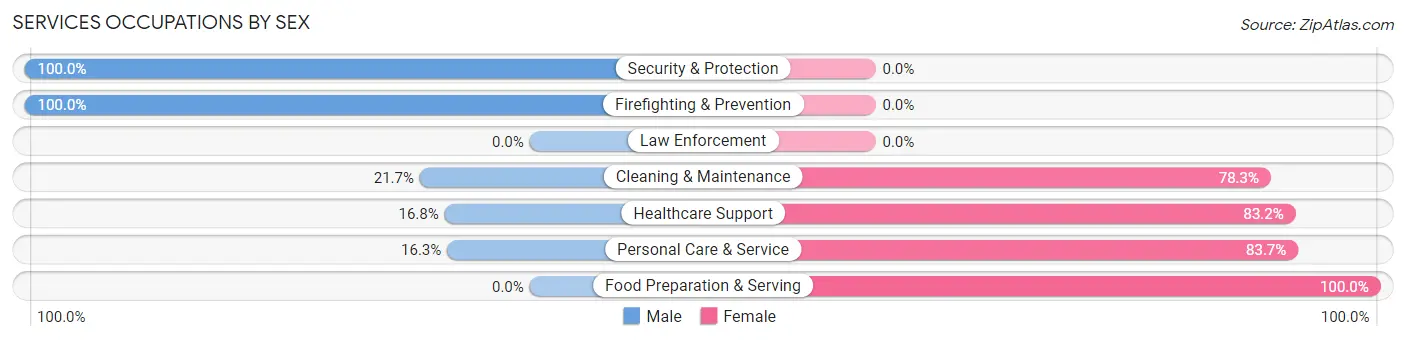
Services Occupations by Sex
Within the Services occupations in Northville, the most male-oriented occupations are Security & Protection (100.0%), Firefighting & Prevention (100.0%), and Cleaning & Maintenance (21.7%), while the most female-oriented occupations are Food Preparation & Serving (100.0%), Personal Care & Service (83.7%), and Healthcare Support (83.2%).
| Occupation | Male | Female |
| Healthcare Support | 16 (16.8%) | 79 (83.2%) |
| Security & Protection | 16 (100.0%) | 0 (0.0%) |
| Firefighting & Prevention | 16 (100.0%) | 0 (0.0%) |
| Law Enforcement | 0 (0.0%) | 0 (0.0%) |
| Food Preparation & Serving | 0 (0.0%) | 57 (100.0%) |
| Cleaning & Maintenance | 5 (21.7%) | 18 (78.3%) |
| Personal Care & Service | 8 (16.3%) | 41 (83.7%) |
| Total (Category) | 45 (18.8%) | 195 (81.2%) |
| Total (Overall) | 1,715 (52.6%) | 1,546 (47.4%) |
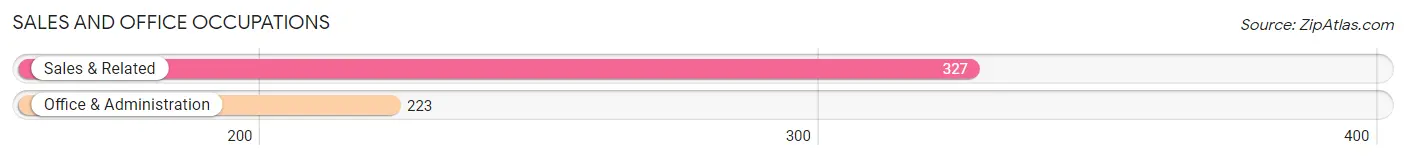
Sales and Office Occupations
The most common Sales and Office occupations in Northville are Sales & Related (327 | 10.0%), and Office & Administration (223 | 6.8%).
Sales and Office Occupations by Sex
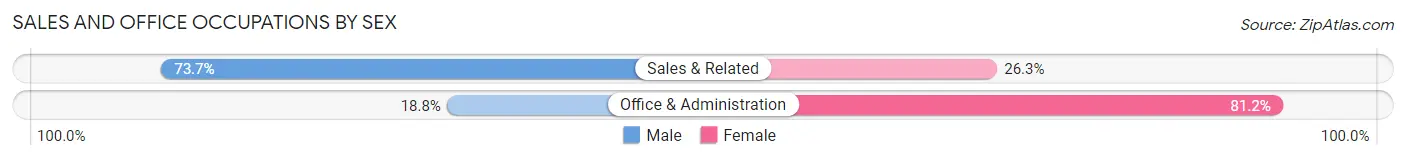
| Occupation | Male | Female |
| Sales & Related | 241 (73.7%) | 86 (26.3%) |
| Office & Administration | 42 (18.8%) | 181 (81.2%) |
| Total (Category) | 283 (51.4%) | 267 (48.5%) |
| Total (Overall) | 1,715 (52.6%) | 1,546 (47.4%) |
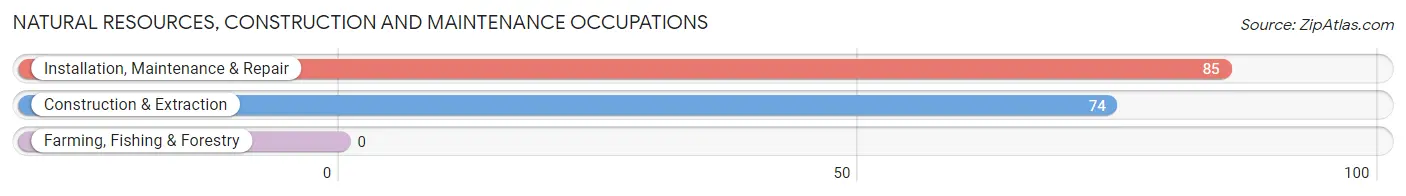
Natural Resources, Construction and Maintenance Occupations
The most common Natural Resources, Construction and Maintenance occupations in Northville are Installation, Maintenance & Repair (85 | 2.6%), and Construction & Extraction (74 | 2.3%).
Natural Resources, Construction and Maintenance Occupations by Sex
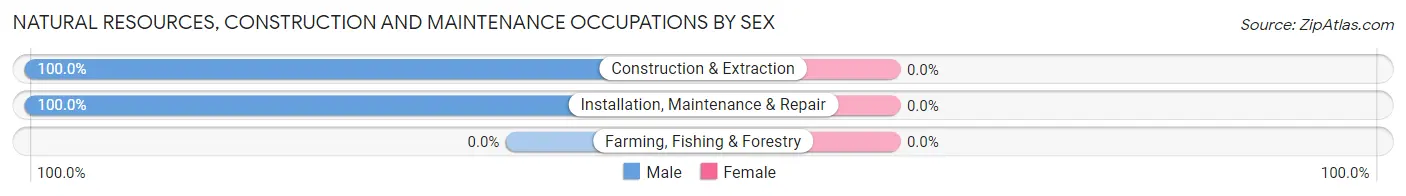
| Occupation | Male | Female |
| Farming, Fishing & Forestry | 0 (0.0%) | 0 (0.0%) |
| Construction & Extraction | 74 (100.0%) | 0 (0.0%) |
| Installation, Maintenance & Repair | 85 (100.0%) | 0 (0.0%) |
| Total (Category) | 159 (100.0%) | 0 (0.0%) |
| Total (Overall) | 1,715 (52.6%) | 1,546 (47.4%) |
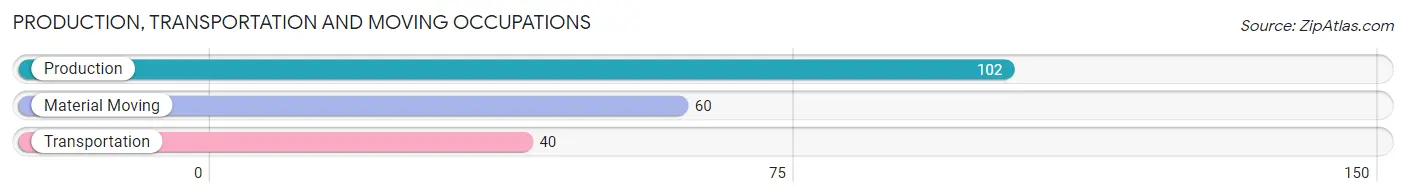
Production, Transportation and Moving Occupations
The most common Production, Transportation and Moving occupations in Northville are Production (102 | 3.1%), Material Moving (60 | 1.8%), and Transportation (40 | 1.2%).
Production, Transportation and Moving Occupations by Sex
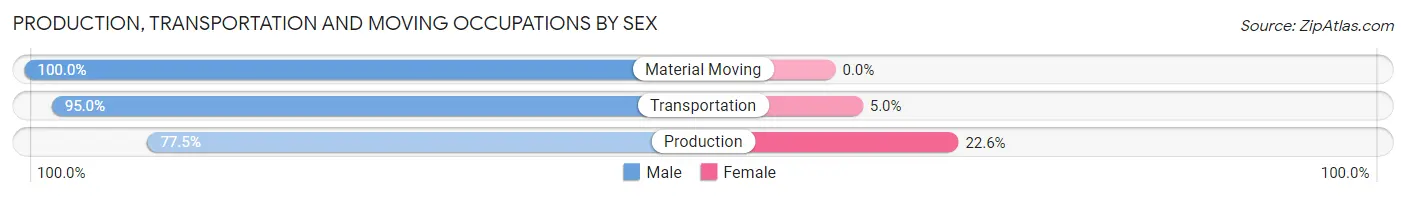
| Occupation | Male | Female |
| Production | 79 (77.4%) | 23 (22.6%) |
| Transportation | 38 (95.0%) | 2 (5.0%) |
| Material Moving | 60 (100.0%) | 0 (0.0%) |
| Total (Category) | 177 (87.6%) | 25 (12.4%) |
| Total (Overall) | 1,715 (52.6%) | 1,546 (47.4%) |
Employment Industries by Sex in Northville
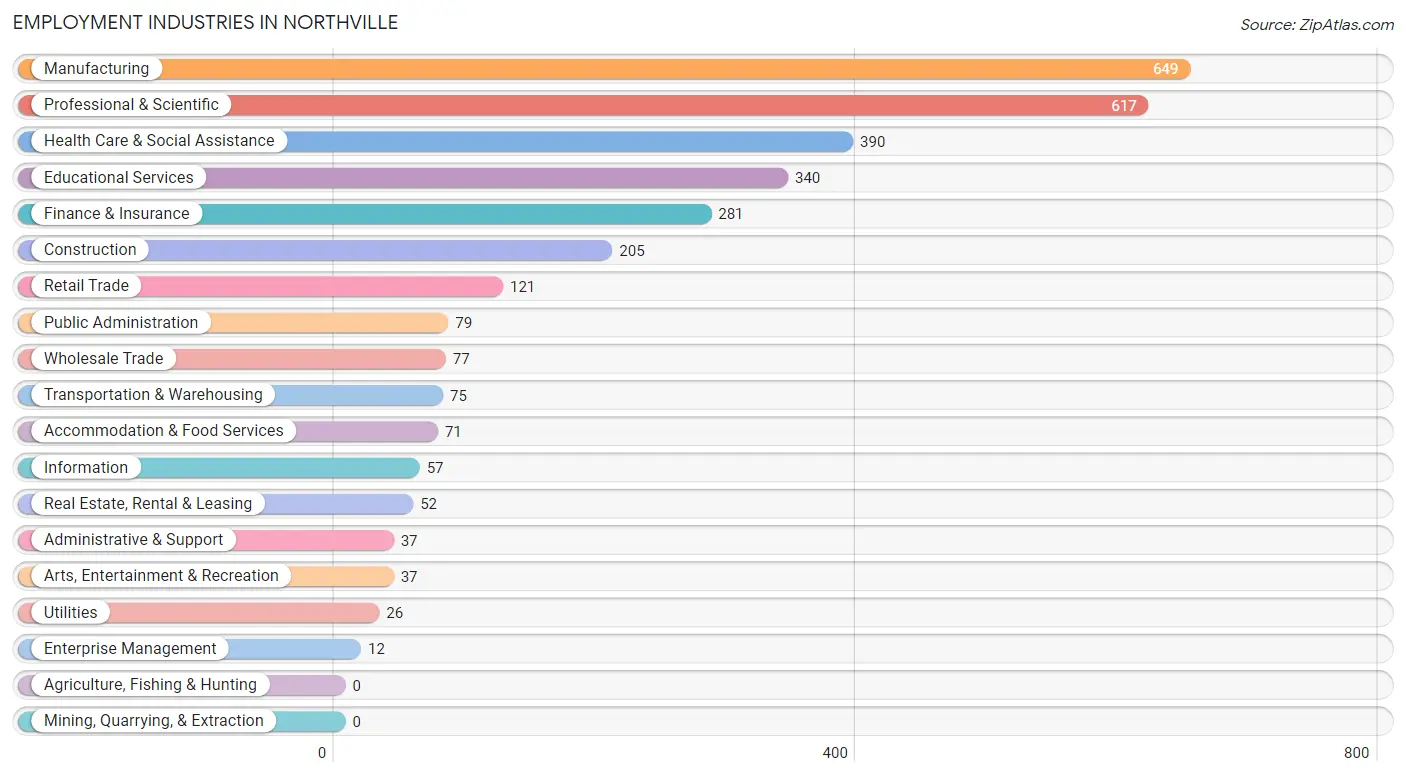
Employment Industries in Northville
The major employment industries in Northville include Manufacturing (649 | 19.9%), Professional & Scientific (617 | 18.9%), Health Care & Social Assistance (390 | 12.0%), Educational Services (340 | 10.4%), and Finance & Insurance (281 | 8.6%).
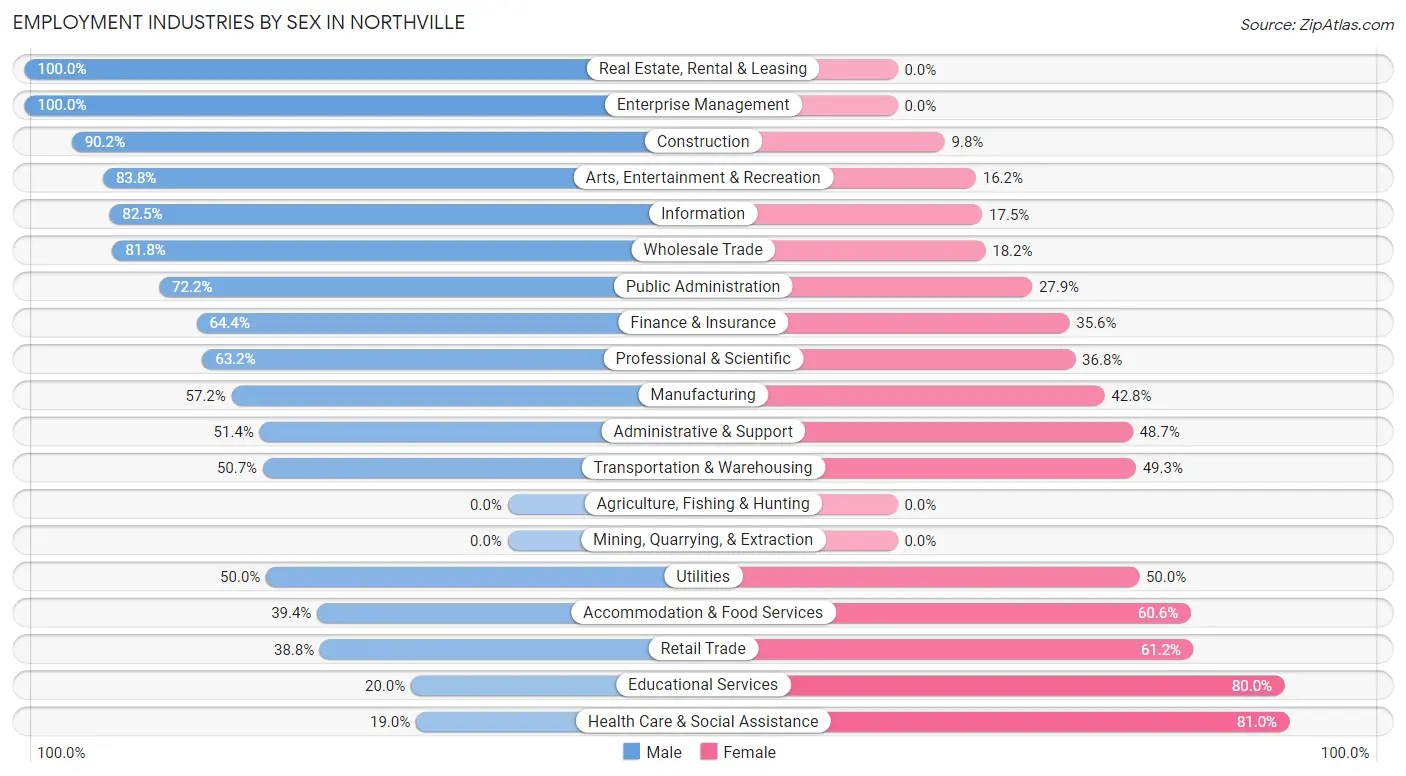
Employment Industries by Sex in Northville
The Northville industries that see more men than women are Real Estate, Rental & Leasing (100.0%), Enterprise Management (100.0%), and Construction (90.2%), whereas the industries that tend to have a higher number of women are Health Care & Social Assistance (81.0%), Educational Services (80.0%), and Retail Trade (61.2%).
| Industry | Male | Female |
| Agriculture, Fishing & Hunting | 0 (0.0%) | 0 (0.0%) |
| Mining, Quarrying, & Extraction | 0 (0.0%) | 0 (0.0%) |
| Construction | 185 (90.2%) | 20 (9.8%) |
| Manufacturing | 371 (57.2%) | 278 (42.8%) |
| Wholesale Trade | 63 (81.8%) | 14 (18.2%) |
| Retail Trade | 47 (38.8%) | 74 (61.2%) |
| Transportation & Warehousing | 38 (50.7%) | 37 (49.3%) |
| Utilities | 13 (50.0%) | 13 (50.0%) |
| Information | 47 (82.5%) | 10 (17.5%) |
| Finance & Insurance | 181 (64.4%) | 100 (35.6%) |
| Real Estate, Rental & Leasing | 52 (100.0%) | 0 (0.0%) |
| Professional & Scientific | 390 (63.2%) | 227 (36.8%) |
| Enterprise Management | 12 (100.0%) | 0 (0.0%) |
| Administrative & Support | 19 (51.3%) | 18 (48.6%) |
| Educational Services | 68 (20.0%) | 272 (80.0%) |
| Health Care & Social Assistance | 74 (19.0%) | 316 (81.0%) |
| Arts, Entertainment & Recreation | 31 (83.8%) | 6 (16.2%) |
| Accommodation & Food Services | 28 (39.4%) | 43 (60.6%) |
| Public Administration | 57 (72.2%) | 22 (27.9%) |
| Total | 1,715 (52.6%) | 1,546 (47.4%) |
Education in Northville
School Enrollment in Northville
The most common levels of schooling among the 1,206 students in Northville are middle school (288 | 23.9%), high school (281 | 23.3%), and elementary school (219 | 18.2%).
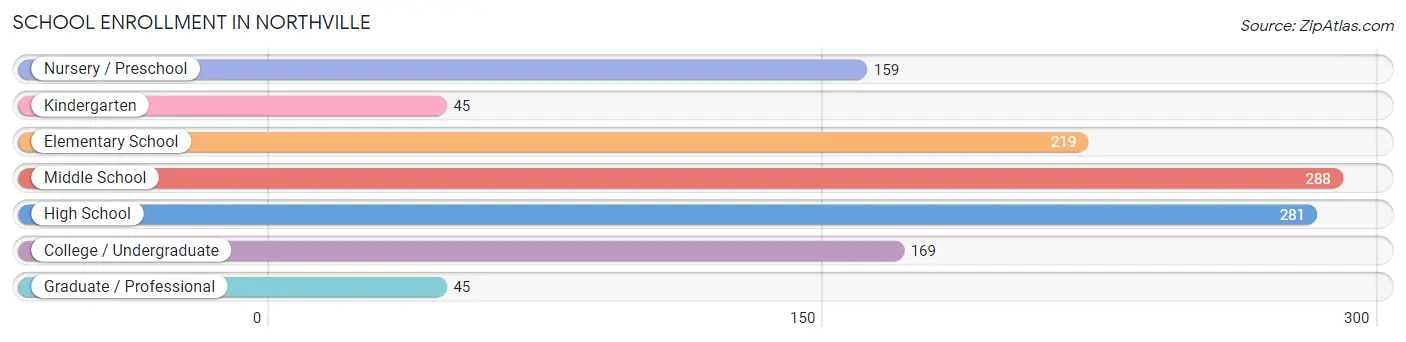
| School Level | # Students | % Students |
| Nursery / Preschool | 159 | 13.2% |
| Kindergarten | 45 | 3.7% |
| Elementary School | 219 | 18.2% |
| Middle School | 288 | 23.9% |
| High School | 281 | 23.3% |
| College / Undergraduate | 169 | 14.0% |
| Graduate / Professional | 45 | 3.7% |
| Total | 1,206 | 100.0% |
School Enrollment by Age by Funding Source in Northville
Out of a total of 1,206 students who are enrolled in schools in Northville, 248 (20.6%) attend a private institution, while the remaining 958 (79.4%) are enrolled in public schools. The age group of 35 years and over has the highest likelihood of being enrolled in private schools, with 26 (83.9% in the age bracket) enrolled. Conversely, the age group of 15 to 17 year olds has the lowest likelihood of being enrolled in a private school, with 215 (89.2% in the age bracket) attending a public institution.
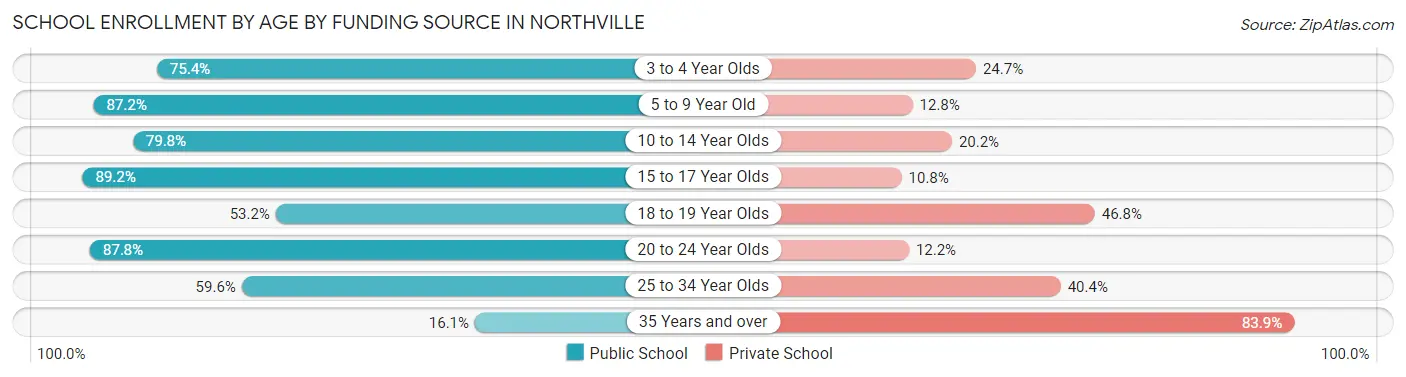
| Age Bracket | Public School | Private School |
| 3 to 4 Year Olds | 107 (75.3%) | 35 (24.6%) |
| 5 to 9 Year Old | 224 (87.2%) | 33 (12.8%) |
| 10 to 14 Year Olds | 281 (79.8%) | 71 (20.2%) |
| 15 to 17 Year Olds | 215 (89.2%) | 26 (10.8%) |
| 18 to 19 Year Olds | 33 (53.2%) | 29 (46.8%) |
| 20 to 24 Year Olds | 65 (87.8%) | 9 (12.2%) |
| 25 to 34 Year Olds | 28 (59.6%) | 19 (40.4%) |
| 35 Years and over | 5 (16.1%) | 26 (83.9%) |
| Total | 958 (79.4%) | 248 (20.6%) |
Educational Attainment by Field of Study in Northville
Business (779 | 23.4%), engineering (496 | 14.9%), science & technology (422 | 12.7%), education (289 | 8.7%), and social sciences (257 | 7.7%) are the most common fields of study among 3,334 individuals in Northville who have obtained a bachelor's degree or higher.
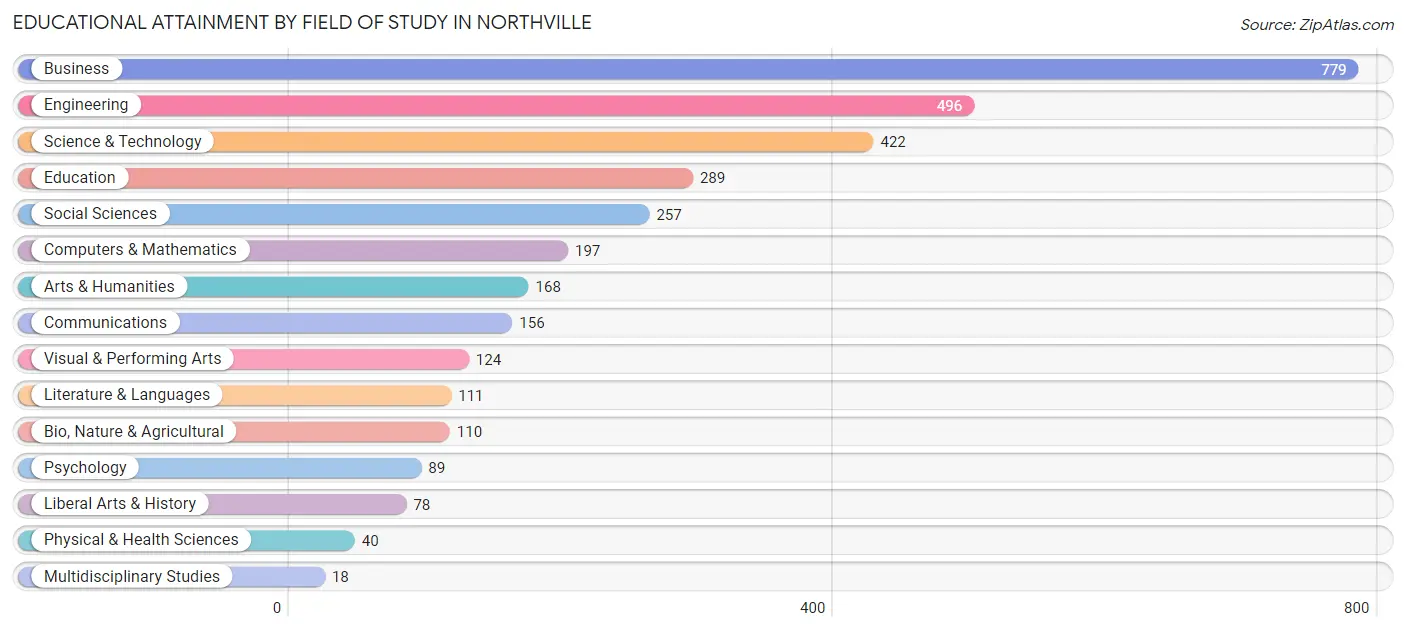
| Field of Study | # Graduates | % Graduates |
| Computers & Mathematics | 197 | 5.9% |
| Bio, Nature & Agricultural | 110 | 3.3% |
| Physical & Health Sciences | 40 | 1.2% |
| Psychology | 89 | 2.7% |
| Social Sciences | 257 | 7.7% |
| Engineering | 496 | 14.9% |
| Multidisciplinary Studies | 18 | 0.5% |
| Science & Technology | 422 | 12.7% |
| Business | 779 | 23.4% |
| Education | 289 | 8.7% |
| Literature & Languages | 111 | 3.3% |
| Liberal Arts & History | 78 | 2.3% |
| Visual & Performing Arts | 124 | 3.7% |
| Communications | 156 | 4.7% |
| Arts & Humanities | 168 | 5.0% |
| Total | 3,334 | 100.0% |
Transportation & Commute in Northville
Vehicle Availability by Sex in Northville
The most prevalent vehicle ownership categories in Northville are males with 2 vehicles (991, accounting for 57.9%) and females with 2 vehicles (910, making up 65.6%).
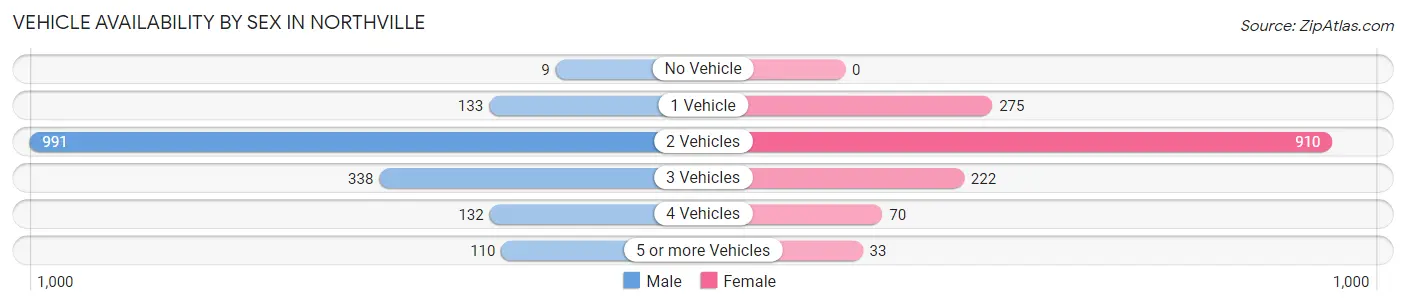
| Vehicles Available | Male | Female |
| No Vehicle | 9 (0.5%) | 0 (0.0%) |
| 1 Vehicle | 133 (7.8%) | 275 (18.2%) |
| 2 Vehicles | 991 (57.9%) | 910 (60.3%) |
| 3 Vehicles | 338 (19.7%) | 222 (14.7%) |
| 4 Vehicles | 132 (7.7%) | 70 (4.6%) |
| 5 or more Vehicles | 110 (6.4%) | 33 (2.2%) |
| Total | 1,713 (100.0%) | 1,510 (100.0%) |
Commute Time in Northville
The most frequently occuring commute durations in Northville are 30 to 34 minutes (467 commuters, 20.1%), 45 to 59 minutes (288 commuters, 12.4%), and 15 to 19 minutes (270 commuters, 11.6%).
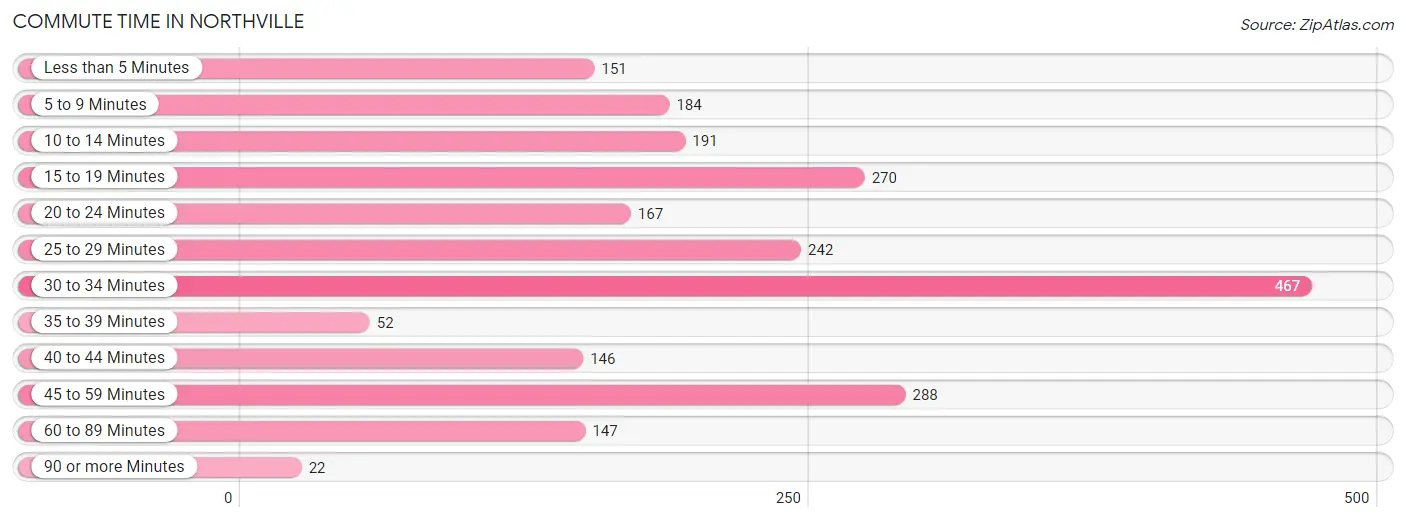
| Commute Time | # Commuters | % Commuters |
| Less than 5 Minutes | 151 | 6.5% |
| 5 to 9 Minutes | 184 | 7.9% |
| 10 to 14 Minutes | 191 | 8.2% |
| 15 to 19 Minutes | 270 | 11.6% |
| 20 to 24 Minutes | 167 | 7.2% |
| 25 to 29 Minutes | 242 | 10.4% |
| 30 to 34 Minutes | 467 | 20.1% |
| 35 to 39 Minutes | 52 | 2.2% |
| 40 to 44 Minutes | 146 | 6.3% |
| 45 to 59 Minutes | 288 | 12.4% |
| 60 to 89 Minutes | 147 | 6.3% |
| 90 or more Minutes | 22 | 0.9% |
Commute Time by Sex in Northville
The most common commute times in Northville are 30 to 34 minutes (205 commuters, 17.4%) for males and 30 to 34 minutes (262 commuters, 22.8%) for females.
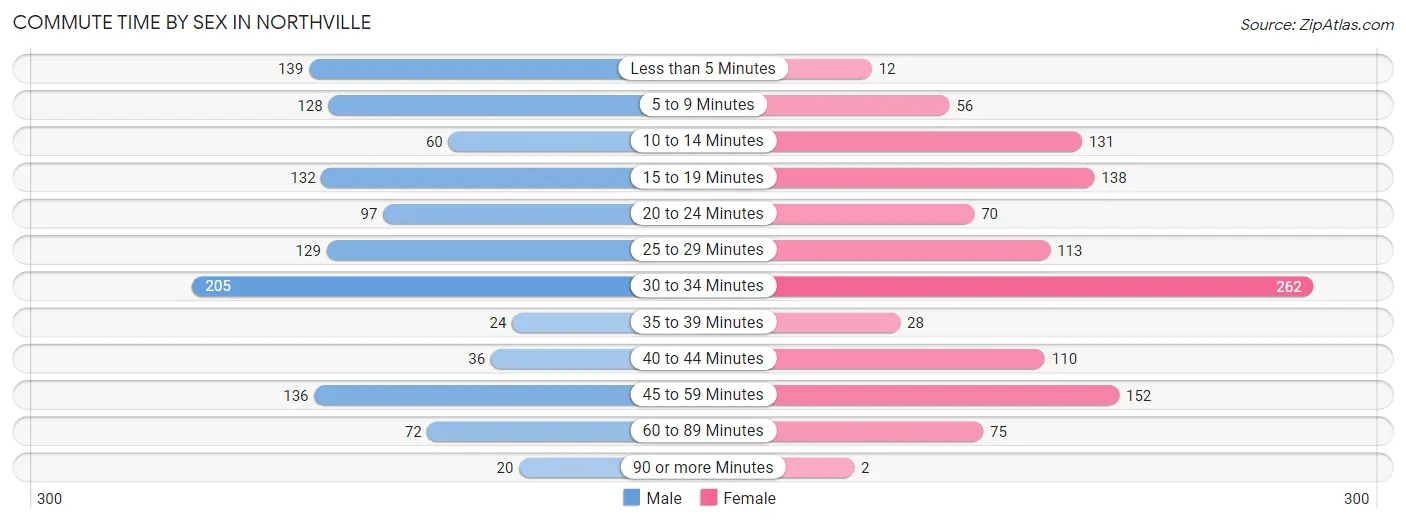
| Commute Time | Male | Female |
| Less than 5 Minutes | 139 (11.8%) | 12 (1.0%) |
| 5 to 9 Minutes | 128 (10.9%) | 56 (4.9%) |
| 10 to 14 Minutes | 60 (5.1%) | 131 (11.4%) |
| 15 to 19 Minutes | 132 (11.2%) | 138 (12.0%) |
| 20 to 24 Minutes | 97 (8.2%) | 70 (6.1%) |
| 25 to 29 Minutes | 129 (11.0%) | 113 (9.8%) |
| 30 to 34 Minutes | 205 (17.4%) | 262 (22.8%) |
| 35 to 39 Minutes | 24 (2.0%) | 28 (2.4%) |
| 40 to 44 Minutes | 36 (3.1%) | 110 (9.6%) |
| 45 to 59 Minutes | 136 (11.5%) | 152 (13.2%) |
| 60 to 89 Minutes | 72 (6.1%) | 75 (6.5%) |
| 90 or more Minutes | 20 (1.7%) | 2 (0.2%) |
Time of Departure to Work by Sex in Northville
The most frequent times of departure to work in Northville are 8:00 AM to 8:29 AM (193, 16.4%) for males and 7:30 AM to 7:59 AM (191, 16.6%) for females.
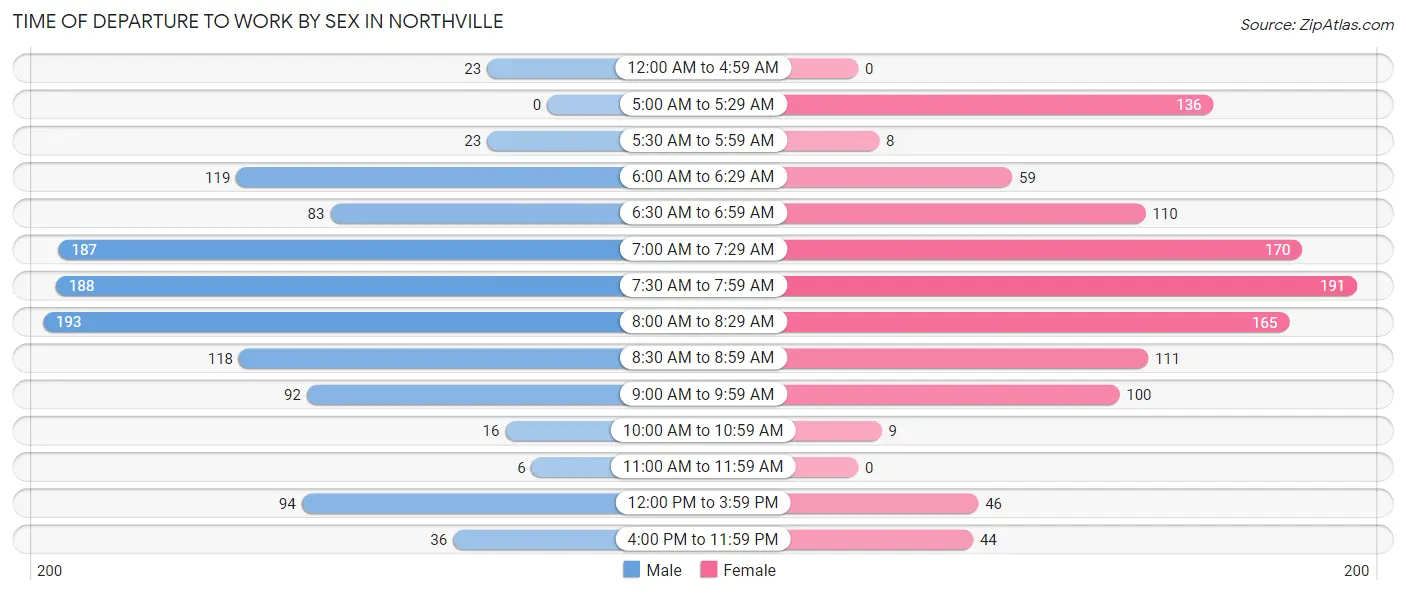
| Time of Departure | Male | Female |
| 12:00 AM to 4:59 AM | 23 (1.9%) | 0 (0.0%) |
| 5:00 AM to 5:29 AM | 0 (0.0%) | 136 (11.8%) |
| 5:30 AM to 5:59 AM | 23 (1.9%) | 8 (0.7%) |
| 6:00 AM to 6:29 AM | 119 (10.1%) | 59 (5.1%) |
| 6:30 AM to 6:59 AM | 83 (7.0%) | 110 (9.6%) |
| 7:00 AM to 7:29 AM | 187 (15.9%) | 170 (14.8%) |
| 7:30 AM to 7:59 AM | 188 (16.0%) | 191 (16.6%) |
| 8:00 AM to 8:29 AM | 193 (16.4%) | 165 (14.4%) |
| 8:30 AM to 8:59 AM | 118 (10.0%) | 111 (9.7%) |
| 9:00 AM to 9:59 AM | 92 (7.8%) | 100 (8.7%) |
| 10:00 AM to 10:59 AM | 16 (1.4%) | 9 (0.8%) |
| 11:00 AM to 11:59 AM | 6 (0.5%) | 0 (0.0%) |
| 12:00 PM to 3:59 PM | 94 (8.0%) | 46 (4.0%) |
| 4:00 PM to 11:59 PM | 36 (3.1%) | 44 (3.8%) |
| Total | 1,178 (100.0%) | 1,149 (100.0%) |
Housing Occupancy in Northville
Occupancy by Ownership in Northville
Of the total 2,631 dwellings in Northville, owner-occupied units account for 2,224 (84.5%), while renter-occupied units make up 407 (15.5%).
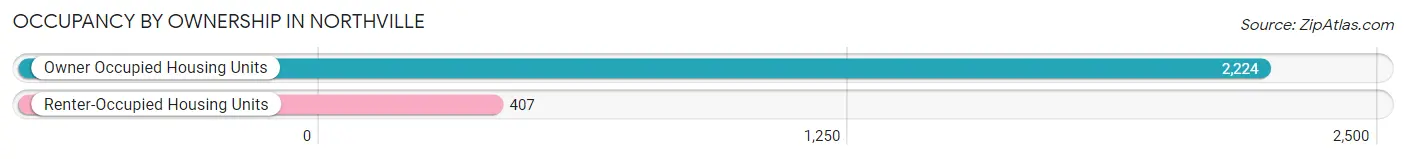
| Occupancy | # Housing Units | % Housing Units |
| Owner Occupied Housing Units | 2,224 | 84.5% |
| Renter-Occupied Housing Units | 407 | 15.5% |
| Total Occupied Housing Units | 2,631 | 100.0% |
Occupancy by Household Size in Northville
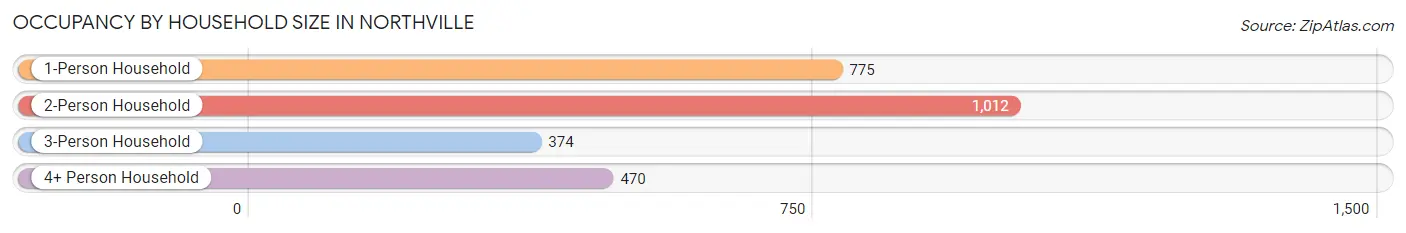
| Household Size | # Housing Units | % Housing Units |
| 1-Person Household | 775 | 29.5% |
| 2-Person Household | 1,012 | 38.5% |
| 3-Person Household | 374 | 14.2% |
| 4+ Person Household | 470 | 17.9% |
| Total Housing Units | 2,631 | 100.0% |
Occupancy by Ownership by Household Size in Northville
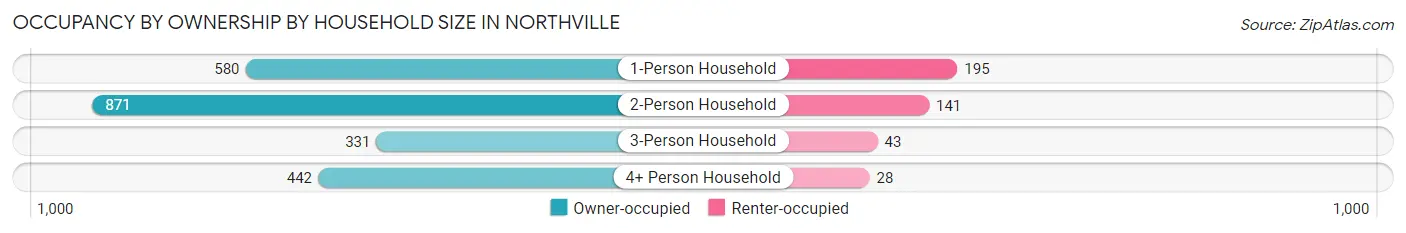
| Household Size | Owner-occupied | Renter-occupied |
| 1-Person Household | 580 (74.8%) | 195 (25.2%) |
| 2-Person Household | 871 (86.1%) | 141 (13.9%) |
| 3-Person Household | 331 (88.5%) | 43 (11.5%) |
| 4+ Person Household | 442 (94.0%) | 28 (6.0%) |
| Total Housing Units | 2,224 (84.5%) | 407 (15.5%) |
Occupancy by Educational Attainment in Northville
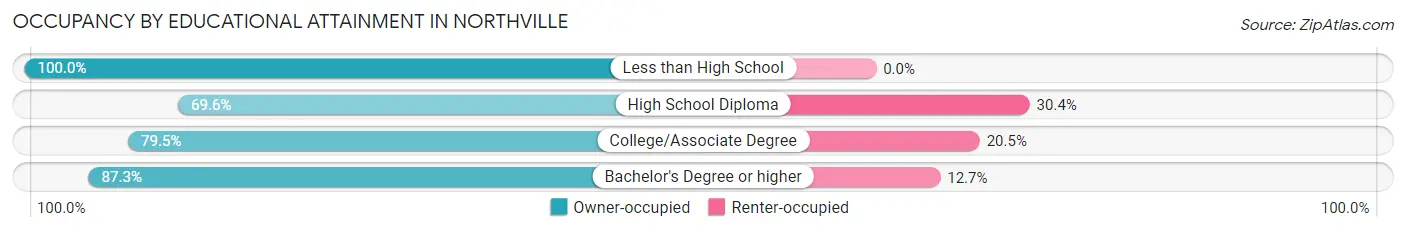
| Household Size | Owner-occupied | Renter-occupied |
| Less than High School | 17 (100.0%) | 0 (0.0%) |
| High School Diploma | 144 (69.6%) | 63 (30.4%) |
| College/Associate Degree | 387 (79.5%) | 100 (20.5%) |
| Bachelor's Degree or higher | 1,676 (87.3%) | 244 (12.7%) |
Occupancy by Age of Householder in Northville
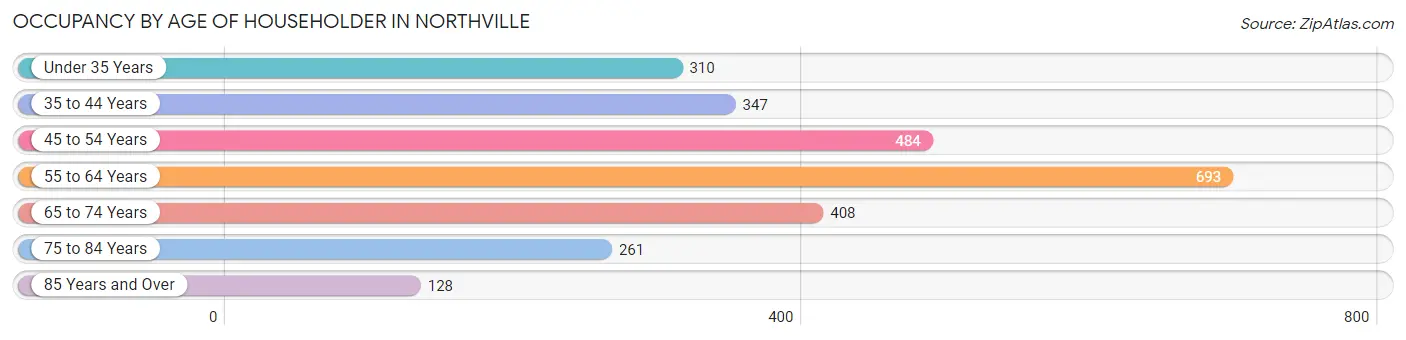
| Age Bracket | # Households | % Households |
| Under 35 Years | 310 | 11.8% |
| 35 to 44 Years | 347 | 13.2% |
| 45 to 54 Years | 484 | 18.4% |
| 55 to 64 Years | 693 | 26.3% |
| 65 to 74 Years | 408 | 15.5% |
| 75 to 84 Years | 261 | 9.9% |
| 85 Years and Over | 128 | 4.9% |
| Total | 2,631 | 100.0% |
Housing Finances in Northville
Median Income by Occupancy in Northville
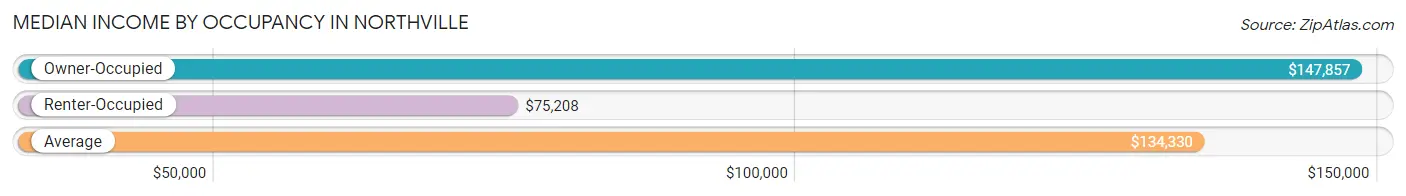
| Occupancy Type | # Households | Median Income |
| Owner-Occupied | 2,224 (84.5%) | $147,857 |
| Renter-Occupied | 407 (15.5%) | $75,208 |
| Average | 2,631 (100.0%) | $134,330 |
Occupancy by Householder Income Bracket in Northville
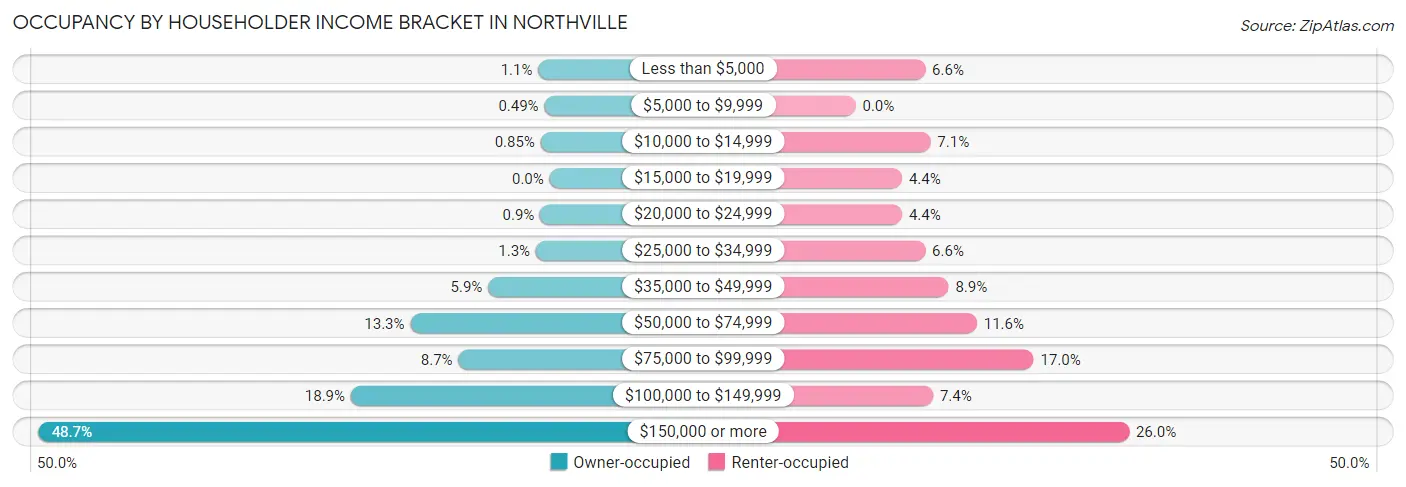
| Income Bracket | Owner-occupied | Renter-occupied |
| Less than $5,000 | 24 (1.1%) | 27 (6.6%) |
| $5,000 to $9,999 | 11 (0.5%) | 0 (0.0%) |
| $10,000 to $14,999 | 19 (0.9%) | 29 (7.1%) |
| $15,000 to $19,999 | 0 (0.0%) | 18 (4.4%) |
| $20,000 to $24,999 | 20 (0.9%) | 18 (4.4%) |
| $25,000 to $34,999 | 29 (1.3%) | 27 (6.6%) |
| $35,000 to $49,999 | 130 (5.9%) | 36 (8.8%) |
| $50,000 to $74,999 | 295 (13.3%) | 47 (11.6%) |
| $75,000 to $99,999 | 193 (8.7%) | 69 (17.0%) |
| $100,000 to $149,999 | 421 (18.9%) | 30 (7.4%) |
| $150,000 or more | 1,082 (48.6%) | 106 (26.0%) |
| Total | 2,224 (100.0%) | 407 (100.0%) |
Monthly Housing Cost Tiers in Northville
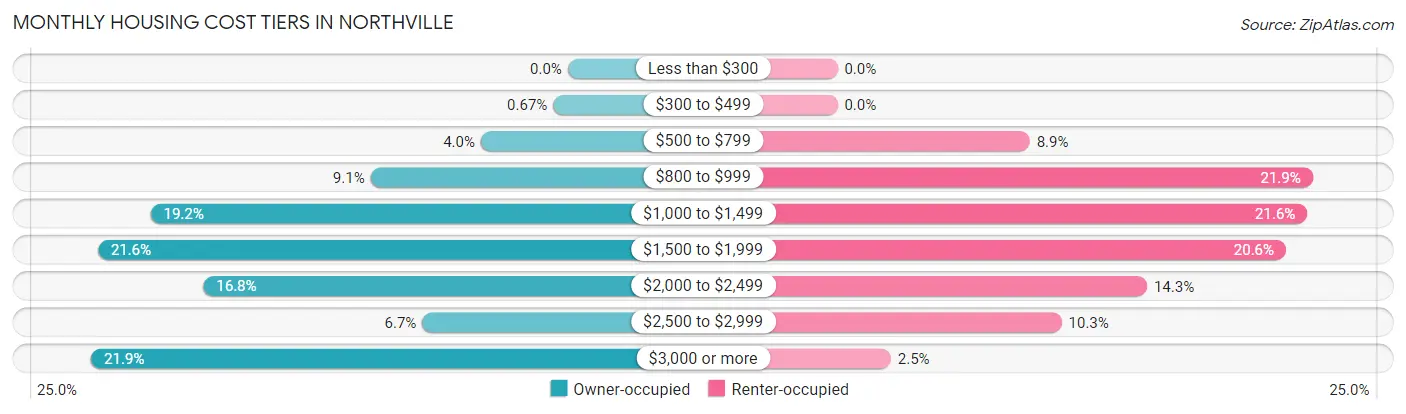
| Monthly Cost | Owner-occupied | Renter-occupied |
| Less than $300 | 0 (0.0%) | 0 (0.0%) |
| $300 to $499 | 15 (0.7%) | 0 (0.0%) |
| $500 to $799 | 89 (4.0%) | 36 (8.8%) |
| $800 to $999 | 202 (9.1%) | 89 (21.9%) |
| $1,000 to $1,499 | 427 (19.2%) | 88 (21.6%) |
| $1,500 to $1,999 | 481 (21.6%) | 84 (20.6%) |
| $2,000 to $2,499 | 373 (16.8%) | 58 (14.2%) |
| $2,500 to $2,999 | 149 (6.7%) | 42 (10.3%) |
| $3,000 or more | 488 (21.9%) | 10 (2.5%) |
| Total | 2,224 (100.0%) | 407 (100.0%) |
Physical Housing Characteristics in Northville
Housing Structures in Northville
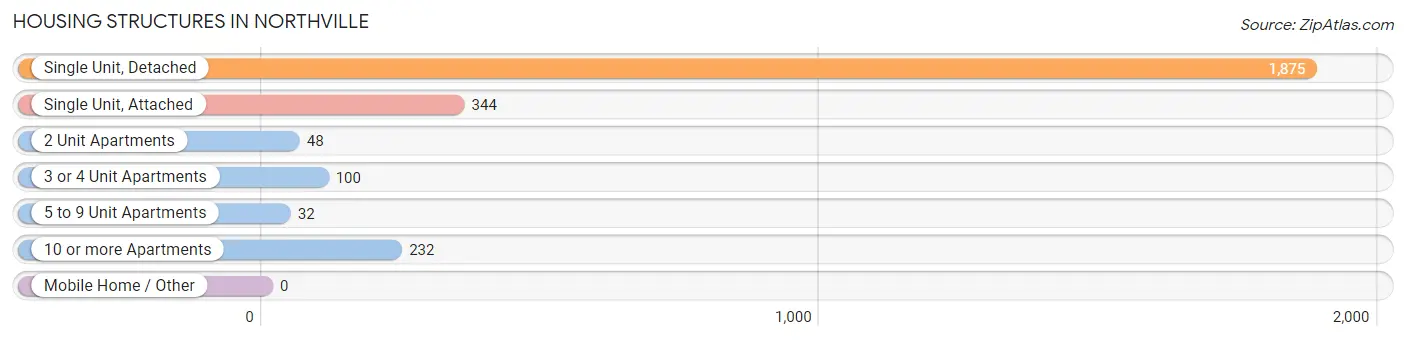
| Structure Type | # Housing Units | % Housing Units |
| Single Unit, Detached | 1,875 | 71.3% |
| Single Unit, Attached | 344 | 13.1% |
| 2 Unit Apartments | 48 | 1.8% |
| 3 or 4 Unit Apartments | 100 | 3.8% |
| 5 to 9 Unit Apartments | 32 | 1.2% |
| 10 or more Apartments | 232 | 8.8% |
| Mobile Home / Other | 0 | 0.0% |
| Total | 2,631 | 100.0% |
Housing Structures by Occupancy in Northville
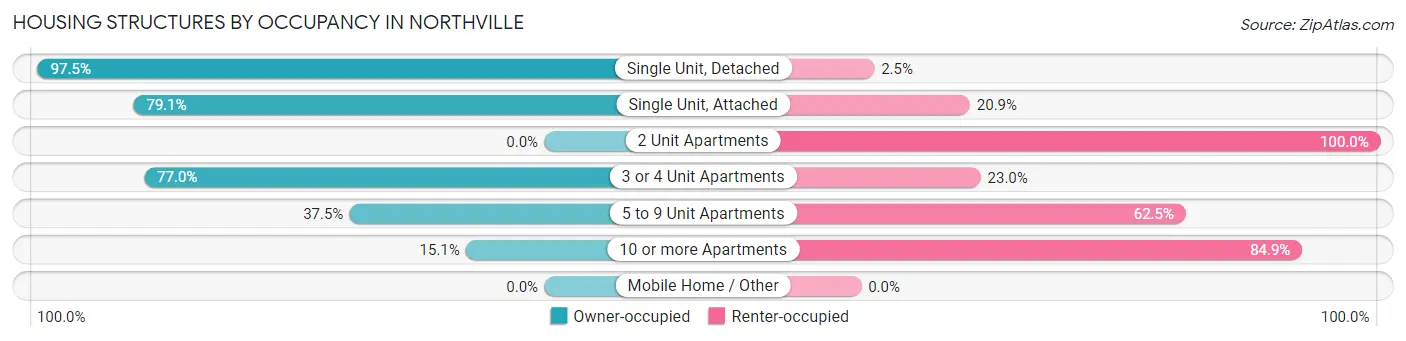
| Structure Type | Owner-occupied | Renter-occupied |
| Single Unit, Detached | 1,828 (97.5%) | 47 (2.5%) |
| Single Unit, Attached | 272 (79.1%) | 72 (20.9%) |
| 2 Unit Apartments | 0 (0.0%) | 48 (100.0%) |
| 3 or 4 Unit Apartments | 77 (77.0%) | 23 (23.0%) |
| 5 to 9 Unit Apartments | 12 (37.5%) | 20 (62.5%) |
| 10 or more Apartments | 35 (15.1%) | 197 (84.9%) |
| Mobile Home / Other | 0 (0.0%) | 0 (0.0%) |
| Total | 2,224 (84.5%) | 407 (15.5%) |
Housing Structures by Number of Rooms in Northville
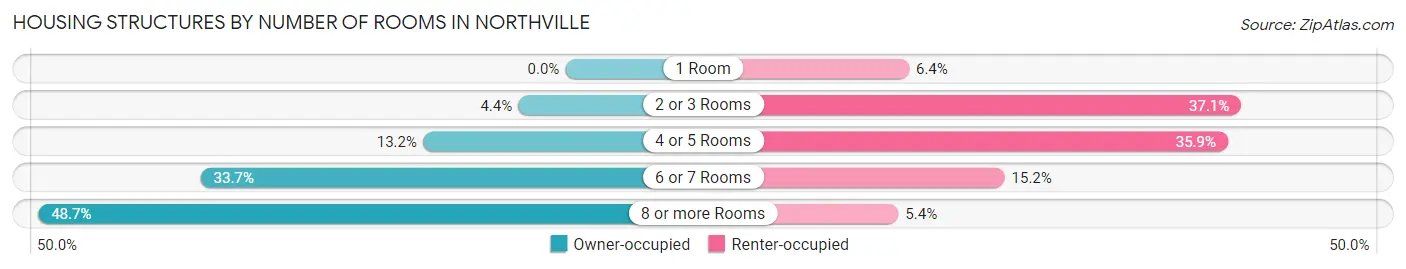
| Number of Rooms | Owner-occupied | Renter-occupied |
| 1 Room | 0 (0.0%) | 26 (6.4%) |
| 2 or 3 Rooms | 97 (4.4%) | 151 (37.1%) |
| 4 or 5 Rooms | 293 (13.2%) | 146 (35.9%) |
| 6 or 7 Rooms | 750 (33.7%) | 62 (15.2%) |
| 8 or more Rooms | 1,084 (48.7%) | 22 (5.4%) |
| Total | 2,224 (100.0%) | 407 (100.0%) |
Housing Structure by Heating Type in Northville

| Heating Type | Owner-occupied | Renter-occupied |
| Utility Gas | 2,043 (91.9%) | 352 (86.5%) |
| Bottled, Tank, or LP Gas | 23 (1.0%) | 0 (0.0%) |
| Electricity | 119 (5.3%) | 26 (6.4%) |
| Fuel Oil or Kerosene | 31 (1.4%) | 0 (0.0%) |
| Coal or Coke | 0 (0.0%) | 0 (0.0%) |
| All other Fuels | 0 (0.0%) | 11 (2.7%) |
| No Fuel Used | 8 (0.4%) | 18 (4.4%) |
| Total | 2,224 (100.0%) | 407 (100.0%) |
Household Vehicle Usage in Northville
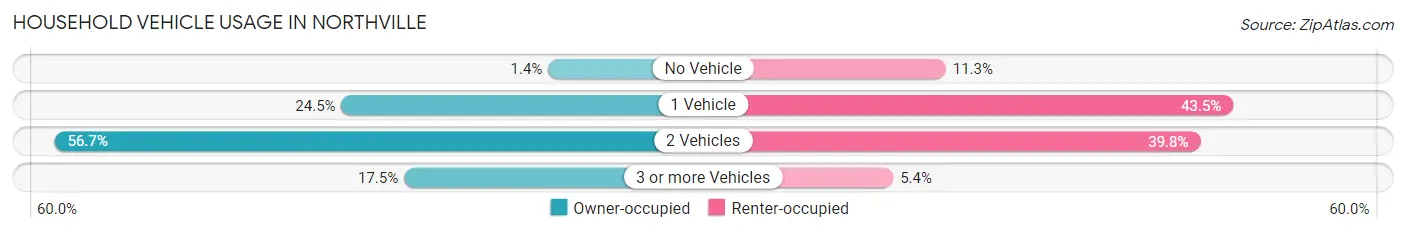
| Vehicles per Household | Owner-occupied | Renter-occupied |
| No Vehicle | 30 (1.3%) | 46 (11.3%) |
| 1 Vehicle | 545 (24.5%) | 177 (43.5%) |
| 2 Vehicles | 1,260 (56.7%) | 162 (39.8%) |
| 3 or more Vehicles | 389 (17.5%) | 22 (5.4%) |
| Total | 2,224 (100.0%) | 407 (100.0%) |
Real Estate & Mortgages in Northville
Real Estate and Mortgage Overview in Northville
| Characteristic | Without Mortgage | With Mortgage |
| Housing Units | 568 | 1,656 |
| Median Property Value | $478,600 | $395,300 |
| Median Household Income | $88,088 | $871 |
| Monthly Housing Costs | $1,058 | $488 |
| Real Estate Taxes | $6,749 | $57 |
Property Value by Mortgage Status in Northville
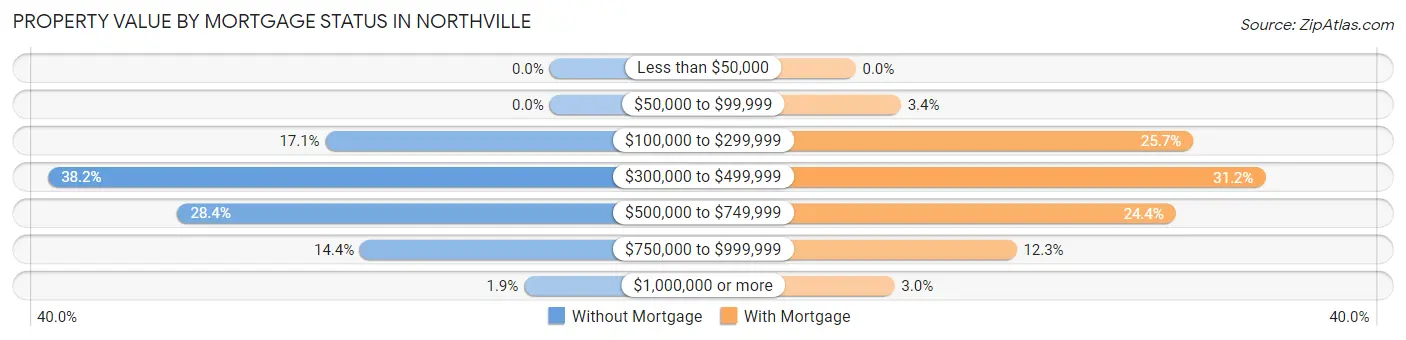
| Property Value | Without Mortgage | With Mortgage |
| Less than $50,000 | 0 (0.0%) | 0 (0.0%) |
| $50,000 to $99,999 | 0 (0.0%) | 57 (3.4%) |
| $100,000 to $299,999 | 97 (17.1%) | 426 (25.7%) |
| $300,000 to $499,999 | 217 (38.2%) | 517 (31.2%) |
| $500,000 to $749,999 | 161 (28.3%) | 404 (24.4%) |
| $750,000 to $999,999 | 82 (14.4%) | 203 (12.3%) |
| $1,000,000 or more | 11 (1.9%) | 49 (3.0%) |
| Total | 568 (100.0%) | 1,656 (100.0%) |
Household Income by Mortgage Status in Northville
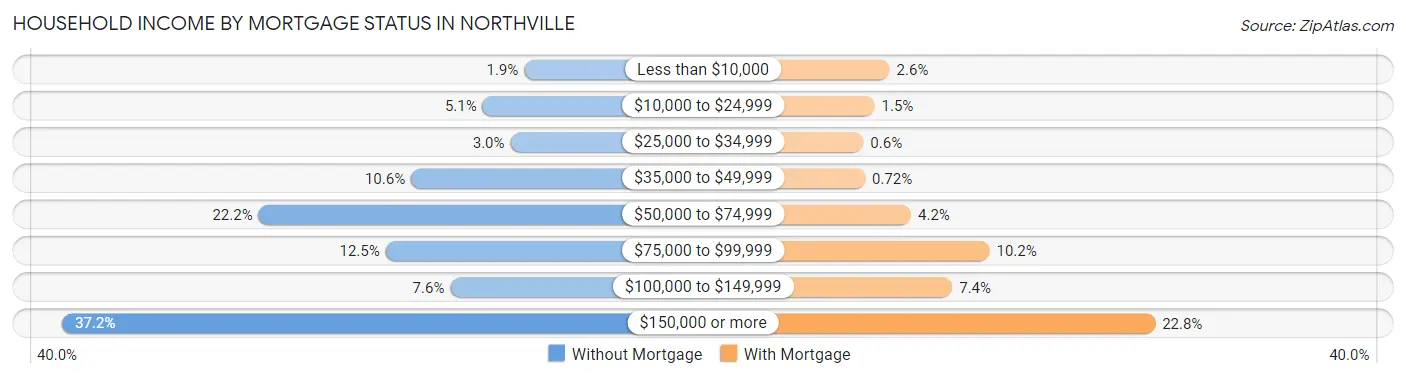
| Household Income | Without Mortgage | With Mortgage |
| Less than $10,000 | 11 (1.9%) | 43 (2.6%) |
| $10,000 to $24,999 | 29 (5.1%) | 24 (1.5%) |
| $25,000 to $34,999 | 17 (3.0%) | 10 (0.6%) |
| $35,000 to $49,999 | 60 (10.6%) | 12 (0.7%) |
| $50,000 to $74,999 | 126 (22.2%) | 70 (4.2%) |
| $75,000 to $99,999 | 71 (12.5%) | 169 (10.2%) |
| $100,000 to $149,999 | 43 (7.6%) | 122 (7.4%) |
| $150,000 or more | 211 (37.1%) | 378 (22.8%) |
| Total | 568 (100.0%) | 1,656 (100.0%) |
Property Value to Household Income Ratio in Northville
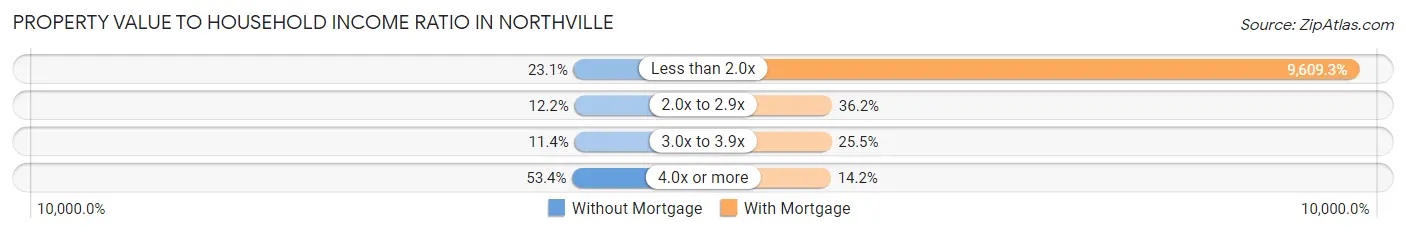
| Value-to-Income Ratio | Without Mortgage | With Mortgage |
| Less than 2.0x | 131 (23.1%) | 159,130 (9,609.3%) |
| 2.0x to 2.9x | 69 (12.1%) | 599 (36.2%) |
| 3.0x to 3.9x | 65 (11.4%) | 423 (25.5%) |
| 4.0x or more | 303 (53.3%) | 235 (14.2%) |
| Total | 568 (100.0%) | 1,656 (100.0%) |
Real Estate Taxes by Mortgage Status in Northville
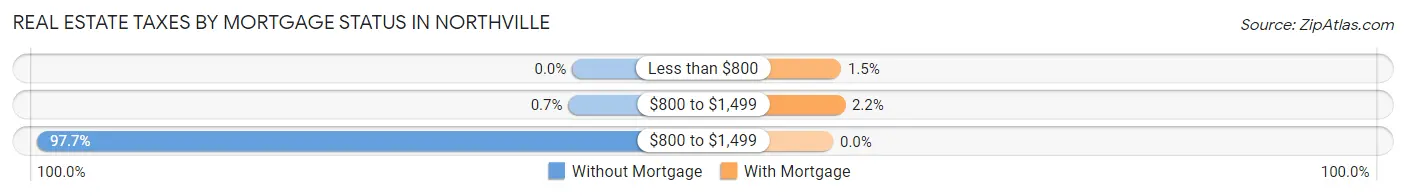
| Property Taxes | Without Mortgage | With Mortgage |
| Less than $800 | 0 (0.0%) | 24 (1.5%) |
| $800 to $1,499 | 4 (0.7%) | 36 (2.2%) |
| $800 to $1,499 | 555 (97.7%) | 0 (0.0%) |
| Total | 568 (100.0%) | 1,656 (100.0%) |
Health & Disability in Northville
Health Insurance Coverage by Age in Northville
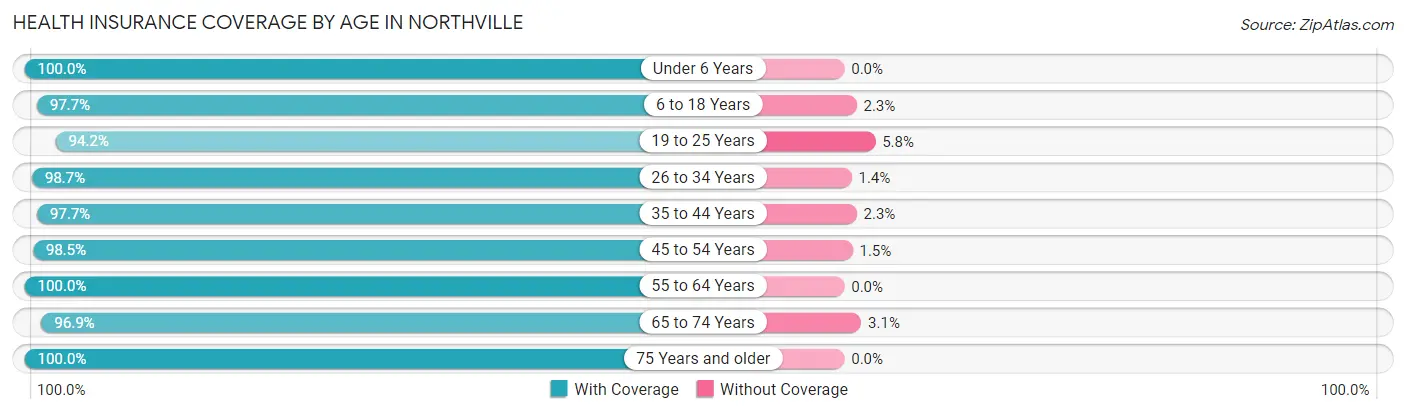
| Age Bracket | With Coverage | Without Coverage |
| Under 6 Years | 415 (100.0%) | 0 (0.0%) |
| 6 to 18 Years | 816 (97.7%) | 19 (2.3%) |
| 19 to 25 Years | 245 (94.2%) | 15 (5.8%) |
| 26 to 34 Years | 656 (98.7%) | 9 (1.3%) |
| 35 to 44 Years | 636 (97.7%) | 15 (2.3%) |
| 45 to 54 Years | 770 (98.5%) | 12 (1.5%) |
| 55 to 64 Years | 1,291 (100.0%) | 0 (0.0%) |
| 65 to 74 Years | 617 (96.9%) | 20 (3.1%) |
| 75 Years and older | 518 (100.0%) | 0 (0.0%) |
| Total | 5,964 (98.5%) | 90 (1.5%) |
Health Insurance Coverage by Citizenship Status in Northville
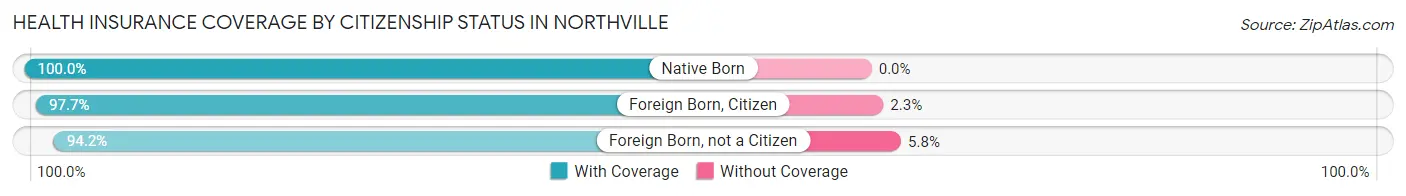
| Citizenship Status | With Coverage | Without Coverage |
| Native Born | 415 (100.0%) | 0 (0.0%) |
| Foreign Born, Citizen | 816 (97.7%) | 19 (2.3%) |
| Foreign Born, not a Citizen | 245 (94.2%) | 15 (5.8%) |
Health Insurance Coverage by Household Income in Northville
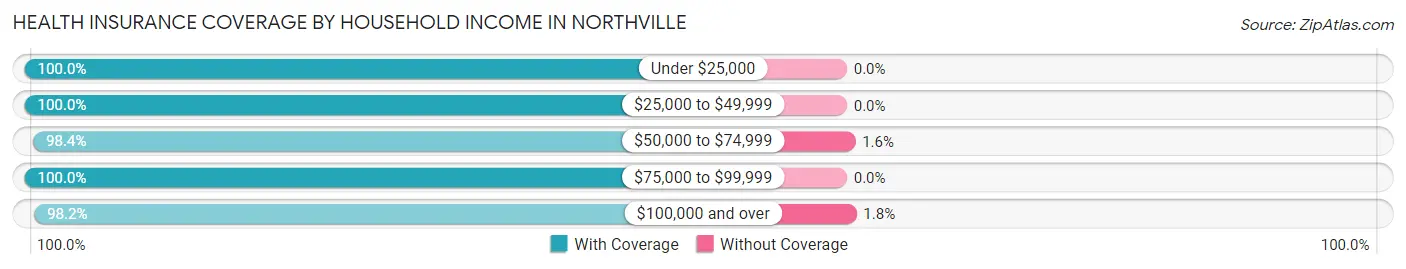
| Household Income | With Coverage | Without Coverage |
| Under $25,000 | 218 (100.0%) | 0 (0.0%) |
| $25,000 to $49,999 | 300 (100.0%) | 0 (0.0%) |
| $50,000 to $74,999 | 559 (98.4%) | 9 (1.6%) |
| $75,000 to $99,999 | 473 (100.0%) | 0 (0.0%) |
| $100,000 and over | 4,414 (98.2%) | 81 (1.8%) |
Public vs Private Health Insurance Coverage by Age in Northville
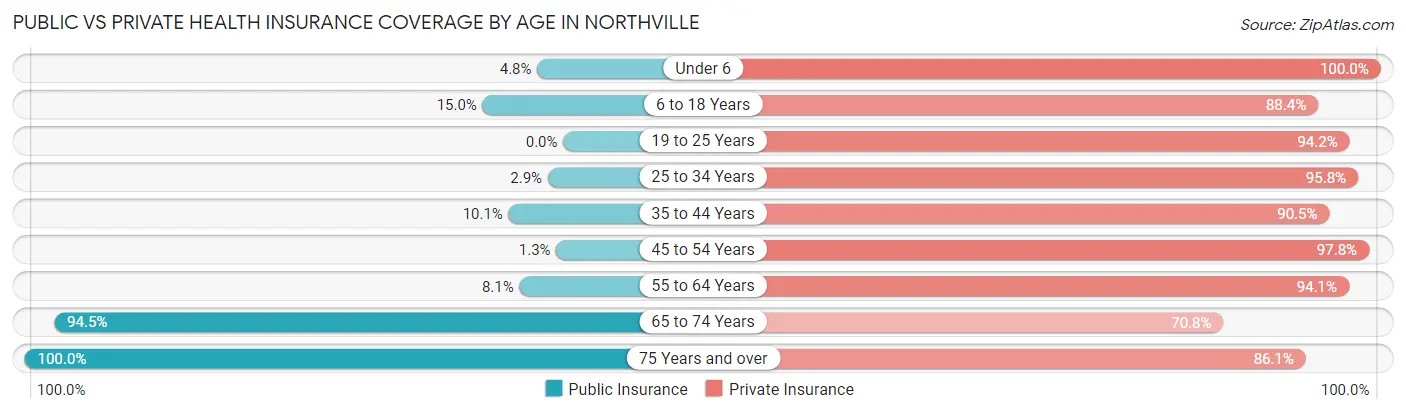
| Age Bracket | Public Insurance | Private Insurance |
| Under 6 | 20 (4.8%) | 415 (100.0%) |
| 6 to 18 Years | 125 (15.0%) | 738 (88.4%) |
| 19 to 25 Years | 0 (0.0%) | 245 (94.2%) |
| 25 to 34 Years | 19 (2.9%) | 637 (95.8%) |
| 35 to 44 Years | 66 (10.1%) | 589 (90.5%) |
| 45 to 54 Years | 10 (1.3%) | 765 (97.8%) |
| 55 to 64 Years | 105 (8.1%) | 1,215 (94.1%) |
| 65 to 74 Years | 602 (94.5%) | 451 (70.8%) |
| 75 Years and over | 518 (100.0%) | 446 (86.1%) |
| Total | 1,465 (24.2%) | 5,501 (90.9%) |
Disability Status by Sex by Age in Northville
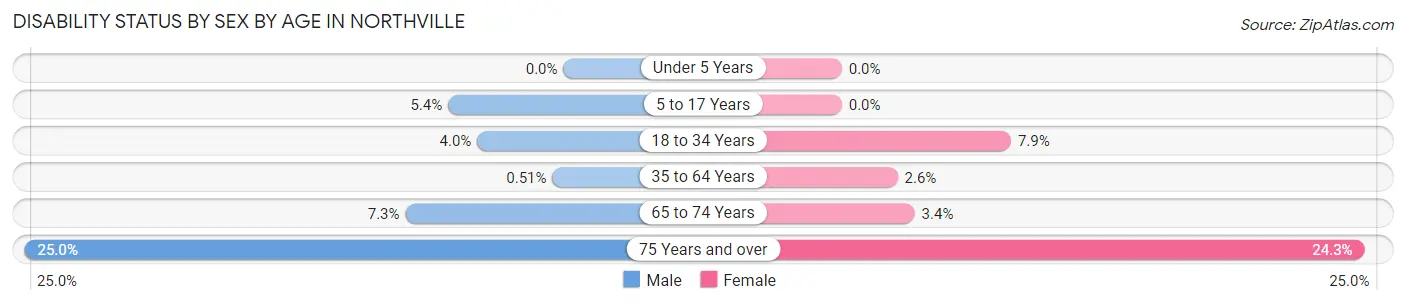
| Age Bracket | Male | Female |
| Under 5 Years | 0 (0.0%) | 0 (0.0%) |
| 5 to 17 Years | 24 (5.3%) | 0 (0.0%) |
| 18 to 34 Years | 21 (4.0%) | 34 (7.9%) |
| 35 to 64 Years | 6 (0.5%) | 40 (2.6%) |
| 65 to 74 Years | 25 (7.3%) | 10 (3.4%) |
| 75 Years and over | 46 (25.0%) | 81 (24.2%) |
Disability Class by Sex by Age in Northville
Disability Class: Hearing Difficulty
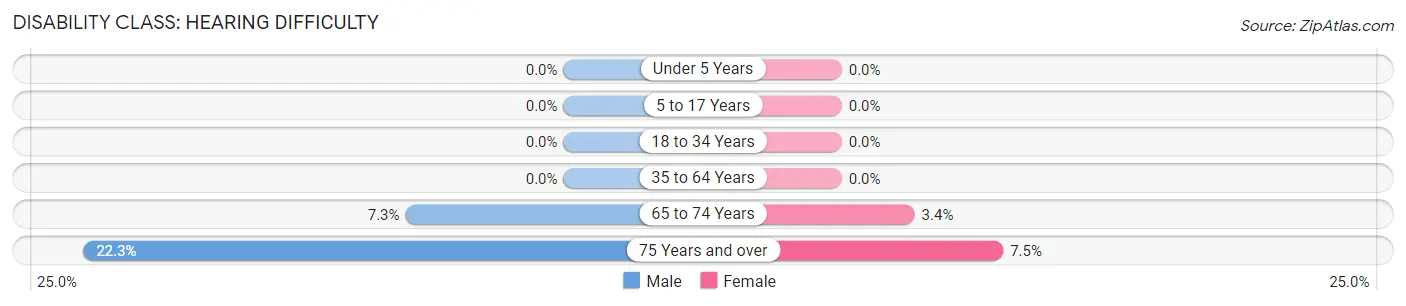
| Age Bracket | Male | Female |
| Under 5 Years | 0 (0.0%) | 0 (0.0%) |
| 5 to 17 Years | 0 (0.0%) | 0 (0.0%) |
| 18 to 34 Years | 0 (0.0%) | 0 (0.0%) |
| 35 to 64 Years | 0 (0.0%) | 0 (0.0%) |
| 65 to 74 Years | 25 (7.3%) | 10 (3.4%) |
| 75 Years and over | 41 (22.3%) | 25 (7.5%) |
Disability Class: Vision Difficulty
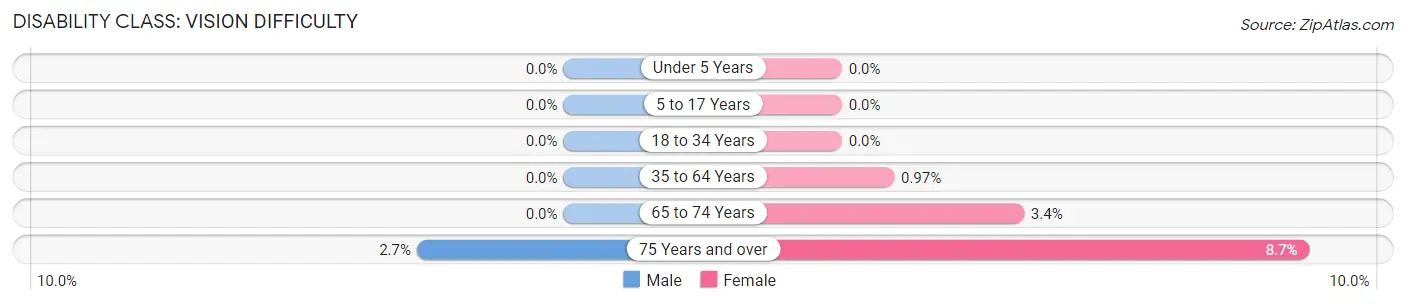
| Age Bracket | Male | Female |
| Under 5 Years | 0 (0.0%) | 0 (0.0%) |
| 5 to 17 Years | 0 (0.0%) | 0 (0.0%) |
| 18 to 34 Years | 0 (0.0%) | 0 (0.0%) |
| 35 to 64 Years | 0 (0.0%) | 15 (1.0%) |
| 65 to 74 Years | 0 (0.0%) | 10 (3.4%) |
| 75 Years and over | 5 (2.7%) | 29 (8.7%) |
Disability Class: Cognitive Difficulty
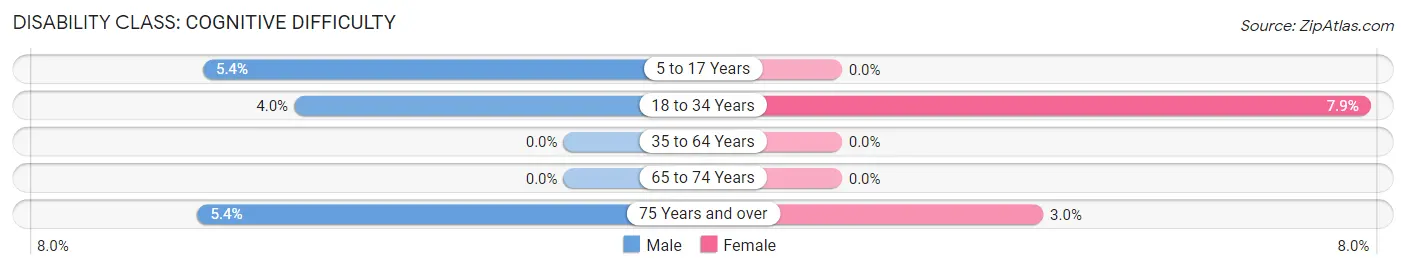
| Age Bracket | Male | Female |
| 5 to 17 Years | 24 (5.3%) | 0 (0.0%) |
| 18 to 34 Years | 21 (4.0%) | 34 (7.9%) |
| 35 to 64 Years | 0 (0.0%) | 0 (0.0%) |
| 65 to 74 Years | 0 (0.0%) | 0 (0.0%) |
| 75 Years and over | 10 (5.4%) | 10 (3.0%) |
Disability Class: Ambulatory Difficulty
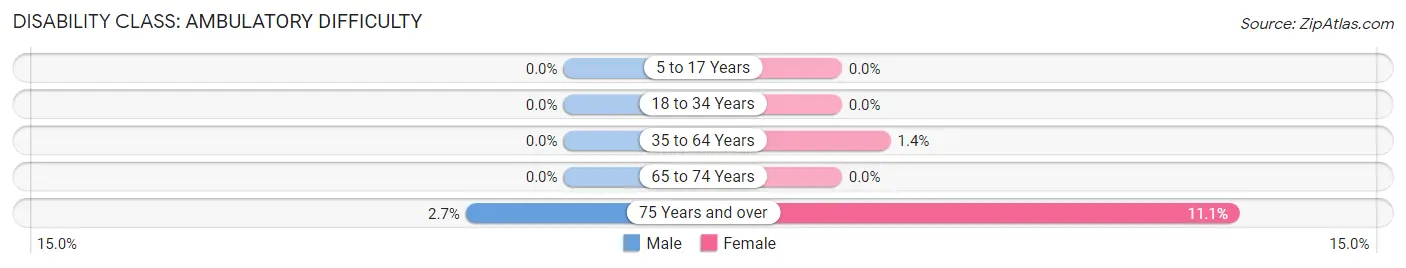
| Age Bracket | Male | Female |
| 5 to 17 Years | 0 (0.0%) | 0 (0.0%) |
| 18 to 34 Years | 0 (0.0%) | 0 (0.0%) |
| 35 to 64 Years | 0 (0.0%) | 21 (1.4%) |
| 65 to 74 Years | 0 (0.0%) | 0 (0.0%) |
| 75 Years and over | 5 (2.7%) | 37 (11.1%) |
Disability Class: Self-Care Difficulty
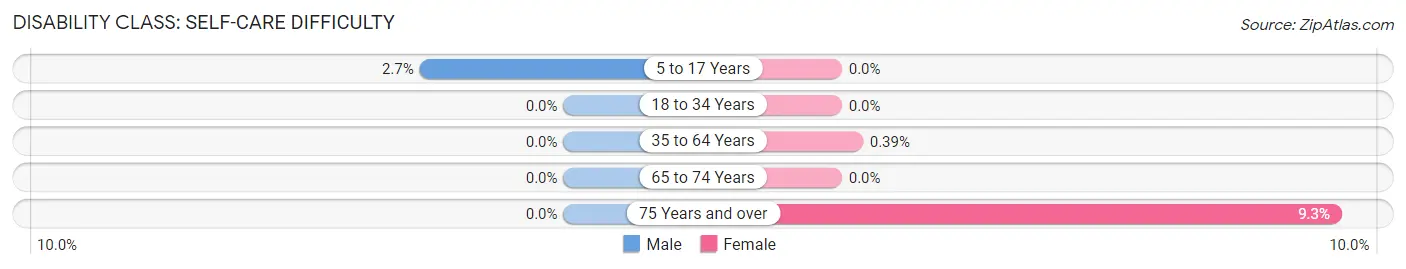
| Age Bracket | Male | Female |
| 5 to 17 Years | 12 (2.7%) | 0 (0.0%) |
| 18 to 34 Years | 0 (0.0%) | 0 (0.0%) |
| 35 to 64 Years | 0 (0.0%) | 6 (0.4%) |
| 65 to 74 Years | 0 (0.0%) | 0 (0.0%) |
| 75 Years and over | 0 (0.0%) | 31 (9.3%) |
Technology Access in Northville
Computing Device Access in Northville
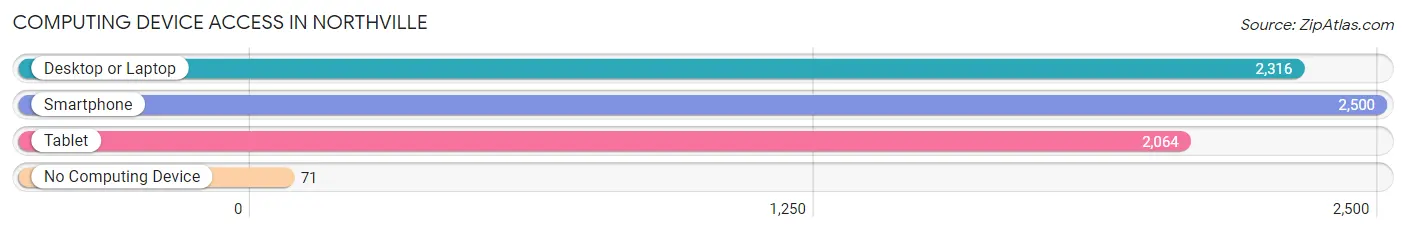
| Device Type | # Households | % Households |
| Desktop or Laptop | 2,316 | 88.0% |
| Smartphone | 2,500 | 95.0% |
| Tablet | 2,064 | 78.4% |
| No Computing Device | 71 | 2.7% |
| Total | 2,631 | 100.0% |
Internet Access in Northville
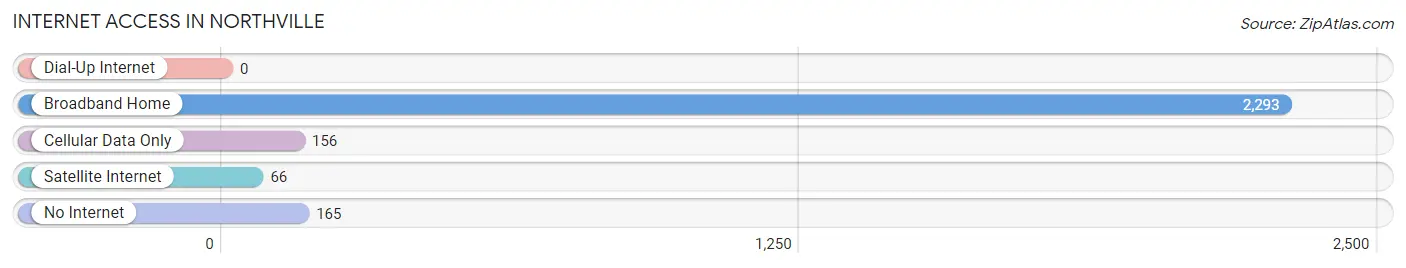
| Internet Type | # Households | % Households |
| Dial-Up Internet | 0 | 0.0% |
| Broadband Home | 2,293 | 87.2% |
| Cellular Data Only | 156 | 5.9% |
| Satellite Internet | 66 | 2.5% |
| No Internet | 165 | 6.3% |
| Total | 2,631 | 100.0% |
Northville Summary
History
Northville, Michigan is a city located in Wayne County, Michigan. It is a suburb of Detroit and is located about 20 miles northwest of the city. The city was first settled in 1825 by a group of settlers from New York. The city was originally known as Northville Township and was incorporated as a village in 1867. The city was officially incorporated as a city in 1955.
Northville has a rich history that dates back to the early 19th century. The city was a major stop on the Underground Railroad, and many of the city’s original settlers were abolitionists. The city was also home to a number of prominent figures in the early days of the automobile industry, including Henry Ford and the Dodge brothers.
Geography
Northville is located in southeastern Michigan, about 20 miles northwest of Detroit. The city is situated on the banks of the Rouge River, which flows through the city. The city is bordered by the cities of Livonia to the east, Plymouth to the north, and Novi to the west. The city covers an area of 8.3 square miles and has a population of about 6,000 people.
The city is located in a region of rolling hills and is home to several parks and nature preserves. The city is also home to a number of lakes, including Cass Lake, which is the largest lake in the city.
Economy
Northville’s economy is largely based on the automotive industry. The city is home to a number of automotive suppliers, including Delphi Automotive, which is one of the largest automotive suppliers in the world. The city is also home to a number of other businesses, including restaurants, retail stores, and professional services.
The city is also home to a number of educational institutions, including Northville Public Schools, which serves the city’s students. The city is also home to a number of private schools, including the Northville Christian School and the Northville Montessori School.
Demographics
As of the 2010 census, the population of Northville was 6,020. The racial makeup of the city was 87.3% White, 5.2% African American, 0.3% Native American, 3.2% Asian, and 3.9% from other races. The median household income in the city was $76,817, and the median family income was $90,917.
The city is home to a number of religious institutions, including churches, synagogues, and mosques. The city is also home to a number of cultural institutions, including the Northville Historical Society and the Northville Arts Commission.
Conclusion
Northville, Michigan is a city located in Wayne County, Michigan. It is a suburb of Detroit and is located about 20 miles northwest of the city. The city was first settled in 1825 by a group of settlers from New York and was officially incorporated as a city in 1955. The city has a rich history that dates back to the early 19th century and is home to a number of prominent figures in the early days of the automobile industry. The city’s economy is largely based on the automotive industry and is home to a number of educational institutions. The city has a population of about 6,000 people and is home to a number of religious and cultural institutions.
Common Questions
What is Per Capita Income in Northville?
Per Capita income in Northville is $76,615.
What is the Median Family Income in Northville?
Median Family Income in Northville is $190,268.
What is the Median Household income in Northville?
Median Household Income in Northville is $134,330.
What is Income or Wage Gap in Northville?
Income or Wage Gap in Northville is 49.1%.
Women in Northville earn 50.9 cents for every dollar earned by a man.
What is Inequality or Gini Index in Northville?
Inequality or Gini Index in Northville is 0.43.
What is the Total Population of Northville?
Total Population of Northville is 6,088.
What is the Total Male Population of Northville?
Total Male Population of Northville is 2,874.
What is the Total Female Population of Northville?
Total Female Population of Northville is 3,214.
What is the Ratio of Males per 100 Females in Northville?
There are 89.42 Males per 100 Females in Northville.
What is the Ratio of Females per 100 Males in Northville?
There are 111.83 Females per 100 Males in Northville.
What is the Median Population Age in Northville?
Median Population Age in Northville is 47.7 Years.
What is the Average Family Size in Northville
Average Family Size in Northville is 2.8 People.
What is the Average Household Size in Northville
Average Household Size in Northville is 2.3 People.
How Large is the Labor Force in Northville?
There are 3,376 People in the Labor Forcein in Northville.
What is the Percentage of People in the Labor Force in Northville?
66.9% of People are in the Labor Force in Northville.
What is the Unemployment Rate in Northville?
Unemployment Rate in Northville is 3.4%.