Turkish vs Immigrants from Barbados Married-Couple Family Poverty
COMPARE
Turkish
Immigrants from Barbados
Married-Couple Family Poverty
Married-Couple Family Poverty Comparison
Turks
Immigrants from Barbados
4.3%
MARRIED-COUPLE FAMILY POVERTY
99.7/ 100
METRIC RATING
49th/ 347
METRIC RANK
6.5%
MARRIED-COUPLE FAMILY POVERTY
0.0/ 100
METRIC RATING
290th/ 347
METRIC RANK
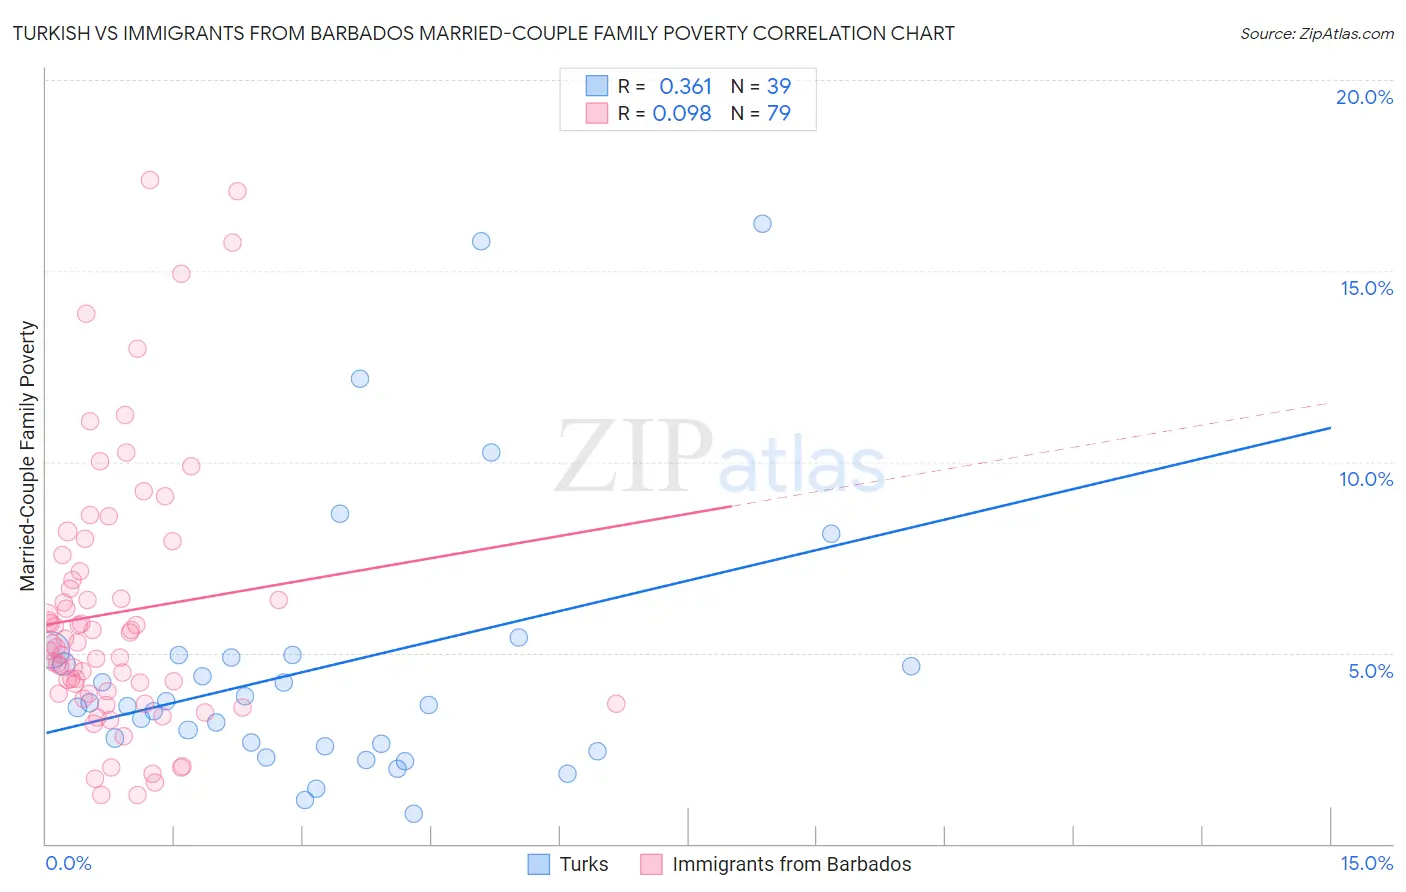
Turkish vs Immigrants from Barbados Married-Couple Family Poverty Correlation Chart
The statistical analysis conducted on geographies consisting of 270,078,353 people shows a mild positive correlation between the proportion of Turks and poverty level among married-couple families in the United States with a correlation coefficient (R) of 0.361 and weighted average of 4.3%. Similarly, the statistical analysis conducted on geographies consisting of 112,495,981 people shows a slight positive correlation between the proportion of Immigrants from Barbados and poverty level among married-couple families in the United States with a correlation coefficient (R) of 0.098 and weighted average of 6.5%, a difference of 51.7%.
Married-Couple Family Poverty Correlation Summary
| Measurement | Turkish | Immigrants from Barbados |
| Minimum | 0.78% | 1.3% |
| Maximum | 16.2% | 17.4% |
| Range | 15.5% | 16.1% |
| Mean | 4.6% | 6.1% |
| Median | 3.6% | 5.2% |
| Interquartile 25% (IQ1) | 2.6% | 3.9% |
| Interquartile 75% (IQ3) | 4.9% | 7.1% |
| Interquartile Range (IQR) | 2.4% | 3.2% |
| Standard Deviation (Sample) | 3.6% | 3.5% |
| Standard Deviation (Population) | 3.5% | 3.5% |
Similar Demographics by Married-Couple Family Poverty
Demographics Similar to Turks by Married-Couple Family Poverty
In terms of married-couple family poverty, the demographic groups most similar to Turks are Australian (4.3%, a difference of 0.080%), Burmese (4.3%, a difference of 0.10%), Immigrants from Lithuania (4.3%, a difference of 0.11%), Russian (4.3%, a difference of 0.13%), and Immigrants from South Central Asia (4.3%, a difference of 0.15%).
| Demographics | Rating | Rank | Married-Couple Family Poverty |
| Scottish | 99.8 /100 | #42 | Exceptional 4.3% |
| Swiss | 99.8 /100 | #43 | Exceptional 4.3% |
| Immigrants | Japan | 99.8 /100 | #44 | Exceptional 4.3% |
| Serbians | 99.8 /100 | #45 | Exceptional 4.3% |
| British | 99.8 /100 | #46 | Exceptional 4.3% |
| Immigrants | South Central Asia | 99.8 /100 | #47 | Exceptional 4.3% |
| Australians | 99.7 /100 | #48 | Exceptional 4.3% |
| Turks | 99.7 /100 | #49 | Exceptional 4.3% |
| Burmese | 99.7 /100 | #50 | Exceptional 4.3% |
| Immigrants | Lithuania | 99.7 /100 | #51 | Exceptional 4.3% |
| Russians | 99.7 /100 | #52 | Exceptional 4.3% |
| Welsh | 99.7 /100 | #53 | Exceptional 4.3% |
| Austrians | 99.7 /100 | #54 | Exceptional 4.3% |
| French | 99.7 /100 | #55 | Exceptional 4.3% |
| Immigrants | Zimbabwe | 99.7 /100 | #56 | Exceptional 4.3% |
Demographics Similar to Immigrants from Barbados by Married-Couple Family Poverty
In terms of married-couple family poverty, the demographic groups most similar to Immigrants from Barbados are Belizean (6.5%, a difference of 0.040%), Immigrants from Lebanon (6.6%, a difference of 0.21%), Nepalese (6.5%, a difference of 0.23%), Arapaho (6.6%, a difference of 0.29%), and Salvadoran (6.5%, a difference of 0.40%).
| Demographics | Rating | Rank | Married-Couple Family Poverty |
| Ute | 0.0 /100 | #283 | Tragic 6.4% |
| Dutch West Indians | 0.0 /100 | #284 | Tragic 6.4% |
| Blacks/African Americans | 0.0 /100 | #285 | Tragic 6.5% |
| Guyanese | 0.0 /100 | #286 | Tragic 6.5% |
| Ecuadorians | 0.0 /100 | #287 | Tragic 6.5% |
| Salvadorans | 0.0 /100 | #288 | Tragic 6.5% |
| Nepalese | 0.0 /100 | #289 | Tragic 6.5% |
| Immigrants | Barbados | 0.0 /100 | #290 | Tragic 6.5% |
| Belizeans | 0.0 /100 | #291 | Tragic 6.5% |
| Immigrants | Lebanon | 0.0 /100 | #292 | Tragic 6.6% |
| Arapaho | 0.0 /100 | #293 | Tragic 6.6% |
| Bahamians | 0.0 /100 | #294 | Tragic 6.6% |
| Immigrants | Uzbekistan | 0.0 /100 | #295 | Tragic 6.6% |
| U.S. Virgin Islanders | 0.0 /100 | #296 | Tragic 6.6% |
| Kiowa | 0.0 /100 | #297 | Tragic 6.6% |