Turkish 1 or more Vehicles in Household
COMPARE
Turkish
Select to Compare
1 or more Vehicles in Household
Turkish 1 or more Vehicles in Household
88.4%
1+ VEHICLES AVAILABLE
2.5/ 100
METRIC RATING
242nd/ 347
METRIC RANK
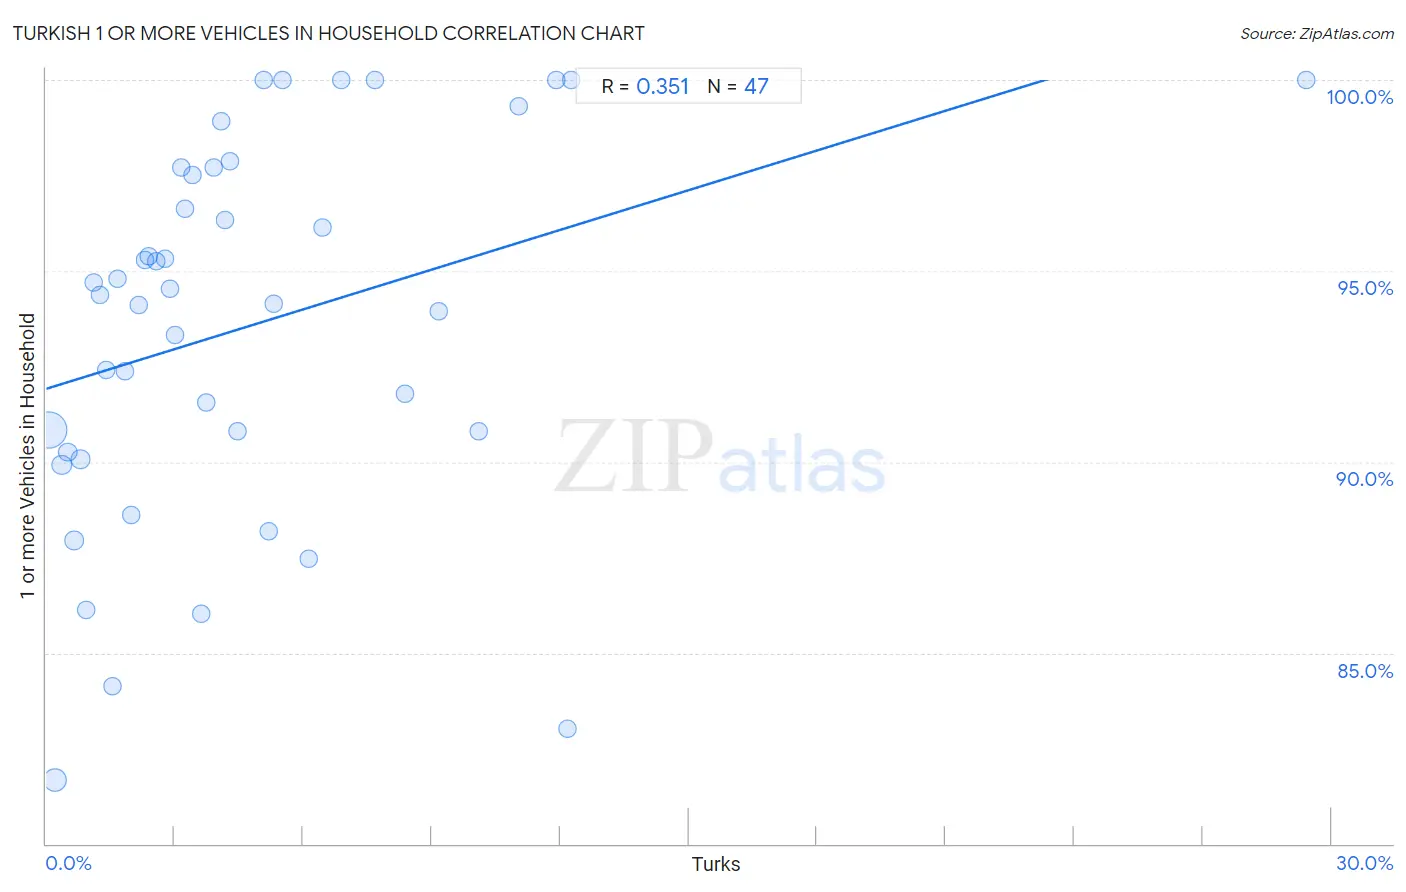
Turkish 1 or more Vehicles in Household Correlation Chart
The statistical analysis conducted on geographies consisting of 271,719,396 people shows a mild positive correlation between the proportion of Turks and percentage of households with 1 or more vehicles available in the United States with a correlation coefficient (R) of 0.351 and weighted average of 88.4%. On average, for every 1% (one percent) increase in Turks within a typical geography, there is an increase of 0.35% in percentage of households with 1 or more vehicles available.
It is essential to understand that the correlation between the percentage of Turks and percentage of households with 1 or more vehicles available does not imply a direct cause-and-effect relationship. It remains uncertain whether the presence of Turks influences an upward or downward trend in the level of percentage of households with 1 or more vehicles available within an area, or if Turks simply ended up residing in those areas with higher or lower levels of percentage of households with 1 or more vehicles available due to other factors.
Demographics Similar to Turks by 1 or more Vehicles in Household
In terms of 1 or more vehicles in household, the demographic groups most similar to Turks are Taiwanese (88.4%, a difference of 0.020%), Immigrants from Belgium (88.4%, a difference of 0.060%), Eastern European (88.5%, a difference of 0.070%), Immigrants from Portugal (88.3%, a difference of 0.080%), and Immigrants from Czechoslovakia (88.3%, a difference of 0.10%).
| Demographics | Rating | Rank | 1 or more Vehicles in Household |
| Paiute | 4.6 /100 | #235 | Tragic 88.6% |
| Immigrants from Pakistan | 4.5 /100 | #236 | Tragic 88.6% |
| Immigrants from Turkey | 4.4 /100 | #237 | Tragic 88.6% |
| Immigrants from Somalia | 4.2 /100 | #238 | Tragic 88.6% |
| Kiowa | 3.8 /100 | #239 | Tragic 88.6% |
| Eastern Europeans | 3.0 /100 | #240 | Tragic 88.5% |
| Taiwanese | 2.6 /100 | #241 | Tragic 88.4% |
| Turks | 2.5 /100 | #242 | Tragic 88.4% |
| Immigrants from Belgium | 2.1 /100 | #243 | Tragic 88.4% |
| Immigrants from Portugal | 2.0 /100 | #244 | Tragic 88.3% |
| Immigrants from Czechoslovakia | 1.9 /100 | #245 | Tragic 88.3% |
| Menominee | 1.9 /100 | #246 | Tragic 88.3% |
| Immigrants from Honduras | 1.7 /100 | #247 | Tragic 88.3% |
| Immigrants from Nigeria | 1.5 /100 | #248 | Tragic 88.2% |
| Blacks/African Americans | 1.4 /100 | #249 | Tragic 88.2% |
Turkish 1 or more Vehicles in Household Correlation Summary
| Measurement | Turkish Data | 1 or more Vehicles in Household Data |
| Minimum | 0.061% | 81.7% |
| Maximum | 29.4% | 100.0% |
| Range | 29.4% | 18.3% |
| Mean | 4.7% | 93.6% |
| Median | 3.4% | 94.4% |
| Interquartile 25% (IQ1) | 1.7% | 90.3% |
| Interquartile 75% (IQ3) | 6.1% | 97.7% |
| Interquartile Range (IQR) | 4.5% | 7.4% |
| Standard Deviation (Sample) | 5.0% | 4.9% |
| Standard Deviation (Population) | 4.9% | 4.9% |
Correlation Details
| Turkish Percentile | Sample Size | 1 or more Vehicles in Household |
[ 0.0% - 0.5% ] 0.061% | 189,224,918 | 90.8% |
[ 0.0% - 0.5% ] 0.20% | 49,216,729 | 81.7% |
[ 0.0% - 0.5% ] 0.36% | 14,810,709 | 89.9% |
[ 0.5% - 1.0% ] 0.51% | 7,034,761 | 90.3% |
[ 0.5% - 1.0% ] 0.65% | 3,917,964 | 87.9% |
[ 0.5% - 1.0% ] 0.80% | 2,297,408 | 90.1% |
[ 0.5% - 1.0% ] 0.94% | 1,523,459 | 86.1% |
[ 1.0% - 1.5% ] 1.11% | 748,389 | 94.7% |
[ 1.0% - 1.5% ] 1.25% | 612,680 | 94.4% |
[ 1.0% - 1.5% ] 1.40% | 450,847 | 92.4% |
[ 1.5% - 2.0% ] 1.54% | 538,342 | 84.1% |
[ 1.5% - 2.0% ] 1.66% | 261,797 | 94.8% |
[ 1.5% - 2.0% ] 1.83% | 294,868 | 92.4% |
[ 1.5% - 2.0% ] 1.98% | 148,588 | 88.6% |
[ 2.0% - 2.5% ] 2.16% | 97,197 | 94.1% |
[ 2.0% - 2.5% ] 2.31% | 67,365 | 95.3% |
[ 2.0% - 2.5% ] 2.40% | 61,942 | 95.4% |
[ 2.5% - 3.0% ] 2.56% | 50,190 | 95.2% |
[ 2.5% - 3.0% ] 2.77% | 33,548 | 95.3% |
[ 2.5% - 3.0% ] 2.88% | 54,287 | 94.5% |
[ 3.0% - 3.5% ] 3.01% | 52,389 | 93.3% |
[ 3.0% - 3.5% ] 3.16% | 3,611 | 97.7% |
[ 3.0% - 3.5% ] 3.25% | 17,340 | 96.6% |
[ 3.0% - 3.5% ] 3.42% | 1,314 | 97.5% |
[ 3.5% - 4.0% ] 3.62% | 33,609 | 86.0% |
[ 3.5% - 4.0% ] 3.73% | 31,781 | 91.6% |
[ 3.5% - 4.0% ] 3.90% | 13,394 | 97.7% |
[ 4.0% - 4.5% ] 4.10% | 11,623 | 98.9% |
[ 4.0% - 4.5% ] 4.18% | 26,829 | 96.3% |
[ 4.0% - 4.5% ] 4.29% | 19,287 | 97.9% |
[ 4.0% - 4.5% ] 4.47% | 10,897 | 90.8% |
[ 5.0% - 5.5% ] 5.08% | 59 | 100.0% |
[ 5.0% - 5.5% ] 5.19% | 1,463 | 88.2% |
[ 5.0% - 5.5% ] 5.30% | 434 | 94.1% |
[ 5.5% - 6.0% ] 5.51% | 381 | 100.0% |
[ 6.0% - 6.5% ] 6.13% | 1,616 | 87.5% |
[ 6.0% - 6.5% ] 6.44% | 21,950 | 96.1% |
[ 6.5% - 7.0% ] 6.90% | 29 | 100.0% |
[ 7.5% - 8.0% ] 7.66% | 4,150 | 100.0% |
[ 8.0% - 8.5% ] 8.36% | 11,458 | 91.8% |
[ 9.0% - 9.5% ] 9.17% | 1,669 | 93.9% |
[ 10.0% - 10.5% ] 10.10% | 5,476 | 90.8% |
[ 11.0% - 11.5% ] 11.04% | 1,857 | 99.3% |
[ 11.5% - 12.0% ] 11.91% | 235 | 100.0% |
[ 12.0% - 12.5% ] 12.16% | 148 | 83.0% |
[ 12.0% - 12.5% ] 12.27% | 375 | 100.0% |
[ 29.0% - 29.5% ] 29.41% | 34 | 100.0% |