Turkish Male Disability
COMPARE
Turkish
Select to Compare
Male Disability
Turkish Male Disability
10.3%
DISABILITY | MALES
99.7/ 100
METRIC RATING
45th/ 347
METRIC RANK
Turkish Male Disability Correlation Chart
The statistical analysis conducted on geographies consisting of 271,851,914 people shows a substantial positive correlation between the proportion of Turks and percentage of males with a disability in the United States with a correlation coefficient (R) of 0.578 and weighted average of 10.3%. On average, for every 1% (one percent) increase in Turks within a typical geography, there is an increase of 1.1% in percentage of males with a disability.
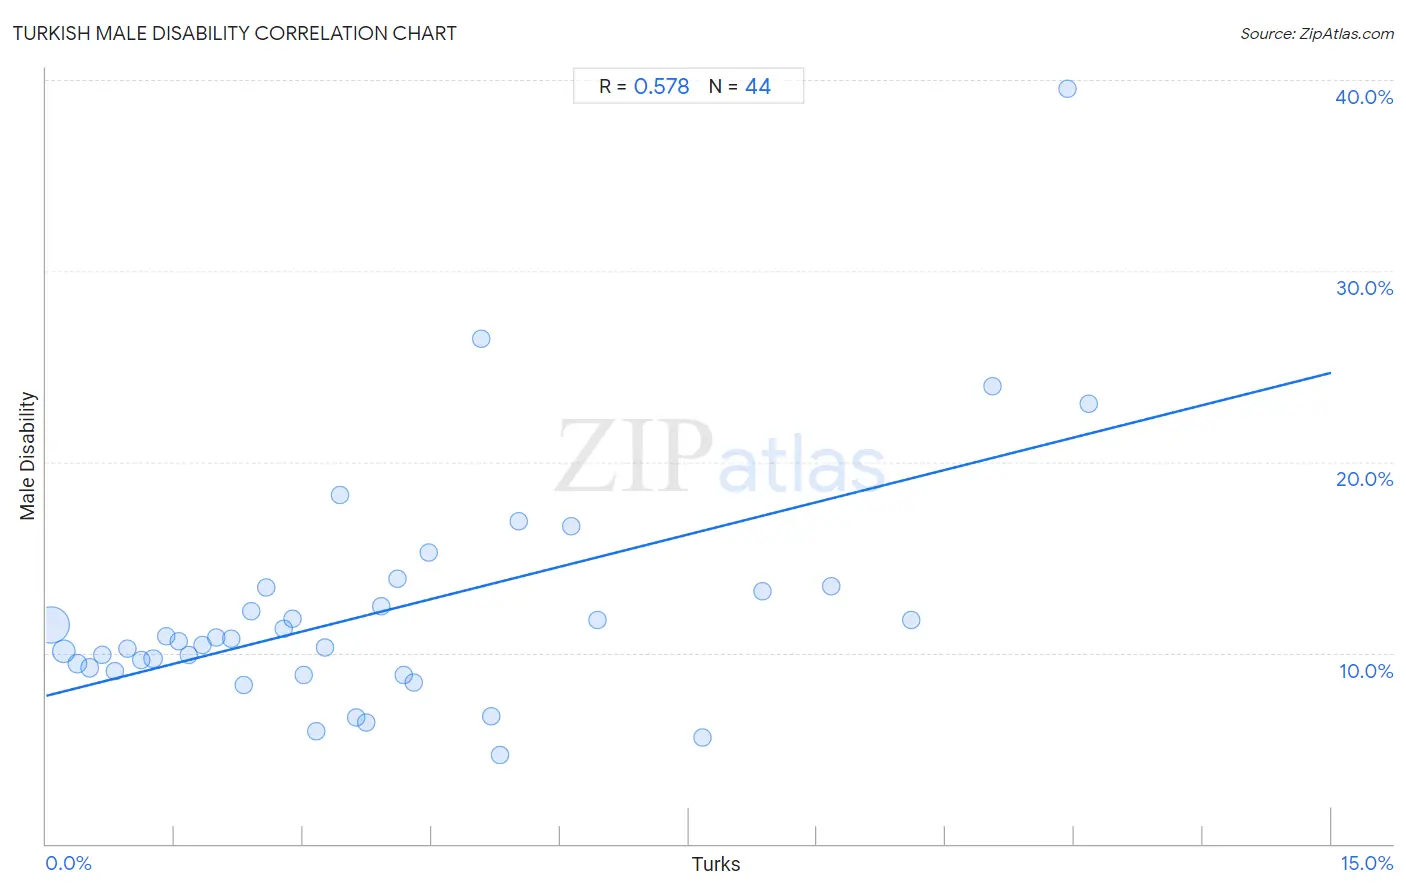
It is essential to understand that the correlation between the percentage of Turks and percentage of males with a disability does not imply a direct cause-and-effect relationship. It remains uncertain whether the presence of Turks influences an upward or downward trend in the level of percentage of males with a disability within an area, or if Turks simply ended up residing in those areas with higher or lower levels of percentage of males with a disability due to other factors.
Demographics Similar to Turks by Male Disability
In terms of male disability, the demographic groups most similar to Turks are Immigrants from El Salvador (10.3%, a difference of 0.0%), Immigrants from Bangladesh (10.3%, a difference of 0.080%), Cambodian (10.3%, a difference of 0.080%), Mongolian (10.3%, a difference of 0.10%), and Immigrants from Peru (10.3%, a difference of 0.12%).
| Demographics | Rating | Rank | Male Disability |
| Immigrants from Kuwait | 99.8 /100 | #38 | Exceptional 10.2% |
| Afghans | 99.8 /100 | #39 | Exceptional 10.2% |
| Immigrants from Nepal | 99.8 /100 | #40 | Exceptional 10.3% |
| Taiwanese | 99.8 /100 | #41 | Exceptional 10.3% |
| Mongolians | 99.7 /100 | #42 | Exceptional 10.3% |
| Immigrants from Bangladesh | 99.7 /100 | #43 | Exceptional 10.3% |
| Immigrants from El Salvador | 99.7 /100 | #44 | Exceptional 10.3% |
| Turks | 99.7 /100 | #45 | Exceptional 10.3% |
| Cambodians | 99.7 /100 | #46 | Exceptional 10.3% |
| Immigrants from Peru | 99.7 /100 | #47 | Exceptional 10.3% |
| Israelis | 99.7 /100 | #48 | Exceptional 10.3% |
| Immigrants from Spain | 99.7 /100 | #49 | Exceptional 10.3% |
| South Americans | 99.6 /100 | #50 | Exceptional 10.3% |
| Salvadorans | 99.6 /100 | #51 | Exceptional 10.4% |
| Immigrants from Saudi Arabia | 99.6 /100 | #52 | Exceptional 10.4% |
Turkish Male Disability Correlation Summary
| Measurement | Turkish Data | Male Disability Data |
| Minimum | 0.061% | 4.6% |
| Maximum | 12.2% | 39.6% |
| Range | 12.1% | 34.9% |
| Mean | 4.0% | 12.2% |
| Median | 3.2% | 10.7% |
| Interquartile 25% (IQ1) | 1.6% | 9.1% |
| Interquartile 75% (IQ3) | 5.2% | 13.3% |
| Interquartile Range (IQR) | 3.6% | 4.2% |
| Standard Deviation (Sample) | 3.2% | 6.2% |
| Standard Deviation (Population) | 3.2% | 6.2% |
Correlation Details
| Turkish Percentile | Sample Size | Male Disability |
[ 0.0% - 0.5% ] 0.061% | 189,249,669 | 11.5% |
[ 0.0% - 0.5% ] 0.20% | 49,239,922 | 10.1% |
[ 0.0% - 0.5% ] 0.36% | 14,871,965 | 9.5% |
[ 0.5% - 1.0% ] 0.51% | 7,043,283 | 9.2% |
[ 0.5% - 1.0% ] 0.65% | 3,926,514 | 9.9% |
[ 0.5% - 1.0% ] 0.80% | 2,298,833 | 9.0% |
[ 0.5% - 1.0% ] 0.94% | 1,523,459 | 10.2% |
[ 1.0% - 1.5% ] 1.11% | 754,314 | 9.6% |
[ 1.0% - 1.5% ] 1.25% | 612,680 | 9.7% |
[ 1.0% - 1.5% ] 1.40% | 451,067 | 10.9% |
[ 1.5% - 2.0% ] 1.54% | 542,506 | 10.6% |
[ 1.5% - 2.0% ] 1.66% | 261,797 | 9.9% |
[ 1.5% - 2.0% ] 1.83% | 293,228 | 10.4% |
[ 1.5% - 2.0% ] 1.98% | 148,588 | 10.8% |
[ 2.0% - 2.5% ] 2.16% | 97,197 | 10.8% |
[ 2.0% - 2.5% ] 2.31% | 67,365 | 8.3% |
[ 2.0% - 2.5% ] 2.39% | 58,665 | 12.2% |
[ 2.5% - 3.0% ] 2.56% | 50,190 | 13.4% |
[ 2.5% - 3.0% ] 2.77% | 33,548 | 11.2% |
[ 2.5% - 3.0% ] 2.88% | 54,287 | 11.8% |
[ 3.0% - 3.5% ] 3.01% | 52,389 | 8.9% |
[ 3.0% - 3.5% ] 3.16% | 3,611 | 5.9% |
[ 3.0% - 3.5% ] 3.25% | 17,340 | 10.3% |
[ 3.0% - 3.5% ] 3.42% | 1,314 | 18.3% |
[ 3.5% - 4.0% ] 3.62% | 33,609 | 6.6% |
[ 3.5% - 4.0% ] 3.73% | 31,648 | 6.3% |
[ 3.5% - 4.0% ] 3.90% | 13,394 | 12.5% |
[ 4.0% - 4.5% ] 4.10% | 11,623 | 13.9% |
[ 4.0% - 4.5% ] 4.18% | 26,829 | 8.8% |
[ 4.0% - 4.5% ] 4.29% | 19,287 | 8.5% |
[ 4.0% - 4.5% ] 4.47% | 10,897 | 15.2% |
[ 5.0% - 5.5% ] 5.08% | 59 | 26.5% |
[ 5.0% - 5.5% ] 5.19% | 1,463 | 6.7% |
[ 5.0% - 5.5% ] 5.30% | 434 | 4.6% |
[ 5.5% - 6.0% ] 5.51% | 381 | 16.9% |
[ 6.0% - 6.5% ] 6.13% | 1,616 | 16.6% |
[ 6.0% - 6.5% ] 6.44% | 21,950 | 11.7% |
[ 7.5% - 8.0% ] 7.66% | 4,150 | 5.6% |
[ 8.0% - 8.5% ] 8.36% | 11,458 | 13.2% |
[ 9.0% - 9.5% ] 9.17% | 1,669 | 13.5% |
[ 10.0% - 10.5% ] 10.10% | 5,476 | 11.7% |
[ 11.0% - 11.5% ] 11.04% | 1,857 | 23.9% |
[ 11.5% - 12.0% ] 11.91% | 235 | 39.6% |
[ 12.0% - 12.5% ] 12.16% | 148 | 23.1% |