Turkish 2 or more Vehicles in Household
COMPARE
Turkish
Select to Compare
2 or more Vehicles in Household
Turkish 2 or more Vehicles in Household
54.3%
2+ VEHICLES AVAILABLE
13.0/ 100
METRIC RATING
207th/ 347
METRIC RANK
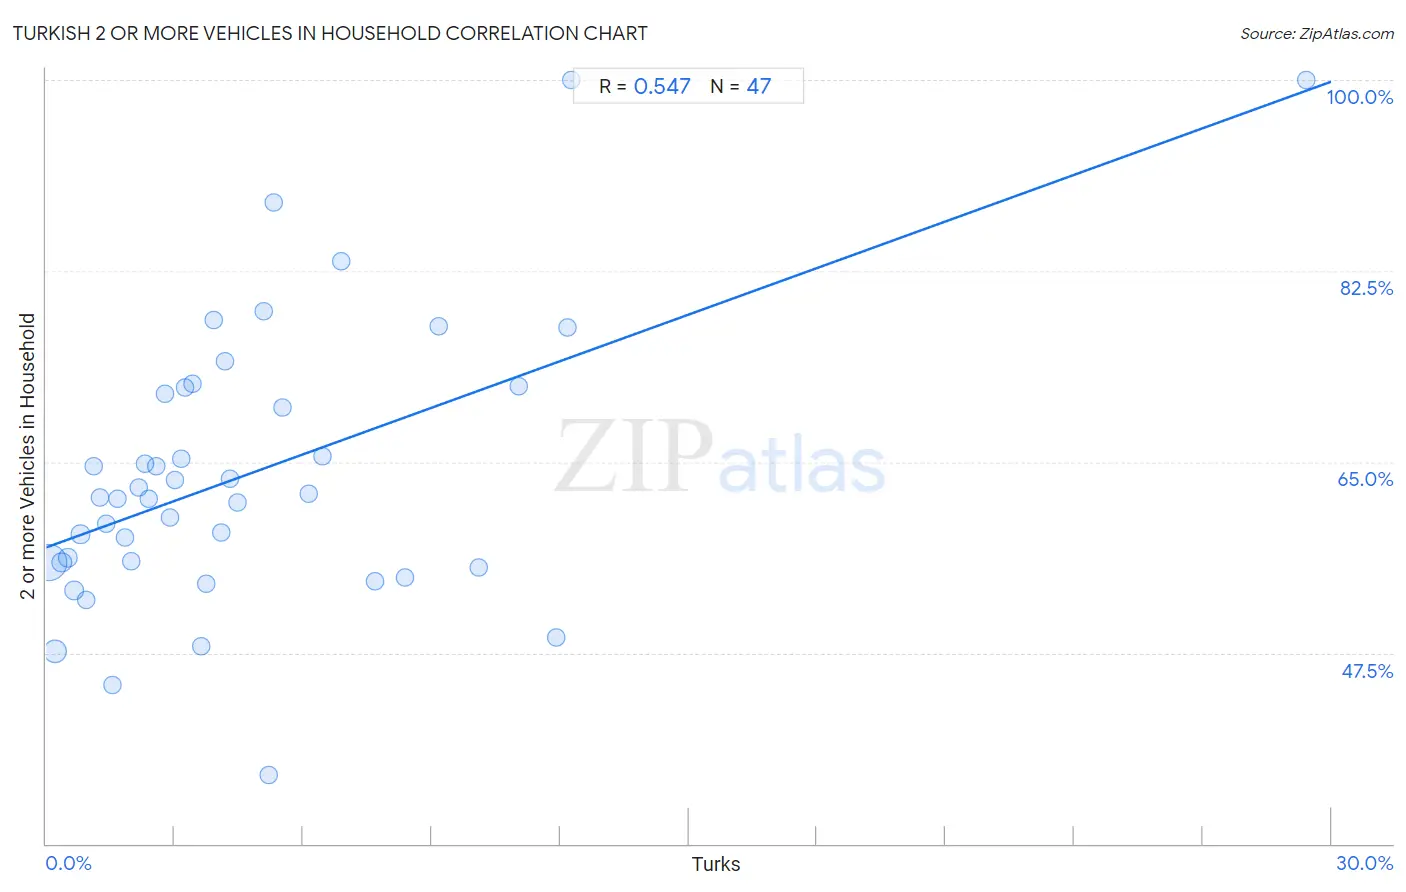
Turkish 2 or more Vehicles in Household Correlation Chart
The statistical analysis conducted on geographies consisting of 271,715,533 people shows a substantial positive correlation between the proportion of Turks and percentage of households with 2 or more vehicles available in the United States with a correlation coefficient (R) of 0.547 and weighted average of 54.3%. On average, for every 1% (one percent) increase in Turks within a typical geography, there is an increase of 1.4% in percentage of households with 2 or more vehicles available.
It is essential to understand that the correlation between the percentage of Turks and percentage of households with 2 or more vehicles available does not imply a direct cause-and-effect relationship. It remains uncertain whether the presence of Turks influences an upward or downward trend in the level of percentage of households with 2 or more vehicles available within an area, or if Turks simply ended up residing in those areas with higher or lower levels of percentage of households with 2 or more vehicles available due to other factors.
Demographics Similar to Turks by 2 or more Vehicles in Household
In terms of 2 or more vehicles in household, the demographic groups most similar to Turks are Immigrants from Latin America (54.3%, a difference of 0.010%), Cheyenne (54.3%, a difference of 0.060%), Immigrants from Belgium (54.3%, a difference of 0.070%), Egyptian (54.3%, a difference of 0.090%), and Immigrants from Bulgaria (54.3%, a difference of 0.090%).
| Demographics | Rating | Rank | 2 or more Vehicles in Household |
| Houma | 15.8 /100 | #200 | Poor 54.4% |
| Immigrants from Italy | 15.5 /100 | #201 | Poor 54.4% |
| Immigrants from North Macedonia | 14.9 /100 | #202 | Poor 54.4% |
| Immigrants from Peru | 14.3 /100 | #203 | Poor 54.4% |
| Immigrants from Belgium | 13.7 /100 | #204 | Poor 54.3% |
| Cheyenne | 13.6 /100 | #205 | Poor 54.3% |
| Immigrants from Latin America | 13.1 /100 | #206 | Poor 54.3% |
| Turks | 13.0 /100 | #207 | Poor 54.3% |
| Egyptians | 12.0 /100 | #208 | Poor 54.3% |
| Immigrants from Bulgaria | 12.0 /100 | #209 | Poor 54.3% |
| Immigrants from Saudi Arabia | 11.3 /100 | #210 | Poor 54.2% |
| Immigrants from Hungary | 11.3 /100 | #211 | Poor 54.2% |
| Immigrants from Chile | 11.1 /100 | #212 | Poor 54.2% |
| Guatemalans | 9.6 /100 | #213 | Tragic 54.1% |
| Immigrants from Czechoslovakia | 9.4 /100 | #214 | Tragic 54.1% |
Turkish 2 or more Vehicles in Household Correlation Summary
| Measurement | Turkish Data | 2 or more Vehicles in Household Data |
| Minimum | 0.061% | 36.3% |
| Maximum | 29.4% | 100.0% |
| Range | 29.4% | 63.7% |
| Mean | 4.7% | 63.9% |
| Median | 3.4% | 61.8% |
| Interquartile 25% (IQ1) | 1.7% | 55.8% |
| Interquartile 75% (IQ3) | 6.1% | 71.8% |
| Interquartile Range (IQR) | 4.5% | 16.0% |
| Standard Deviation (Sample) | 5.0% | 12.9% |
| Standard Deviation (Population) | 4.9% | 12.8% |
Correlation Details
| Turkish Percentile | Sample Size | 2 or more Vehicles in Household |
[ 0.0% - 0.5% ] 0.061% | 189,221,958 | 55.8% |
[ 0.0% - 0.5% ] 0.20% | 49,216,729 | 47.6% |
[ 0.0% - 0.5% ] 0.36% | 14,809,806 | 55.8% |
[ 0.5% - 1.0% ] 0.51% | 7,034,761 | 56.2% |
[ 0.5% - 1.0% ] 0.65% | 3,917,964 | 53.2% |
[ 0.5% - 1.0% ] 0.80% | 2,297,408 | 58.4% |
[ 0.5% - 1.0% ] 0.94% | 1,523,459 | 52.3% |
[ 1.0% - 1.5% ] 1.11% | 748,389 | 64.6% |
[ 1.0% - 1.5% ] 1.25% | 612,680 | 61.8% |
[ 1.0% - 1.5% ] 1.40% | 450,847 | 59.3% |
[ 1.5% - 2.0% ] 1.54% | 538,342 | 44.5% |
[ 1.5% - 2.0% ] 1.66% | 261,797 | 61.6% |
[ 1.5% - 2.0% ] 1.83% | 294,868 | 58.1% |
[ 1.5% - 2.0% ] 1.98% | 148,588 | 55.9% |
[ 2.0% - 2.5% ] 2.16% | 97,197 | 62.6% |
[ 2.0% - 2.5% ] 2.31% | 67,365 | 64.8% |
[ 2.0% - 2.5% ] 2.40% | 61,942 | 61.7% |
[ 2.5% - 3.0% ] 2.56% | 50,190 | 64.6% |
[ 2.5% - 3.0% ] 2.77% | 33,548 | 71.3% |
[ 2.5% - 3.0% ] 2.88% | 54,287 | 59.9% |
[ 3.0% - 3.5% ] 3.01% | 52,389 | 63.3% |
[ 3.0% - 3.5% ] 3.16% | 3,611 | 65.3% |
[ 3.0% - 3.5% ] 3.25% | 17,340 | 71.8% |
[ 3.0% - 3.5% ] 3.42% | 1,314 | 72.2% |
[ 3.5% - 4.0% ] 3.62% | 33,609 | 48.1% |
[ 3.5% - 4.0% ] 3.73% | 31,781 | 53.8% |
[ 3.5% - 4.0% ] 3.90% | 13,394 | 78.0% |
[ 4.0% - 4.5% ] 4.10% | 11,623 | 58.5% |
[ 4.0% - 4.5% ] 4.18% | 26,829 | 74.2% |
[ 4.0% - 4.5% ] 4.29% | 19,287 | 63.4% |
[ 4.0% - 4.5% ] 4.47% | 10,897 | 61.2% |
[ 5.0% - 5.5% ] 5.08% | 59 | 78.8% |
[ 5.0% - 5.5% ] 5.19% | 1,463 | 36.3% |
[ 5.0% - 5.5% ] 5.30% | 434 | 88.8% |
[ 5.5% - 6.0% ] 5.51% | 381 | 70.0% |
[ 6.0% - 6.5% ] 6.13% | 1,616 | 62.1% |
[ 6.0% - 6.5% ] 6.44% | 21,950 | 65.5% |
[ 6.5% - 7.0% ] 6.90% | 29 | 83.3% |
[ 7.5% - 8.0% ] 7.66% | 4,150 | 54.0% |
[ 8.0% - 8.5% ] 8.36% | 11,458 | 54.5% |
[ 9.0% - 9.5% ] 9.17% | 1,669 | 77.4% |
[ 10.0% - 10.5% ] 10.10% | 5,476 | 55.3% |
[ 11.0% - 11.5% ] 11.04% | 1,857 | 71.9% |
[ 11.5% - 12.0% ] 11.91% | 235 | 48.9% |
[ 12.0% - 12.5% ] 12.16% | 148 | 77.4% |
[ 12.0% - 12.5% ] 12.27% | 375 | 100.0% |
[ 29.0% - 29.5% ] 29.41% | 34 | 100.0% |