Turkish Wage/Income Gap
COMPARE
Turkish
Select to Compare
Wage/Income Gap
Turkish Wage/Income Gap
27.7%
WAGE/INCOME GAP
1.0/ 100
METRIC RATING
267th/ 347
METRIC RANK
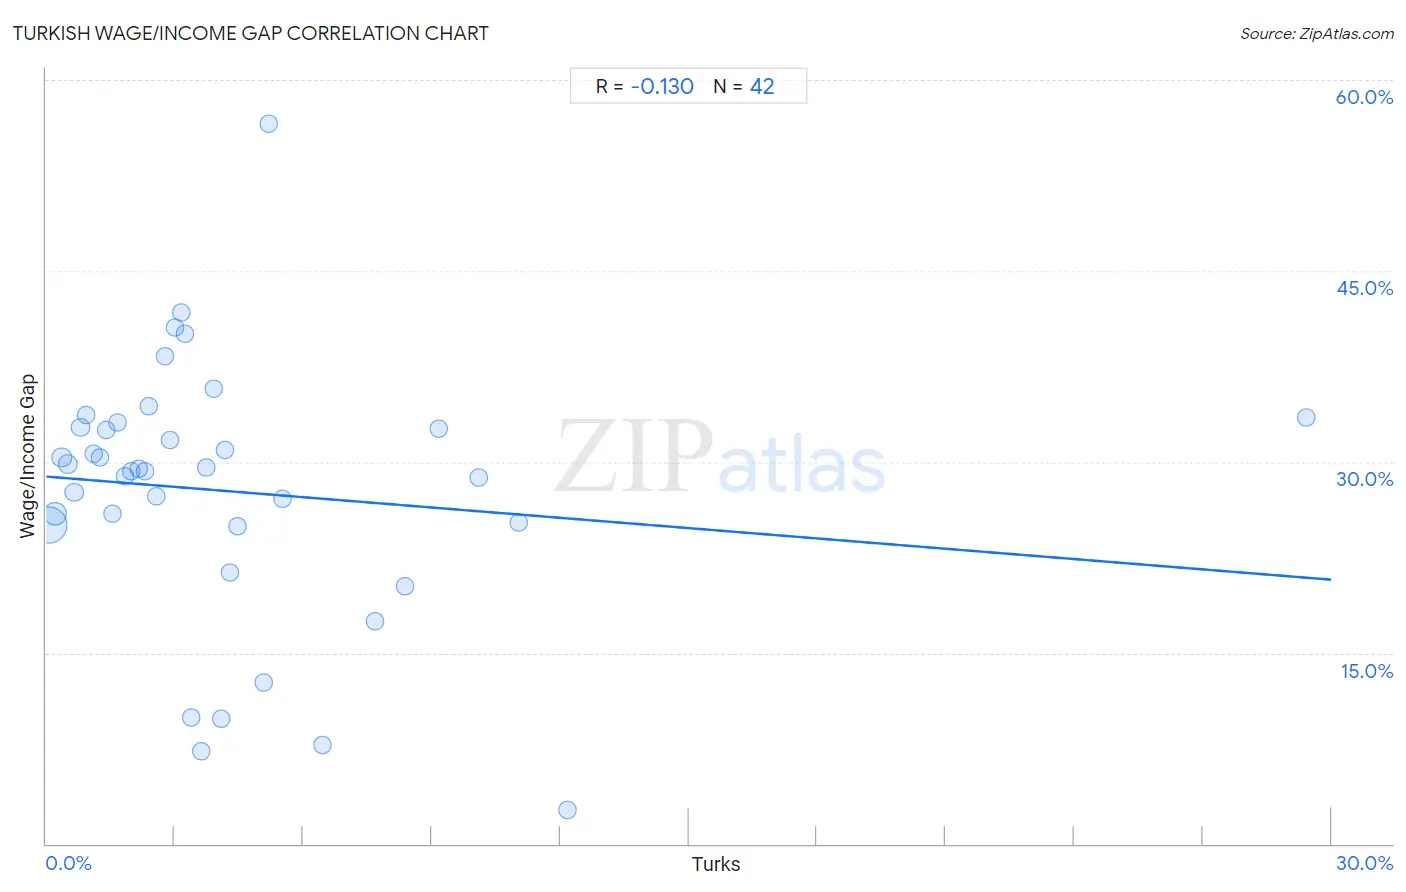
Turkish Wage/Income Gap Correlation Chart
The statistical analysis conducted on geographies consisting of 271,781,198 people shows a poor negative correlation between the proportion of Turks and wage/income gap percentage in the United States with a correlation coefficient (R) of -0.130 and weighted average of 27.7%. On average, for every 1% (one percent) increase in Turks within a typical geography, there is a decrease of 0.27% in wage/income gap percentage.
It is essential to understand that the correlation between the percentage of Turks and wage/income gap percentage does not imply a direct cause-and-effect relationship. It remains uncertain whether the presence of Turks influences an upward or downward trend in the level of wage/income gap percentage within an area, or if Turks simply ended up residing in those areas with higher or lower levels of wage/income gap percentage due to other factors.
Demographics Similar to Turks by Wage/Income Gap
In terms of wage/income gap, the demographic groups most similar to Turks are Immigrants from Switzerland (27.7%, a difference of 0.020%), Serbian (27.7%, a difference of 0.020%), Hmong (27.7%, a difference of 0.020%), New Zealander (27.7%, a difference of 0.080%), and Potawatomi (27.7%, a difference of 0.090%).
| Demographics | Rating | Rank | Wage/Income Gap |
| Tongans | 1.7 /100 | #260 | Tragic 27.5% |
| Immigrants from Germany | 1.5 /100 | #261 | Tragic 27.5% |
| Immigrants from Lebanon | 1.5 /100 | #262 | Tragic 27.5% |
| Syrians | 1.4 /100 | #263 | Tragic 27.6% |
| Immigrants from Switzerland | 1.0 /100 | #264 | Tragic 27.7% |
| Serbians | 1.0 /100 | #265 | Tragic 27.7% |
| Hmong | 1.0 /100 | #266 | Tragic 27.7% |
| Turks | 1.0 /100 | #267 | Tragic 27.7% |
| New Zealanders | 1.0 /100 | #268 | Tragic 27.7% |
| Potawatomi | 0.9 /100 | #269 | Tragic 27.7% |
| Immigrants from Western Europe | 0.9 /100 | #270 | Tragic 27.8% |
| Ute | 0.8 /100 | #271 | Tragic 27.8% |
| Immigrants from Korea | 0.8 /100 | #272 | Tragic 27.8% |
| Bulgarians | 0.7 /100 | #273 | Tragic 27.8% |
| Americans | 0.7 /100 | #274 | Tragic 27.8% |
Turkish Wage/Income Gap Correlation Summary
| Measurement | Turkish Data | Wage/Income Gap Data |
| Minimum | 0.061% | 2.6% |
| Maximum | 29.4% | 56.6% |
| Range | 29.4% | 54.0% |
| Mean | 4.3% | 27.7% |
| Median | 3.1% | 29.3% |
| Interquartile 25% (IQ1) | 1.5% | 25.1% |
| Interquartile 75% (IQ3) | 5.1% | 32.7% |
| Interquartile Range (IQR) | 3.5% | 7.6% |
| Standard Deviation (Sample) | 5.0% | 10.3% |
| Standard Deviation (Population) | 4.9% | 10.2% |
Correlation Details
| Turkish Percentile | Sample Size | Wage/Income Gap |
[ 0.0% - 0.5% ] 0.061% | 189,247,280 | 25.1% |
[ 0.0% - 0.5% ] 0.20% | 49,230,623 | 25.9% |
[ 0.0% - 0.5% ] 0.36% | 14,865,896 | 30.3% |
[ 0.5% - 1.0% ] 0.51% | 7,037,104 | 29.8% |
[ 0.5% - 1.0% ] 0.65% | 3,921,542 | 27.6% |
[ 0.5% - 1.0% ] 0.80% | 2,290,402 | 32.7% |
[ 0.5% - 1.0% ] 0.94% | 1,521,169 | 33.7% |
[ 1.0% - 1.5% ] 1.11% | 753,057 | 30.6% |
[ 1.0% - 1.5% ] 1.25% | 610,886 | 30.3% |
[ 1.0% - 1.5% ] 1.40% | 450,610 | 32.5% |
[ 1.5% - 2.0% ] 1.54% | 534,566 | 25.9% |
[ 1.5% - 2.0% ] 1.66% | 261,797 | 33.1% |
[ 1.5% - 2.0% ] 1.83% | 290,391 | 28.9% |
[ 1.5% - 2.0% ] 1.98% | 138,953 | 29.3% |
[ 2.0% - 2.5% ] 2.16% | 93,824 | 29.4% |
[ 2.0% - 2.5% ] 2.31% | 66,556 | 29.2% |
[ 2.0% - 2.5% ] 2.40% | 61,415 | 34.4% |
[ 2.5% - 3.0% ] 2.56% | 50,190 | 27.3% |
[ 2.5% - 3.0% ] 2.77% | 33,360 | 38.3% |
[ 2.5% - 3.0% ] 2.88% | 54,287 | 31.8% |
[ 3.0% - 3.5% ] 3.01% | 52,223 | 40.6% |
[ 3.0% - 3.5% ] 3.16% | 3,611 | 41.7% |
[ 3.0% - 3.5% ] 3.25% | 17,340 | 40.1% |
[ 3.0% - 3.5% ] 3.40% | 618 | 9.9% |
[ 3.5% - 4.0% ] 3.62% | 33,499 | 7.3% |
[ 3.5% - 4.0% ] 3.73% | 29,775 | 29.6% |
[ 3.5% - 4.0% ] 3.90% | 13,394 | 35.8% |
[ 4.0% - 4.5% ] 4.10% | 11,172 | 9.8% |
[ 4.0% - 4.5% ] 4.18% | 26,829 | 30.9% |
[ 4.0% - 4.5% ] 4.29% | 19,287 | 21.3% |
[ 4.0% - 4.5% ] 4.47% | 10,897 | 24.9% |
[ 5.0% - 5.5% ] 5.08% | 59 | 12.7% |
[ 5.0% - 5.5% ] 5.19% | 1,463 | 56.6% |
[ 5.5% - 6.0% ] 5.51% | 381 | 27.1% |
[ 6.0% - 6.5% ] 6.44% | 21,950 | 7.8% |
[ 7.5% - 8.0% ] 7.66% | 4,150 | 17.5% |
[ 8.0% - 8.5% ] 8.36% | 11,458 | 20.3% |
[ 9.0% - 9.5% ] 9.17% | 1,669 | 32.6% |
[ 10.0% - 10.5% ] 10.10% | 5,476 | 28.8% |
[ 11.0% - 11.5% ] 11.04% | 1,857 | 25.3% |
[ 12.0% - 12.5% ] 12.16% | 148 | 2.6% |
[ 29.0% - 29.5% ] 29.41% | 34 | 33.5% |