Turkish 3 or more Vehicles in Household

COMPARE

Turkish
Race
Ancestry
AfghanAfricanAlaska NativeAlaskan AthabascanAlbanianAleutAlsatianAmericanApacheArabArapahoArgentineanArmenianAssyrian/Chaldean/SyriacAustralianAustrianBahamianBangladeshiBarbadianBasqueBelgianBelizeanBermudanBhutaneseBlackfeetBolivianBrazilianBritishBritish West IndianBulgarianBurmeseCajunCambodianCanadianCape VerdeanCarpatho RusynCelticCentral AmericanCentral American IndianCherokeeCheyenneChickasawChileanChineseChippewaChoctawColombianColvilleComancheCosta RicanCreeCreekCroatianCrowCubanCypriotCzechCzechoslovakianDanishDelawareDominicanDutchDutch West IndianEastern EuropeanEcuadorianEgyptianEnglishEstonianEthiopianEuropeanFijianFilipinoFinnishFrenchFrench American IndianFrench CanadianGermanGerman RussianGhanaianGreekGuamanian/ChamorroGuatemalanGuyaneseHaitianHmongHonduranHopiHoumaHungarianIcelanderIndian (Asian)IndonesianInupiatIranianIraqiIrishIroquoisIsraeliItalianJamaicanJapaneseJordanianKenyanKiowaKoreanLaotianLatvianLebaneseLiberianLithuanianLumbeeLuxembourgerMacedonianMalaysianMalteseMarshalleseMenomineeMexicanMexican American IndianMongolianMoroccanNative HawaiianNavajoNepaleseNew ZealanderNicaraguanNigerianNorthern EuropeanNorwegianOkinawanOsageOttawaPaiutePakistaniPalestinianPanamanianParaguayanPennsylvania GermanPeruvianPimaPolishPortuguesePotawatomiPuebloPuerto RicanPuget Sound SalishRomanianRussianSalvadoranSamoanScandinavianScotch-IrishScottishSeminoleSenegaleseSerbianShoshoneSierra LeoneanSiouxSlavicSlovakSloveneSomaliSouth AfricanSouth AmericanSouth American IndianSoviet UnionSpaniardSpanishSpanish AmericanSpanish American IndianSri LankanSubsaharan AfricanSudaneseSwedishSwissSyrianTaiwaneseThaiTlingit-HaidaTohono O'OdhamTonganTrinidadian and TobagonianTsimshianTurkishU.S. Virgin IslanderUgandanUkrainianUruguayanUteVenezuelanVietnameseWelshWest IndianYakamaYaquiYugoslavianYumanYup'ikZimbabwean
Immigration
NonimmigrantsImmigrantsAfghanistanAfricaAlbaniaArgentinaArmeniaAsiaAustraliaAustriaBahamasBangladeshBarbadosBelarusBelgiumBelizeBoliviaBosnia and HerzegovinaBrazilBulgariaBurma/MyanmarCabo VerdeCambodiaCameroonCanadaCaribbeanCentral AmericaChileChinaColombiaCongoCosta RicaCroatiaCubaCzechoslovakiaDenmarkDominicaDominican RepublicEastern AfricaEastern AsiaEastern EuropeEcuadorEgyptEl SalvadorEnglandEritreaEthiopiaEuropeFijiFranceGermanyGhanaGreeceGrenadaGuatemalaGuyanaHaitiHondurasHong KongHungaryIndiaIndonesiaIranIraqIrelandIsraelItalyJamaicaJapanJordanKazakhstanKenyaKoreaKuwaitLaosLatin AmericaLatviaLebanonLiberiaLithuaniaMalaysiaMexicoMicronesiaMiddle AfricaMoldovaMoroccoNepalNetherlandsNicaraguaNigeriaNorth AmericaNorth MacedoniaNorthern AfricaNorthern EuropeNorwayOceaniaPakistanPanamaPeruPhilippinesPolandPortugalRomaniaRussiaSaudi ArabiaScotlandSenegalSerbiaSierra LeoneSingaporeSomaliaSouth AfricaSouth AmericaSouth Central AsiaSouth Eastern AsiaSouthern EuropeSpainSri LankaSt. Vincent and the GrenadinesSudanSwedenSwitzerlandSyriaTaiwanThailandTrinidad and TobagoTurkeyUgandaUkraineUruguayUzbekistanVenezuelaVietnamWest IndiesWestern AfricaWestern AsiaWestern EuropeYemenZaireZimbabweAzores
Select to Compare
Race
Ancestry
AfghanAfricanAlaska NativeAlaskan AthabascanAlbanianAleutAlsatianAmericanApacheArabArapahoArgentineanArmenianAssyrian/Chaldean/SyriacAustralianAustrianBahamianBangladeshiBarbadianBasqueBelgianBelizeanBermudanBhutaneseBlackfeetBolivianBrazilianBritishBritish West IndianBulgarianBurmeseCajunCambodianCanadianCape VerdeanCarpatho RusynCelticCentral AmericanCentral American IndianCherokeeCheyenneChickasawChileanChineseChippewaChoctawColombianColvilleComancheCosta RicanCreeCreekCroatianCrowCubanCypriotCzechCzechoslovakianDanishDelawareDominicanDutchDutch West IndianEastern EuropeanEcuadorianEgyptianEnglishEstonianEthiopianEuropeanFijianFilipinoFinnishFrenchFrench American IndianFrench CanadianGermanGerman RussianGhanaianGreekGuamanian/ChamorroGuatemalanGuyaneseHaitianHmongHonduranHopiHoumaHungarianIcelanderIndian (Asian)IndonesianInupiatIranianIraqiIrishIroquoisIsraeliItalianJamaicanJapaneseJordanianKenyanKiowaKoreanLaotianLatvianLebaneseLiberianLithuanianLumbeeLuxembourgerMacedonianMalaysianMalteseMarshalleseMenomineeMexicanMexican American IndianMongolianMoroccanNative HawaiianNavajoNepaleseNew ZealanderNicaraguanNigerianNorthern EuropeanNorwegianOkinawanOsageOttawaPaiutePakistaniPalestinianPanamanianParaguayanPennsylvania GermanPeruvianPimaPolishPortuguesePotawatomiPuebloPuerto RicanPuget Sound SalishRomanianRussianSalvadoranSamoanScandinavianScotch-IrishScottishSeminoleSenegaleseSerbianShoshoneSierra LeoneanSiouxSlavicSlovakSloveneSomaliSouth AfricanSouth AmericanSouth American IndianSoviet UnionSpaniardSpanishSpanish AmericanSpanish American IndianSri LankanSubsaharan AfricanSudaneseSwedishSwissSyrianTaiwaneseThaiTlingit-HaidaTohono O'OdhamTonganTrinidadian and TobagonianTsimshianU.S. Virgin IslanderUgandanUkrainianUruguayanUteVenezuelanVietnameseWelshWest IndianYakamaYaquiYugoslavianYumanYup'ikZimbabwean
Immigration
NonimmigrantsImmigrantsAfghanistanAfricaAlbaniaArgentinaArmeniaAsiaAustraliaAustriaBahamasBangladeshBarbadosBelarusBelgiumBelizeBoliviaBosnia and HerzegovinaBrazilBulgariaBurma/MyanmarCabo VerdeCambodiaCameroonCanadaCaribbeanCentral AmericaChileChinaColombiaCongoCosta RicaCroatiaCubaCzechoslovakiaDenmarkDominicaDominican RepublicEastern AfricaEastern AsiaEastern EuropeEcuadorEgyptEl SalvadorEnglandEritreaEthiopiaEuropeFijiFranceGermanyGhanaGreeceGrenadaGuatemalaGuyanaHaitiHondurasHong KongHungaryIndiaIndonesiaIranIraqIrelandIsraelItalyJamaicaJapanJordanKazakhstanKenyaKoreaKuwaitLaosLatin AmericaLatviaLebanonLiberiaLithuaniaMalaysiaMexicoMicronesiaMiddle AfricaMoldovaMoroccoNepalNetherlandsNicaraguaNigeriaNorth AmericaNorth MacedoniaNorthern AfricaNorthern EuropeNorwayOceaniaPakistanPanamaPeruPhilippinesPolandPortugalRomaniaRussiaSaudi ArabiaScotlandSenegalSerbiaSierra LeoneSingaporeSomaliaSouth AfricaSouth AmericaSouth Central AsiaSouth Eastern AsiaSouthern EuropeSpainSri LankaSt. Vincent and the GrenadinesSudanSwedenSwitzerlandSyriaTaiwanThailandTrinidad and TobagoTurkeyUgandaUkraineUruguayUzbekistanVenezuelaVietnamWest IndiesWestern AfricaWestern AsiaWestern EuropeYemenZaireZimbabweAzores
3 or more Vehicles in Household
Income
Poverty
Unemployment
Labor Participation
Family Structure
Vehicle Availability
Education Level
Disability

Turkish 3 or more Vehicles in Household
Tragic

18.4%
3+ VEHICLES AVAILABLE
5.4/ 100
METRIC RATING
228th/ 347
METRIC RANK

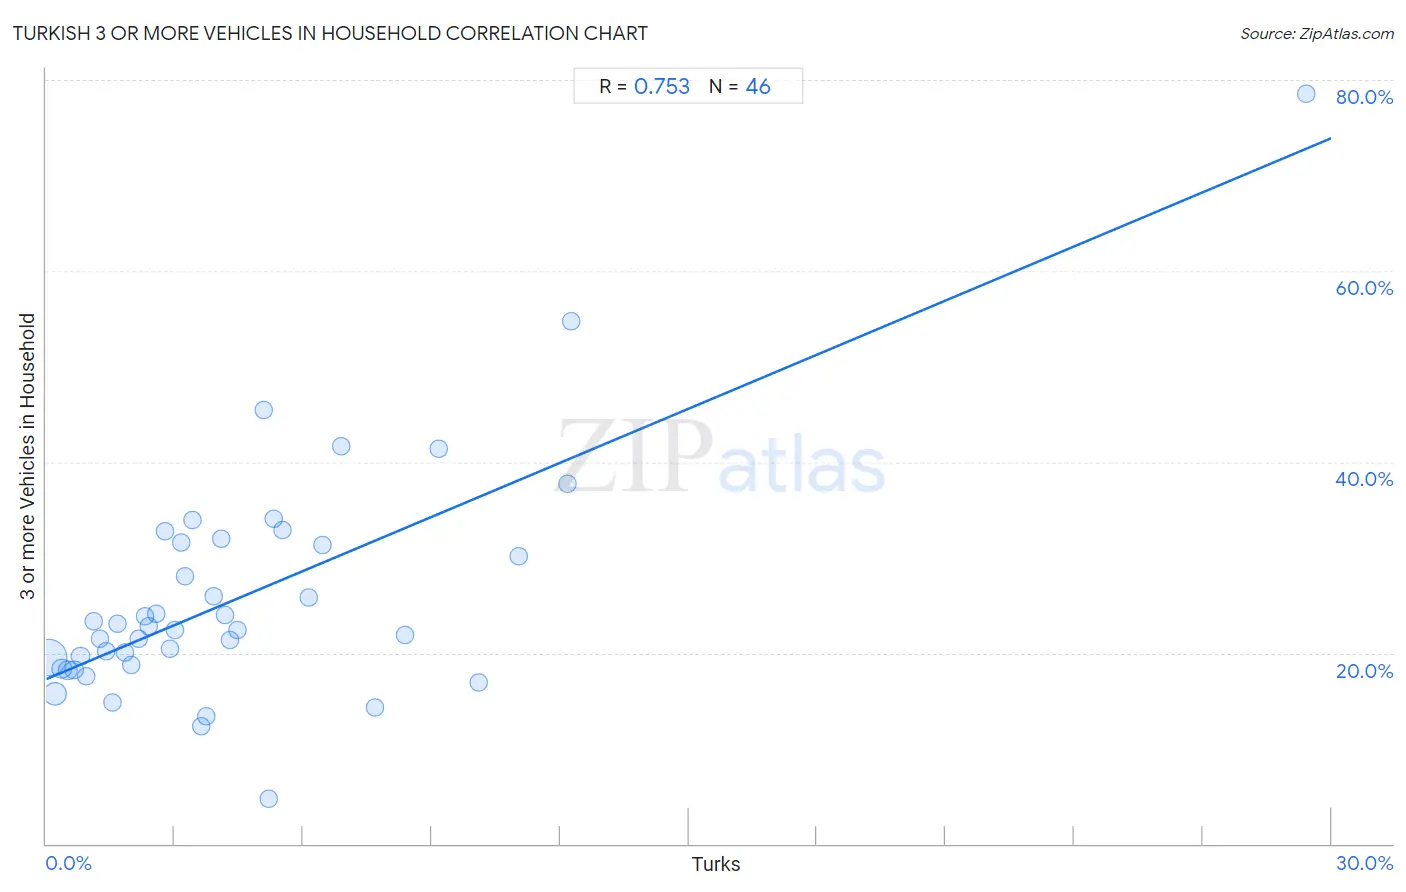
Turkish 3 or more Vehicles in Household Correlation Chart

The statistical analysis conducted on geographies consisting of 271,619,794 people shows a strong positive correlation between the proportion of Turks and percentage of households with 3 or more vehicles available in the United States with a correlation coefficient (R) of 0.753 and weighted average of 18.4%. On average, for every 1% (one percent) increase in Turks within a typical geography, there is an increase of 1.9% in percentage of households with 3 or more vehicles available.
Turkish 3 or more Vehicles in Household
It is essential to understand that the correlation between the percentage of Turks and percentage of households with 3 or more vehicles available does not imply a direct cause-and-effect relationship. It remains uncertain whether the presence of Turks influences an upward or downward trend in the level of percentage of households with 3 or more vehicles available within an area, or if Turks simply ended up residing in those areas with higher or lower levels of percentage of households with 3 or more vehicles available due to other factors.

Demographics Similar to Turks by 3 or more Vehicles in Household

In terms of 3 or more vehicles in household, the demographic groups most similar to Turks are Immigrants from Singapore (18.4%, a difference of 0.020%), Immigrants from Hungary (18.5%, a difference of 0.050%), Immigrants from Lithuania (18.5%, a difference of 0.080%), Immigrants from Argentina (18.5%, a difference of 0.090%), and Immigrants from Switzerland (18.4%, a difference of 0.17%).
DemographicsRating | Rank3 or more Vehicles in Household
Immigrants from Poland
7.5
/100
|
#221
Tragic
18.6%
Belizeans
7.3
/100
|
#222
Tragic
18.6%
Immigrants from Czechoslovakia
5.9
/100
|
#223
Tragic
18.5%
Immigrants from Argentina
5.6
/100
|
#224
Tragic
18.5%
Immigrants from Lithuania
5.6
/100
|
#225
Tragic
18.5%
Immigrants from Hungary
5.5
/100
|
#226
Tragic
18.5%
Immigrants from Singapore
5.4
/100
|
#227
Tragic
18.4%
Turks
5.4
/100
|
#228
Tragic
18.4%
Immigrants from Switzerland
5.0
/100
|
#229
Tragic
18.4%
Immigrants from Western Asia
4.8
/100
|
#230
Tragic
18.4%
Immigrants from Belgium
4.8
/100
|
#231
Tragic
18.4%
Immigrants from Uganda
4.6
/100
|
#232
Tragic
18.4%
Hondurans
4.6
/100
|
#233
Tragic
18.4%
Immigrants from North Macedonia
4.4
/100
|
#234
Tragic
18.4%
Sierra Leoneans
3.9
/100
|
#235
Tragic
18.3%

Turkish 3 or more Vehicles in Household Correlation Summary

MeasurementTurkish Data3 or more Vehicles in Household Data
Minimum0.061%4.7%
Maximum29.4%78.6%
Range29.4%73.9%
Mean4.6%25.9%
Median3.3%22.6%
Interquartile 25% (IQ1)1.7%18.7%
Interquartile 75% (IQ3)5.5%31.6%
Interquartile Range (IQR)3.9%12.8%
Standard Deviation (Sample)4.9%12.3%
Standard Deviation (Population)4.8%12.2%

Correlation Details

Turkish PercentileSample Size3 or more Vehicles in Household
[
0.0%
-
0.5%
]
0.061%
189,172,49819.5%
[
0.0%
-
0.5%
]
0.20%
49,195,77015.7%
[
0.0%
-
0.5%
]
0.36%
14,809,80618.4%
[
0.5%
-
1.0%
]
0.51%
7,027,41318.2%
[
0.5%
-
1.0%
]
0.65%
3,914,75718.2%
[
0.5%
-
1.0%
]
0.80%
2,297,40819.6%
[
0.5%
-
1.0%
]
0.94%
1,514,61617.6%
[
1.0%
-
1.5%
]
1.11%
747,13223.3%
[
1.0%
-
1.5%
]
1.25%
612,68021.4%
[
1.0%
-
1.5%
]
1.40%
450,84720.2%
[
1.5%
-
2.0%
]
1.54%
534,82914.8%
[
1.5%
-
2.0%
]
1.66%
260,88023.1%
[
1.5%
-
2.0%
]
1.83%
294,86820.0%
[
1.5%
-
2.0%
]
1.98%
148,58818.7%
[
2.0%
-
2.5%
]
2.16%
97,19721.5%
[
2.0%
-
2.5%
]
2.31%
67,36523.8%
[
2.0%
-
2.5%
]
2.40%
61,94222.8%
[
2.5%
-
3.0%
]
2.56%
50,19024.1%
[
2.5%
-
3.0%
]
2.77%
33,54832.7%
[
2.5%
-
3.0%
]
2.88%
54,28720.4%
[
3.0%
-
3.5%
]
3.01%
52,38922.3%
[
3.0%
-
3.5%
]
3.16%
3,61131.6%
[
3.0%
-
3.5%
]
3.25%
17,34028.1%
[
3.0%
-
3.5%
]
3.42%
1,31433.8%
[
3.5%
-
4.0%
]
3.62%
33,60912.3%
[
3.5%
-
4.0%
]
3.73%
31,78113.3%
[
3.5%
-
4.0%
]
3.90%
13,39425.9%
[
4.0%
-
4.5%
]
4.10%
11,62332.0%
[
4.0%
-
4.5%
]
4.18%
26,82924.0%
[
4.0%
-
4.5%
]
4.29%
19,28721.3%
[
4.0%
-
4.5%
]
4.47%
10,89722.3%
[
5.0%
-
5.5%
]
5.08%
5945.5%
[
5.0%
-
5.5%
]
5.19%
1,4634.7%
[
5.0%
-
5.5%
]
5.30%
43434.0%
[
5.5%
-
6.0%
]
5.51%
38132.9%
[
6.0%
-
6.5%
]
6.13%
1,61625.8%
[
6.0%
-
6.5%
]
6.44%
21,95031.3%
[
6.5%
-
7.0%
]
6.90%
2941.7%
[
7.5%
-
8.0%
]
7.66%
4,15014.3%
[
8.0%
-
8.5%
]
8.36%
11,45821.9%
[
9.0%
-
9.5%
]
9.17%
1,66941.4%
[
10.0%
-
10.5%
]
10.10%
5,47616.9%
[
11.0%
-
11.5%
]
11.04%
1,85730.1%
[
12.0%
-
12.5%
]
12.16%
14837.7%
[
12.0%
-
12.5%
]
12.27%
37554.7%
[
29.0%
-
29.5%
]
29.41%
3478.6%