Zip Codes with the Highest Percentage of Population Employed in Security & Protection in Roswell, NM
RELATED REPORTS & OPTIONS
Security & Protection
Roswell
Compare Zip Codes
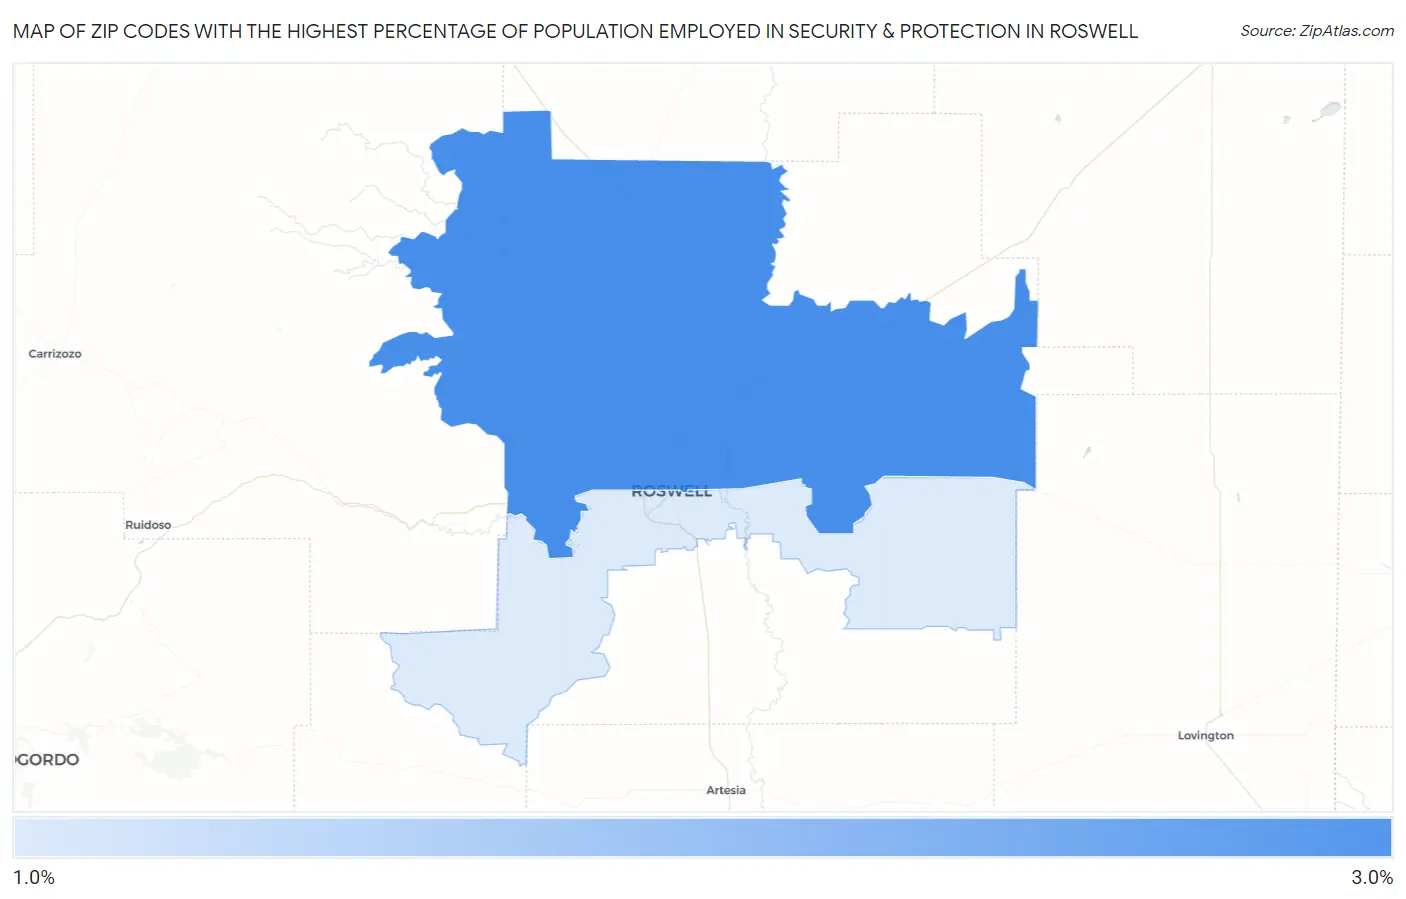
Map of Zip Codes with the Highest Percentage of Population Employed in Security & Protection in Roswell
1.8%
3.0%
Zip Codes with the Highest Percentage of Population Employed in Security & Protection in Roswell, NM
| Zip Code | % Employed | vs State | vs National | |
| 1. | 88201 | 3.0% | 2.8%(+0.219)#100 | 2.1%(+0.832)#7,300 |
| 2. | 88203 | 1.8% | 2.8%(-0.976)#145 | 2.1%(-0.363)#14,064 |
1
Common Questions
What are the Top Zip Codes with the Highest Percentage of Population Employed in Security & Protection in Roswell, NM?
Top Zip Codes with the Highest Percentage of Population Employed in Security & Protection in Roswell, NM are:
What zip code has the Highest Percentage of Population Employed in Security & Protection in Roswell, NM?
88201 has the Highest Percentage of Population Employed in Security & Protection in Roswell, NM with 3.0%.
What is the Percentage of Population Employed in Security & Protection in Roswell, NM?
Percentage of Population Employed in Security & Protection in Roswell is 2.0%.
What is the Percentage of Population Employed in Security & Protection in New Mexico?
Percentage of Population Employed in Security & Protection in New Mexico is 2.8%.
What is the Percentage of Population Employed in Security & Protection in the United States?
Percentage of Population Employed in Security & Protection in the United States is 2.1%.