Berino, NM Map & Demographics
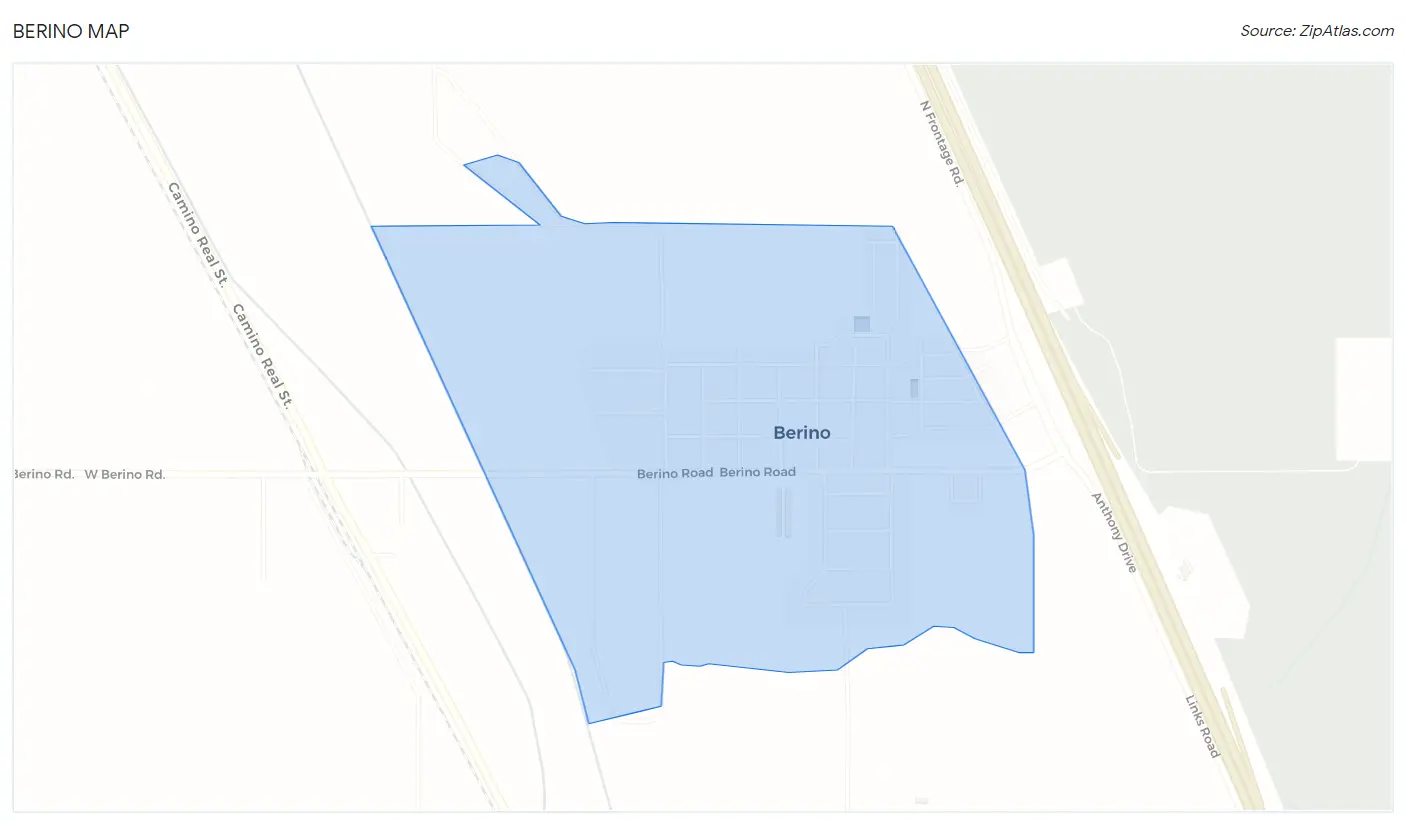
Berino Map
Berino Overview
$13,903
PER CAPITA INCOME
$26,136
AVG FAMILY INCOME
$26,477
AVG HOUSEHOLD INCOME
31.1%
WAGE / INCOME GAP [ % ]
68.9¢/ $1
WAGE / INCOME GAP [ $ ]
0.41
INEQUALITY / GINI INDEX
1,250
TOTAL POPULATION
526
MALE POPULATION
724
FEMALE POPULATION
72.65
MALES / 100 FEMALES
137.64
FEMALES / 100 MALES
33.3
MEDIAN AGE
3.1
AVG FAMILY SIZE
2.7
AVG HOUSEHOLD SIZE
475
LABOR FORCE [ PEOPLE ]
44.5%
PERCENT IN LABOR FORCE
9.9%
UNEMPLOYMENT RATE
Berino Zip Codes
Berino Area Codes
Income in Berino
Income Overview in Berino
Per Capita Income in Berino is $13,903, while median incomes of families and households are $26,136 and $26,477 respectively.
| Characteristic | Number | Measure |
| Per Capita Income | 1,250 | $13,903 |
| Median Family Income | 356 | $26,136 |
| Mean Family Income | 356 | $34,216 |
| Median Household Income | 461 | $26,477 |
| Mean Household Income | 461 | $31,844 |
| Income Deficit | 356 | $0 |
| Wage / Income Gap (%) | 1,250 | 31.15% |
| Wage / Income Gap ($) | 1,250 | 68.85¢ per $1 |
| Gini / Inequality Index | 1,250 | 0.41 |
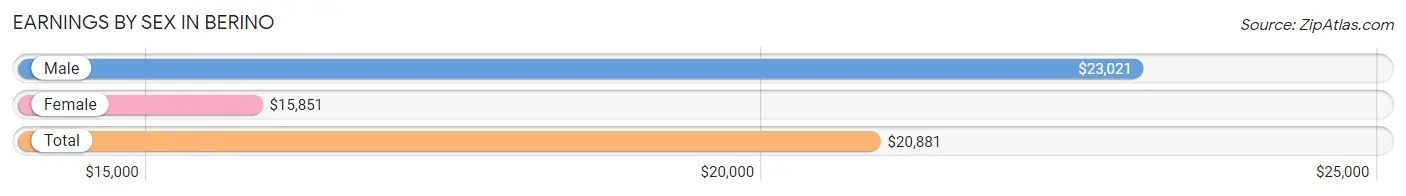
Earnings by Sex in Berino
Average Earnings in Berino are $20,881, $23,021 for men and $15,851 for women, a difference of 31.1%.
| Sex | Number | Average Earnings |
| Male | 307 (60.1%) | $23,021 |
| Female | 204 (39.9%) | $15,851 |
| Total | 511 (100.0%) | $20,881 |
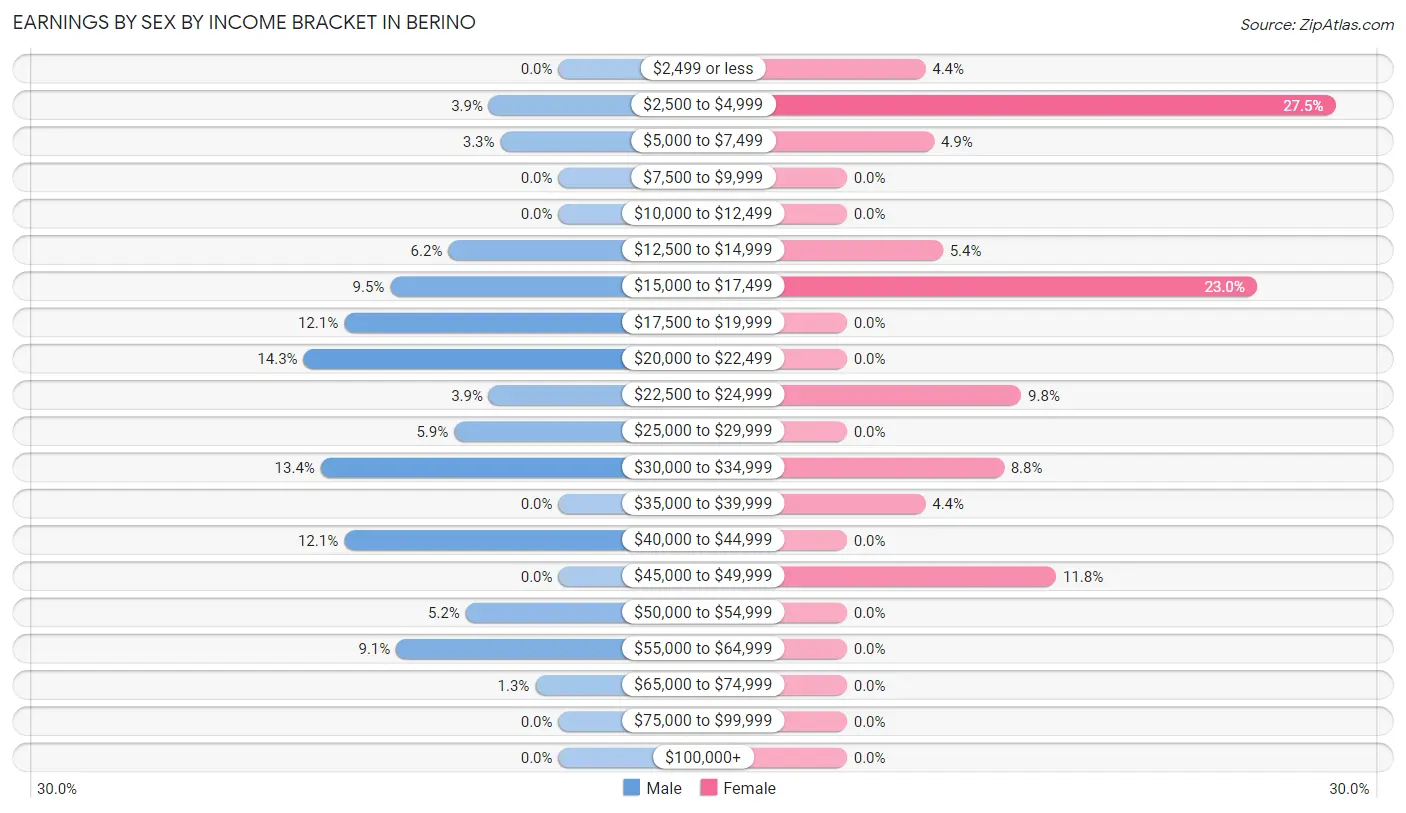
Earnings by Sex by Income Bracket in Berino
The most common earnings brackets in Berino are $20,000 to $22,499 for men (44 | 14.3%) and $2,500 to $4,999 for women (56 | 27.5%).
| Income | Male | Female |
| $2,499 or less | 0 (0.0%) | 9 (4.4%) |
| $2,500 to $4,999 | 12 (3.9%) | 56 (27.5%) |
| $5,000 to $7,499 | 10 (3.3%) | 10 (4.9%) |
| $7,500 to $9,999 | 0 (0.0%) | 0 (0.0%) |
| $10,000 to $12,499 | 0 (0.0%) | 0 (0.0%) |
| $12,500 to $14,999 | 19 (6.2%) | 11 (5.4%) |
| $15,000 to $17,499 | 29 (9.5%) | 47 (23.0%) |
| $17,500 to $19,999 | 37 (12.0%) | 0 (0.0%) |
| $20,000 to $22,499 | 44 (14.3%) | 0 (0.0%) |
| $22,500 to $24,999 | 12 (3.9%) | 20 (9.8%) |
| $25,000 to $29,999 | 18 (5.9%) | 0 (0.0%) |
| $30,000 to $34,999 | 41 (13.4%) | 18 (8.8%) |
| $35,000 to $39,999 | 0 (0.0%) | 9 (4.4%) |
| $40,000 to $44,999 | 37 (12.0%) | 0 (0.0%) |
| $45,000 to $49,999 | 0 (0.0%) | 24 (11.8%) |
| $50,000 to $54,999 | 16 (5.2%) | 0 (0.0%) |
| $55,000 to $64,999 | 28 (9.1%) | 0 (0.0%) |
| $65,000 to $74,999 | 4 (1.3%) | 0 (0.0%) |
| $75,000 to $99,999 | 0 (0.0%) | 0 (0.0%) |
| $100,000+ | 0 (0.0%) | 0 (0.0%) |
| Total | 307 (100.0%) | 204 (100.0%) |
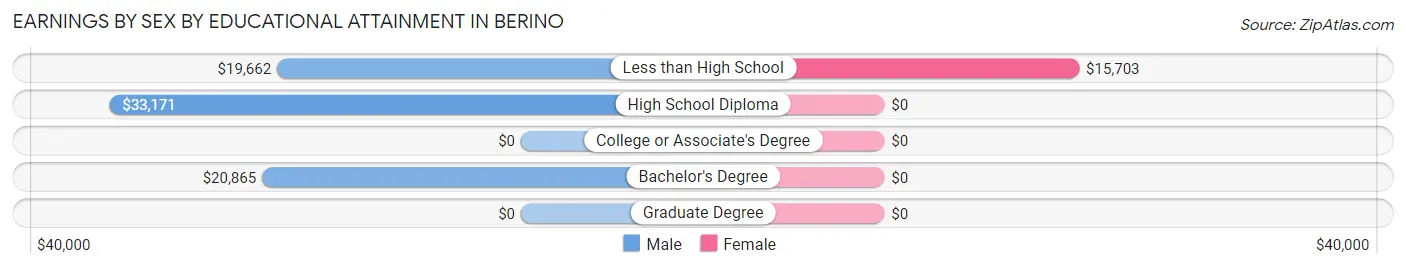
Earnings by Sex by Educational Attainment in Berino
Average earnings in Berino are $25,694 for men and $16,090 for women, a difference of 37.4%. Men with an educational attainment of high school diploma enjoy the highest average annual earnings of $33,171, while those with less than high school education earn the least with $19,662. Women with an educational attainment of less than high school earn the most with the average annual earnings of $15,703, while those with less than high school education have the smallest earnings of $15,703.
| Educational Attainment | Male Income | Female Income |
| Less than High School | $19,662 | $15,703 |
| High School Diploma | $33,171 | $0 |
| College or Associate's Degree | - | - |
| Bachelor's Degree | $20,865 | $0 |
| Graduate Degree | - | - |
| Total | $25,694 | $16,090 |
Family Income in Berino
Family Income Brackets in Berino
According to the Berino family income data, there are 116 families falling into the $15,000 to $24,999 income range, which is the most common income bracket and makes up 32.6% of all families.
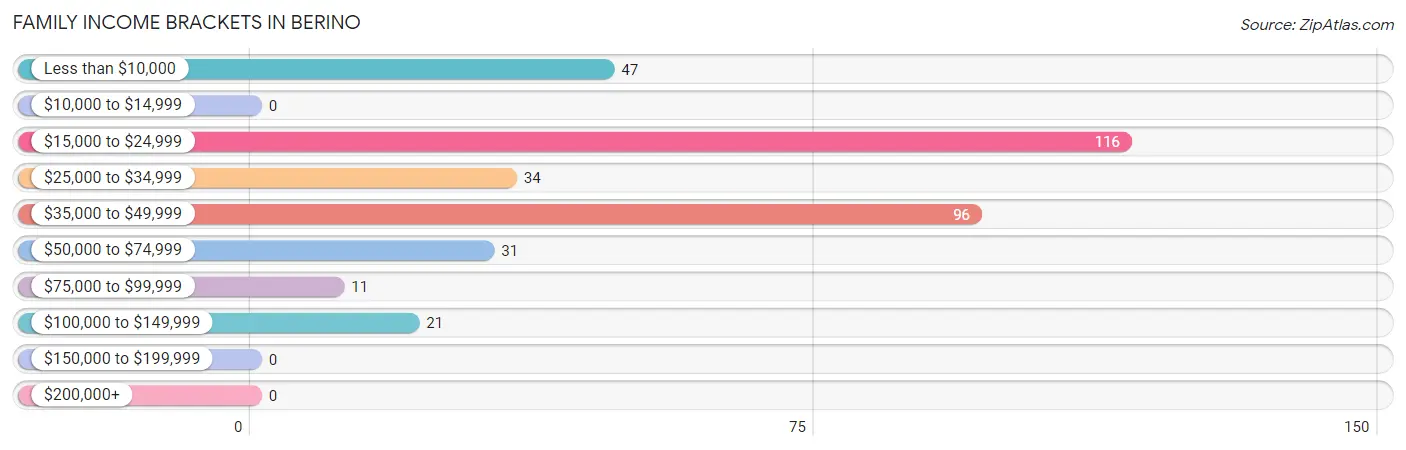
| Income Bracket | # Families | % Families |
| Less than $10,000 | 47 | 13.2% |
| $10,000 to $14,999 | 0 | 0.0% |
| $15,000 to $24,999 | 116 | 32.6% |
| $25,000 to $34,999 | 34 | 9.6% |
| $35,000 to $49,999 | 96 | 27.0% |
| $50,000 to $74,999 | 31 | 8.7% |
| $75,000 to $99,999 | 11 | 3.1% |
| $100,000 to $149,999 | 21 | 5.9% |
| $150,000 to $199,999 | 0 | 0.0% |
| $200,000+ | 0 | 0.0% |
Family Income by Famaliy Size in Berino
3-person families (80 | 22.5%) account for the highest median family income in Berino with $41,328 per family, while 3-person families (80 | 22.5%) have the highest median income of $13,776 per family member.
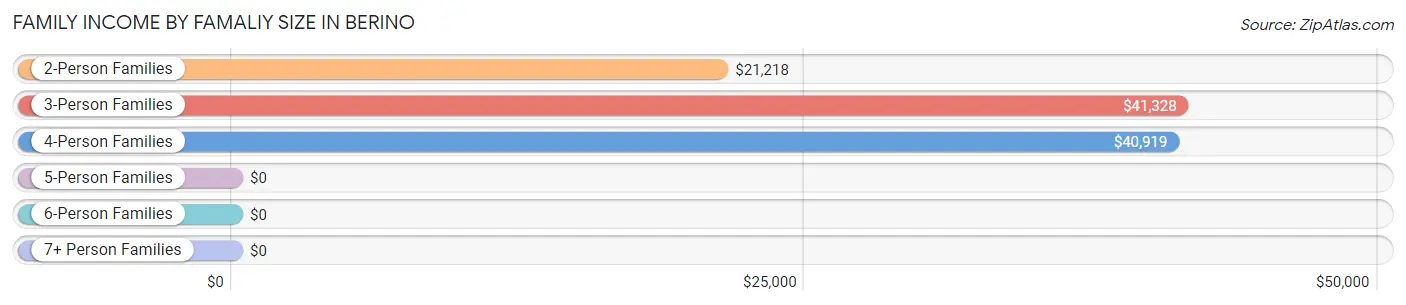
| Income Bracket | # Families | Median Income |
| 2-Person Families | 204 (57.3%) | $21,218 |
| 3-Person Families | 80 (22.5%) | $41,328 |
| 4-Person Families | 65 (18.3%) | $40,919 |
| 5-Person Families | 7 (2.0%) | $0 |
| 6-Person Families | 0 (0.0%) | $0 |
| 7+ Person Families | 0 (0.0%) | $0 |
| Total | 356 (100.0%) | $26,136 |
Family Income by Number of Earners in Berino
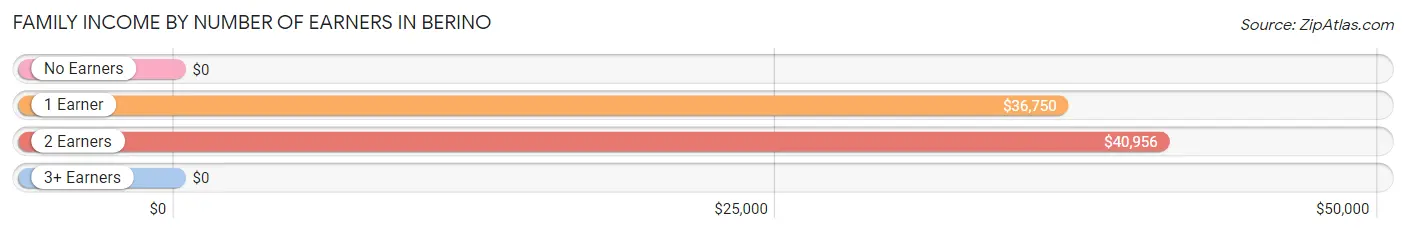
| Number of Earners | # Families | Median Income |
| No Earners | 116 (32.6%) | $0 |
| 1 Earner | 144 (40.5%) | $36,750 |
| 2 Earners | 84 (23.6%) | $40,956 |
| 3+ Earners | 12 (3.4%) | $0 |
| Total | 356 (100.0%) | $26,136 |
Household Income in Berino
Household Income Brackets in Berino
With 153 households falling in the category, the $35,000 to $49,999 income range is the most frequent in Berino, accounting for 33.2% of all households.
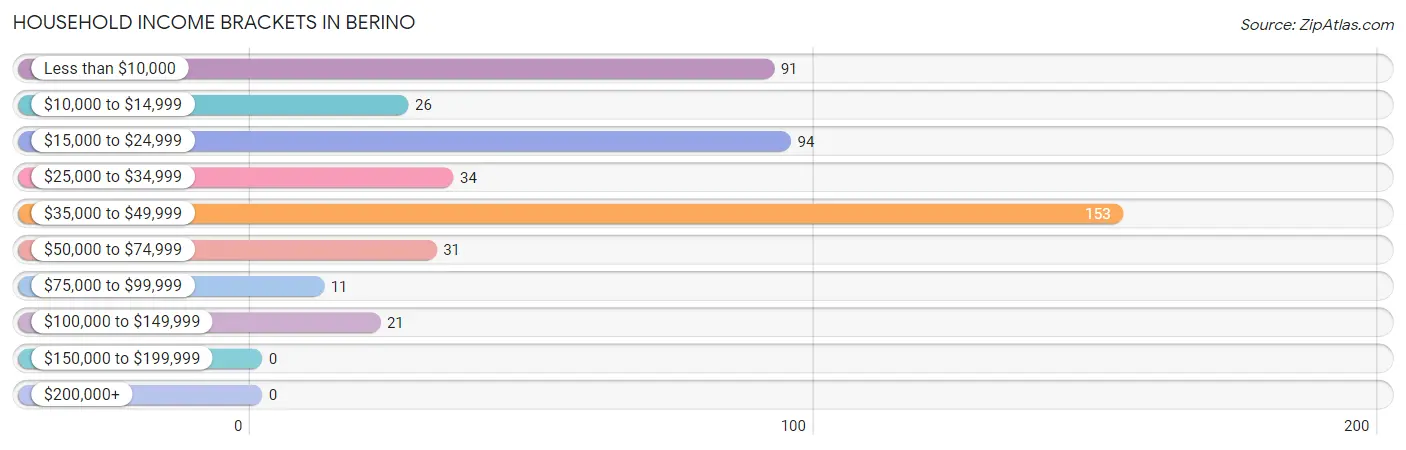
| Income Bracket | # Households | % Households |
| Less than $10,000 | 91 | 19.7% |
| $10,000 to $14,999 | 26 | 5.6% |
| $15,000 to $24,999 | 94 | 20.4% |
| $25,000 to $34,999 | 34 | 7.4% |
| $35,000 to $49,999 | 153 | 33.2% |
| $50,000 to $74,999 | 31 | 6.7% |
| $75,000 to $99,999 | 11 | 2.4% |
| $100,000 to $149,999 | 21 | 4.6% |
| $150,000 to $199,999 | 0 | 0.0% |
| $200,000+ | 0 | 0.0% |
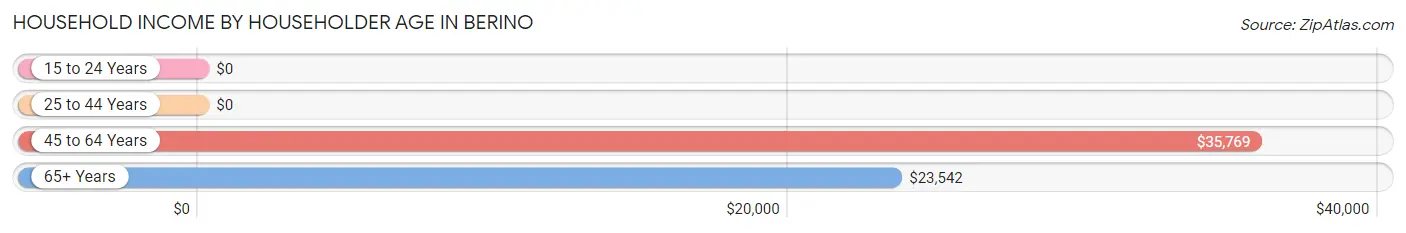
Household Income by Householder Age in Berino
The median household income in Berino is $26,477, with the highest median household income of $35,769 found in the 45 to 64 years age bracket for the primary householder. A total of 232 households (50.3%) fall into this category.
| Income Bracket | # Households | Median Income |
| 15 to 24 Years | 0 (0.0%) | $0 |
| 25 to 44 Years | 126 (27.3%) | $0 |
| 45 to 64 Years | 232 (50.3%) | $35,769 |
| 65+ Years | 103 (22.3%) | $23,542 |
| Total | 461 (100.0%) | $26,477 |
Poverty in Berino
Income Below Poverty by Sex and Age in Berino
With 26.8% poverty level for males and 22.2% for females among the residents of Berino, under 5 year old males and 75 year old and over females are the most vulnerable to poverty, with 12 males (100.0%) and 44 females (89.8%) in their respective age groups living below the poverty level.
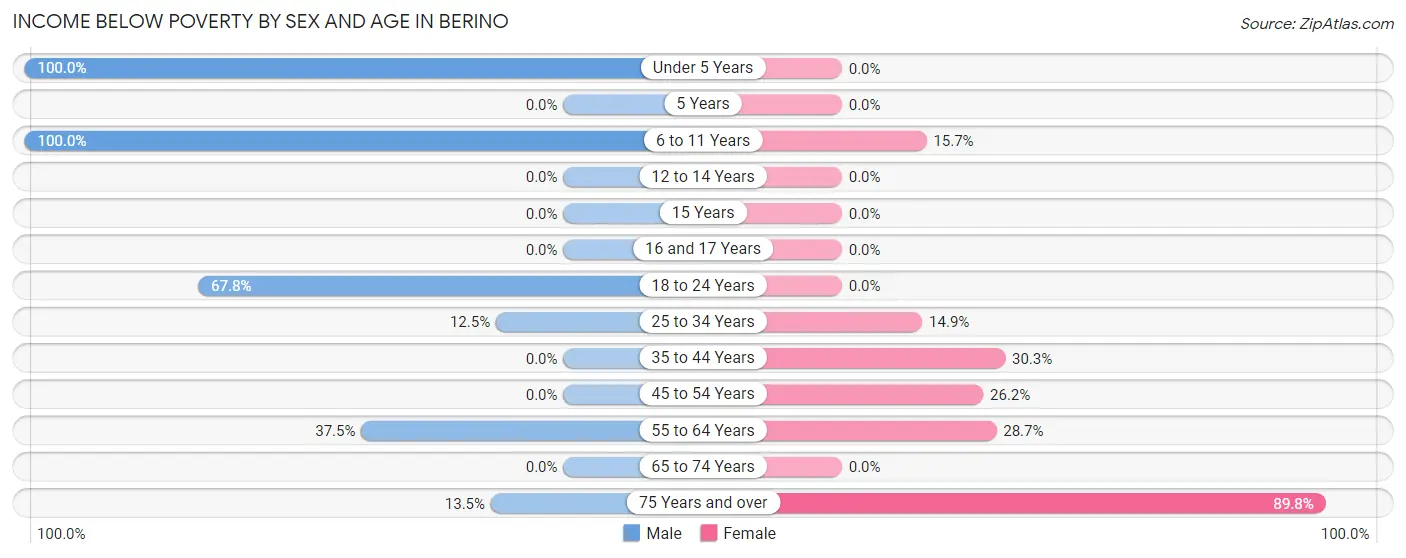
| Age Bracket | Male | Female |
| Under 5 Years | 12 (100.0%) | 0 (0.0%) |
| 5 Years | 0 (0.0%) | 0 (0.0%) |
| 6 to 11 Years | 21 (100.0%) | 11 (15.7%) |
| 12 to 14 Years | 0 (0.0%) | 0 (0.0%) |
| 15 Years | 0 (0.0%) | 0 (0.0%) |
| 16 and 17 Years | 0 (0.0%) | 0 (0.0%) |
| 18 to 24 Years | 61 (67.8%) | 0 (0.0%) |
| 25 to 34 Years | 22 (12.5%) | 27 (14.9%) |
| 35 to 44 Years | 0 (0.0%) | 10 (30.3%) |
| 45 to 54 Years | 0 (0.0%) | 32 (26.2%) |
| 55 to 64 Years | 18 (37.5%) | 37 (28.7%) |
| 65 to 74 Years | 0 (0.0%) | 0 (0.0%) |
| 75 Years and over | 7 (13.5%) | 44 (89.8%) |
| Total | 141 (26.8%) | 161 (22.2%) |
Income Above Poverty by Sex and Age in Berino
According to the poverty statistics in Berino, males aged 45 to 54 years and females aged 5 years are the age groups that are most secure financially, with 100.0% of males and 100.0% of females in these age groups living above the poverty line.
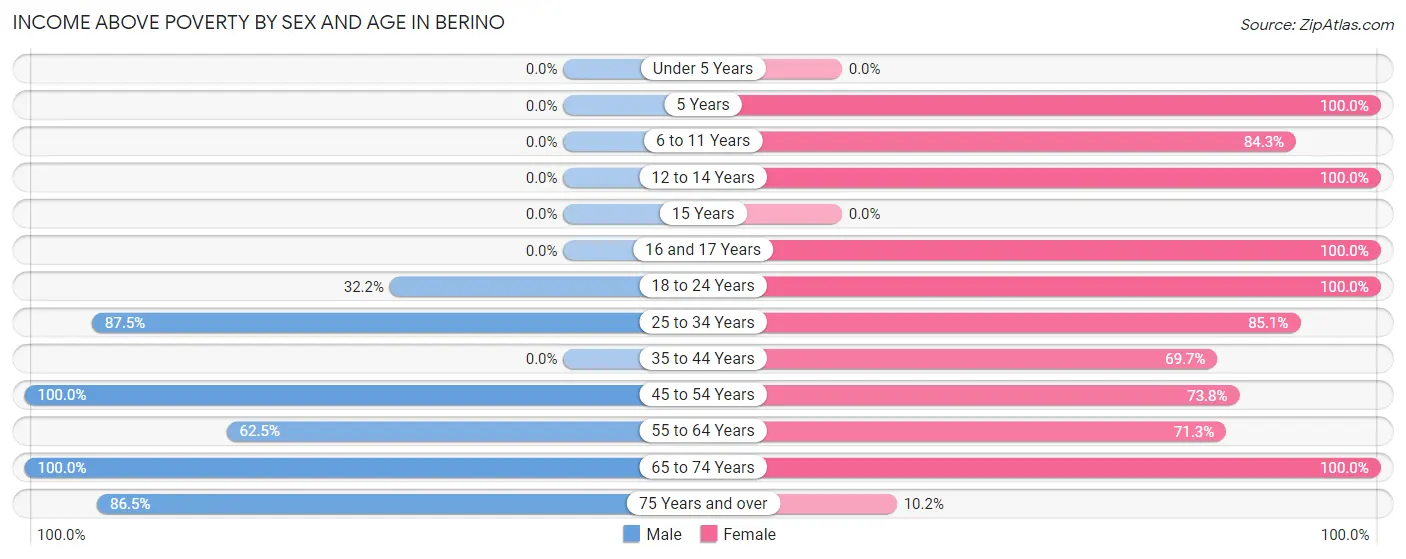
| Age Bracket | Male | Female |
| Under 5 Years | 0 (0.0%) | 0 (0.0%) |
| 5 Years | 0 (0.0%) | 39 (100.0%) |
| 6 to 11 Years | 0 (0.0%) | 59 (84.3%) |
| 12 to 14 Years | 0 (0.0%) | 41 (100.0%) |
| 15 Years | 0 (0.0%) | 0 (0.0%) |
| 16 and 17 Years | 0 (0.0%) | 21 (100.0%) |
| 18 to 24 Years | 29 (32.2%) | 9 (100.0%) |
| 25 to 34 Years | 154 (87.5%) | 154 (85.1%) |
| 35 to 44 Years | 0 (0.0%) | 23 (69.7%) |
| 45 to 54 Years | 89 (100.0%) | 90 (73.8%) |
| 55 to 64 Years | 30 (62.5%) | 92 (71.3%) |
| 65 to 74 Years | 38 (100.0%) | 30 (100.0%) |
| 75 Years and over | 45 (86.5%) | 5 (10.2%) |
| Total | 385 (73.2%) | 563 (77.8%) |
Income Below Poverty Among Married-Couple Families in Berino
The poverty statistics for married-couple families in Berino show that 9.8% or 18 of the total 183 families live below the poverty line. Families with no children have the highest poverty rate of 13.4%, comprising of 18 families. On the other hand, families with 1 or 2 children have the lowest poverty rate of 0.0%, which includes 0 families.
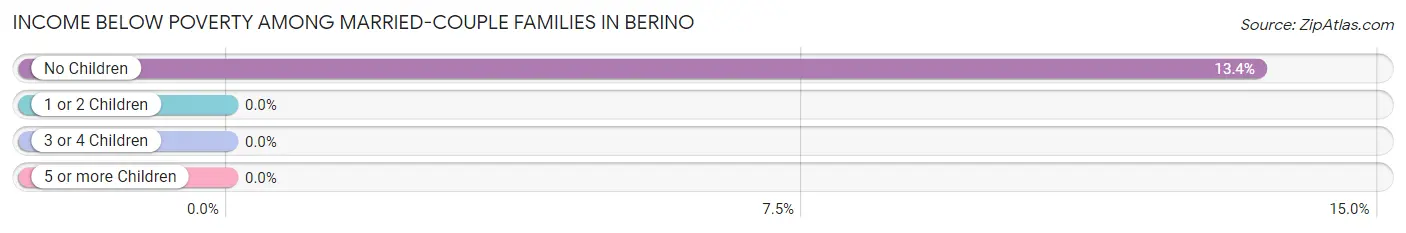
| Children | Above Poverty | Below Poverty |
| No Children | 116 (86.6%) | 18 (13.4%) |
| 1 or 2 Children | 49 (100.0%) | 0 (0.0%) |
| 3 or 4 Children | 0 (0.0%) | 0 (0.0%) |
| 5 or more Children | 0 (0.0%) | 0 (0.0%) |
| Total | 165 (90.2%) | 18 (9.8%) |
Income Below Poverty Among Single-Parent Households in Berino
According to the poverty data in Berino, 100.0% or 7 single-father households and 39.2% or 65 single-mother households are living below the poverty line. Among single-father households, those with 1 or 2 children have the highest poverty rate, with 7 households (100.0%) experiencing poverty. Likewise, among single-mother households, those with 1 or 2 children have the highest poverty rate, with 27 households (60.0%) falling below the poverty line.
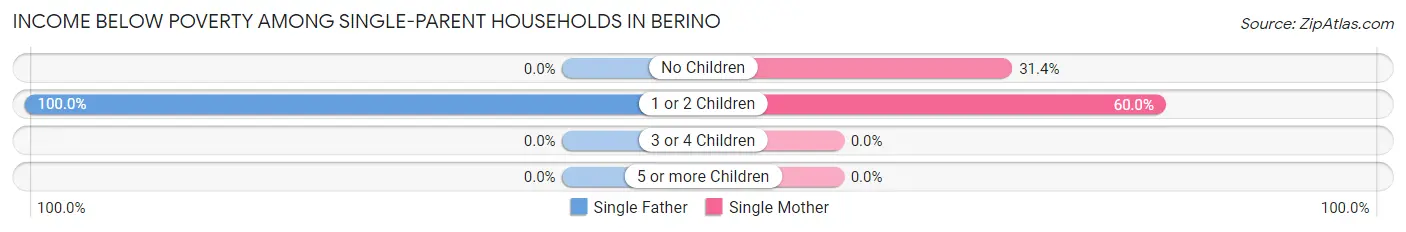
| Children | Single Father | Single Mother |
| No Children | 0 (0.0%) | 38 (31.4%) |
| 1 or 2 Children | 7 (100.0%) | 27 (60.0%) |
| 3 or 4 Children | 0 (0.0%) | 0 (0.0%) |
| 5 or more Children | 0 (0.0%) | 0 (0.0%) |
| Total | 7 (100.0%) | 65 (39.2%) |
Income Below Poverty Among Married-Couple vs Single-Parent Households in Berino
The poverty data for Berino shows that 18 of the married-couple family households (9.8%) and 72 of the single-parent households (41.6%) are living below the poverty level. Within the married-couple family households, those with no children have the highest poverty rate, with 18 households (13.4%) falling below the poverty line. Among the single-parent households, those with 1 or 2 children have the highest poverty rate, with 34 household (65.4%) living below poverty.
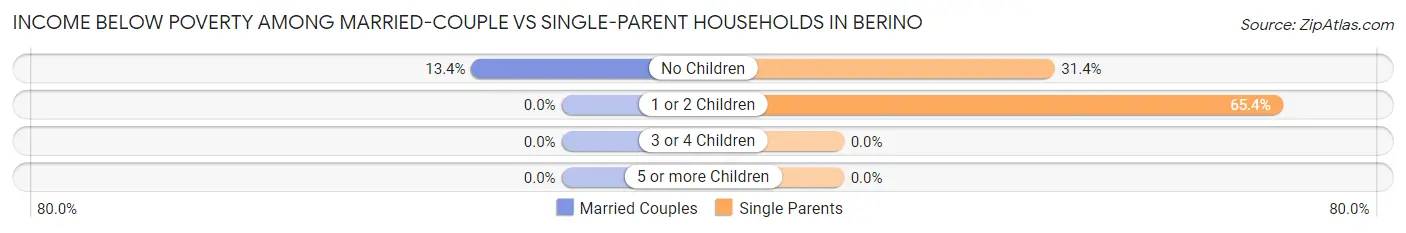
| Children | Married-Couple Families | Single-Parent Households |
| No Children | 18 (13.4%) | 38 (31.4%) |
| 1 or 2 Children | 0 (0.0%) | 34 (65.4%) |
| 3 or 4 Children | 0 (0.0%) | 0 (0.0%) |
| 5 or more Children | 0 (0.0%) | 0 (0.0%) |
| Total | 18 (9.8%) | 72 (41.6%) |
Race in Berino
The most populous races in Berino are Hispanic or Latino (1,250 | 100.0%), Some other Race (757 | 60.6%), and White / Caucasian (423 | 33.8%).
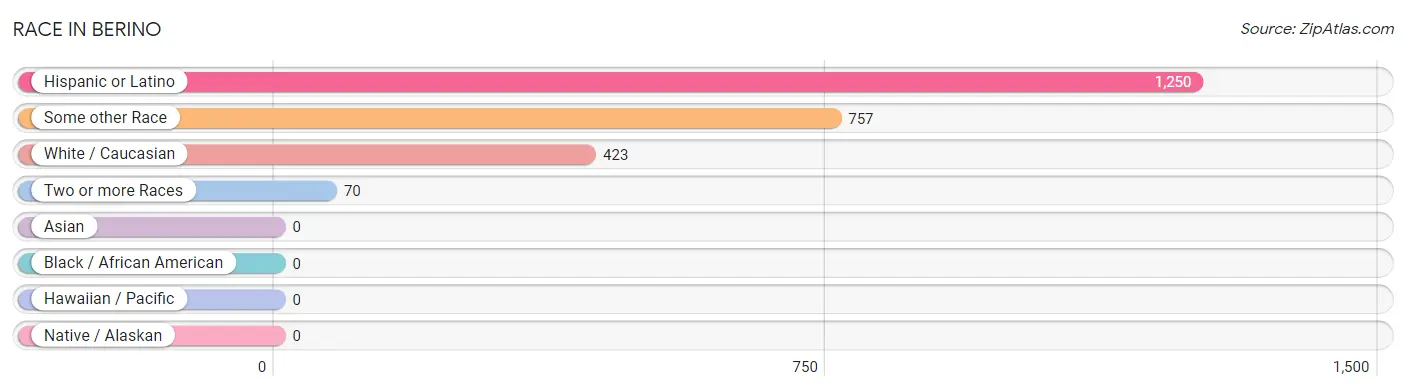
| Race | # Population | % Population |
| Asian | 0 | 0.0% |
| Black / African American | 0 | 0.0% |
| Hawaiian / Pacific | 0 | 0.0% |
| Hispanic or Latino | 1,250 | 100.0% |
| Native / Alaskan | 0 | 0.0% |
| White / Caucasian | 423 | 33.8% |
| Two or more Races | 70 | 5.6% |
| Some other Race | 757 | 60.6% |
| Total | 1,250 | 100.0% |
Ancestry in Berino
The most populous ancestries reported in Berino are Mexican (1,240 | 99.2%), Central American (10 | 0.8%), and Honduran (10 | 0.8%), together accounting for 100.8% of all Berino residents.
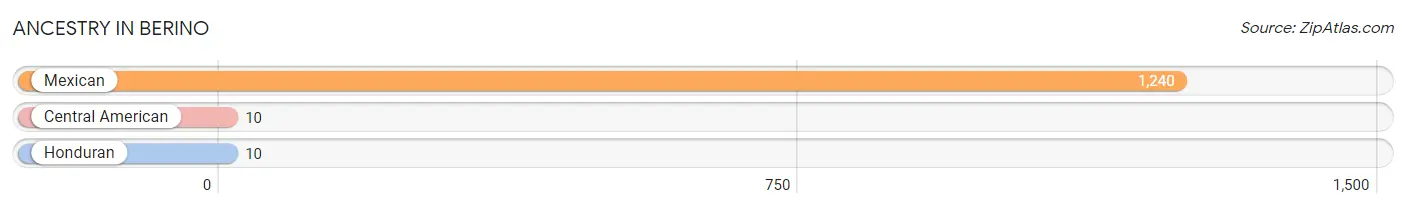
| Ancestry | # Population | % Population |
| Central American | 10 | 0.8% |
| Honduran | 10 | 0.8% |
| Mexican | 1,240 | 99.2% | View All 3 Rows |
Immigrants in Berino
The most numerous immigrant groups reported in Berino came from Central America (488 | 39.0%), Latin America (488 | 39.0%), Mexico (478 | 38.2%), and Honduras (10 | 0.8%), together accounting for 117.1% of all Berino residents.
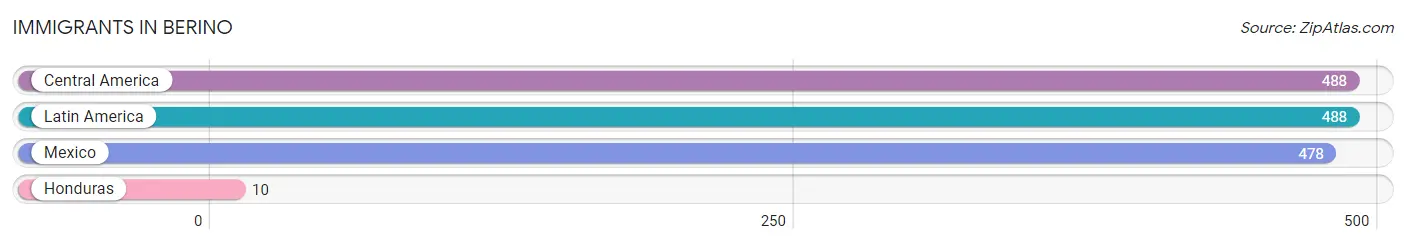
| Immigration Origin | # Population | % Population |
| Central America | 488 | 39.0% |
| Honduras | 10 | 0.8% |
| Latin America | 488 | 39.0% |
| Mexico | 478 | 38.2% | View All 4 Rows |
Sex and Age in Berino
Sex and Age in Berino
The most populous age groups in Berino are 25 to 29 Years (107 | 20.3%) for men and 25 to 29 Years (147 | 20.3%) for women.
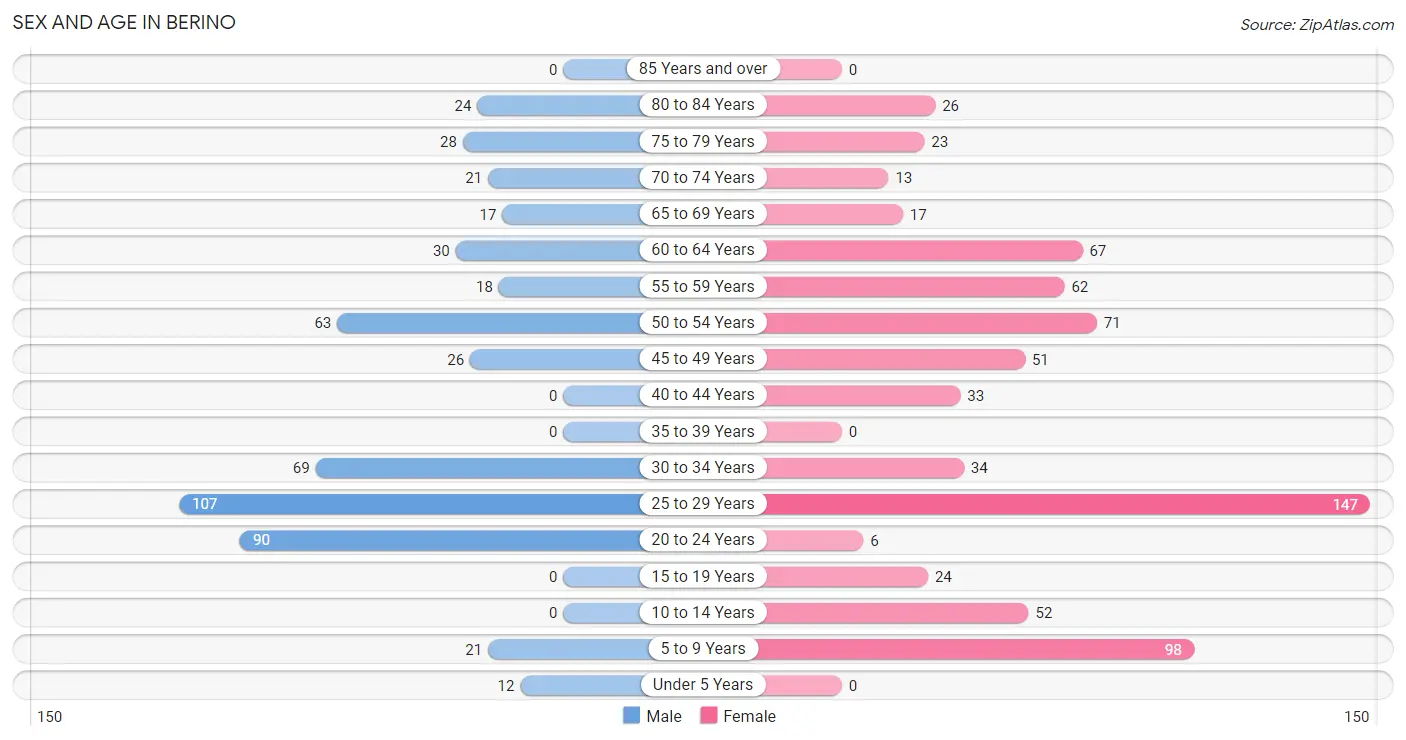
| Age Bracket | Male | Female |
| Under 5 Years | 12 (2.3%) | 0 (0.0%) |
| 5 to 9 Years | 21 (4.0%) | 98 (13.5%) |
| 10 to 14 Years | 0 (0.0%) | 52 (7.2%) |
| 15 to 19 Years | 0 (0.0%) | 24 (3.3%) |
| 20 to 24 Years | 90 (17.1%) | 6 (0.8%) |
| 25 to 29 Years | 107 (20.3%) | 147 (20.3%) |
| 30 to 34 Years | 69 (13.1%) | 34 (4.7%) |
| 35 to 39 Years | 0 (0.0%) | 0 (0.0%) |
| 40 to 44 Years | 0 (0.0%) | 33 (4.6%) |
| 45 to 49 Years | 26 (4.9%) | 51 (7.0%) |
| 50 to 54 Years | 63 (12.0%) | 71 (9.8%) |
| 55 to 59 Years | 18 (3.4%) | 62 (8.6%) |
| 60 to 64 Years | 30 (5.7%) | 67 (9.2%) |
| 65 to 69 Years | 17 (3.2%) | 17 (2.4%) |
| 70 to 74 Years | 21 (4.0%) | 13 (1.8%) |
| 75 to 79 Years | 28 (5.3%) | 23 (3.2%) |
| 80 to 84 Years | 24 (4.6%) | 26 (3.6%) |
| 85 Years and over | 0 (0.0%) | 0 (0.0%) |
| Total | 526 (100.0%) | 724 (100.0%) |
Families and Households in Berino
Median Family Size in Berino
The median family size in Berino is 3.14 persons per family, with single male/father families (7 | 2.0%) accounting for the largest median family size of 7.14 persons per family. On the other hand, single female/mother families (166 | 46.6%) represent the smallest median family size with 2.54 persons per family.
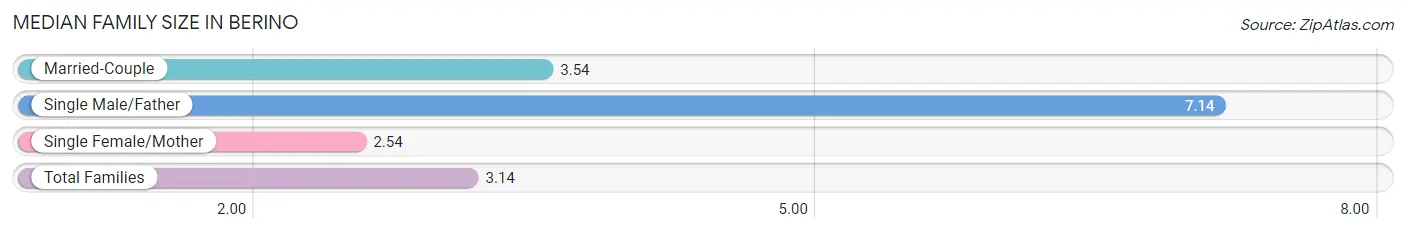
| Family Type | # Families | Family Size |
| Married-Couple | 183 (51.4%) | 3.54 |
| Single Male/Father | 7 (2.0%) | 7.14 |
| Single Female/Mother | 166 (46.6%) | 2.54 |
| Total Families | 356 (100.0%) | 3.14 |
Median Household Size in Berino
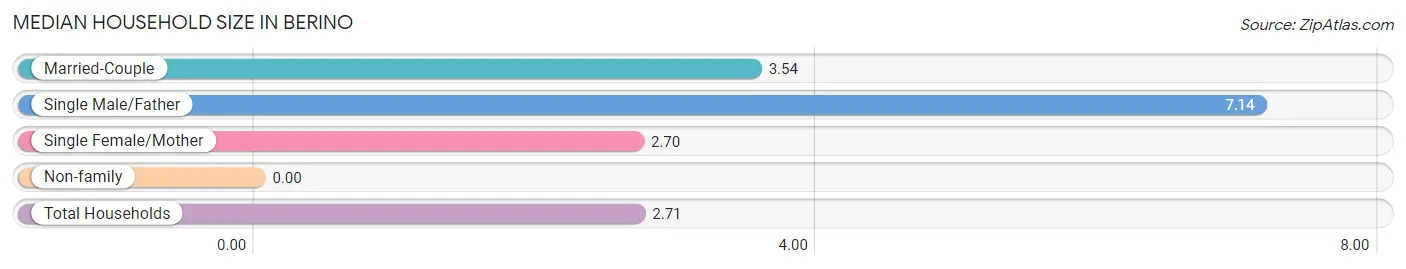
| Household Type | # Households | Household Size |
| Married-Couple | 183 (39.7%) | 3.54 |
| Single Male/Father | 7 (1.5%) | 7.14 |
| Single Female/Mother | 166 (36.0%) | 2.70 |
| Non-family | 105 (22.8%) | - |
| Total Households | 461 (100.0%) | 2.71 |
Household Size by Marriage Status in Berino
Out of a total of 461 households in Berino, 356 (77.2%) are family households, while 105 (22.8%) are nonfamily households. The most numerous type of family households are 2-person households, comprising 182, and the most common type of nonfamily households are 1-person households, comprising 105.
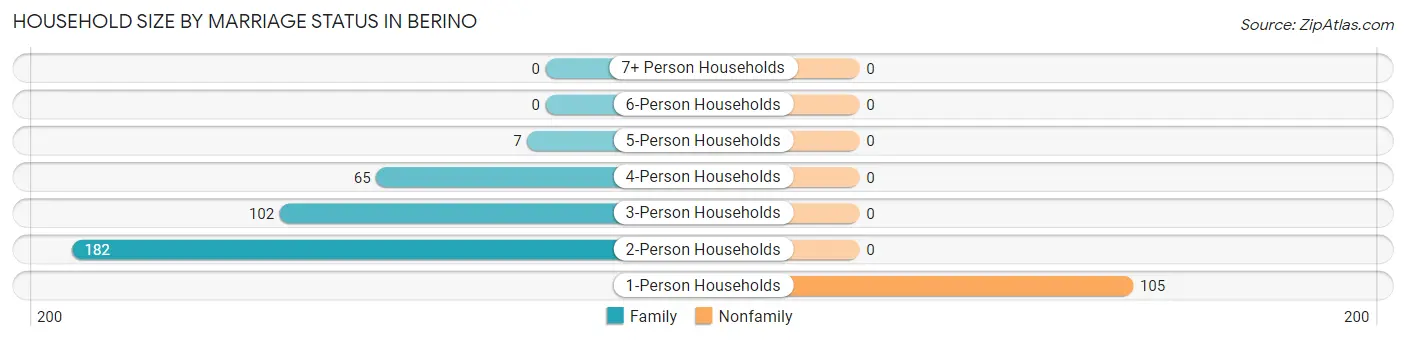
| Household Size | Family Households | Nonfamily Households |
| 1-Person Households | - | 105 (22.8%) |
| 2-Person Households | 182 (39.5%) | 0 (0.0%) |
| 3-Person Households | 102 (22.1%) | 0 (0.0%) |
| 4-Person Households | 65 (14.1%) | 0 (0.0%) |
| 5-Person Households | 7 (1.5%) | 0 (0.0%) |
| 6-Person Households | 0 (0.0%) | 0 (0.0%) |
| 7+ Person Households | 0 (0.0%) | 0 (0.0%) |
| Total | 356 (77.2%) | 105 (22.8%) |
Female Fertility in Berino
Fertility by Age in Berino
| Age Bracket | Women with Births | Births / 1,000 Women |
| 15 to 19 years | 0 (0.0%) | 0.0 |
| 20 to 34 years | 0 (0.0%) | 0.0 |
| 35 to 50 years | 0 (0.0%) | 0.0 |
| Total | 0 (0.0%) | 0.0 |
Fertility by Age by Marriage Status in Berino
| Age Bracket | Married | Unmarried |
| 15 to 19 years | 0 (0.0%) | 0 (0.0%) |
| 20 to 34 years | 0 (0.0%) | 0 (0.0%) |
| 35 to 50 years | 0 (0.0%) | 0 (0.0%) |
| Total | 0 (0.0%) | 0 (0.0%) |
Fertility by Education in Berino
| Educational Attainment | Women with Births | Births / 1,000 Women |
| Less than High School | 0 (0.0%) | 0.0 |
| High School Diploma | 0 (0.0%) | 0.0 |
| College or Associate's Degree | 0 (0.0%) | 0.0 |
| Bachelor's Degree | 0 (0.0%) | 0.0 |
| Graduate Degree | 0 (0.0%) | 0.0 |
| Total | 0 (0.0%) | 0.0 |
Fertility by Education by Marriage Status in Berino
| Educational Attainment | Married | Unmarried |
| Less than High School | 0 (0.0%) | 0 (0.0%) |
| High School Diploma | 0 (0.0%) | 0 (0.0%) |
| College or Associate's Degree | 0 (0.0%) | 0 (0.0%) |
| Bachelor's Degree | 0 (0.0%) | 0 (0.0%) |
| Graduate Degree | 0 (0.0%) | 0 (0.0%) |
| Total | 0 (0.0%) | 0 (0.0%) |
Employment Characteristics in Berino
Employment by Class of Employer in Berino
Among the 400 employed individuals in Berino, private company employees (303 | 75.7%), not-for-profit organizations (53 | 13.3%), and state government employees (33 | 8.3%) make up the most common classes of employment.
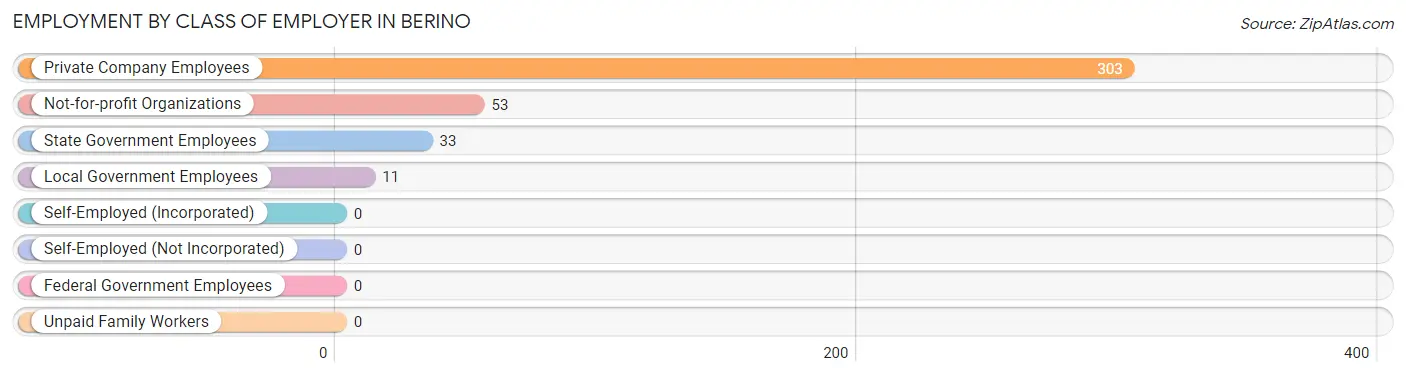
| Employer Class | # Employees | % Employees |
| Private Company Employees | 303 | 75.7% |
| Self-Employed (Incorporated) | 0 | 0.0% |
| Self-Employed (Not Incorporated) | 0 | 0.0% |
| Not-for-profit Organizations | 53 | 13.3% |
| Local Government Employees | 11 | 2.8% |
| State Government Employees | 33 | 8.3% |
| Federal Government Employees | 0 | 0.0% |
| Unpaid Family Workers | 0 | 0.0% |
| Total | 400 | 100.0% |
Employment Status by Age in Berino
According to the labor force statistics for Berino, out of the total population over 16 years of age (1,067), 44.5% or 475 individuals are in the labor force, with 9.9% or 47 of them unemployed. The age group with the highest labor force participation rate is 45 to 54 years, with 73.9% or 156 individuals in the labor force. Within the labor force, the 20 to 24 years age range has the highest percentage of unemployed individuals, with 82.9% or 29 of them being unemployed.
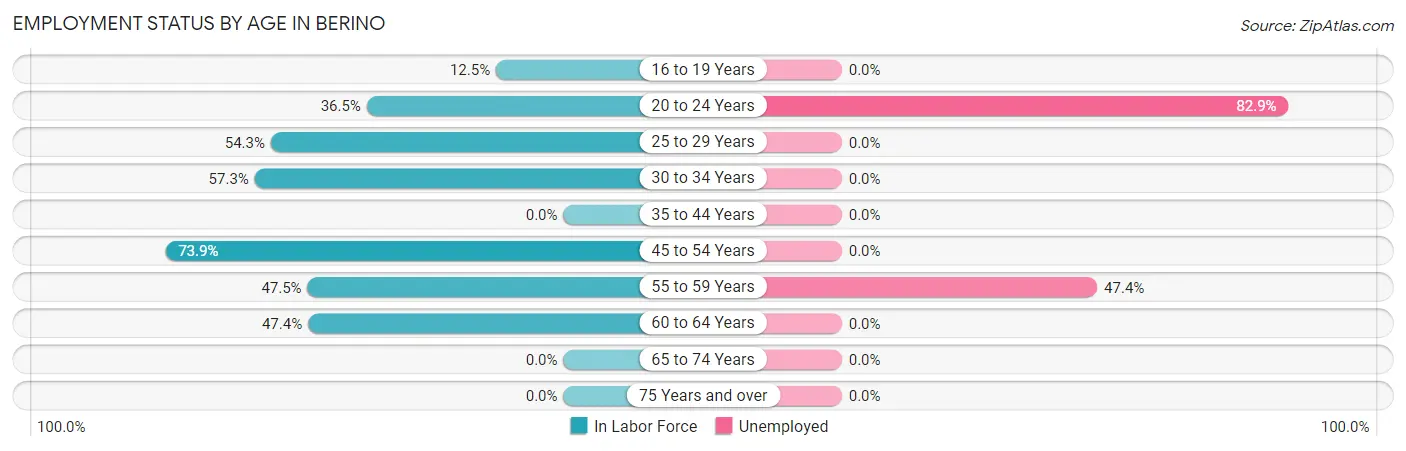
| Age Bracket | In Labor Force | Unemployed |
| 16 to 19 Years | 3 (12.5%) | 0 (0.0%) |
| 20 to 24 Years | 35 (36.5%) | 29 (82.9%) |
| 25 to 29 Years | 138 (54.3%) | 0 (0.0%) |
| 30 to 34 Years | 59 (57.3%) | 0 (0.0%) |
| 35 to 44 Years | 0 (0.0%) | 0 (0.0%) |
| 45 to 54 Years | 156 (73.9%) | 0 (0.0%) |
| 55 to 59 Years | 38 (47.5%) | 18 (47.4%) |
| 60 to 64 Years | 46 (47.4%) | 0 (0.0%) |
| 65 to 74 Years | 0 (0.0%) | 0 (0.0%) |
| 75 Years and over | 0 (0.0%) | 0 (0.0%) |
| Total | 475 (44.5%) | 47 (9.9%) |
Employment Status by Educational Attainment in Berino
According to labor force statistics for Berino, 56.2% of individuals (437) out of the total population between 25 and 64 years of age (778) are in the labor force, with 4.1% or 18 of them being unemployed. The group with the highest labor force participation rate are those with the educational attainment of college / associate degree, with 70.6% or 125 individuals in the labor force. Within the labor force, individuals with college / associate degree education have the highest percentage of unemployment, with 14.4% or 18 of them being unemployed.
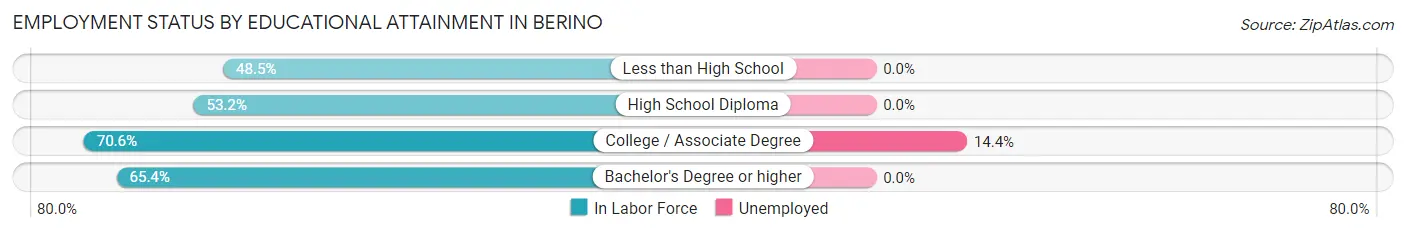
| Educational Attainment | In Labor Force | Unemployed |
| Less than High School | 177 (48.5%) | 0 (0.0%) |
| High School Diploma | 84 (53.2%) | 0 (0.0%) |
| College / Associate Degree | 125 (70.6%) | 25 (14.4%) |
| Bachelor's Degree or higher | 51 (65.4%) | 0 (0.0%) |
| Total | 437 (56.2%) | 32 (4.1%) |
Employment Occupations by Sex in Berino
Management, Business, Science and Arts Occupations
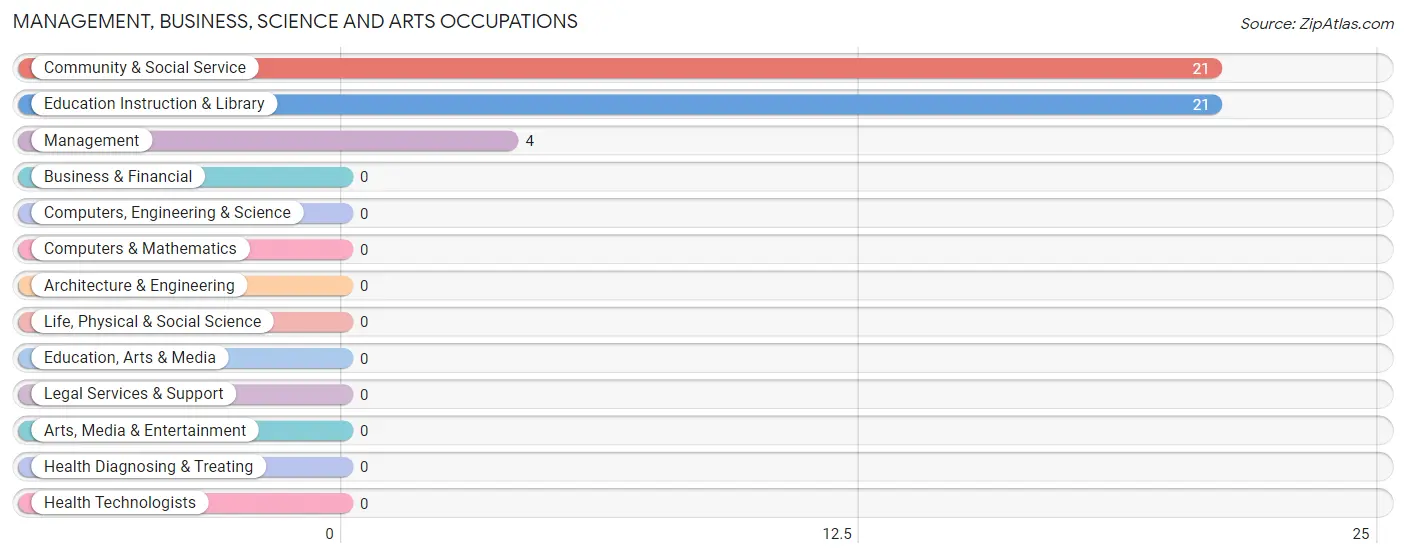
The most common Management, Business, Science and Arts occupations in Berino are Community & Social Service (21 | 4.9%), Education Instruction & Library (21 | 4.9%), and Management (4 | 0.9%).
Management, Business, Science and Arts Occupations by Sex
Within the Management, Business, Science and Arts occupations in Berino, the most male-oriented occupations are Management (100.0%), Community & Social Service (57.1%), and Education Instruction & Library (57.1%), while the most female-oriented occupations are Community & Social Service (42.9%), and Education Instruction & Library (42.9%).
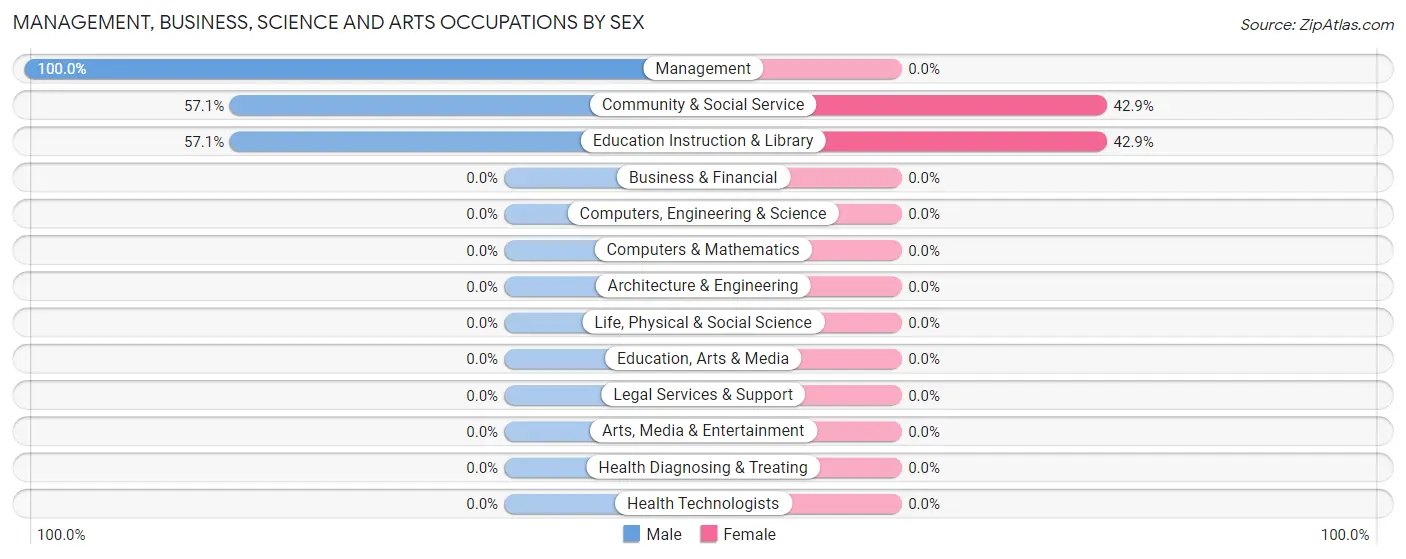
| Occupation | Male | Female |
| Management | 4 (100.0%) | 0 (0.0%) |
| Business & Financial | 0 (0.0%) | 0 (0.0%) |
| Computers, Engineering & Science | 0 (0.0%) | 0 (0.0%) |
| Computers & Mathematics | 0 (0.0%) | 0 (0.0%) |
| Architecture & Engineering | 0 (0.0%) | 0 (0.0%) |
| Life, Physical & Social Science | 0 (0.0%) | 0 (0.0%) |
| Community & Social Service | 12 (57.1%) | 9 (42.9%) |
| Education, Arts & Media | 0 (0.0%) | 0 (0.0%) |
| Legal Services & Support | 0 (0.0%) | 0 (0.0%) |
| Education Instruction & Library | 12 (57.1%) | 9 (42.9%) |
| Arts, Media & Entertainment | 0 (0.0%) | 0 (0.0%) |
| Health Diagnosing & Treating | 0 (0.0%) | 0 (0.0%) |
| Health Technologists | 0 (0.0%) | 0 (0.0%) |
| Total (Category) | 16 (64.0%) | 9 (36.0%) |
| Total (Overall) | 268 (62.6%) | 160 (37.4%) |
Services Occupations
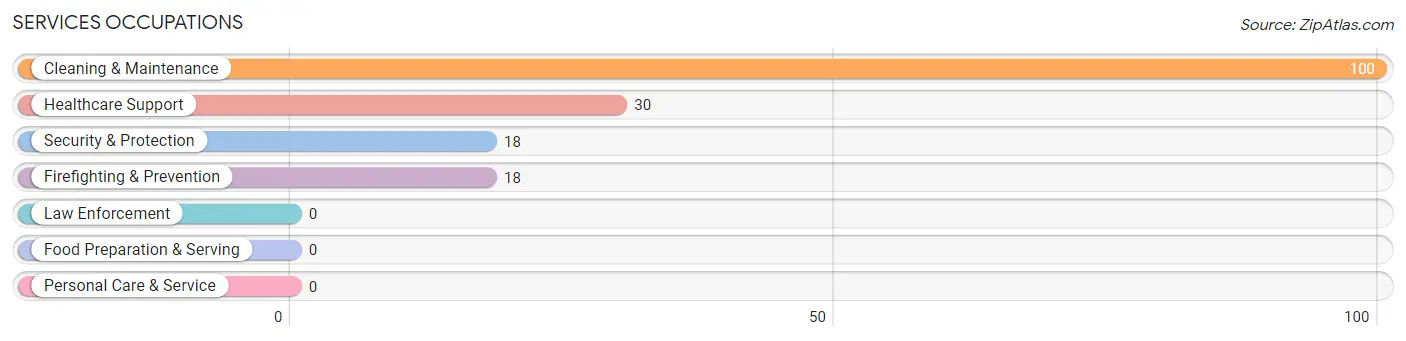
The most common Services occupations in Berino are Cleaning & Maintenance (100 | 23.4%), Healthcare Support (30 | 7.0%), Security & Protection (18 | 4.2%), and Firefighting & Prevention (18 | 4.2%).
Services Occupations by Sex
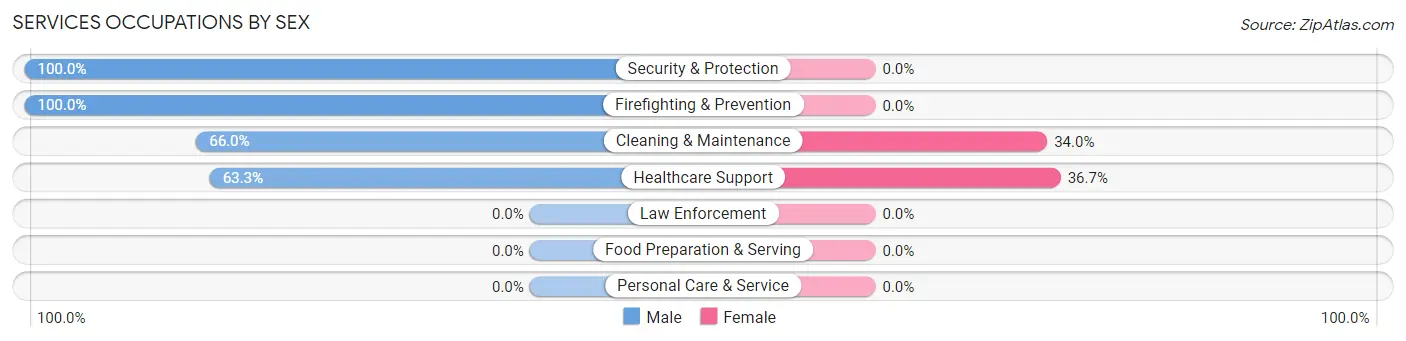
Within the Services occupations in Berino, the most male-oriented occupations are Security & Protection (100.0%), Firefighting & Prevention (100.0%), and Cleaning & Maintenance (66.0%), while the most female-oriented occupations are Healthcare Support (36.7%), and Cleaning & Maintenance (34.0%).
| Occupation | Male | Female |
| Healthcare Support | 19 (63.3%) | 11 (36.7%) |
| Security & Protection | 18 (100.0%) | 0 (0.0%) |
| Firefighting & Prevention | 18 (100.0%) | 0 (0.0%) |
| Law Enforcement | 0 (0.0%) | 0 (0.0%) |
| Food Preparation & Serving | 0 (0.0%) | 0 (0.0%) |
| Cleaning & Maintenance | 66 (66.0%) | 34 (34.0%) |
| Personal Care & Service | 0 (0.0%) | 0 (0.0%) |
| Total (Category) | 103 (69.6%) | 45 (30.4%) |
| Total (Overall) | 268 (62.6%) | 160 (37.4%) |
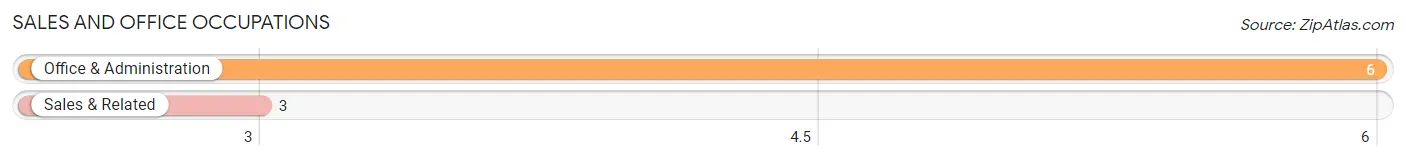
Sales and Office Occupations
The most common Sales and Office occupations in Berino are Office & Administration (6 | 1.4%), and Sales & Related (3 | 0.7%).
Sales and Office Occupations by Sex
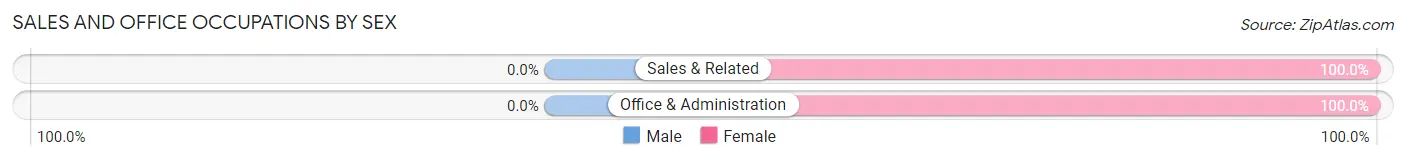
| Occupation | Male | Female |
| Sales & Related | 0 (0.0%) | 3 (100.0%) |
| Office & Administration | 0 (0.0%) | 6 (100.0%) |
| Total (Category) | 0 (0.0%) | 9 (100.0%) |
| Total (Overall) | 268 (62.6%) | 160 (37.4%) |
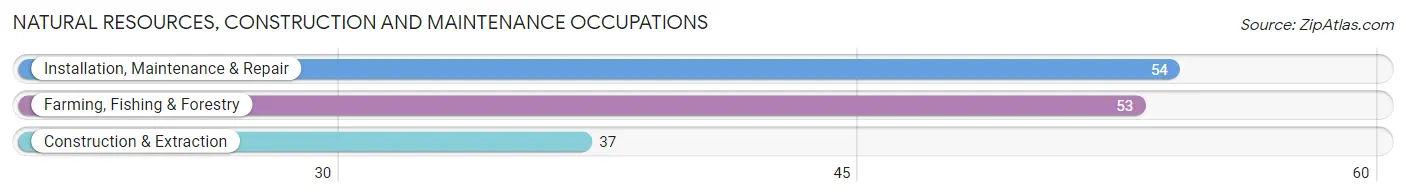
Natural Resources, Construction and Maintenance Occupations
The most common Natural Resources, Construction and Maintenance occupations in Berino are Installation, Maintenance & Repair (54 | 12.6%), Farming, Fishing & Forestry (53 | 12.4%), and Construction & Extraction (37 | 8.6%).
Natural Resources, Construction and Maintenance Occupations by Sex
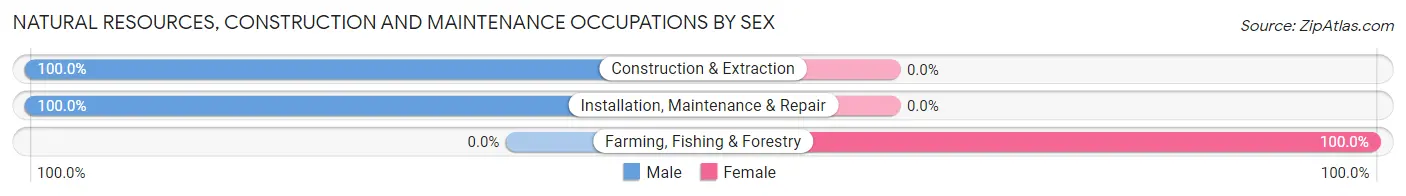
| Occupation | Male | Female |
| Farming, Fishing & Forestry | 0 (0.0%) | 53 (100.0%) |
| Construction & Extraction | 37 (100.0%) | 0 (0.0%) |
| Installation, Maintenance & Repair | 54 (100.0%) | 0 (0.0%) |
| Total (Category) | 91 (63.2%) | 53 (36.8%) |
| Total (Overall) | 268 (62.6%) | 160 (37.4%) |
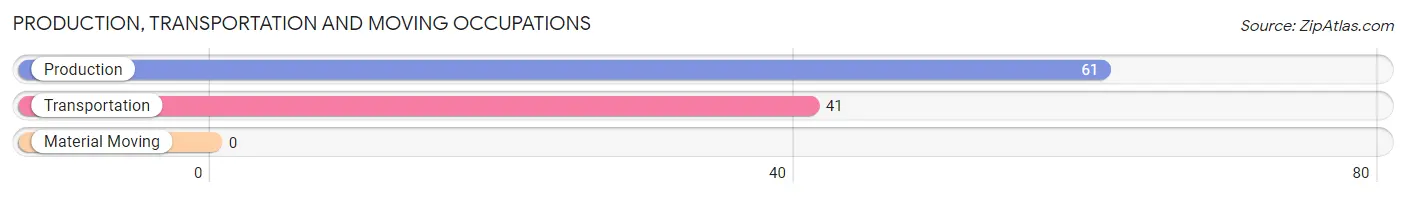
Production, Transportation and Moving Occupations
The most common Production, Transportation and Moving occupations in Berino are Production (61 | 14.2%), and Transportation (41 | 9.6%).
Production, Transportation and Moving Occupations by Sex
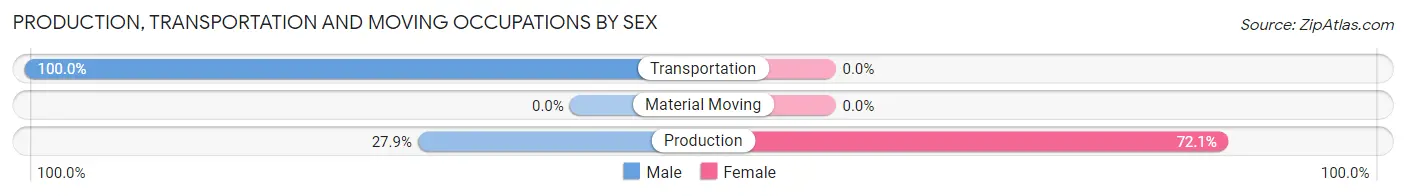
| Occupation | Male | Female |
| Production | 17 (27.9%) | 44 (72.1%) |
| Transportation | 41 (100.0%) | 0 (0.0%) |
| Material Moving | 0 (0.0%) | 0 (0.0%) |
| Total (Category) | 58 (56.9%) | 44 (43.1%) |
| Total (Overall) | 268 (62.6%) | 160 (37.4%) |
Employment Industries by Sex in Berino
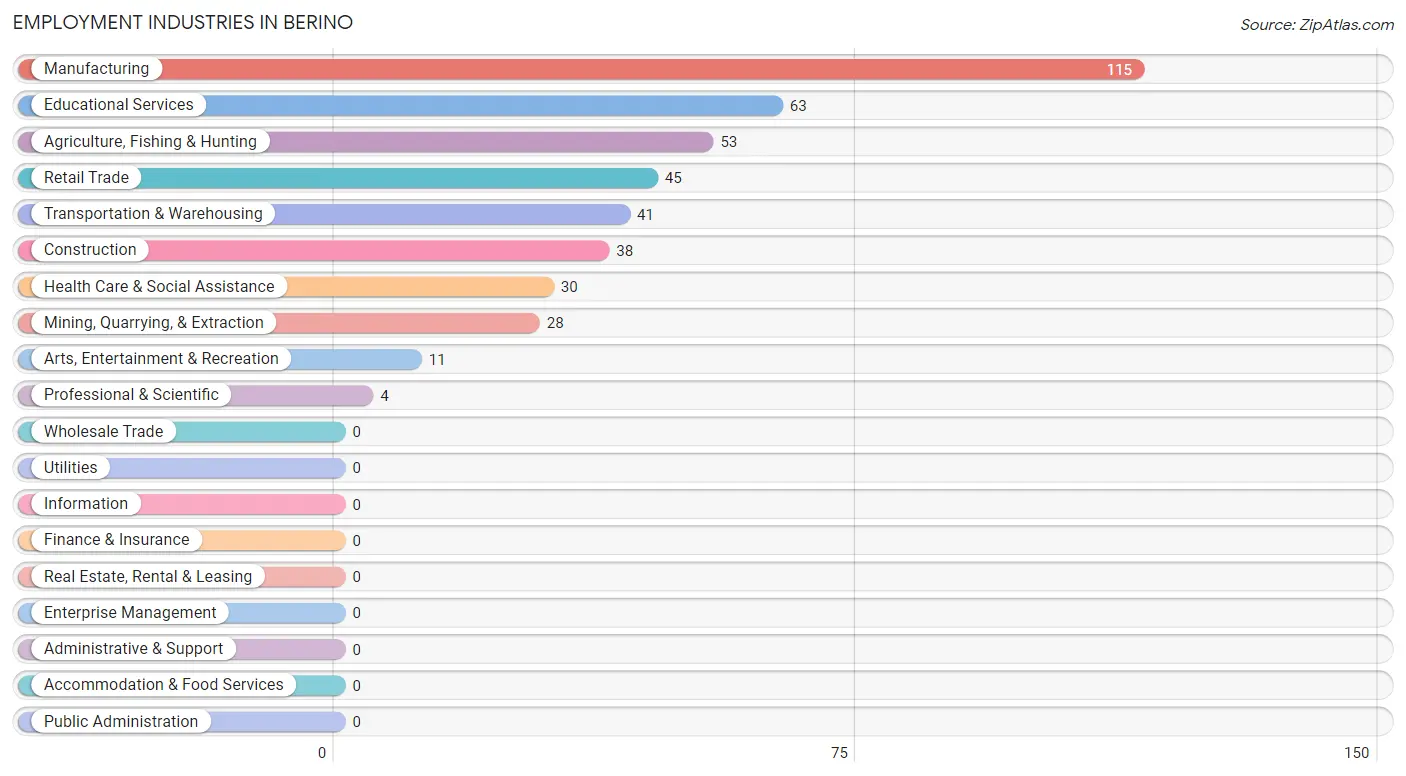
Employment Industries in Berino
The major employment industries in Berino include Manufacturing (115 | 26.9%), Educational Services (63 | 14.7%), Agriculture, Fishing & Hunting (53 | 12.4%), Retail Trade (45 | 10.5%), and Transportation & Warehousing (41 | 9.6%).
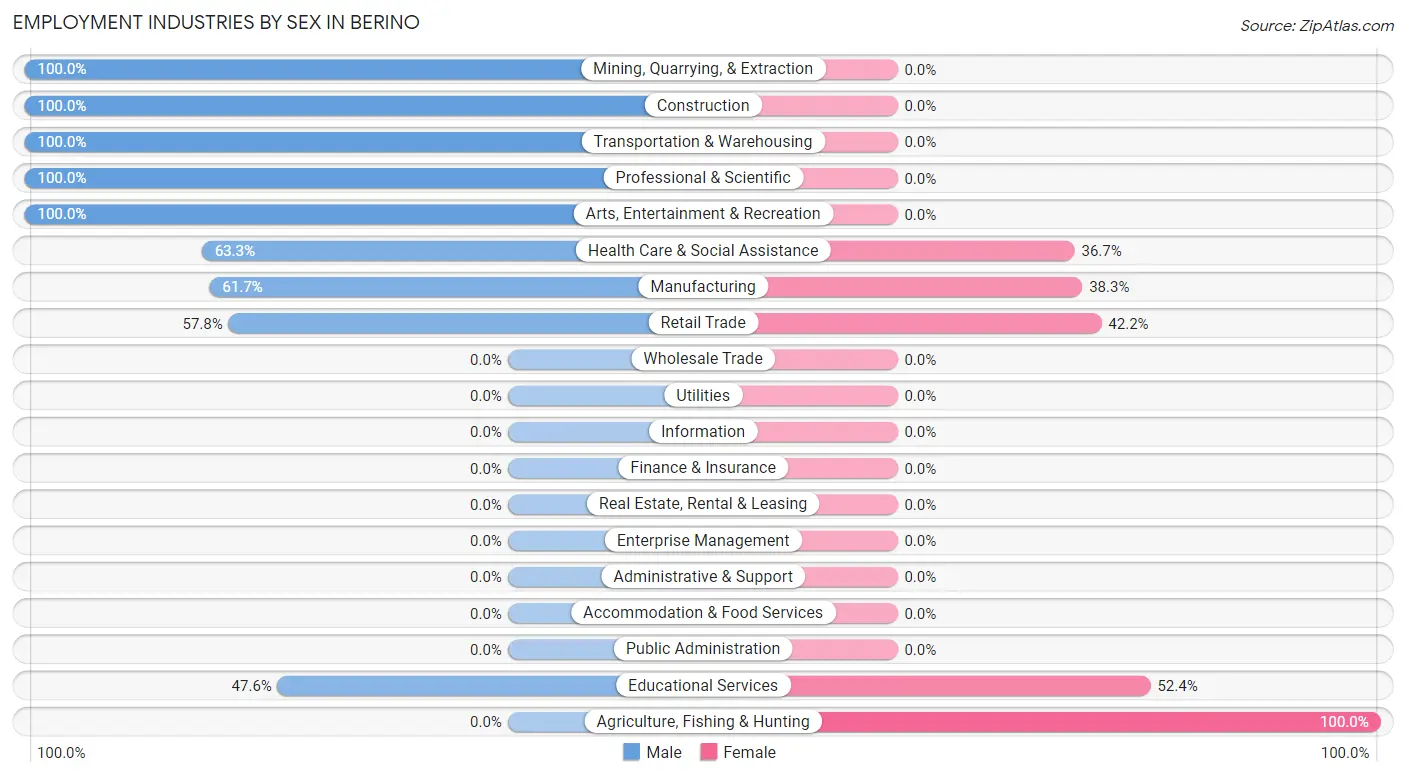
Employment Industries by Sex in Berino
The Berino industries that see more men than women are Mining, Quarrying, & Extraction (100.0%), Construction (100.0%), and Transportation & Warehousing (100.0%), whereas the industries that tend to have a higher number of women are Agriculture, Fishing & Hunting (100.0%), Educational Services (52.4%), and Retail Trade (42.2%).
| Industry | Male | Female |
| Agriculture, Fishing & Hunting | 0 (0.0%) | 53 (100.0%) |
| Mining, Quarrying, & Extraction | 28 (100.0%) | 0 (0.0%) |
| Construction | 38 (100.0%) | 0 (0.0%) |
| Manufacturing | 71 (61.7%) | 44 (38.3%) |
| Wholesale Trade | 0 (0.0%) | 0 (0.0%) |
| Retail Trade | 26 (57.8%) | 19 (42.2%) |
| Transportation & Warehousing | 41 (100.0%) | 0 (0.0%) |
| Utilities | 0 (0.0%) | 0 (0.0%) |
| Information | 0 (0.0%) | 0 (0.0%) |
| Finance & Insurance | 0 (0.0%) | 0 (0.0%) |
| Real Estate, Rental & Leasing | 0 (0.0%) | 0 (0.0%) |
| Professional & Scientific | 4 (100.0%) | 0 (0.0%) |
| Enterprise Management | 0 (0.0%) | 0 (0.0%) |
| Administrative & Support | 0 (0.0%) | 0 (0.0%) |
| Educational Services | 30 (47.6%) | 33 (52.4%) |
| Health Care & Social Assistance | 19 (63.3%) | 11 (36.7%) |
| Arts, Entertainment & Recreation | 11 (100.0%) | 0 (0.0%) |
| Accommodation & Food Services | 0 (0.0%) | 0 (0.0%) |
| Public Administration | 0 (0.0%) | 0 (0.0%) |
| Total | 268 (62.6%) | 160 (37.4%) |
Education in Berino
School Enrollment in Berino
The most common levels of schooling among the 272 students in Berino are elementary school (80 | 29.4%), college / undergraduate (53 | 19.5%), and middle school (52 | 19.1%).
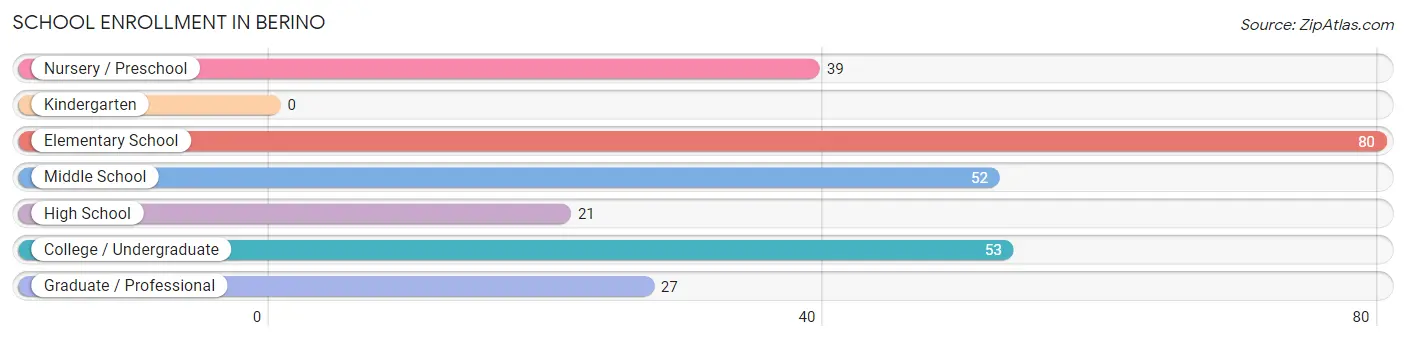
| School Level | # Students | % Students |
| Nursery / Preschool | 39 | 14.3% |
| Kindergarten | 0 | 0.0% |
| Elementary School | 80 | 29.4% |
| Middle School | 52 | 19.1% |
| High School | 21 | 7.7% |
| College / Undergraduate | 53 | 19.5% |
| Graduate / Professional | 27 | 9.9% |
| Total | 272 | 100.0% |
School Enrollment by Age by Funding Source in Berino
Out of a total of 272 students who are enrolled in schools in Berino, 6 (2.2%) attend a private institution, while the remaining 266 (97.8%) are enrolled in public schools. The age group of 20 to 24 year olds has the highest likelihood of being enrolled in private schools, with 6 (15.8% in the age bracket) enrolled. Conversely, the age group of 5 to 9 year old has the lowest likelihood of being enrolled in a private school, with 119 (100.0% in the age bracket) attending a public institution.
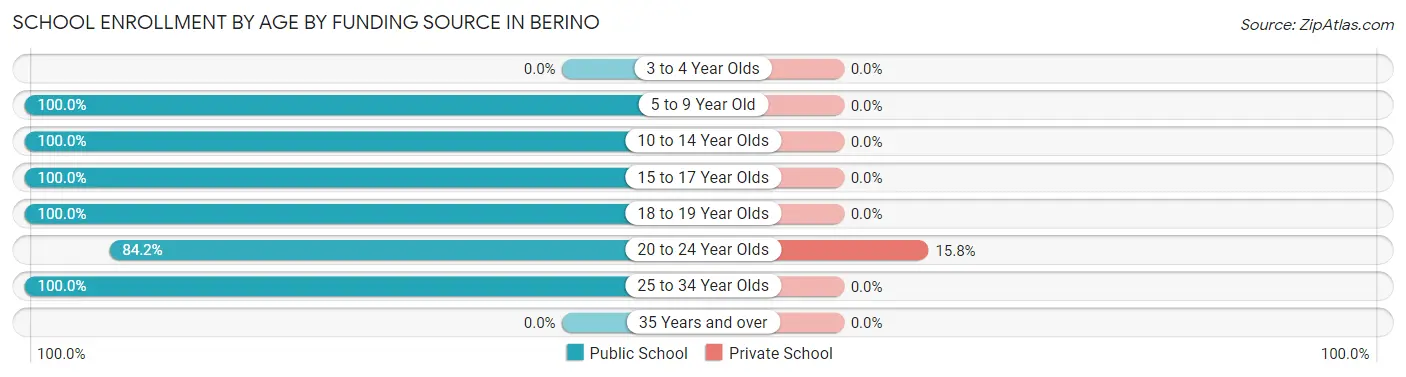
| Age Bracket | Public School | Private School |
| 3 to 4 Year Olds | 0 (0.0%) | 0 (0.0%) |
| 5 to 9 Year Old | 119 (100.0%) | 0 (0.0%) |
| 10 to 14 Year Olds | 52 (100.0%) | 0 (0.0%) |
| 15 to 17 Year Olds | 21 (100.0%) | 0 (0.0%) |
| 18 to 19 Year Olds | 3 (100.0%) | 0 (0.0%) |
| 20 to 24 Year Olds | 32 (84.2%) | 6 (15.8%) |
| 25 to 34 Year Olds | 39 (100.0%) | 0 (0.0%) |
| 35 Years and over | 0 (0.0%) | 0 (0.0%) |
| Total | 266 (97.8%) | 6 (2.2%) |
Educational Attainment by Field of Study in Berino
Psychology (36 | 41.4%), social sciences (26 | 29.9%), bio, nature & agricultural (12 | 13.8%), literature & languages (9 | 10.3%), and business (4 | 4.6%) are the most common fields of study among 87 individuals in Berino who have obtained a bachelor's degree or higher.
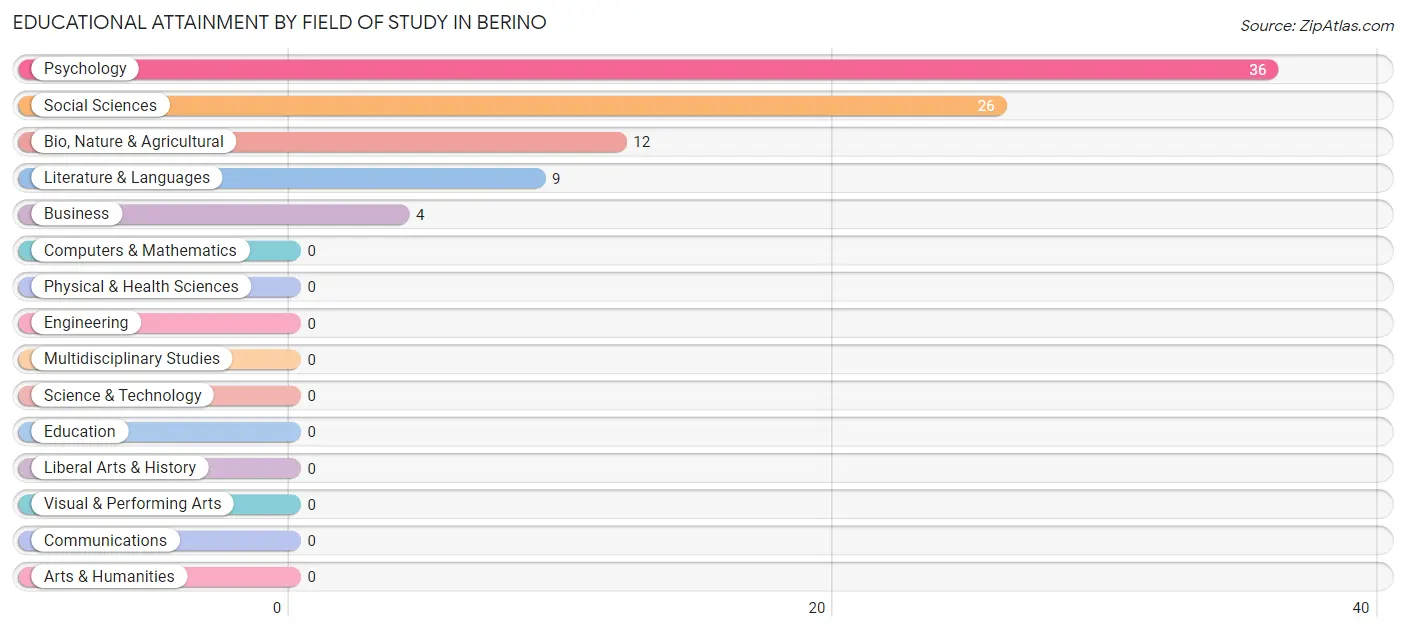
| Field of Study | # Graduates | % Graduates |
| Computers & Mathematics | 0 | 0.0% |
| Bio, Nature & Agricultural | 12 | 13.8% |
| Physical & Health Sciences | 0 | 0.0% |
| Psychology | 36 | 41.4% |
| Social Sciences | 26 | 29.9% |
| Engineering | 0 | 0.0% |
| Multidisciplinary Studies | 0 | 0.0% |
| Science & Technology | 0 | 0.0% |
| Business | 4 | 4.6% |
| Education | 0 | 0.0% |
| Literature & Languages | 9 | 10.3% |
| Liberal Arts & History | 0 | 0.0% |
| Visual & Performing Arts | 0 | 0.0% |
| Communications | 0 | 0.0% |
| Arts & Humanities | 0 | 0.0% |
| Total | 87 | 100.0% |
Transportation & Commute in Berino
Vehicle Availability by Sex in Berino
The most prevalent vehicle ownership categories in Berino are males with 2 vehicles (109, accounting for 45.4%) and females with 2 vehicles (11, making up 68.1%).
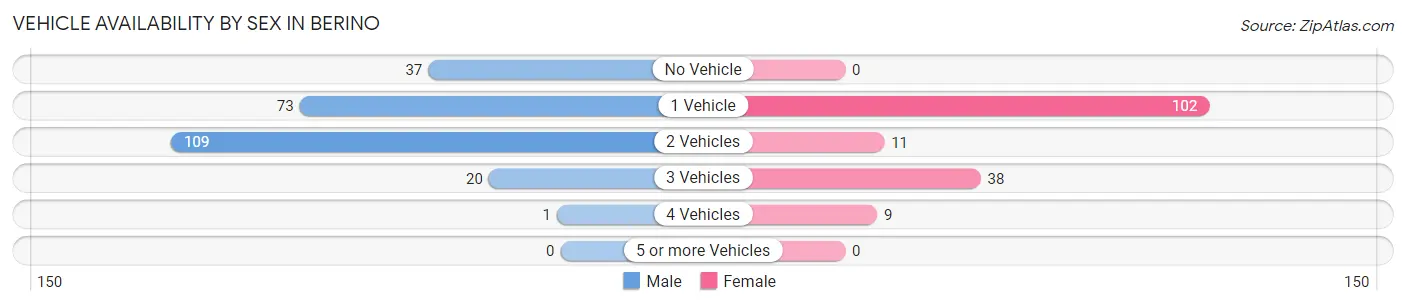
| Vehicles Available | Male | Female |
| No Vehicle | 37 (15.4%) | 0 (0.0%) |
| 1 Vehicle | 73 (30.4%) | 102 (63.7%) |
| 2 Vehicles | 109 (45.4%) | 11 (6.9%) |
| 3 Vehicles | 20 (8.3%) | 38 (23.7%) |
| 4 Vehicles | 1 (0.4%) | 9 (5.6%) |
| 5 or more Vehicles | 0 (0.0%) | 0 (0.0%) |
| Total | 240 (100.0%) | 160 (100.0%) |
Commute Time in Berino
The most frequently occuring commute durations in Berino are 20 to 24 minutes (108 commuters, 28.3%), 15 to 19 minutes (69 commuters, 18.1%), and 40 to 44 minutes (62 commuters, 16.3%).
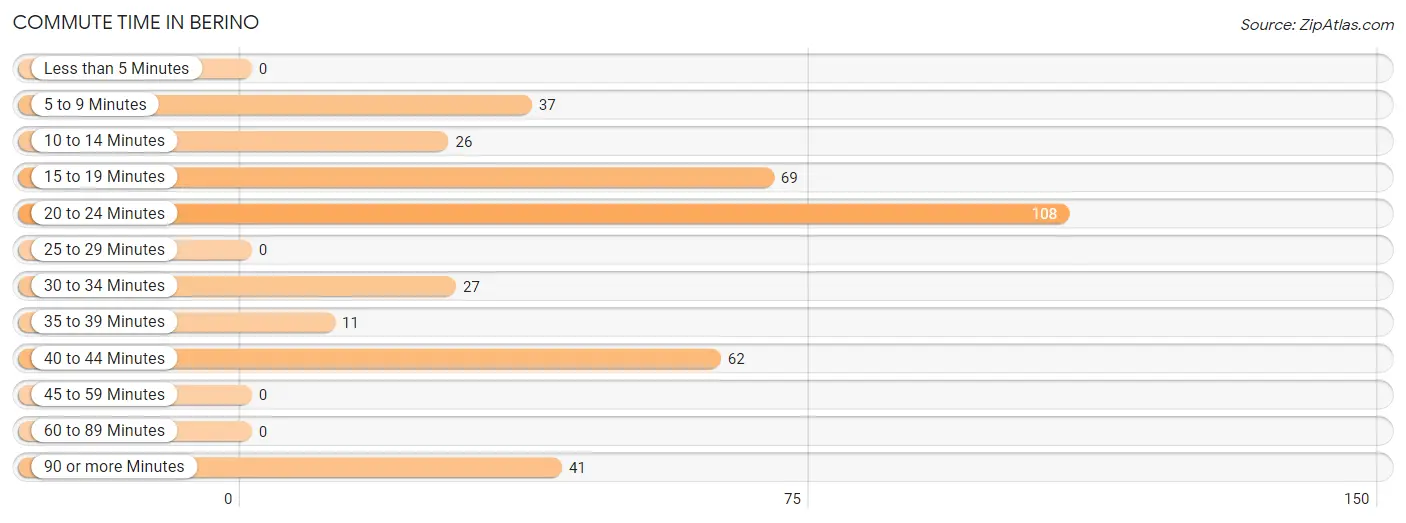
| Commute Time | # Commuters | % Commuters |
| Less than 5 Minutes | 0 | 0.0% |
| 5 to 9 Minutes | 37 | 9.7% |
| 10 to 14 Minutes | 26 | 6.8% |
| 15 to 19 Minutes | 69 | 18.1% |
| 20 to 24 Minutes | 108 | 28.3% |
| 25 to 29 Minutes | 0 | 0.0% |
| 30 to 34 Minutes | 27 | 7.1% |
| 35 to 39 Minutes | 11 | 2.9% |
| 40 to 44 Minutes | 62 | 16.3% |
| 45 to 59 Minutes | 0 | 0.0% |
| 60 to 89 Minutes | 0 | 0.0% |
| 90 or more Minutes | 41 | 10.8% |
Commute Time by Sex in Berino
The most common commute times in Berino are 20 to 24 minutes (68 commuters, 30.8%) for males and 40 to 44 minutes (62 commuters, 38.8%) for females.
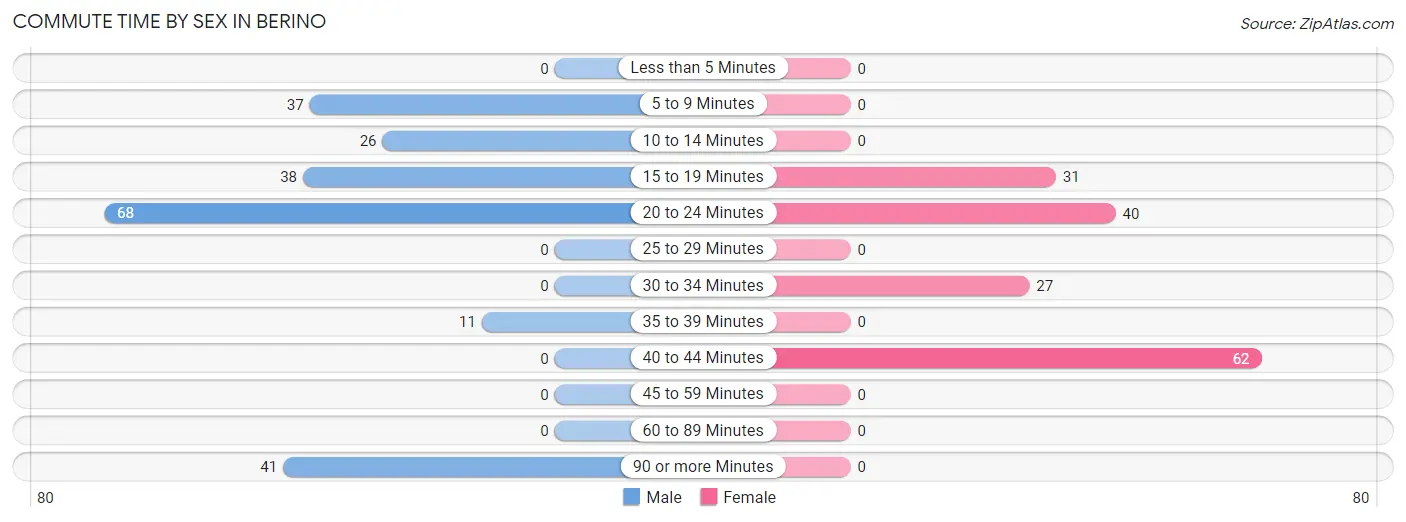
| Commute Time | Male | Female |
| Less than 5 Minutes | 0 (0.0%) | 0 (0.0%) |
| 5 to 9 Minutes | 37 (16.7%) | 0 (0.0%) |
| 10 to 14 Minutes | 26 (11.8%) | 0 (0.0%) |
| 15 to 19 Minutes | 38 (17.2%) | 31 (19.4%) |
| 20 to 24 Minutes | 68 (30.8%) | 40 (25.0%) |
| 25 to 29 Minutes | 0 (0.0%) | 0 (0.0%) |
| 30 to 34 Minutes | 0 (0.0%) | 27 (16.9%) |
| 35 to 39 Minutes | 11 (5.0%) | 0 (0.0%) |
| 40 to 44 Minutes | 0 (0.0%) | 62 (38.8%) |
| 45 to 59 Minutes | 0 (0.0%) | 0 (0.0%) |
| 60 to 89 Minutes | 0 (0.0%) | 0 (0.0%) |
| 90 or more Minutes | 41 (18.5%) | 0 (0.0%) |
Time of Departure to Work by Sex in Berino
The most frequent times of departure to work in Berino are 4:00 PM to 11:59 PM (44, 19.9%) for males and 6:30 AM to 6:59 AM (53, 33.1%) for females.
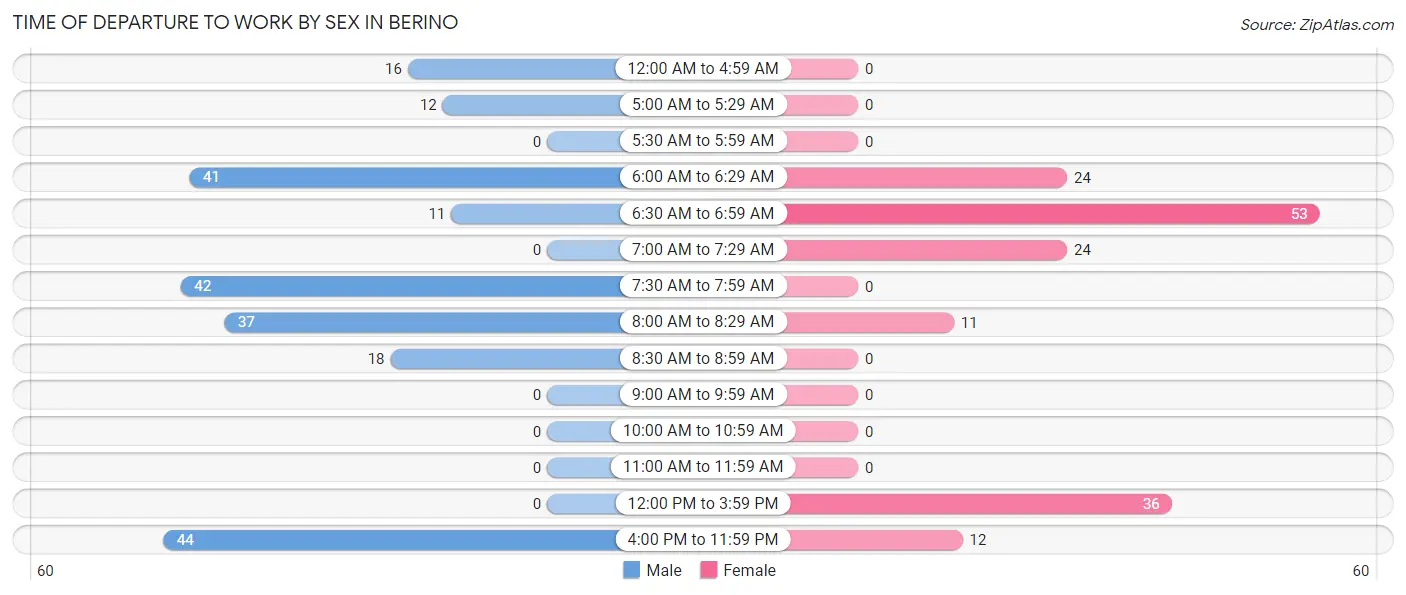
| Time of Departure | Male | Female |
| 12:00 AM to 4:59 AM | 16 (7.2%) | 0 (0.0%) |
| 5:00 AM to 5:29 AM | 12 (5.4%) | 0 (0.0%) |
| 5:30 AM to 5:59 AM | 0 (0.0%) | 0 (0.0%) |
| 6:00 AM to 6:29 AM | 41 (18.5%) | 24 (15.0%) |
| 6:30 AM to 6:59 AM | 11 (5.0%) | 53 (33.1%) |
| 7:00 AM to 7:29 AM | 0 (0.0%) | 24 (15.0%) |
| 7:30 AM to 7:59 AM | 42 (19.0%) | 0 (0.0%) |
| 8:00 AM to 8:29 AM | 37 (16.7%) | 11 (6.9%) |
| 8:30 AM to 8:59 AM | 18 (8.1%) | 0 (0.0%) |
| 9:00 AM to 9:59 AM | 0 (0.0%) | 0 (0.0%) |
| 10:00 AM to 10:59 AM | 0 (0.0%) | 0 (0.0%) |
| 11:00 AM to 11:59 AM | 0 (0.0%) | 0 (0.0%) |
| 12:00 PM to 3:59 PM | 0 (0.0%) | 36 (22.5%) |
| 4:00 PM to 11:59 PM | 44 (19.9%) | 12 (7.5%) |
| Total | 221 (100.0%) | 160 (100.0%) |
Housing Occupancy in Berino
Occupancy by Ownership in Berino
Of the total 461 dwellings in Berino, owner-occupied units account for 324 (70.3%), while renter-occupied units make up 137 (29.7%).
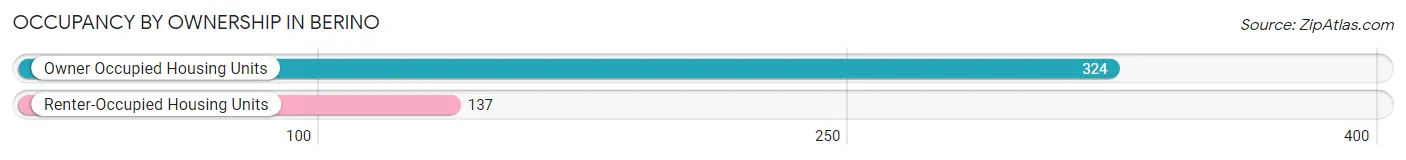
| Occupancy | # Housing Units | % Housing Units |
| Owner Occupied Housing Units | 324 | 70.3% |
| Renter-Occupied Housing Units | 137 | 29.7% |
| Total Occupied Housing Units | 461 | 100.0% |
Occupancy by Household Size in Berino
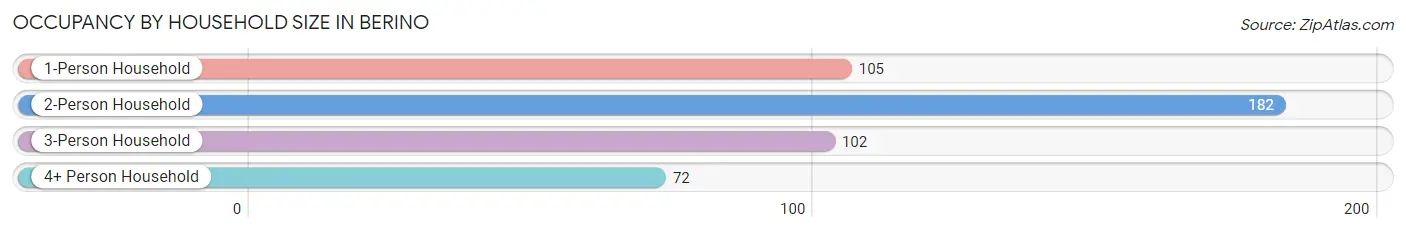
| Household Size | # Housing Units | % Housing Units |
| 1-Person Household | 105 | 22.8% |
| 2-Person Household | 182 | 39.5% |
| 3-Person Household | 102 | 22.1% |
| 4+ Person Household | 72 | 15.6% |
| Total Housing Units | 461 | 100.0% |
Occupancy by Ownership by Household Size in Berino
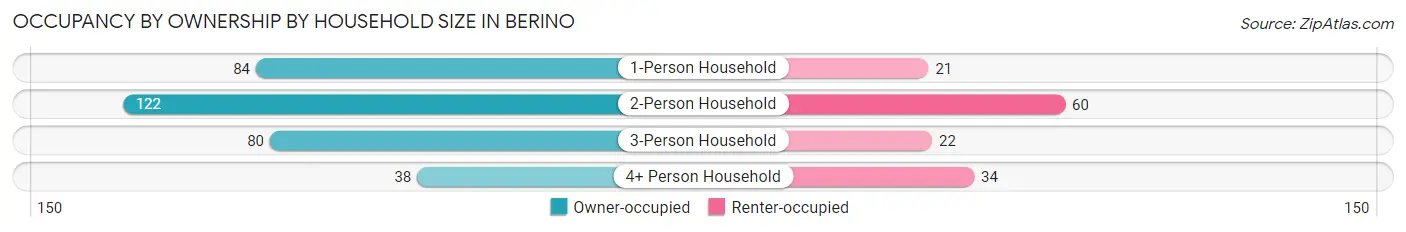
| Household Size | Owner-occupied | Renter-occupied |
| 1-Person Household | 84 (80.0%) | 21 (20.0%) |
| 2-Person Household | 122 (67.0%) | 60 (33.0%) |
| 3-Person Household | 80 (78.4%) | 22 (21.6%) |
| 4+ Person Household | 38 (52.8%) | 34 (47.2%) |
| Total Housing Units | 324 (70.3%) | 137 (29.7%) |
Occupancy by Educational Attainment in Berino
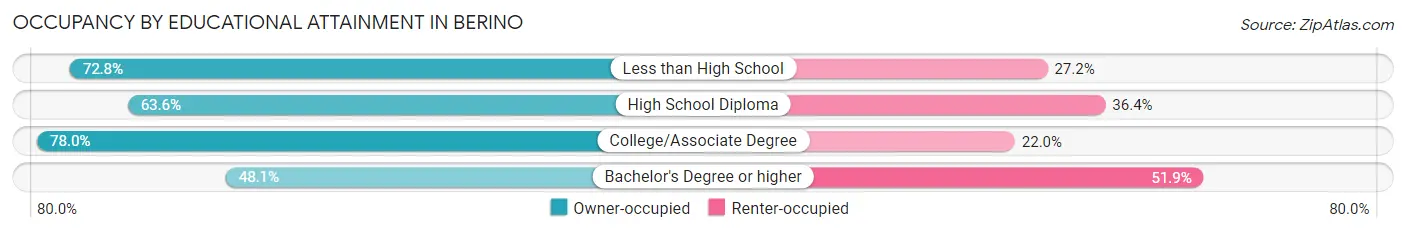
| Household Size | Owner-occupied | Renter-occupied |
| Less than High School | 193 (72.8%) | 72 (27.2%) |
| High School Diploma | 28 (63.6%) | 16 (36.4%) |
| College/Associate Degree | 78 (78.0%) | 22 (22.0%) |
| Bachelor's Degree or higher | 25 (48.1%) | 27 (51.9%) |
Occupancy by Age of Householder in Berino
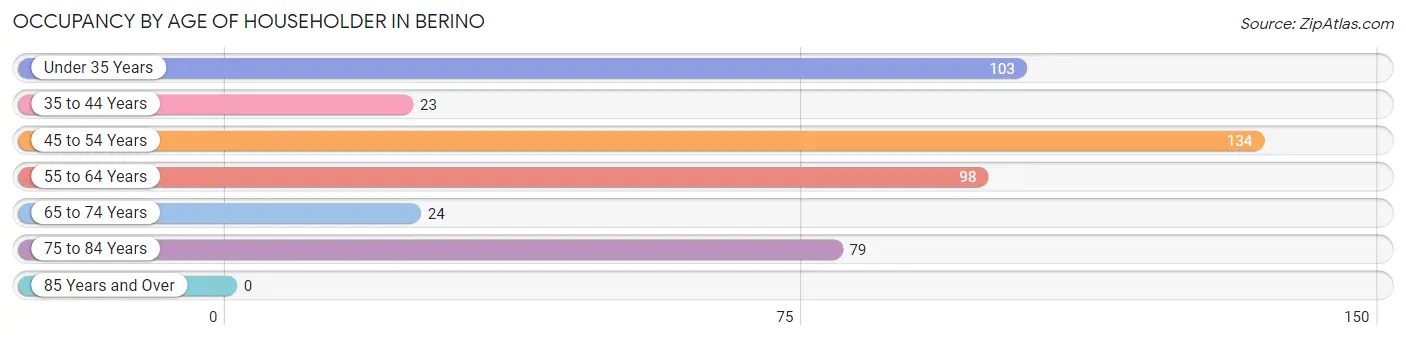
| Age Bracket | # Households | % Households |
| Under 35 Years | 103 | 22.3% |
| 35 to 44 Years | 23 | 5.0% |
| 45 to 54 Years | 134 | 29.1% |
| 55 to 64 Years | 98 | 21.3% |
| 65 to 74 Years | 24 | 5.2% |
| 75 to 84 Years | 79 | 17.1% |
| 85 Years and Over | 0 | 0.0% |
| Total | 461 | 100.0% |
Housing Finances in Berino
Median Income by Occupancy in Berino
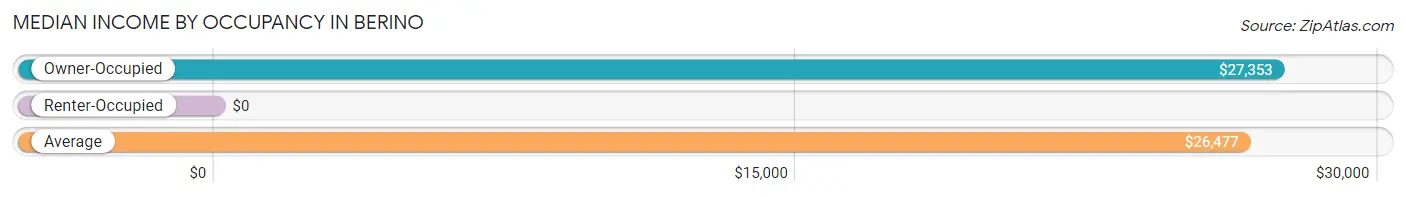
| Occupancy Type | # Households | Median Income |
| Owner-Occupied | 324 (70.3%) | $27,353 |
| Renter-Occupied | 137 (29.7%) | $0 |
| Average | 461 (100.0%) | $26,477 |
Occupancy by Householder Income Bracket in Berino
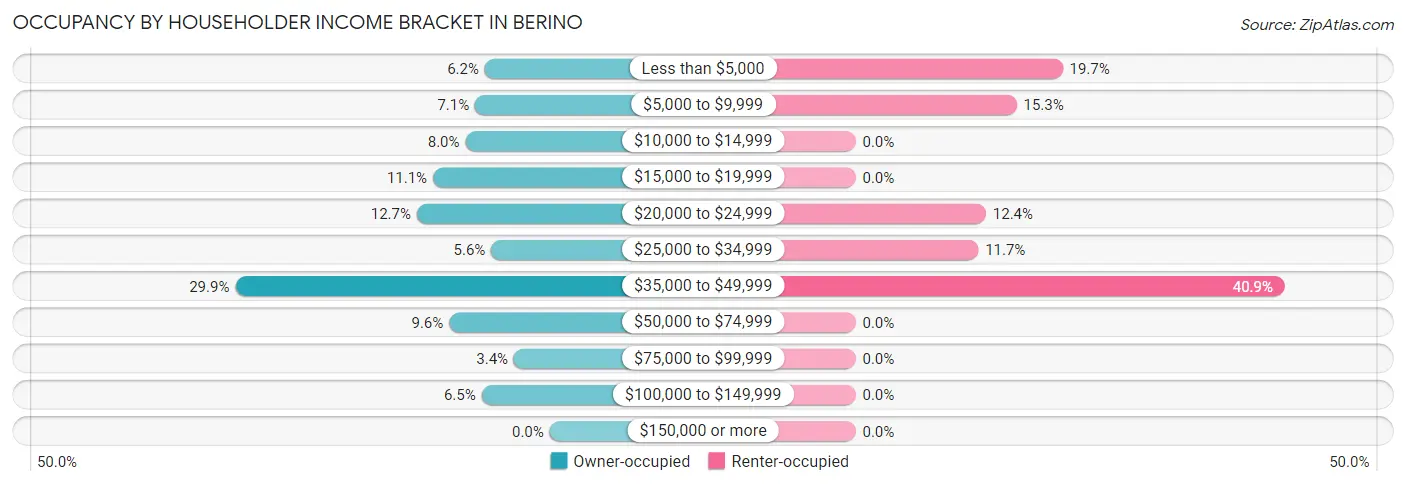
| Income Bracket | Owner-occupied | Renter-occupied |
| Less than $5,000 | 20 (6.2%) | 27 (19.7%) |
| $5,000 to $9,999 | 23 (7.1%) | 21 (15.3%) |
| $10,000 to $14,999 | 26 (8.0%) | 0 (0.0%) |
| $15,000 to $19,999 | 36 (11.1%) | 0 (0.0%) |
| $20,000 to $24,999 | 41 (12.7%) | 17 (12.4%) |
| $25,000 to $34,999 | 18 (5.6%) | 16 (11.7%) |
| $35,000 to $49,999 | 97 (29.9%) | 56 (40.9%) |
| $50,000 to $74,999 | 31 (9.6%) | 0 (0.0%) |
| $75,000 to $99,999 | 11 (3.4%) | 0 (0.0%) |
| $100,000 to $149,999 | 21 (6.5%) | 0 (0.0%) |
| $150,000 or more | 0 (0.0%) | 0 (0.0%) |
| Total | 324 (100.0%) | 137 (100.0%) |
Monthly Housing Cost Tiers in Berino
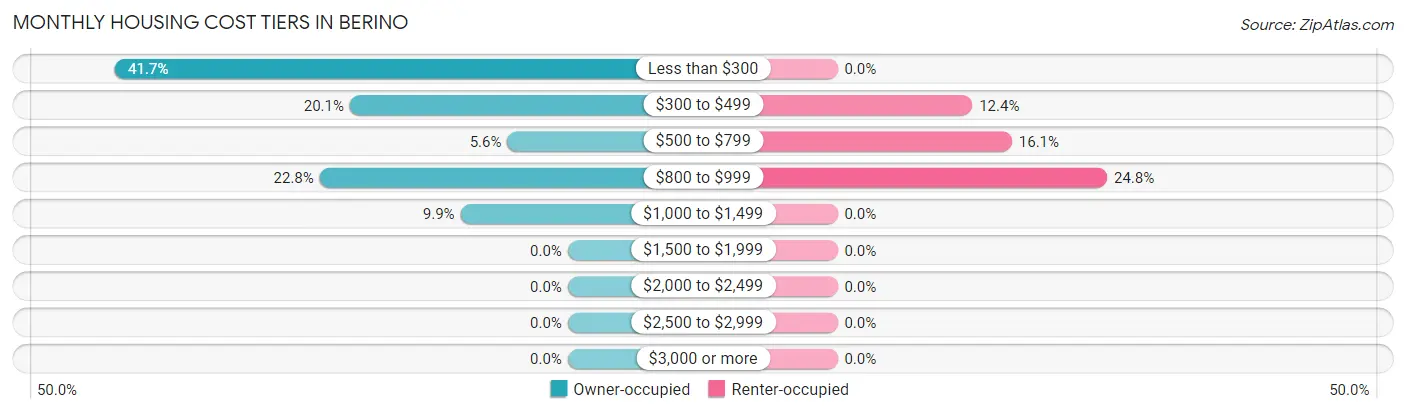
| Monthly Cost | Owner-occupied | Renter-occupied |
| Less than $300 | 135 (41.7%) | 0 (0.0%) |
| $300 to $499 | 65 (20.1%) | 17 (12.4%) |
| $500 to $799 | 18 (5.6%) | 22 (16.1%) |
| $800 to $999 | 74 (22.8%) | 34 (24.8%) |
| $1,000 to $1,499 | 32 (9.9%) | 0 (0.0%) |
| $1,500 to $1,999 | 0 (0.0%) | 0 (0.0%) |
| $2,000 to $2,499 | 0 (0.0%) | 0 (0.0%) |
| $2,500 to $2,999 | 0 (0.0%) | 0 (0.0%) |
| $3,000 or more | 0 (0.0%) | 0 (0.0%) |
| Total | 324 (100.0%) | 137 (100.0%) |
Physical Housing Characteristics in Berino
Housing Structures in Berino
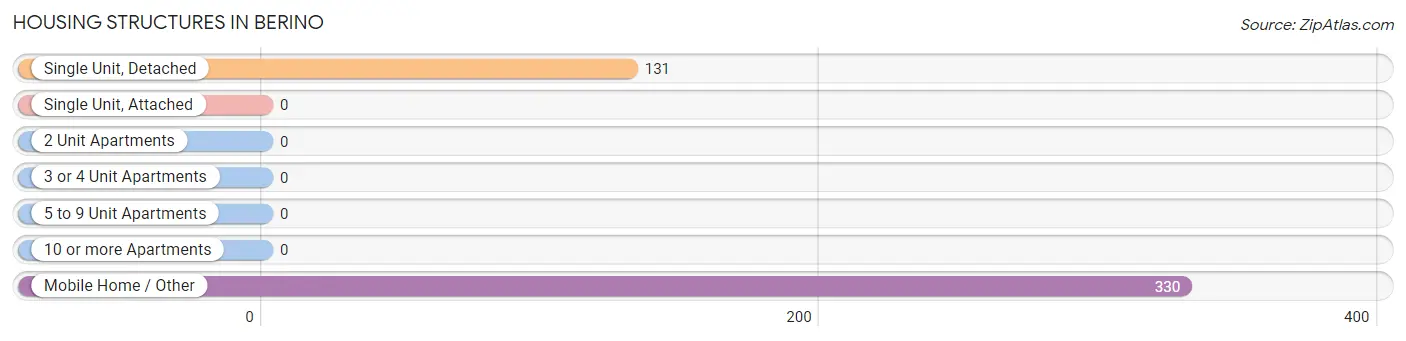
| Structure Type | # Housing Units | % Housing Units |
| Single Unit, Detached | 131 | 28.4% |
| Single Unit, Attached | 0 | 0.0% |
| 2 Unit Apartments | 0 | 0.0% |
| 3 or 4 Unit Apartments | 0 | 0.0% |
| 5 to 9 Unit Apartments | 0 | 0.0% |
| 10 or more Apartments | 0 | 0.0% |
| Mobile Home / Other | 330 | 71.6% |
| Total | 461 | 100.0% |
Housing Structures by Occupancy in Berino
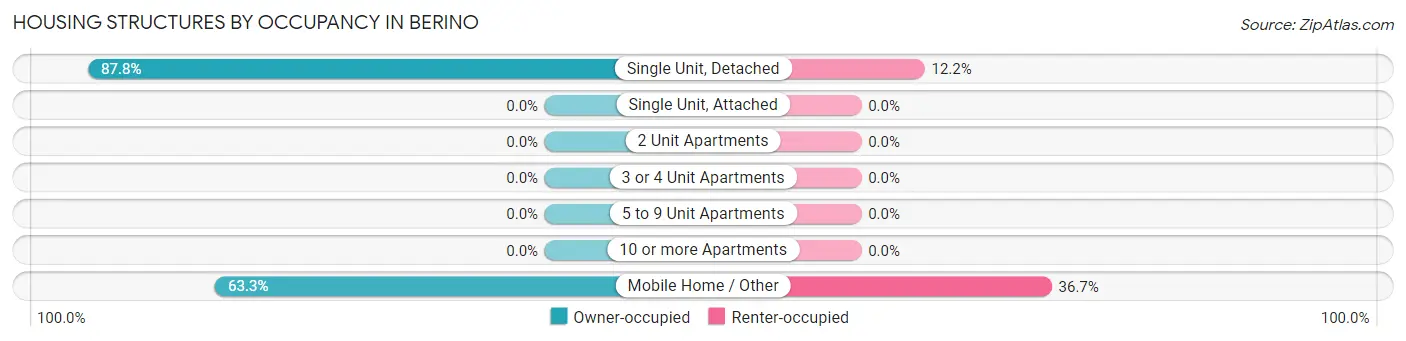
| Structure Type | Owner-occupied | Renter-occupied |
| Single Unit, Detached | 115 (87.8%) | 16 (12.2%) |
| Single Unit, Attached | 0 (0.0%) | 0 (0.0%) |
| 2 Unit Apartments | 0 (0.0%) | 0 (0.0%) |
| 3 or 4 Unit Apartments | 0 (0.0%) | 0 (0.0%) |
| 5 to 9 Unit Apartments | 0 (0.0%) | 0 (0.0%) |
| 10 or more Apartments | 0 (0.0%) | 0 (0.0%) |
| Mobile Home / Other | 209 (63.3%) | 121 (36.7%) |
| Total | 324 (70.3%) | 137 (29.7%) |
Housing Structures by Number of Rooms in Berino
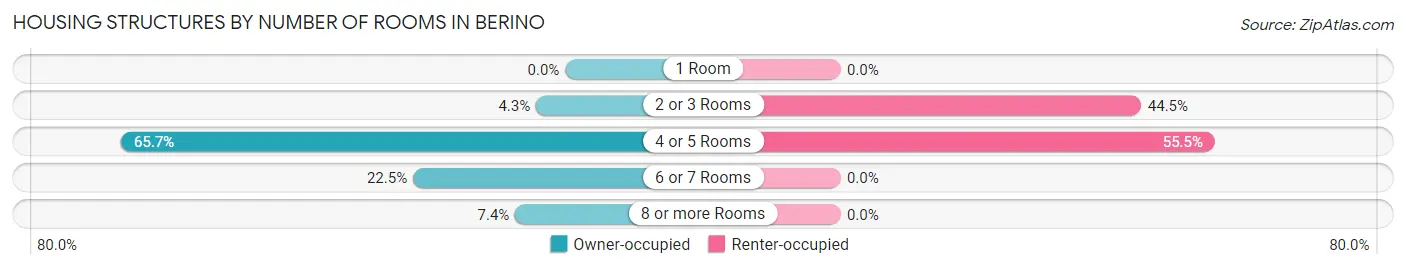
| Number of Rooms | Owner-occupied | Renter-occupied |
| 1 Room | 0 (0.0%) | 0 (0.0%) |
| 2 or 3 Rooms | 14 (4.3%) | 61 (44.5%) |
| 4 or 5 Rooms | 213 (65.7%) | 76 (55.5%) |
| 6 or 7 Rooms | 73 (22.5%) | 0 (0.0%) |
| 8 or more Rooms | 24 (7.4%) | 0 (0.0%) |
| Total | 324 (100.0%) | 137 (100.0%) |
Housing Structure by Heating Type in Berino
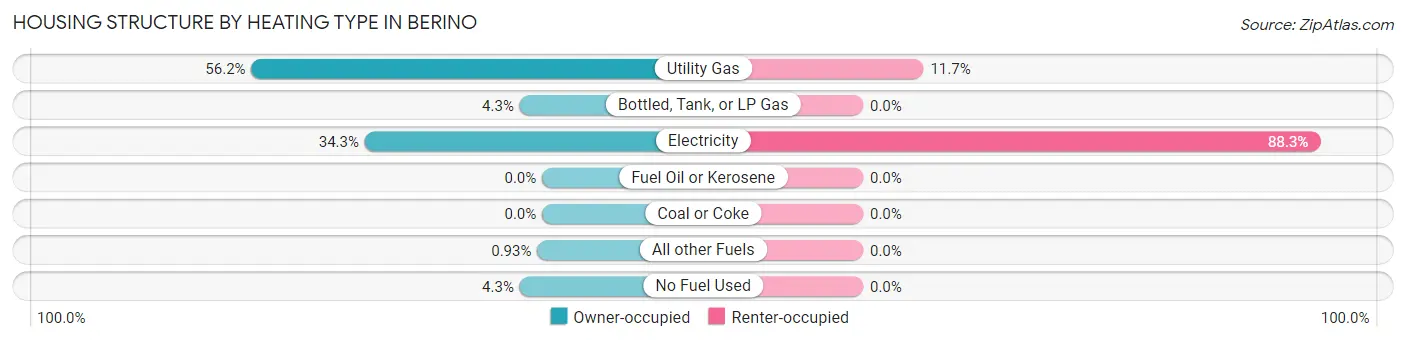
| Heating Type | Owner-occupied | Renter-occupied |
| Utility Gas | 182 (56.2%) | 16 (11.7%) |
| Bottled, Tank, or LP Gas | 14 (4.3%) | 0 (0.0%) |
| Electricity | 111 (34.3%) | 121 (88.3%) |
| Fuel Oil or Kerosene | 0 (0.0%) | 0 (0.0%) |
| Coal or Coke | 0 (0.0%) | 0 (0.0%) |
| All other Fuels | 3 (0.9%) | 0 (0.0%) |
| No Fuel Used | 14 (4.3%) | 0 (0.0%) |
| Total | 324 (100.0%) | 137 (100.0%) |
Household Vehicle Usage in Berino
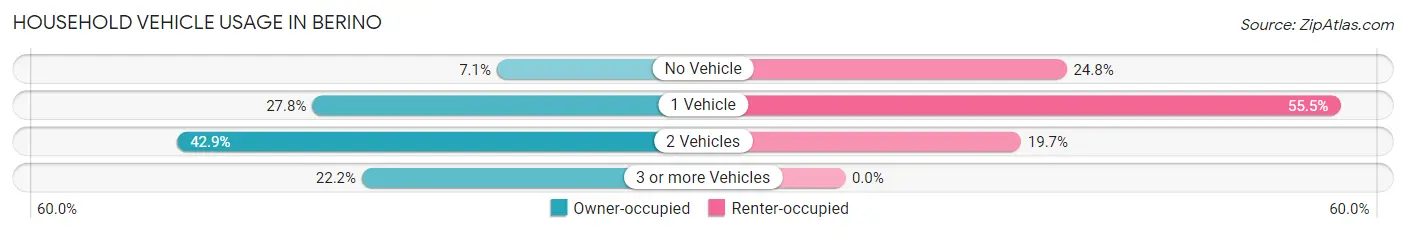
| Vehicles per Household | Owner-occupied | Renter-occupied |
| No Vehicle | 23 (7.1%) | 34 (24.8%) |
| 1 Vehicle | 90 (27.8%) | 76 (55.5%) |
| 2 Vehicles | 139 (42.9%) | 27 (19.7%) |
| 3 or more Vehicles | 72 (22.2%) | 0 (0.0%) |
| Total | 324 (100.0%) | 137 (100.0%) |
Real Estate & Mortgages in Berino
Real Estate and Mortgage Overview in Berino
| Characteristic | Without Mortgage | With Mortgage |
| Housing Units | 200 | 124 |
| Median Property Value | $53,700 | $128,900 |
| Median Household Income | $25,882 | $0 |
| Monthly Housing Costs | $256 | $0 |
| Real Estate Taxes | $357 | $0 |
Property Value by Mortgage Status in Berino
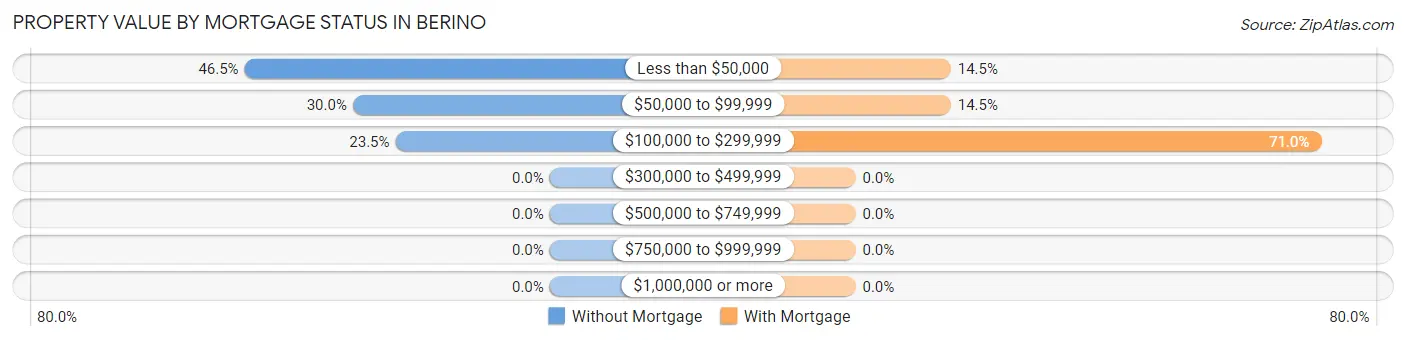
| Property Value | Without Mortgage | With Mortgage |
| Less than $50,000 | 93 (46.5%) | 18 (14.5%) |
| $50,000 to $99,999 | 60 (30.0%) | 18 (14.5%) |
| $100,000 to $299,999 | 47 (23.5%) | 88 (71.0%) |
| $300,000 to $499,999 | 0 (0.0%) | 0 (0.0%) |
| $500,000 to $749,999 | 0 (0.0%) | 0 (0.0%) |
| $750,000 to $999,999 | 0 (0.0%) | 0 (0.0%) |
| $1,000,000 or more | 0 (0.0%) | 0 (0.0%) |
| Total | 200 (100.0%) | 124 (100.0%) |
Household Income by Mortgage Status in Berino
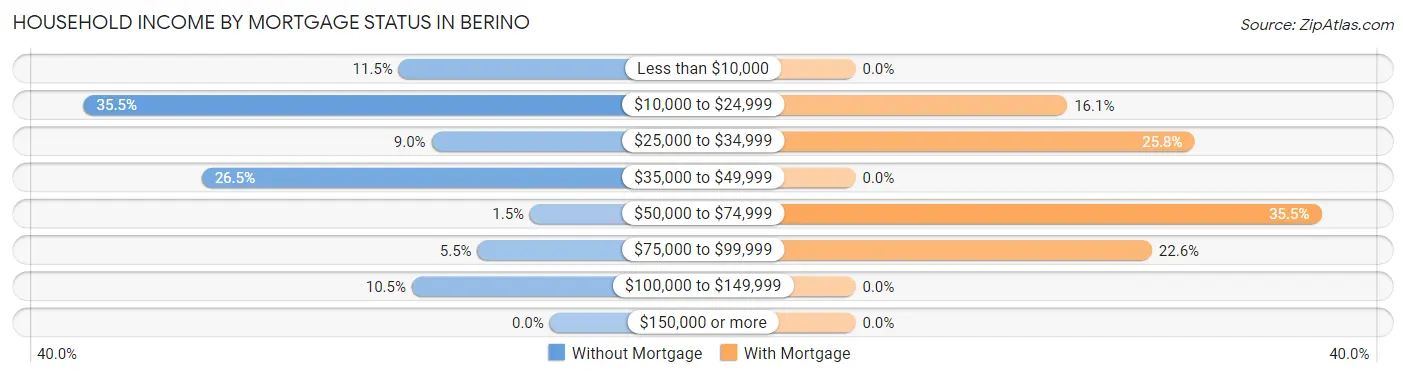
| Household Income | Without Mortgage | With Mortgage |
| Less than $10,000 | 23 (11.5%) | 0 (0.0%) |
| $10,000 to $24,999 | 71 (35.5%) | 20 (16.1%) |
| $25,000 to $34,999 | 18 (9.0%) | 32 (25.8%) |
| $35,000 to $49,999 | 53 (26.5%) | 0 (0.0%) |
| $50,000 to $74,999 | 3 (1.5%) | 44 (35.5%) |
| $75,000 to $99,999 | 11 (5.5%) | 28 (22.6%) |
| $100,000 to $149,999 | 21 (10.5%) | 0 (0.0%) |
| $150,000 or more | 0 (0.0%) | 0 (0.0%) |
| Total | 200 (100.0%) | 124 (100.0%) |
Property Value to Household Income Ratio in Berino
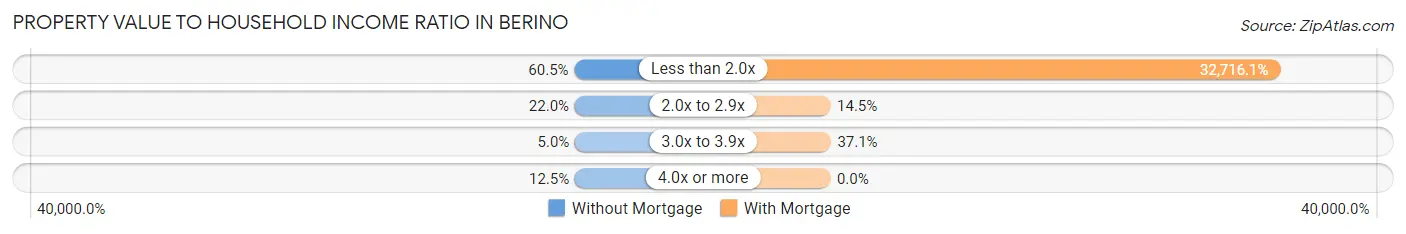
| Value-to-Income Ratio | Without Mortgage | With Mortgage |
| Less than 2.0x | 121 (60.5%) | 40,568 (32,716.1%) |
| 2.0x to 2.9x | 44 (22.0%) | 18 (14.5%) |
| 3.0x to 3.9x | 10 (5.0%) | 46 (37.1%) |
| 4.0x or more | 25 (12.5%) | 0 (0.0%) |
| Total | 200 (100.0%) | 124 (100.0%) |
Real Estate Taxes by Mortgage Status in Berino
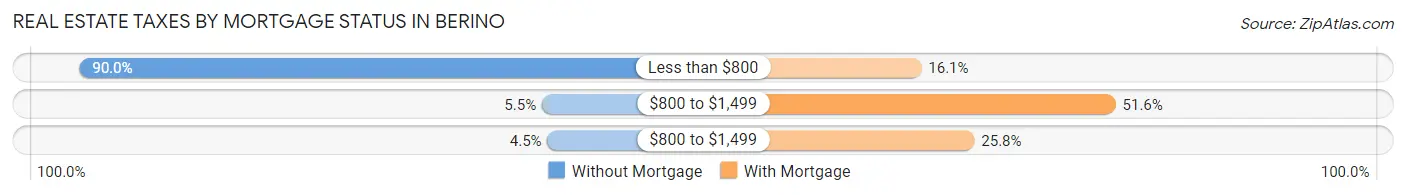
| Property Taxes | Without Mortgage | With Mortgage |
| Less than $800 | 180 (90.0%) | 20 (16.1%) |
| $800 to $1,499 | 11 (5.5%) | 64 (51.6%) |
| $800 to $1,499 | 9 (4.5%) | 32 (25.8%) |
| Total | 200 (100.0%) | 124 (100.0%) |
Health & Disability in Berino
Health Insurance Coverage by Age in Berino
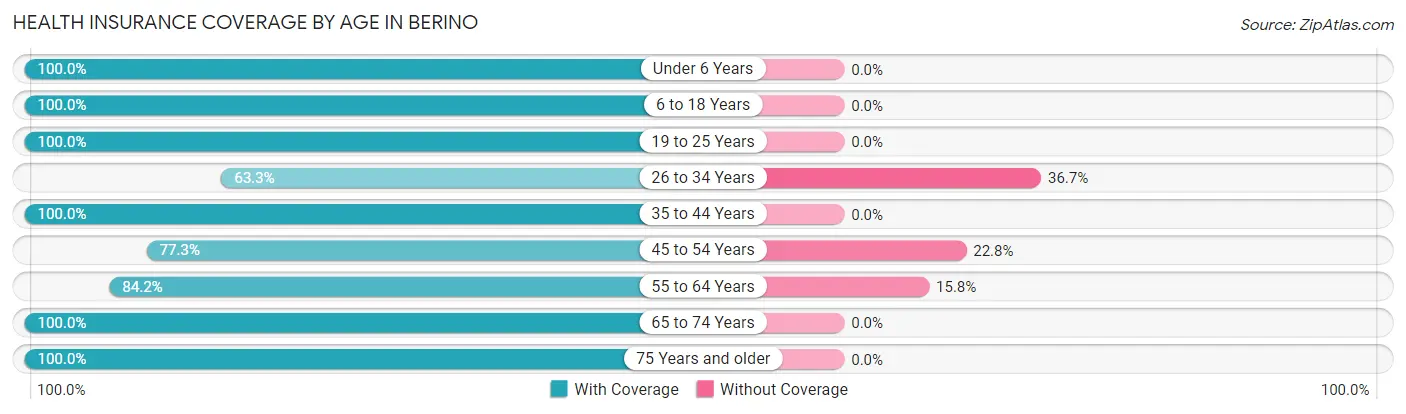
| Age Bracket | With Coverage | Without Coverage |
| Under 6 Years | 51 (100.0%) | 0 (0.0%) |
| 6 to 18 Years | 156 (100.0%) | 0 (0.0%) |
| 19 to 25 Years | 96 (100.0%) | 0 (0.0%) |
| 26 to 34 Years | 226 (63.3%) | 131 (36.7%) |
| 35 to 44 Years | 33 (100.0%) | 0 (0.0%) |
| 45 to 54 Years | 163 (77.2%) | 48 (22.8%) |
| 55 to 64 Years | 149 (84.2%) | 28 (15.8%) |
| 65 to 74 Years | 68 (100.0%) | 0 (0.0%) |
| 75 Years and older | 101 (100.0%) | 0 (0.0%) |
| Total | 1,043 (83.4%) | 207 (16.6%) |
Health Insurance Coverage by Citizenship Status in Berino
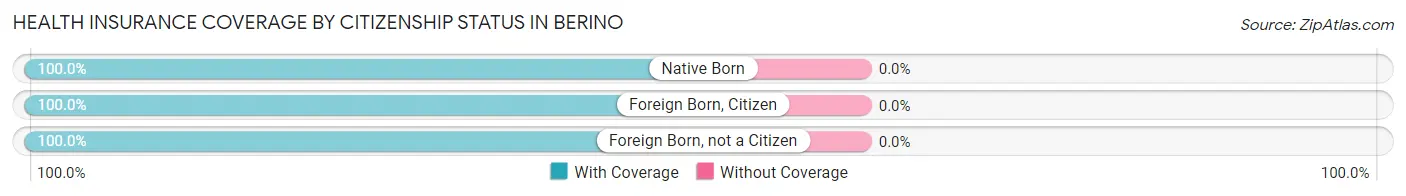
| Citizenship Status | With Coverage | Without Coverage |
| Native Born | 51 (100.0%) | 0 (0.0%) |
| Foreign Born, Citizen | 156 (100.0%) | 0 (0.0%) |
| Foreign Born, not a Citizen | 96 (100.0%) | 0 (0.0%) |
Health Insurance Coverage by Household Income in Berino
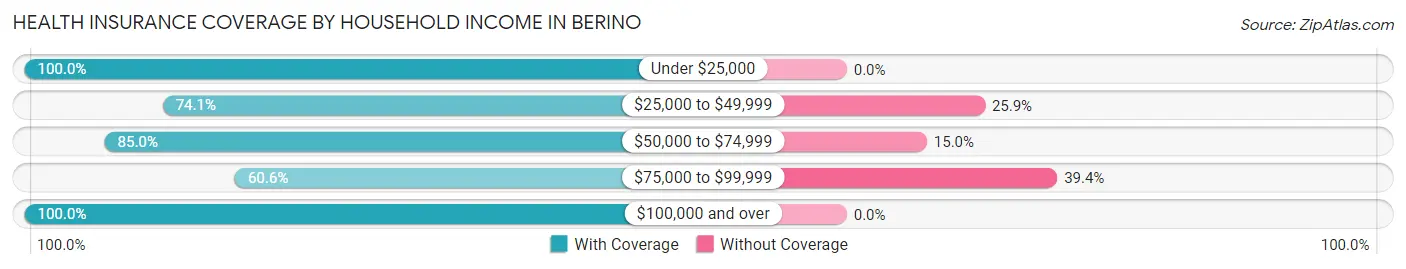
| Household Income | With Coverage | Without Coverage |
| Under $25,000 | 402 (100.0%) | 0 (0.0%) |
| $25,000 to $49,999 | 441 (74.1%) | 154 (25.9%) |
| $50,000 to $74,999 | 68 (85.0%) | 12 (15.0%) |
| $75,000 to $99,999 | 63 (60.6%) | 41 (39.4%) |
| $100,000 and over | 69 (100.0%) | 0 (0.0%) |
Public vs Private Health Insurance Coverage by Age in Berino
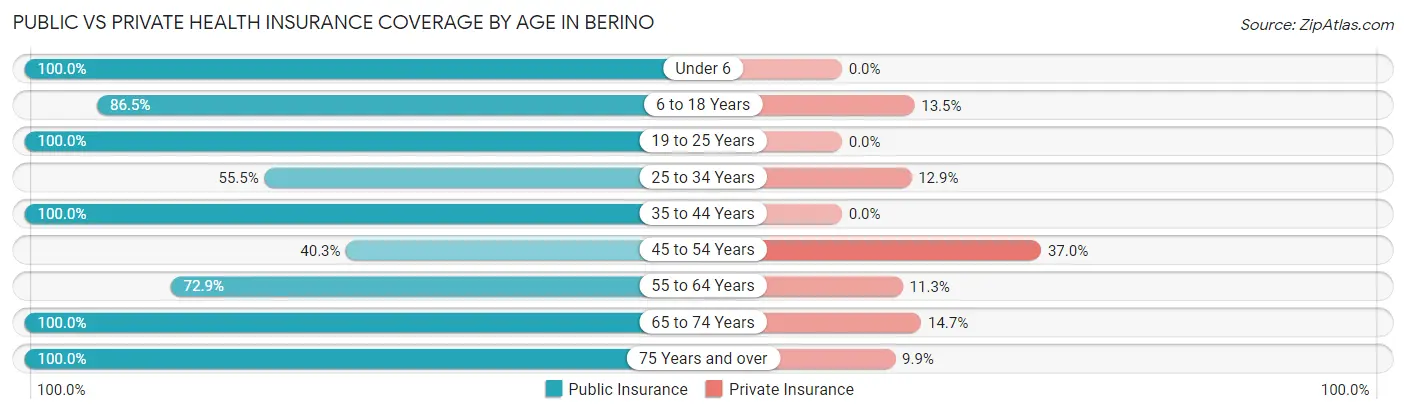
| Age Bracket | Public Insurance | Private Insurance |
| Under 6 | 51 (100.0%) | 0 (0.0%) |
| 6 to 18 Years | 135 (86.5%) | 21 (13.5%) |
| 19 to 25 Years | 96 (100.0%) | 0 (0.0%) |
| 25 to 34 Years | 198 (55.5%) | 46 (12.9%) |
| 35 to 44 Years | 33 (100.0%) | 0 (0.0%) |
| 45 to 54 Years | 85 (40.3%) | 78 (37.0%) |
| 55 to 64 Years | 129 (72.9%) | 20 (11.3%) |
| 65 to 74 Years | 68 (100.0%) | 10 (14.7%) |
| 75 Years and over | 101 (100.0%) | 10 (9.9%) |
| Total | 896 (71.7%) | 185 (14.8%) |
Disability Status by Sex by Age in Berino
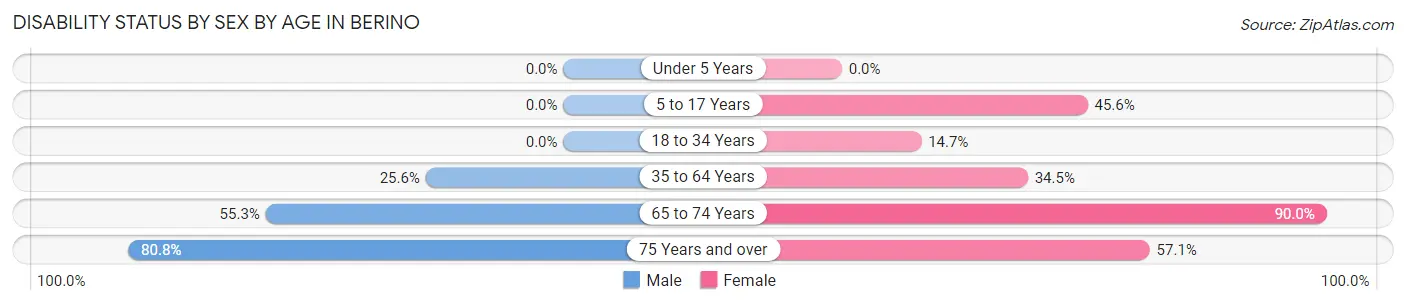
| Age Bracket | Male | Female |
| Under 5 Years | 0 (0.0%) | 0 (0.0%) |
| 5 to 17 Years | 0 (0.0%) | 78 (45.6%) |
| 18 to 34 Years | 0 (0.0%) | 28 (14.7%) |
| 35 to 64 Years | 35 (25.6%) | 98 (34.5%) |
| 65 to 74 Years | 21 (55.3%) | 27 (90.0%) |
| 75 Years and over | 42 (80.8%) | 28 (57.1%) |
Disability Class by Sex by Age in Berino
Disability Class: Hearing Difficulty
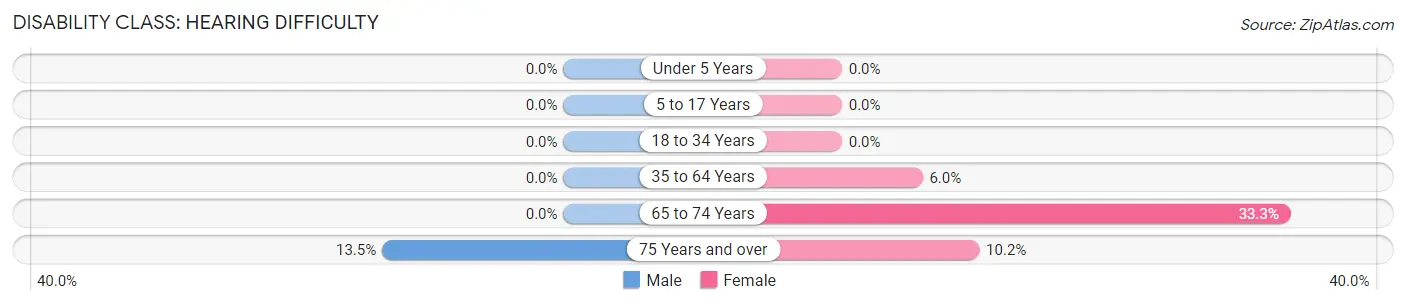
| Age Bracket | Male | Female |
| Under 5 Years | 0 (0.0%) | 0 (0.0%) |
| 5 to 17 Years | 0 (0.0%) | 0 (0.0%) |
| 18 to 34 Years | 0 (0.0%) | 0 (0.0%) |
| 35 to 64 Years | 0 (0.0%) | 17 (6.0%) |
| 65 to 74 Years | 0 (0.0%) | 10 (33.3%) |
| 75 Years and over | 7 (13.5%) | 5 (10.2%) |
Disability Class: Vision Difficulty
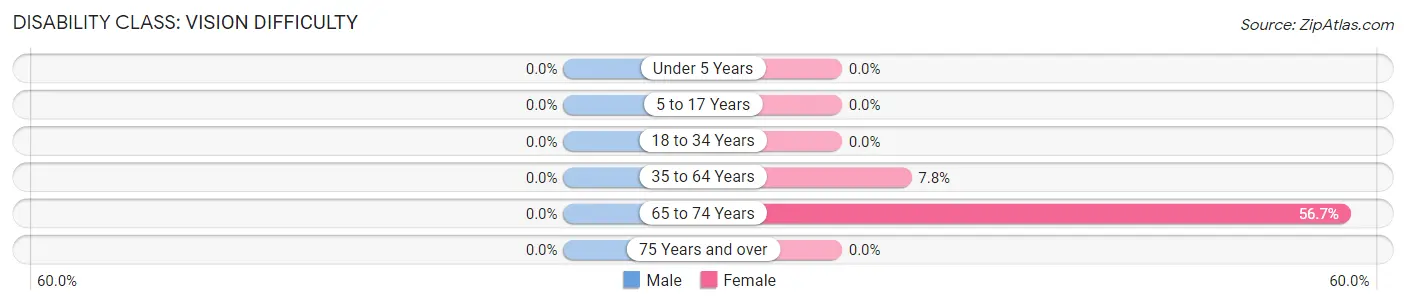
| Age Bracket | Male | Female |
| Under 5 Years | 0 (0.0%) | 0 (0.0%) |
| 5 to 17 Years | 0 (0.0%) | 0 (0.0%) |
| 18 to 34 Years | 0 (0.0%) | 0 (0.0%) |
| 35 to 64 Years | 0 (0.0%) | 22 (7.7%) |
| 65 to 74 Years | 0 (0.0%) | 17 (56.7%) |
| 75 Years and over | 0 (0.0%) | 0 (0.0%) |
Disability Class: Cognitive Difficulty
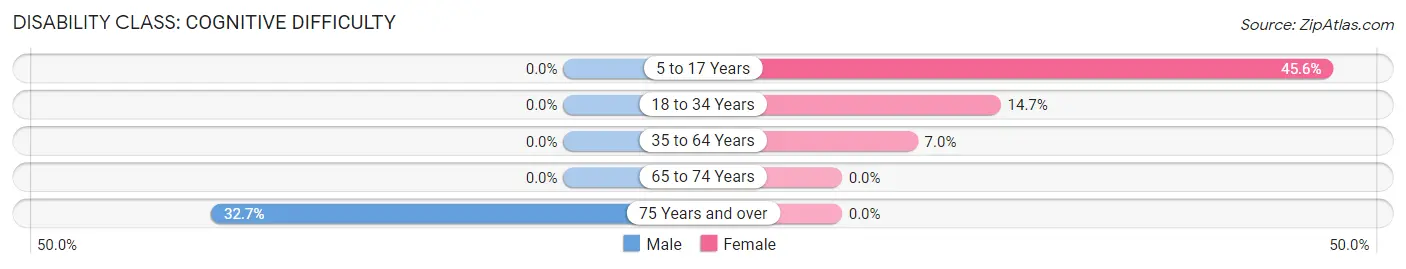
| Age Bracket | Male | Female |
| 5 to 17 Years | 0 (0.0%) | 78 (45.6%) |
| 18 to 34 Years | 0 (0.0%) | 28 (14.7%) |
| 35 to 64 Years | 0 (0.0%) | 20 (7.0%) |
| 65 to 74 Years | 0 (0.0%) | 0 (0.0%) |
| 75 Years and over | 17 (32.7%) | 0 (0.0%) |
Disability Class: Ambulatory Difficulty
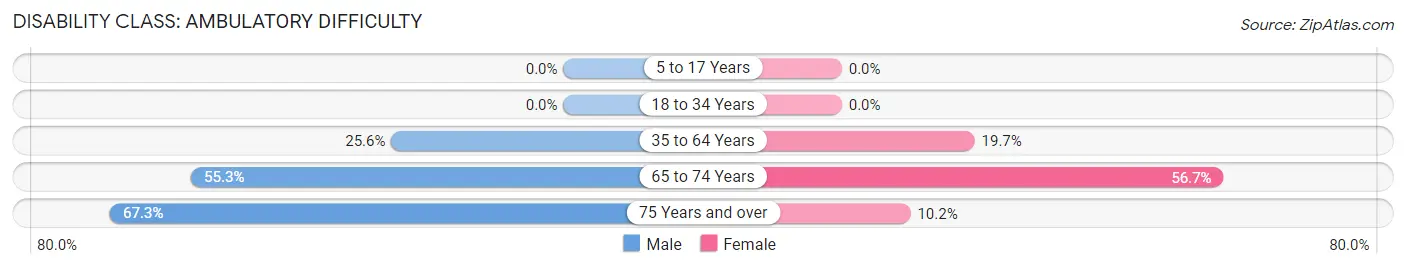
| Age Bracket | Male | Female |
| 5 to 17 Years | 0 (0.0%) | 0 (0.0%) |
| 18 to 34 Years | 0 (0.0%) | 0 (0.0%) |
| 35 to 64 Years | 35 (25.6%) | 56 (19.7%) |
| 65 to 74 Years | 21 (55.3%) | 17 (56.7%) |
| 75 Years and over | 35 (67.3%) | 5 (10.2%) |
Disability Class: Self-Care Difficulty
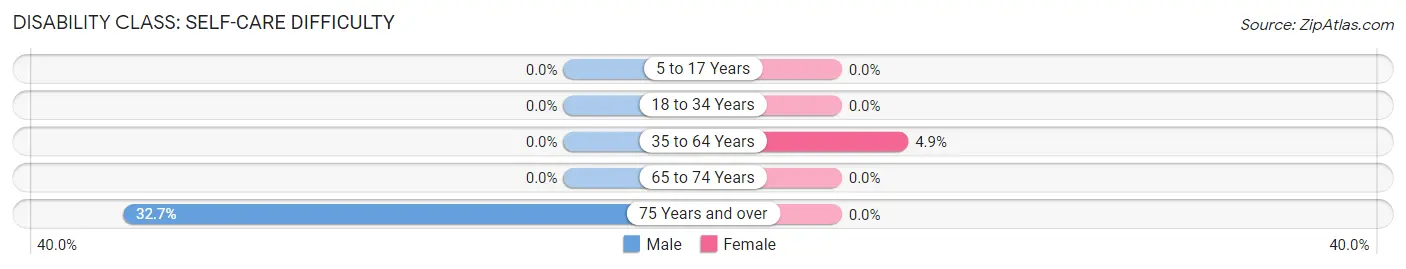
| Age Bracket | Male | Female |
| 5 to 17 Years | 0 (0.0%) | 0 (0.0%) |
| 18 to 34 Years | 0 (0.0%) | 0 (0.0%) |
| 35 to 64 Years | 0 (0.0%) | 14 (4.9%) |
| 65 to 74 Years | 0 (0.0%) | 0 (0.0%) |
| 75 Years and over | 17 (32.7%) | 0 (0.0%) |
Technology Access in Berino
Computing Device Access in Berino
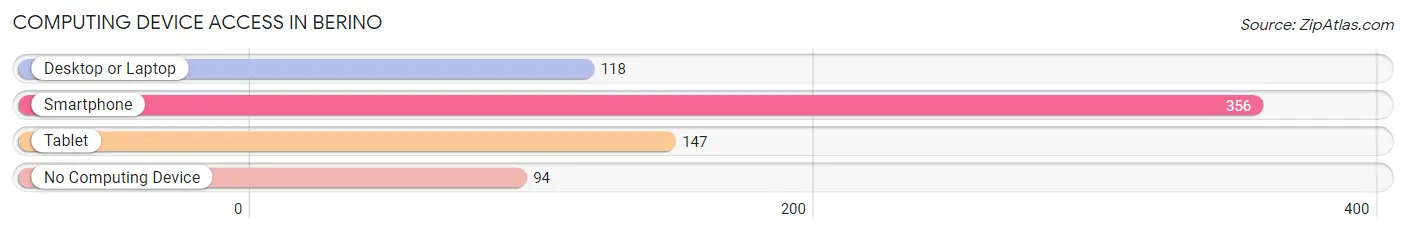
| Device Type | # Households | % Households |
| Desktop or Laptop | 118 | 25.6% |
| Smartphone | 356 | 77.2% |
| Tablet | 147 | 31.9% |
| No Computing Device | 94 | 20.4% |
| Total | 461 | 100.0% |
Internet Access in Berino
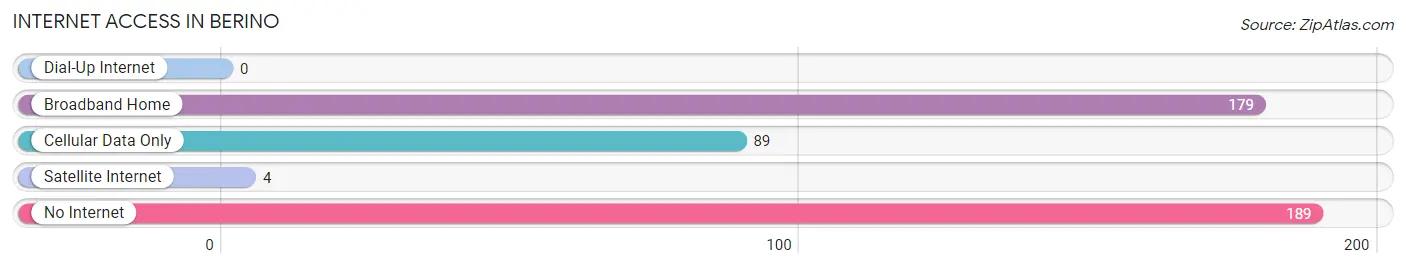
| Internet Type | # Households | % Households |
| Dial-Up Internet | 0 | 0.0% |
| Broadband Home | 179 | 38.8% |
| Cellular Data Only | 89 | 19.3% |
| Satellite Internet | 4 | 0.9% |
| No Internet | 189 | 41.0% |
| Total | 461 | 100.0% |
Berino Summary
Berino is a small unincorporated community located in Dona Ana County, New Mexico. It is situated in the Mesilla Valley, approximately 15 miles north of Las Cruces. The population of Berino was estimated to be 1,845 in 2019.
History
Berino was founded in 1881 by a group of settlers from the nearby town of Mesilla. The settlers were looking for a place to settle and farm, and Berino was the perfect spot. The town was named after a local rancher, Juan Berino. The first post office was established in 1883.
Berino grew slowly but steadily over the years, and by the early 1900s it had become a thriving agricultural community. The town was home to several stores, a school, a church, and a hotel. The town also had a railroad station, which allowed for the transport of goods and people.
Geography
Berino is located in the Mesilla Valley, which is part of the Chihuahuan Desert. The valley is surrounded by the Organ Mountains to the east and the San Andres Mountains to the west. The valley is known for its mild climate and fertile soil, which makes it ideal for farming.
The town of Berino is situated at an elevation of 4,000 feet. The area is mostly flat, with some rolling hills. The town is located near the Rio Grande, which provides irrigation for the local farms.
Economy
The economy of Berino is largely based on agriculture. The town is home to several farms, which produce a variety of crops, including alfalfa, cotton, and chile peppers. The town also has a few small businesses, such as a grocery store, a gas station, and a restaurant.
Demographics
As of 2019, the population of Berino was estimated to be 1,845. The town is predominantly Hispanic, with a large percentage of the population being of Mexican descent. The median household income in Berino is $30,000, and the median age is 33.
Conclusion
Berino is a small unincorporated community located in Dona Ana County, New Mexico. It is situated in the Mesilla Valley, approximately 15 miles north of Las Cruces. The population of Berino was estimated to be 1,845 in 2019. The town is predominantly Hispanic, with a large percentage of the population being of Mexican descent. The economy of Berino is largely based on agriculture, and the town is home to several farms, which produce a variety of crops. Berino is a peaceful and welcoming community, and it is a great place to live and work.
Common Questions
What is Per Capita Income in Berino?
Per Capita income in Berino is $13,903.
What is the Median Family Income in Berino?
Median Family Income in Berino is $26,136.
What is the Median Household income in Berino?
Median Household Income in Berino is $26,477.
What is Income or Wage Gap in Berino?
Income or Wage Gap in Berino is 31.1%.
Women in Berino earn 68.9 cents for every dollar earned by a man.
What is Inequality or Gini Index in Berino?
Inequality or Gini Index in Berino is 0.41.
What is the Total Population of Berino?
Total Population of Berino is 1,250.
What is the Total Male Population of Berino?
Total Male Population of Berino is 526.
What is the Total Female Population of Berino?
Total Female Population of Berino is 724.
What is the Ratio of Males per 100 Females in Berino?
There are 72.65 Males per 100 Females in Berino.
What is the Ratio of Females per 100 Males in Berino?
There are 137.64 Females per 100 Males in Berino.
What is the Median Population Age in Berino?
Median Population Age in Berino is 33.3 Years.
What is the Average Family Size in Berino
Average Family Size in Berino is 3.1 People.
What is the Average Household Size in Berino
Average Household Size in Berino is 2.7 People.
How Large is the Labor Force in Berino?
There are 475 People in the Labor Forcein in Berino.
What is the Percentage of People in the Labor Force in Berino?
44.5% of People are in the Labor Force in Berino.
What is the Unemployment Rate in Berino?
Unemployment Rate in Berino is 9.9%.