San Ildefonso Pueblo, NM Map & Demographics
San Ildefonso Pueblo Map
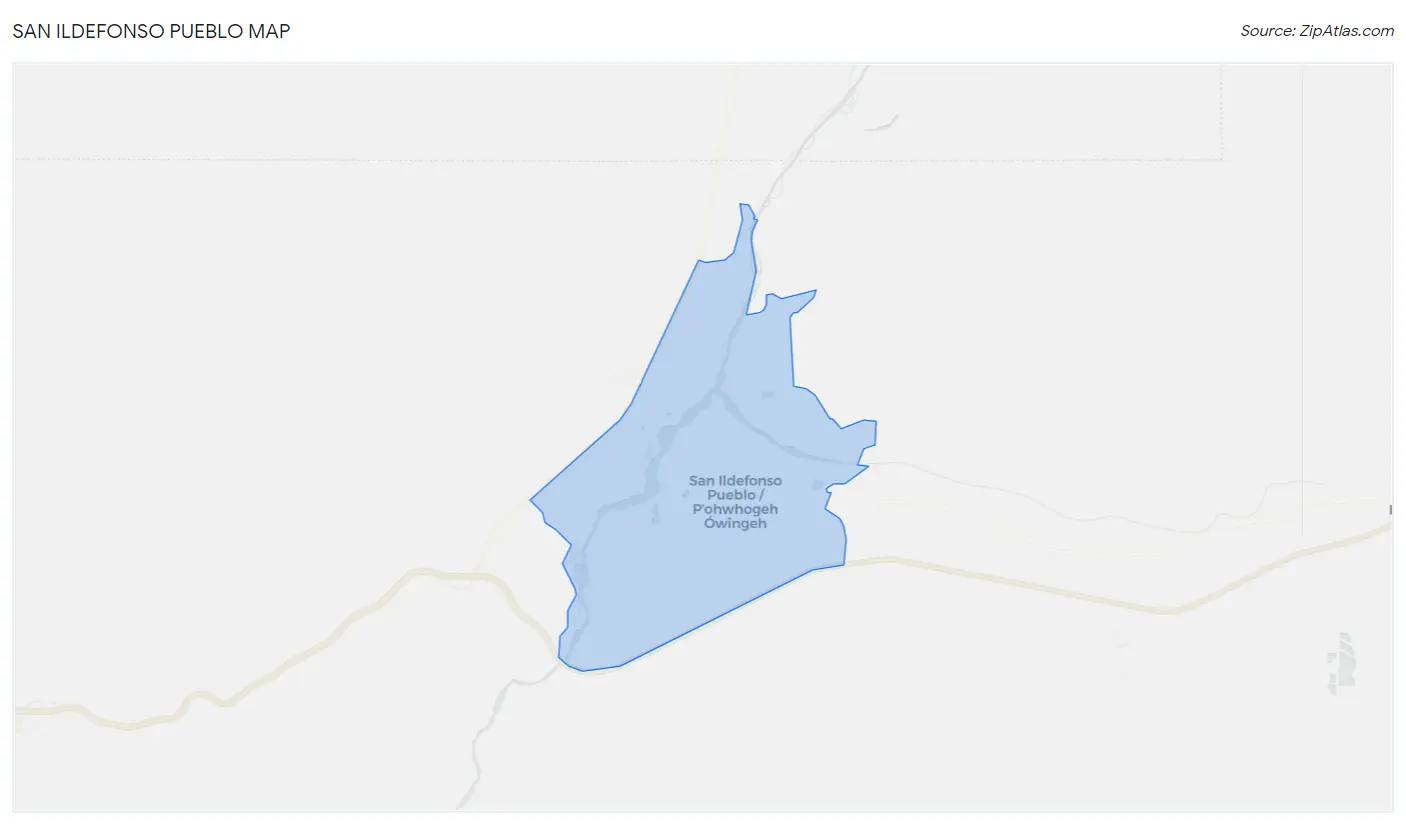
San Ildefonso Pueblo Overview
$35,245
PER CAPITA INCOME
$83,750
AVG FAMILY INCOME
$82,656
AVG HOUSEHOLD INCOME
20.0%
WAGE / INCOME GAP [ % ]
80.0¢/ $1
WAGE / INCOME GAP [ $ ]
0.40
INEQUALITY / GINI INDEX
722
TOTAL POPULATION
379
MALE POPULATION
343
FEMALE POPULATION
110.50
MALES / 100 FEMALES
90.50
FEMALES / 100 MALES
33.3
MEDIAN AGE
3.5
AVG FAMILY SIZE
3.0
AVG HOUSEHOLD SIZE
392
LABOR FORCE [ PEOPLE ]
68.8%
PERCENT IN LABOR FORCE
6.9%
UNEMPLOYMENT RATE
San Ildefonso Pueblo Area Codes
Income in San Ildefonso Pueblo
Income Overview in San Ildefonso Pueblo
Per Capita Income in San Ildefonso Pueblo is $35,245, while median incomes of families and households are $83,750 and $82,656 respectively.
| Characteristic | Number | Measure |
| Per Capita Income | 722 | $35,245 |
| Median Family Income | 176 | $83,750 |
| Mean Family Income | 176 | $99,561 |
| Median Household Income | 239 | $82,656 |
| Mean Household Income | 239 | $98,466 |
| Income Deficit | 176 | $0 |
| Wage / Income Gap (%) | 722 | 19.99% |
| Wage / Income Gap ($) | 722 | 80.01¢ per $1 |
| Gini / Inequality Index | 722 | 0.40 |
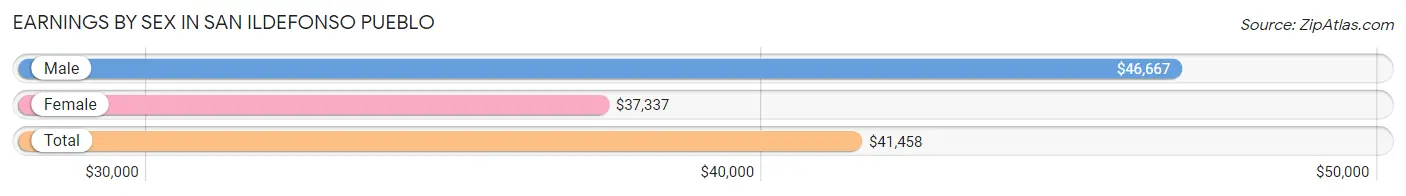
Earnings by Sex in San Ildefonso Pueblo
Average Earnings in San Ildefonso Pueblo are $41,458, $46,667 for men and $37,337 for women, a difference of 20.0%.
| Sex | Number | Average Earnings |
| Male | 210 (52.4%) | $46,667 |
| Female | 191 (47.6%) | $37,337 |
| Total | 401 (100.0%) | $41,458 |
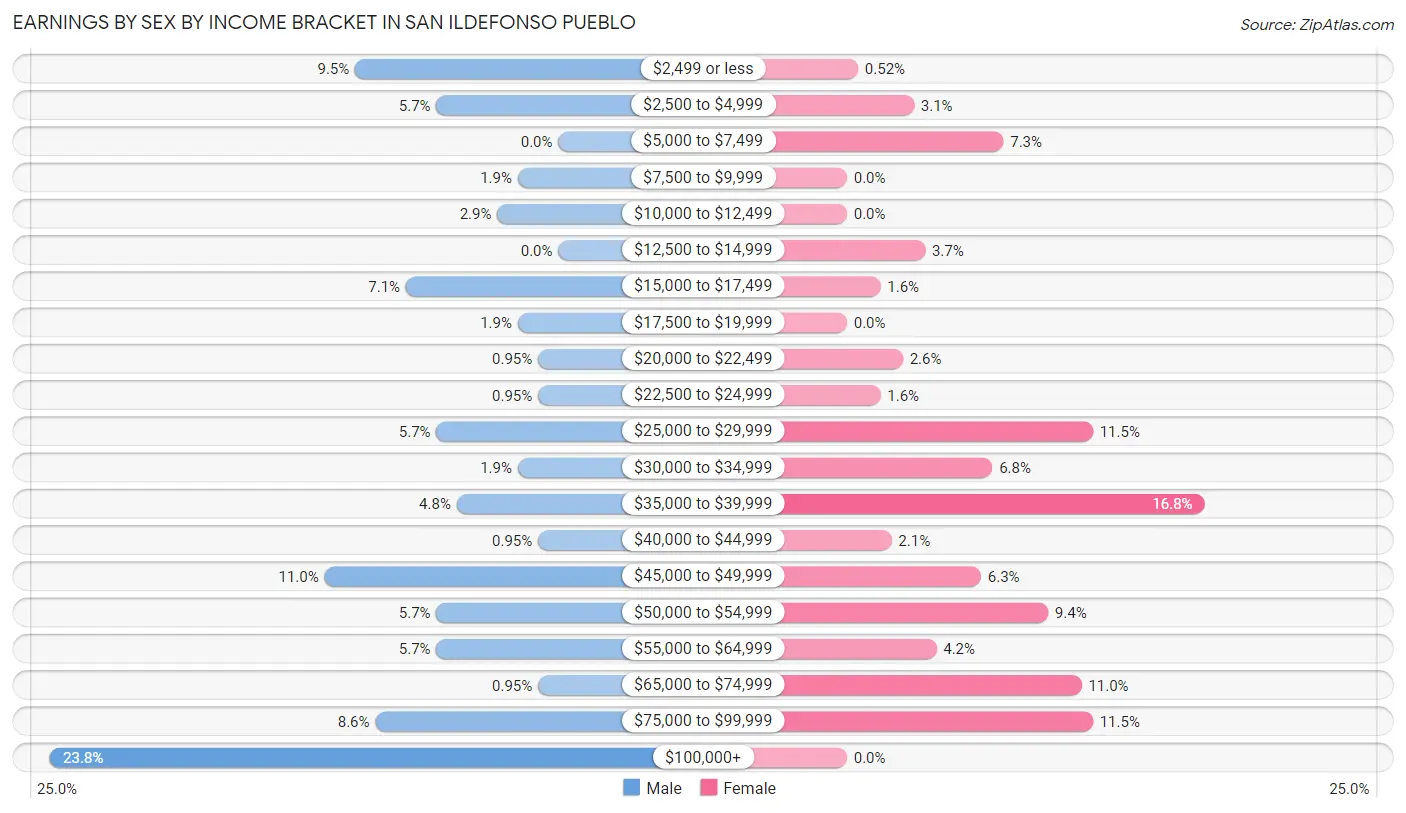
Earnings by Sex by Income Bracket in San Ildefonso Pueblo
The most common earnings brackets in San Ildefonso Pueblo are $100,000+ for men (50 | 23.8%) and $35,000 to $39,999 for women (32 | 16.8%).
| Income | Male | Female |
| $2,499 or less | 20 (9.5%) | 1 (0.5%) |
| $2,500 to $4,999 | 12 (5.7%) | 6 (3.1%) |
| $5,000 to $7,499 | 0 (0.0%) | 14 (7.3%) |
| $7,500 to $9,999 | 4 (1.9%) | 0 (0.0%) |
| $10,000 to $12,499 | 6 (2.9%) | 0 (0.0%) |
| $12,500 to $14,999 | 0 (0.0%) | 7 (3.7%) |
| $15,000 to $17,499 | 15 (7.1%) | 3 (1.6%) |
| $17,500 to $19,999 | 4 (1.9%) | 0 (0.0%) |
| $20,000 to $22,499 | 2 (0.9%) | 5 (2.6%) |
| $22,500 to $24,999 | 2 (0.9%) | 3 (1.6%) |
| $25,000 to $29,999 | 12 (5.7%) | 22 (11.5%) |
| $30,000 to $34,999 | 4 (1.9%) | 13 (6.8%) |
| $35,000 to $39,999 | 10 (4.8%) | 32 (16.8%) |
| $40,000 to $44,999 | 2 (0.9%) | 4 (2.1%) |
| $45,000 to $49,999 | 23 (11.0%) | 12 (6.3%) |
| $50,000 to $54,999 | 12 (5.7%) | 18 (9.4%) |
| $55,000 to $64,999 | 12 (5.7%) | 8 (4.2%) |
| $65,000 to $74,999 | 2 (0.9%) | 21 (11.0%) |
| $75,000 to $99,999 | 18 (8.6%) | 22 (11.5%) |
| $100,000+ | 50 (23.8%) | 0 (0.0%) |
| Total | 210 (100.0%) | 191 (100.0%) |
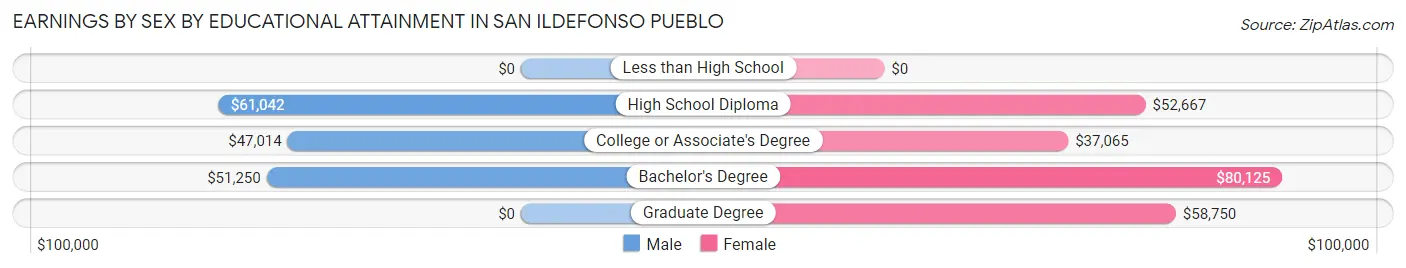
Earnings by Sex by Educational Attainment in San Ildefonso Pueblo
Average earnings in San Ildefonso Pueblo are $51,750 for men and $45,104 for women, a difference of 12.8%. Men with an educational attainment of high school diploma enjoy the highest average annual earnings of $61,042, while those with college or associate's degree education earn the least with $47,014. Women with an educational attainment of bachelor's degree earn the most with the average annual earnings of $80,125, while those with college or associate's degree education have the smallest earnings of $37,065.
| Educational Attainment | Male Income | Female Income |
| Less than High School | - | - |
| High School Diploma | $61,042 | $52,667 |
| College or Associate's Degree | $47,014 | $37,065 |
| Bachelor's Degree | $51,250 | $80,125 |
| Graduate Degree | - | - |
| Total | $51,750 | $45,104 |
Family Income in San Ildefonso Pueblo
Family Income Brackets in San Ildefonso Pueblo
According to the San Ildefonso Pueblo family income data, there are 34 families falling into the $100,000 to $149,999 income range, which is the most common income bracket and makes up 19.3% of all families. Conversely, the $10,000 to $14,999 income bracket is the least frequent group with only 3 families (1.7%) belonging to this category.
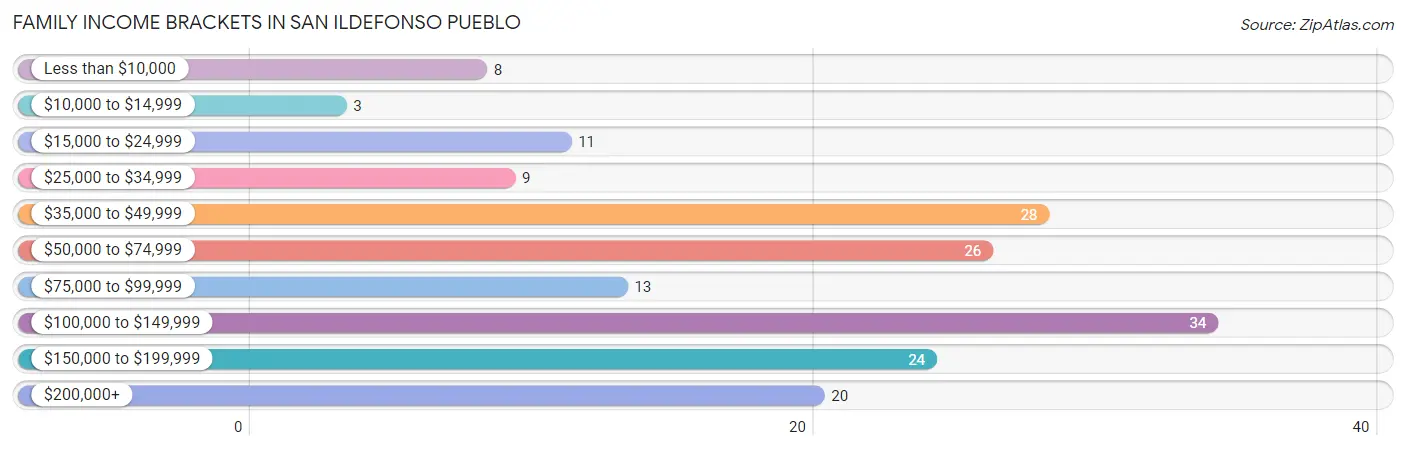
| Income Bracket | # Families | % Families |
| Less than $10,000 | 8 | 4.5% |
| $10,000 to $14,999 | 3 | 1.7% |
| $15,000 to $24,999 | 11 | 6.3% |
| $25,000 to $34,999 | 9 | 5.1% |
| $35,000 to $49,999 | 28 | 15.9% |
| $50,000 to $74,999 | 26 | 14.8% |
| $75,000 to $99,999 | 13 | 7.4% |
| $100,000 to $149,999 | 34 | 19.3% |
| $150,000 to $199,999 | 24 | 13.6% |
| $200,000+ | 20 | 11.4% |
Family Income by Famaliy Size in San Ildefonso Pueblo
4-person families (44 | 25.0%) account for the highest median family income in San Ildefonso Pueblo with $118,250 per family, while 4-person families (44 | 25.0%) have the highest median income of $29,562 per family member.
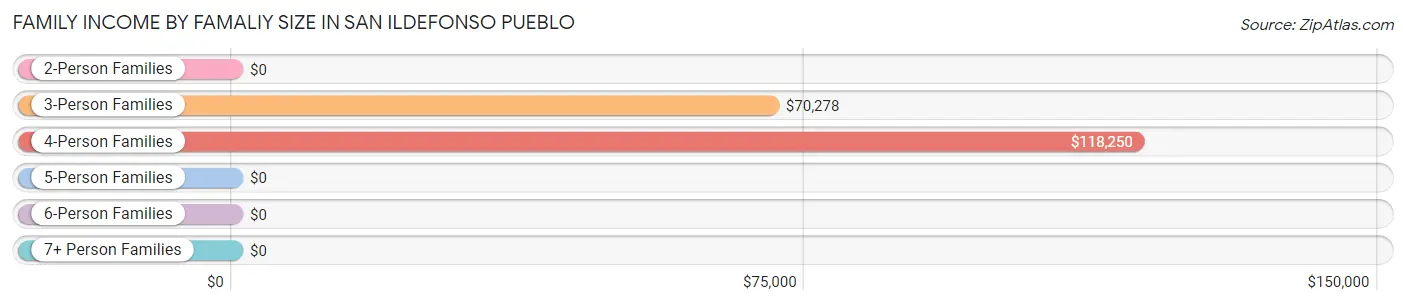
| Income Bracket | # Families | Median Income |
| 2-Person Families | 69 (39.2%) | $0 |
| 3-Person Families | 32 (18.2%) | $70,278 |
| 4-Person Families | 44 (25.0%) | $118,250 |
| 5-Person Families | 13 (7.4%) | $0 |
| 6-Person Families | 3 (1.7%) | $0 |
| 7+ Person Families | 15 (8.5%) | $0 |
| Total | 176 (100.0%) | $83,750 |
Family Income by Number of Earners in San Ildefonso Pueblo
The median family income in San Ildefonso Pueblo is $83,750, with families comprising 3+ earners (54) having the highest median family income of $163,636, while families with no earners (29) have the lowest median family income of $25,313, accounting for 30.7% and 16.5% of families, respectively.
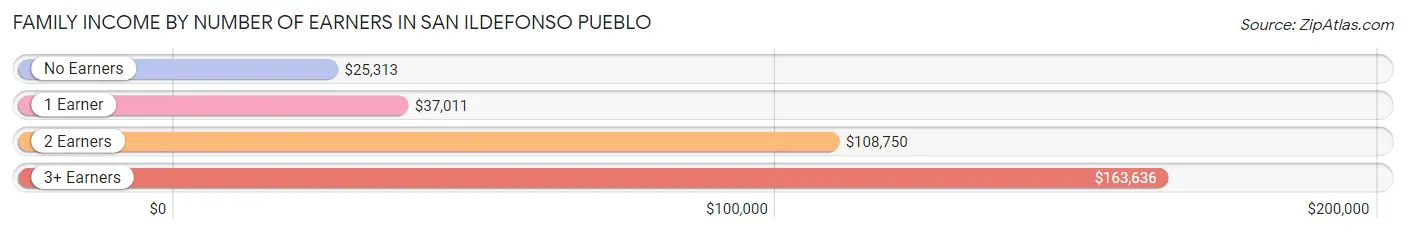
| Number of Earners | # Families | Median Income |
| No Earners | 29 (16.5%) | $25,313 |
| 1 Earner | 57 (32.4%) | $37,011 |
| 2 Earners | 36 (20.4%) | $108,750 |
| 3+ Earners | 54 (30.7%) | $163,636 |
| Total | 176 (100.0%) | $83,750 |
Household Income in San Ildefonso Pueblo
Household Income Brackets in San Ildefonso Pueblo
With 41 households falling in the category, the $100,000 to $149,999 income range is the most frequent in San Ildefonso Pueblo, accounting for 17.2% of all households.
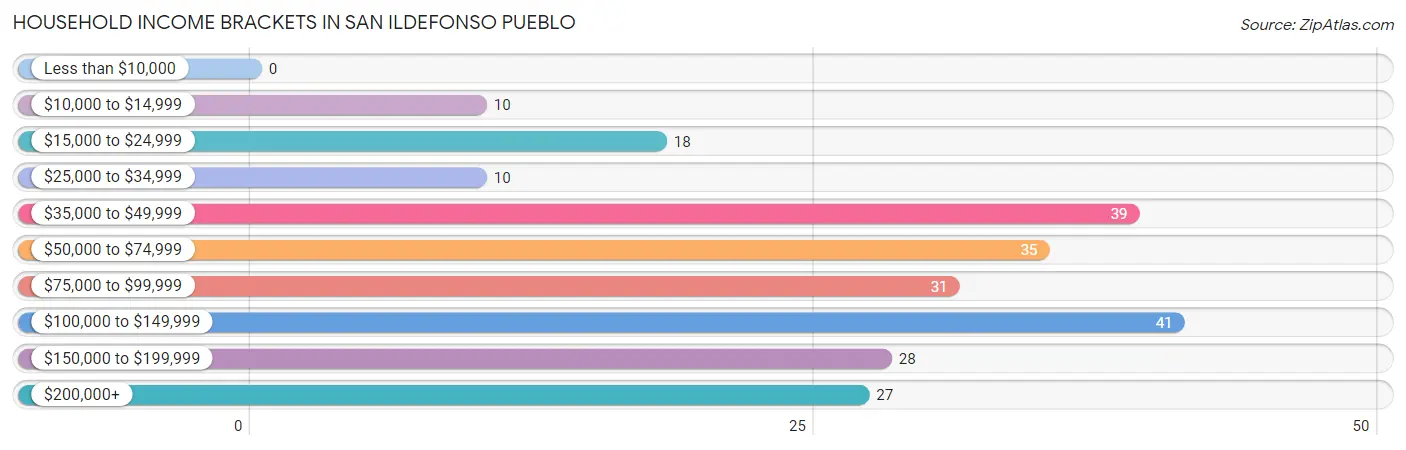
| Income Bracket | # Households | % Households |
| Less than $10,000 | 0 | 0.0% |
| $10,000 to $14,999 | 10 | 4.2% |
| $15,000 to $24,999 | 18 | 7.5% |
| $25,000 to $34,999 | 10 | 4.2% |
| $35,000 to $49,999 | 39 | 16.3% |
| $50,000 to $74,999 | 35 | 14.6% |
| $75,000 to $99,999 | 31 | 13.0% |
| $100,000 to $149,999 | 41 | 17.2% |
| $150,000 to $199,999 | 28 | 11.7% |
| $200,000+ | 27 | 11.3% |
Household Income by Householder Age in San Ildefonso Pueblo
The median household income in San Ildefonso Pueblo is $82,656, with the highest median household income of $121,250 found in the 45 to 64 years age bracket for the primary householder. A total of 101 households (42.3%) fall into this category.
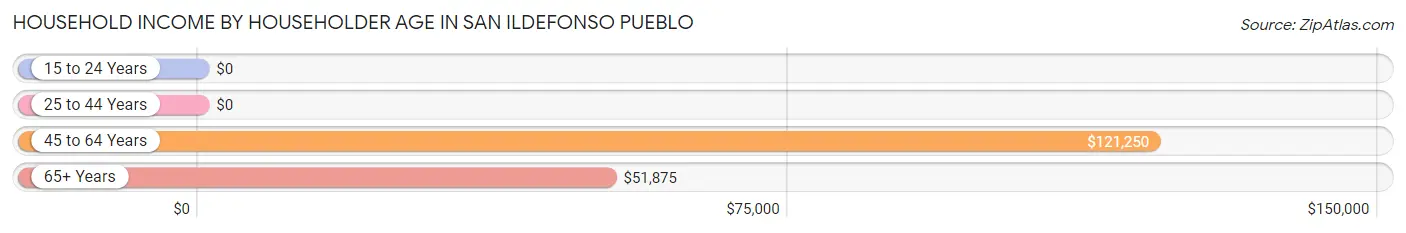
| Income Bracket | # Households | Median Income |
| 15 to 24 Years | 0 (0.0%) | $0 |
| 25 to 44 Years | 67 (28.0%) | $0 |
| 45 to 64 Years | 101 (42.3%) | $121,250 |
| 65+ Years | 71 (29.7%) | $51,875 |
| Total | 239 (100.0%) | $82,656 |
Poverty in San Ildefonso Pueblo
Income Below Poverty by Sex and Age in San Ildefonso Pueblo
With 16.1% poverty level for males and 15.1% for females among the residents of San Ildefonso Pueblo, 12 to 14 year old males and under 5 year old females are the most vulnerable to poverty, with 8 males (61.5%) and 10 females (47.6%) in their respective age groups living below the poverty level.
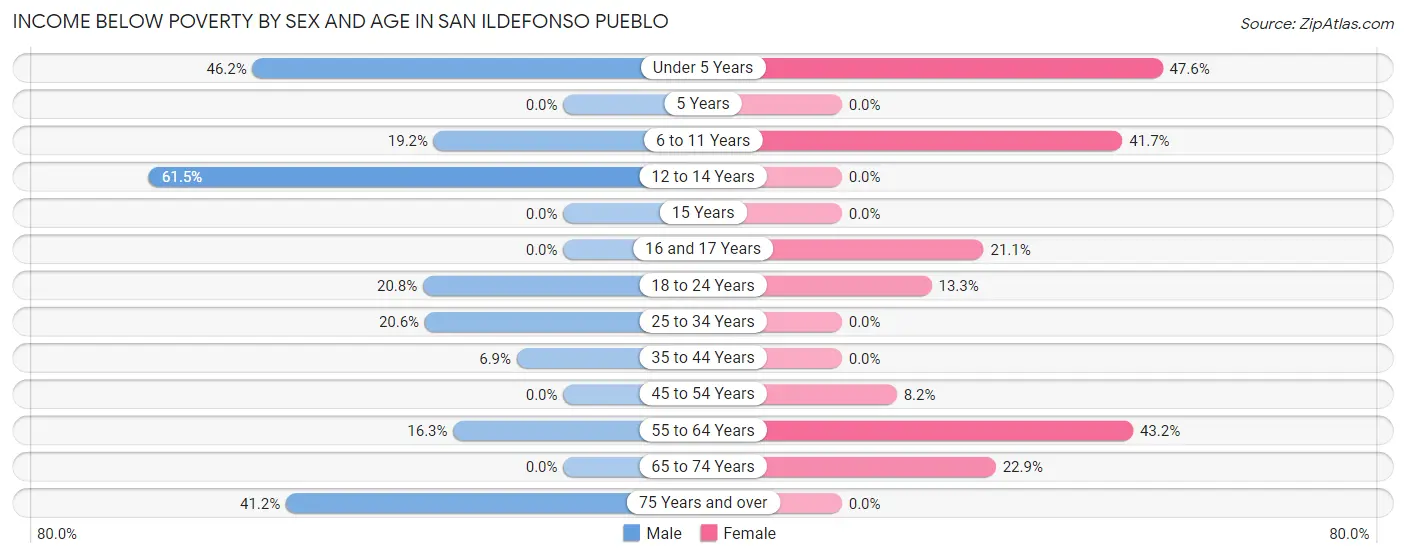
| Age Bracket | Male | Female |
| Under 5 Years | 6 (46.2%) | 10 (47.6%) |
| 5 Years | 0 (0.0%) | 0 (0.0%) |
| 6 to 11 Years | 10 (19.2%) | 5 (41.7%) |
| 12 to 14 Years | 8 (61.5%) | 0 (0.0%) |
| 15 Years | 0 (0.0%) | 0 (0.0%) |
| 16 and 17 Years | 0 (0.0%) | 4 (21.0%) |
| 18 to 24 Years | 5 (20.8%) | 4 (13.3%) |
| 25 to 34 Years | 15 (20.5%) | 0 (0.0%) |
| 35 to 44 Years | 2 (6.9%) | 0 (0.0%) |
| 45 to 54 Years | 0 (0.0%) | 4 (8.2%) |
| 55 to 64 Years | 8 (16.3%) | 16 (43.2%) |
| 65 to 74 Years | 0 (0.0%) | 8 (22.9%) |
| 75 Years and over | 7 (41.2%) | 0 (0.0%) |
| Total | 61 (16.1%) | 51 (15.1%) |
Income Above Poverty by Sex and Age in San Ildefonso Pueblo
According to the poverty statistics in San Ildefonso Pueblo, males aged 15 years and females aged 12 to 14 years are the age groups that are most secure financially, with 100.0% of males and 100.0% of females in these age groups living above the poverty line.
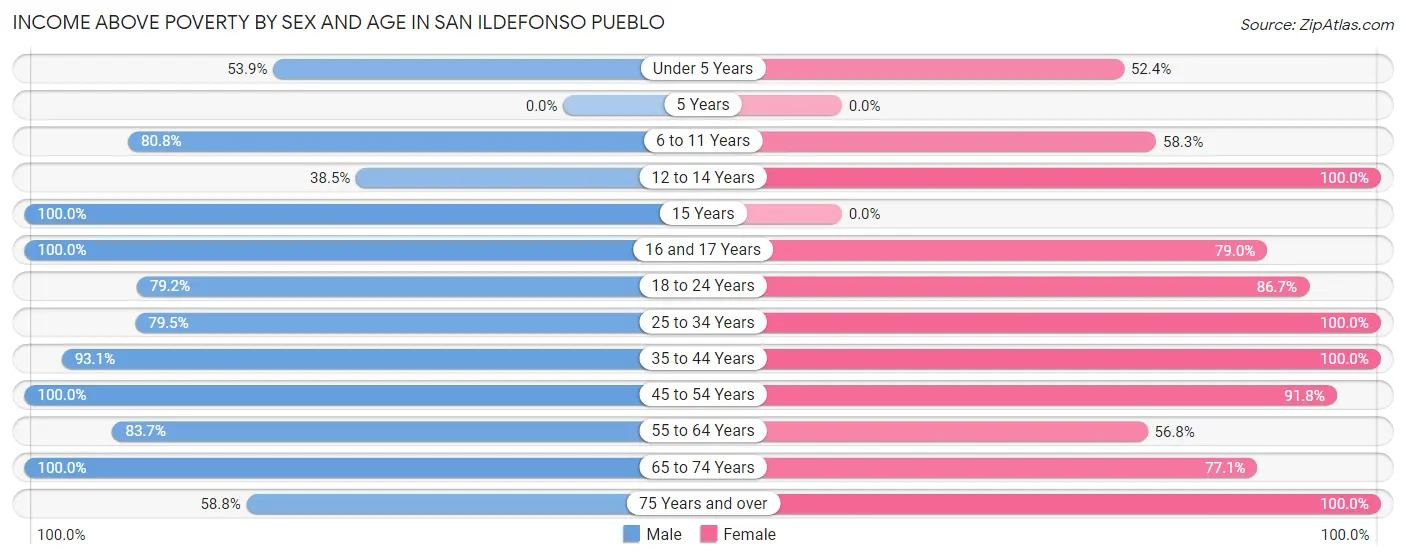
| Age Bracket | Male | Female |
| Under 5 Years | 7 (53.8%) | 11 (52.4%) |
| 5 Years | 0 (0.0%) | 0 (0.0%) |
| 6 to 11 Years | 42 (80.8%) | 7 (58.3%) |
| 12 to 14 Years | 5 (38.5%) | 26 (100.0%) |
| 15 Years | 10 (100.0%) | 0 (0.0%) |
| 16 and 17 Years | 18 (100.0%) | 15 (78.9%) |
| 18 to 24 Years | 19 (79.2%) | 26 (86.7%) |
| 25 to 34 Years | 58 (79.4%) | 70 (100.0%) |
| 35 to 44 Years | 27 (93.1%) | 26 (100.0%) |
| 45 to 54 Years | 59 (100.0%) | 45 (91.8%) |
| 55 to 64 Years | 41 (83.7%) | 21 (56.8%) |
| 65 to 74 Years | 22 (100.0%) | 27 (77.1%) |
| 75 Years and over | 10 (58.8%) | 13 (100.0%) |
| Total | 318 (83.9%) | 287 (84.9%) |
Income Below Poverty Among Married-Couple Families in San Ildefonso Pueblo
The poverty statistics for married-couple families in San Ildefonso Pueblo show that 7.1% or 7 of the total 98 families live below the poverty line. Families with 1 or 2 children have the highest poverty rate of 10.8%, comprising of 4 families. On the other hand, families with 3 or 4 children have the lowest poverty rate of 0.0%, which includes 0 families.
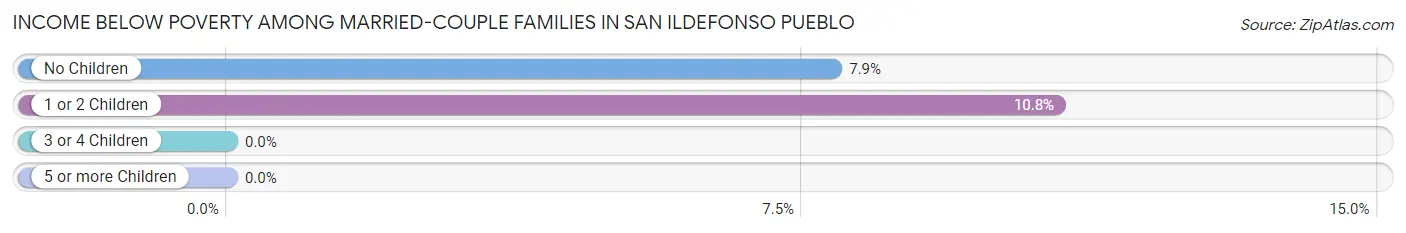
| Children | Above Poverty | Below Poverty |
| No Children | 35 (92.1%) | 3 (7.9%) |
| 1 or 2 Children | 33 (89.2%) | 4 (10.8%) |
| 3 or 4 Children | 8 (100.0%) | 0 (0.0%) |
| 5 or more Children | 15 (100.0%) | 0 (0.0%) |
| Total | 91 (92.9%) | 7 (7.1%) |
Income Below Poverty Among Single-Parent Households in San Ildefonso Pueblo
According to the poverty data in San Ildefonso Pueblo, 33.3% or 9 single-father households and 11.8% or 6 single-mother households are living below the poverty line. Among single-father households, those with 3 or 4 children have the highest poverty rate, with 4 households (100.0%) experiencing poverty. Likewise, among single-mother households, those with 3 or 4 children have the highest poverty rate, with 4 households (100.0%) falling below the poverty line.
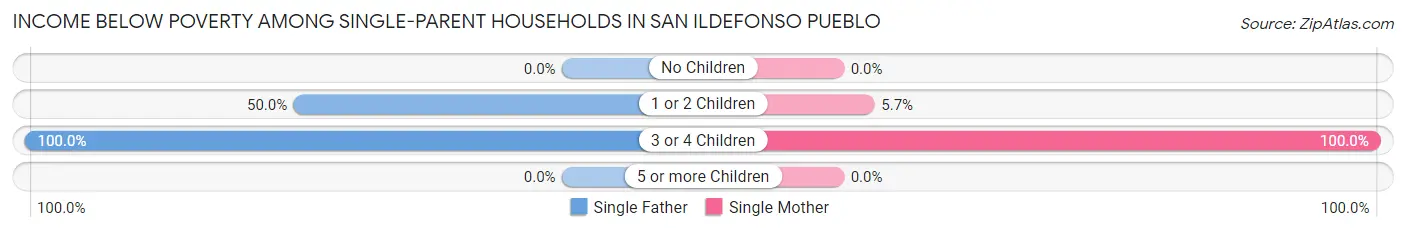
| Children | Single Father | Single Mother |
| No Children | 0 (0.0%) | 0 (0.0%) |
| 1 or 2 Children | 5 (50.0%) | 2 (5.7%) |
| 3 or 4 Children | 4 (100.0%) | 4 (100.0%) |
| 5 or more Children | 0 (0.0%) | 0 (0.0%) |
| Total | 9 (33.3%) | 6 (11.8%) |
Income Below Poverty Among Married-Couple vs Single-Parent Households in San Ildefonso Pueblo
The poverty data for San Ildefonso Pueblo shows that 7 of the married-couple family households (7.1%) and 15 of the single-parent households (19.2%) are living below the poverty level. Within the married-couple family households, those with 1 or 2 children have the highest poverty rate, with 4 households (10.8%) falling below the poverty line. Among the single-parent households, those with 3 or 4 children have the highest poverty rate, with 8 household (100.0%) living below poverty.
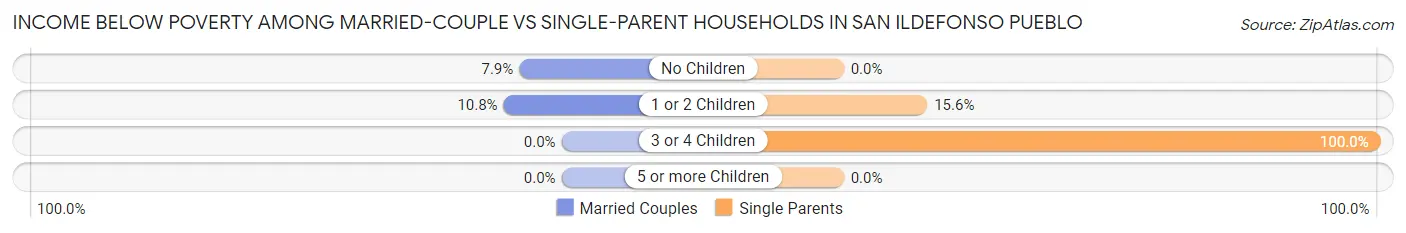
| Children | Married-Couple Families | Single-Parent Households |
| No Children | 3 (7.9%) | 0 (0.0%) |
| 1 or 2 Children | 4 (10.8%) | 7 (15.6%) |
| 3 or 4 Children | 0 (0.0%) | 8 (100.0%) |
| 5 or more Children | 0 (0.0%) | 0 (0.0%) |
| Total | 7 (7.1%) | 15 (19.2%) |
Race in San Ildefonso Pueblo
The most populous races in San Ildefonso Pueblo are Native / Alaskan (489 | 67.7%), Hispanic or Latino (169 | 23.4%), and White / Caucasian (124 | 17.2%).
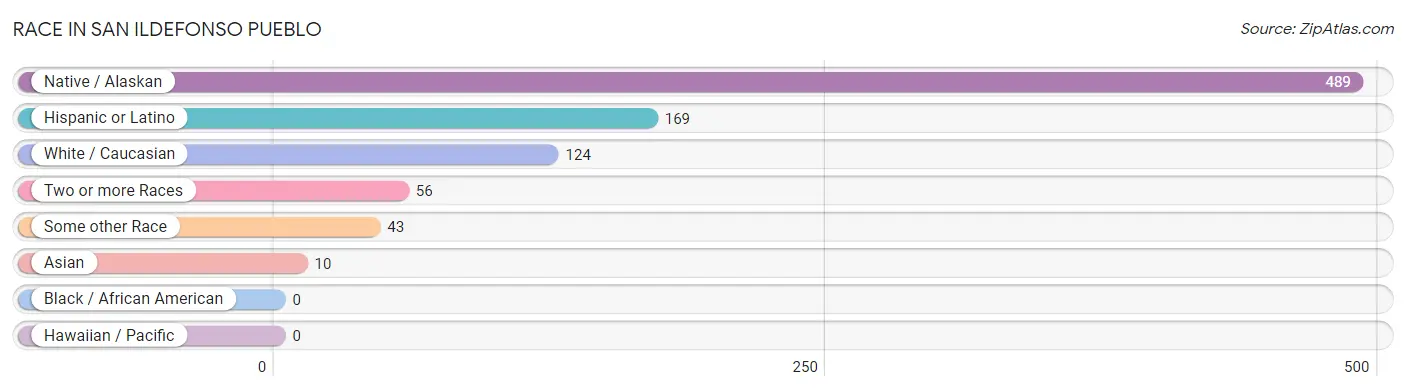
| Race | # Population | % Population |
| Asian | 10 | 1.4% |
| Black / African American | 0 | 0.0% |
| Hawaiian / Pacific | 0 | 0.0% |
| Hispanic or Latino | 169 | 23.4% |
| Native / Alaskan | 489 | 67.7% |
| White / Caucasian | 124 | 17.2% |
| Two or more Races | 56 | 7.8% |
| Some other Race | 43 | 6.0% |
| Total | 722 | 100.0% |
Ancestry in San Ildefonso Pueblo
The most populous ancestries reported in San Ildefonso Pueblo are Pueblo (496 | 68.7%), Mexican (72 | 10.0%), Spanish (61 | 8.5%), English (19 | 2.6%), and German (19 | 2.6%), together accounting for 92.4% of all San Ildefonso Pueblo residents.
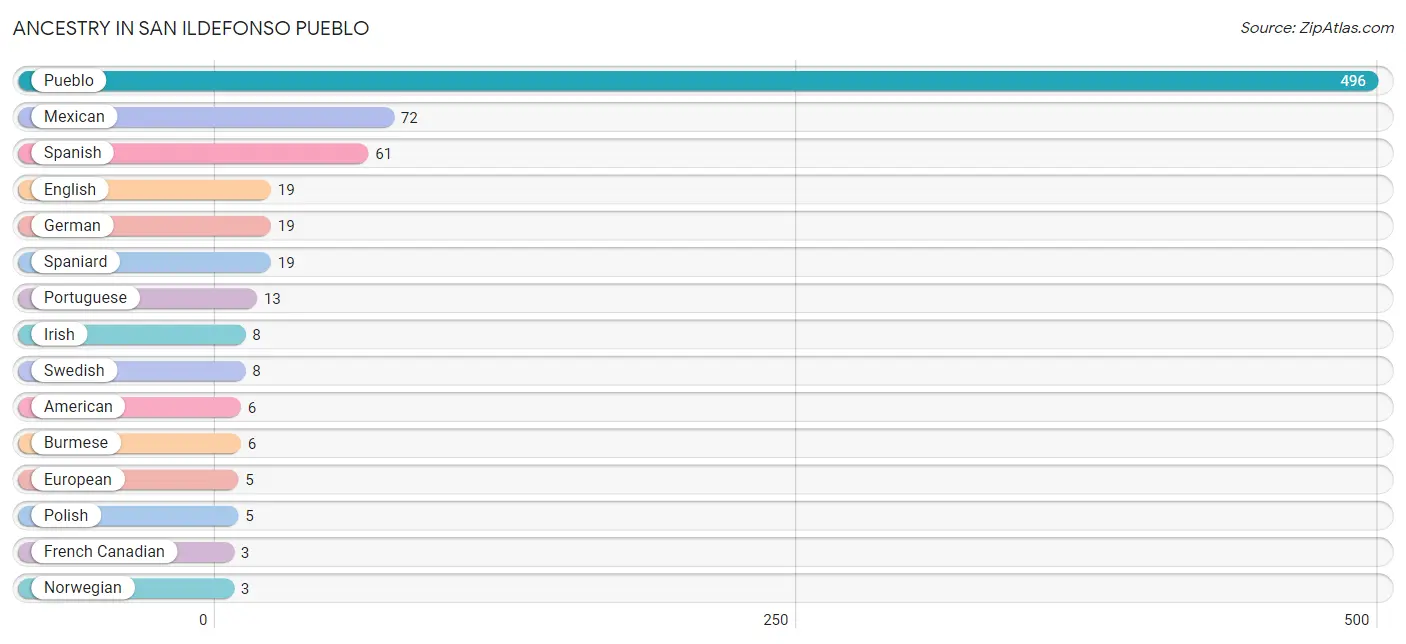
| Ancestry | # Population | % Population |
| American | 6 | 0.8% |
| British | 1 | 0.1% |
| Burmese | 6 | 0.8% |
| English | 19 | 2.6% |
| European | 5 | 0.7% |
| French Canadian | 3 | 0.4% |
| German | 19 | 2.6% |
| Indian (Asian) | 2 | 0.3% |
| Irish | 8 | 1.1% |
| Korean | 2 | 0.3% |
| Mexican | 72 | 10.0% |
| Norwegian | 3 | 0.4% |
| Polish | 5 | 0.7% |
| Portuguese | 13 | 1.8% |
| Pueblo | 496 | 68.7% |
| Spaniard | 19 | 2.6% |
| Spanish | 61 | 8.5% |
| Swedish | 8 | 1.1% |
| Welsh | 1 | 0.1% | View All 19 Rows |
Immigrants in San Ildefonso Pueblo
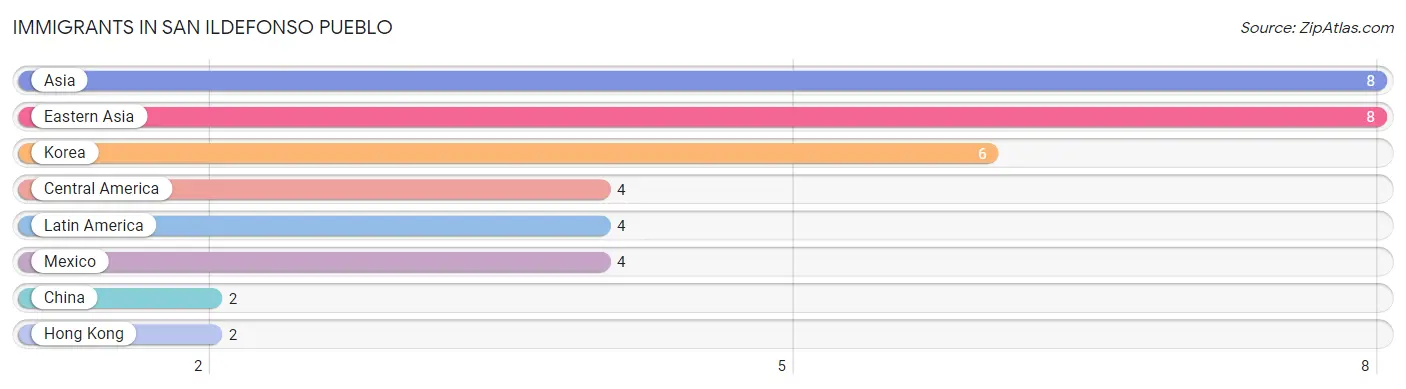
The most numerous immigrant groups reported in San Ildefonso Pueblo came from Asia (8 | 1.1%), Eastern Asia (8 | 1.1%), Korea (6 | 0.8%), Central America (4 | 0.5%), and Latin America (4 | 0.5%), together accounting for 4.1% of all San Ildefonso Pueblo residents.
| Immigration Origin | # Population | % Population |
| Asia | 8 | 1.1% |
| Central America | 4 | 0.5% |
| China | 2 | 0.3% |
| Eastern Asia | 8 | 1.1% |
| Hong Kong | 2 | 0.3% |
| Korea | 6 | 0.8% |
| Latin America | 4 | 0.5% |
| Mexico | 4 | 0.5% | View All 8 Rows |
Sex and Age in San Ildefonso Pueblo
Sex and Age in San Ildefonso Pueblo
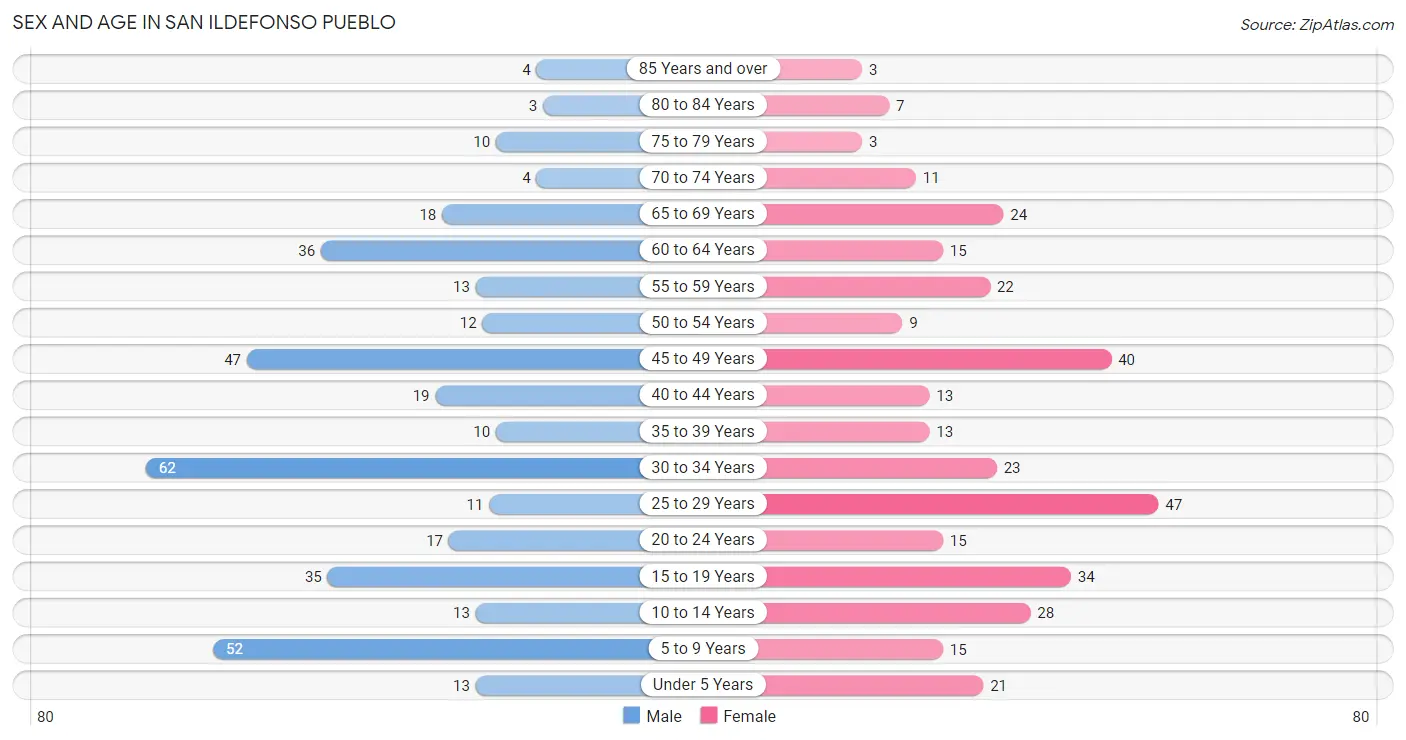
The most populous age groups in San Ildefonso Pueblo are 30 to 34 Years (62 | 16.4%) for men and 25 to 29 Years (47 | 13.7%) for women.
| Age Bracket | Male | Female |
| Under 5 Years | 13 (3.4%) | 21 (6.1%) |
| 5 to 9 Years | 52 (13.7%) | 15 (4.4%) |
| 10 to 14 Years | 13 (3.4%) | 28 (8.2%) |
| 15 to 19 Years | 35 (9.2%) | 34 (9.9%) |
| 20 to 24 Years | 17 (4.5%) | 15 (4.4%) |
| 25 to 29 Years | 11 (2.9%) | 47 (13.7%) |
| 30 to 34 Years | 62 (16.4%) | 23 (6.7%) |
| 35 to 39 Years | 10 (2.6%) | 13 (3.8%) |
| 40 to 44 Years | 19 (5.0%) | 13 (3.8%) |
| 45 to 49 Years | 47 (12.4%) | 40 (11.7%) |
| 50 to 54 Years | 12 (3.2%) | 9 (2.6%) |
| 55 to 59 Years | 13 (3.4%) | 22 (6.4%) |
| 60 to 64 Years | 36 (9.5%) | 15 (4.4%) |
| 65 to 69 Years | 18 (4.8%) | 24 (7.0%) |
| 70 to 74 Years | 4 (1.1%) | 11 (3.2%) |
| 75 to 79 Years | 10 (2.6%) | 3 (0.9%) |
| 80 to 84 Years | 3 (0.8%) | 7 (2.0%) |
| 85 Years and over | 4 (1.1%) | 3 (0.9%) |
| Total | 379 (100.0%) | 343 (100.0%) |
Families and Households in San Ildefonso Pueblo
Median Family Size in San Ildefonso Pueblo
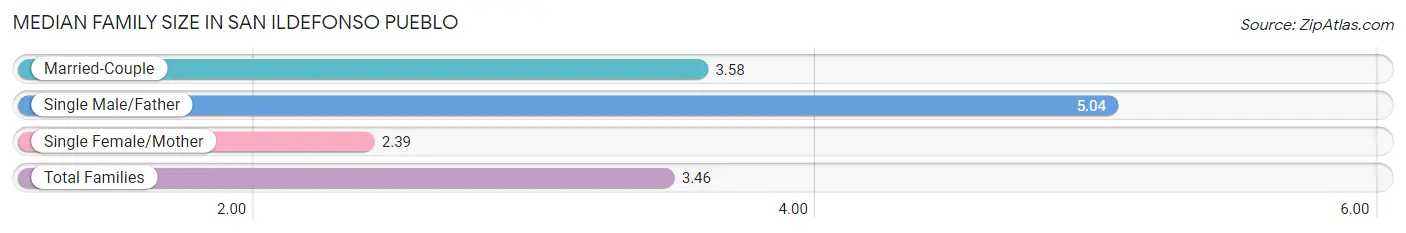
The median family size in San Ildefonso Pueblo is 3.46 persons per family, with single male/father families (27 | 15.3%) accounting for the largest median family size of 5.04 persons per family. On the other hand, single female/mother families (51 | 29.0%) represent the smallest median family size with 2.39 persons per family.
| Family Type | # Families | Family Size |
| Married-Couple | 98 (55.7%) | 3.58 |
| Single Male/Father | 27 (15.3%) | 5.04 |
| Single Female/Mother | 51 (29.0%) | 2.39 |
| Total Families | 176 (100.0%) | 3.46 |
Median Household Size in San Ildefonso Pueblo
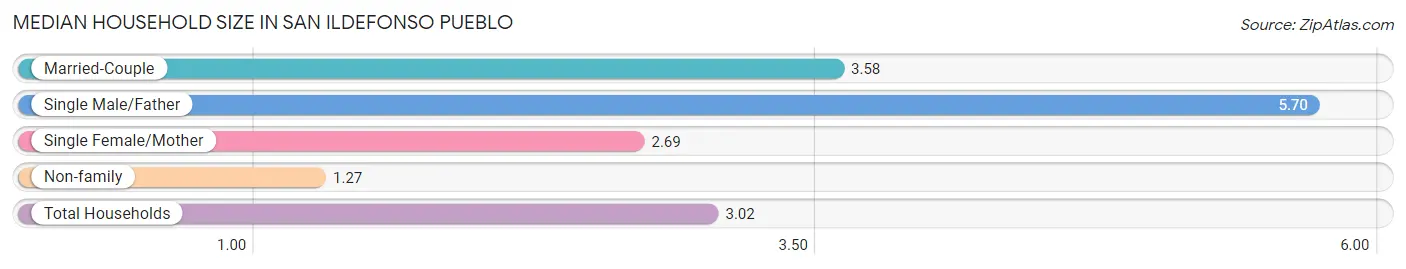
The median household size in San Ildefonso Pueblo is 3.02 persons per household, with single male/father households (27 | 11.3%) accounting for the largest median household size of 5.7 persons per household. non-family households (63 | 26.4%) represent the smallest median household size with 1.27 persons per household.
| Household Type | # Households | Household Size |
| Married-Couple | 98 (41.0%) | 3.58 |
| Single Male/Father | 27 (11.3%) | 5.70 |
| Single Female/Mother | 51 (21.3%) | 2.69 |
| Non-family | 63 (26.4%) | 1.27 |
| Total Households | 239 (100.0%) | 3.02 |
Household Size by Marriage Status in San Ildefonso Pueblo
Out of a total of 239 households in San Ildefonso Pueblo, 176 (73.6%) are family households, while 63 (26.4%) are nonfamily households. The most numerous type of family households are 2-person households, comprising 65, and the most common type of nonfamily households are 1-person households, comprising 52.
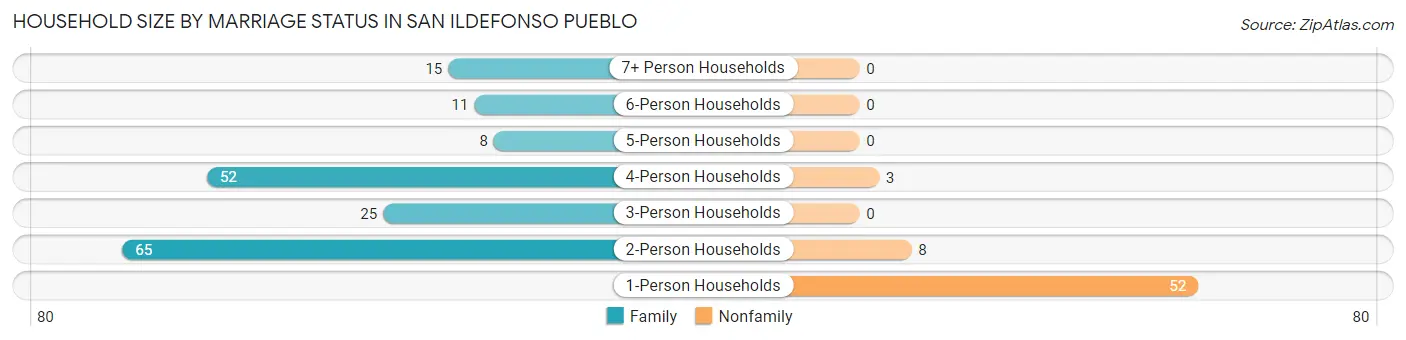
| Household Size | Family Households | Nonfamily Households |
| 1-Person Households | - | 52 (21.8%) |
| 2-Person Households | 65 (27.2%) | 8 (3.4%) |
| 3-Person Households | 25 (10.5%) | 0 (0.0%) |
| 4-Person Households | 52 (21.8%) | 3 (1.3%) |
| 5-Person Households | 8 (3.4%) | 0 (0.0%) |
| 6-Person Households | 11 (4.6%) | 0 (0.0%) |
| 7+ Person Households | 15 (6.3%) | 0 (0.0%) |
| Total | 176 (73.6%) | 63 (26.4%) |
Female Fertility in San Ildefonso Pueblo
Fertility by Age in San Ildefonso Pueblo
| Age Bracket | Women with Births | Births / 1,000 Women |
| 15 to 19 years | 0 (0.0%) | 0.0 |
| 20 to 34 years | 0 (0.0%) | 0.0 |
| 35 to 50 years | 0 (0.0%) | 0.0 |
| Total | 0 (0.0%) | 0.0 |
Fertility by Age by Marriage Status in San Ildefonso Pueblo
| Age Bracket | Married | Unmarried |
| 15 to 19 years | 0 (0.0%) | 0 (0.0%) |
| 20 to 34 years | 0 (0.0%) | 0 (0.0%) |
| 35 to 50 years | 0 (0.0%) | 0 (0.0%) |
| Total | 0 (0.0%) | 0 (0.0%) |
Fertility by Education in San Ildefonso Pueblo
| Educational Attainment | Women with Births | Births / 1,000 Women |
| Less than High School | 0 (0.0%) | 0.0 |
| High School Diploma | 0 (0.0%) | 0.0 |
| College or Associate's Degree | 0 (0.0%) | 0.0 |
| Bachelor's Degree | 0 (0.0%) | 0.0 |
| Graduate Degree | 0 (0.0%) | 0.0 |
| Total | 0 (0.0%) | 0.0 |
Fertility by Education by Marriage Status in San Ildefonso Pueblo
| Educational Attainment | Married | Unmarried |
| Less than High School | 0 (0.0%) | 0 (0.0%) |
| High School Diploma | 0 (0.0%) | 0 (0.0%) |
| College or Associate's Degree | 0 (0.0%) | 0 (0.0%) |
| Bachelor's Degree | 0 (0.0%) | 0 (0.0%) |
| Graduate Degree | 0 (0.0%) | 0 (0.0%) |
| Total | 0 (0.0%) | 0 (0.0%) |
Employment Characteristics in San Ildefonso Pueblo
Employment by Class of Employer in San Ildefonso Pueblo
Among the 359 employed individuals in San Ildefonso Pueblo, private company employees (109 | 30.4%), federal government employees (93 | 25.9%), and local government employees (91 | 25.4%) make up the most common classes of employment.
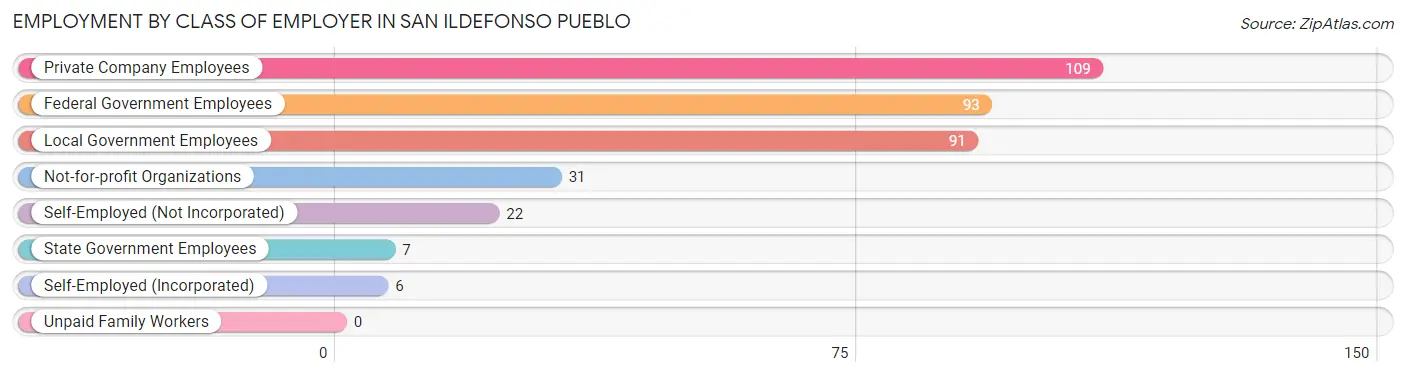
| Employer Class | # Employees | % Employees |
| Private Company Employees | 109 | 30.4% |
| Self-Employed (Incorporated) | 6 | 1.7% |
| Self-Employed (Not Incorporated) | 22 | 6.1% |
| Not-for-profit Organizations | 31 | 8.6% |
| Local Government Employees | 91 | 25.4% |
| State Government Employees | 7 | 1.9% |
| Federal Government Employees | 93 | 25.9% |
| Unpaid Family Workers | 0 | 0.0% |
| Total | 359 | 100.0% |
Employment Status by Age in San Ildefonso Pueblo
According to the labor force statistics for San Ildefonso Pueblo, out of the total population over 16 years of age (570), 68.8% or 392 individuals are in the labor force, with 6.9% or 27 of them unemployed. The age group with the highest labor force participation rate is 35 to 44 years, with 100.0% or 55 individuals in the labor force. Within the labor force, the 16 to 19 years age range has the highest percentage of unemployed individuals, with 29.3% or 12 of them being unemployed.
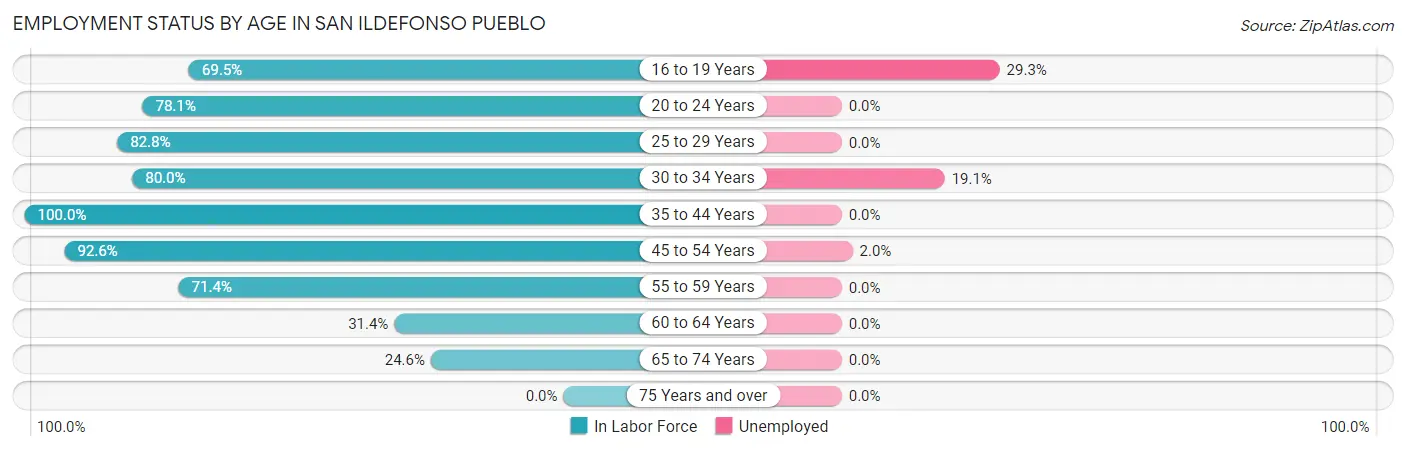
| Age Bracket | In Labor Force | Unemployed |
| 16 to 19 Years | 41 (69.5%) | 12 (29.3%) |
| 20 to 24 Years | 25 (78.1%) | 0 (0.0%) |
| 25 to 29 Years | 48 (82.8%) | 0 (0.0%) |
| 30 to 34 Years | 68 (80.0%) | 13 (19.1%) |
| 35 to 44 Years | 55 (100.0%) | 0 (0.0%) |
| 45 to 54 Years | 100 (92.6%) | 2 (2.0%) |
| 55 to 59 Years | 25 (71.4%) | 0 (0.0%) |
| 60 to 64 Years | 16 (31.4%) | 0 (0.0%) |
| 65 to 74 Years | 14 (24.6%) | 0 (0.0%) |
| 75 Years and over | 0 (0.0%) | 0 (0.0%) |
| Total | 392 (68.8%) | 27 (6.9%) |
Employment Status by Educational Attainment in San Ildefonso Pueblo
According to labor force statistics for San Ildefonso Pueblo, 79.6% of individuals (312) out of the total population between 25 and 64 years of age (392) are in the labor force, with 4.8% or 15 of them being unemployed. The group with the highest labor force participation rate are those with the educational attainment of bachelor's degree or higher, with 94.4% or 67 individuals in the labor force. Within the labor force, individuals with high school diploma education have the highest percentage of unemployment, with 13.6% or 15 of them being unemployed.
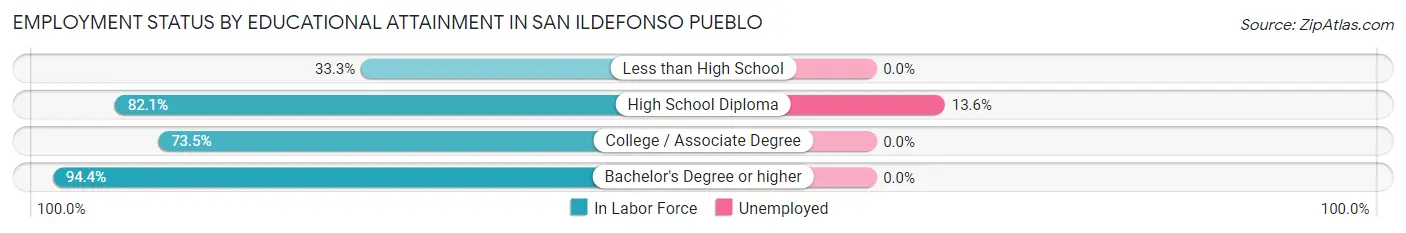
| Educational Attainment | In Labor Force | Unemployed |
| Less than High School | 2 (33.3%) | 0 (0.0%) |
| High School Diploma | 110 (82.1%) | 18 (13.6%) |
| College / Associate Degree | 133 (73.5%) | 0 (0.0%) |
| Bachelor's Degree or higher | 67 (94.4%) | 0 (0.0%) |
| Total | 312 (79.6%) | 19 (4.8%) |
Employment Occupations by Sex in San Ildefonso Pueblo
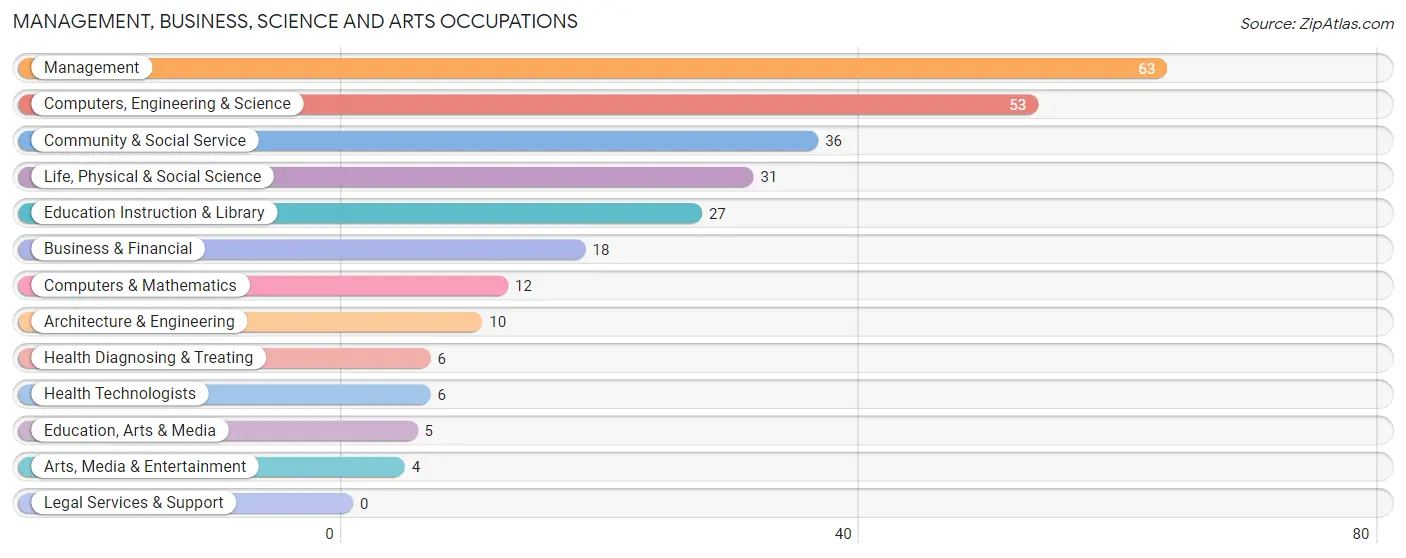
Management, Business, Science and Arts Occupations
The most common Management, Business, Science and Arts occupations in San Ildefonso Pueblo are Management (63 | 17.3%), Computers, Engineering & Science (53 | 14.5%), Community & Social Service (36 | 9.9%), Life, Physical & Social Science (31 | 8.5%), and Education Instruction & Library (27 | 7.4%).
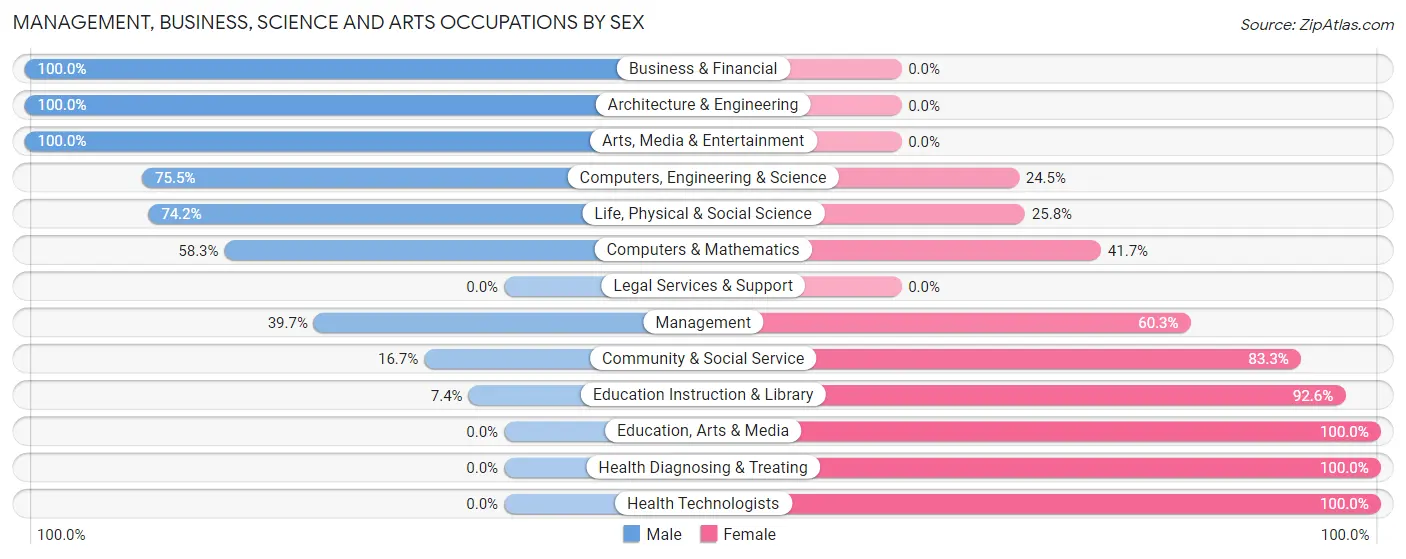
Management, Business, Science and Arts Occupations by Sex
Within the Management, Business, Science and Arts occupations in San Ildefonso Pueblo, the most male-oriented occupations are Business & Financial (100.0%), Architecture & Engineering (100.0%), and Arts, Media & Entertainment (100.0%), while the most female-oriented occupations are Education, Arts & Media (100.0%), Health Diagnosing & Treating (100.0%), and Health Technologists (100.0%).
| Occupation | Male | Female |
| Management | 25 (39.7%) | 38 (60.3%) |
| Business & Financial | 18 (100.0%) | 0 (0.0%) |
| Computers, Engineering & Science | 40 (75.5%) | 13 (24.5%) |
| Computers & Mathematics | 7 (58.3%) | 5 (41.7%) |
| Architecture & Engineering | 10 (100.0%) | 0 (0.0%) |
| Life, Physical & Social Science | 23 (74.2%) | 8 (25.8%) |
| Community & Social Service | 6 (16.7%) | 30 (83.3%) |
| Education, Arts & Media | 0 (0.0%) | 5 (100.0%) |
| Legal Services & Support | 0 (0.0%) | 0 (0.0%) |
| Education Instruction & Library | 2 (7.4%) | 25 (92.6%) |
| Arts, Media & Entertainment | 4 (100.0%) | 0 (0.0%) |
| Health Diagnosing & Treating | 0 (0.0%) | 6 (100.0%) |
| Health Technologists | 0 (0.0%) | 6 (100.0%) |
| Total (Category) | 89 (50.6%) | 87 (49.4%) |
| Total (Overall) | 179 (49.0%) | 186 (51.0%) |
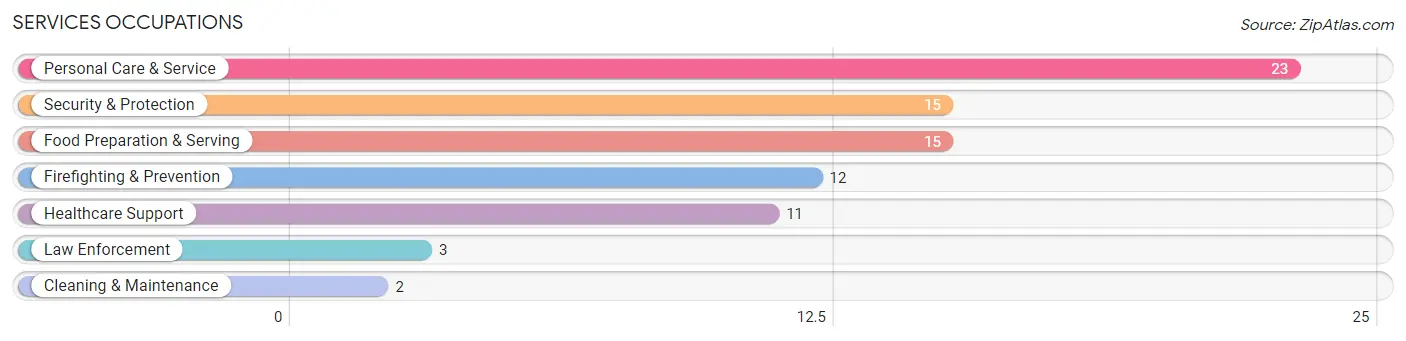
Services Occupations
The most common Services occupations in San Ildefonso Pueblo are Personal Care & Service (23 | 6.3%), Security & Protection (15 | 4.1%), Food Preparation & Serving (15 | 4.1%), Firefighting & Prevention (12 | 3.3%), and Healthcare Support (11 | 3.0%).
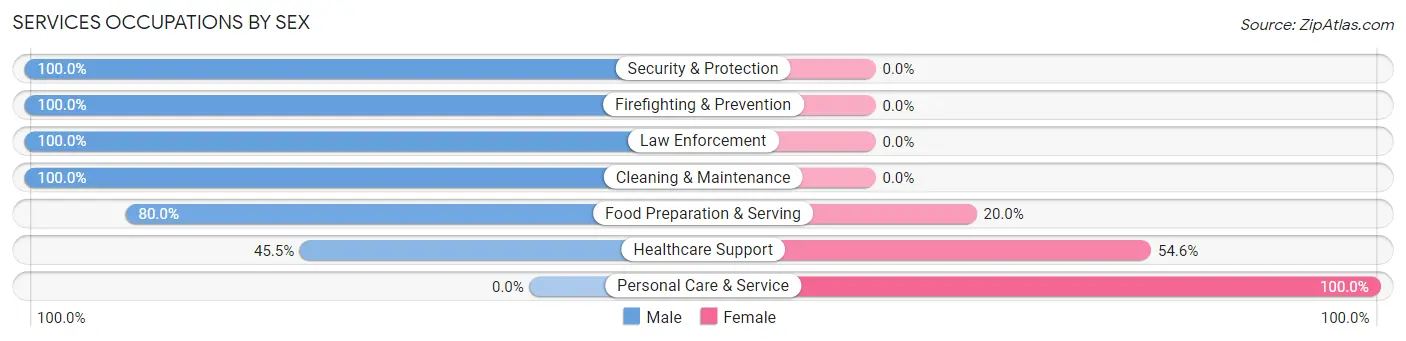
Services Occupations by Sex
Within the Services occupations in San Ildefonso Pueblo, the most male-oriented occupations are Security & Protection (100.0%), Firefighting & Prevention (100.0%), and Law Enforcement (100.0%), while the most female-oriented occupations are Personal Care & Service (100.0%), Healthcare Support (54.5%), and Food Preparation & Serving (20.0%).
| Occupation | Male | Female |
| Healthcare Support | 5 (45.5%) | 6 (54.5%) |
| Security & Protection | 15 (100.0%) | 0 (0.0%) |
| Firefighting & Prevention | 12 (100.0%) | 0 (0.0%) |
| Law Enforcement | 3 (100.0%) | 0 (0.0%) |
| Food Preparation & Serving | 12 (80.0%) | 3 (20.0%) |
| Cleaning & Maintenance | 2 (100.0%) | 0 (0.0%) |
| Personal Care & Service | 0 (0.0%) | 23 (100.0%) |
| Total (Category) | 34 (51.5%) | 32 (48.5%) |
| Total (Overall) | 179 (49.0%) | 186 (51.0%) |
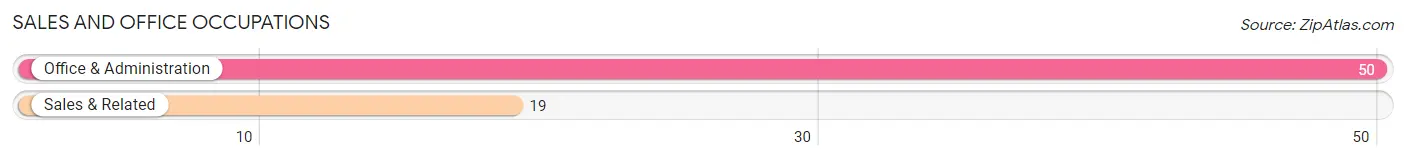
Sales and Office Occupations
The most common Sales and Office occupations in San Ildefonso Pueblo are Office & Administration (50 | 13.7%), and Sales & Related (19 | 5.2%).
Sales and Office Occupations by Sex
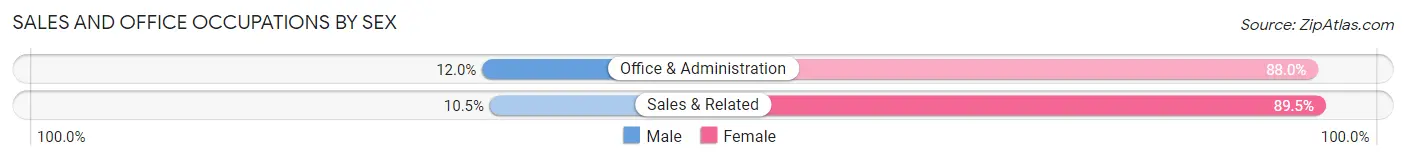
| Occupation | Male | Female |
| Sales & Related | 2 (10.5%) | 17 (89.5%) |
| Office & Administration | 6 (12.0%) | 44 (88.0%) |
| Total (Category) | 8 (11.6%) | 61 (88.4%) |
| Total (Overall) | 179 (49.0%) | 186 (51.0%) |
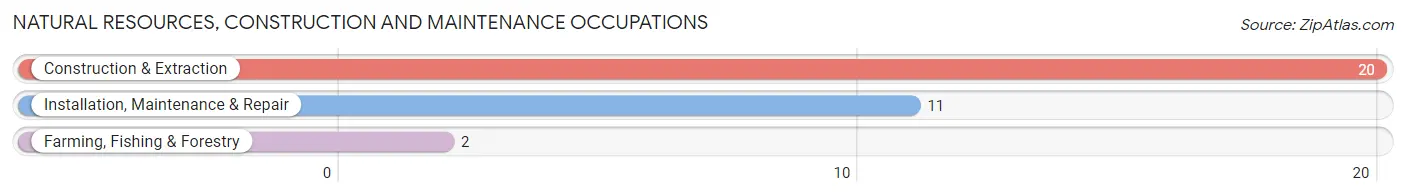
Natural Resources, Construction and Maintenance Occupations
The most common Natural Resources, Construction and Maintenance occupations in San Ildefonso Pueblo are Construction & Extraction (20 | 5.5%), Installation, Maintenance & Repair (11 | 3.0%), and Farming, Fishing & Forestry (2 | 0.5%).
Natural Resources, Construction and Maintenance Occupations by Sex
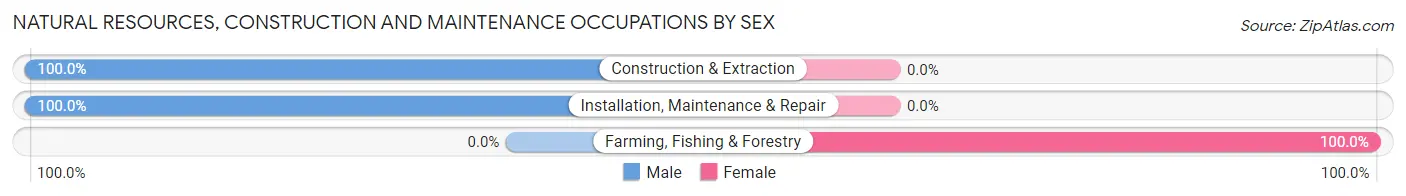
| Occupation | Male | Female |
| Farming, Fishing & Forestry | 0 (0.0%) | 2 (100.0%) |
| Construction & Extraction | 20 (100.0%) | 0 (0.0%) |
| Installation, Maintenance & Repair | 11 (100.0%) | 0 (0.0%) |
| Total (Category) | 31 (93.9%) | 2 (6.1%) |
| Total (Overall) | 179 (49.0%) | 186 (51.0%) |
Production, Transportation and Moving Occupations
The most common Production, Transportation and Moving occupations in San Ildefonso Pueblo are Production (18 | 4.9%), and Material Moving (3 | 0.8%).
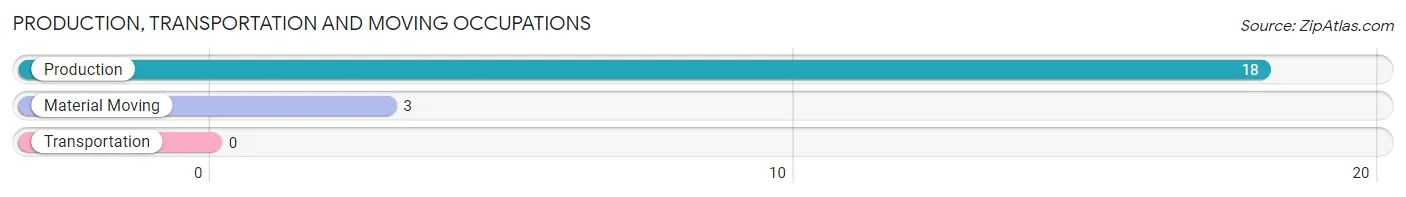
Production, Transportation and Moving Occupations by Sex
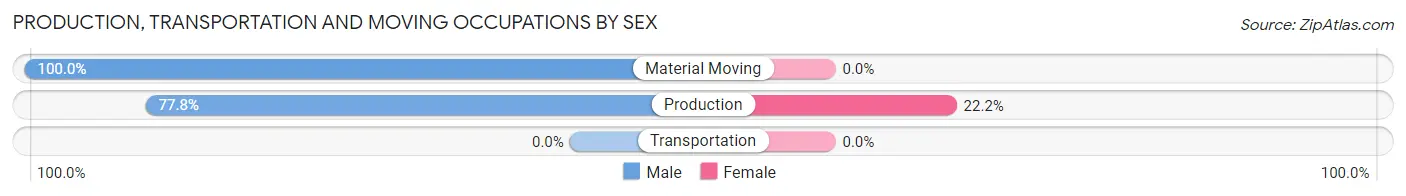
| Occupation | Male | Female |
| Production | 14 (77.8%) | 4 (22.2%) |
| Transportation | 0 (0.0%) | 0 (0.0%) |
| Material Moving | 3 (100.0%) | 0 (0.0%) |
| Total (Category) | 17 (80.9%) | 4 (19.1%) |
| Total (Overall) | 179 (49.0%) | 186 (51.0%) |
Employment Industries by Sex in San Ildefonso Pueblo
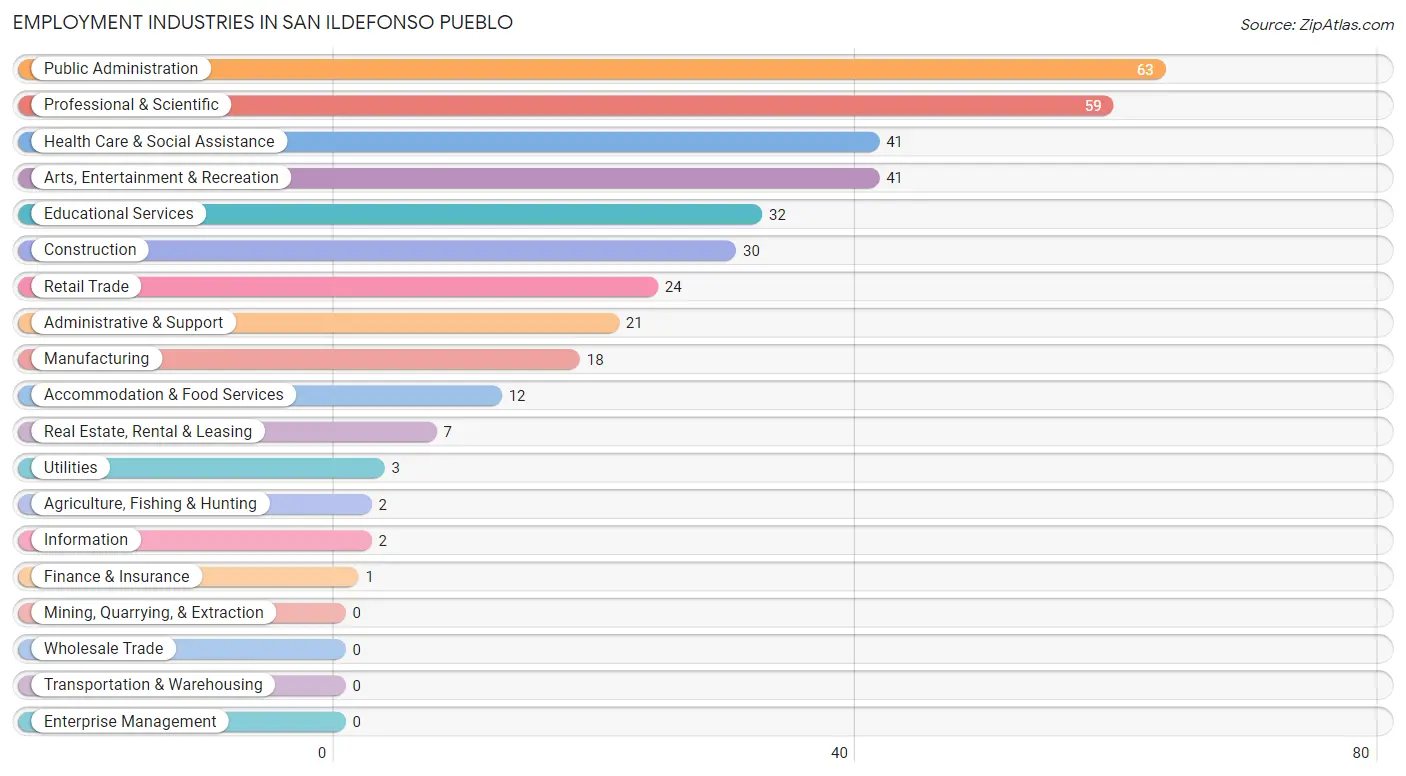
Employment Industries in San Ildefonso Pueblo
The major employment industries in San Ildefonso Pueblo include Public Administration (63 | 17.3%), Professional & Scientific (59 | 16.2%), Health Care & Social Assistance (41 | 11.2%), Arts, Entertainment & Recreation (41 | 11.2%), and Educational Services (32 | 8.8%).
Employment Industries by Sex in San Ildefonso Pueblo
The San Ildefonso Pueblo industries that see more men than women are Construction (93.3%), Professional & Scientific (78.0%), and Manufacturing (77.8%), whereas the industries that tend to have a higher number of women are Agriculture, Fishing & Hunting (100.0%), Utilities (100.0%), and Information (100.0%).
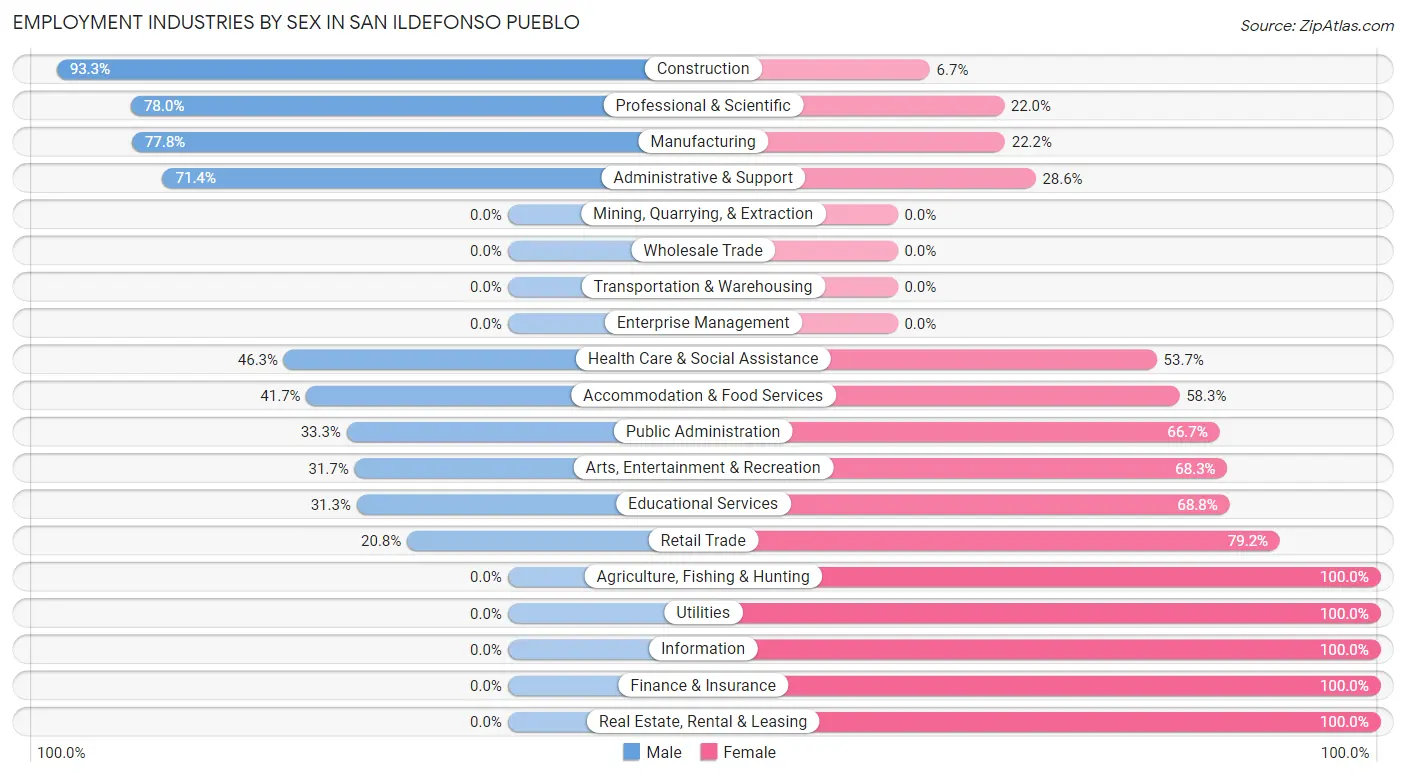
| Industry | Male | Female |
| Agriculture, Fishing & Hunting | 0 (0.0%) | 2 (100.0%) |
| Mining, Quarrying, & Extraction | 0 (0.0%) | 0 (0.0%) |
| Construction | 28 (93.3%) | 2 (6.7%) |
| Manufacturing | 14 (77.8%) | 4 (22.2%) |
| Wholesale Trade | 0 (0.0%) | 0 (0.0%) |
| Retail Trade | 5 (20.8%) | 19 (79.2%) |
| Transportation & Warehousing | 0 (0.0%) | 0 (0.0%) |
| Utilities | 0 (0.0%) | 3 (100.0%) |
| Information | 0 (0.0%) | 2 (100.0%) |
| Finance & Insurance | 0 (0.0%) | 1 (100.0%) |
| Real Estate, Rental & Leasing | 0 (0.0%) | 7 (100.0%) |
| Professional & Scientific | 46 (78.0%) | 13 (22.0%) |
| Enterprise Management | 0 (0.0%) | 0 (0.0%) |
| Administrative & Support | 15 (71.4%) | 6 (28.6%) |
| Educational Services | 10 (31.2%) | 22 (68.8%) |
| Health Care & Social Assistance | 19 (46.3%) | 22 (53.7%) |
| Arts, Entertainment & Recreation | 13 (31.7%) | 28 (68.3%) |
| Accommodation & Food Services | 5 (41.7%) | 7 (58.3%) |
| Public Administration | 21 (33.3%) | 42 (66.7%) |
| Total | 179 (49.0%) | 186 (51.0%) |
Education in San Ildefonso Pueblo
School Enrollment in San Ildefonso Pueblo
The most common levels of schooling among the 211 students in San Ildefonso Pueblo are high school (62 | 29.4%), elementary school (56 | 26.5%), and college / undergraduate (40 | 19.0%).
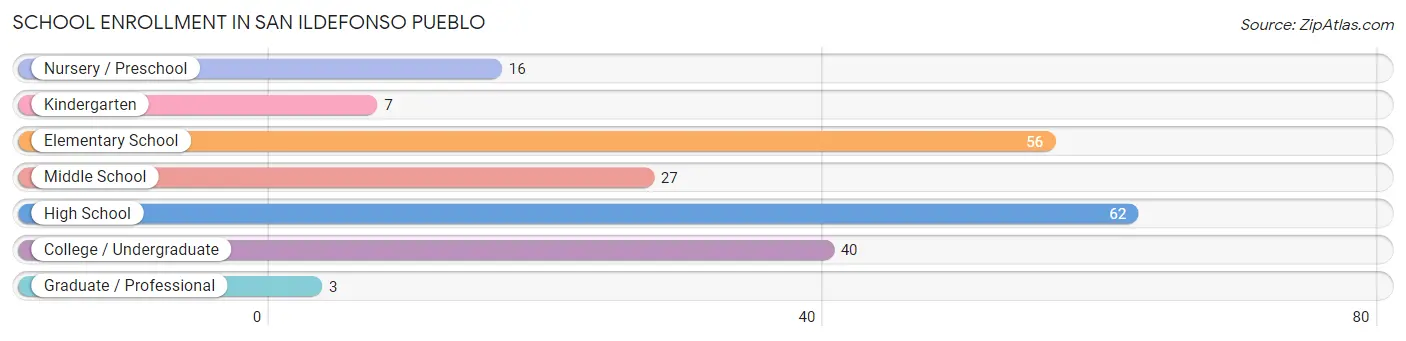
| School Level | # Students | % Students |
| Nursery / Preschool | 16 | 7.6% |
| Kindergarten | 7 | 3.3% |
| Elementary School | 56 | 26.5% |
| Middle School | 27 | 12.8% |
| High School | 62 | 29.4% |
| College / Undergraduate | 40 | 19.0% |
| Graduate / Professional | 3 | 1.4% |
| Total | 211 | 100.0% |
School Enrollment by Age by Funding Source in San Ildefonso Pueblo
Out of a total of 211 students who are enrolled in schools in San Ildefonso Pueblo, 13 (6.2%) attend a private institution, while the remaining 198 (93.8%) are enrolled in public schools. The age group of 3 to 4 year olds has the highest likelihood of being enrolled in private schools, with 3 (18.8% in the age bracket) enrolled. Conversely, the age group of 5 to 9 year old has the lowest likelihood of being enrolled in a private school, with 63 (100.0% in the age bracket) attending a public institution.
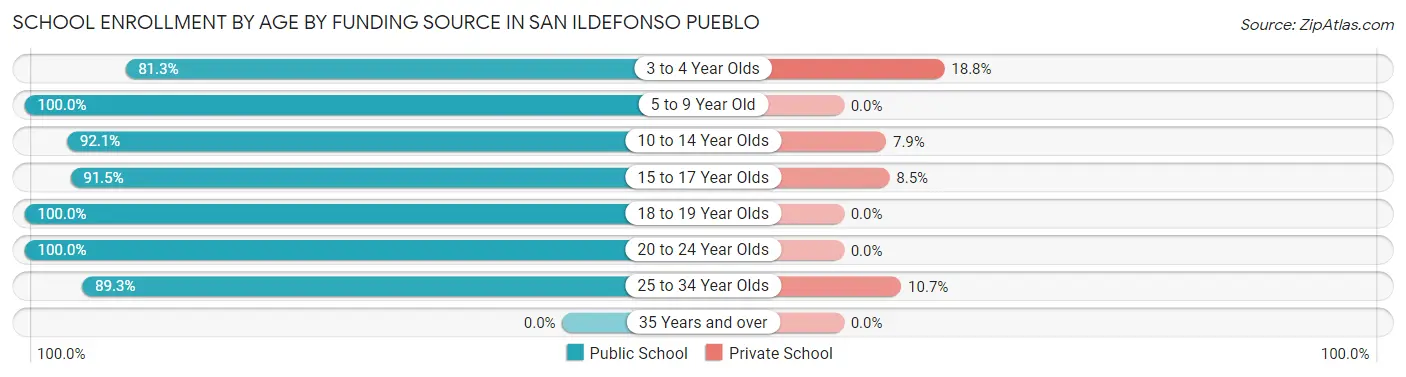
| Age Bracket | Public School | Private School |
| 3 to 4 Year Olds | 13 (81.2%) | 3 (18.8%) |
| 5 to 9 Year Old | 63 (100.0%) | 0 (0.0%) |
| 10 to 14 Year Olds | 35 (92.1%) | 3 (7.9%) |
| 15 to 17 Year Olds | 43 (91.5%) | 4 (8.5%) |
| 18 to 19 Year Olds | 11 (100.0%) | 0 (0.0%) |
| 20 to 24 Year Olds | 8 (100.0%) | 0 (0.0%) |
| 25 to 34 Year Olds | 25 (89.3%) | 3 (10.7%) |
| 35 Years and over | 0 (0.0%) | 0 (0.0%) |
| Total | 198 (93.8%) | 13 (6.2%) |
Educational Attainment by Field of Study in San Ildefonso Pueblo
Literature & languages (20 | 18.2%), physical & health sciences (12 | 10.9%), bio, nature & agricultural (10 | 9.1%), computers & mathematics (9 | 8.2%), and education (9 | 8.2%) are the most common fields of study among 110 individuals in San Ildefonso Pueblo who have obtained a bachelor's degree or higher.
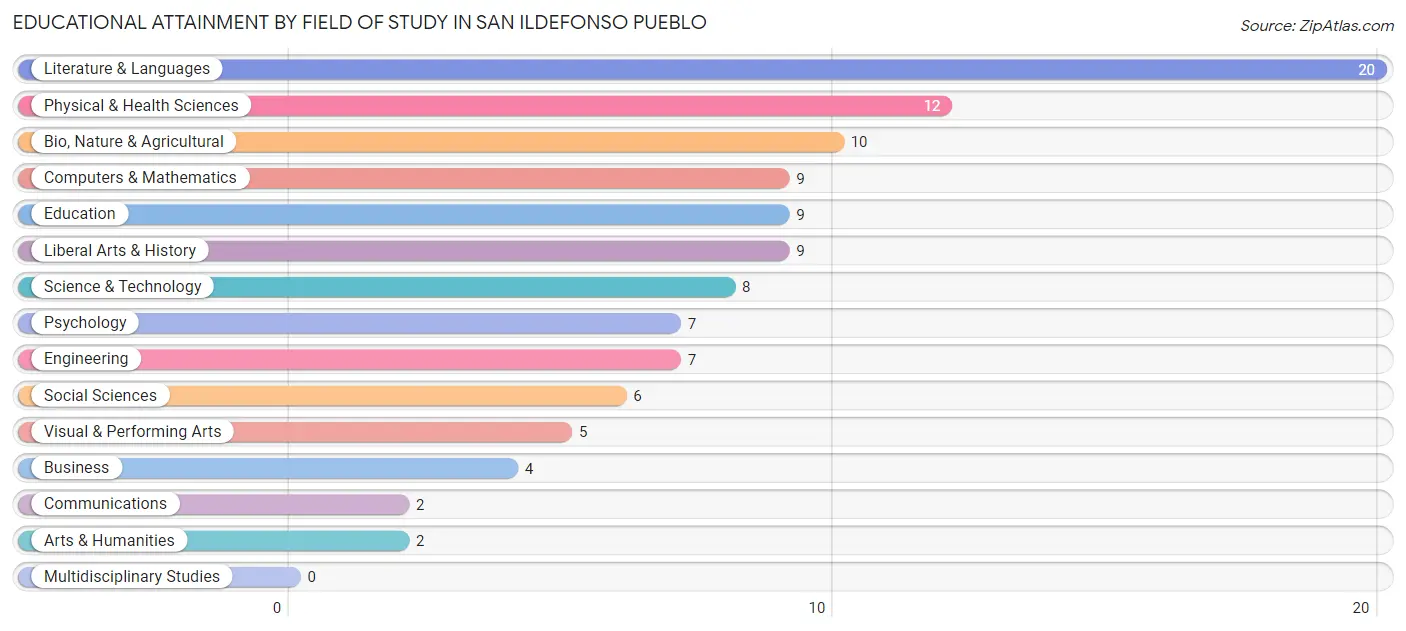
| Field of Study | # Graduates | % Graduates |
| Computers & Mathematics | 9 | 8.2% |
| Bio, Nature & Agricultural | 10 | 9.1% |
| Physical & Health Sciences | 12 | 10.9% |
| Psychology | 7 | 6.4% |
| Social Sciences | 6 | 5.4% |
| Engineering | 7 | 6.4% |
| Multidisciplinary Studies | 0 | 0.0% |
| Science & Technology | 8 | 7.3% |
| Business | 4 | 3.6% |
| Education | 9 | 8.2% |
| Literature & Languages | 20 | 18.2% |
| Liberal Arts & History | 9 | 8.2% |
| Visual & Performing Arts | 5 | 4.5% |
| Communications | 2 | 1.8% |
| Arts & Humanities | 2 | 1.8% |
| Total | 110 | 100.0% |
Transportation & Commute in San Ildefonso Pueblo
Vehicle Availability by Sex in San Ildefonso Pueblo
The most prevalent vehicle ownership categories in San Ildefonso Pueblo are males with 3 vehicles (82, accounting for 47.4%) and females with 3 vehicles (66, making up 44.1%).
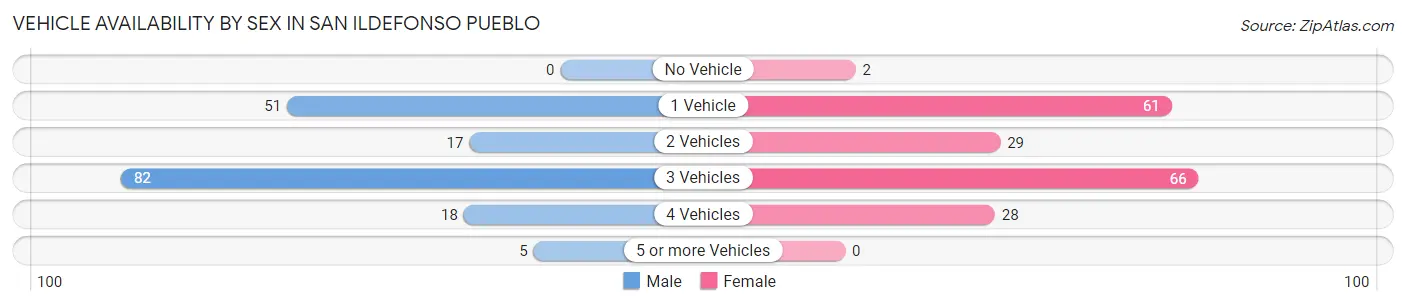
| Vehicles Available | Male | Female |
| No Vehicle | 0 (0.0%) | 2 (1.1%) |
| 1 Vehicle | 51 (29.5%) | 61 (32.8%) |
| 2 Vehicles | 17 (9.8%) | 29 (15.6%) |
| 3 Vehicles | 82 (47.4%) | 66 (35.5%) |
| 4 Vehicles | 18 (10.4%) | 28 (15.0%) |
| 5 or more Vehicles | 5 (2.9%) | 0 (0.0%) |
| Total | 173 (100.0%) | 186 (100.0%) |
Commute Time in San Ildefonso Pueblo
The most frequently occuring commute durations in San Ildefonso Pueblo are 30 to 34 minutes (65 commuters, 19.5%), 20 to 24 minutes (60 commuters, 18.0%), and 15 to 19 minutes (45 commuters, 13.5%).
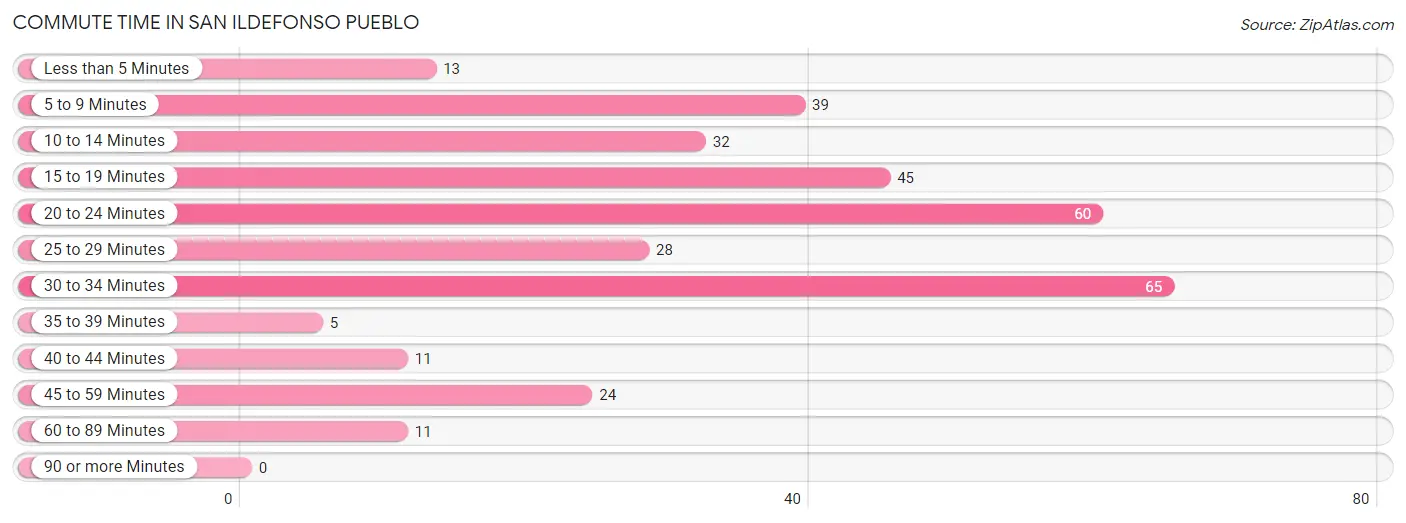
| Commute Time | # Commuters | % Commuters |
| Less than 5 Minutes | 13 | 3.9% |
| 5 to 9 Minutes | 39 | 11.7% |
| 10 to 14 Minutes | 32 | 9.6% |
| 15 to 19 Minutes | 45 | 13.5% |
| 20 to 24 Minutes | 60 | 18.0% |
| 25 to 29 Minutes | 28 | 8.4% |
| 30 to 34 Minutes | 65 | 19.5% |
| 35 to 39 Minutes | 5 | 1.5% |
| 40 to 44 Minutes | 11 | 3.3% |
| 45 to 59 Minutes | 24 | 7.2% |
| 60 to 89 Minutes | 11 | 3.3% |
| 90 or more Minutes | 0 | 0.0% |
Commute Time by Sex in San Ildefonso Pueblo
The most common commute times in San Ildefonso Pueblo are 30 to 34 minutes (40 commuters, 24.5%) for males and 5 to 9 minutes (36 commuters, 21.2%) for females.
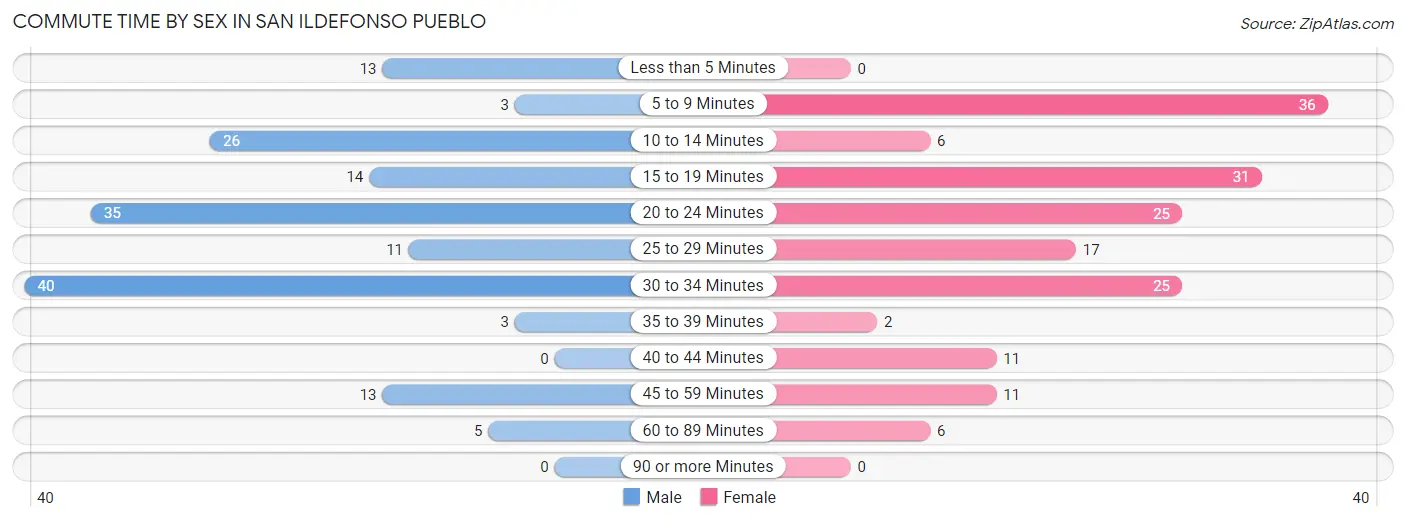
| Commute Time | Male | Female |
| Less than 5 Minutes | 13 (8.0%) | 0 (0.0%) |
| 5 to 9 Minutes | 3 (1.8%) | 36 (21.2%) |
| 10 to 14 Minutes | 26 (16.0%) | 6 (3.5%) |
| 15 to 19 Minutes | 14 (8.6%) | 31 (18.2%) |
| 20 to 24 Minutes | 35 (21.5%) | 25 (14.7%) |
| 25 to 29 Minutes | 11 (6.8%) | 17 (10.0%) |
| 30 to 34 Minutes | 40 (24.5%) | 25 (14.7%) |
| 35 to 39 Minutes | 3 (1.8%) | 2 (1.2%) |
| 40 to 44 Minutes | 0 (0.0%) | 11 (6.5%) |
| 45 to 59 Minutes | 13 (8.0%) | 11 (6.5%) |
| 60 to 89 Minutes | 5 (3.1%) | 6 (3.5%) |
| 90 or more Minutes | 0 (0.0%) | 0 (0.0%) |
Time of Departure to Work by Sex in San Ildefonso Pueblo
The most frequent times of departure to work in San Ildefonso Pueblo are 7:00 AM to 7:29 AM (52, 31.9%) for males and 8:00 AM to 8:29 AM (56, 32.9%) for females.
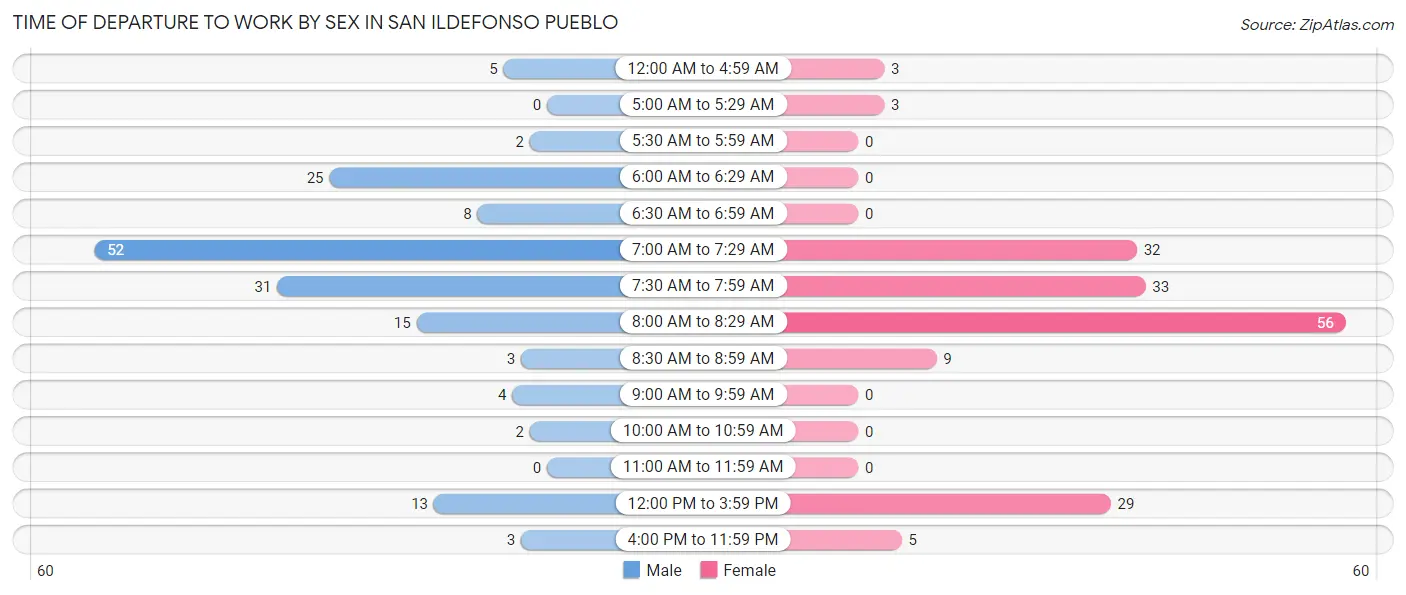
| Time of Departure | Male | Female |
| 12:00 AM to 4:59 AM | 5 (3.1%) | 3 (1.8%) |
| 5:00 AM to 5:29 AM | 0 (0.0%) | 3 (1.8%) |
| 5:30 AM to 5:59 AM | 2 (1.2%) | 0 (0.0%) |
| 6:00 AM to 6:29 AM | 25 (15.3%) | 0 (0.0%) |
| 6:30 AM to 6:59 AM | 8 (4.9%) | 0 (0.0%) |
| 7:00 AM to 7:29 AM | 52 (31.9%) | 32 (18.8%) |
| 7:30 AM to 7:59 AM | 31 (19.0%) | 33 (19.4%) |
| 8:00 AM to 8:29 AM | 15 (9.2%) | 56 (32.9%) |
| 8:30 AM to 8:59 AM | 3 (1.8%) | 9 (5.3%) |
| 9:00 AM to 9:59 AM | 4 (2.5%) | 0 (0.0%) |
| 10:00 AM to 10:59 AM | 2 (1.2%) | 0 (0.0%) |
| 11:00 AM to 11:59 AM | 0 (0.0%) | 0 (0.0%) |
| 12:00 PM to 3:59 PM | 13 (8.0%) | 29 (17.1%) |
| 4:00 PM to 11:59 PM | 3 (1.8%) | 5 (2.9%) |
| Total | 163 (100.0%) | 170 (100.0%) |
Housing Occupancy in San Ildefonso Pueblo
Occupancy by Ownership in San Ildefonso Pueblo
Of the total 239 dwellings in San Ildefonso Pueblo, owner-occupied units account for 191 (79.9%), while renter-occupied units make up 48 (20.1%).
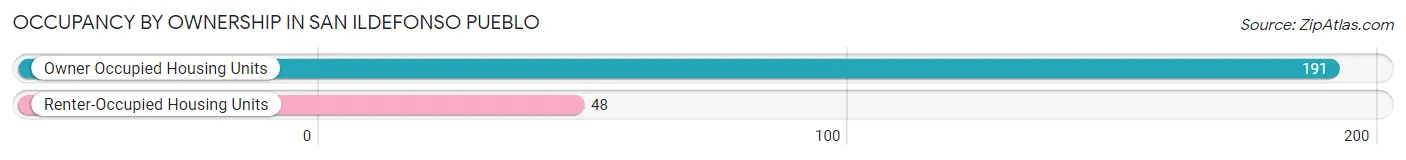
| Occupancy | # Housing Units | % Housing Units |
| Owner Occupied Housing Units | 191 | 79.9% |
| Renter-Occupied Housing Units | 48 | 20.1% |
| Total Occupied Housing Units | 239 | 100.0% |
Occupancy by Household Size in San Ildefonso Pueblo
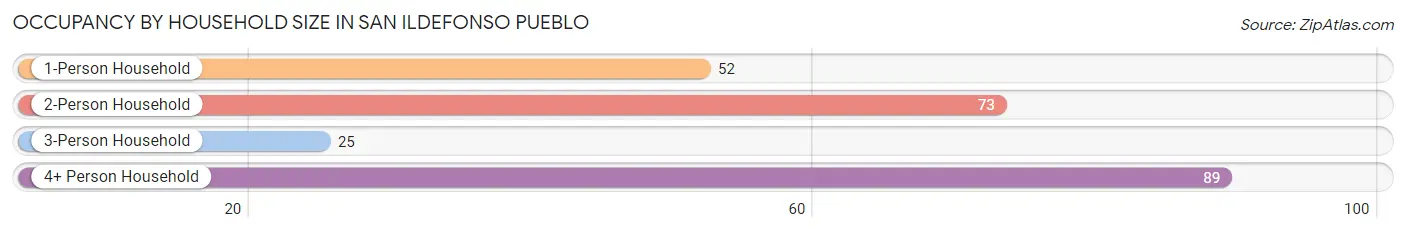
| Household Size | # Housing Units | % Housing Units |
| 1-Person Household | 52 | 21.8% |
| 2-Person Household | 73 | 30.5% |
| 3-Person Household | 25 | 10.5% |
| 4+ Person Household | 89 | 37.2% |
| Total Housing Units | 239 | 100.0% |
Occupancy by Ownership by Household Size in San Ildefonso Pueblo
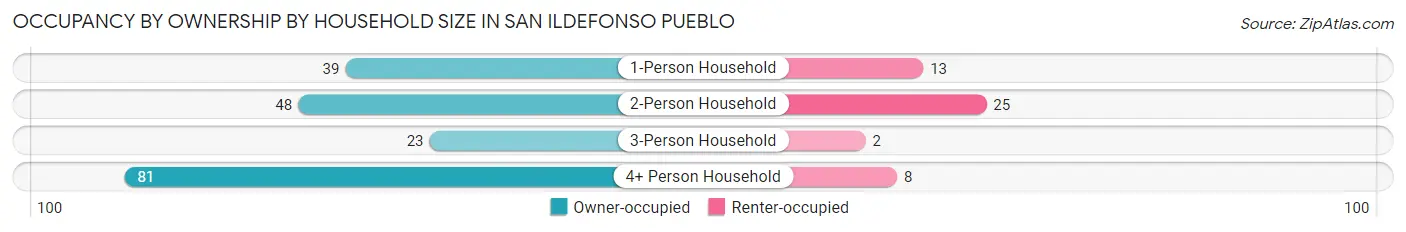
| Household Size | Owner-occupied | Renter-occupied |
| 1-Person Household | 39 (75.0%) | 13 (25.0%) |
| 2-Person Household | 48 (65.7%) | 25 (34.3%) |
| 3-Person Household | 23 (92.0%) | 2 (8.0%) |
| 4+ Person Household | 81 (91.0%) | 8 (9.0%) |
| Total Housing Units | 191 (79.9%) | 48 (20.1%) |
Occupancy by Educational Attainment in San Ildefonso Pueblo
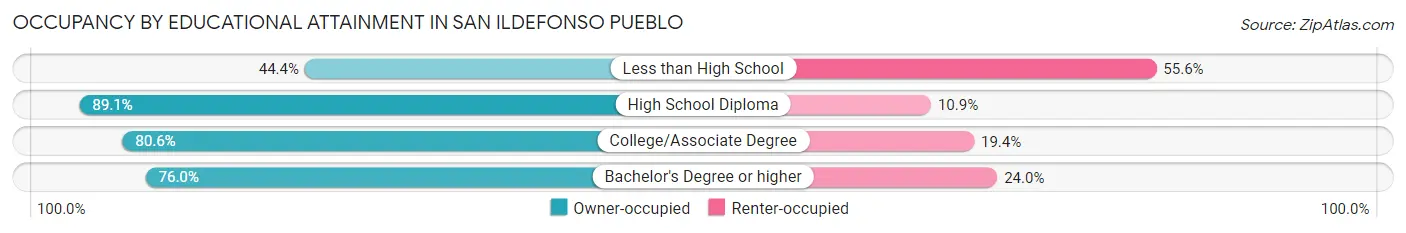
| Household Size | Owner-occupied | Renter-occupied |
| Less than High School | 4 (44.4%) | 5 (55.6%) |
| High School Diploma | 41 (89.1%) | 5 (10.9%) |
| College/Associate Degree | 108 (80.6%) | 26 (19.4%) |
| Bachelor's Degree or higher | 38 (76.0%) | 12 (24.0%) |
Occupancy by Age of Householder in San Ildefonso Pueblo
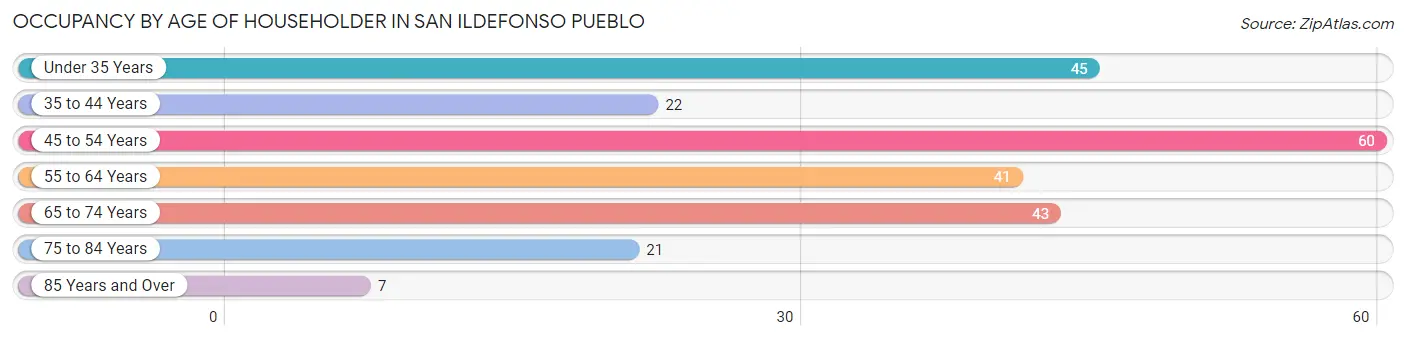
| Age Bracket | # Households | % Households |
| Under 35 Years | 45 | 18.8% |
| 35 to 44 Years | 22 | 9.2% |
| 45 to 54 Years | 60 | 25.1% |
| 55 to 64 Years | 41 | 17.2% |
| 65 to 74 Years | 43 | 18.0% |
| 75 to 84 Years | 21 | 8.8% |
| 85 Years and Over | 7 | 2.9% |
| Total | 239 | 100.0% |
Housing Finances in San Ildefonso Pueblo
Median Income by Occupancy in San Ildefonso Pueblo
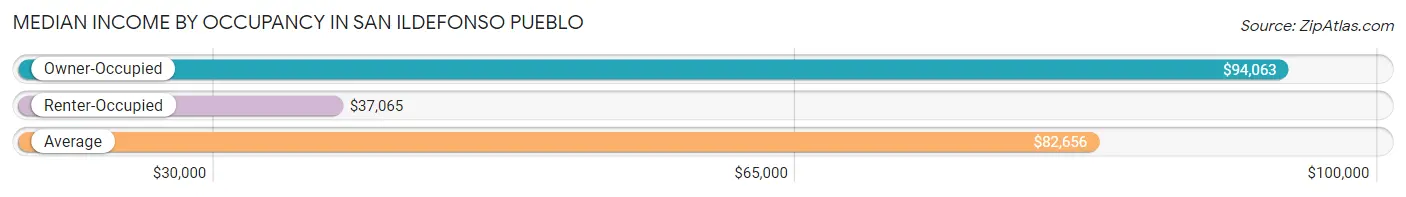
| Occupancy Type | # Households | Median Income |
| Owner-Occupied | 191 (79.9%) | $94,063 |
| Renter-Occupied | 48 (20.1%) | $37,065 |
| Average | 239 (100.0%) | $82,656 |
Occupancy by Householder Income Bracket in San Ildefonso Pueblo
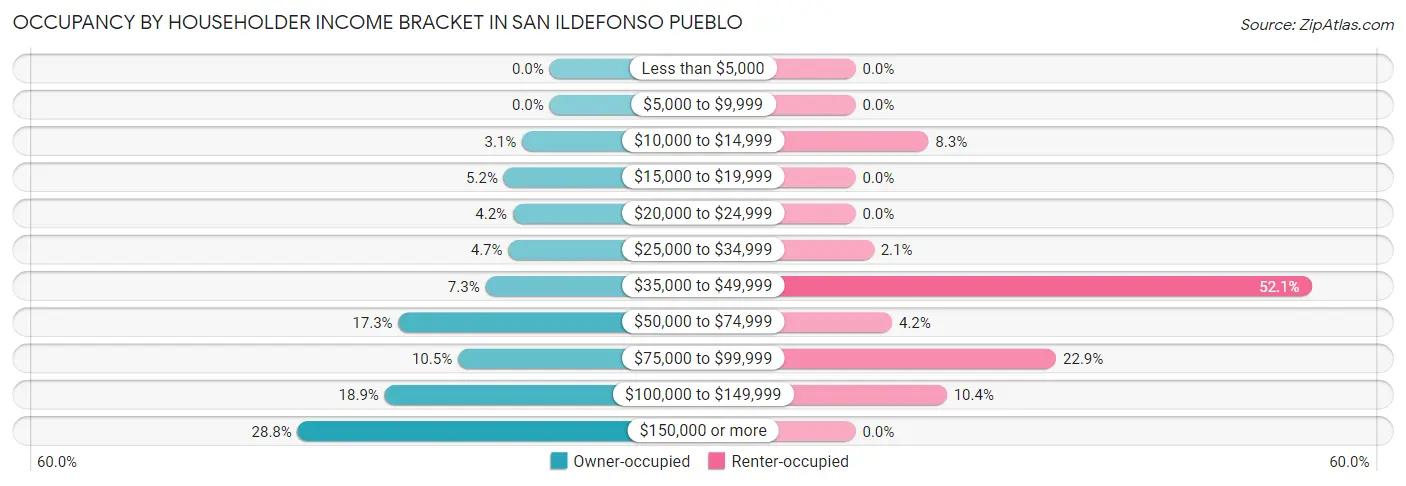
| Income Bracket | Owner-occupied | Renter-occupied |
| Less than $5,000 | 0 (0.0%) | 0 (0.0%) |
| $5,000 to $9,999 | 0 (0.0%) | 0 (0.0%) |
| $10,000 to $14,999 | 6 (3.1%) | 4 (8.3%) |
| $15,000 to $19,999 | 10 (5.2%) | 0 (0.0%) |
| $20,000 to $24,999 | 8 (4.2%) | 0 (0.0%) |
| $25,000 to $34,999 | 9 (4.7%) | 1 (2.1%) |
| $35,000 to $49,999 | 14 (7.3%) | 25 (52.1%) |
| $50,000 to $74,999 | 33 (17.3%) | 2 (4.2%) |
| $75,000 to $99,999 | 20 (10.5%) | 11 (22.9%) |
| $100,000 to $149,999 | 36 (18.9%) | 5 (10.4%) |
| $150,000 or more | 55 (28.8%) | 0 (0.0%) |
| Total | 191 (100.0%) | 48 (100.0%) |
Monthly Housing Cost Tiers in San Ildefonso Pueblo
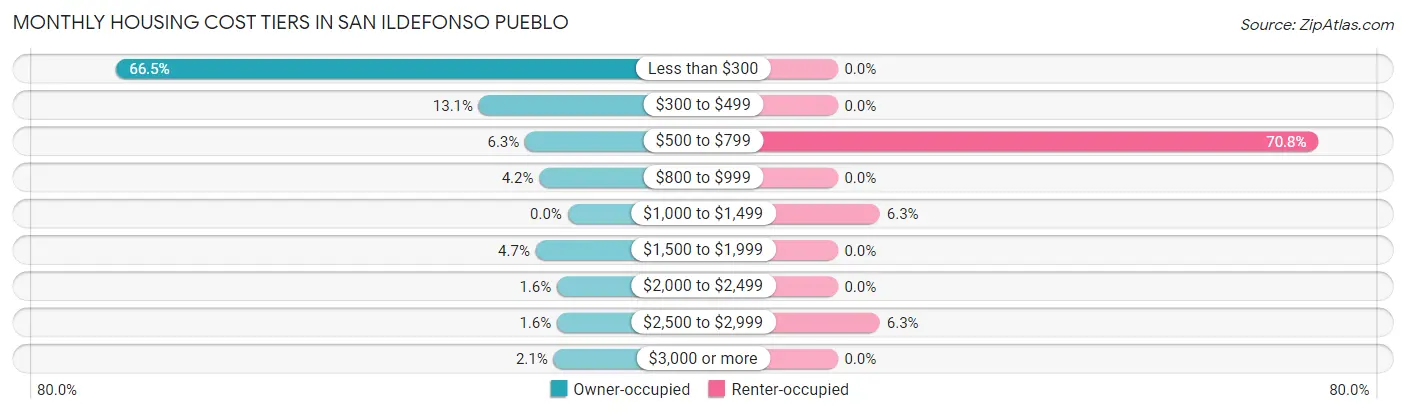
| Monthly Cost | Owner-occupied | Renter-occupied |
| Less than $300 | 127 (66.5%) | 0 (0.0%) |
| $300 to $499 | 25 (13.1%) | 0 (0.0%) |
| $500 to $799 | 12 (6.3%) | 34 (70.8%) |
| $800 to $999 | 8 (4.2%) | 0 (0.0%) |
| $1,000 to $1,499 | 0 (0.0%) | 3 (6.2%) |
| $1,500 to $1,999 | 9 (4.7%) | 0 (0.0%) |
| $2,000 to $2,499 | 3 (1.6%) | 0 (0.0%) |
| $2,500 to $2,999 | 3 (1.6%) | 3 (6.2%) |
| $3,000 or more | 4 (2.1%) | 0 (0.0%) |
| Total | 191 (100.0%) | 48 (100.0%) |
Physical Housing Characteristics in San Ildefonso Pueblo
Housing Structures in San Ildefonso Pueblo
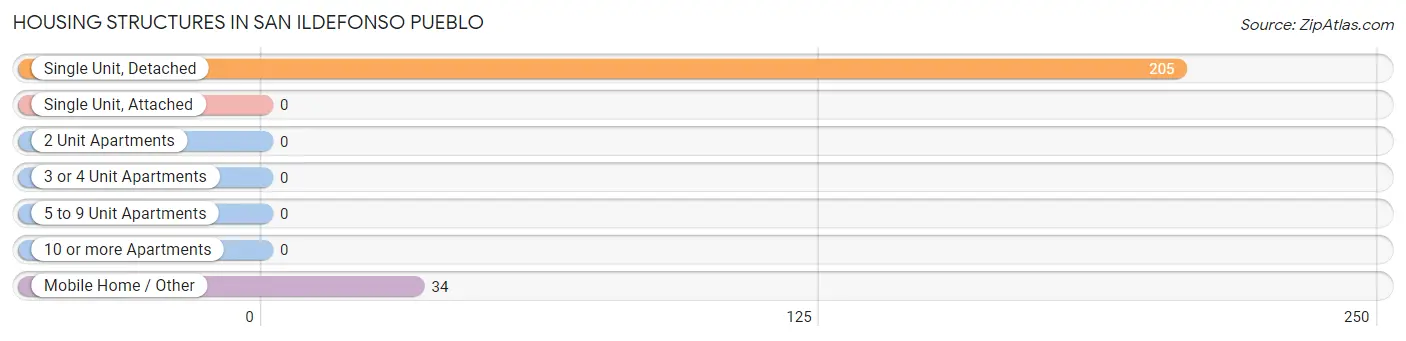
| Structure Type | # Housing Units | % Housing Units |
| Single Unit, Detached | 205 | 85.8% |
| Single Unit, Attached | 0 | 0.0% |
| 2 Unit Apartments | 0 | 0.0% |
| 3 or 4 Unit Apartments | 0 | 0.0% |
| 5 to 9 Unit Apartments | 0 | 0.0% |
| 10 or more Apartments | 0 | 0.0% |
| Mobile Home / Other | 34 | 14.2% |
| Total | 239 | 100.0% |
Housing Structures by Occupancy in San Ildefonso Pueblo
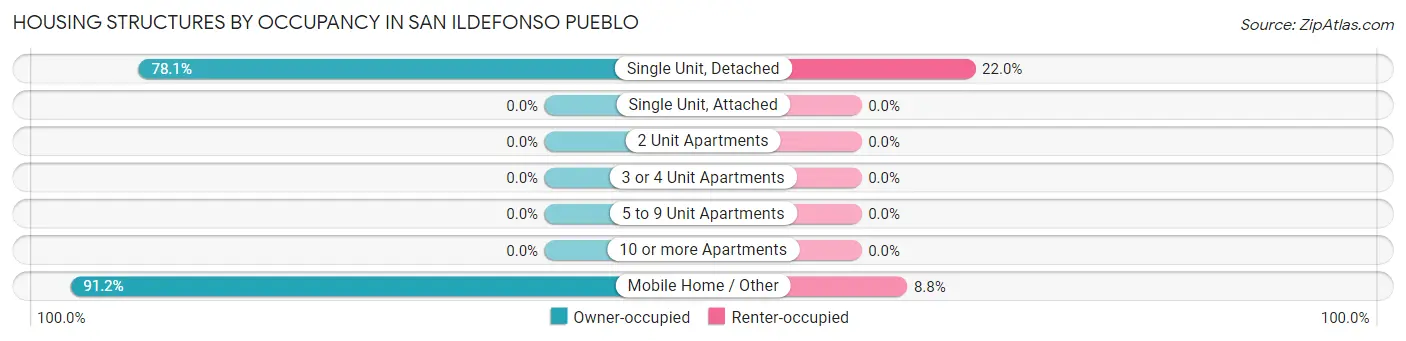
| Structure Type | Owner-occupied | Renter-occupied |
| Single Unit, Detached | 160 (78.0%) | 45 (22.0%) |
| Single Unit, Attached | 0 (0.0%) | 0 (0.0%) |
| 2 Unit Apartments | 0 (0.0%) | 0 (0.0%) |
| 3 or 4 Unit Apartments | 0 (0.0%) | 0 (0.0%) |
| 5 to 9 Unit Apartments | 0 (0.0%) | 0 (0.0%) |
| 10 or more Apartments | 0 (0.0%) | 0 (0.0%) |
| Mobile Home / Other | 31 (91.2%) | 3 (8.8%) |
| Total | 191 (79.9%) | 48 (20.1%) |
Housing Structures by Number of Rooms in San Ildefonso Pueblo
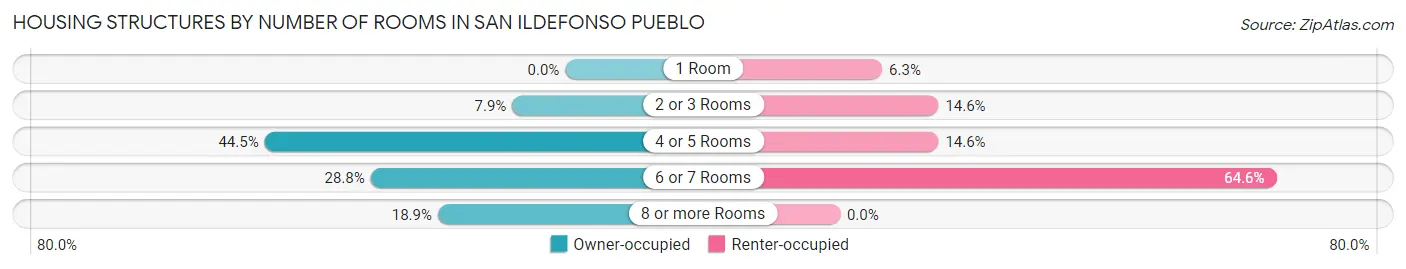
| Number of Rooms | Owner-occupied | Renter-occupied |
| 1 Room | 0 (0.0%) | 3 (6.2%) |
| 2 or 3 Rooms | 15 (7.9%) | 7 (14.6%) |
| 4 or 5 Rooms | 85 (44.5%) | 7 (14.6%) |
| 6 or 7 Rooms | 55 (28.8%) | 31 (64.6%) |
| 8 or more Rooms | 36 (18.9%) | 0 (0.0%) |
| Total | 191 (100.0%) | 48 (100.0%) |
Housing Structure by Heating Type in San Ildefonso Pueblo
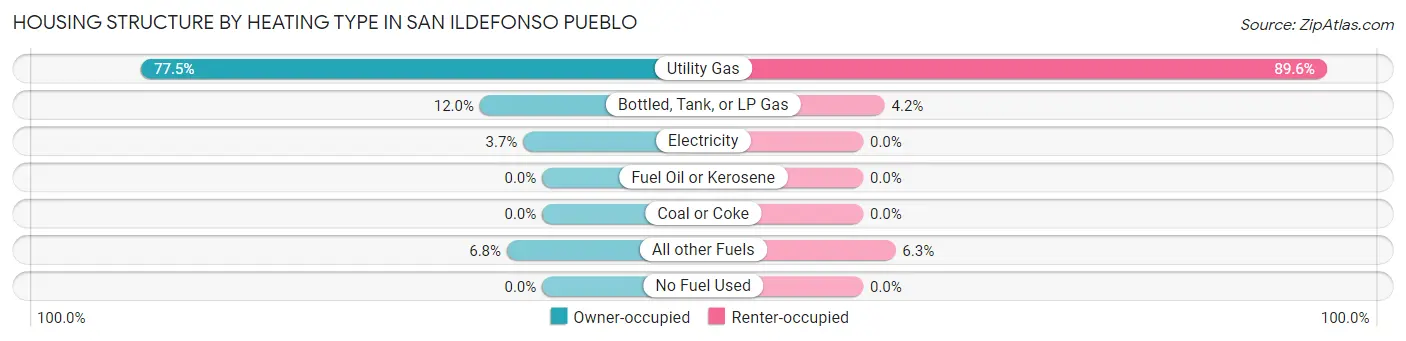
| Heating Type | Owner-occupied | Renter-occupied |
| Utility Gas | 148 (77.5%) | 43 (89.6%) |
| Bottled, Tank, or LP Gas | 23 (12.0%) | 2 (4.2%) |
| Electricity | 7 (3.7%) | 0 (0.0%) |
| Fuel Oil or Kerosene | 0 (0.0%) | 0 (0.0%) |
| Coal or Coke | 0 (0.0%) | 0 (0.0%) |
| All other Fuels | 13 (6.8%) | 3 (6.2%) |
| No Fuel Used | 0 (0.0%) | 0 (0.0%) |
| Total | 191 (100.0%) | 48 (100.0%) |
Household Vehicle Usage in San Ildefonso Pueblo
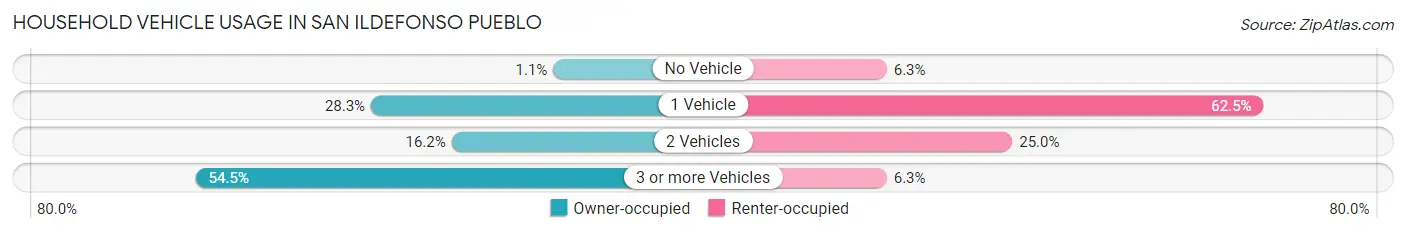
| Vehicles per Household | Owner-occupied | Renter-occupied |
| No Vehicle | 2 (1.1%) | 3 (6.2%) |
| 1 Vehicle | 54 (28.3%) | 30 (62.5%) |
| 2 Vehicles | 31 (16.2%) | 12 (25.0%) |
| 3 or more Vehicles | 104 (54.4%) | 3 (6.2%) |
| Total | 191 (100.0%) | 48 (100.0%) |
Real Estate & Mortgages in San Ildefonso Pueblo
Real Estate and Mortgage Overview in San Ildefonso Pueblo
| Characteristic | Without Mortgage | With Mortgage |
| Housing Units | 153 | 38 |
| Median Property Value | $269,300 | $220,000 |
| Median Household Income | $81,875 | $13 |
| Monthly Housing Costs | $181 | $4 |
| Real Estate Taxes | $1,292 | $15 |
Property Value by Mortgage Status in San Ildefonso Pueblo
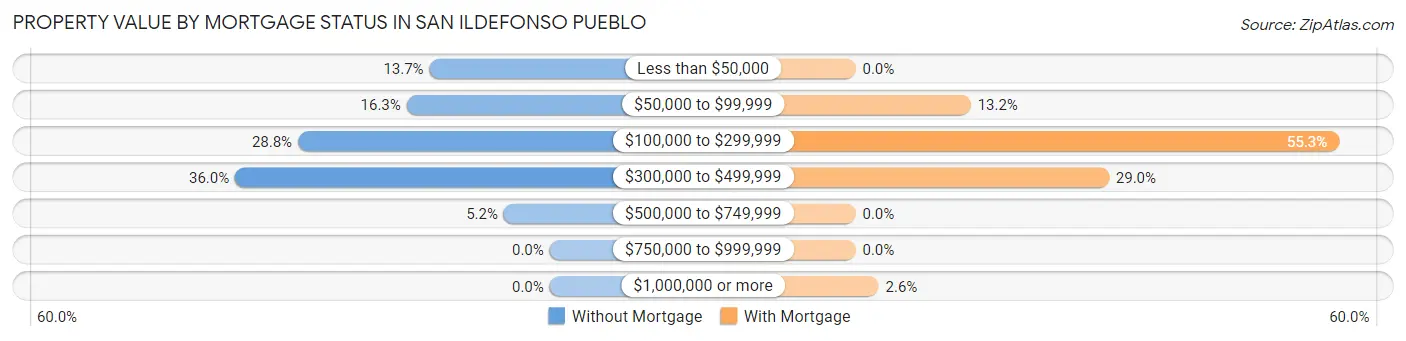
| Property Value | Without Mortgage | With Mortgage |
| Less than $50,000 | 21 (13.7%) | 0 (0.0%) |
| $50,000 to $99,999 | 25 (16.3%) | 5 (13.2%) |
| $100,000 to $299,999 | 44 (28.8%) | 21 (55.3%) |
| $300,000 to $499,999 | 55 (35.9%) | 11 (28.9%) |
| $500,000 to $749,999 | 8 (5.2%) | 0 (0.0%) |
| $750,000 to $999,999 | 0 (0.0%) | 0 (0.0%) |
| $1,000,000 or more | 0 (0.0%) | 1 (2.6%) |
| Total | 153 (100.0%) | 38 (100.0%) |
Household Income by Mortgage Status in San Ildefonso Pueblo
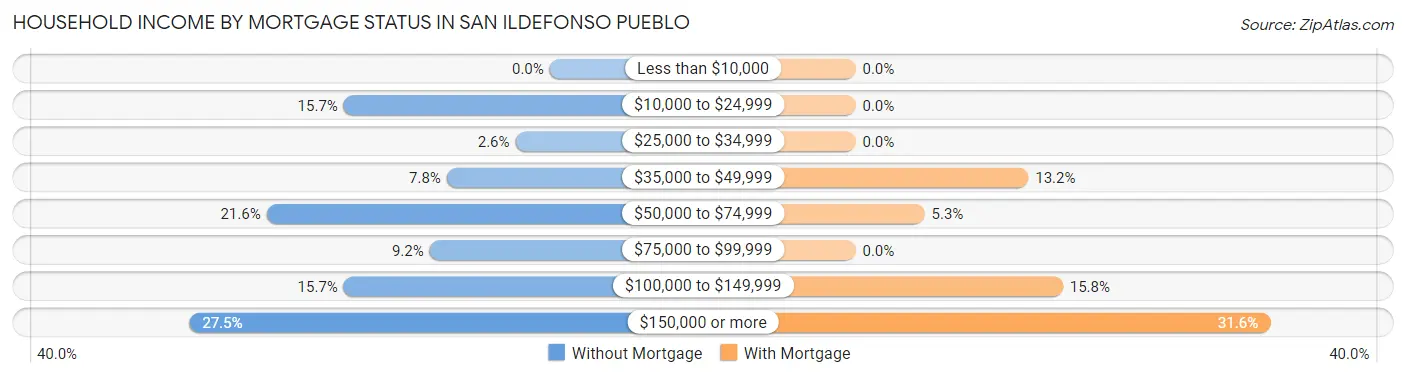
| Household Income | Without Mortgage | With Mortgage |
| Less than $10,000 | 0 (0.0%) | 0 (0.0%) |
| $10,000 to $24,999 | 24 (15.7%) | 0 (0.0%) |
| $25,000 to $34,999 | 4 (2.6%) | 0 (0.0%) |
| $35,000 to $49,999 | 12 (7.8%) | 5 (13.2%) |
| $50,000 to $74,999 | 33 (21.6%) | 2 (5.3%) |
| $75,000 to $99,999 | 14 (9.1%) | 0 (0.0%) |
| $100,000 to $149,999 | 24 (15.7%) | 6 (15.8%) |
| $150,000 or more | 42 (27.5%) | 12 (31.6%) |
| Total | 153 (100.0%) | 38 (100.0%) |
Property Value to Household Income Ratio in San Ildefonso Pueblo
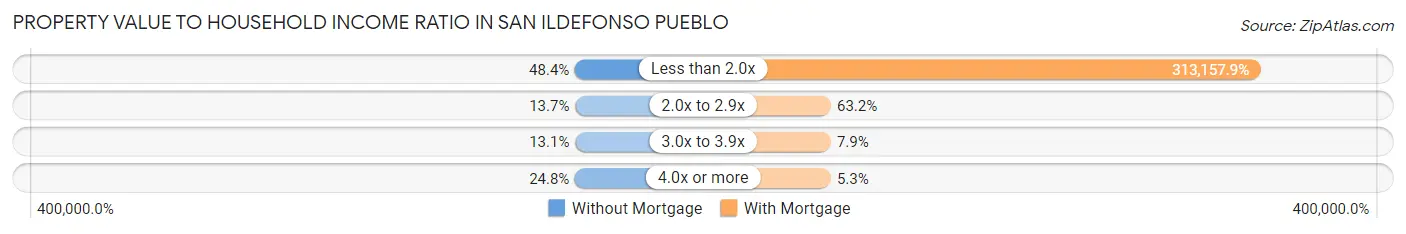
| Value-to-Income Ratio | Without Mortgage | With Mortgage |
| Less than 2.0x | 74 (48.4%) | 119,000 (313,157.9%) |
| 2.0x to 2.9x | 21 (13.7%) | 24 (63.2%) |
| 3.0x to 3.9x | 20 (13.1%) | 3 (7.9%) |
| 4.0x or more | 38 (24.8%) | 2 (5.3%) |
| Total | 153 (100.0%) | 38 (100.0%) |
Real Estate Taxes by Mortgage Status in San Ildefonso Pueblo
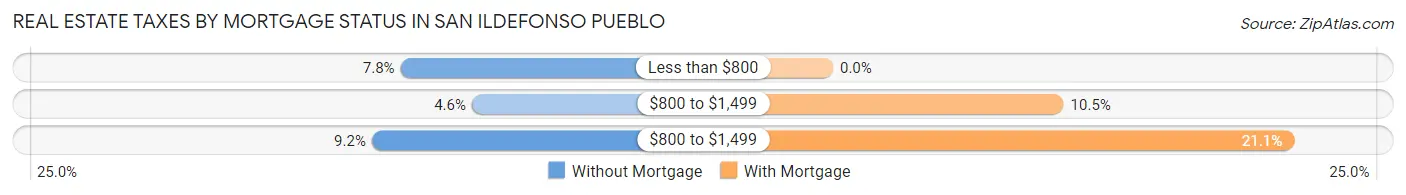
| Property Taxes | Without Mortgage | With Mortgage |
| Less than $800 | 12 (7.8%) | 0 (0.0%) |
| $800 to $1,499 | 7 (4.6%) | 4 (10.5%) |
| $800 to $1,499 | 14 (9.1%) | 8 (21.0%) |
| Total | 153 (100.0%) | 38 (100.0%) |
Health & Disability in San Ildefonso Pueblo
Health Insurance Coverage by Age in San Ildefonso Pueblo
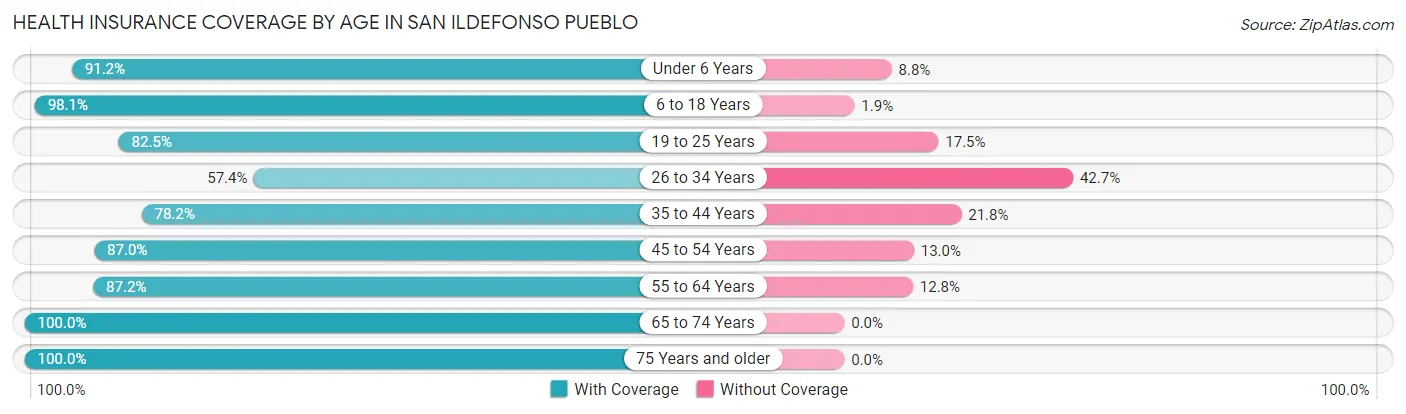
| Age Bracket | With Coverage | Without Coverage |
| Under 6 Years | 31 (91.2%) | 3 (8.8%) |
| 6 to 18 Years | 156 (98.1%) | 3 (1.9%) |
| 19 to 25 Years | 47 (82.5%) | 10 (17.5%) |
| 26 to 34 Years | 78 (57.4%) | 58 (42.6%) |
| 35 to 44 Years | 43 (78.2%) | 12 (21.8%) |
| 45 to 54 Years | 94 (87.0%) | 14 (13.0%) |
| 55 to 64 Years | 75 (87.2%) | 11 (12.8%) |
| 65 to 74 Years | 57 (100.0%) | 0 (0.0%) |
| 75 Years and older | 30 (100.0%) | 0 (0.0%) |
| Total | 611 (84.6%) | 111 (15.4%) |
Health Insurance Coverage by Citizenship Status in San Ildefonso Pueblo
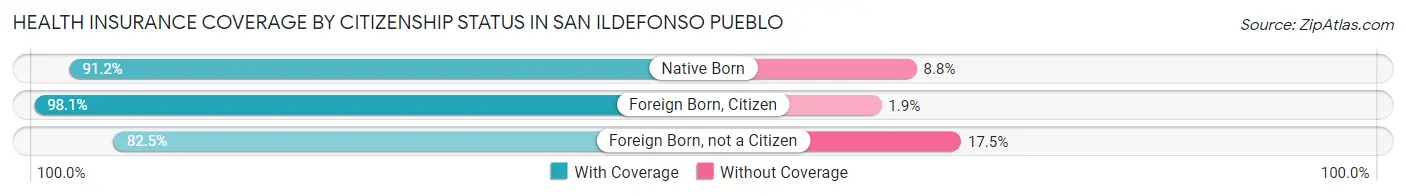
| Citizenship Status | With Coverage | Without Coverage |
| Native Born | 31 (91.2%) | 3 (8.8%) |
| Foreign Born, Citizen | 156 (98.1%) | 3 (1.9%) |
| Foreign Born, not a Citizen | 47 (82.5%) | 10 (17.5%) |
Health Insurance Coverage by Household Income in San Ildefonso Pueblo
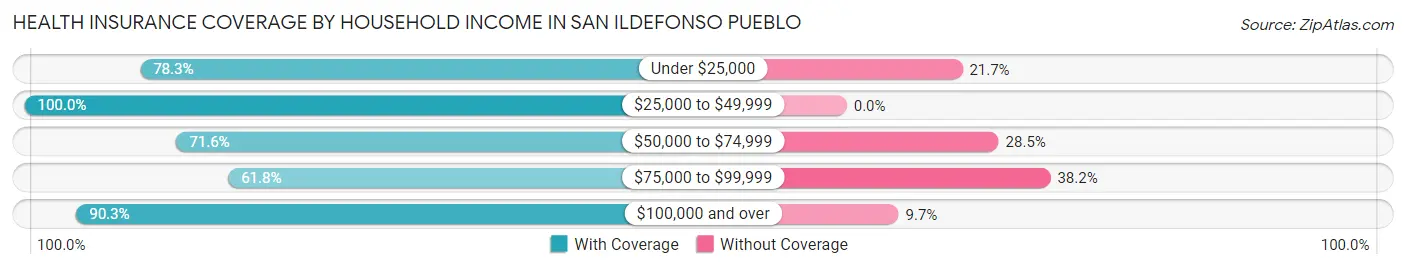
| Household Income | With Coverage | Without Coverage |
| Under $25,000 | 47 (78.3%) | 13 (21.7%) |
| $25,000 to $49,999 | 99 (100.0%) | 0 (0.0%) |
| $50,000 to $74,999 | 83 (71.6%) | 33 (28.4%) |
| $75,000 to $99,999 | 47 (61.8%) | 29 (38.2%) |
| $100,000 and over | 335 (90.3%) | 36 (9.7%) |
Public vs Private Health Insurance Coverage by Age in San Ildefonso Pueblo
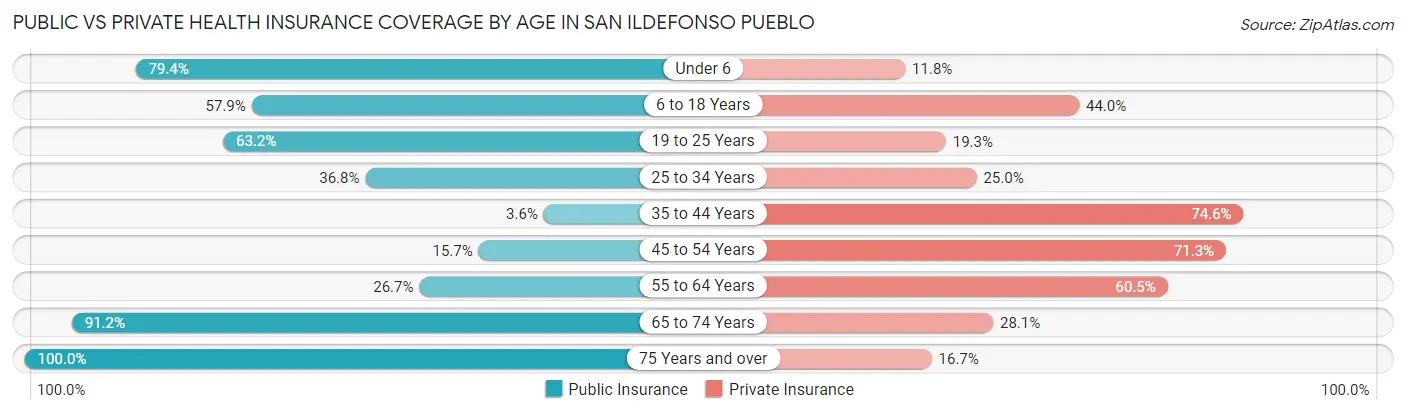
| Age Bracket | Public Insurance | Private Insurance |
| Under 6 | 27 (79.4%) | 4 (11.8%) |
| 6 to 18 Years | 92 (57.9%) | 70 (44.0%) |
| 19 to 25 Years | 36 (63.2%) | 11 (19.3%) |
| 25 to 34 Years | 50 (36.8%) | 34 (25.0%) |
| 35 to 44 Years | 2 (3.6%) | 41 (74.6%) |
| 45 to 54 Years | 17 (15.7%) | 77 (71.3%) |
| 55 to 64 Years | 23 (26.7%) | 52 (60.5%) |
| 65 to 74 Years | 52 (91.2%) | 16 (28.1%) |
| 75 Years and over | 30 (100.0%) | 5 (16.7%) |
| Total | 329 (45.6%) | 310 (42.9%) |
Disability Status by Sex by Age in San Ildefonso Pueblo
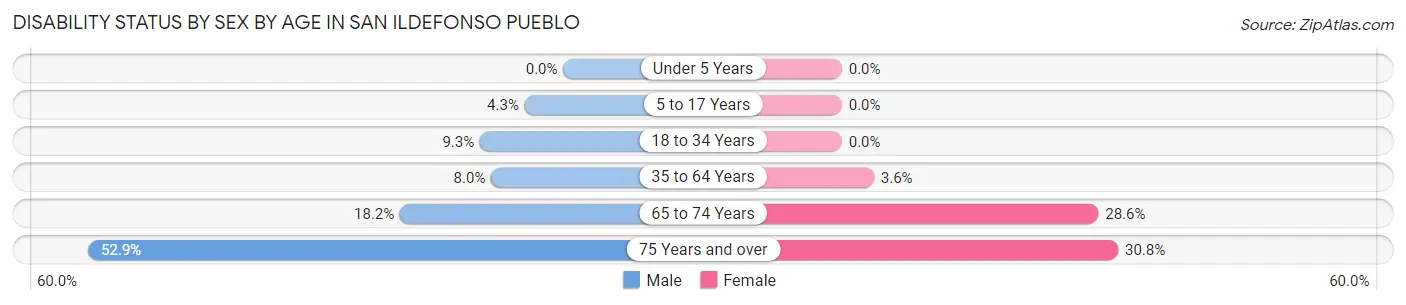
| Age Bracket | Male | Female |
| Under 5 Years | 0 (0.0%) | 0 (0.0%) |
| 5 to 17 Years | 4 (4.3%) | 0 (0.0%) |
| 18 to 34 Years | 9 (9.3%) | 0 (0.0%) |
| 35 to 64 Years | 11 (8.0%) | 4 (3.6%) |
| 65 to 74 Years | 4 (18.2%) | 10 (28.6%) |
| 75 Years and over | 9 (52.9%) | 4 (30.8%) |
Disability Class by Sex by Age in San Ildefonso Pueblo
Disability Class: Hearing Difficulty
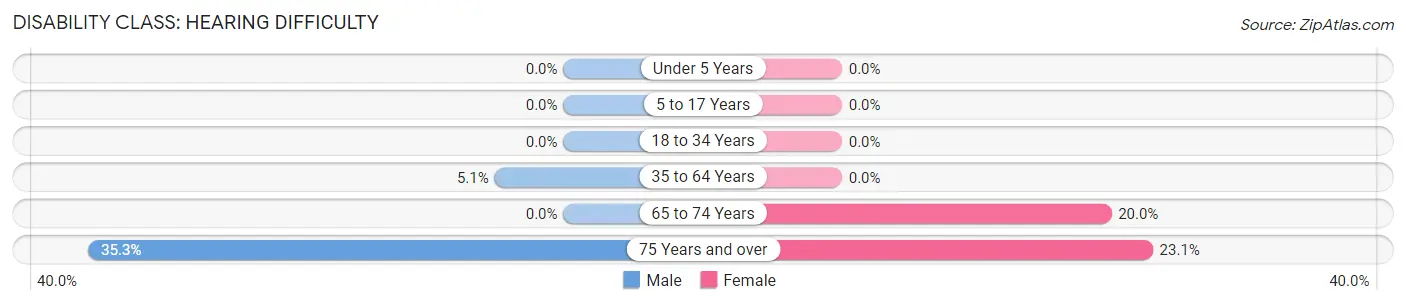
| Age Bracket | Male | Female |
| Under 5 Years | 0 (0.0%) | 0 (0.0%) |
| 5 to 17 Years | 0 (0.0%) | 0 (0.0%) |
| 18 to 34 Years | 0 (0.0%) | 0 (0.0%) |
| 35 to 64 Years | 7 (5.1%) | 0 (0.0%) |
| 65 to 74 Years | 0 (0.0%) | 7 (20.0%) |
| 75 Years and over | 6 (35.3%) | 3 (23.1%) |
Disability Class: Vision Difficulty
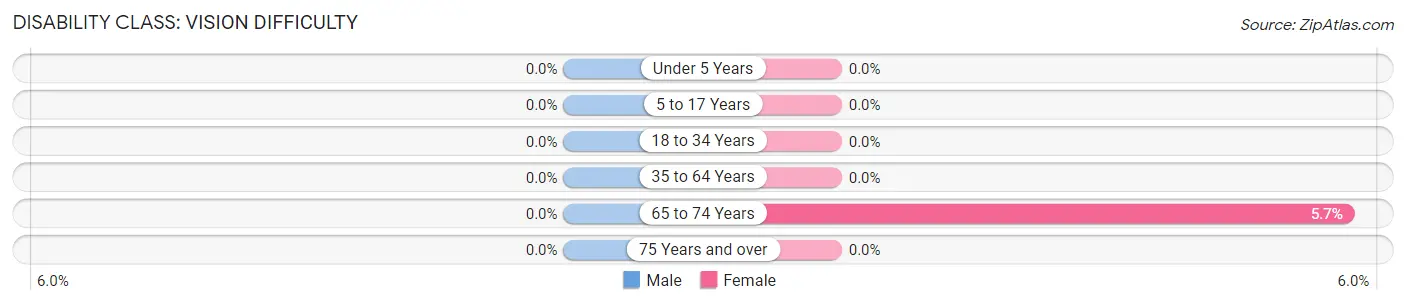
| Age Bracket | Male | Female |
| Under 5 Years | 0 (0.0%) | 0 (0.0%) |
| 5 to 17 Years | 0 (0.0%) | 0 (0.0%) |
| 18 to 34 Years | 0 (0.0%) | 0 (0.0%) |
| 35 to 64 Years | 0 (0.0%) | 0 (0.0%) |
| 65 to 74 Years | 0 (0.0%) | 2 (5.7%) |
| 75 Years and over | 0 (0.0%) | 0 (0.0%) |
Disability Class: Cognitive Difficulty
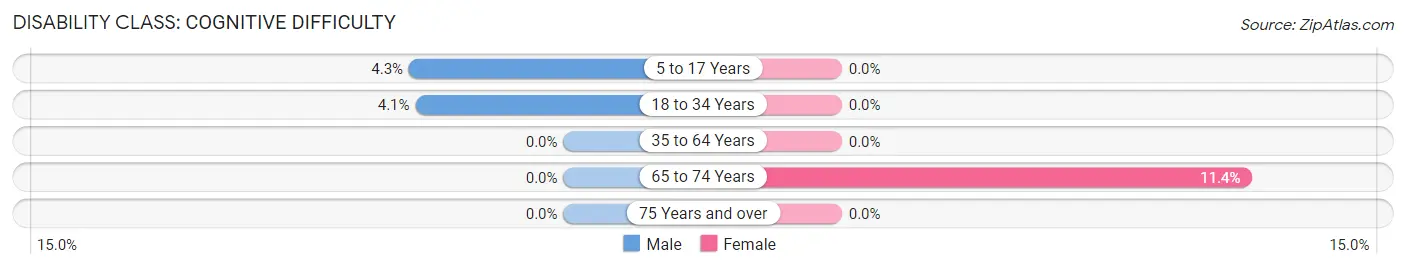
| Age Bracket | Male | Female |
| 5 to 17 Years | 4 (4.3%) | 0 (0.0%) |
| 18 to 34 Years | 4 (4.1%) | 0 (0.0%) |
| 35 to 64 Years | 0 (0.0%) | 0 (0.0%) |
| 65 to 74 Years | 0 (0.0%) | 4 (11.4%) |
| 75 Years and over | 0 (0.0%) | 0 (0.0%) |
Disability Class: Ambulatory Difficulty
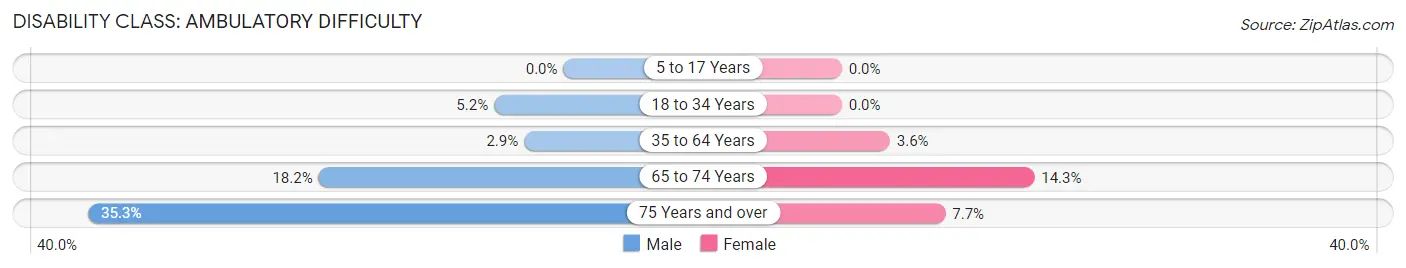
| Age Bracket | Male | Female |
| 5 to 17 Years | 0 (0.0%) | 0 (0.0%) |
| 18 to 34 Years | 5 (5.1%) | 0 (0.0%) |
| 35 to 64 Years | 4 (2.9%) | 4 (3.6%) |
| 65 to 74 Years | 4 (18.2%) | 5 (14.3%) |
| 75 Years and over | 6 (35.3%) | 1 (7.7%) |
Disability Class: Self-Care Difficulty
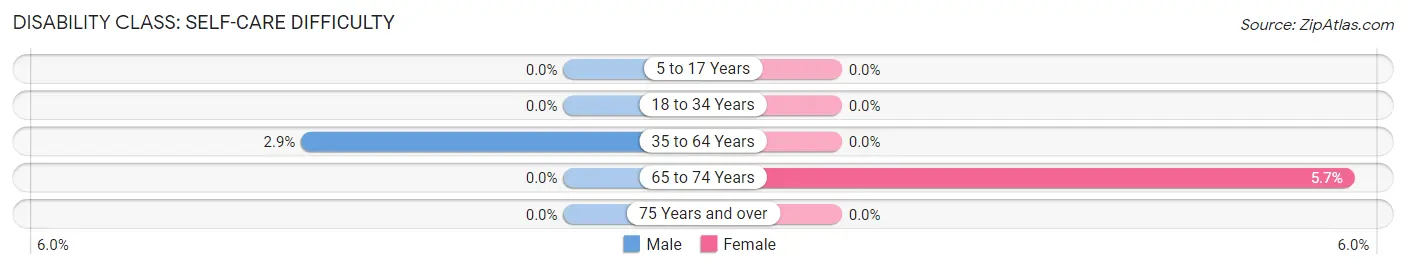
| Age Bracket | Male | Female |
| 5 to 17 Years | 0 (0.0%) | 0 (0.0%) |
| 18 to 34 Years | 0 (0.0%) | 0 (0.0%) |
| 35 to 64 Years | 4 (2.9%) | 0 (0.0%) |
| 65 to 74 Years | 0 (0.0%) | 2 (5.7%) |
| 75 Years and over | 0 (0.0%) | 0 (0.0%) |
Technology Access in San Ildefonso Pueblo
Computing Device Access in San Ildefonso Pueblo
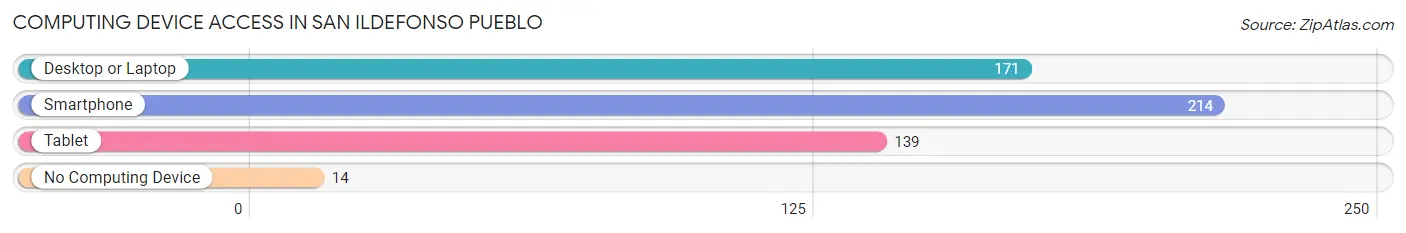
| Device Type | # Households | % Households |
| Desktop or Laptop | 171 | 71.6% |
| Smartphone | 214 | 89.5% |
| Tablet | 139 | 58.2% |
| No Computing Device | 14 | 5.9% |
| Total | 239 | 100.0% |
Internet Access in San Ildefonso Pueblo
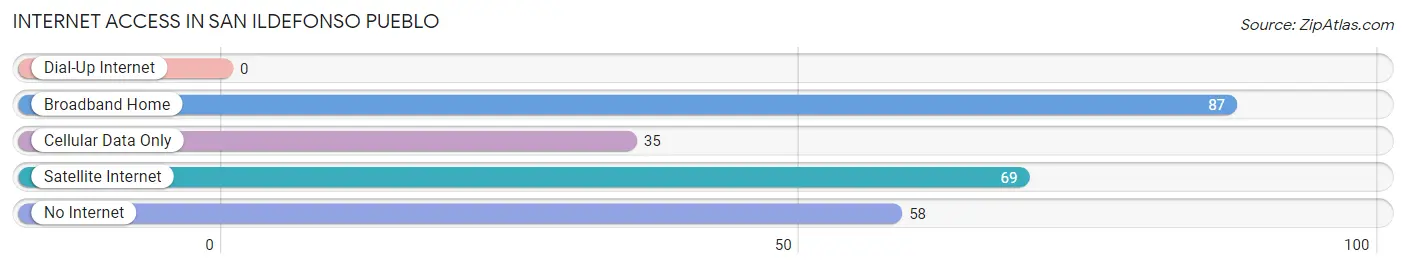
| Internet Type | # Households | % Households |
| Dial-Up Internet | 0 | 0.0% |
| Broadband Home | 87 | 36.4% |
| Cellular Data Only | 35 | 14.6% |
| Satellite Internet | 69 | 28.9% |
| No Internet | 58 | 24.3% |
| Total | 239 | 100.0% |
San Ildefonso Pueblo Summary
San Ildefonso Pueblo is a small Native American community located in the Rio Grande Valley of northern New Mexico. It is one of the 19 Pueblos of New Mexico, and is home to the Tewa people, who have lived in the area for centuries. The Pueblo is located about 25 miles north of Santa Fe, and is home to about 1,500 people.
Geography
San Ildefonso Pueblo is located in the Rio Grande Valley of northern New Mexico, about 25 miles north of Santa Fe. The Pueblo is situated on the banks of the Rio Grande, and is surrounded by the Sangre de Cristo Mountains to the east and the Jemez Mountains to the west. The Pueblo is located at an elevation of 6,000 feet, and has a semi-arid climate with hot summers and cold winters.
History
The Tewa people have lived in the area around San Ildefonso Pueblo for centuries. The Pueblo was established in the late 1600s, and was originally known as Po-woh-ge-oweenge, which means “place of the strong people” in the Tewa language. The Pueblo was renamed San Ildefonso in 1706, after the Spanish explorer Ildefonso de Onate.
The Pueblo was a major trading center for the Tewa people, and was a major stop on the Camino Real, the main trade route between Mexico and the United States. The Pueblo was also a major center of pottery production, and is still known for its traditional pottery today.
Economy
San Ildefonso Pueblo is a rural community, and the main sources of income are agriculture and tourism. The Pueblo is home to several farms, which produce a variety of crops, including corn, beans, squash, and melons. The Pueblo is also home to several tourist attractions, including the San Ildefonso Museum, which showcases traditional Tewa pottery, and the San Ildefonso Cultural Center, which offers traditional Tewa dances and other cultural events.
Demographics
As of the 2010 census, San Ildefonso Pueblo had a population of 1,521 people. The population is predominantly Native American, with 95.3% of the population identifying as Native American. The majority of the population (94.2%) is Tewa, with the remaining 5.8% identifying as other Native American tribes. The median age of the population is 37.3 years, and the median household income is $25,000.
Conclusion
San Ildefonso Pueblo is a small Native American community located in the Rio Grande Valley of northern New Mexico. It is home to the Tewa people, who have lived in the area for centuries. The Pueblo is a rural community, and the main sources of income are agriculture and tourism. The population is predominantly Native American, with 95.3% of the population identifying as Native American. San Ildefonso Pueblo is a unique and vibrant community, and is a great place to visit and explore.
Common Questions
What is Per Capita Income in San Ildefonso Pueblo?
Per Capita income in San Ildefonso Pueblo is $35,245.
What is the Median Family Income in San Ildefonso Pueblo?
Median Family Income in San Ildefonso Pueblo is $83,750.
What is the Median Household income in San Ildefonso Pueblo?
Median Household Income in San Ildefonso Pueblo is $82,656.
What is Income or Wage Gap in San Ildefonso Pueblo?
Income or Wage Gap in San Ildefonso Pueblo is 20.0%.
Women in San Ildefonso Pueblo earn 80.0 cents for every dollar earned by a man.
What is Inequality or Gini Index in San Ildefonso Pueblo?
Inequality or Gini Index in San Ildefonso Pueblo is 0.40.
What is the Total Population of San Ildefonso Pueblo?
Total Population of San Ildefonso Pueblo is 722.
What is the Total Male Population of San Ildefonso Pueblo?
Total Male Population of San Ildefonso Pueblo is 379.
What is the Total Female Population of San Ildefonso Pueblo?
Total Female Population of San Ildefonso Pueblo is 343.
What is the Ratio of Males per 100 Females in San Ildefonso Pueblo?
There are 110.50 Males per 100 Females in San Ildefonso Pueblo.
What is the Ratio of Females per 100 Males in San Ildefonso Pueblo?
There are 90.50 Females per 100 Males in San Ildefonso Pueblo.
What is the Median Population Age in San Ildefonso Pueblo?
Median Population Age in San Ildefonso Pueblo is 33.3 Years.
What is the Average Family Size in San Ildefonso Pueblo
Average Family Size in San Ildefonso Pueblo is 3.5 People.
What is the Average Household Size in San Ildefonso Pueblo
Average Household Size in San Ildefonso Pueblo is 3.0 People.
How Large is the Labor Force in San Ildefonso Pueblo?
There are 392 People in the Labor Forcein in San Ildefonso Pueblo.
What is the Percentage of People in the Labor Force in San Ildefonso Pueblo?
68.8% of People are in the Labor Force in San Ildefonso Pueblo.
What is the Unemployment Rate in San Ildefonso Pueblo?
Unemployment Rate in San Ildefonso Pueblo is 6.9%.