Zia Pueblo, NM Map & Demographics
Zia Pueblo Map
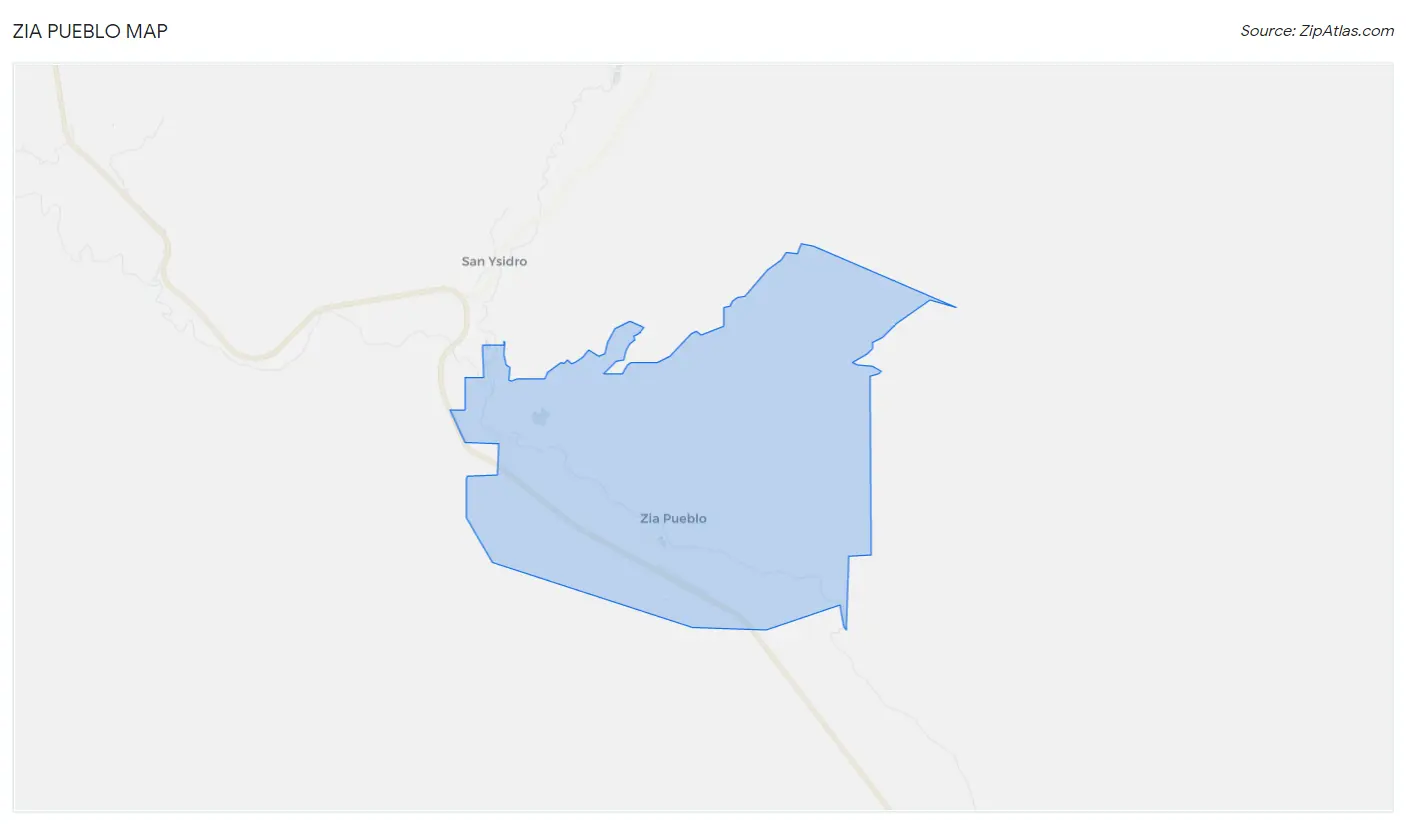
Zia Pueblo Overview
$19,651
PER CAPITA INCOME
$54,297
AVG FAMILY INCOME
$55,724
AVG HOUSEHOLD INCOME
52.4%
WAGE / INCOME GAP [ % ]
47.6¢/ $1
WAGE / INCOME GAP [ $ ]
0.43
INEQUALITY / GINI INDEX
899
TOTAL POPULATION
396
MALE POPULATION
503
FEMALE POPULATION
78.73
MALES / 100 FEMALES
127.02
FEMALES / 100 MALES
29.8
MEDIAN AGE
4.8
AVG FAMILY SIZE
4.1
AVG HOUSEHOLD SIZE
441
LABOR FORCE [ PEOPLE ]
68.0%
PERCENT IN LABOR FORCE
10.0%
UNEMPLOYMENT RATE
Zia Pueblo Area Codes
Income in Zia Pueblo
Income Overview in Zia Pueblo
Per Capita Income in Zia Pueblo is $19,651, while median incomes of families and households are $54,297 and $55,724 respectively.
| Characteristic | Number | Measure |
| Per Capita Income | 899 | $19,651 |
| Median Family Income | 171 | $54,297 |
| Mean Family Income | 171 | $79,356 |
| Median Household Income | 221 | $55,724 |
| Mean Household Income | 221 | $72,875 |
| Income Deficit | 171 | $0 |
| Wage / Income Gap (%) | 899 | 52.39% |
| Wage / Income Gap ($) | 899 | 47.61¢ per $1 |
| Gini / Inequality Index | 899 | 0.43 |
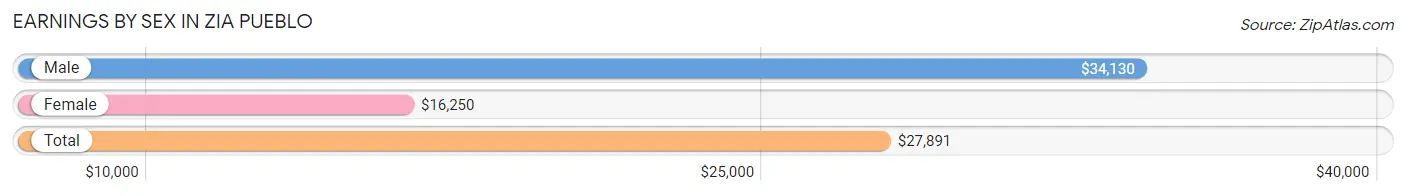
Earnings by Sex in Zia Pueblo
Average Earnings in Zia Pueblo are $27,891, $34,130 for men and $16,250 for women, a difference of 52.4%.
| Sex | Number | Average Earnings |
| Male | 230 (50.3%) | $34,130 |
| Female | 227 (49.7%) | $16,250 |
| Total | 457 (100.0%) | $27,891 |
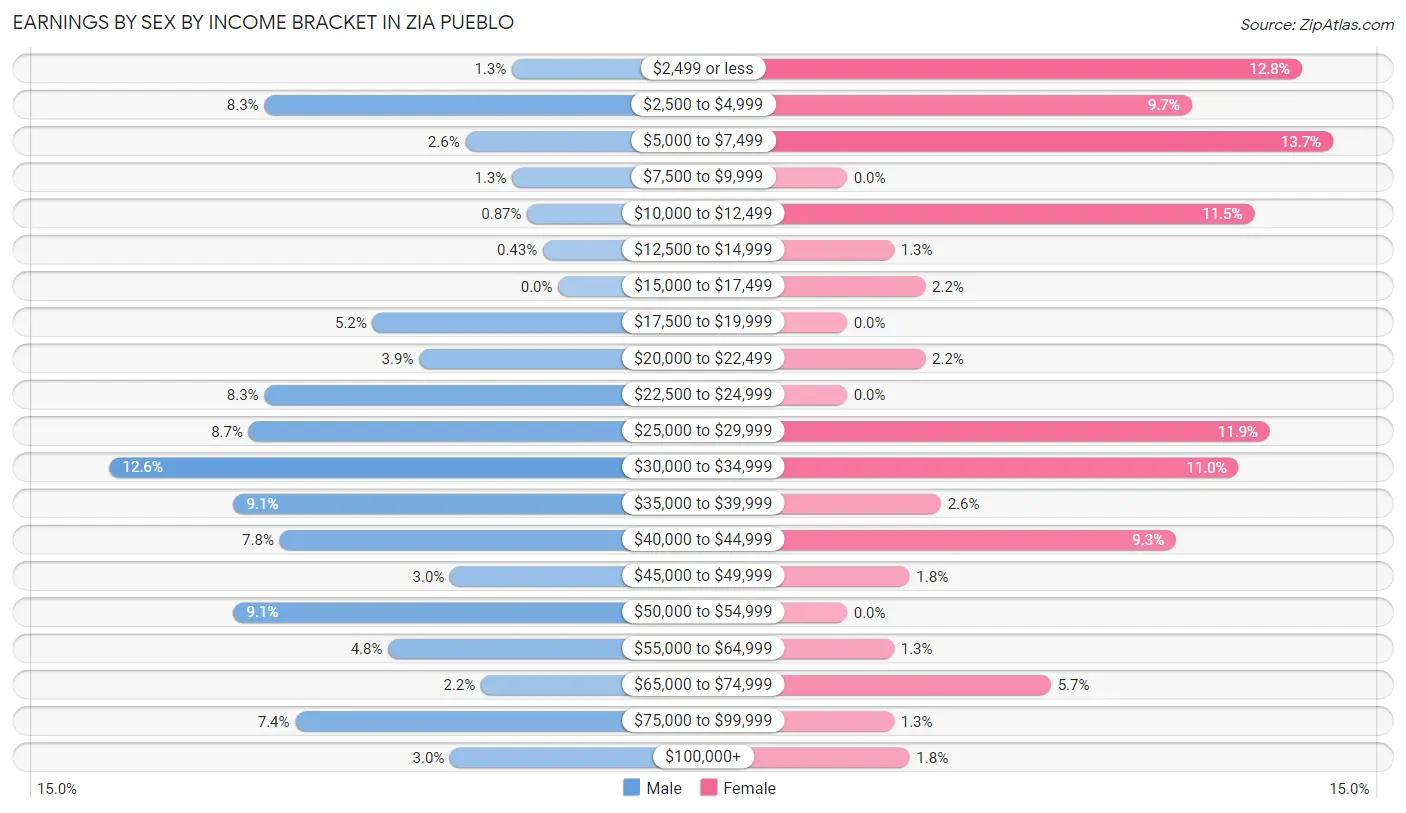
Earnings by Sex by Income Bracket in Zia Pueblo
The most common earnings brackets in Zia Pueblo are $30,000 to $34,999 for men (29 | 12.6%) and $5,000 to $7,499 for women (31 | 13.7%).
| Income | Male | Female |
| $2,499 or less | 3 (1.3%) | 29 (12.8%) |
| $2,500 to $4,999 | 19 (8.3%) | 22 (9.7%) |
| $5,000 to $7,499 | 6 (2.6%) | 31 (13.7%) |
| $7,500 to $9,999 | 3 (1.3%) | 0 (0.0%) |
| $10,000 to $12,499 | 2 (0.9%) | 26 (11.5%) |
| $12,500 to $14,999 | 1 (0.4%) | 3 (1.3%) |
| $15,000 to $17,499 | 0 (0.0%) | 5 (2.2%) |
| $17,500 to $19,999 | 12 (5.2%) | 0 (0.0%) |
| $20,000 to $22,499 | 9 (3.9%) | 5 (2.2%) |
| $22,500 to $24,999 | 19 (8.3%) | 0 (0.0%) |
| $25,000 to $29,999 | 20 (8.7%) | 27 (11.9%) |
| $30,000 to $34,999 | 29 (12.6%) | 25 (11.0%) |
| $35,000 to $39,999 | 21 (9.1%) | 6 (2.6%) |
| $40,000 to $44,999 | 18 (7.8%) | 21 (9.2%) |
| $45,000 to $49,999 | 7 (3.0%) | 4 (1.8%) |
| $50,000 to $54,999 | 21 (9.1%) | 0 (0.0%) |
| $55,000 to $64,999 | 11 (4.8%) | 3 (1.3%) |
| $65,000 to $74,999 | 5 (2.2%) | 13 (5.7%) |
| $75,000 to $99,999 | 17 (7.4%) | 3 (1.3%) |
| $100,000+ | 7 (3.0%) | 4 (1.8%) |
| Total | 230 (100.0%) | 227 (100.0%) |
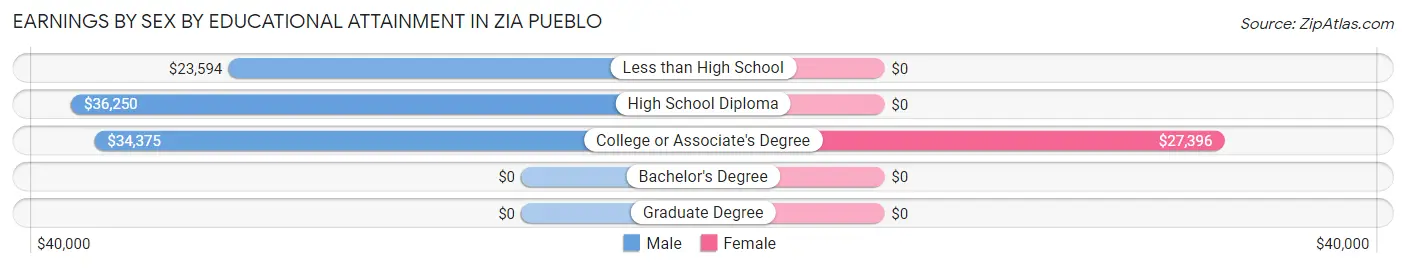
Earnings by Sex by Educational Attainment in Zia Pueblo
Average earnings in Zia Pueblo are $33,750 for men and $26,615 for women, a difference of 21.1%. Men with an educational attainment of high school diploma enjoy the highest average annual earnings of $36,250, while those with less than high school education earn the least with $23,594. Women with an educational attainment of college or associate's degree earn the most with the average annual earnings of $27,396, while those with college or associate's degree education have the smallest earnings of $27,396.
| Educational Attainment | Male Income | Female Income |
| Less than High School | $23,594 | $0 |
| High School Diploma | $36,250 | $0 |
| College or Associate's Degree | $34,375 | $27,396 |
| Bachelor's Degree | - | - |
| Graduate Degree | - | - |
| Total | $33,750 | $26,615 |
Family Income in Zia Pueblo
Family Income Brackets in Zia Pueblo
According to the Zia Pueblo family income data, there are 53 families falling into the $50,000 to $74,999 income range, which is the most common income bracket and makes up 31.0% of all families. Conversely, the $10,000 to $14,999 income bracket is the least frequent group with only 2 families (1.2%) belonging to this category.
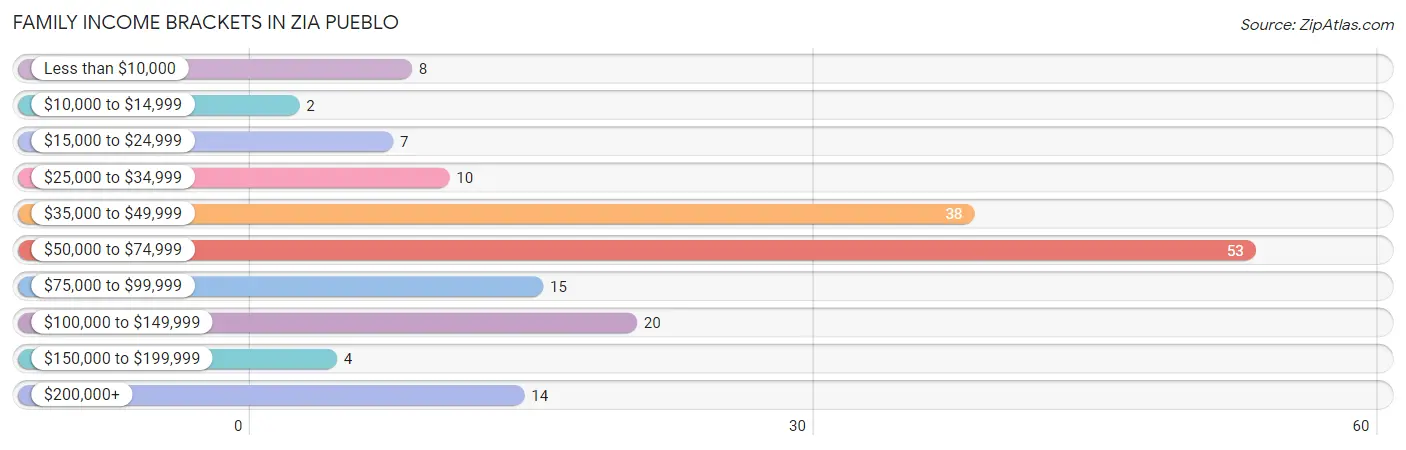
| Income Bracket | # Families | % Families |
| Less than $10,000 | 8 | 4.7% |
| $10,000 to $14,999 | 2 | 1.2% |
| $15,000 to $24,999 | 7 | 4.1% |
| $25,000 to $34,999 | 10 | 5.8% |
| $35,000 to $49,999 | 38 | 22.2% |
| $50,000 to $74,999 | 53 | 31.0% |
| $75,000 to $99,999 | 15 | 8.8% |
| $100,000 to $149,999 | 20 | 11.7% |
| $150,000 to $199,999 | 4 | 2.3% |
| $200,000+ | 14 | 8.2% |
Family Income by Famaliy Size in Zia Pueblo
4-person families (19 | 11.1%) account for the highest median family income in Zia Pueblo with $132,250 per family, while 4-person families (19 | 11.1%) have the highest median income of $33,062 per family member.
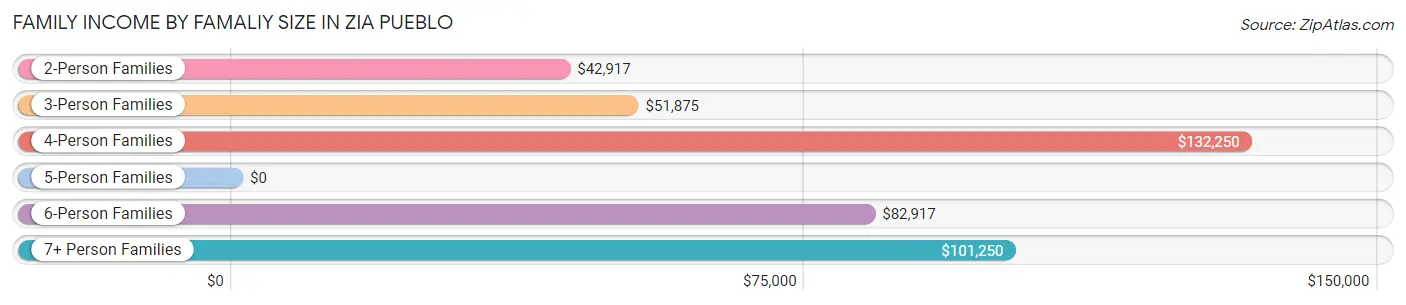
| Income Bracket | # Families | Median Income |
| 2-Person Families | 61 (35.7%) | $42,917 |
| 3-Person Families | 37 (21.6%) | $51,875 |
| 4-Person Families | 19 (11.1%) | $132,250 |
| 5-Person Families | 19 (11.1%) | $0 |
| 6-Person Families | 9 (5.3%) | $82,917 |
| 7+ Person Families | 26 (15.2%) | $101,250 |
| Total | 171 (100.0%) | $54,297 |
Family Income by Number of Earners in Zia Pueblo
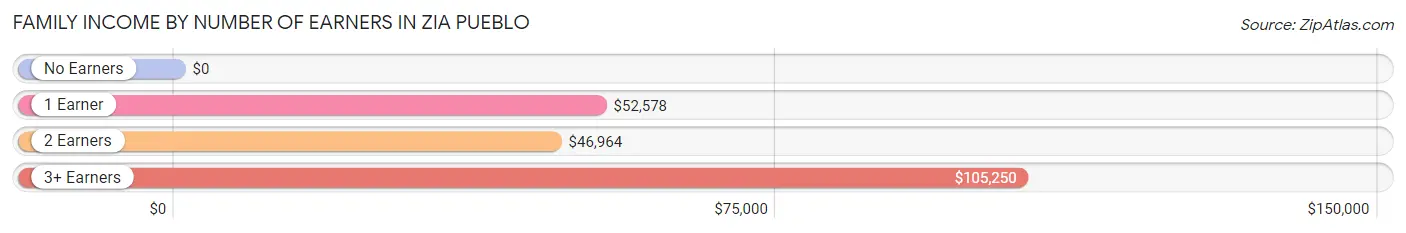
| Number of Earners | # Families | Median Income |
| No Earners | 8 (4.7%) | $0 |
| 1 Earner | 49 (28.6%) | $52,578 |
| 2 Earners | 61 (35.7%) | $46,964 |
| 3+ Earners | 53 (31.0%) | $105,250 |
| Total | 171 (100.0%) | $54,297 |
Household Income in Zia Pueblo
Household Income Brackets in Zia Pueblo
With 67 households falling in the category, the $50,000 to $74,999 income range is the most frequent in Zia Pueblo, accounting for 30.3% of all households. In contrast, only 3 households (1.4%) fall into the $10,000 to $14,999 income bracket, making it the least populous group.
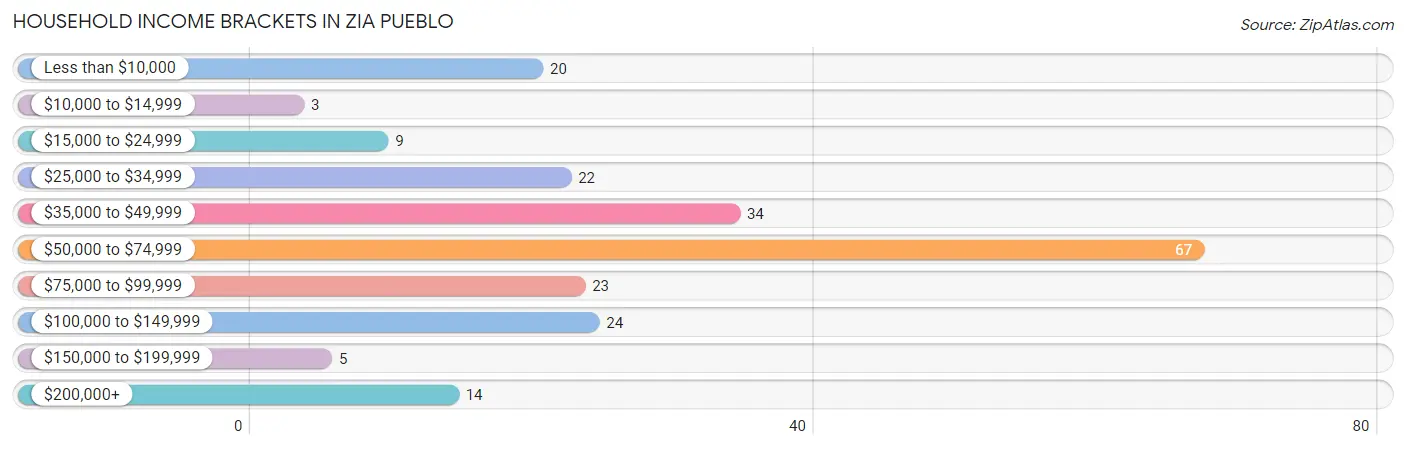
| Income Bracket | # Households | % Households |
| Less than $10,000 | 20 | 9.0% |
| $10,000 to $14,999 | 3 | 1.4% |
| $15,000 to $24,999 | 9 | 4.1% |
| $25,000 to $34,999 | 22 | 10.0% |
| $35,000 to $49,999 | 34 | 15.4% |
| $50,000 to $74,999 | 67 | 30.3% |
| $75,000 to $99,999 | 23 | 10.4% |
| $100,000 to $149,999 | 24 | 10.9% |
| $150,000 to $199,999 | 5 | 2.3% |
| $200,000+ | 14 | 6.3% |
Household Income by Householder Age in Zia Pueblo
The median household income in Zia Pueblo is $55,724, with the highest median household income of $67,813 found in the 25 to 44 years age bracket for the primary householder. A total of 47 households (21.3%) fall into this category. Meanwhile, the 15 to 24 years age bracket for the primary householder has the lowest median household income of $0, with 16 households (7.2%) in this group.
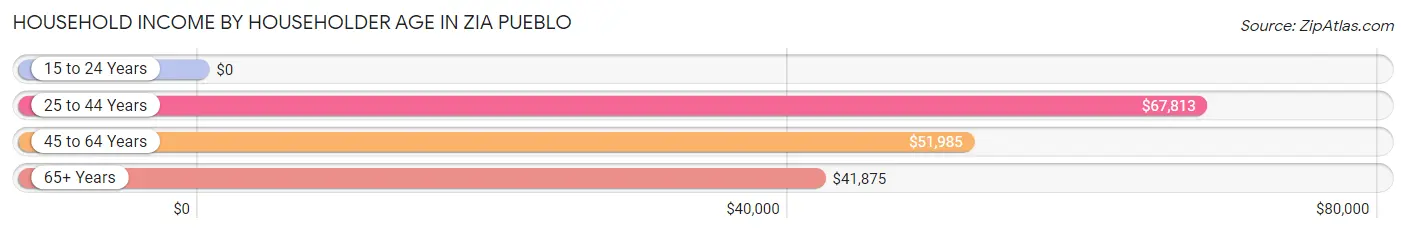
| Income Bracket | # Households | Median Income |
| 15 to 24 Years | 16 (7.2%) | $0 |
| 25 to 44 Years | 47 (21.3%) | $67,813 |
| 45 to 64 Years | 121 (54.7%) | $51,985 |
| 65+ Years | 37 (16.7%) | $41,875 |
| Total | 221 (100.0%) | $55,724 |
Poverty in Zia Pueblo
Income Below Poverty by Sex and Age in Zia Pueblo
With 5.6% poverty level for males and 10.9% for females among the residents of Zia Pueblo, 65 to 74 year old males and 18 to 24 year old females are the most vulnerable to poverty, with 5 males (35.7%) and 11 females (26.2%) in their respective age groups living below the poverty level.
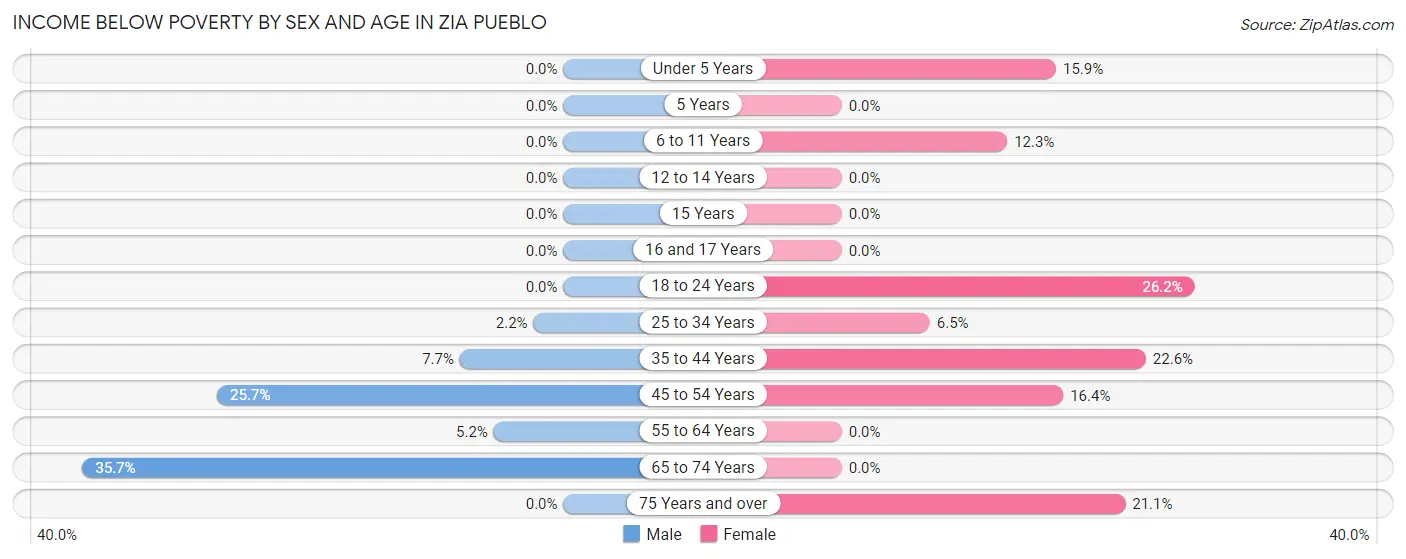
| Age Bracket | Male | Female |
| Under 5 Years | 0 (0.0%) | 7 (15.9%) |
| 5 Years | 0 (0.0%) | 0 (0.0%) |
| 6 to 11 Years | 0 (0.0%) | 7 (12.3%) |
| 12 to 14 Years | 0 (0.0%) | 0 (0.0%) |
| 15 Years | 0 (0.0%) | 0 (0.0%) |
| 16 and 17 Years | 0 (0.0%) | 0 (0.0%) |
| 18 to 24 Years | 0 (0.0%) | 11 (26.2%) |
| 25 to 34 Years | 2 (2.2%) | 7 (6.5%) |
| 35 to 44 Years | 3 (7.7%) | 7 (22.6%) |
| 45 to 54 Years | 9 (25.7%) | 12 (16.4%) |
| 55 to 64 Years | 3 (5.2%) | 0 (0.0%) |
| 65 to 74 Years | 5 (35.7%) | 0 (0.0%) |
| 75 Years and over | 0 (0.0%) | 4 (21.0%) |
| Total | 22 (5.6%) | 55 (10.9%) |
Income Above Poverty by Sex and Age in Zia Pueblo
According to the poverty statistics in Zia Pueblo, males aged under 5 years and females aged 5 years are the age groups that are most secure financially, with 100.0% of males and 100.0% of females in these age groups living above the poverty line.
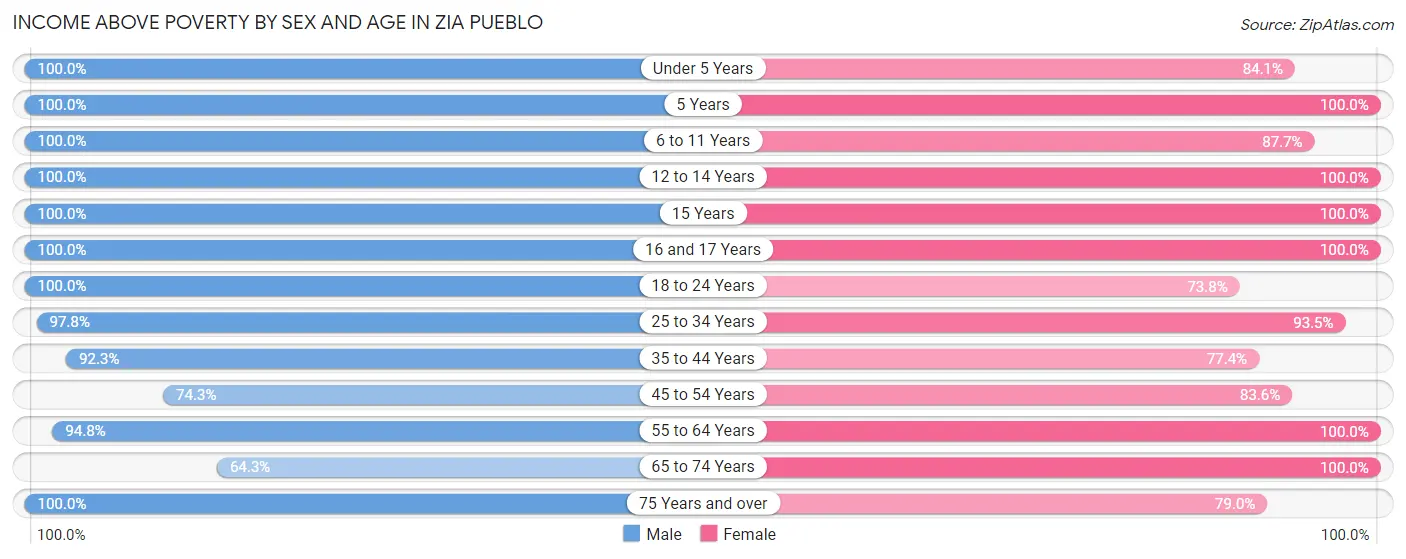
| Age Bracket | Male | Female |
| Under 5 Years | 39 (100.0%) | 37 (84.1%) |
| 5 Years | 16 (100.0%) | 14 (100.0%) |
| 6 to 11 Years | 19 (100.0%) | 50 (87.7%) |
| 12 to 14 Years | 14 (100.0%) | 18 (100.0%) |
| 15 Years | 4 (100.0%) | 23 (100.0%) |
| 16 and 17 Years | 18 (100.0%) | 22 (100.0%) |
| 18 to 24 Years | 42 (100.0%) | 31 (73.8%) |
| 25 to 34 Years | 88 (97.8%) | 100 (93.5%) |
| 35 to 44 Years | 36 (92.3%) | 24 (77.4%) |
| 45 to 54 Years | 26 (74.3%) | 61 (83.6%) |
| 55 to 64 Years | 55 (94.8%) | 43 (100.0%) |
| 65 to 74 Years | 9 (64.3%) | 10 (100.0%) |
| 75 Years and over | 6 (100.0%) | 15 (78.9%) |
| Total | 372 (94.4%) | 448 (89.1%) |
Income Below Poverty Among Married-Couple Families in Zia Pueblo
The poverty statistics for married-couple families in Zia Pueblo show that 7.8% or 6 of the total 77 families live below the poverty line. Families with no children have the highest poverty rate of 15.0%, comprising of 6 families. On the other hand, families with 1 or 2 children have the lowest poverty rate of 0.0%, which includes 0 families.
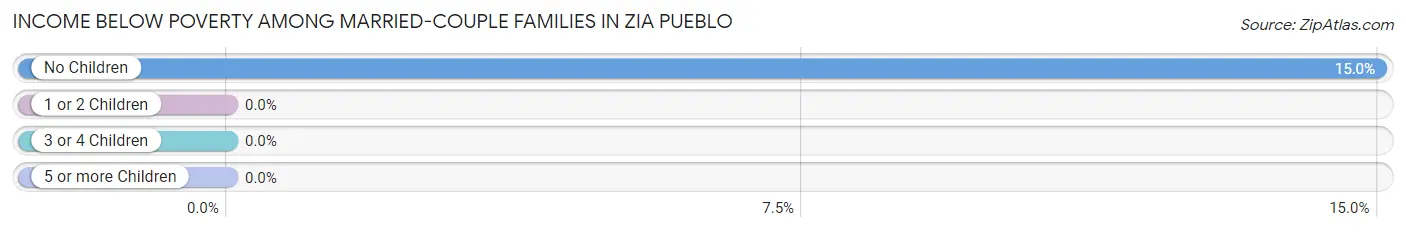
| Children | Above Poverty | Below Poverty |
| No Children | 34 (85.0%) | 6 (15.0%) |
| 1 or 2 Children | 18 (100.0%) | 0 (0.0%) |
| 3 or 4 Children | 10 (100.0%) | 0 (0.0%) |
| 5 or more Children | 9 (100.0%) | 0 (0.0%) |
| Total | 71 (92.2%) | 6 (7.8%) |
Income Below Poverty Among Single-Parent Households in Zia Pueblo
According to the poverty data in Zia Pueblo, 6.8% or 3 single-father households and 10.0% or 5 single-mother households are living below the poverty line. Among single-father households, those with 1 or 2 children have the highest poverty rate, with 3 households (14.3%) experiencing poverty. Likewise, among single-mother households, those with 1 or 2 children have the highest poverty rate, with 4 households (19.1%) falling below the poverty line.
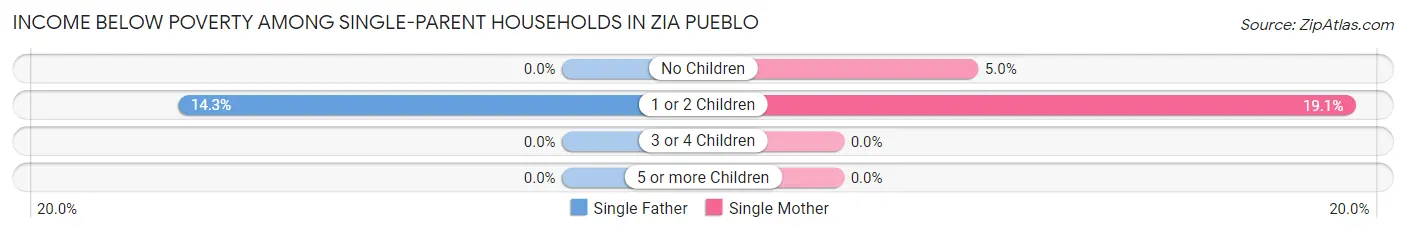
| Children | Single Father | Single Mother |
| No Children | 0 (0.0%) | 1 (5.0%) |
| 1 or 2 Children | 3 (14.3%) | 4 (19.1%) |
| 3 or 4 Children | 0 (0.0%) | 0 (0.0%) |
| 5 or more Children | 0 (0.0%) | 0 (0.0%) |
| Total | 3 (6.8%) | 5 (10.0%) |
Income Below Poverty Among Married-Couple vs Single-Parent Households in Zia Pueblo
The poverty data for Zia Pueblo shows that 6 of the married-couple family households (7.8%) and 8 of the single-parent households (8.5%) are living below the poverty level. Within the married-couple family households, those with no children have the highest poverty rate, with 6 households (15.0%) falling below the poverty line. Among the single-parent households, those with 1 or 2 children have the highest poverty rate, with 7 household (16.7%) living below poverty.
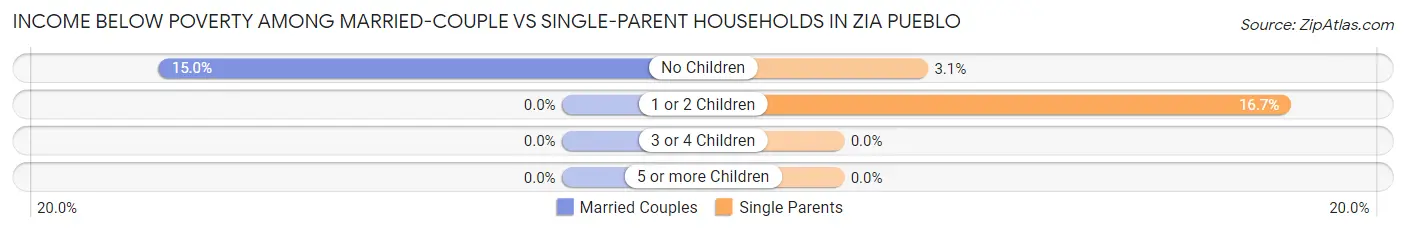
| Children | Married-Couple Families | Single-Parent Households |
| No Children | 6 (15.0%) | 1 (3.1%) |
| 1 or 2 Children | 0 (0.0%) | 7 (16.7%) |
| 3 or 4 Children | 0 (0.0%) | 0 (0.0%) |
| 5 or more Children | 0 (0.0%) | 0 (0.0%) |
| Total | 6 (7.8%) | 8 (8.5%) |
Race in Zia Pueblo
The most populous races in Zia Pueblo are Native / Alaskan (890 | 99.0%), Hispanic or Latino (15 | 1.7%), and Two or more Races (5 | 0.6%).
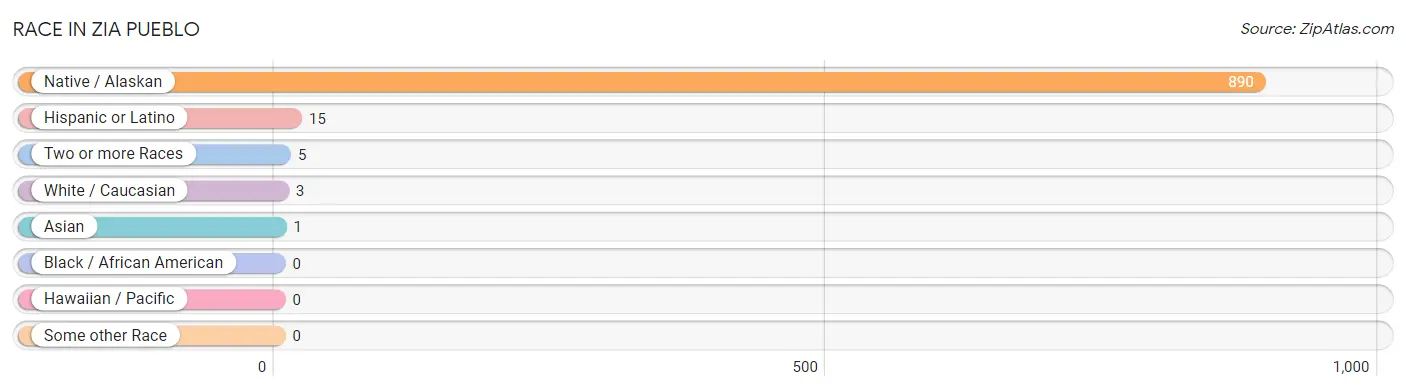
| Race | # Population | % Population |
| Asian | 1 | 0.1% |
| Black / African American | 0 | 0.0% |
| Hawaiian / Pacific | 0 | 0.0% |
| Hispanic or Latino | 15 | 1.7% |
| Native / Alaskan | 890 | 99.0% |
| White / Caucasian | 3 | 0.3% |
| Two or more Races | 5 | 0.6% |
| Some other Race | 0 | 0.0% |
| Total | 899 | 100.0% |
Ancestry in Zia Pueblo
The most populous ancestries reported in Zia Pueblo are Pueblo (861 | 95.8%), American (195 | 21.7%), Mexican (9 | 1.0%), Spaniard (4 | 0.4%), and Korean (3 | 0.3%), together accounting for 119.2% of all Zia Pueblo residents.
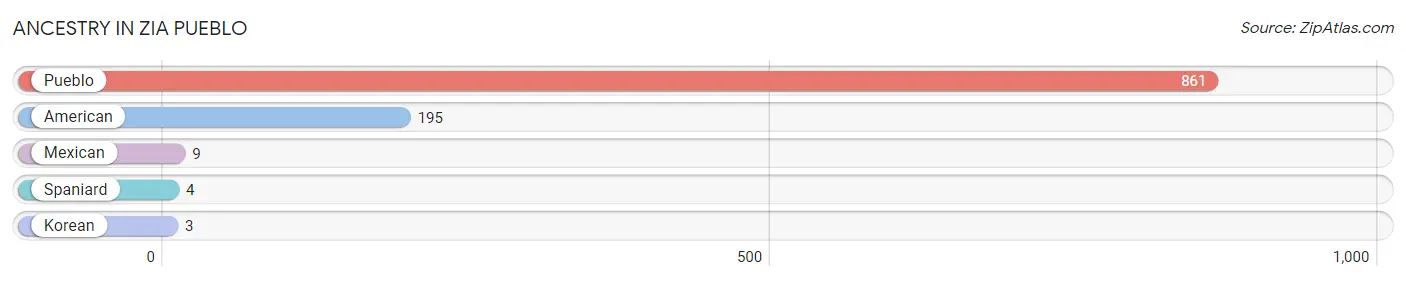
| Ancestry | # Population | % Population |
| American | 195 | 21.7% |
| Korean | 3 | 0.3% |
| Mexican | 9 | 1.0% |
| Pueblo | 861 | 95.8% |
| Spaniard | 4 | 0.4% | View All 5 Rows |
Immigrants in Zia Pueblo

| Immigration Origin | # Population | % Population | View All 0 Rows |
Sex and Age in Zia Pueblo
Sex and Age in Zia Pueblo
The most populous age groups in Zia Pueblo are 30 to 34 Years (55 | 13.9%) for men and 30 to 34 Years (63 | 12.5%) for women.
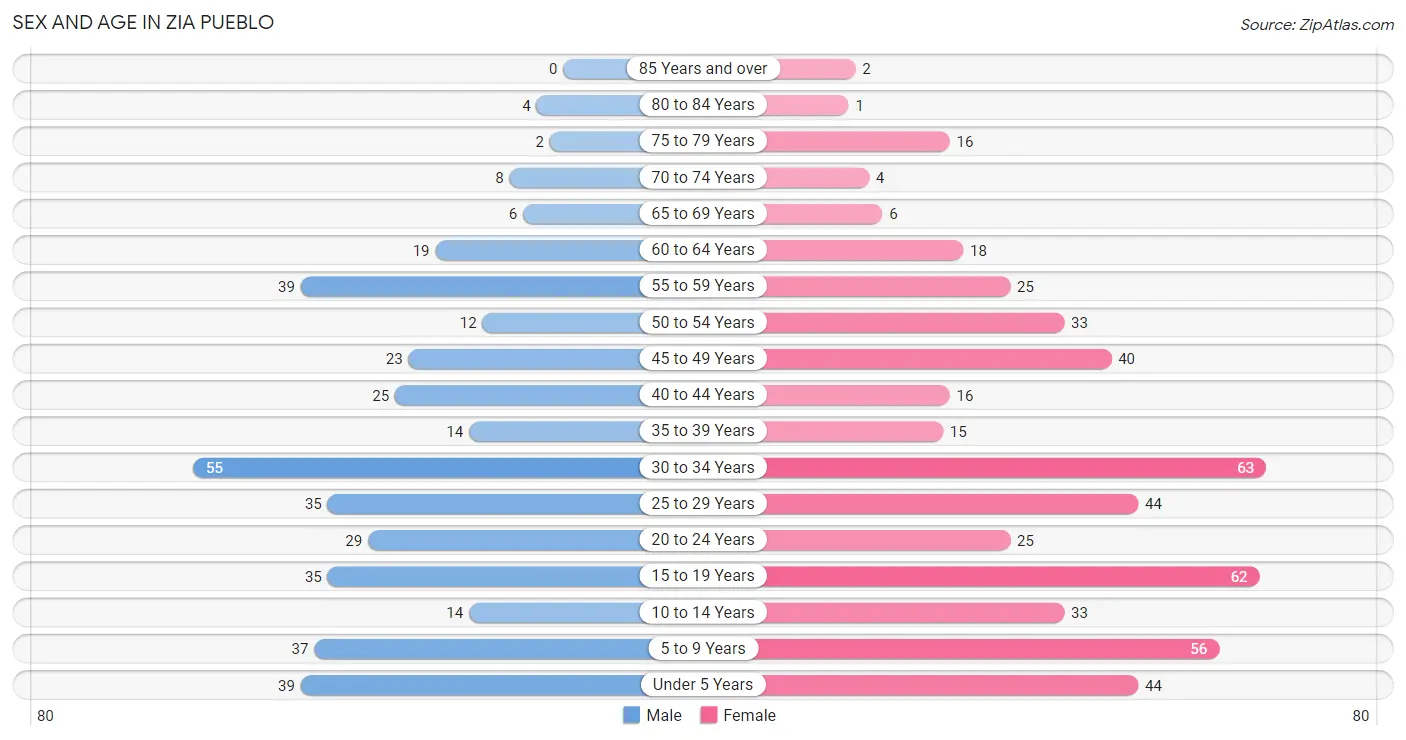
| Age Bracket | Male | Female |
| Under 5 Years | 39 (9.9%) | 44 (8.7%) |
| 5 to 9 Years | 37 (9.3%) | 56 (11.1%) |
| 10 to 14 Years | 14 (3.5%) | 33 (6.6%) |
| 15 to 19 Years | 35 (8.8%) | 62 (12.3%) |
| 20 to 24 Years | 29 (7.3%) | 25 (5.0%) |
| 25 to 29 Years | 35 (8.8%) | 44 (8.7%) |
| 30 to 34 Years | 55 (13.9%) | 63 (12.5%) |
| 35 to 39 Years | 14 (3.5%) | 15 (3.0%) |
| 40 to 44 Years | 25 (6.3%) | 16 (3.2%) |
| 45 to 49 Years | 23 (5.8%) | 40 (8.0%) |
| 50 to 54 Years | 12 (3.0%) | 33 (6.6%) |
| 55 to 59 Years | 39 (9.9%) | 25 (5.0%) |
| 60 to 64 Years | 19 (4.8%) | 18 (3.6%) |
| 65 to 69 Years | 6 (1.5%) | 6 (1.2%) |
| 70 to 74 Years | 8 (2.0%) | 4 (0.8%) |
| 75 to 79 Years | 2 (0.5%) | 16 (3.2%) |
| 80 to 84 Years | 4 (1.0%) | 1 (0.2%) |
| 85 Years and over | 0 (0.0%) | 2 (0.4%) |
| Total | 396 (100.0%) | 503 (100.0%) |
Families and Households in Zia Pueblo
Median Family Size in Zia Pueblo
The median family size in Zia Pueblo is 4.76 persons per family, with married-couple families (77 | 45.0%) accounting for the largest median family size of 5.56 persons per family. On the other hand, single male/father families (44 | 25.7%) represent the smallest median family size with 3.55 persons per family.
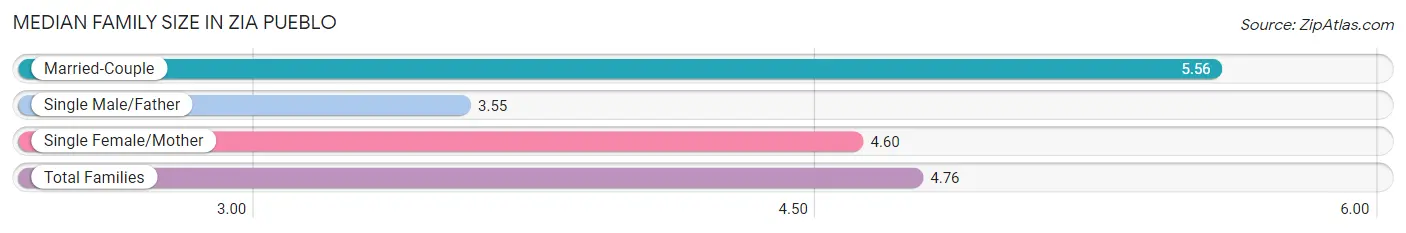
| Family Type | # Families | Family Size |
| Married-Couple | 77 (45.0%) | 5.56 |
| Single Male/Father | 44 (25.7%) | 3.55 |
| Single Female/Mother | 50 (29.2%) | 4.60 |
| Total Families | 171 (100.0%) | 4.76 |
Median Household Size in Zia Pueblo
The median household size in Zia Pueblo is 4.07 persons per household, with married-couple households (77 | 34.8%) accounting for the largest median household size of 5.71 persons per household. non-family households (50 | 22.6%) represent the smallest median household size with 1.12 persons per household.
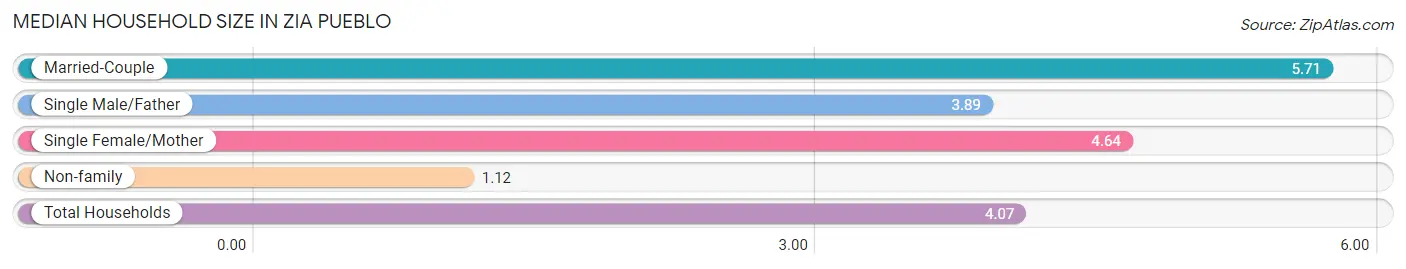
| Household Type | # Households | Household Size |
| Married-Couple | 77 (34.8%) | 5.71 |
| Single Male/Father | 44 (19.9%) | 3.89 |
| Single Female/Mother | 50 (22.6%) | 4.64 |
| Non-family | 50 (22.6%) | 1.12 |
| Total Households | 221 (100.0%) | 4.07 |
Household Size by Marriage Status in Zia Pueblo
Out of a total of 221 households in Zia Pueblo, 171 (77.4%) are family households, while 50 (22.6%) are nonfamily households. The most numerous type of family households are 2-person households, comprising 55, and the most common type of nonfamily households are 1-person households, comprising 46.
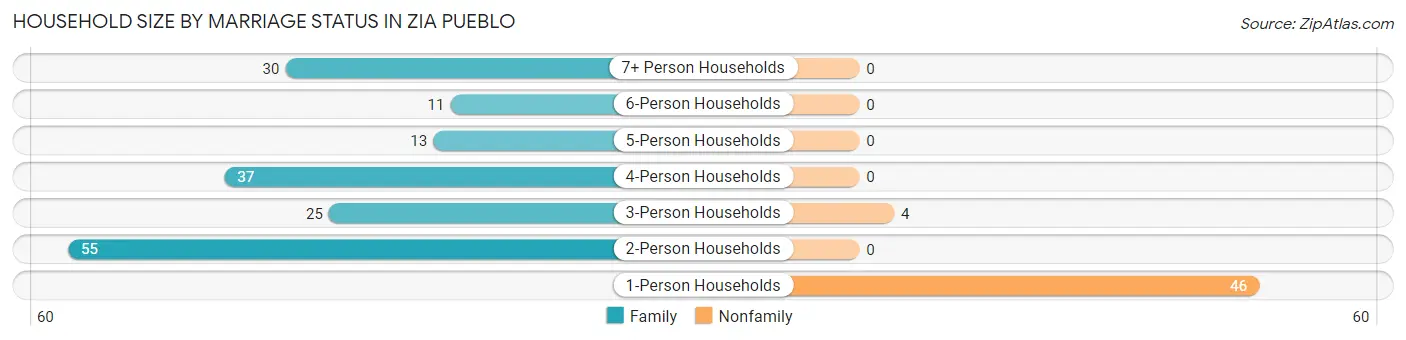
| Household Size | Family Households | Nonfamily Households |
| 1-Person Households | - | 46 (20.8%) |
| 2-Person Households | 55 (24.9%) | 0 (0.0%) |
| 3-Person Households | 25 (11.3%) | 4 (1.8%) |
| 4-Person Households | 37 (16.7%) | 0 (0.0%) |
| 5-Person Households | 13 (5.9%) | 0 (0.0%) |
| 6-Person Households | 11 (5.0%) | 0 (0.0%) |
| 7+ Person Households | 30 (13.6%) | 0 (0.0%) |
| Total | 171 (77.4%) | 50 (22.6%) |
Female Fertility in Zia Pueblo
Fertility by Age in Zia Pueblo
Average fertility rate in Zia Pueblo is 84.0 births per 1,000 women. Women in the age bracket of 20 to 34 years have the highest fertility rate with 174.0 births per 1,000 women. Women in the age bracket of 20 to 34 years acount for 100.0% of all women with births.
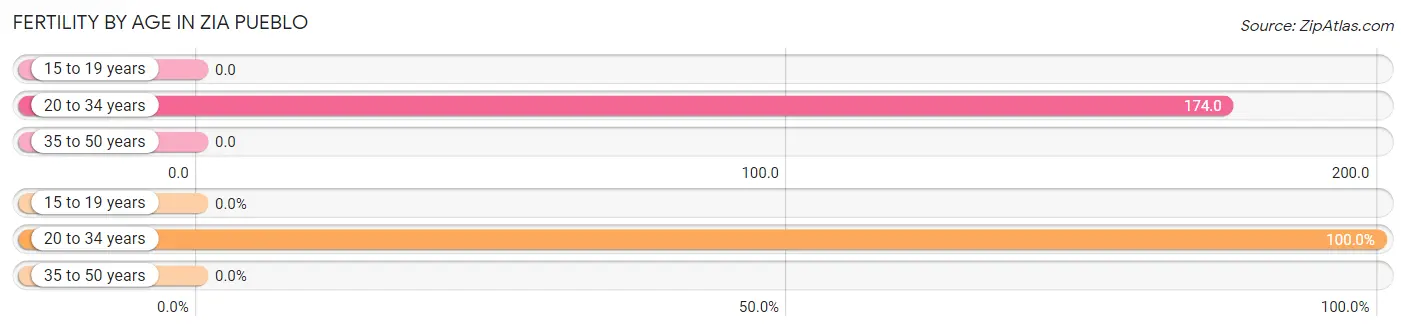
| Age Bracket | Women with Births | Births / 1,000 Women |
| 15 to 19 years | 0 (0.0%) | 0.0 |
| 20 to 34 years | 23 (100.0%) | 174.0 |
| 35 to 50 years | 0 (0.0%) | 0.0 |
| Total | 23 (100.0%) | 84.0 |
Fertility by Age by Marriage Status in Zia Pueblo
34.8% of women with births (23) in Zia Pueblo are married. The highest percentage of unmarried women with births falls into 20 to 34 years age bracket with 65.2% of them unmarried at the time of birth, while the lowest percentage of unmarried women with births belong to 20 to 34 years age bracket with 65.2% of them unmarried.
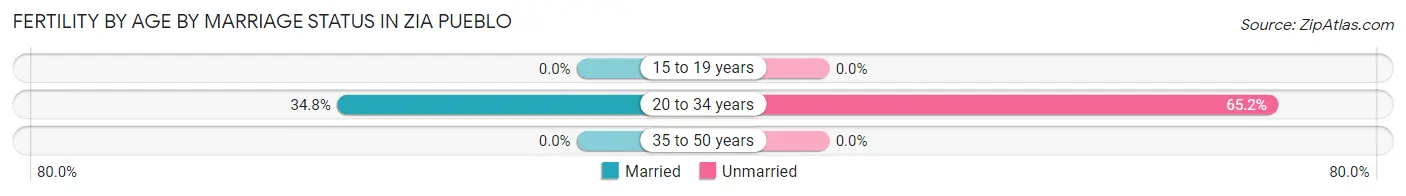
| Age Bracket | Married | Unmarried |
| 15 to 19 years | 0 (0.0%) | 0 (0.0%) |
| 20 to 34 years | 8 (34.8%) | 15 (65.2%) |
| 35 to 50 years | 0 (0.0%) | 0 (0.0%) |
| Total | 8 (34.8%) | 15 (65.2%) |
Fertility by Education in Zia Pueblo
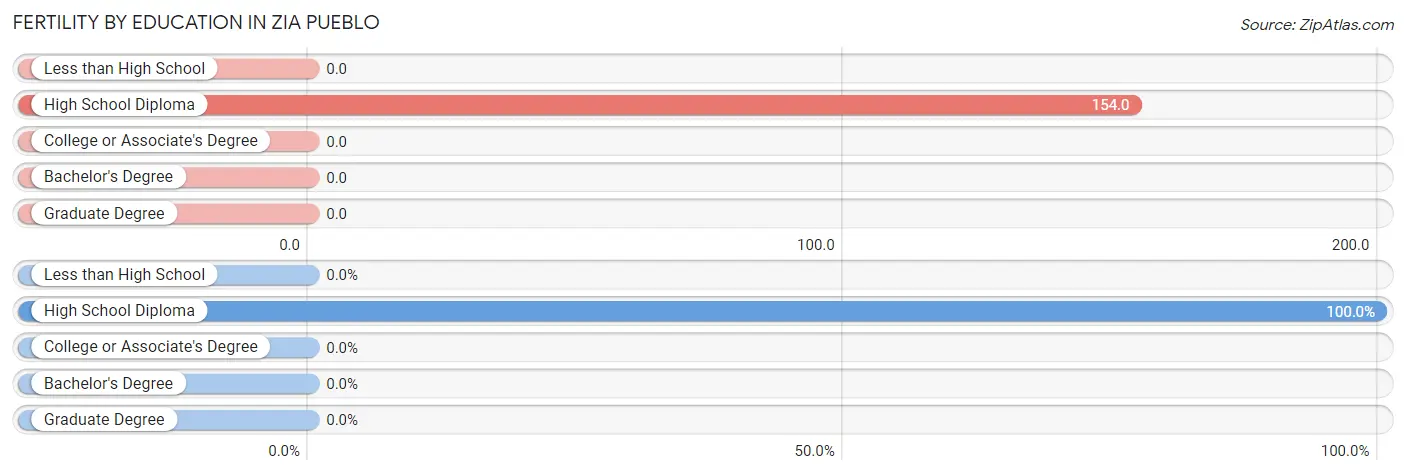
| Educational Attainment | Women with Births | Births / 1,000 Women |
| Less than High School | 0 (0.0%) | 0.0 |
| High School Diploma | 23 (100.0%) | 154.0 |
| College or Associate's Degree | 0 (0.0%) | 0.0 |
| Bachelor's Degree | 0 (0.0%) | 0.0 |
| Graduate Degree | 0 (0.0%) | 0.0 |
| Total | 23 (100.0%) | 84.0 |
Fertility by Education by Marriage Status in Zia Pueblo
65.2% of women with births in Zia Pueblo are unmarried. Women with the educational attainment of high school diploma are most likely to be married with 34.8% of them married at childbirth, while women with the educational attainment of high school diploma are least likely to be married with 65.2% of them unmarried at childbirth.
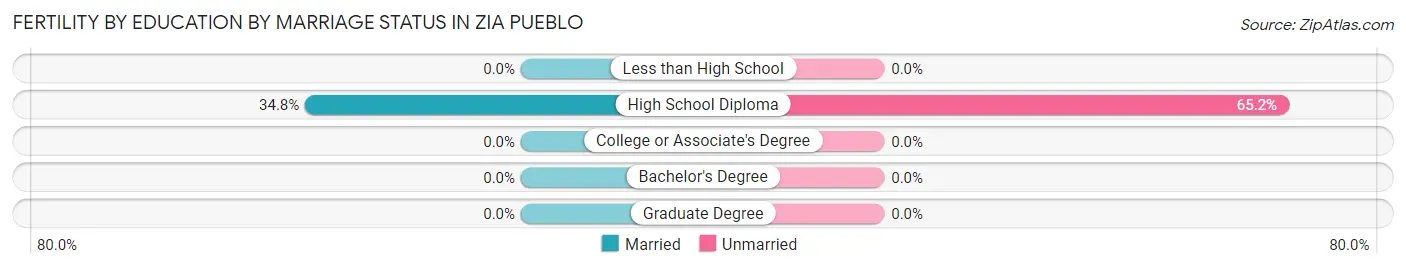
| Educational Attainment | Married | Unmarried |
| Less than High School | 0 (0.0%) | 0 (0.0%) |
| High School Diploma | 8 (34.8%) | 15 (65.2%) |
| College or Associate's Degree | 0 (0.0%) | 0 (0.0%) |
| Bachelor's Degree | 0 (0.0%) | 0 (0.0%) |
| Graduate Degree | 0 (0.0%) | 0 (0.0%) |
| Total | 8 (34.8%) | 15 (65.2%) |
Employment Characteristics in Zia Pueblo
Employment by Class of Employer in Zia Pueblo
Among the 387 employed individuals in Zia Pueblo, private company employees (241 | 62.3%), federal government employees (54 | 14.0%), and local government employees (36 | 9.3%) make up the most common classes of employment.
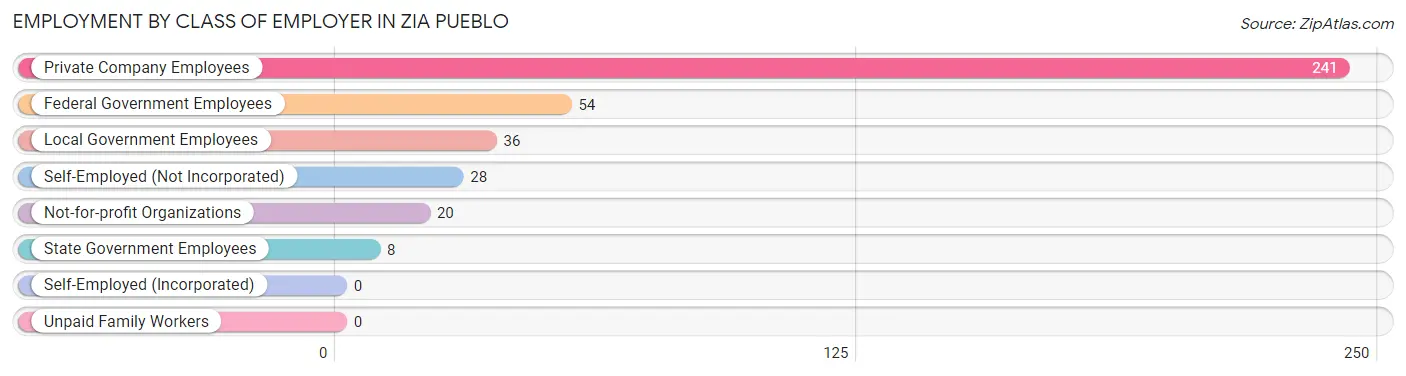
| Employer Class | # Employees | % Employees |
| Private Company Employees | 241 | 62.3% |
| Self-Employed (Incorporated) | 0 | 0.0% |
| Self-Employed (Not Incorporated) | 28 | 7.2% |
| Not-for-profit Organizations | 20 | 5.2% |
| Local Government Employees | 36 | 9.3% |
| State Government Employees | 8 | 2.1% |
| Federal Government Employees | 54 | 14.0% |
| Unpaid Family Workers | 0 | 0.0% |
| Total | 387 | 100.0% |
Employment Status by Age in Zia Pueblo
According to the labor force statistics for Zia Pueblo, out of the total population over 16 years of age (649), 68.0% or 441 individuals are in the labor force, with 10.0% or 44 of them unemployed. The age group with the highest labor force participation rate is 20 to 24 years, with 92.6% or 50 individuals in the labor force. Within the labor force, the 16 to 19 years age range has the highest percentage of unemployed individuals, with 36.4% or 12 of them being unemployed.
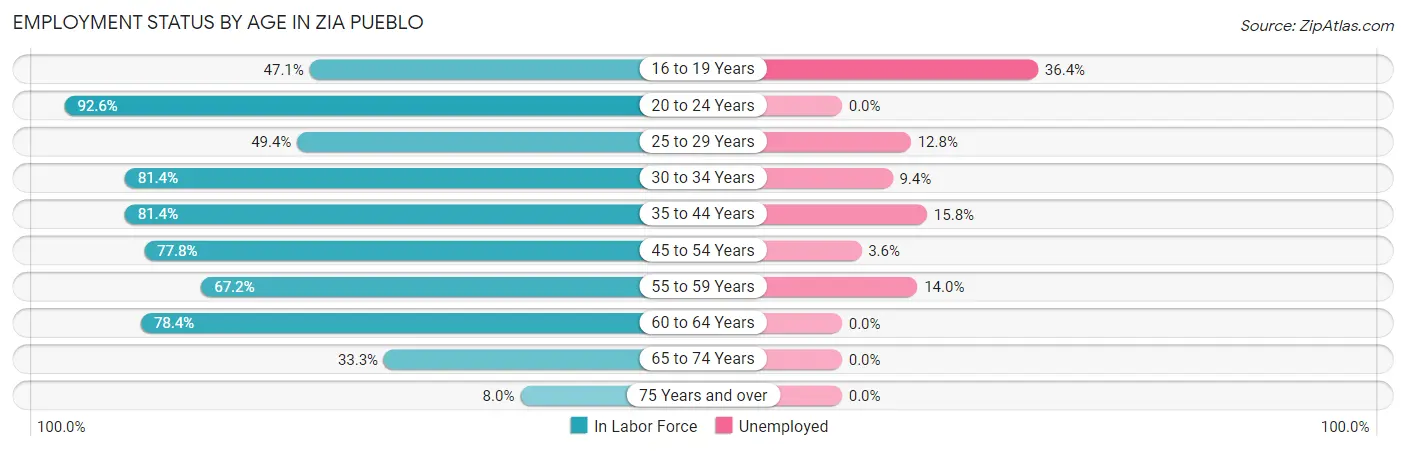
| Age Bracket | In Labor Force | Unemployed |
| 16 to 19 Years | 33 (47.1%) | 12 (36.4%) |
| 20 to 24 Years | 50 (92.6%) | 0 (0.0%) |
| 25 to 29 Years | 39 (49.4%) | 5 (12.8%) |
| 30 to 34 Years | 96 (81.4%) | 9 (9.4%) |
| 35 to 44 Years | 57 (81.4%) | 9 (15.8%) |
| 45 to 54 Years | 84 (77.8%) | 3 (3.6%) |
| 55 to 59 Years | 43 (67.2%) | 6 (14.0%) |
| 60 to 64 Years | 29 (78.4%) | 0 (0.0%) |
| 65 to 74 Years | 8 (33.3%) | 0 (0.0%) |
| 75 Years and over | 2 (8.0%) | 0 (0.0%) |
| Total | 441 (68.0%) | 44 (10.0%) |
Employment Status by Educational Attainment in Zia Pueblo
According to labor force statistics for Zia Pueblo, 73.1% of individuals (348) out of the total population between 25 and 64 years of age (476) are in the labor force, with 9.2% or 32 of them being unemployed. The group with the highest labor force participation rate are those with the educational attainment of bachelor's degree or higher, with 100.0% or 20 individuals in the labor force. Within the labor force, individuals with less than high school education have the highest percentage of unemployment, with 22.6% or 7 of them being unemployed.
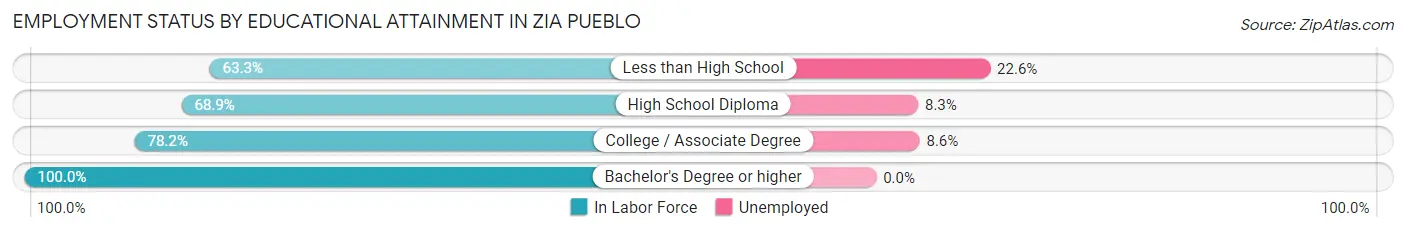
| Educational Attainment | In Labor Force | Unemployed |
| Less than High School | 31 (63.3%) | 11 (22.6%) |
| High School Diploma | 157 (68.9%) | 19 (8.3%) |
| College / Associate Degree | 140 (78.2%) | 15 (8.6%) |
| Bachelor's Degree or higher | 20 (100.0%) | 0 (0.0%) |
| Total | 348 (73.1%) | 44 (9.2%) |
Employment Occupations by Sex in Zia Pueblo
Management, Business, Science and Arts Occupations
The most common Management, Business, Science and Arts occupations in Zia Pueblo are Community & Social Service (34 | 8.6%), Management (32 | 8.1%), Computers, Engineering & Science (24 | 6.0%), Computers & Mathematics (21 | 5.3%), and Education Instruction & Library (19 | 4.8%).
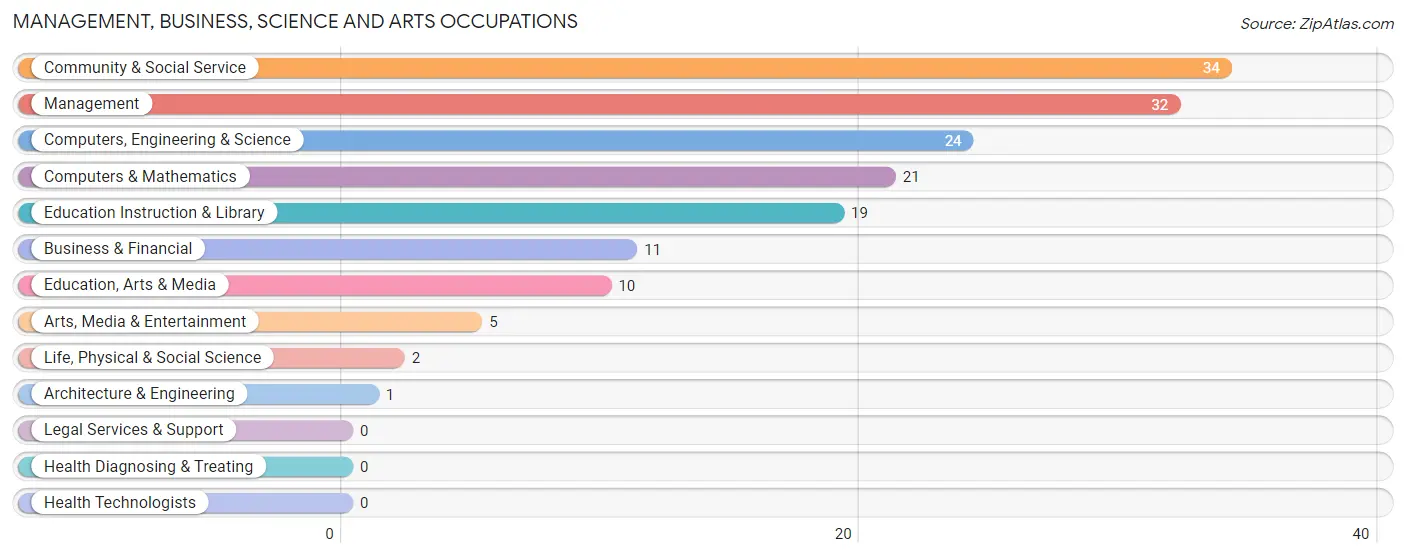
Management, Business, Science and Arts Occupations by Sex
Within the Management, Business, Science and Arts occupations in Zia Pueblo, the most male-oriented occupations are Architecture & Engineering (100.0%), Life, Physical & Social Science (100.0%), and Arts, Media & Entertainment (100.0%), while the most female-oriented occupations are Business & Financial (100.0%), Education Instruction & Library (89.5%), and Community & Social Service (70.6%).
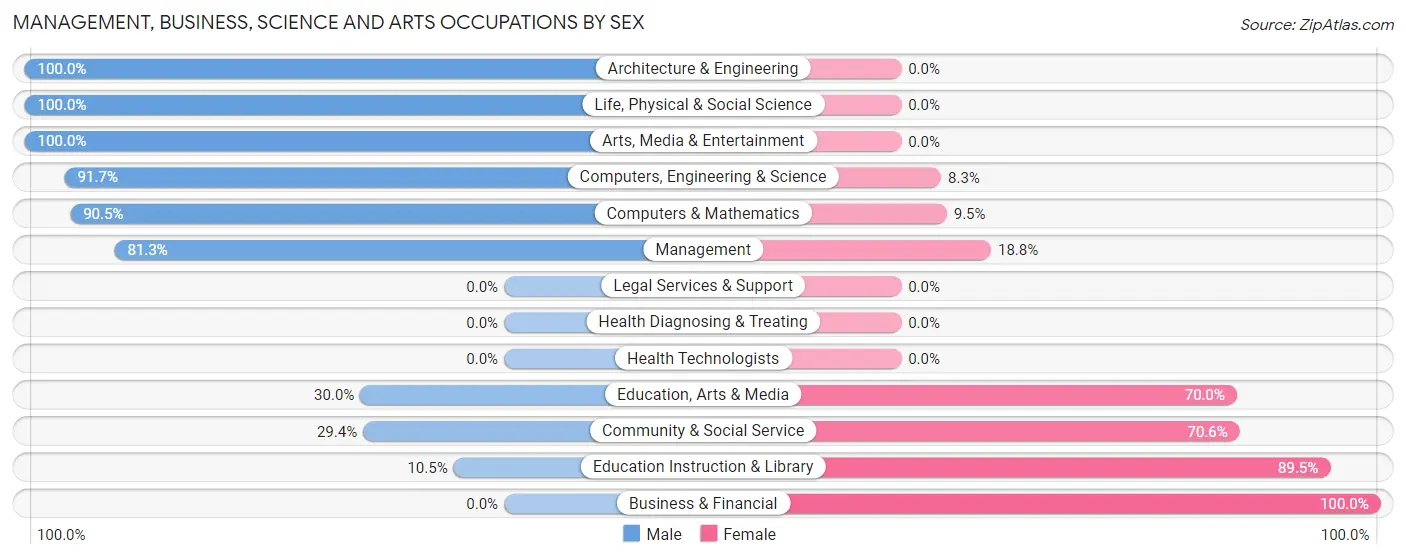
| Occupation | Male | Female |
| Management | 26 (81.2%) | 6 (18.8%) |
| Business & Financial | 0 (0.0%) | 11 (100.0%) |
| Computers, Engineering & Science | 22 (91.7%) | 2 (8.3%) |
| Computers & Mathematics | 19 (90.5%) | 2 (9.5%) |
| Architecture & Engineering | 1 (100.0%) | 0 (0.0%) |
| Life, Physical & Social Science | 2 (100.0%) | 0 (0.0%) |
| Community & Social Service | 10 (29.4%) | 24 (70.6%) |
| Education, Arts & Media | 3 (30.0%) | 7 (70.0%) |
| Legal Services & Support | 0 (0.0%) | 0 (0.0%) |
| Education Instruction & Library | 2 (10.5%) | 17 (89.5%) |
| Arts, Media & Entertainment | 5 (100.0%) | 0 (0.0%) |
| Health Diagnosing & Treating | 0 (0.0%) | 0 (0.0%) |
| Health Technologists | 0 (0.0%) | 0 (0.0%) |
| Total (Category) | 58 (57.4%) | 43 (42.6%) |
| Total (Overall) | 209 (52.6%) | 188 (47.4%) |
Services Occupations
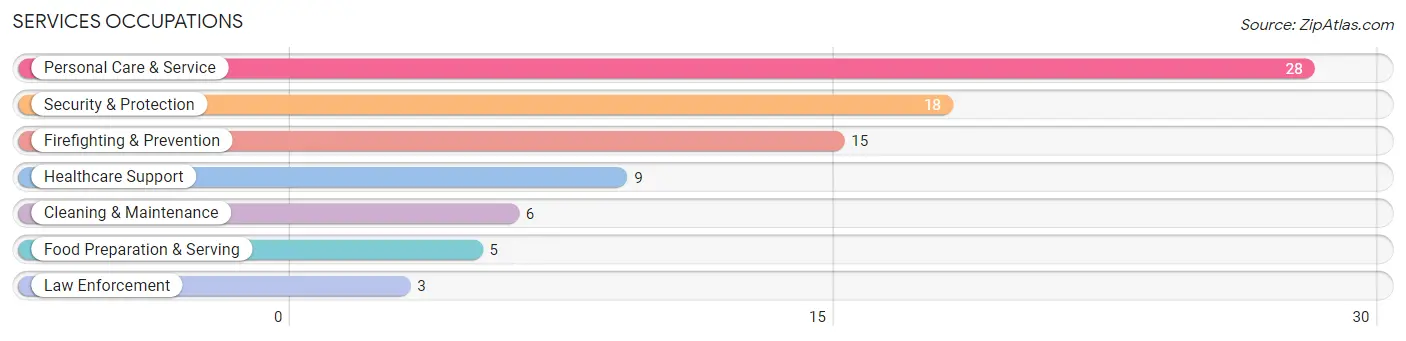
The most common Services occupations in Zia Pueblo are Personal Care & Service (28 | 7.0%), Security & Protection (18 | 4.5%), Firefighting & Prevention (15 | 3.8%), Healthcare Support (9 | 2.3%), and Cleaning & Maintenance (6 | 1.5%).
Services Occupations by Sex
Within the Services occupations in Zia Pueblo, the most male-oriented occupations are Law Enforcement (100.0%), Cleaning & Maintenance (100.0%), and Security & Protection (72.2%), while the most female-oriented occupations are Healthcare Support (100.0%), Food Preparation & Serving (100.0%), and Personal Care & Service (71.4%).
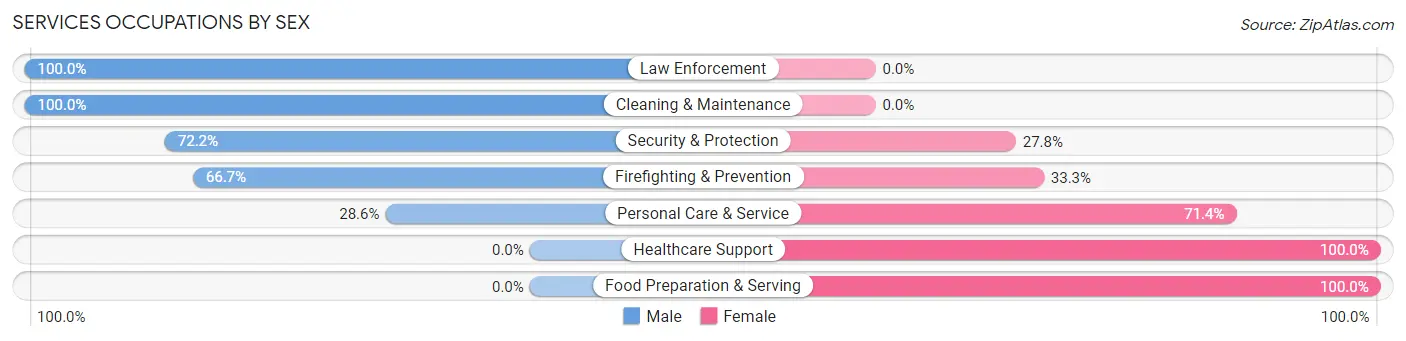
| Occupation | Male | Female |
| Healthcare Support | 0 (0.0%) | 9 (100.0%) |
| Security & Protection | 13 (72.2%) | 5 (27.8%) |
| Firefighting & Prevention | 10 (66.7%) | 5 (33.3%) |
| Law Enforcement | 3 (100.0%) | 0 (0.0%) |
| Food Preparation & Serving | 0 (0.0%) | 5 (100.0%) |
| Cleaning & Maintenance | 6 (100.0%) | 0 (0.0%) |
| Personal Care & Service | 8 (28.6%) | 20 (71.4%) |
| Total (Category) | 27 (40.9%) | 39 (59.1%) |
| Total (Overall) | 209 (52.6%) | 188 (47.4%) |
Sales and Office Occupations
The most common Sales and Office occupations in Zia Pueblo are Office & Administration (64 | 16.1%), and Sales & Related (42 | 10.6%).

Sales and Office Occupations by Sex
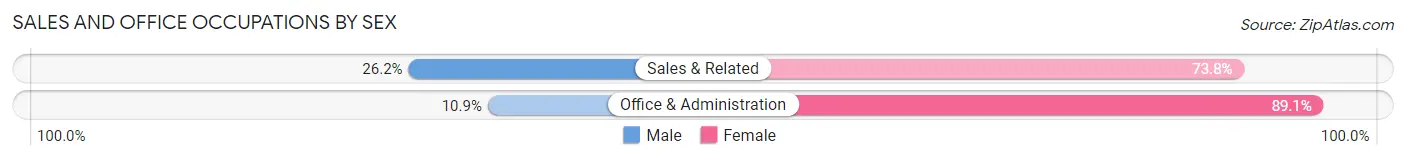
| Occupation | Male | Female |
| Sales & Related | 11 (26.2%) | 31 (73.8%) |
| Office & Administration | 7 (10.9%) | 57 (89.1%) |
| Total (Category) | 18 (17.0%) | 88 (83.0%) |
| Total (Overall) | 209 (52.6%) | 188 (47.4%) |
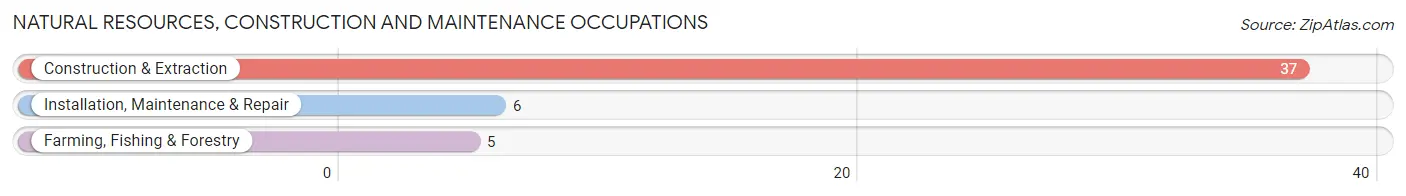
Natural Resources, Construction and Maintenance Occupations
The most common Natural Resources, Construction and Maintenance occupations in Zia Pueblo are Construction & Extraction (37 | 9.3%), Installation, Maintenance & Repair (6 | 1.5%), and Farming, Fishing & Forestry (5 | 1.3%).
Natural Resources, Construction and Maintenance Occupations by Sex
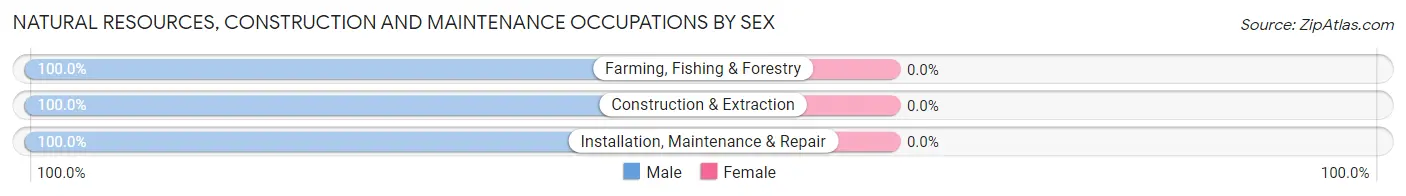
| Occupation | Male | Female |
| Farming, Fishing & Forestry | 5 (100.0%) | 0 (0.0%) |
| Construction & Extraction | 37 (100.0%) | 0 (0.0%) |
| Installation, Maintenance & Repair | 6 (100.0%) | 0 (0.0%) |
| Total (Category) | 48 (100.0%) | 0 (0.0%) |
| Total (Overall) | 209 (52.6%) | 188 (47.4%) |
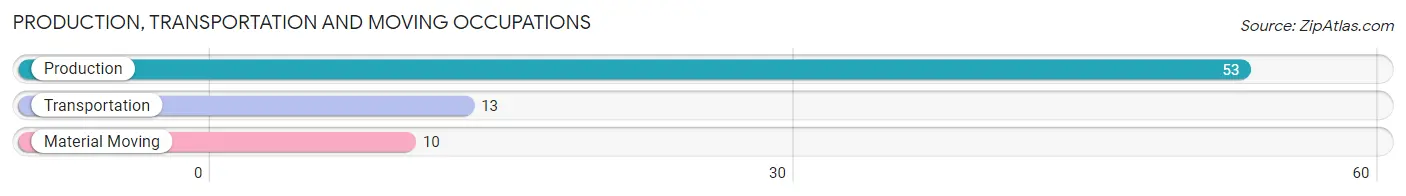
Production, Transportation and Moving Occupations
The most common Production, Transportation and Moving occupations in Zia Pueblo are Production (53 | 13.4%), Transportation (13 | 3.3%), and Material Moving (10 | 2.5%).
Production, Transportation and Moving Occupations by Sex
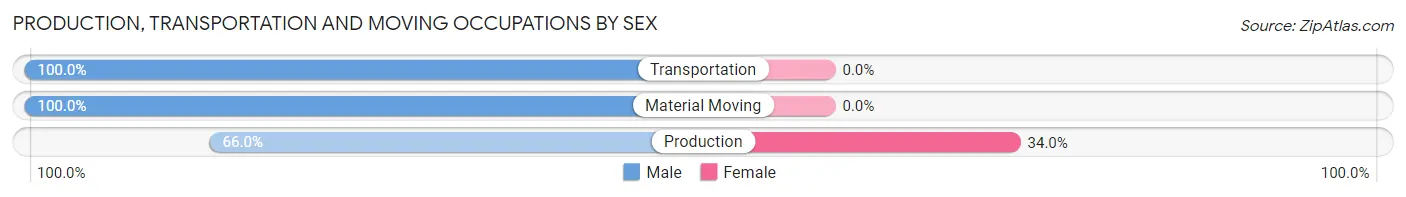
| Occupation | Male | Female |
| Production | 35 (66.0%) | 18 (34.0%) |
| Transportation | 13 (100.0%) | 0 (0.0%) |
| Material Moving | 10 (100.0%) | 0 (0.0%) |
| Total (Category) | 58 (76.3%) | 18 (23.7%) |
| Total (Overall) | 209 (52.6%) | 188 (47.4%) |
Employment Industries by Sex in Zia Pueblo
Employment Industries in Zia Pueblo
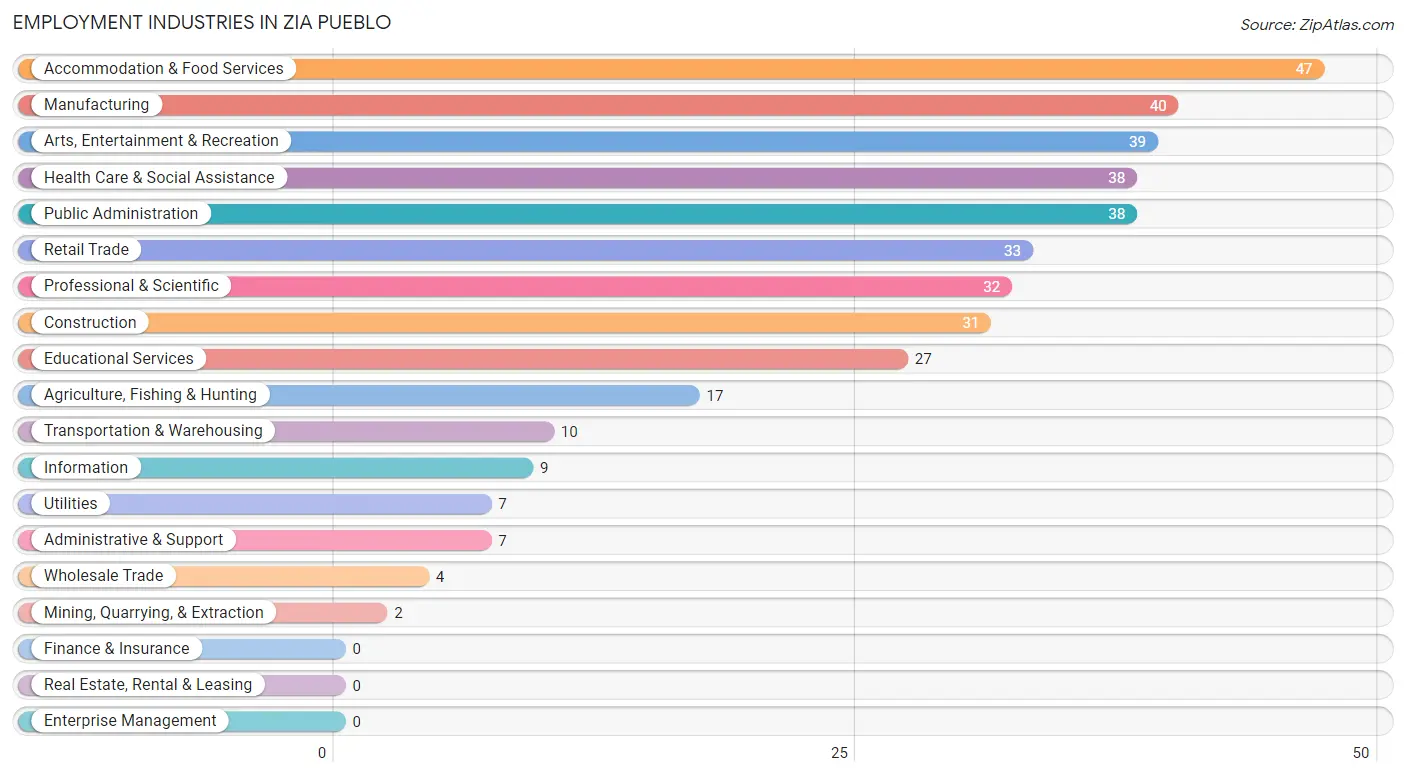
The major employment industries in Zia Pueblo include Accommodation & Food Services (47 | 11.8%), Manufacturing (40 | 10.1%), Arts, Entertainment & Recreation (39 | 9.8%), Health Care & Social Assistance (38 | 9.6%), and Public Administration (38 | 9.6%).
Employment Industries by Sex in Zia Pueblo
The Zia Pueblo industries that see more men than women are Agriculture, Fishing & Hunting (100.0%), Mining, Quarrying, & Extraction (100.0%), and Construction (100.0%), whereas the industries that tend to have a higher number of women are Administrative & Support (100.0%), Information (77.8%), and Health Care & Social Assistance (73.7%).
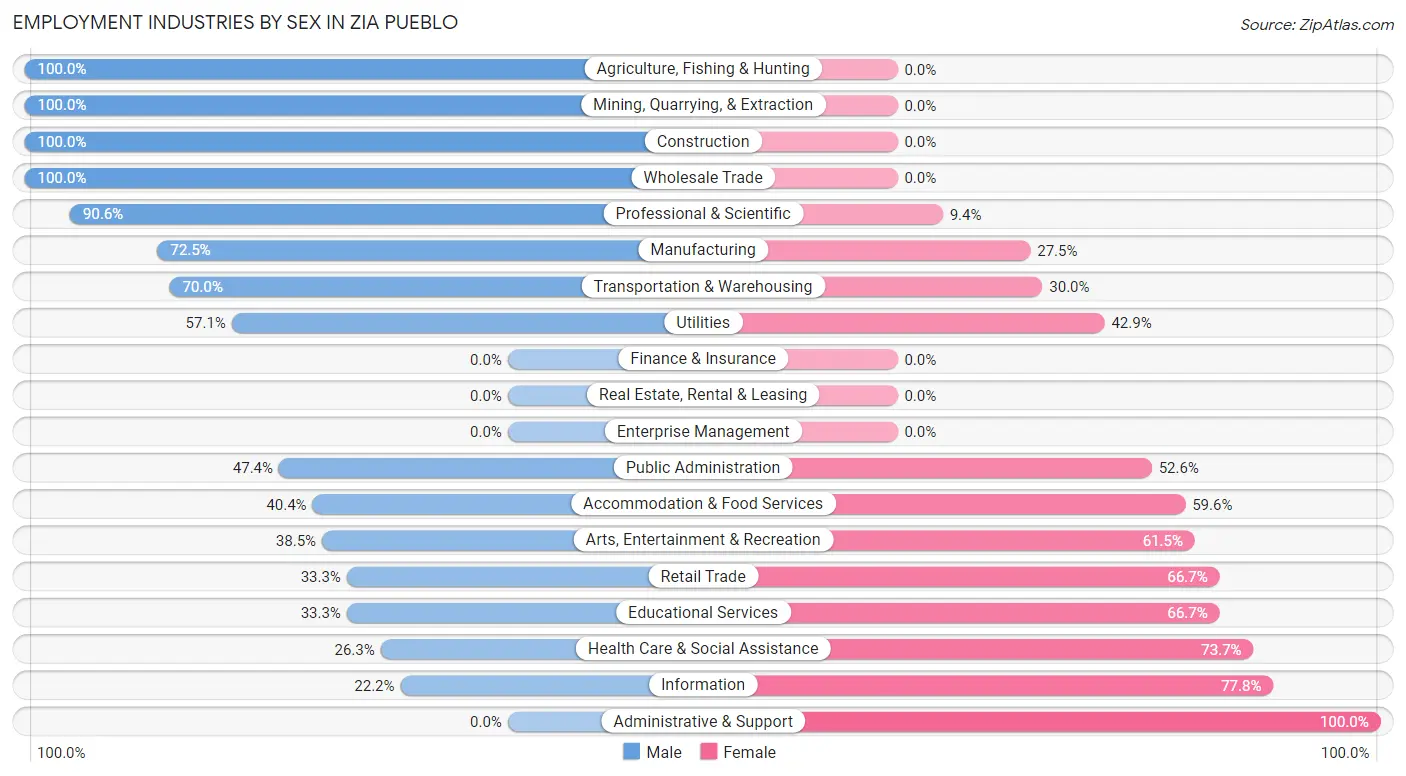
| Industry | Male | Female |
| Agriculture, Fishing & Hunting | 17 (100.0%) | 0 (0.0%) |
| Mining, Quarrying, & Extraction | 2 (100.0%) | 0 (0.0%) |
| Construction | 31 (100.0%) | 0 (0.0%) |
| Manufacturing | 29 (72.5%) | 11 (27.5%) |
| Wholesale Trade | 4 (100.0%) | 0 (0.0%) |
| Retail Trade | 11 (33.3%) | 22 (66.7%) |
| Transportation & Warehousing | 7 (70.0%) | 3 (30.0%) |
| Utilities | 4 (57.1%) | 3 (42.9%) |
| Information | 2 (22.2%) | 7 (77.8%) |
| Finance & Insurance | 0 (0.0%) | 0 (0.0%) |
| Real Estate, Rental & Leasing | 0 (0.0%) | 0 (0.0%) |
| Professional & Scientific | 29 (90.6%) | 3 (9.4%) |
| Enterprise Management | 0 (0.0%) | 0 (0.0%) |
| Administrative & Support | 0 (0.0%) | 7 (100.0%) |
| Educational Services | 9 (33.3%) | 18 (66.7%) |
| Health Care & Social Assistance | 10 (26.3%) | 28 (73.7%) |
| Arts, Entertainment & Recreation | 15 (38.5%) | 24 (61.5%) |
| Accommodation & Food Services | 19 (40.4%) | 28 (59.6%) |
| Public Administration | 18 (47.4%) | 20 (52.6%) |
| Total | 209 (52.6%) | 188 (47.4%) |
Education in Zia Pueblo
School Enrollment in Zia Pueblo
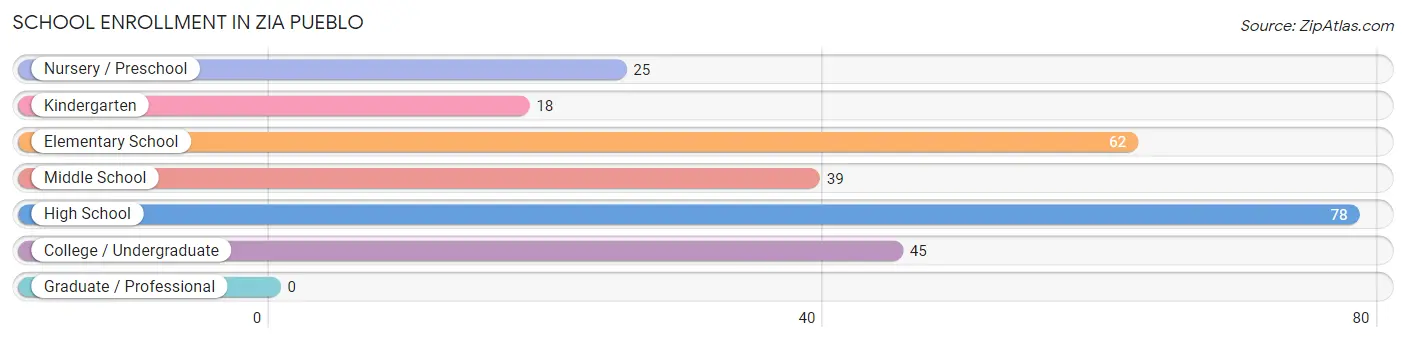
The most common levels of schooling among the 267 students in Zia Pueblo are high school (78 | 29.2%), elementary school (62 | 23.2%), and college / undergraduate (45 | 16.9%).
| School Level | # Students | % Students |
| Nursery / Preschool | 25 | 9.4% |
| Kindergarten | 18 | 6.7% |
| Elementary School | 62 | 23.2% |
| Middle School | 39 | 14.6% |
| High School | 78 | 29.2% |
| College / Undergraduate | 45 | 16.9% |
| Graduate / Professional | 0 | 0.0% |
| Total | 267 | 100.0% |
School Enrollment by Age by Funding Source in Zia Pueblo
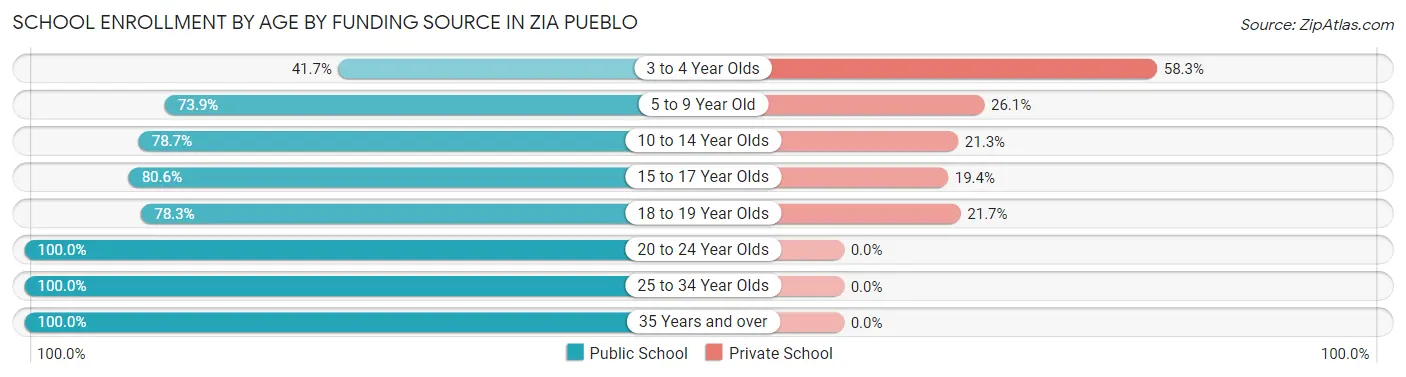
Out of a total of 267 students who are enrolled in schools in Zia Pueblo, 58 (21.7%) attend a private institution, while the remaining 209 (78.3%) are enrolled in public schools. The age group of 3 to 4 year olds has the highest likelihood of being enrolled in private schools, with 7 (58.3% in the age bracket) enrolled. Conversely, the age group of 20 to 24 year olds has the lowest likelihood of being enrolled in a private school, with 14 (100.0% in the age bracket) attending a public institution.
| Age Bracket | Public School | Private School |
| 3 to 4 Year Olds | 5 (41.7%) | 7 (58.3%) |
| 5 to 9 Year Old | 65 (73.9%) | 23 (26.1%) |
| 10 to 14 Year Olds | 37 (78.7%) | 10 (21.3%) |
| 15 to 17 Year Olds | 54 (80.6%) | 13 (19.4%) |
| 18 to 19 Year Olds | 18 (78.3%) | 5 (21.7%) |
| 20 to 24 Year Olds | 14 (100.0%) | 0 (0.0%) |
| 25 to 34 Year Olds | 14 (100.0%) | 0 (0.0%) |
| 35 Years and over | 2 (100.0%) | 0 (0.0%) |
| Total | 209 (78.3%) | 58 (21.7%) |
Educational Attainment by Field of Study in Zia Pueblo
Education (17 | 58.6%), bio, nature & agricultural (8 | 27.6%), physical & health sciences (2 | 6.9%), and business (2 | 6.9%) are the most common fields of study among 29 individuals in Zia Pueblo who have obtained a bachelor's degree or higher.
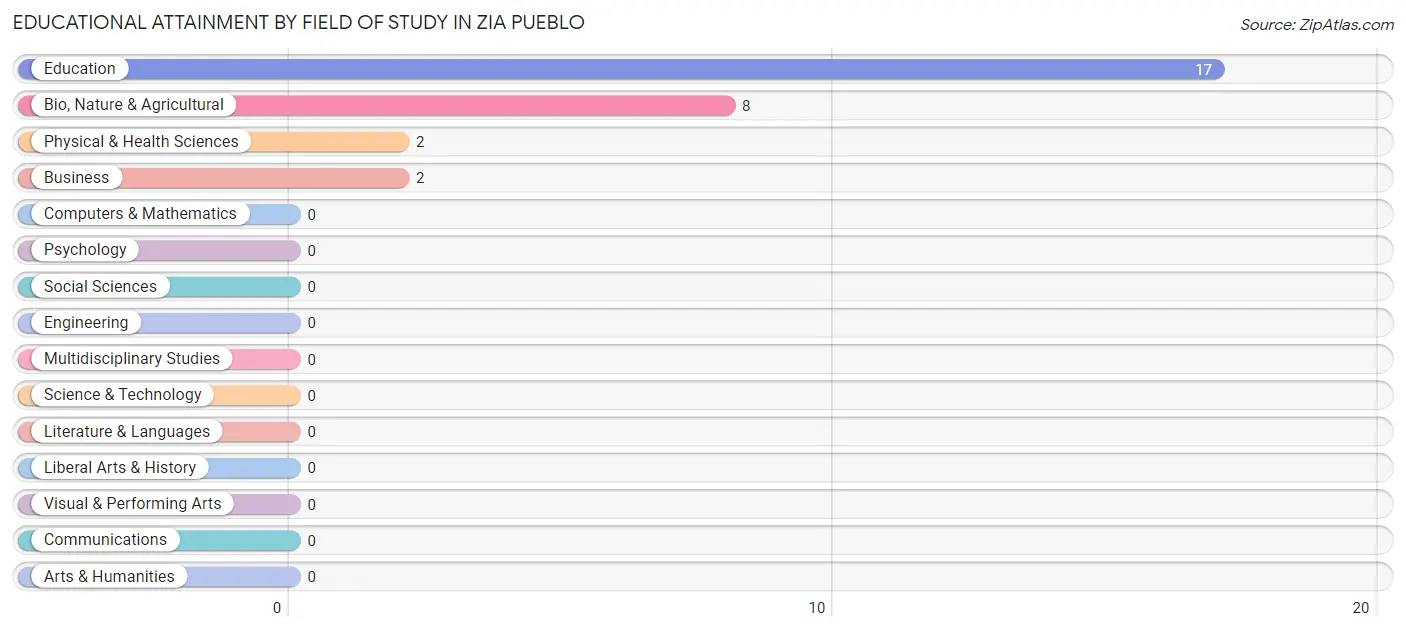
| Field of Study | # Graduates | % Graduates |
| Computers & Mathematics | 0 | 0.0% |
| Bio, Nature & Agricultural | 8 | 27.6% |
| Physical & Health Sciences | 2 | 6.9% |
| Psychology | 0 | 0.0% |
| Social Sciences | 0 | 0.0% |
| Engineering | 0 | 0.0% |
| Multidisciplinary Studies | 0 | 0.0% |
| Science & Technology | 0 | 0.0% |
| Business | 2 | 6.9% |
| Education | 17 | 58.6% |
| Literature & Languages | 0 | 0.0% |
| Liberal Arts & History | 0 | 0.0% |
| Visual & Performing Arts | 0 | 0.0% |
| Communications | 0 | 0.0% |
| Arts & Humanities | 0 | 0.0% |
| Total | 29 | 100.0% |
Transportation & Commute in Zia Pueblo
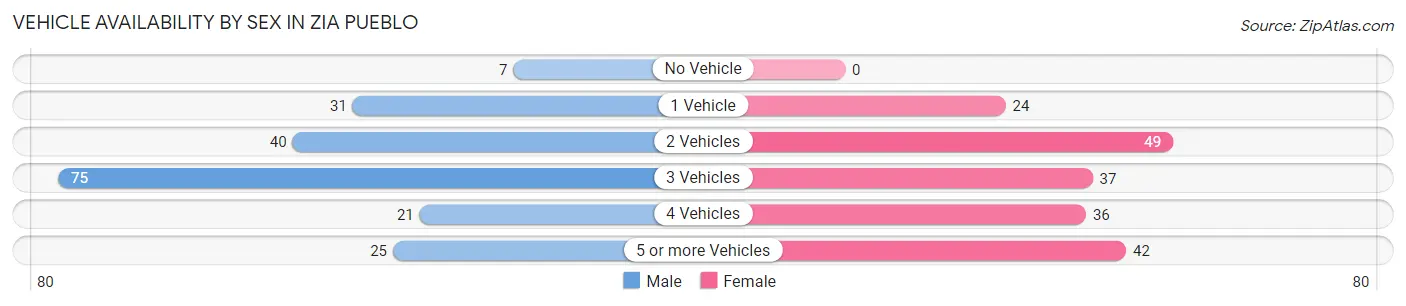
Vehicle Availability by Sex in Zia Pueblo
The most prevalent vehicle ownership categories in Zia Pueblo are males with 3 vehicles (75, accounting for 37.7%) and females with 3 vehicles (37, making up 39.9%).
| Vehicles Available | Male | Female |
| No Vehicle | 7 (3.5%) | 0 (0.0%) |
| 1 Vehicle | 31 (15.6%) | 24 (12.8%) |
| 2 Vehicles | 40 (20.1%) | 49 (26.1%) |
| 3 Vehicles | 75 (37.7%) | 37 (19.7%) |
| 4 Vehicles | 21 (10.5%) | 36 (19.2%) |
| 5 or more Vehicles | 25 (12.6%) | 42 (22.3%) |
| Total | 199 (100.0%) | 188 (100.0%) |
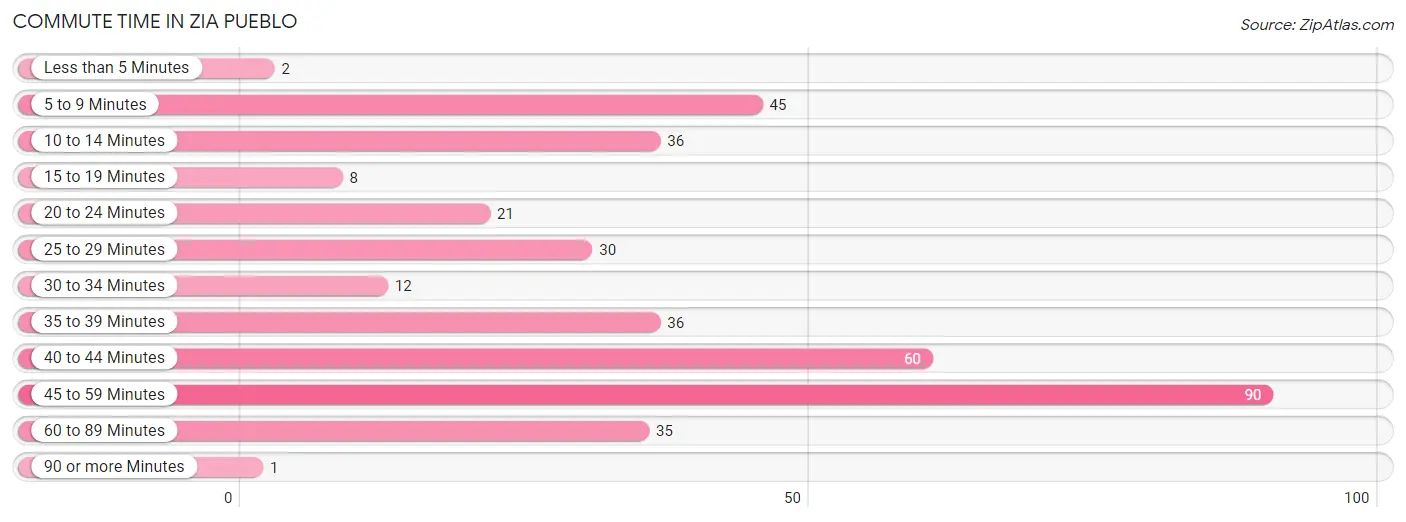
Commute Time in Zia Pueblo
The most frequently occuring commute durations in Zia Pueblo are 45 to 59 minutes (90 commuters, 23.9%), 40 to 44 minutes (60 commuters, 16.0%), and 5 to 9 minutes (45 commuters, 12.0%).
| Commute Time | # Commuters | % Commuters |
| Less than 5 Minutes | 2 | 0.5% |
| 5 to 9 Minutes | 45 | 12.0% |
| 10 to 14 Minutes | 36 | 9.6% |
| 15 to 19 Minutes | 8 | 2.1% |
| 20 to 24 Minutes | 21 | 5.6% |
| 25 to 29 Minutes | 30 | 8.0% |
| 30 to 34 Minutes | 12 | 3.2% |
| 35 to 39 Minutes | 36 | 9.6% |
| 40 to 44 Minutes | 60 | 16.0% |
| 45 to 59 Minutes | 90 | 23.9% |
| 60 to 89 Minutes | 35 | 9.3% |
| 90 or more Minutes | 1 | 0.3% |
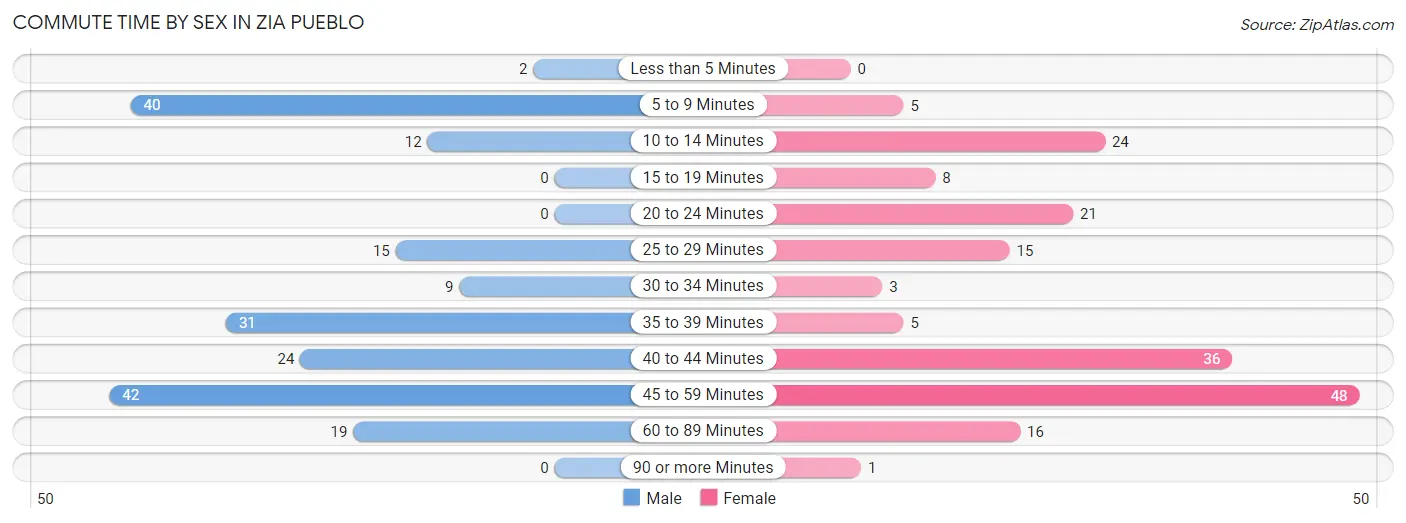
Commute Time by Sex in Zia Pueblo
The most common commute times in Zia Pueblo are 45 to 59 minutes (42 commuters, 21.6%) for males and 45 to 59 minutes (48 commuters, 26.4%) for females.
| Commute Time | Male | Female |
| Less than 5 Minutes | 2 (1.0%) | 0 (0.0%) |
| 5 to 9 Minutes | 40 (20.6%) | 5 (2.8%) |
| 10 to 14 Minutes | 12 (6.2%) | 24 (13.2%) |
| 15 to 19 Minutes | 0 (0.0%) | 8 (4.4%) |
| 20 to 24 Minutes | 0 (0.0%) | 21 (11.5%) |
| 25 to 29 Minutes | 15 (7.7%) | 15 (8.2%) |
| 30 to 34 Minutes | 9 (4.6%) | 3 (1.7%) |
| 35 to 39 Minutes | 31 (16.0%) | 5 (2.8%) |
| 40 to 44 Minutes | 24 (12.4%) | 36 (19.8%) |
| 45 to 59 Minutes | 42 (21.6%) | 48 (26.4%) |
| 60 to 89 Minutes | 19 (9.8%) | 16 (8.8%) |
| 90 or more Minutes | 0 (0.0%) | 1 (0.5%) |
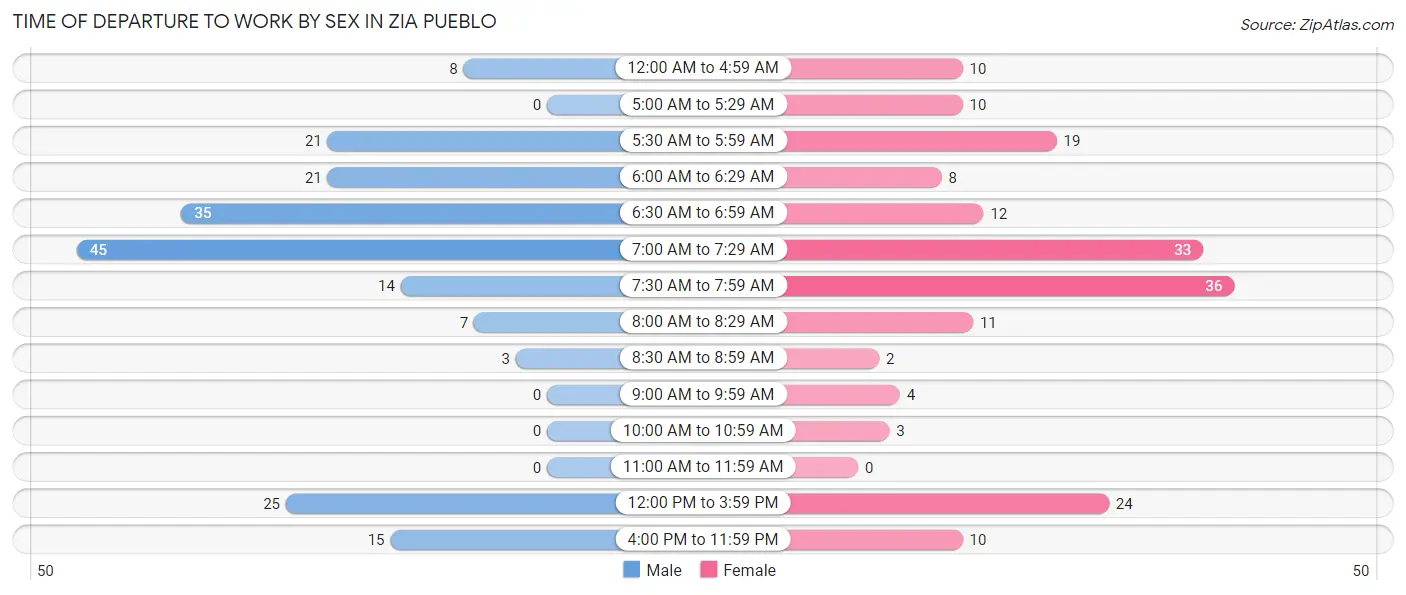
Time of Departure to Work by Sex in Zia Pueblo
The most frequent times of departure to work in Zia Pueblo are 7:00 AM to 7:29 AM (45, 23.2%) for males and 7:30 AM to 7:59 AM (36, 19.8%) for females.
| Time of Departure | Male | Female |
| 12:00 AM to 4:59 AM | 8 (4.1%) | 10 (5.5%) |
| 5:00 AM to 5:29 AM | 0 (0.0%) | 10 (5.5%) |
| 5:30 AM to 5:59 AM | 21 (10.8%) | 19 (10.4%) |
| 6:00 AM to 6:29 AM | 21 (10.8%) | 8 (4.4%) |
| 6:30 AM to 6:59 AM | 35 (18.0%) | 12 (6.6%) |
| 7:00 AM to 7:29 AM | 45 (23.2%) | 33 (18.1%) |
| 7:30 AM to 7:59 AM | 14 (7.2%) | 36 (19.8%) |
| 8:00 AM to 8:29 AM | 7 (3.6%) | 11 (6.0%) |
| 8:30 AM to 8:59 AM | 3 (1.5%) | 2 (1.1%) |
| 9:00 AM to 9:59 AM | 0 (0.0%) | 4 (2.2%) |
| 10:00 AM to 10:59 AM | 0 (0.0%) | 3 (1.7%) |
| 11:00 AM to 11:59 AM | 0 (0.0%) | 0 (0.0%) |
| 12:00 PM to 3:59 PM | 25 (12.9%) | 24 (13.2%) |
| 4:00 PM to 11:59 PM | 15 (7.7%) | 10 (5.5%) |
| Total | 194 (100.0%) | 182 (100.0%) |
Housing Occupancy in Zia Pueblo
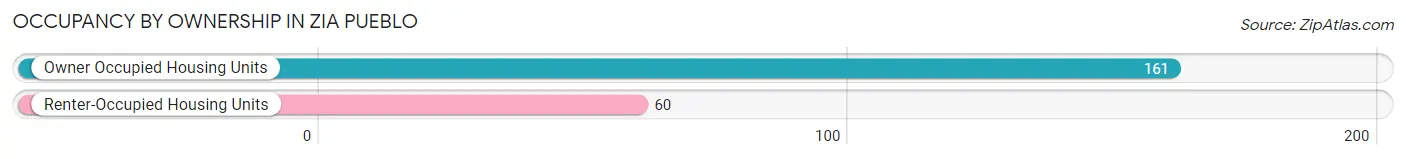
Occupancy by Ownership in Zia Pueblo
Of the total 221 dwellings in Zia Pueblo, owner-occupied units account for 161 (72.9%), while renter-occupied units make up 60 (27.2%).
| Occupancy | # Housing Units | % Housing Units |
| Owner Occupied Housing Units | 161 | 72.9% |
| Renter-Occupied Housing Units | 60 | 27.2% |
| Total Occupied Housing Units | 221 | 100.0% |
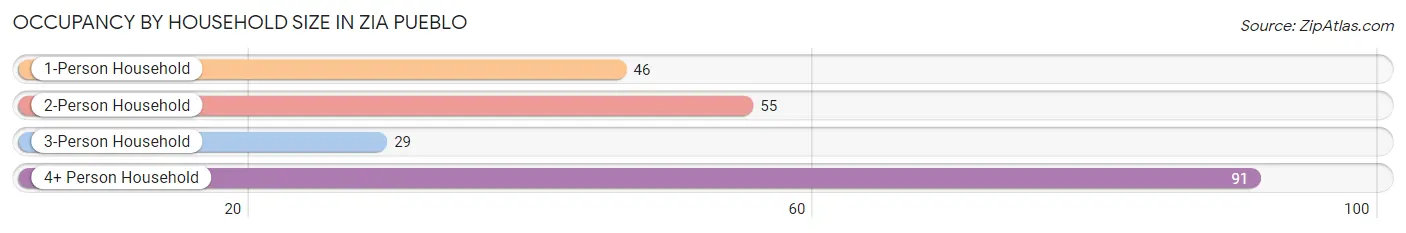
Occupancy by Household Size in Zia Pueblo
| Household Size | # Housing Units | % Housing Units |
| 1-Person Household | 46 | 20.8% |
| 2-Person Household | 55 | 24.9% |
| 3-Person Household | 29 | 13.1% |
| 4+ Person Household | 91 | 41.2% |
| Total Housing Units | 221 | 100.0% |
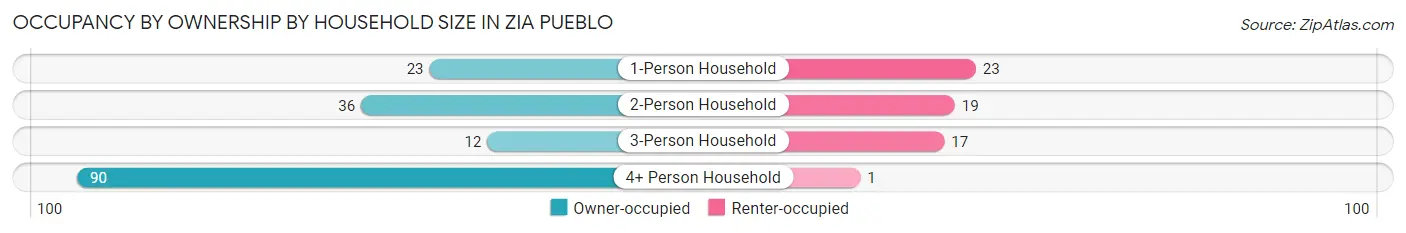
Occupancy by Ownership by Household Size in Zia Pueblo
| Household Size | Owner-occupied | Renter-occupied |
| 1-Person Household | 23 (50.0%) | 23 (50.0%) |
| 2-Person Household | 36 (65.4%) | 19 (34.5%) |
| 3-Person Household | 12 (41.4%) | 17 (58.6%) |
| 4+ Person Household | 90 (98.9%) | 1 (1.1%) |
| Total Housing Units | 161 (72.9%) | 60 (27.2%) |
Occupancy by Educational Attainment in Zia Pueblo
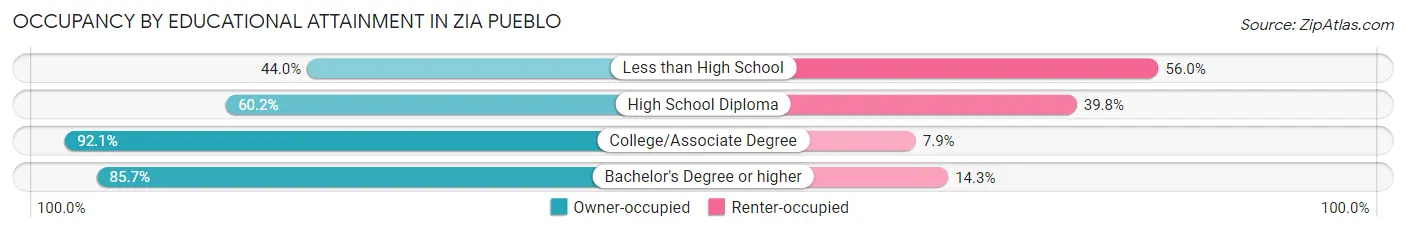
| Household Size | Owner-occupied | Renter-occupied |
| Less than High School | 11 (44.0%) | 14 (56.0%) |
| High School Diploma | 56 (60.2%) | 37 (39.8%) |
| College/Associate Degree | 82 (92.1%) | 7 (7.9%) |
| Bachelor's Degree or higher | 12 (85.7%) | 2 (14.3%) |
Occupancy by Age of Householder in Zia Pueblo
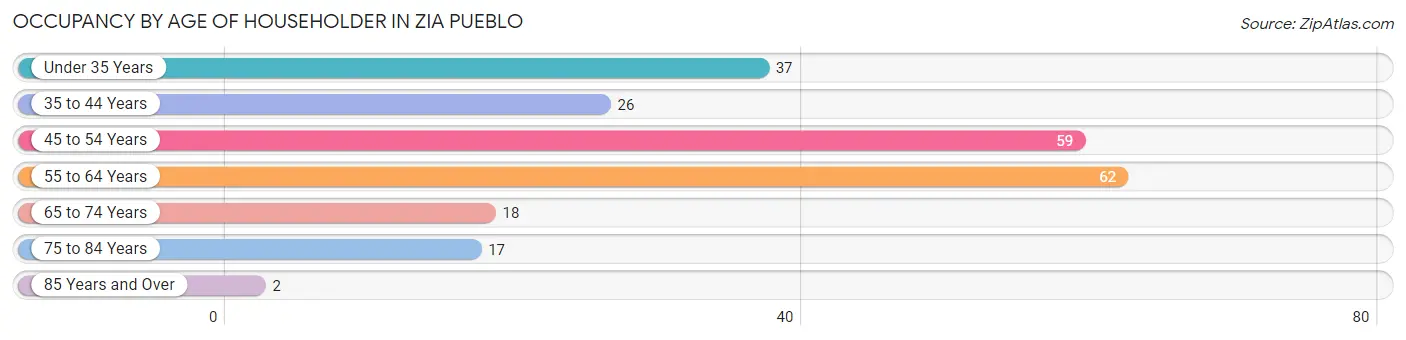
| Age Bracket | # Households | % Households |
| Under 35 Years | 37 | 16.7% |
| 35 to 44 Years | 26 | 11.8% |
| 45 to 54 Years | 59 | 26.7% |
| 55 to 64 Years | 62 | 28.1% |
| 65 to 74 Years | 18 | 8.1% |
| 75 to 84 Years | 17 | 7.7% |
| 85 Years and Over | 2 | 0.9% |
| Total | 221 | 100.0% |
Housing Finances in Zia Pueblo
Median Income by Occupancy in Zia Pueblo
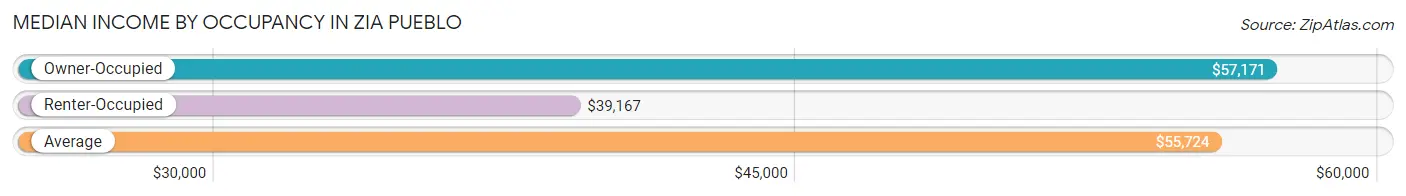
| Occupancy Type | # Households | Median Income |
| Owner-Occupied | 161 (72.9%) | $57,171 |
| Renter-Occupied | 60 (27.2%) | $39,167 |
| Average | 221 (100.0%) | $55,724 |
Occupancy by Householder Income Bracket in Zia Pueblo
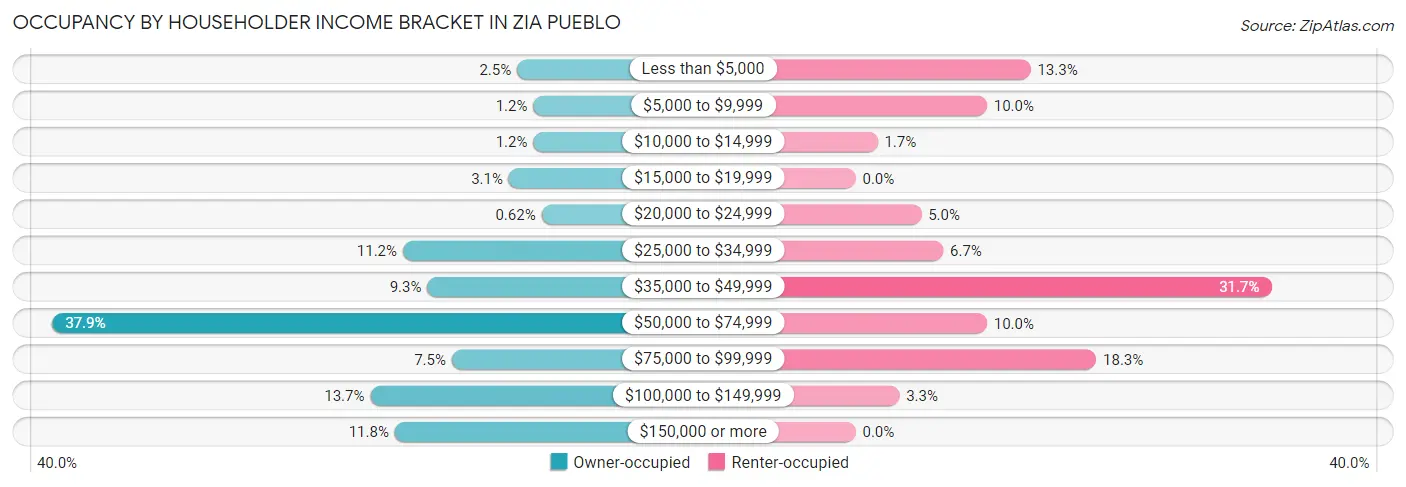
| Income Bracket | Owner-occupied | Renter-occupied |
| Less than $5,000 | 4 (2.5%) | 8 (13.3%) |
| $5,000 to $9,999 | 2 (1.2%) | 6 (10.0%) |
| $10,000 to $14,999 | 2 (1.2%) | 1 (1.7%) |
| $15,000 to $19,999 | 5 (3.1%) | 0 (0.0%) |
| $20,000 to $24,999 | 1 (0.6%) | 3 (5.0%) |
| $25,000 to $34,999 | 18 (11.2%) | 4 (6.7%) |
| $35,000 to $49,999 | 15 (9.3%) | 19 (31.7%) |
| $50,000 to $74,999 | 61 (37.9%) | 6 (10.0%) |
| $75,000 to $99,999 | 12 (7.4%) | 11 (18.3%) |
| $100,000 to $149,999 | 22 (13.7%) | 2 (3.3%) |
| $150,000 or more | 19 (11.8%) | 0 (0.0%) |
| Total | 161 (100.0%) | 60 (100.0%) |
Monthly Housing Cost Tiers in Zia Pueblo
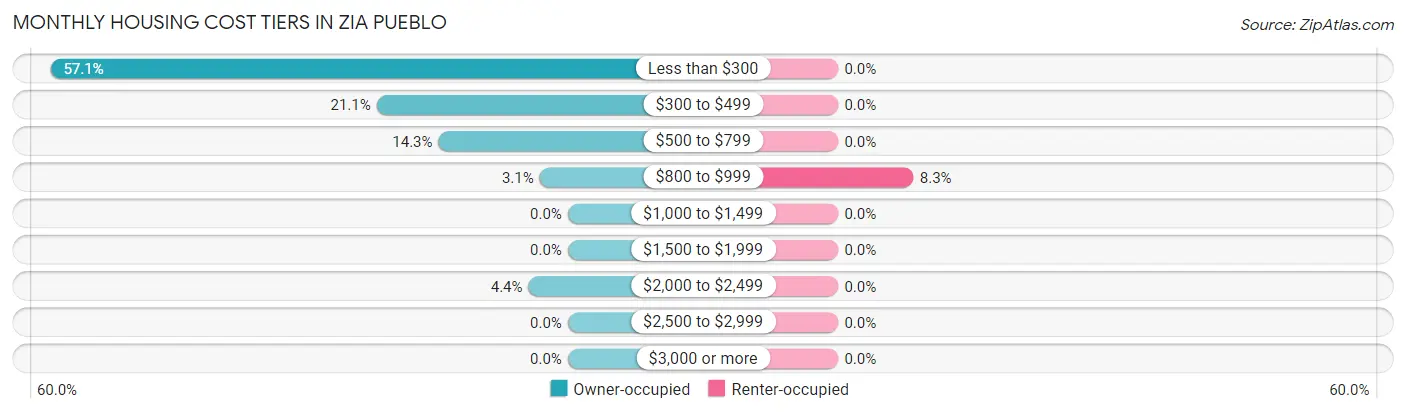
| Monthly Cost | Owner-occupied | Renter-occupied |
| Less than $300 | 92 (57.1%) | 0 (0.0%) |
| $300 to $499 | 34 (21.1%) | 0 (0.0%) |
| $500 to $799 | 23 (14.3%) | 0 (0.0%) |
| $800 to $999 | 5 (3.1%) | 5 (8.3%) |
| $1,000 to $1,499 | 0 (0.0%) | 0 (0.0%) |
| $1,500 to $1,999 | 0 (0.0%) | 0 (0.0%) |
| $2,000 to $2,499 | 7 (4.3%) | 0 (0.0%) |
| $2,500 to $2,999 | 0 (0.0%) | 0 (0.0%) |
| $3,000 or more | 0 (0.0%) | 0 (0.0%) |
| Total | 161 (100.0%) | 60 (100.0%) |
Physical Housing Characteristics in Zia Pueblo
Housing Structures in Zia Pueblo
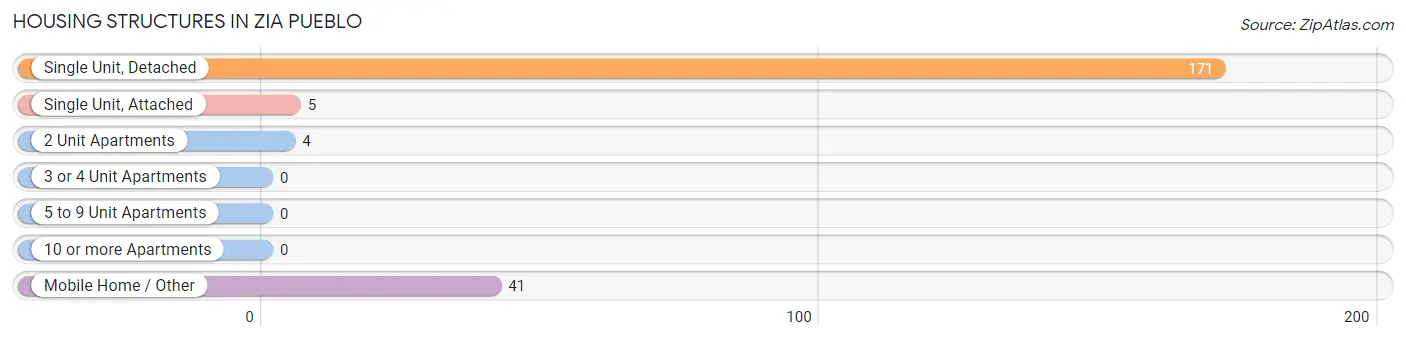
| Structure Type | # Housing Units | % Housing Units |
| Single Unit, Detached | 171 | 77.4% |
| Single Unit, Attached | 5 | 2.3% |
| 2 Unit Apartments | 4 | 1.8% |
| 3 or 4 Unit Apartments | 0 | 0.0% |
| 5 to 9 Unit Apartments | 0 | 0.0% |
| 10 or more Apartments | 0 | 0.0% |
| Mobile Home / Other | 41 | 18.5% |
| Total | 221 | 100.0% |
Housing Structures by Occupancy in Zia Pueblo
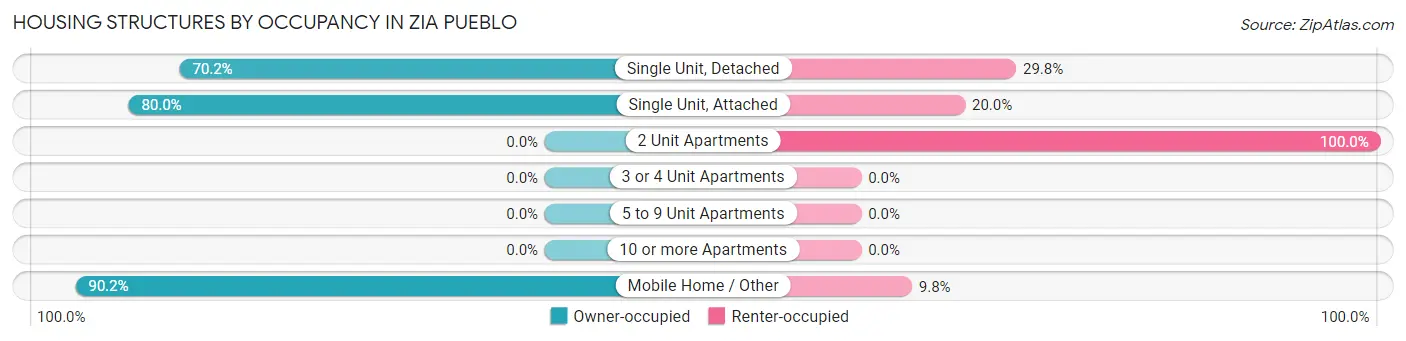
| Structure Type | Owner-occupied | Renter-occupied |
| Single Unit, Detached | 120 (70.2%) | 51 (29.8%) |
| Single Unit, Attached | 4 (80.0%) | 1 (20.0%) |
| 2 Unit Apartments | 0 (0.0%) | 4 (100.0%) |
| 3 or 4 Unit Apartments | 0 (0.0%) | 0 (0.0%) |
| 5 to 9 Unit Apartments | 0 (0.0%) | 0 (0.0%) |
| 10 or more Apartments | 0 (0.0%) | 0 (0.0%) |
| Mobile Home / Other | 37 (90.2%) | 4 (9.8%) |
| Total | 161 (72.9%) | 60 (27.2%) |
Housing Structures by Number of Rooms in Zia Pueblo
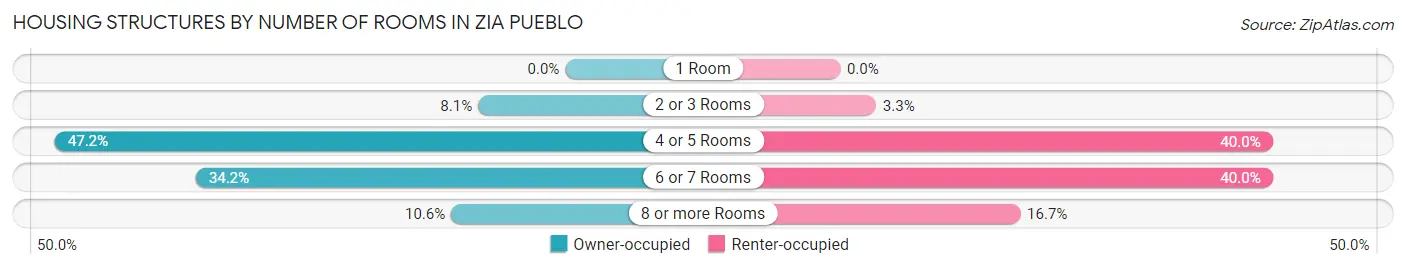
| Number of Rooms | Owner-occupied | Renter-occupied |
| 1 Room | 0 (0.0%) | 0 (0.0%) |
| 2 or 3 Rooms | 13 (8.1%) | 2 (3.3%) |
| 4 or 5 Rooms | 76 (47.2%) | 24 (40.0%) |
| 6 or 7 Rooms | 55 (34.2%) | 24 (40.0%) |
| 8 or more Rooms | 17 (10.6%) | 10 (16.7%) |
| Total | 161 (100.0%) | 60 (100.0%) |
Housing Structure by Heating Type in Zia Pueblo
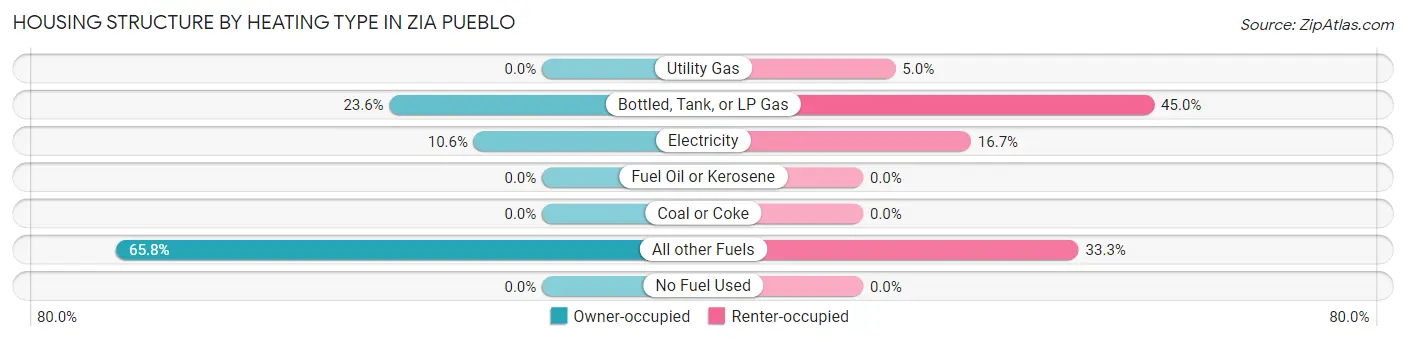
| Heating Type | Owner-occupied | Renter-occupied |
| Utility Gas | 0 (0.0%) | 3 (5.0%) |
| Bottled, Tank, or LP Gas | 38 (23.6%) | 27 (45.0%) |
| Electricity | 17 (10.6%) | 10 (16.7%) |
| Fuel Oil or Kerosene | 0 (0.0%) | 0 (0.0%) |
| Coal or Coke | 0 (0.0%) | 0 (0.0%) |
| All other Fuels | 106 (65.8%) | 20 (33.3%) |
| No Fuel Used | 0 (0.0%) | 0 (0.0%) |
| Total | 161 (100.0%) | 60 (100.0%) |
Household Vehicle Usage in Zia Pueblo
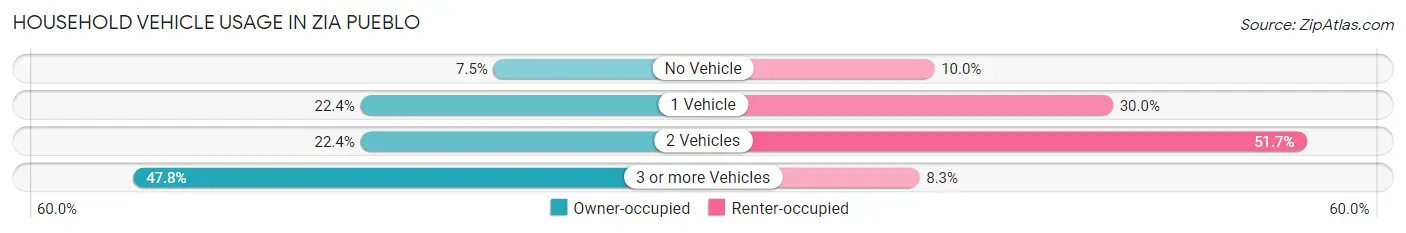
| Vehicles per Household | Owner-occupied | Renter-occupied |
| No Vehicle | 12 (7.4%) | 6 (10.0%) |
| 1 Vehicle | 36 (22.4%) | 18 (30.0%) |
| 2 Vehicles | 36 (22.4%) | 31 (51.7%) |
| 3 or more Vehicles | 77 (47.8%) | 5 (8.3%) |
| Total | 161 (100.0%) | 60 (100.0%) |
Real Estate & Mortgages in Zia Pueblo
Real Estate and Mortgage Overview in Zia Pueblo
| Characteristic | Without Mortgage | With Mortgage |
| Housing Units | 139 | 22 |
| Median Property Value | - | - |
| Median Household Income | $57,171 | $4 |
| Monthly Housing Costs | $220 | $0 |
| Real Estate Taxes | $892 | $17 |
Property Value by Mortgage Status in Zia Pueblo
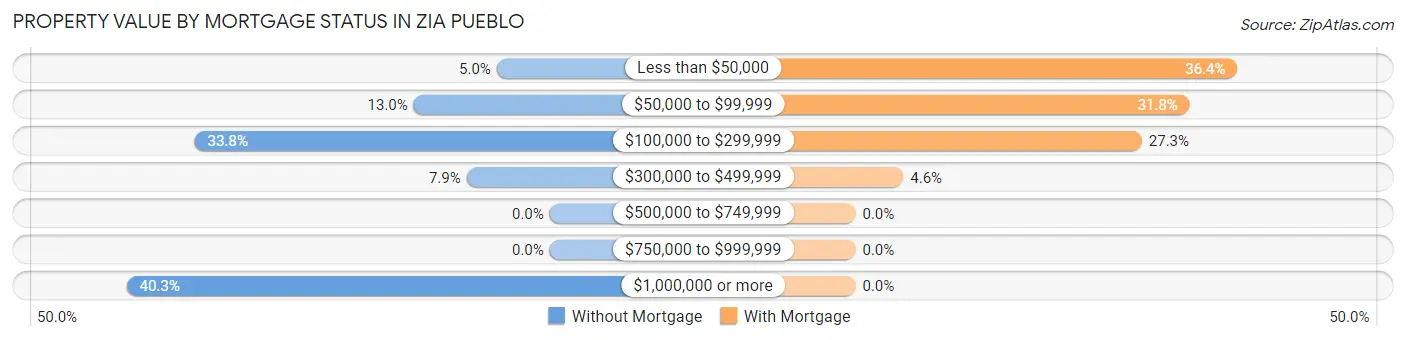
| Property Value | Without Mortgage | With Mortgage |
| Less than $50,000 | 7 (5.0%) | 8 (36.4%) |
| $50,000 to $99,999 | 18 (13.0%) | 7 (31.8%) |
| $100,000 to $299,999 | 47 (33.8%) | 6 (27.3%) |
| $300,000 to $499,999 | 11 (7.9%) | 1 (4.5%) |
| $500,000 to $749,999 | 0 (0.0%) | 0 (0.0%) |
| $750,000 to $999,999 | 0 (0.0%) | 0 (0.0%) |
| $1,000,000 or more | 56 (40.3%) | 0 (0.0%) |
| Total | 139 (100.0%) | 22 (100.0%) |
Household Income by Mortgage Status in Zia Pueblo
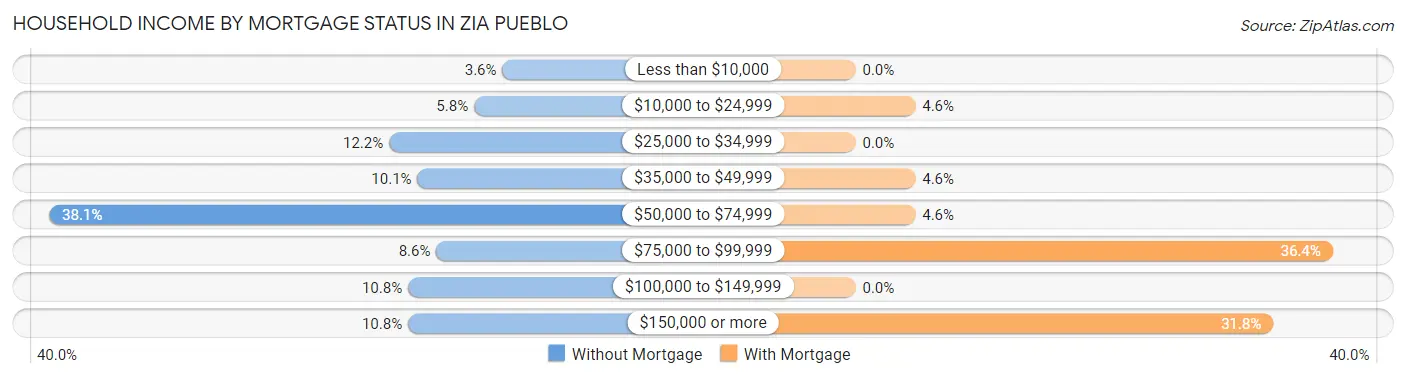
| Household Income | Without Mortgage | With Mortgage |
| Less than $10,000 | 5 (3.6%) | 0 (0.0%) |
| $10,000 to $24,999 | 8 (5.8%) | 1 (4.5%) |
| $25,000 to $34,999 | 17 (12.2%) | 0 (0.0%) |
| $35,000 to $49,999 | 14 (10.1%) | 1 (4.5%) |
| $50,000 to $74,999 | 53 (38.1%) | 1 (4.5%) |
| $75,000 to $99,999 | 12 (8.6%) | 8 (36.4%) |
| $100,000 to $149,999 | 15 (10.8%) | 0 (0.0%) |
| $150,000 or more | 15 (10.8%) | 7 (31.8%) |
| Total | 139 (100.0%) | 22 (100.0%) |
Property Value to Household Income Ratio in Zia Pueblo
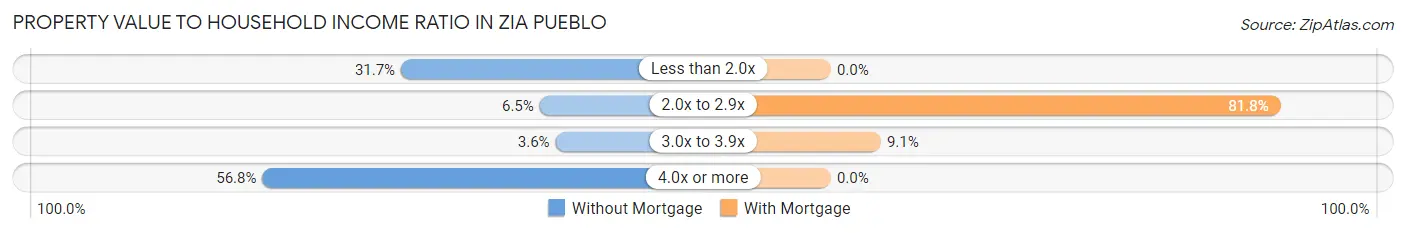
| Value-to-Income Ratio | Without Mortgage | With Mortgage |
| Less than 2.0x | 44 (31.7%) | 0 (0.0%) |
| 2.0x to 2.9x | 9 (6.5%) | 18 (81.8%) |
| 3.0x to 3.9x | 5 (3.6%) | 2 (9.1%) |
| 4.0x or more | 79 (56.8%) | 0 (0.0%) |
| Total | 139 (100.0%) | 22 (100.0%) |
Real Estate Taxes by Mortgage Status in Zia Pueblo
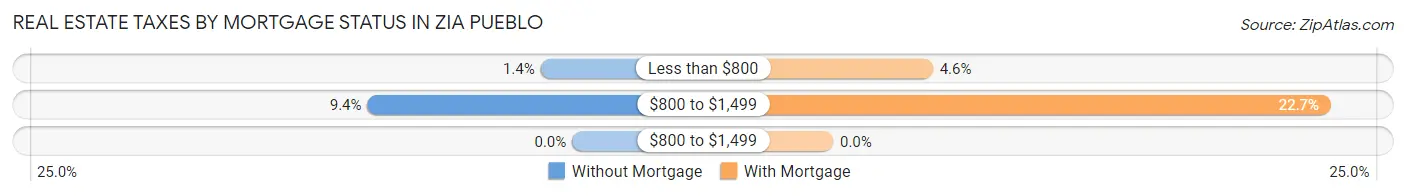
| Property Taxes | Without Mortgage | With Mortgage |
| Less than $800 | 2 (1.4%) | 1 (4.5%) |
| $800 to $1,499 | 13 (9.3%) | 5 (22.7%) |
| $800 to $1,499 | 0 (0.0%) | 0 (0.0%) |
| Total | 139 (100.0%) | 22 (100.0%) |
Health & Disability in Zia Pueblo
Health Insurance Coverage by Age in Zia Pueblo
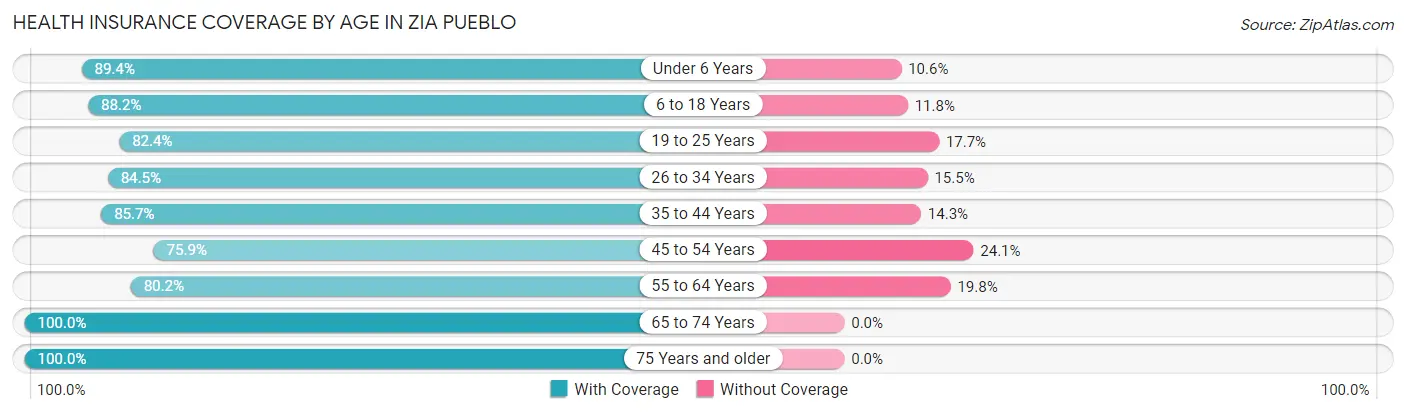
| Age Bracket | With Coverage | Without Coverage |
| Under 6 Years | 101 (89.4%) | 12 (10.6%) |
| 6 to 18 Years | 164 (88.2%) | 22 (11.8%) |
| 19 to 25 Years | 70 (82.4%) | 15 (17.6%) |
| 26 to 34 Years | 158 (84.5%) | 29 (15.5%) |
| 35 to 44 Years | 60 (85.7%) | 10 (14.3%) |
| 45 to 54 Years | 82 (75.9%) | 26 (24.1%) |
| 55 to 64 Years | 81 (80.2%) | 20 (19.8%) |
| 65 to 74 Years | 24 (100.0%) | 0 (0.0%) |
| 75 Years and older | 25 (100.0%) | 0 (0.0%) |
| Total | 765 (85.1%) | 134 (14.9%) |
Health Insurance Coverage by Citizenship Status in Zia Pueblo
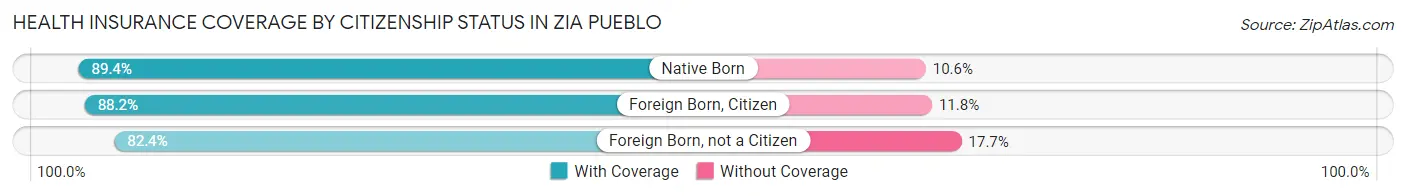
| Citizenship Status | With Coverage | Without Coverage |
| Native Born | 101 (89.4%) | 12 (10.6%) |
| Foreign Born, Citizen | 164 (88.2%) | 22 (11.8%) |
| Foreign Born, not a Citizen | 70 (82.4%) | 15 (17.6%) |
Health Insurance Coverage by Household Income in Zia Pueblo
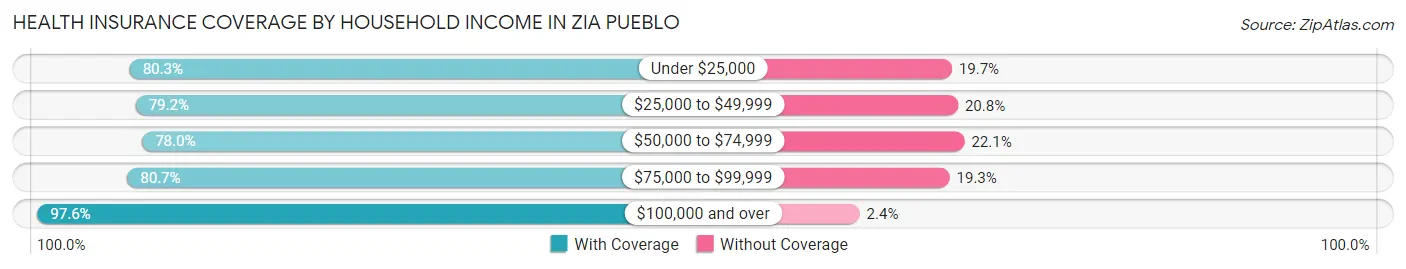
| Household Income | With Coverage | Without Coverage |
| Under $25,000 | 53 (80.3%) | 13 (19.7%) |
| $25,000 to $49,999 | 114 (79.2%) | 30 (20.8%) |
| $50,000 to $74,999 | 205 (77.9%) | 58 (22.1%) |
| $75,000 to $99,999 | 109 (80.7%) | 26 (19.3%) |
| $100,000 and over | 284 (97.6%) | 7 (2.4%) |
Public vs Private Health Insurance Coverage by Age in Zia Pueblo
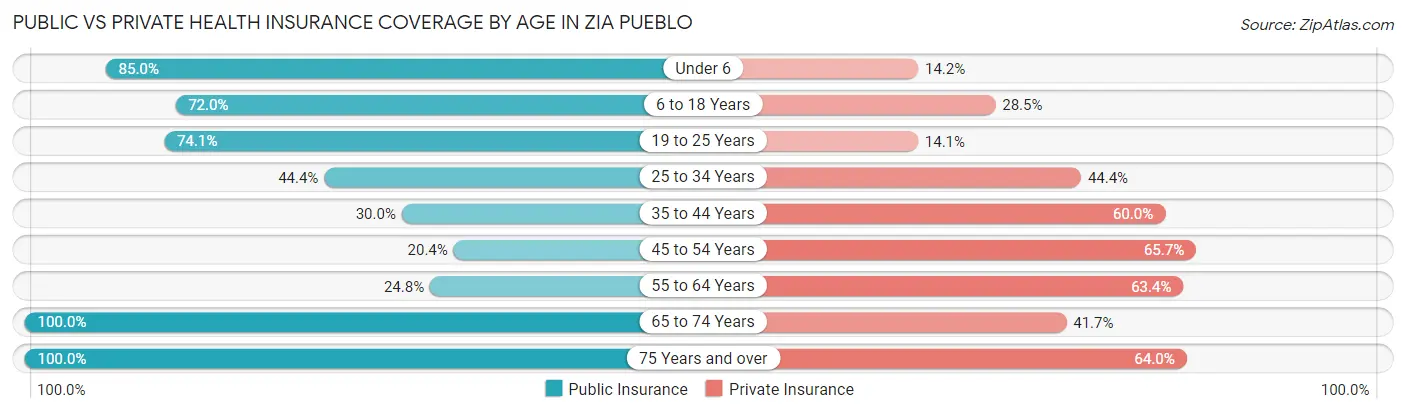
| Age Bracket | Public Insurance | Private Insurance |
| Under 6 | 96 (85.0%) | 16 (14.2%) |
| 6 to 18 Years | 134 (72.0%) | 53 (28.5%) |
| 19 to 25 Years | 63 (74.1%) | 12 (14.1%) |
| 25 to 34 Years | 83 (44.4%) | 83 (44.4%) |
| 35 to 44 Years | 21 (30.0%) | 42 (60.0%) |
| 45 to 54 Years | 22 (20.4%) | 71 (65.7%) |
| 55 to 64 Years | 25 (24.7%) | 64 (63.4%) |
| 65 to 74 Years | 24 (100.0%) | 10 (41.7%) |
| 75 Years and over | 25 (100.0%) | 16 (64.0%) |
| Total | 493 (54.8%) | 367 (40.8%) |
Disability Status by Sex by Age in Zia Pueblo
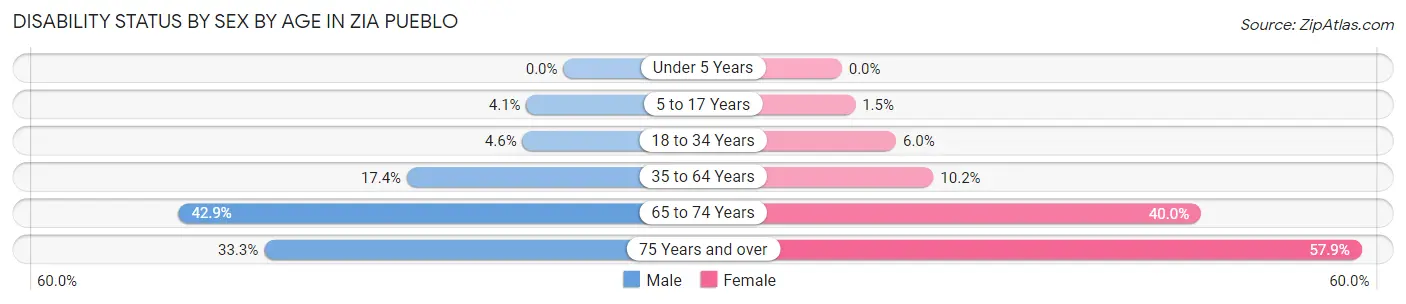
| Age Bracket | Male | Female |
| Under 5 Years | 0 (0.0%) | 0 (0.0%) |
| 5 to 17 Years | 3 (4.1%) | 2 (1.5%) |
| 18 to 34 Years | 6 (4.5%) | 9 (6.0%) |
| 35 to 64 Years | 23 (17.4%) | 15 (10.2%) |
| 65 to 74 Years | 6 (42.9%) | 4 (40.0%) |
| 75 Years and over | 2 (33.3%) | 11 (57.9%) |
Disability Class by Sex by Age in Zia Pueblo
Disability Class: Hearing Difficulty
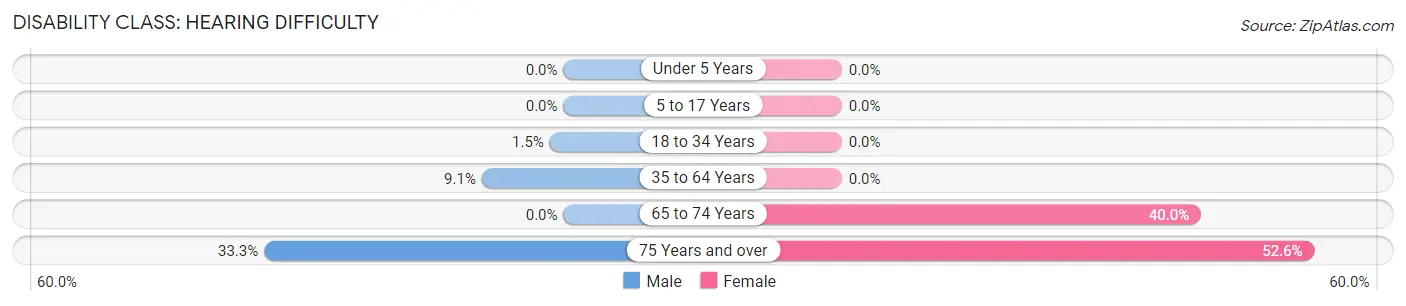
| Age Bracket | Male | Female |
| Under 5 Years | 0 (0.0%) | 0 (0.0%) |
| 5 to 17 Years | 0 (0.0%) | 0 (0.0%) |
| 18 to 34 Years | 2 (1.5%) | 0 (0.0%) |
| 35 to 64 Years | 12 (9.1%) | 0 (0.0%) |
| 65 to 74 Years | 0 (0.0%) | 4 (40.0%) |
| 75 Years and over | 2 (33.3%) | 10 (52.6%) |
Disability Class: Vision Difficulty
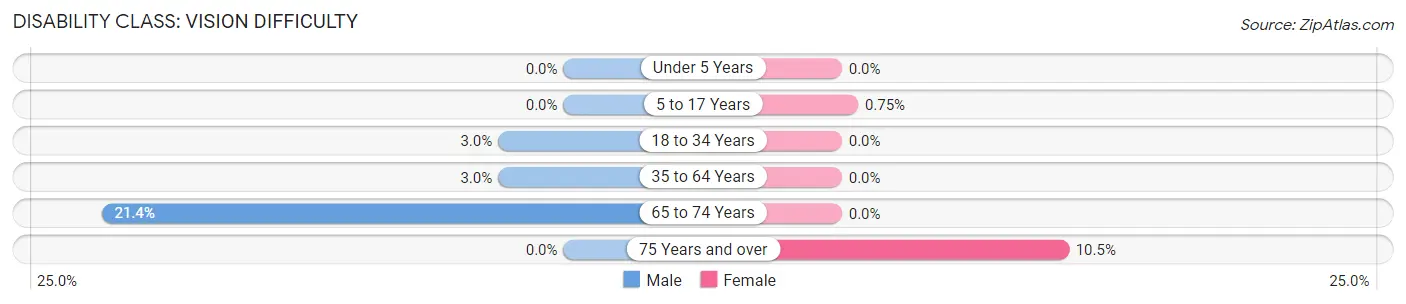
| Age Bracket | Male | Female |
| Under 5 Years | 0 (0.0%) | 0 (0.0%) |
| 5 to 17 Years | 0 (0.0%) | 1 (0.7%) |
| 18 to 34 Years | 4 (3.0%) | 0 (0.0%) |
| 35 to 64 Years | 4 (3.0%) | 0 (0.0%) |
| 65 to 74 Years | 3 (21.4%) | 0 (0.0%) |
| 75 Years and over | 0 (0.0%) | 2 (10.5%) |
Disability Class: Cognitive Difficulty
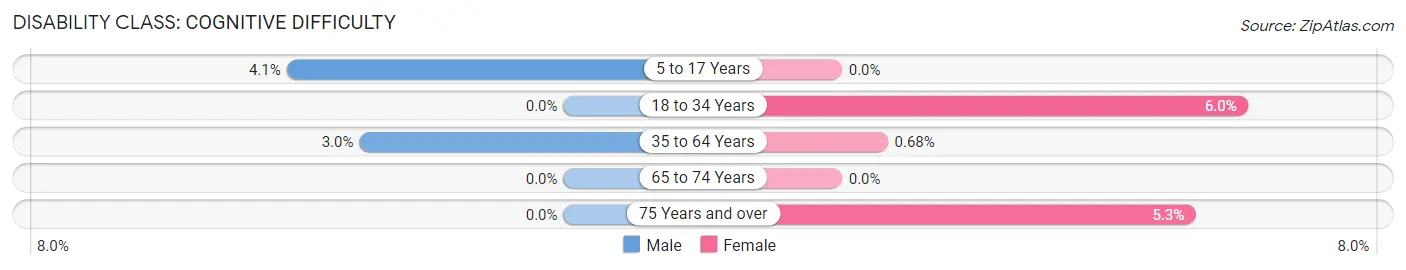
| Age Bracket | Male | Female |
| 5 to 17 Years | 3 (4.1%) | 0 (0.0%) |
| 18 to 34 Years | 0 (0.0%) | 9 (6.0%) |
| 35 to 64 Years | 4 (3.0%) | 1 (0.7%) |
| 65 to 74 Years | 0 (0.0%) | 0 (0.0%) |
| 75 Years and over | 0 (0.0%) | 1 (5.3%) |
Disability Class: Ambulatory Difficulty
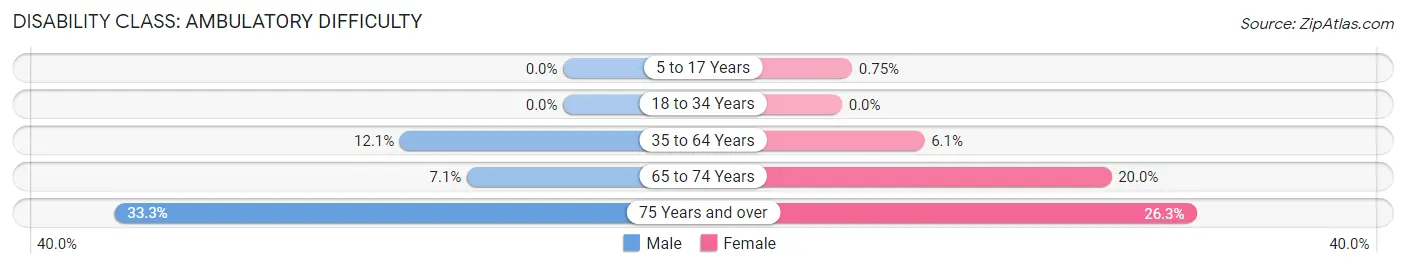
| Age Bracket | Male | Female |
| 5 to 17 Years | 0 (0.0%) | 1 (0.7%) |
| 18 to 34 Years | 0 (0.0%) | 0 (0.0%) |
| 35 to 64 Years | 16 (12.1%) | 9 (6.1%) |
| 65 to 74 Years | 1 (7.1%) | 2 (20.0%) |
| 75 Years and over | 2 (33.3%) | 5 (26.3%) |
Disability Class: Self-Care Difficulty
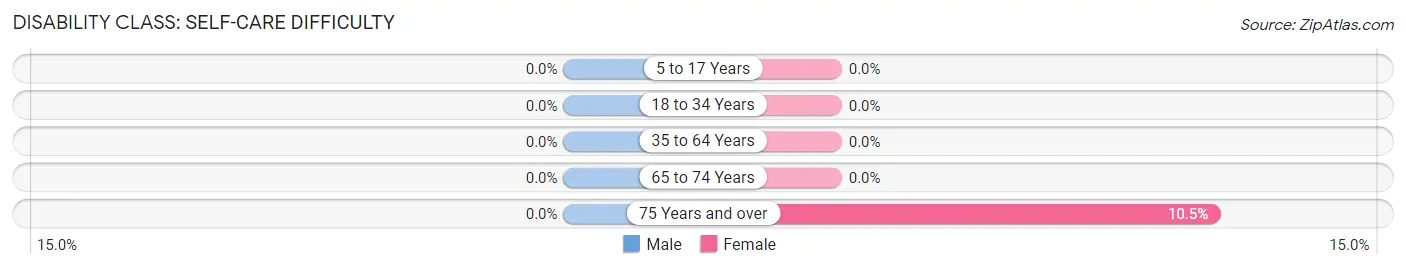
| Age Bracket | Male | Female |
| 5 to 17 Years | 0 (0.0%) | 0 (0.0%) |
| 18 to 34 Years | 0 (0.0%) | 0 (0.0%) |
| 35 to 64 Years | 0 (0.0%) | 0 (0.0%) |
| 65 to 74 Years | 0 (0.0%) | 0 (0.0%) |
| 75 Years and over | 0 (0.0%) | 2 (10.5%) |
Technology Access in Zia Pueblo
Computing Device Access in Zia Pueblo
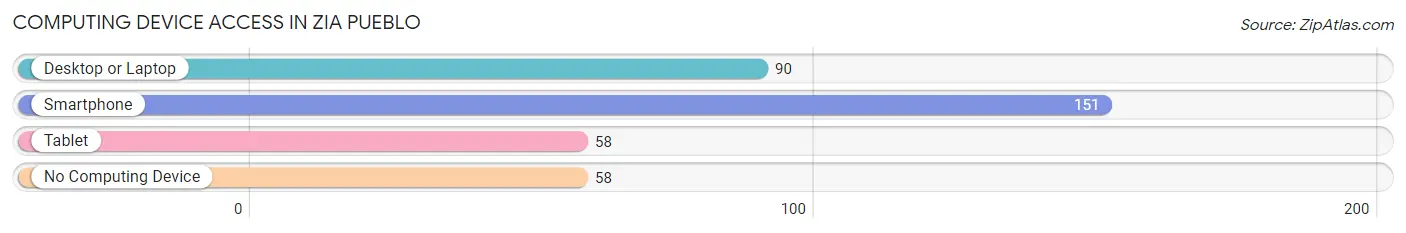
| Device Type | # Households | % Households |
| Desktop or Laptop | 90 | 40.7% |
| Smartphone | 151 | 68.3% |
| Tablet | 58 | 26.2% |
| No Computing Device | 58 | 26.2% |
| Total | 221 | 100.0% |
Internet Access in Zia Pueblo
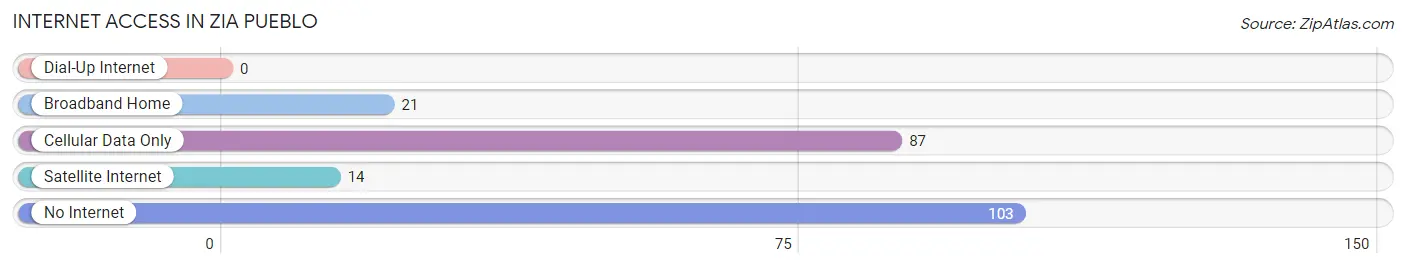
| Internet Type | # Households | % Households |
| Dial-Up Internet | 0 | 0.0% |
| Broadband Home | 21 | 9.5% |
| Cellular Data Only | 87 | 39.4% |
| Satellite Internet | 14 | 6.3% |
| No Internet | 103 | 46.6% |
| Total | 221 | 100.0% |
Zia Pueblo Summary
Zia Pueblo is a Native American Pueblo located in Sandoval County, New Mexico. It is one of 19 Pueblos in the state and is home to the Zia people, a tribe of the Pueblo Indians. The Zia Pueblo is located approximately 25 miles northwest of Albuquerque and is situated on the eastern slopes of the Jemez Mountains. The Pueblo is home to approximately 1,500 people, most of whom are members of the Zia tribe.
Geography
Zia Pueblo is located in the Rio Grande Valley, at an elevation of 5,500 feet. The Pueblo is surrounded by the Jemez Mountains to the west and the Sangre de Cristo Mountains to the east. The Rio Grande River runs through the Pueblo, providing a source of water for the Zia people. The climate in the area is semi-arid, with hot summers and cold winters.
History
The Zia people have lived in the area for centuries, and the Pueblo was established in the late 1600s. The Zia people were part of the Tiwa language group, which also included the Taos, Picuris, and Jemez Pueblos. The Zia people were known for their pottery and basketry, which were traded throughout the region.
In the late 1700s, the Spanish arrived in the area and established a mission at Zia Pueblo. The mission was destroyed in 1821, when Mexico gained independence from Spain. In 1848, the United States acquired the area as part of the Treaty of Guadalupe Hidalgo.
In the late 1800s, the Zia people faced increasing pressure from the United States government to assimilate into American culture. In 1876, the Zia people were forced to move to a reservation in the Jemez Mountains. In 1882, the Zia people were allowed to return to their original land, and the Pueblo was re-established.
Economy
The economy of Zia Pueblo is largely based on agriculture and tourism. The Zia people grow corn, beans, squash, and other crops on their land. They also raise livestock, including sheep, goats, and cattle. The Zia people also produce traditional pottery and basketry, which are sold to tourists.
The Zia people also receive income from the sale of natural resources, such as timber and minerals. The Zia people also receive income from the sale of oil and gas leases on their land.
Demographics
As of the 2010 census, the population of Zia Pueblo was 1,479. The population is predominantly Native American, with 97.3% of the population identifying as American Indian or Alaska Native. The median age of the population is 33.7 years, and the median household income is $25,000.
The Zia people are predominantly Roman Catholic, and the Pueblo is home to several churches. The Zia people also practice traditional ceremonies and rituals, such as the Corn Dance and the Deer Dance.
Conclusion
Zia Pueblo is a Native American Pueblo located in Sandoval County, New Mexico. It is home to the Zia people, a tribe of the Pueblo Indians. The Zia people have lived in the area for centuries, and the Pueblo was established in the late 1600s. The economy of Zia Pueblo is largely based on agriculture and tourism, and the population is predominantly Native American. The Zia people practice traditional ceremonies and rituals, and the Pueblo is home to several churches.
Common Questions
What is Per Capita Income in Zia Pueblo?
Per Capita income in Zia Pueblo is $19,651.
What is the Median Family Income in Zia Pueblo?
Median Family Income in Zia Pueblo is $54,297.
What is the Median Household income in Zia Pueblo?
Median Household Income in Zia Pueblo is $55,724.
What is Income or Wage Gap in Zia Pueblo?
Income or Wage Gap in Zia Pueblo is 52.4%.
Women in Zia Pueblo earn 47.6 cents for every dollar earned by a man.
What is Inequality or Gini Index in Zia Pueblo?
Inequality or Gini Index in Zia Pueblo is 0.43.
What is the Total Population of Zia Pueblo?
Total Population of Zia Pueblo is 899.
What is the Total Male Population of Zia Pueblo?
Total Male Population of Zia Pueblo is 396.
What is the Total Female Population of Zia Pueblo?
Total Female Population of Zia Pueblo is 503.
What is the Ratio of Males per 100 Females in Zia Pueblo?
There are 78.73 Males per 100 Females in Zia Pueblo.
What is the Ratio of Females per 100 Males in Zia Pueblo?
There are 127.02 Females per 100 Males in Zia Pueblo.
What is the Median Population Age in Zia Pueblo?
Median Population Age in Zia Pueblo is 29.8 Years.
What is the Average Family Size in Zia Pueblo
Average Family Size in Zia Pueblo is 4.8 People.
What is the Average Household Size in Zia Pueblo
Average Household Size in Zia Pueblo is 4.1 People.
How Large is the Labor Force in Zia Pueblo?
There are 441 People in the Labor Forcein in Zia Pueblo.
What is the Percentage of People in the Labor Force in Zia Pueblo?
68.0% of People are in the Labor Force in Zia Pueblo.
What is the Unemployment Rate in Zia Pueblo?
Unemployment Rate in Zia Pueblo is 10.0%.