Skyline Ganipa, NM Map & Demographics
Skyline Ganipa Map
Skyline Ganipa Overview
$26,100
PER CAPITA INCOME
$63,259
AVG FAMILY INCOME
$62,895
AVG HOUSEHOLD INCOME
15.2%
WAGE / INCOME GAP [ % ]
84.8¢/ $1
WAGE / INCOME GAP [ $ ]
0.46
INEQUALITY / GINI INDEX
1,132
TOTAL POPULATION
543
MALE POPULATION
589
FEMALE POPULATION
92.19
MALES / 100 FEMALES
108.47
FEMALES / 100 MALES
39.3
MEDIAN AGE
4.7
AVG FAMILY SIZE
4.3
AVG HOUSEHOLD SIZE
475
LABOR FORCE [ PEOPLE ]
56.3%
PERCENT IN LABOR FORCE
5.3%
UNEMPLOYMENT RATE
Income in Skyline Ganipa
Income Overview in Skyline Ganipa
Per Capita Income in Skyline Ganipa is $26,100, while median incomes of families and households are $63,259 and $62,895 respectively.
| Characteristic | Number | Measure |
| Per Capita Income | 1,132 | $26,100 |
| Median Family Income | 229 | $63,259 |
| Mean Family Income | 229 | $86,181 |
| Median Household Income | 266 | $62,895 |
| Mean Household Income | 266 | $81,586 |
| Income Deficit | 229 | $0 |
| Wage / Income Gap (%) | 1,132 | 15.18% |
| Wage / Income Gap ($) | 1,132 | 84.82¢ per $1 |
| Gini / Inequality Index | 1,132 | 0.46 |
Earnings by Sex in Skyline Ganipa
Average Earnings in Skyline Ganipa are $25,114, $22,266 for men and $26,250 for women, a difference of 15.2%.
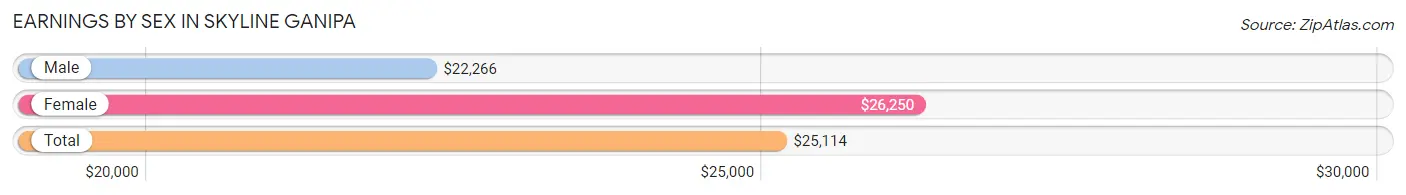
| Sex | Number | Average Earnings |
| Male | 236 (44.7%) | $22,266 |
| Female | 292 (55.3%) | $26,250 |
| Total | 528 (100.0%) | $25,114 |
Earnings by Sex by Income Bracket in Skyline Ganipa
The most common earnings brackets in Skyline Ganipa are $2,499 or less for men (62 | 26.3%) and $22,500 to $24,999 for women (48 | 16.4%).
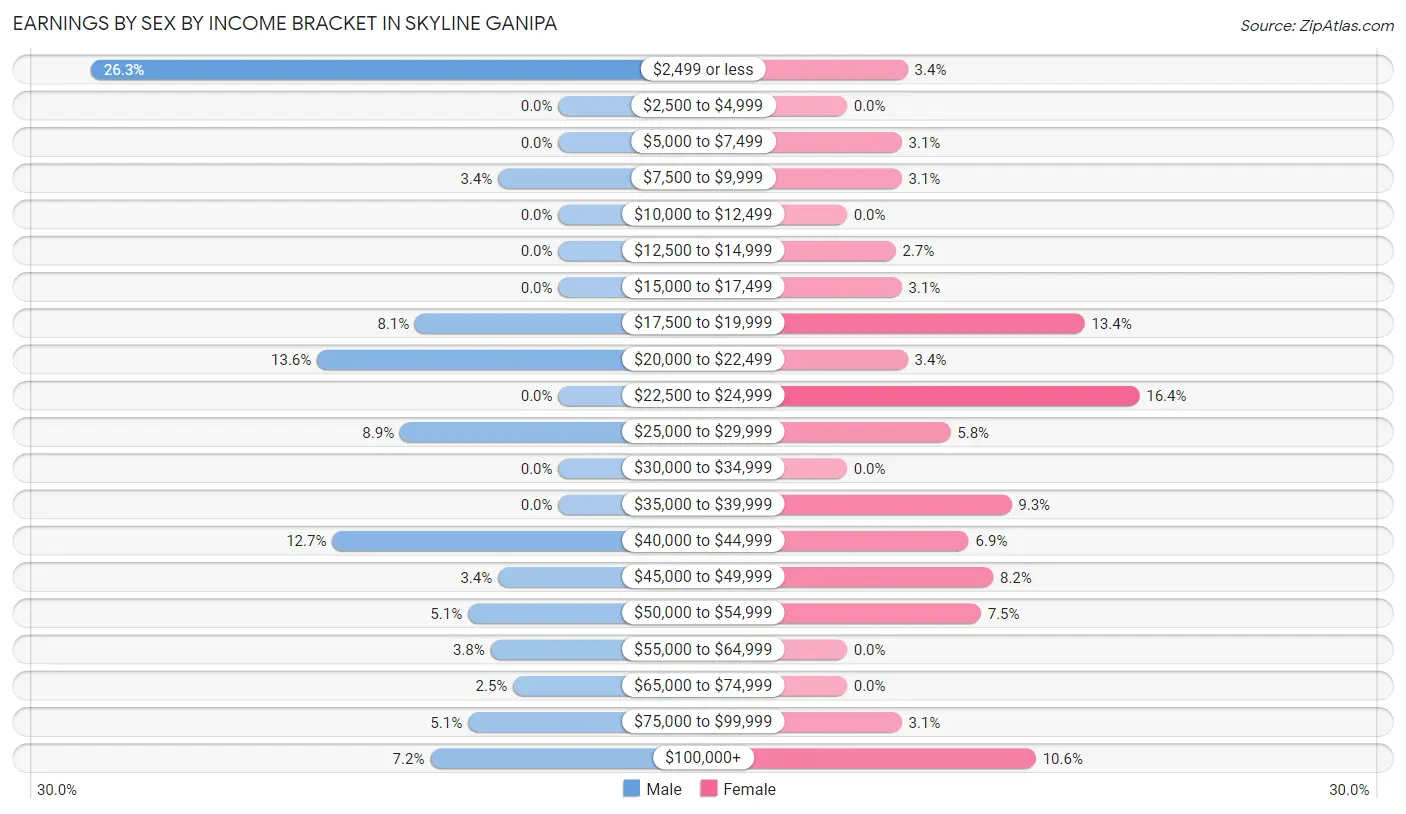
| Income | Male | Female |
| $2,499 or less | 62 (26.3%) | 10 (3.4%) |
| $2,500 to $4,999 | 0 (0.0%) | 0 (0.0%) |
| $5,000 to $7,499 | 0 (0.0%) | 9 (3.1%) |
| $7,500 to $9,999 | 8 (3.4%) | 9 (3.1%) |
| $10,000 to $12,499 | 0 (0.0%) | 0 (0.0%) |
| $12,500 to $14,999 | 0 (0.0%) | 8 (2.7%) |
| $15,000 to $17,499 | 0 (0.0%) | 9 (3.1%) |
| $17,500 to $19,999 | 19 (8.1%) | 39 (13.4%) |
| $20,000 to $22,499 | 32 (13.6%) | 10 (3.4%) |
| $22,500 to $24,999 | 0 (0.0%) | 48 (16.4%) |
| $25,000 to $29,999 | 21 (8.9%) | 17 (5.8%) |
| $30,000 to $34,999 | 0 (0.0%) | 0 (0.0%) |
| $35,000 to $39,999 | 0 (0.0%) | 27 (9.2%) |
| $40,000 to $44,999 | 30 (12.7%) | 20 (6.9%) |
| $45,000 to $49,999 | 8 (3.4%) | 24 (8.2%) |
| $50,000 to $54,999 | 12 (5.1%) | 22 (7.5%) |
| $55,000 to $64,999 | 9 (3.8%) | 0 (0.0%) |
| $65,000 to $74,999 | 6 (2.5%) | 0 (0.0%) |
| $75,000 to $99,999 | 12 (5.1%) | 9 (3.1%) |
| $100,000+ | 17 (7.2%) | 31 (10.6%) |
| Total | 236 (100.0%) | 292 (100.0%) |
Earnings by Sex by Educational Attainment in Skyline Ganipa
Average earnings in Skyline Ganipa are $21,172 for men and $35,417 for women, a difference of 40.2%. Men with an educational attainment of high school diploma enjoy the highest average annual earnings of $21,563, while those with college or associate's degree education earn the least with $2,499. Women with an educational attainment of college or associate's degree earn the most with the average annual earnings of $37,315, while those with college or associate's degree education have the smallest earnings of $37,315.
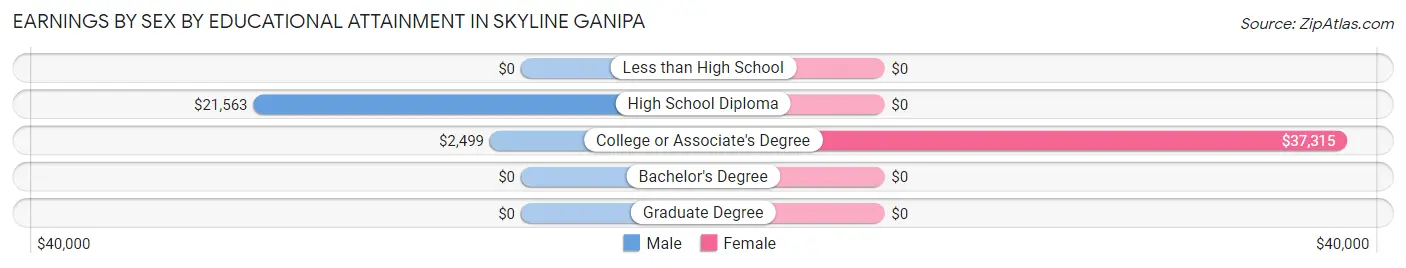
| Educational Attainment | Male Income | Female Income |
| Less than High School | - | - |
| High School Diploma | $21,563 | $0 |
| College or Associate's Degree | $2,499 | $37,315 |
| Bachelor's Degree | - | - |
| Graduate Degree | - | - |
| Total | $21,172 | $35,417 |
Family Income in Skyline Ganipa
Family Income Brackets in Skyline Ganipa
According to the Skyline Ganipa family income data, there are 75 families falling into the $50,000 to $74,999 income range, which is the most common income bracket and makes up 32.8% of all families. Conversely, the $10,000 to $14,999 income bracket is the least frequent group with only 6 families (2.6%) belonging to this category.
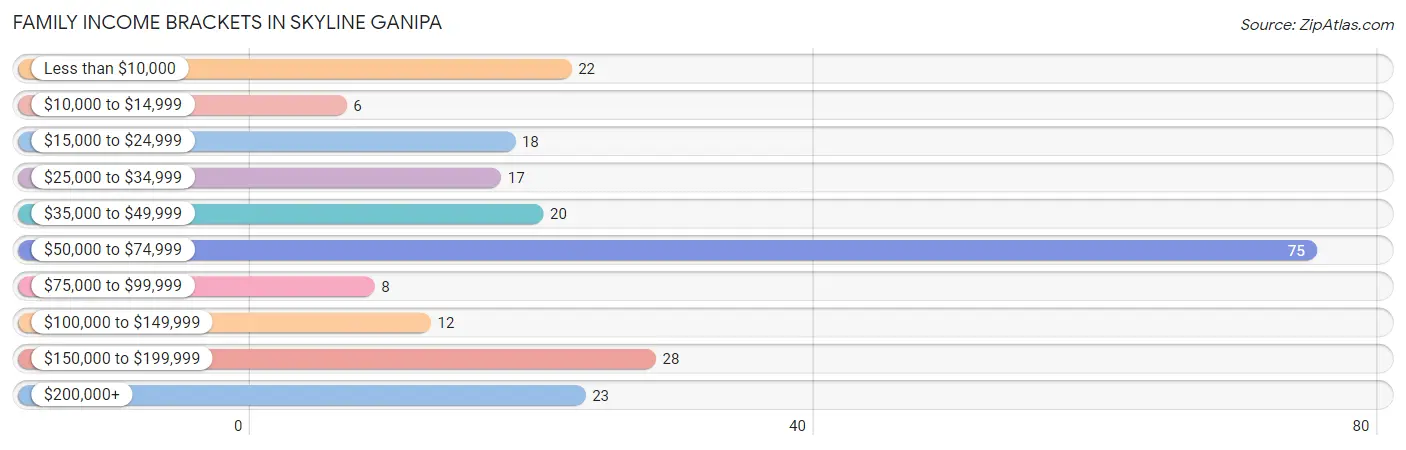
| Income Bracket | # Families | % Families |
| Less than $10,000 | 22 | 9.6% |
| $10,000 to $14,999 | 6 | 2.6% |
| $15,000 to $24,999 | 18 | 7.9% |
| $25,000 to $34,999 | 17 | 7.4% |
| $35,000 to $49,999 | 20 | 8.7% |
| $50,000 to $74,999 | 75 | 32.8% |
| $75,000 to $99,999 | 8 | 3.5% |
| $100,000 to $149,999 | 12 | 5.2% |
| $150,000 to $199,999 | 28 | 12.2% |
| $200,000+ | 23 | 10.0% |
Family Income by Famaliy Size in Skyline Ganipa
3-person families (41 | 17.9%) account for the highest median family income in Skyline Ganipa with $168,906 per family, while 3-person families (41 | 17.9%) have the highest median income of $56,302 per family member.
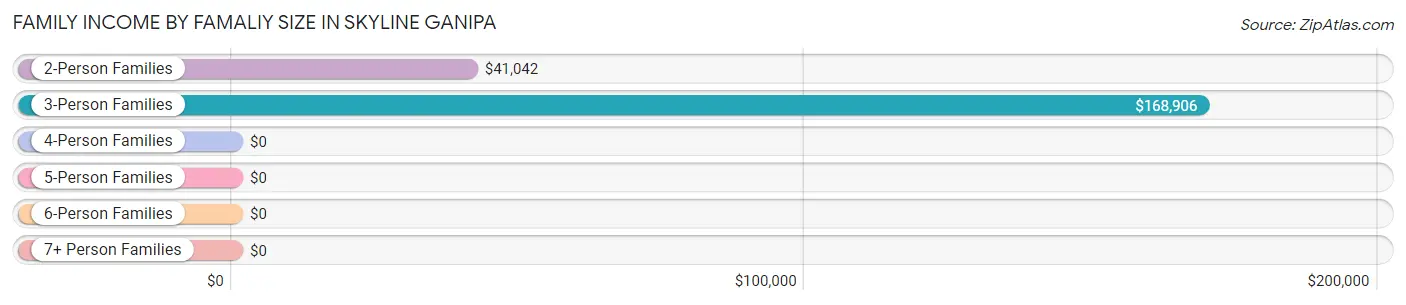
| Income Bracket | # Families | Median Income |
| 2-Person Families | 82 (35.8%) | $41,042 |
| 3-Person Families | 41 (17.9%) | $168,906 |
| 4-Person Families | 41 (17.9%) | $0 |
| 5-Person Families | 42 (18.3%) | $0 |
| 6-Person Families | 5 (2.2%) | $0 |
| 7+ Person Families | 18 (7.9%) | $0 |
| Total | 229 (100.0%) | $63,259 |
Family Income by Number of Earners in Skyline Ganipa
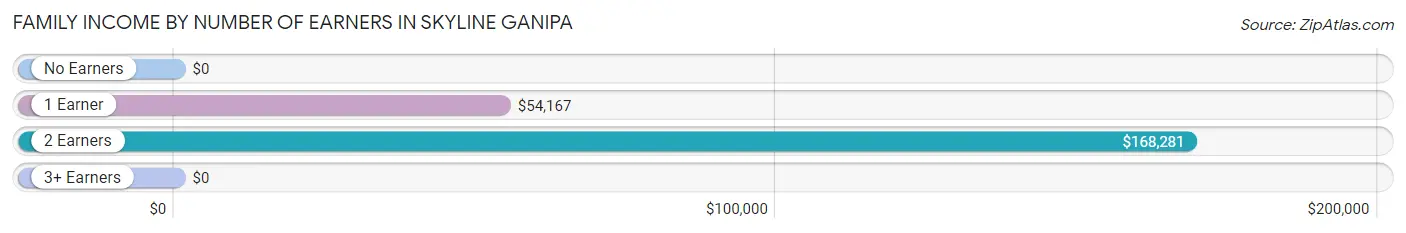
| Number of Earners | # Families | Median Income |
| No Earners | 42 (18.3%) | $0 |
| 1 Earner | 90 (39.3%) | $54,167 |
| 2 Earners | 45 (19.7%) | $168,281 |
| 3+ Earners | 52 (22.7%) | $0 |
| Total | 229 (100.0%) | $63,259 |
Household Income in Skyline Ganipa
Household Income Brackets in Skyline Ganipa
With 100 households falling in the category, the $50,000 to $74,999 income range is the most frequent in Skyline Ganipa, accounting for 37.6% of all households. In contrast, only 6 households (2.3%) fall into the $10,000 to $14,999 income bracket, making it the least populous group.
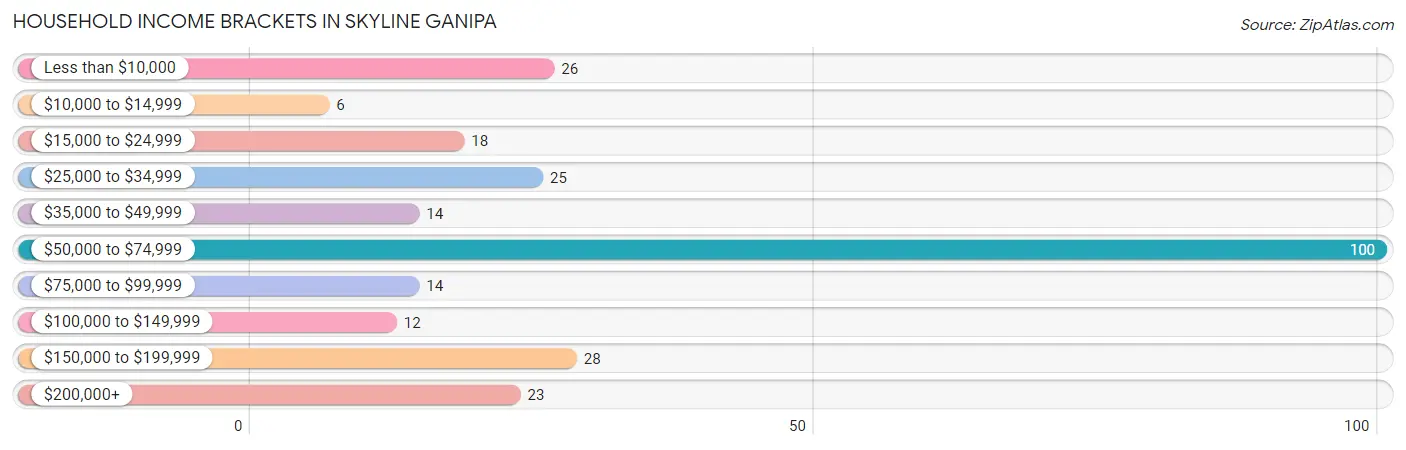
| Income Bracket | # Households | % Households |
| Less than $10,000 | 26 | 9.8% |
| $10,000 to $14,999 | 6 | 2.3% |
| $15,000 to $24,999 | 18 | 6.8% |
| $25,000 to $34,999 | 25 | 9.4% |
| $35,000 to $49,999 | 14 | 5.3% |
| $50,000 to $74,999 | 100 | 37.6% |
| $75,000 to $99,999 | 14 | 5.3% |
| $100,000 to $149,999 | 12 | 4.5% |
| $150,000 to $199,999 | 28 | 10.5% |
| $200,000+ | 23 | 8.6% |
Household Income by Householder Age in Skyline Ganipa
The median household income in Skyline Ganipa is $62,895, with the highest median household income of $64,313 found in the 25 to 44 years age bracket for the primary householder. A total of 39 households (14.7%) fall into this category.

| Income Bracket | # Households | Median Income |
| 15 to 24 Years | 0 (0.0%) | $0 |
| 25 to 44 Years | 39 (14.7%) | $64,313 |
| 45 to 64 Years | 169 (63.5%) | $58,281 |
| 65+ Years | 58 (21.8%) | $59,500 |
| Total | 266 (100.0%) | $62,895 |
Poverty in Skyline Ganipa
Income Below Poverty by Sex and Age in Skyline Ganipa
With 19.0% poverty level for males and 16.3% for females among the residents of Skyline Ganipa, under 5 year old males and 75 year old and over females are the most vulnerable to poverty, with 26 males (100.0%) and 12 females (38.7%) in their respective age groups living below the poverty level.
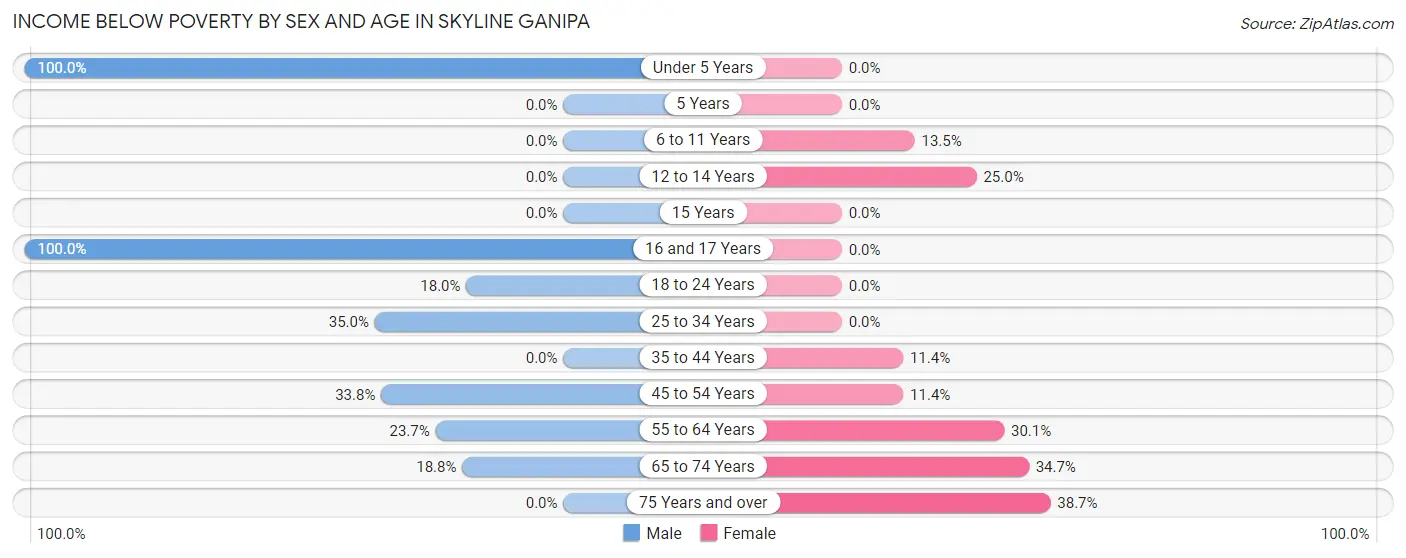
| Age Bracket | Male | Female |
| Under 5 Years | 26 (100.0%) | 0 (0.0%) |
| 5 Years | 0 (0.0%) | 0 (0.0%) |
| 6 to 11 Years | 0 (0.0%) | 10 (13.5%) |
| 12 to 14 Years | 0 (0.0%) | 10 (25.0%) |
| 15 Years | 0 (0.0%) | 0 (0.0%) |
| 16 and 17 Years | 10 (100.0%) | 0 (0.0%) |
| 18 to 24 Years | 9 (18.0%) | 0 (0.0%) |
| 25 to 34 Years | 14 (35.0%) | 0 (0.0%) |
| 35 to 44 Years | 0 (0.0%) | 10 (11.4%) |
| 45 to 54 Years | 24 (33.8%) | 9 (11.4%) |
| 55 to 64 Years | 14 (23.7%) | 28 (30.1%) |
| 65 to 74 Years | 6 (18.8%) | 17 (34.7%) |
| 75 Years and over | 0 (0.0%) | 12 (38.7%) |
| Total | 103 (19.0%) | 96 (16.3%) |
Income Above Poverty by Sex and Age in Skyline Ganipa
According to the poverty statistics in Skyline Ganipa, males aged 6 to 11 years and females aged under 5 years are the age groups that are most secure financially, with 100.0% of males and 100.0% of females in these age groups living above the poverty line.
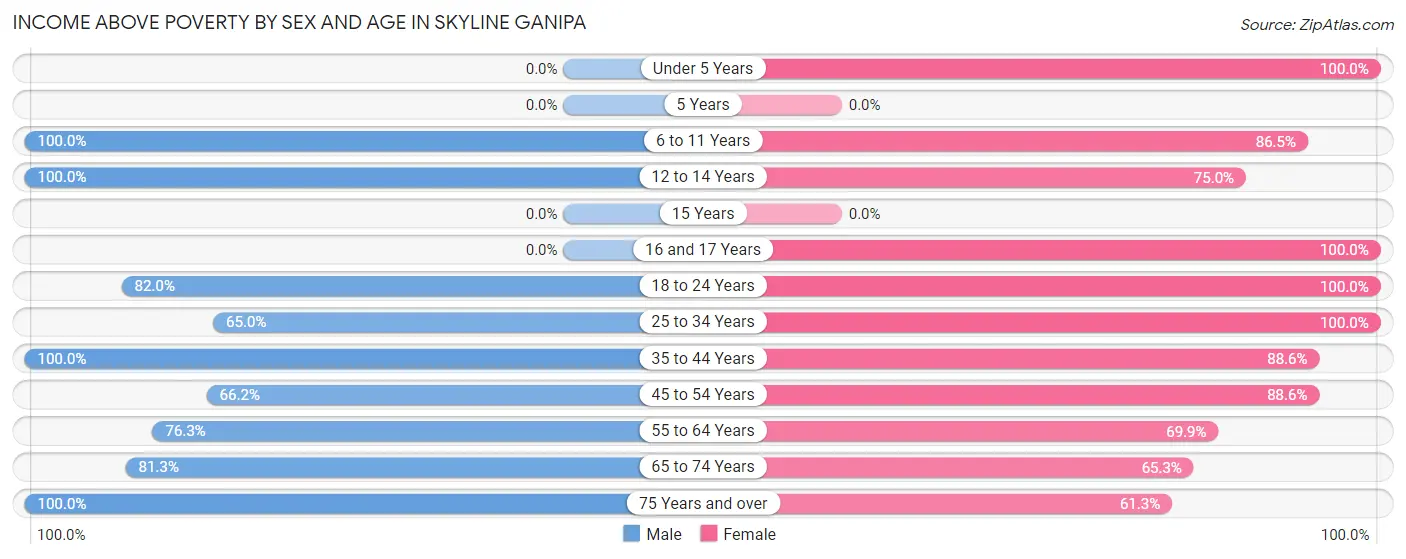
| Age Bracket | Male | Female |
| Under 5 Years | 0 (0.0%) | 43 (100.0%) |
| 5 Years | 0 (0.0%) | 0 (0.0%) |
| 6 to 11 Years | 80 (100.0%) | 64 (86.5%) |
| 12 to 14 Years | 25 (100.0%) | 30 (75.0%) |
| 15 Years | 0 (0.0%) | 0 (0.0%) |
| 16 and 17 Years | 0 (0.0%) | 5 (100.0%) |
| 18 to 24 Years | 41 (82.0%) | 35 (100.0%) |
| 25 to 34 Years | 26 (65.0%) | 52 (100.0%) |
| 35 to 44 Years | 61 (100.0%) | 78 (88.6%) |
| 45 to 54 Years | 47 (66.2%) | 70 (88.6%) |
| 55 to 64 Years | 45 (76.3%) | 65 (69.9%) |
| 65 to 74 Years | 26 (81.2%) | 32 (65.3%) |
| 75 Years and over | 89 (100.0%) | 19 (61.3%) |
| Total | 440 (81.0%) | 493 (83.7%) |
Income Below Poverty Among Married-Couple Families in Skyline Ganipa
The poverty statistics for married-couple families in Skyline Ganipa show that 17.8% or 27 of the total 152 families live below the poverty line. Families with 1 or 2 children have the highest poverty rate of 27.0%, comprising of 17 families. On the other hand, families with 3 or 4 children have the lowest poverty rate of 0.0%, which includes 0 families.
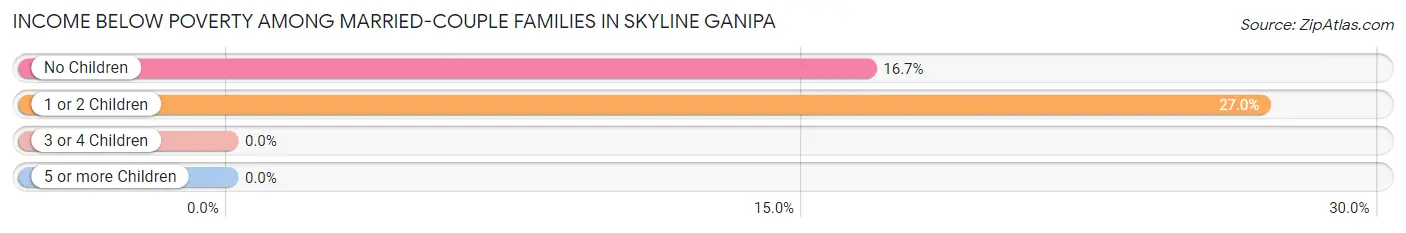
| Children | Above Poverty | Below Poverty |
| No Children | 50 (83.3%) | 10 (16.7%) |
| 1 or 2 Children | 46 (73.0%) | 17 (27.0%) |
| 3 or 4 Children | 29 (100.0%) | 0 (0.0%) |
| 5 or more Children | 0 (0.0%) | 0 (0.0%) |
| Total | 125 (82.2%) | 27 (17.8%) |
Income Below Poverty Among Single-Parent Households in Skyline Ganipa
According to the poverty data in Skyline Ganipa, 27.3% or 6 single-father households and 40.0% or 22 single-mother households are living below the poverty line. Among single-father households, those with no children have the highest poverty rate, with 6 households (27.3%) experiencing poverty. Likewise, among single-mother households, those with 3 or 4 children have the highest poverty rate, with 10 households (100.0%) falling below the poverty line.
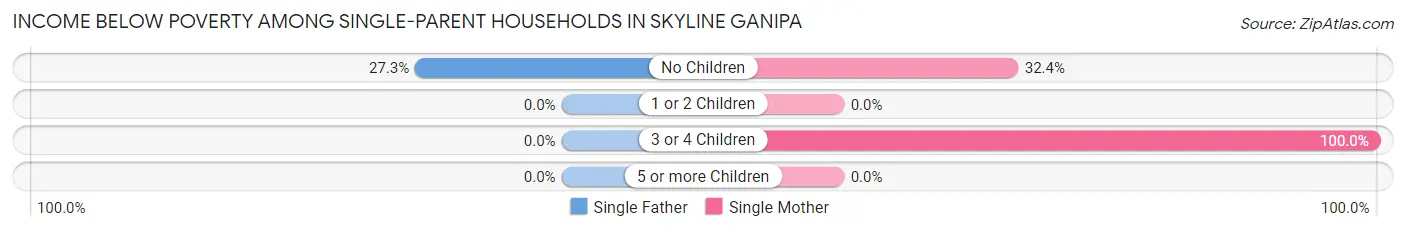
| Children | Single Father | Single Mother |
| No Children | 6 (27.3%) | 12 (32.4%) |
| 1 or 2 Children | 0 (0.0%) | 0 (0.0%) |
| 3 or 4 Children | 0 (0.0%) | 10 (100.0%) |
| 5 or more Children | 0 (0.0%) | 0 (0.0%) |
| Total | 6 (27.3%) | 22 (40.0%) |
Income Below Poverty Among Married-Couple vs Single-Parent Households in Skyline Ganipa
The poverty data for Skyline Ganipa shows that 27 of the married-couple family households (17.8%) and 28 of the single-parent households (36.4%) are living below the poverty level. Within the married-couple family households, those with 1 or 2 children have the highest poverty rate, with 17 households (27.0%) falling below the poverty line. Among the single-parent households, those with 3 or 4 children have the highest poverty rate, with 10 household (100.0%) living below poverty.
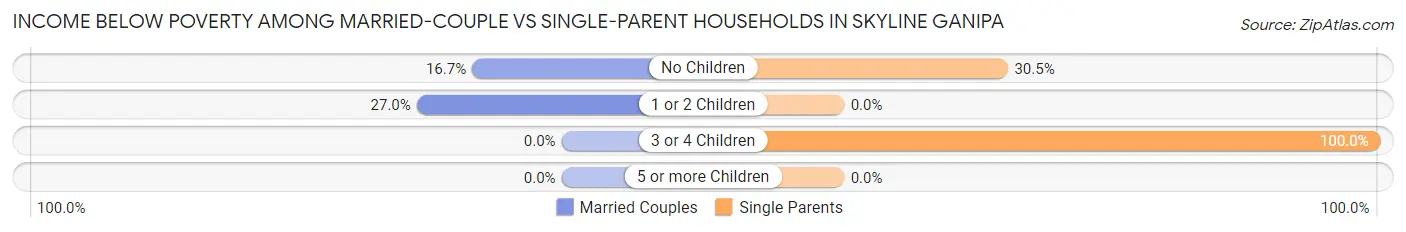
| Children | Married-Couple Families | Single-Parent Households |
| No Children | 10 (16.7%) | 18 (30.5%) |
| 1 or 2 Children | 17 (27.0%) | 0 (0.0%) |
| 3 or 4 Children | 0 (0.0%) | 10 (100.0%) |
| 5 or more Children | 0 (0.0%) | 0 (0.0%) |
| Total | 27 (17.8%) | 28 (36.4%) |
Race in Skyline Ganipa
The most populous races in Skyline Ganipa are Native / Alaskan (963 | 85.1%), Two or more Races (93 | 8.2%), and Hispanic or Latino (76 | 6.7%).
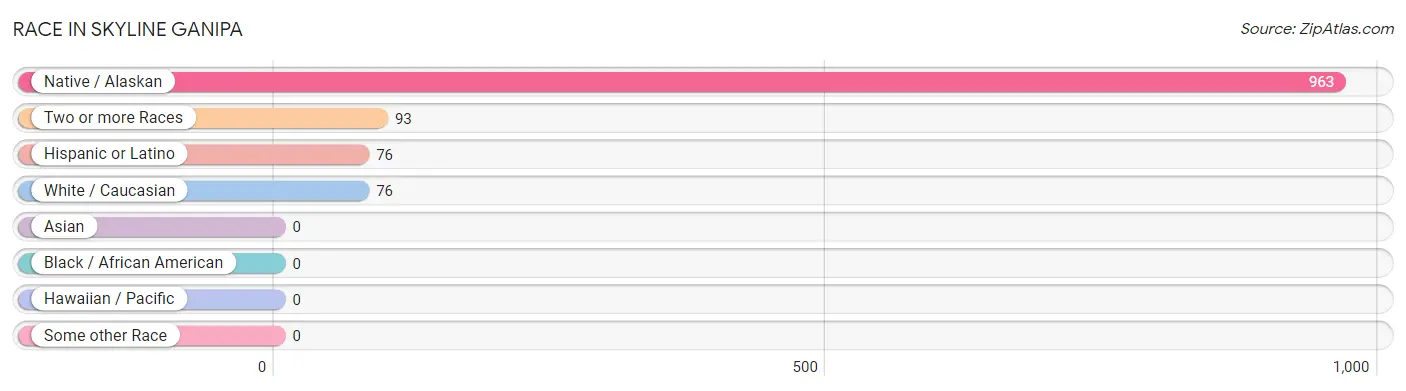
| Race | # Population | % Population |
| Asian | 0 | 0.0% |
| Black / African American | 0 | 0.0% |
| Hawaiian / Pacific | 0 | 0.0% |
| Hispanic or Latino | 76 | 6.7% |
| Native / Alaskan | 963 | 85.1% |
| White / Caucasian | 76 | 6.7% |
| Two or more Races | 93 | 8.2% |
| Some other Race | 0 | 0.0% |
| Total | 1,132 | 100.0% |
Ancestry in Skyline Ganipa
The most populous ancestries reported in Skyline Ganipa are Pueblo (1,017 | 89.8%), Mexican (76 | 6.7%), Hopi (37 | 3.3%), Cheyenne (19 | 1.7%), and Navajo (9 | 0.8%), together accounting for 102.3% of all Skyline Ganipa residents.
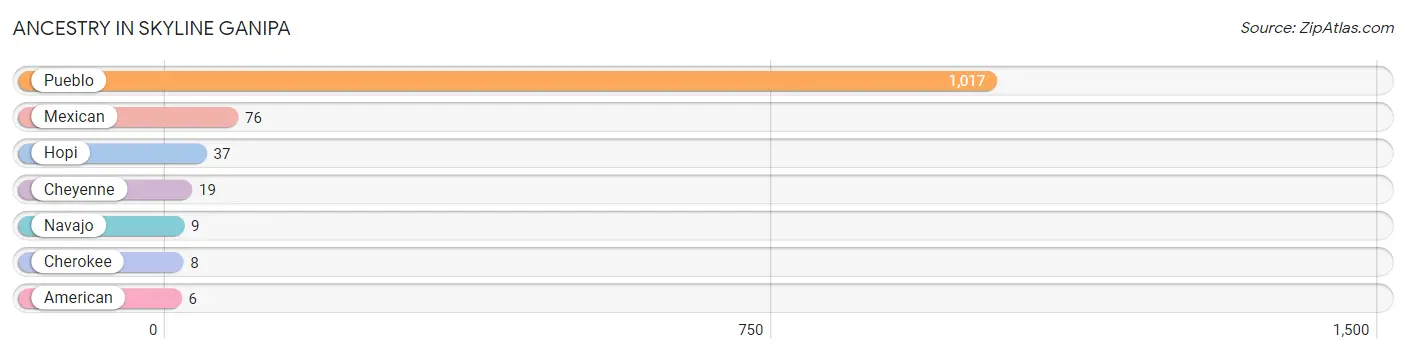
| Ancestry | # Population | % Population |
| American | 6 | 0.5% |
| Cherokee | 8 | 0.7% |
| Cheyenne | 19 | 1.7% |
| Hopi | 37 | 3.3% |
| Mexican | 76 | 6.7% |
| Navajo | 9 | 0.8% |
| Pueblo | 1,017 | 89.8% | View All 7 Rows |
Immigrants in Skyline Ganipa
The most numerous immigrant groups reported in Skyline Ganipa came from England (62 | 5.5%), Europe (62 | 5.5%), and Northern Europe (62 | 5.5%), together accounting for 16.4% of all Skyline Ganipa residents.
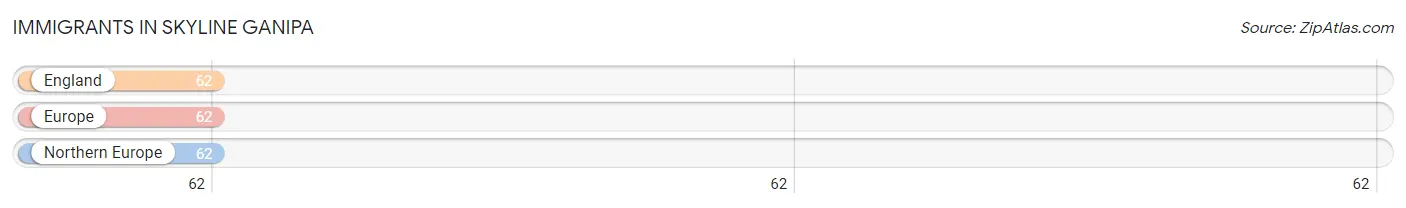
| Immigration Origin | # Population | % Population |
| England | 62 | 5.5% |
| Europe | 62 | 5.5% |
| Northern Europe | 62 | 5.5% | View All 3 Rows |
Sex and Age in Skyline Ganipa
Sex and Age in Skyline Ganipa
The most populous age groups in Skyline Ganipa are 75 to 79 Years (74 | 13.6%) for men and 10 to 14 Years (97 | 16.5%) for women.
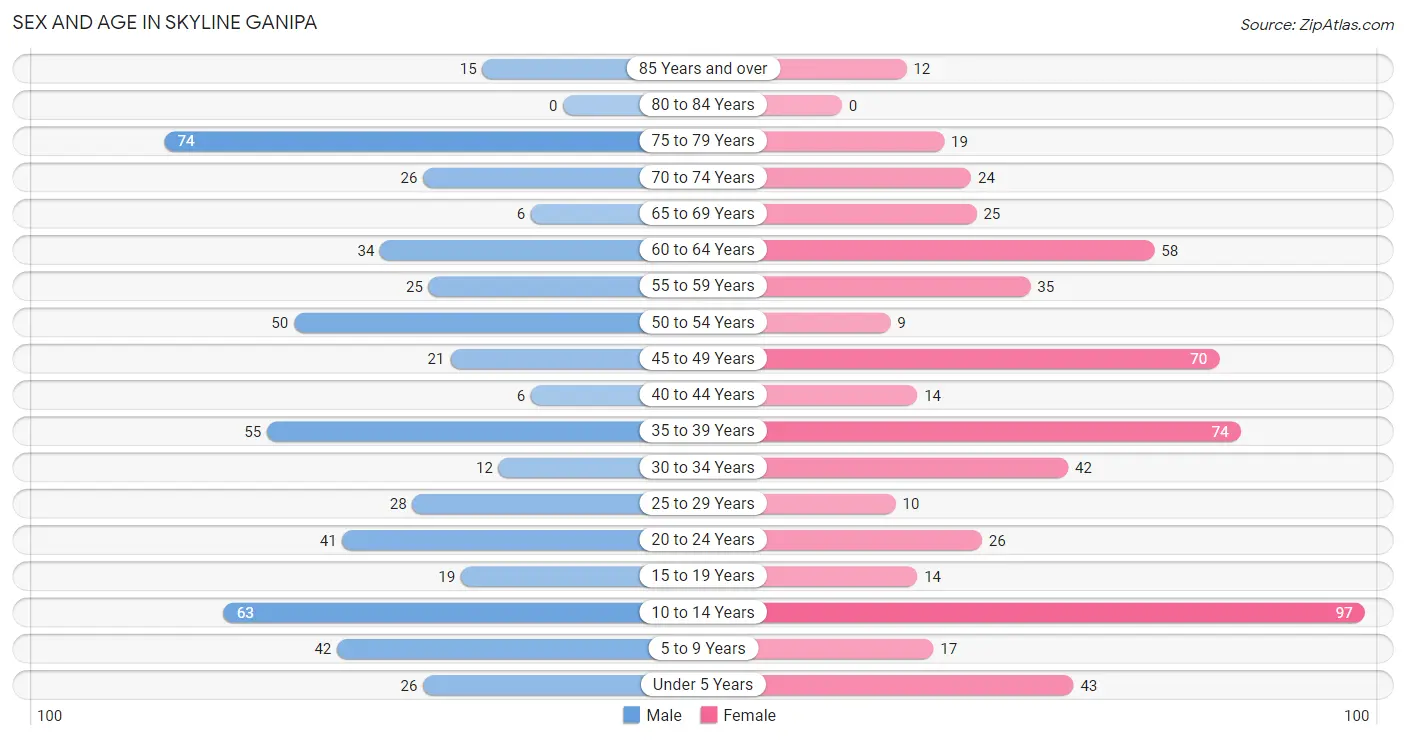
| Age Bracket | Male | Female |
| Under 5 Years | 26 (4.8%) | 43 (7.3%) |
| 5 to 9 Years | 42 (7.7%) | 17 (2.9%) |
| 10 to 14 Years | 63 (11.6%) | 97 (16.5%) |
| 15 to 19 Years | 19 (3.5%) | 14 (2.4%) |
| 20 to 24 Years | 41 (7.5%) | 26 (4.4%) |
| 25 to 29 Years | 28 (5.2%) | 10 (1.7%) |
| 30 to 34 Years | 12 (2.2%) | 42 (7.1%) |
| 35 to 39 Years | 55 (10.1%) | 74 (12.6%) |
| 40 to 44 Years | 6 (1.1%) | 14 (2.4%) |
| 45 to 49 Years | 21 (3.9%) | 70 (11.9%) |
| 50 to 54 Years | 50 (9.2%) | 9 (1.5%) |
| 55 to 59 Years | 25 (4.6%) | 35 (5.9%) |
| 60 to 64 Years | 34 (6.3%) | 58 (9.9%) |
| 65 to 69 Years | 6 (1.1%) | 25 (4.2%) |
| 70 to 74 Years | 26 (4.8%) | 24 (4.1%) |
| 75 to 79 Years | 74 (13.6%) | 19 (3.2%) |
| 80 to 84 Years | 0 (0.0%) | 0 (0.0%) |
| 85 Years and over | 15 (2.8%) | 12 (2.0%) |
| Total | 543 (100.0%) | 589 (100.0%) |
Families and Households in Skyline Ganipa
Median Family Size in Skyline Ganipa
The median family size in Skyline Ganipa is 4.66 persons per family, with married-couple families (152 | 66.4%) accounting for the largest median family size of 5.09 persons per family. On the other hand, single female/mother families (55 | 24.0%) represent the smallest median family size with 3.33 persons per family.
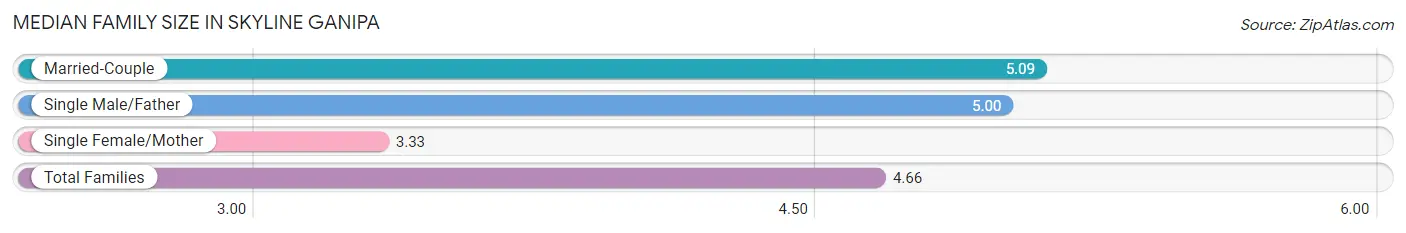
| Family Type | # Families | Family Size |
| Married-Couple | 152 (66.4%) | 5.09 |
| Single Male/Father | 22 (9.6%) | 5.00 |
| Single Female/Mother | 55 (24.0%) | 3.33 |
| Total Families | 229 (100.0%) | 4.66 |
Median Household Size in Skyline Ganipa
The median household size in Skyline Ganipa is 4.26 persons per household, with single male/father households (22 | 8.3%) accounting for the largest median household size of 5.45 persons per household. non-family households (37 | 13.9%) represent the smallest median household size with 1.16 persons per household.
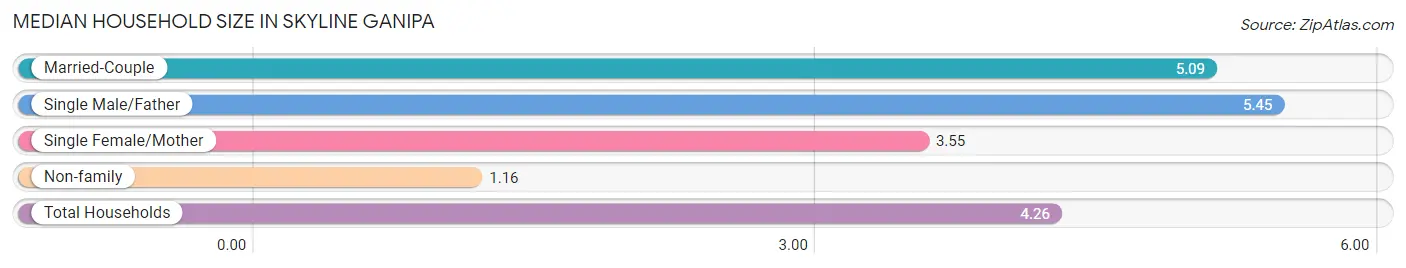
| Household Type | # Households | Household Size |
| Married-Couple | 152 (57.1%) | 5.09 |
| Single Male/Father | 22 (8.3%) | 5.45 |
| Single Female/Mother | 55 (20.7%) | 3.55 |
| Non-family | 37 (13.9%) | 1.16 |
| Total Households | 266 (100.0%) | 4.26 |
Household Size by Marriage Status in Skyline Ganipa
Out of a total of 266 households in Skyline Ganipa, 229 (86.1%) are family households, while 37 (13.9%) are nonfamily households. The most numerous type of family households are 2-person households, comprising 76, and the most common type of nonfamily households are 1-person households, comprising 32.
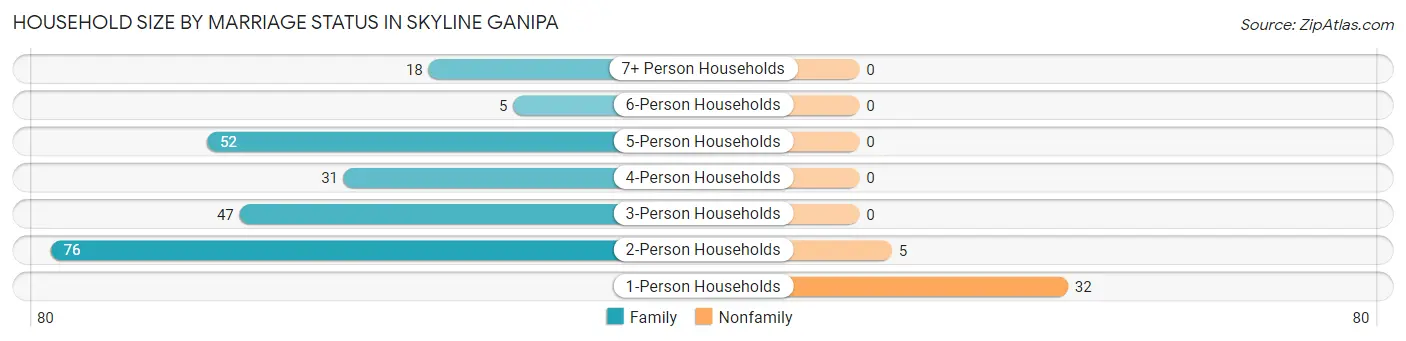
| Household Size | Family Households | Nonfamily Households |
| 1-Person Households | - | 32 (12.0%) |
| 2-Person Households | 76 (28.6%) | 5 (1.9%) |
| 3-Person Households | 47 (17.7%) | 0 (0.0%) |
| 4-Person Households | 31 (11.7%) | 0 (0.0%) |
| 5-Person Households | 52 (19.6%) | 0 (0.0%) |
| 6-Person Households | 5 (1.9%) | 0 (0.0%) |
| 7+ Person Households | 18 (6.8%) | 0 (0.0%) |
| Total | 229 (86.1%) | 37 (13.9%) |
Female Fertility in Skyline Ganipa
Fertility by Age in Skyline Ganipa
Average fertility rate in Skyline Ganipa is 56.0 births per 1,000 women. Women in the age bracket of 35 to 50 years have the highest fertility rate with 89.0 births per 1,000 women. Women in the age bracket of 35 to 50 years acount for 100.0% of all women with births.
| Age Bracket | Women with Births | Births / 1,000 Women |
| 15 to 19 years | 0 (0.0%) | 0.0 |
| 20 to 34 years | 0 (0.0%) | 0.0 |
| 35 to 50 years | 14 (100.0%) | 89.0 |
| Total | 14 (100.0%) | 56.0 |
Fertility by Age by Marriage Status in Skyline Ganipa
| Age Bracket | Married | Unmarried |
| 15 to 19 years | 0 (0.0%) | 0 (0.0%) |
| 20 to 34 years | 0 (0.0%) | 0 (0.0%) |
| 35 to 50 years | 0 (0.0%) | 14 (100.0%) |
| Total | 0 (0.0%) | 14 (100.0%) |
Fertility by Education in Skyline Ganipa
| Educational Attainment | Women with Births | Births / 1,000 Women |
| Less than High School | 0 (0.0%) | 0.0 |
| High School Diploma | 0 (0.0%) | 0.0 |
| College or Associate's Degree | 14 (100.0%) | 103.0 |
| Bachelor's Degree | 0 (0.0%) | 0.0 |
| Graduate Degree | 0 (0.0%) | 0.0 |
| Total | 14 (100.0%) | 56.0 |
Fertility by Education by Marriage Status in Skyline Ganipa
| Educational Attainment | Married | Unmarried |
| Less than High School | 0 (0.0%) | 0 (0.0%) |
| High School Diploma | 0 (0.0%) | 0 (0.0%) |
| College or Associate's Degree | 0 (0.0%) | 14 (100.0%) |
| Bachelor's Degree | 0 (0.0%) | 0 (0.0%) |
| Graduate Degree | 0 (0.0%) | 0 (0.0%) |
| Total | 0 (0.0%) | 14 (100.0%) |
Employment Characteristics in Skyline Ganipa
Employment by Class of Employer in Skyline Ganipa
Among the 440 employed individuals in Skyline Ganipa, private company employees (203 | 46.1%), local government employees (149 | 33.9%), and not-for-profit organizations (35 | 8.0%) make up the most common classes of employment.
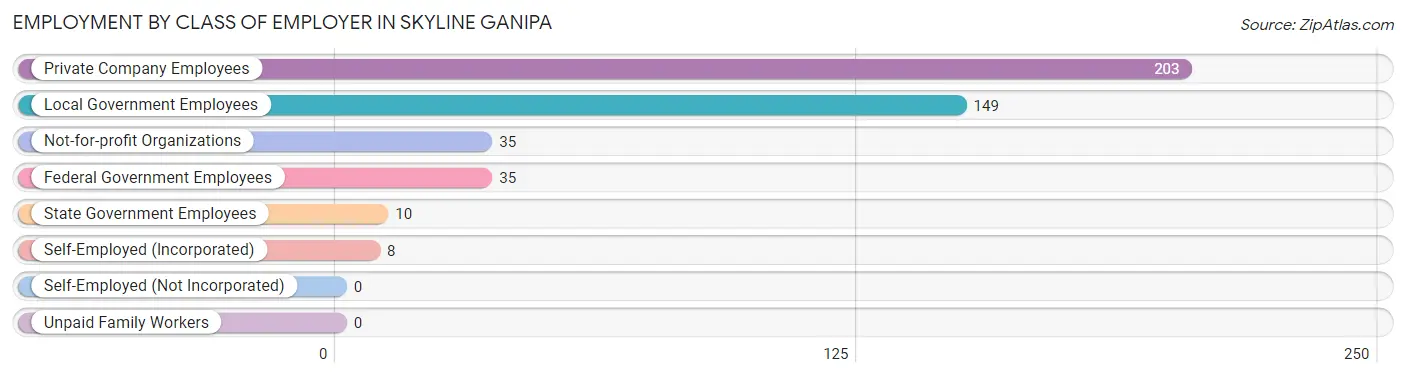
| Employer Class | # Employees | % Employees |
| Private Company Employees | 203 | 46.1% |
| Self-Employed (Incorporated) | 8 | 1.8% |
| Self-Employed (Not Incorporated) | 0 | 0.0% |
| Not-for-profit Organizations | 35 | 8.0% |
| Local Government Employees | 149 | 33.9% |
| State Government Employees | 10 | 2.3% |
| Federal Government Employees | 35 | 8.0% |
| Unpaid Family Workers | 0 | 0.0% |
| Total | 440 | 100.0% |
Employment Status by Age in Skyline Ganipa
According to the labor force statistics for Skyline Ganipa, out of the total population over 16 years of age (844), 56.3% or 475 individuals are in the labor force, with 5.3% or 25 of them unemployed. The age group with the highest labor force participation rate is 25 to 29 years, with 100.0% or 38 individuals in the labor force. Within the labor force, the 35 to 44 years age range has the highest percentage of unemployed individuals, with 15.5% or 17 of them being unemployed.
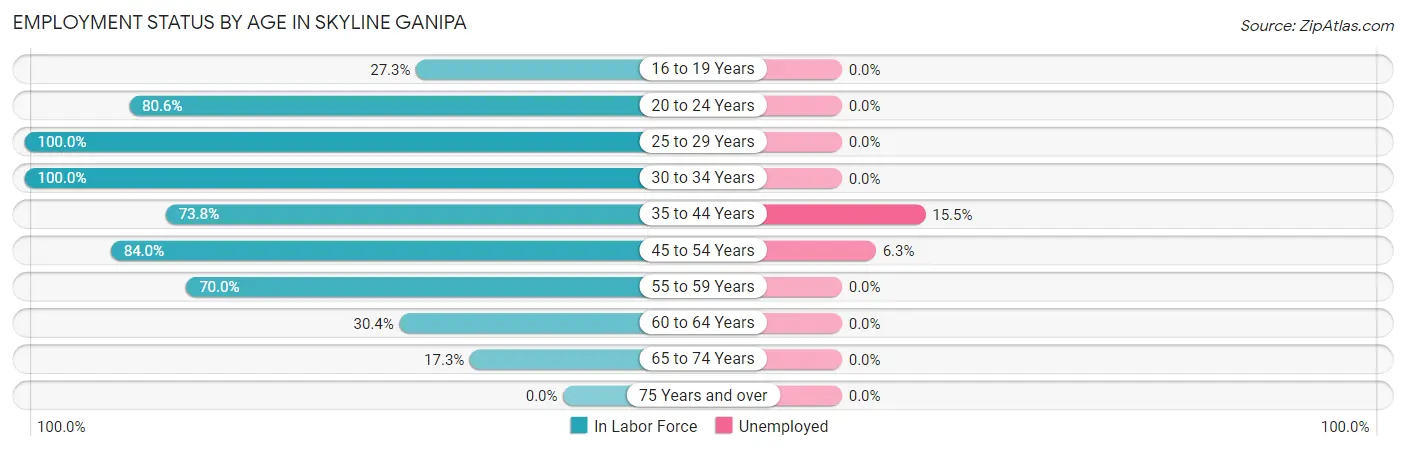
| Age Bracket | In Labor Force | Unemployed |
| 16 to 19 Years | 9 (27.3%) | 0 (0.0%) |
| 20 to 24 Years | 54 (80.6%) | 0 (0.0%) |
| 25 to 29 Years | 38 (100.0%) | 0 (0.0%) |
| 30 to 34 Years | 54 (100.0%) | 0 (0.0%) |
| 35 to 44 Years | 110 (73.8%) | 17 (15.5%) |
| 45 to 54 Years | 126 (84.0%) | 8 (6.3%) |
| 55 to 59 Years | 42 (70.0%) | 0 (0.0%) |
| 60 to 64 Years | 28 (30.4%) | 0 (0.0%) |
| 65 to 74 Years | 14 (17.3%) | 0 (0.0%) |
| 75 Years and over | 0 (0.0%) | 0 (0.0%) |
| Total | 475 (56.3%) | 25 (5.3%) |
Employment Status by Educational Attainment in Skyline Ganipa
According to labor force statistics for Skyline Ganipa, 73.3% of individuals (398) out of the total population between 25 and 64 years of age (543) are in the labor force, with 6.3% or 25 of them being unemployed. The group with the highest labor force participation rate are those with the educational attainment of bachelor's degree or higher, with 100.0% or 84 individuals in the labor force. Within the labor force, individuals with less than high school education have the highest percentage of unemployment, with 21.6% or 8 of them being unemployed.
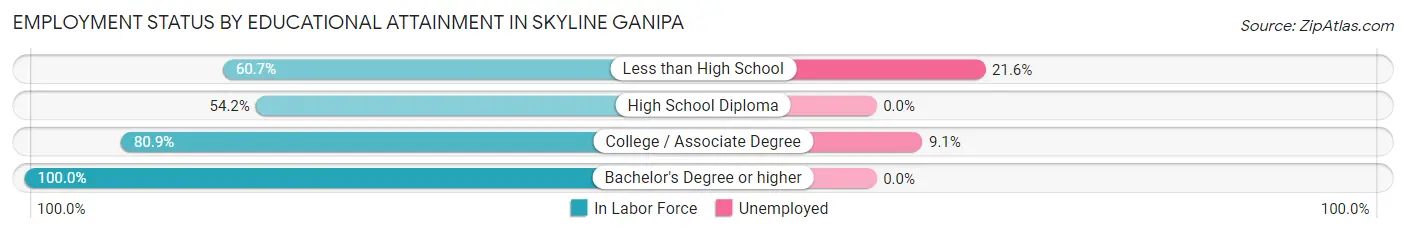
| Educational Attainment | In Labor Force | Unemployed |
| Less than High School | 37 (60.7%) | 13 (21.6%) |
| High School Diploma | 91 (54.2%) | 0 (0.0%) |
| College / Associate Degree | 186 (80.9%) | 21 (9.1%) |
| Bachelor's Degree or higher | 84 (100.0%) | 0 (0.0%) |
| Total | 398 (73.3%) | 34 (6.3%) |
Employment Occupations by Sex in Skyline Ganipa
Management, Business, Science and Arts Occupations
The most common Management, Business, Science and Arts occupations in Skyline Ganipa are Community & Social Service (77 | 17.1%), Management (54 | 12.0%), Health Diagnosing & Treating (51 | 11.3%), Education Instruction & Library (36 | 8.0%), and Health Technologists (24 | 5.3%).
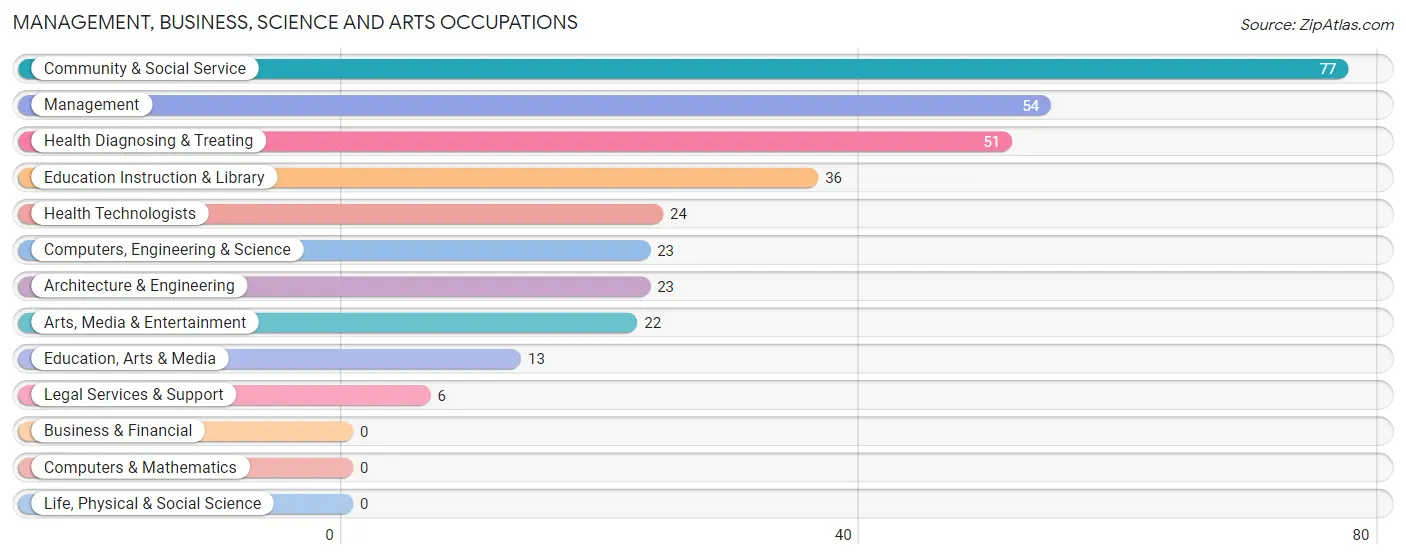
Management, Business, Science and Arts Occupations by Sex
Within the Management, Business, Science and Arts occupations in Skyline Ganipa, the most male-oriented occupations are Computers, Engineering & Science (100.0%), Architecture & Engineering (100.0%), and Legal Services & Support (100.0%), while the most female-oriented occupations are Education, Arts & Media (100.0%), Education Instruction & Library (100.0%), and Arts, Media & Entertainment (100.0%).
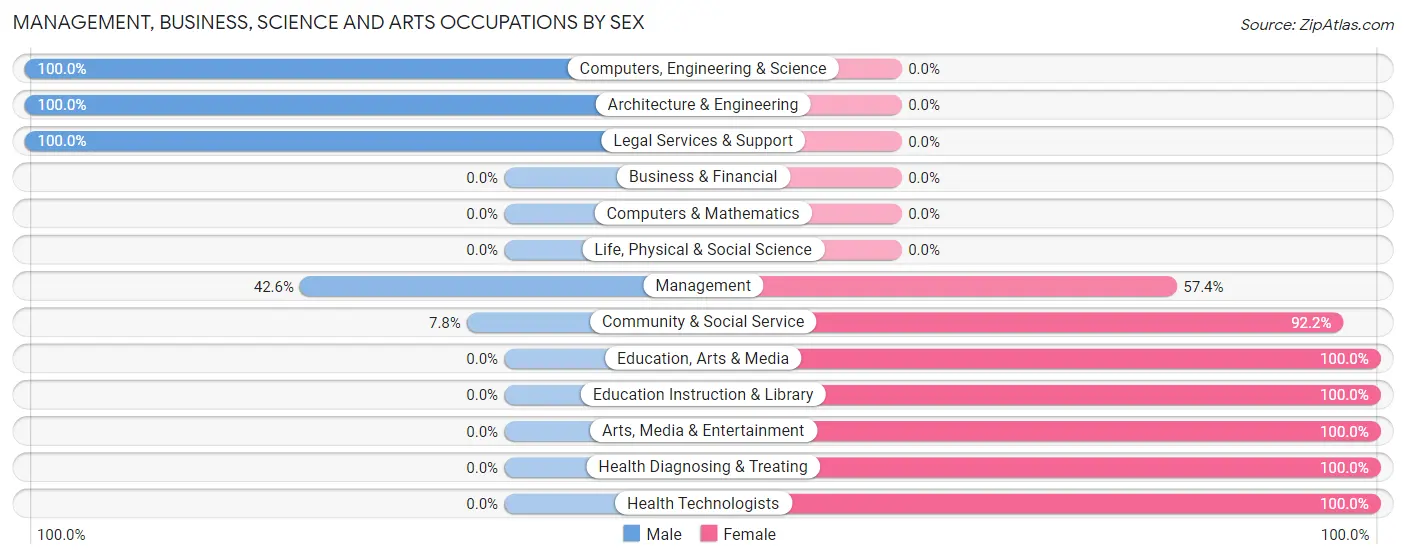
| Occupation | Male | Female |
| Management | 23 (42.6%) | 31 (57.4%) |
| Business & Financial | 0 (0.0%) | 0 (0.0%) |
| Computers, Engineering & Science | 23 (100.0%) | 0 (0.0%) |
| Computers & Mathematics | 0 (0.0%) | 0 (0.0%) |
| Architecture & Engineering | 23 (100.0%) | 0 (0.0%) |
| Life, Physical & Social Science | 0 (0.0%) | 0 (0.0%) |
| Community & Social Service | 6 (7.8%) | 71 (92.2%) |
| Education, Arts & Media | 0 (0.0%) | 13 (100.0%) |
| Legal Services & Support | 6 (100.0%) | 0 (0.0%) |
| Education Instruction & Library | 0 (0.0%) | 36 (100.0%) |
| Arts, Media & Entertainment | 0 (0.0%) | 22 (100.0%) |
| Health Diagnosing & Treating | 0 (0.0%) | 51 (100.0%) |
| Health Technologists | 0 (0.0%) | 24 (100.0%) |
| Total (Category) | 52 (25.4%) | 153 (74.6%) |
| Total (Overall) | 158 (35.1%) | 292 (64.9%) |
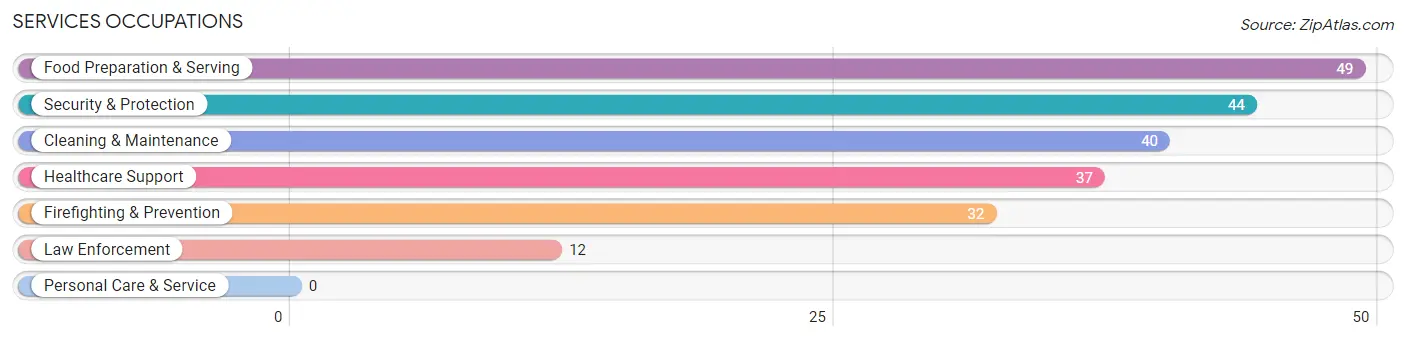
Services Occupations
The most common Services occupations in Skyline Ganipa are Food Preparation & Serving (49 | 10.9%), Security & Protection (44 | 9.8%), Cleaning & Maintenance (40 | 8.9%), Healthcare Support (37 | 8.2%), and Firefighting & Prevention (32 | 7.1%).
Services Occupations by Sex
Within the Services occupations in Skyline Ganipa, the most male-oriented occupations are Law Enforcement (100.0%), Cleaning & Maintenance (77.5%), and Security & Protection (77.3%), while the most female-oriented occupations are Healthcare Support (100.0%), Food Preparation & Serving (71.4%), and Firefighting & Prevention (31.2%).
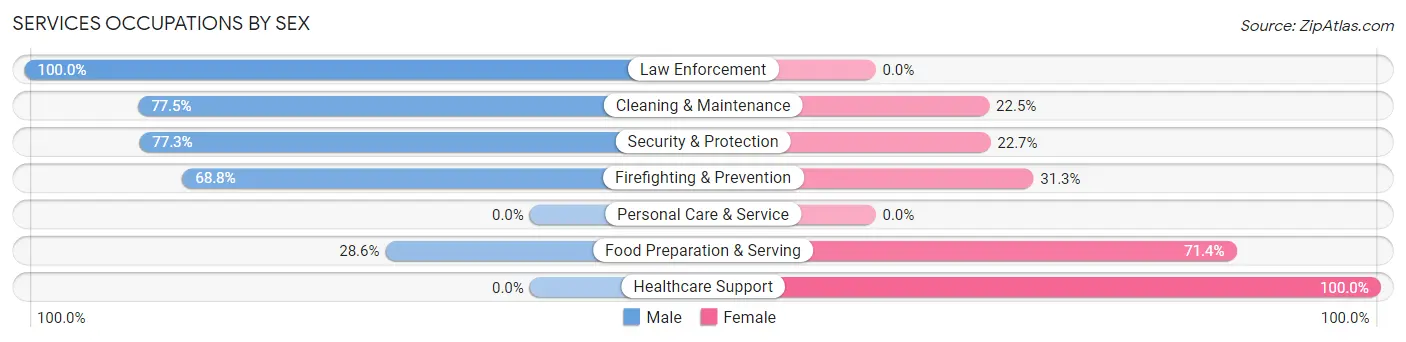
| Occupation | Male | Female |
| Healthcare Support | 0 (0.0%) | 37 (100.0%) |
| Security & Protection | 34 (77.3%) | 10 (22.7%) |
| Firefighting & Prevention | 22 (68.8%) | 10 (31.2%) |
| Law Enforcement | 12 (100.0%) | 0 (0.0%) |
| Food Preparation & Serving | 14 (28.6%) | 35 (71.4%) |
| Cleaning & Maintenance | 31 (77.5%) | 9 (22.5%) |
| Personal Care & Service | 0 (0.0%) | 0 (0.0%) |
| Total (Category) | 79 (46.5%) | 91 (53.5%) |
| Total (Overall) | 158 (35.1%) | 292 (64.9%) |
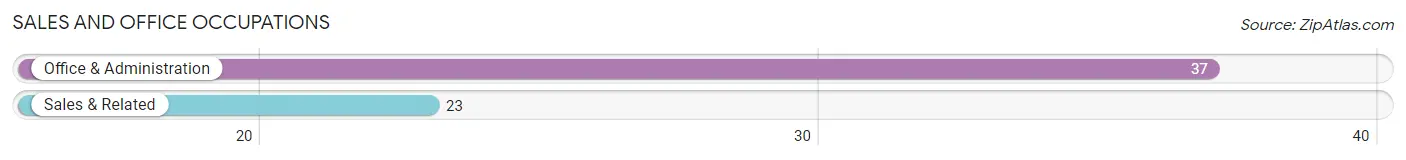
Sales and Office Occupations
The most common Sales and Office occupations in Skyline Ganipa are Office & Administration (37 | 8.2%), and Sales & Related (23 | 5.1%).
Sales and Office Occupations by Sex
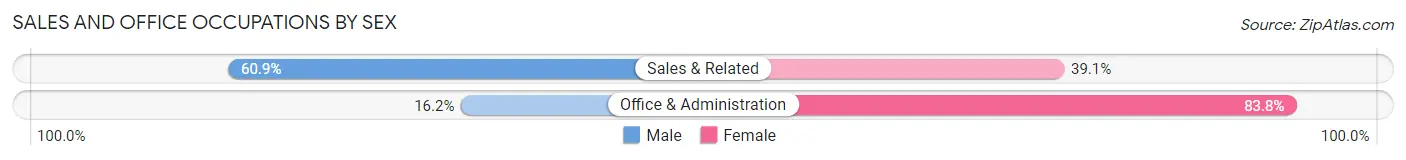
| Occupation | Male | Female |
| Sales & Related | 14 (60.9%) | 9 (39.1%) |
| Office & Administration | 6 (16.2%) | 31 (83.8%) |
| Total (Category) | 20 (33.3%) | 40 (66.7%) |
| Total (Overall) | 158 (35.1%) | 292 (64.9%) |
Natural Resources, Construction and Maintenance Occupations
The most common Natural Resources, Construction and Maintenance occupations in Skyline Ganipa are , and Construction & Extraction (7 | 1.6%).
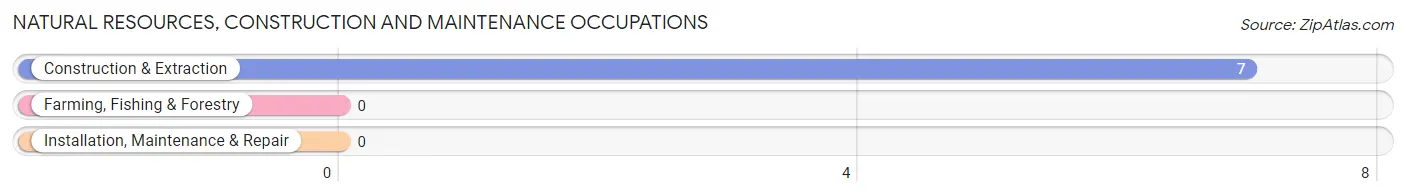
Natural Resources, Construction and Maintenance Occupations by Sex
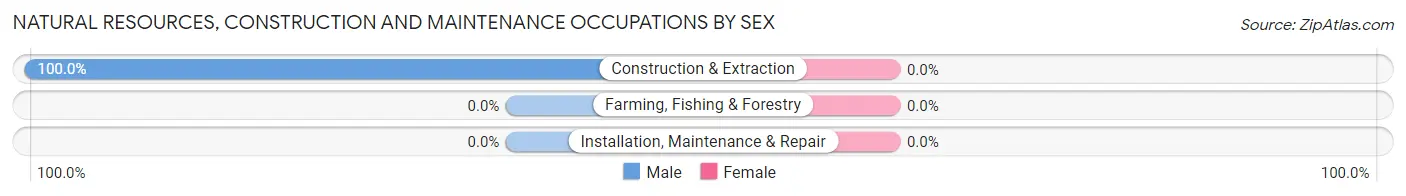
| Occupation | Male | Female |
| Farming, Fishing & Forestry | 0 (0.0%) | 0 (0.0%) |
| Construction & Extraction | 7 (100.0%) | 0 (0.0%) |
| Installation, Maintenance & Repair | 0 (0.0%) | 0 (0.0%) |
| Total (Category) | 7 (100.0%) | 0 (0.0%) |
| Total (Overall) | 158 (35.1%) | 292 (64.9%) |
Production, Transportation and Moving Occupations
The most common Production, Transportation and Moving occupations in Skyline Ganipa are , and Transportation (8 | 1.8%).
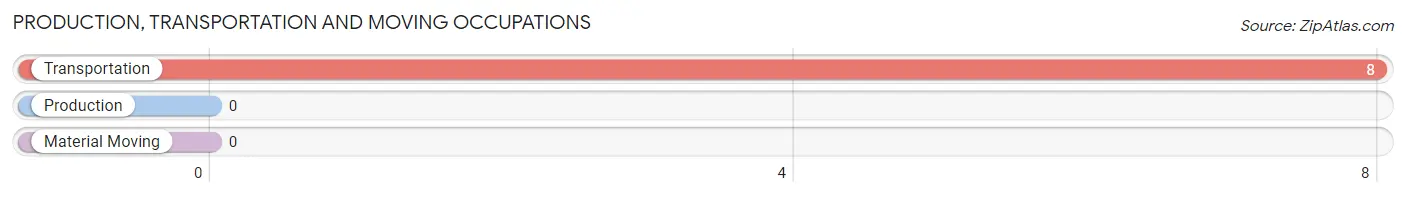
Production, Transportation and Moving Occupations by Sex
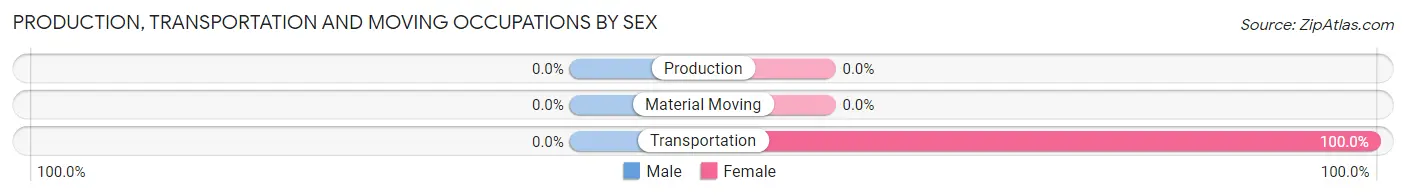
| Occupation | Male | Female |
| Production | 0 (0.0%) | 0 (0.0%) |
| Transportation | 0 (0.0%) | 8 (100.0%) |
| Material Moving | 0 (0.0%) | 0 (0.0%) |
| Total (Category) | 0 (0.0%) | 8 (100.0%) |
| Total (Overall) | 158 (35.1%) | 292 (64.9%) |
Employment Industries by Sex in Skyline Ganipa
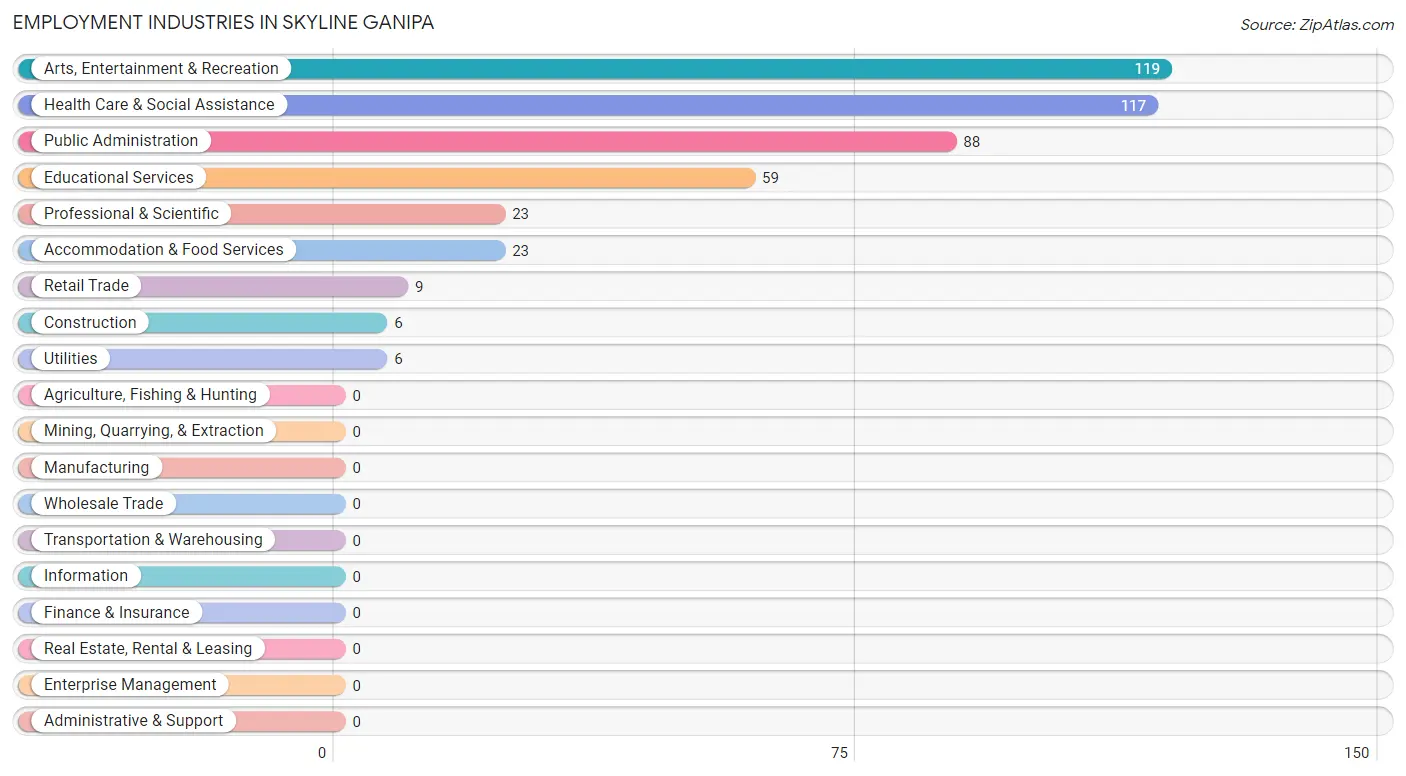
Employment Industries in Skyline Ganipa
The major employment industries in Skyline Ganipa include Arts, Entertainment & Recreation (119 | 26.4%), Health Care & Social Assistance (117 | 26.0%), Public Administration (88 | 19.6%), Educational Services (59 | 13.1%), and Professional & Scientific (23 | 5.1%).
Employment Industries by Sex in Skyline Ganipa
The Skyline Ganipa industries that see more men than women are Construction (100.0%), Utilities (100.0%), and Professional & Scientific (100.0%), whereas the industries that tend to have a higher number of women are Retail Trade (100.0%), Educational Services (100.0%), and Health Care & Social Assistance (100.0%).
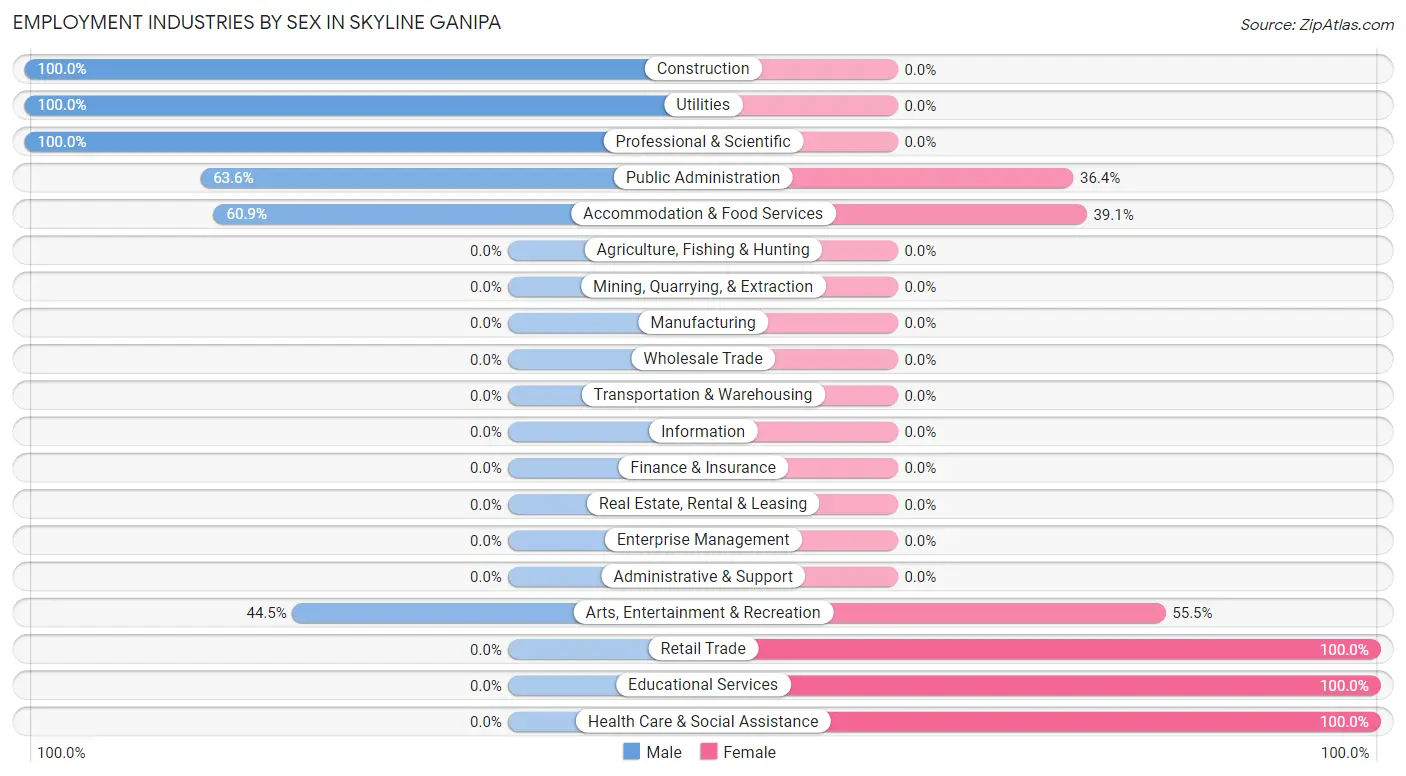
| Industry | Male | Female |
| Agriculture, Fishing & Hunting | 0 (0.0%) | 0 (0.0%) |
| Mining, Quarrying, & Extraction | 0 (0.0%) | 0 (0.0%) |
| Construction | 6 (100.0%) | 0 (0.0%) |
| Manufacturing | 0 (0.0%) | 0 (0.0%) |
| Wholesale Trade | 0 (0.0%) | 0 (0.0%) |
| Retail Trade | 0 (0.0%) | 9 (100.0%) |
| Transportation & Warehousing | 0 (0.0%) | 0 (0.0%) |
| Utilities | 6 (100.0%) | 0 (0.0%) |
| Information | 0 (0.0%) | 0 (0.0%) |
| Finance & Insurance | 0 (0.0%) | 0 (0.0%) |
| Real Estate, Rental & Leasing | 0 (0.0%) | 0 (0.0%) |
| Professional & Scientific | 23 (100.0%) | 0 (0.0%) |
| Enterprise Management | 0 (0.0%) | 0 (0.0%) |
| Administrative & Support | 0 (0.0%) | 0 (0.0%) |
| Educational Services | 0 (0.0%) | 59 (100.0%) |
| Health Care & Social Assistance | 0 (0.0%) | 117 (100.0%) |
| Arts, Entertainment & Recreation | 53 (44.5%) | 66 (55.5%) |
| Accommodation & Food Services | 14 (60.9%) | 9 (39.1%) |
| Public Administration | 56 (63.6%) | 32 (36.4%) |
| Total | 158 (35.1%) | 292 (64.9%) |
Education in Skyline Ganipa
School Enrollment in Skyline Ganipa
The most common levels of schooling among the 290 students in Skyline Ganipa are middle school (124 | 42.8%), elementary school (85 | 29.3%), and college / undergraduate (32 | 11.0%).
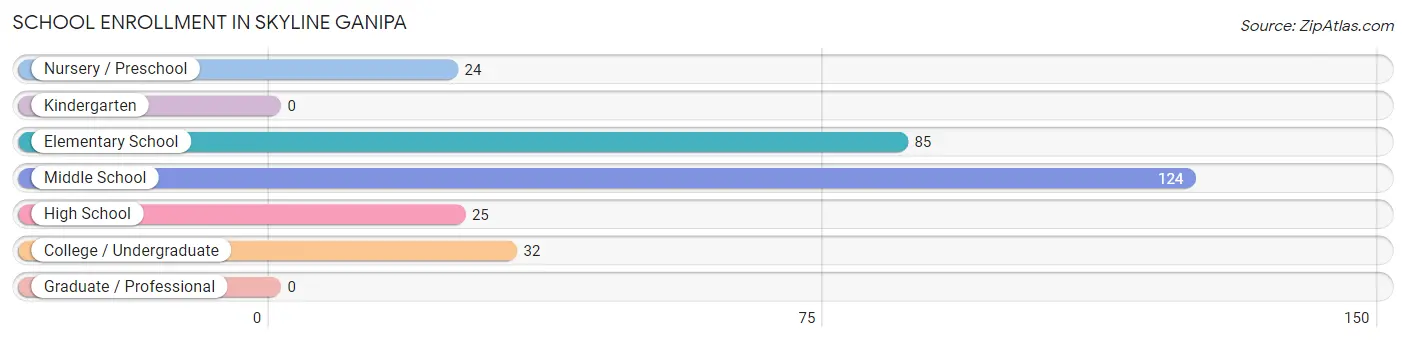
| School Level | # Students | % Students |
| Nursery / Preschool | 24 | 8.3% |
| Kindergarten | 0 | 0.0% |
| Elementary School | 85 | 29.3% |
| Middle School | 124 | 42.8% |
| High School | 25 | 8.6% |
| College / Undergraduate | 32 | 11.0% |
| Graduate / Professional | 0 | 0.0% |
| Total | 290 | 100.0% |
School Enrollment by Age by Funding Source in Skyline Ganipa
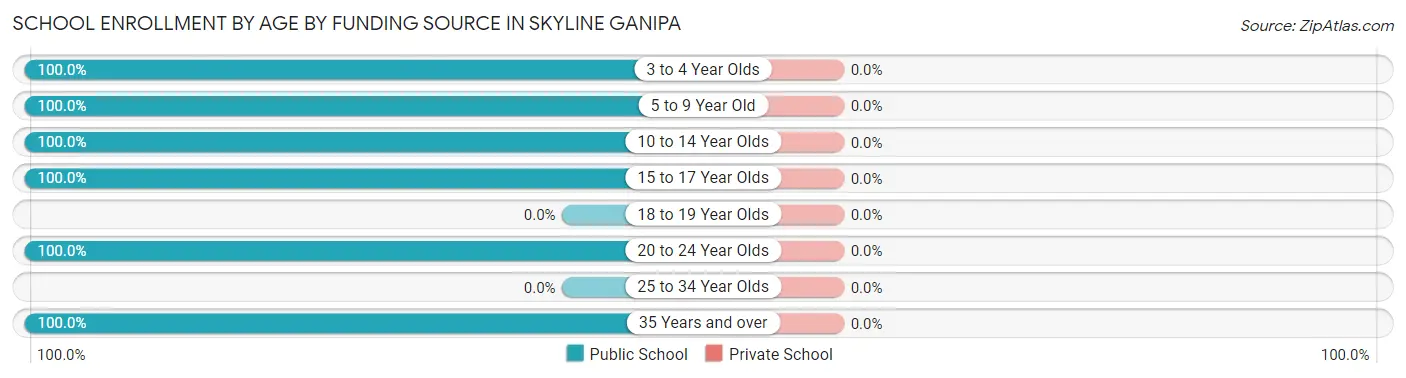
| Age Bracket | Public School | Private School |
| 3 to 4 Year Olds | 24 (100.0%) | 0 (0.0%) |
| 5 to 9 Year Old | 59 (100.0%) | 0 (0.0%) |
| 10 to 14 Year Olds | 160 (100.0%) | 0 (0.0%) |
| 15 to 17 Year Olds | 15 (100.0%) | 0 (0.0%) |
| 18 to 19 Year Olds | 0 (0.0%) | 0 (0.0%) |
| 20 to 24 Year Olds | 13 (100.0%) | 0 (0.0%) |
| 25 to 34 Year Olds | 0 (0.0%) | 0 (0.0%) |
| 35 Years and over | 19 (100.0%) | 0 (0.0%) |
| Total | 290 (100.0%) | 0 (0.0%) |
Educational Attainment by Field of Study in Skyline Ganipa
Arts & humanities (46 | 51.1%), science & technology (32 | 35.6%), business (6 | 6.7%), and education (6 | 6.7%) are the most common fields of study among 90 individuals in Skyline Ganipa who have obtained a bachelor's degree or higher.
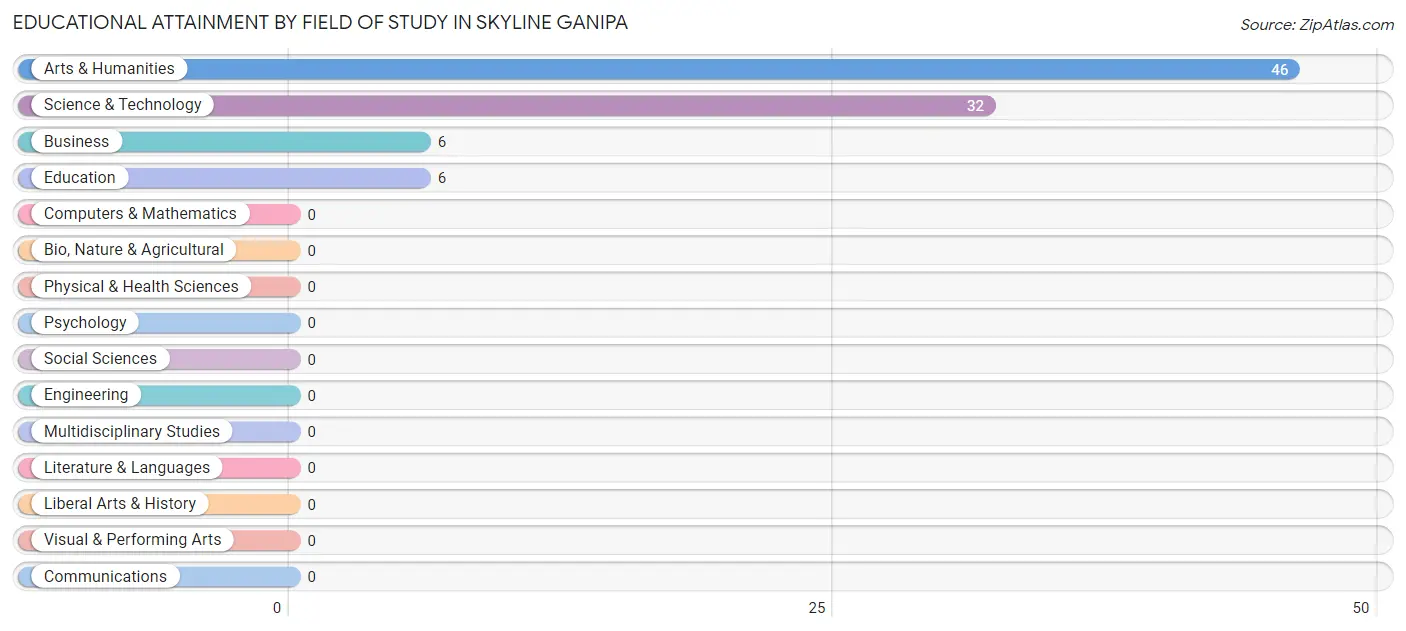
| Field of Study | # Graduates | % Graduates |
| Computers & Mathematics | 0 | 0.0% |
| Bio, Nature & Agricultural | 0 | 0.0% |
| Physical & Health Sciences | 0 | 0.0% |
| Psychology | 0 | 0.0% |
| Social Sciences | 0 | 0.0% |
| Engineering | 0 | 0.0% |
| Multidisciplinary Studies | 0 | 0.0% |
| Science & Technology | 32 | 35.6% |
| Business | 6 | 6.7% |
| Education | 6 | 6.7% |
| Literature & Languages | 0 | 0.0% |
| Liberal Arts & History | 0 | 0.0% |
| Visual & Performing Arts | 0 | 0.0% |
| Communications | 0 | 0.0% |
| Arts & Humanities | 46 | 51.1% |
| Total | 90 | 100.0% |
Transportation & Commute in Skyline Ganipa
Vehicle Availability by Sex in Skyline Ganipa
The most prevalent vehicle ownership categories in Skyline Ganipa are males with 4 vehicles (61, accounting for 38.6%) and females with 4 vehicles (60, making up 21.6%).
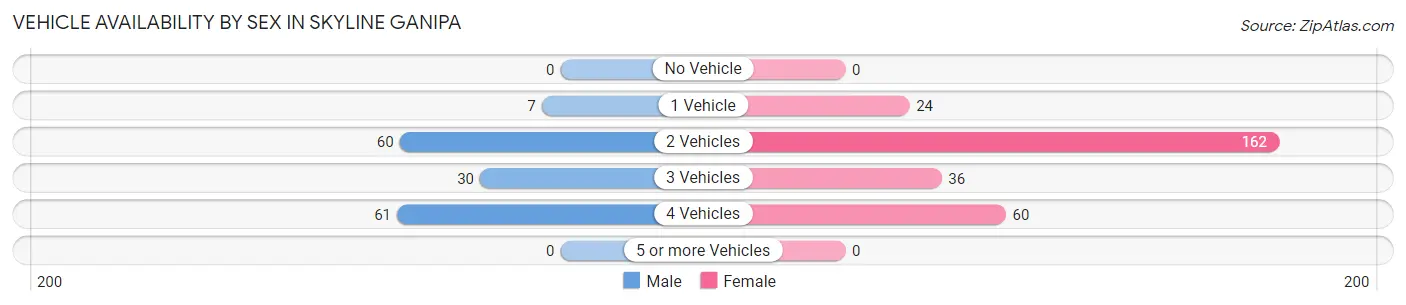
| Vehicles Available | Male | Female |
| No Vehicle | 0 (0.0%) | 0 (0.0%) |
| 1 Vehicle | 7 (4.4%) | 24 (8.5%) |
| 2 Vehicles | 60 (38.0%) | 162 (57.5%) |
| 3 Vehicles | 30 (19.0%) | 36 (12.8%) |
| 4 Vehicles | 61 (38.6%) | 60 (21.3%) |
| 5 or more Vehicles | 0 (0.0%) | 0 (0.0%) |
| Total | 158 (100.0%) | 282 (100.0%) |
Commute Time in Skyline Ganipa
The most frequently occuring commute durations in Skyline Ganipa are 15 to 19 minutes (109 commuters, 26.5%), 45 to 59 minutes (59 commuters, 14.4%), and 90 or more minutes (47 commuters, 11.4%).
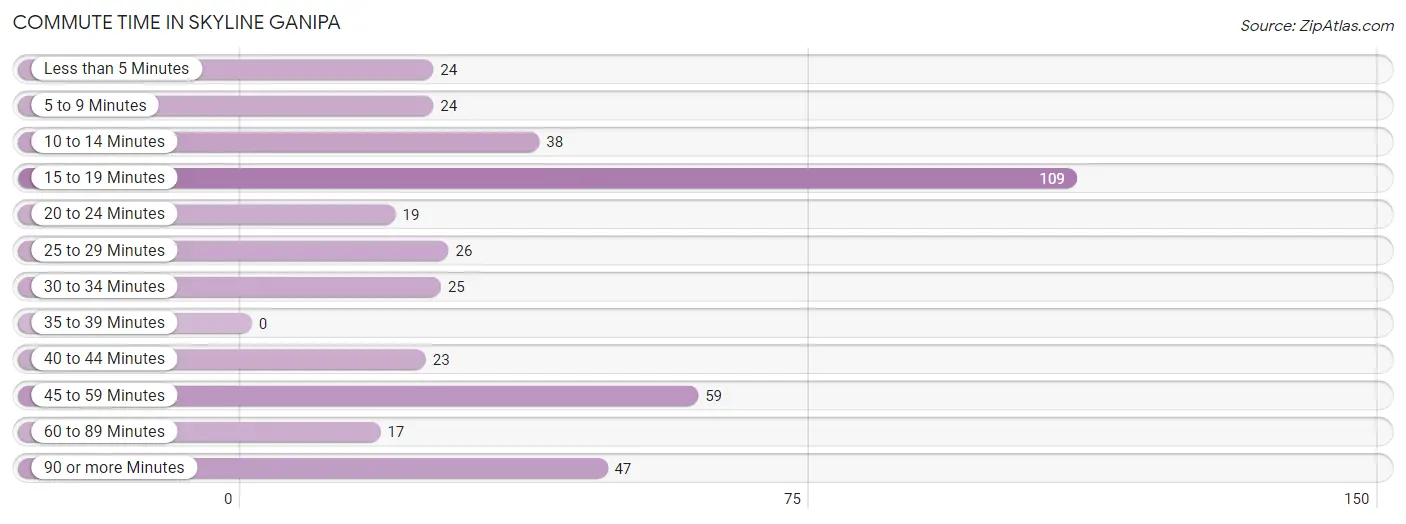
| Commute Time | # Commuters | % Commuters |
| Less than 5 Minutes | 24 | 5.8% |
| 5 to 9 Minutes | 24 | 5.8% |
| 10 to 14 Minutes | 38 | 9.2% |
| 15 to 19 Minutes | 109 | 26.5% |
| 20 to 24 Minutes | 19 | 4.6% |
| 25 to 29 Minutes | 26 | 6.3% |
| 30 to 34 Minutes | 25 | 6.1% |
| 35 to 39 Minutes | 0 | 0.0% |
| 40 to 44 Minutes | 23 | 5.6% |
| 45 to 59 Minutes | 59 | 14.4% |
| 60 to 89 Minutes | 17 | 4.1% |
| 90 or more Minutes | 47 | 11.4% |
Commute Time by Sex in Skyline Ganipa
The most common commute times in Skyline Ganipa are 15 to 19 minutes (31 commuters, 19.6%) for males and 15 to 19 minutes (78 commuters, 30.8%) for females.
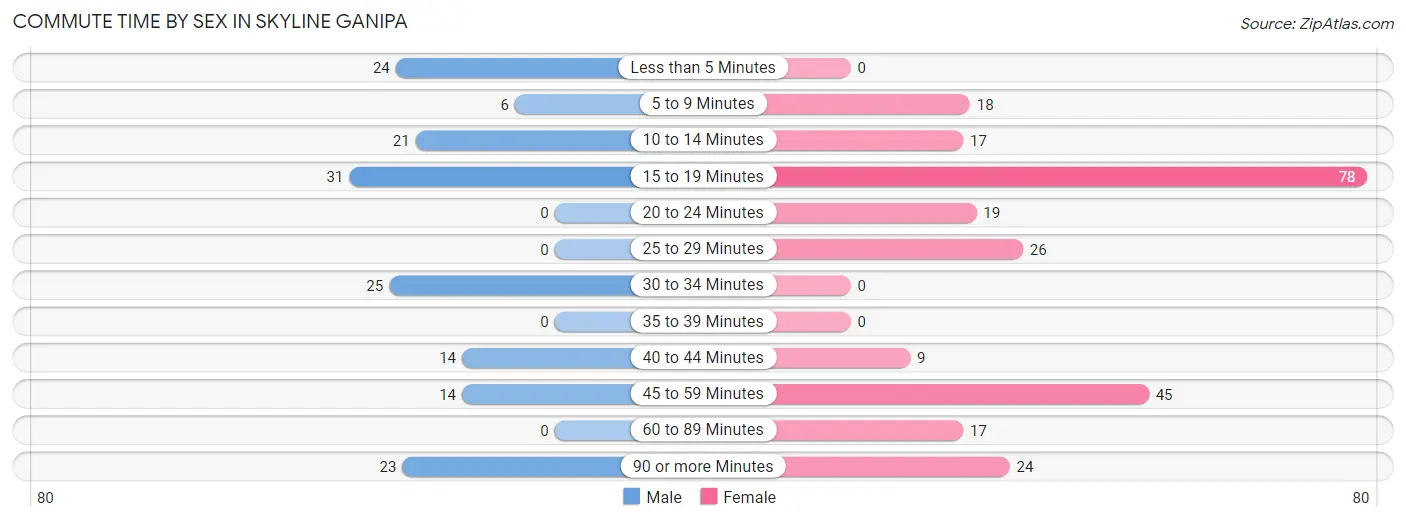
| Commute Time | Male | Female |
| Less than 5 Minutes | 24 (15.2%) | 0 (0.0%) |
| 5 to 9 Minutes | 6 (3.8%) | 18 (7.1%) |
| 10 to 14 Minutes | 21 (13.3%) | 17 (6.7%) |
| 15 to 19 Minutes | 31 (19.6%) | 78 (30.8%) |
| 20 to 24 Minutes | 0 (0.0%) | 19 (7.5%) |
| 25 to 29 Minutes | 0 (0.0%) | 26 (10.3%) |
| 30 to 34 Minutes | 25 (15.8%) | 0 (0.0%) |
| 35 to 39 Minutes | 0 (0.0%) | 0 (0.0%) |
| 40 to 44 Minutes | 14 (8.9%) | 9 (3.6%) |
| 45 to 59 Minutes | 14 (8.9%) | 45 (17.8%) |
| 60 to 89 Minutes | 0 (0.0%) | 17 (6.7%) |
| 90 or more Minutes | 23 (14.6%) | 24 (9.5%) |
Time of Departure to Work by Sex in Skyline Ganipa
The most frequent times of departure to work in Skyline Ganipa are 5:00 AM to 5:29 AM (37, 23.4%) for males and 7:30 AM to 7:59 AM (64, 25.3%) for females.
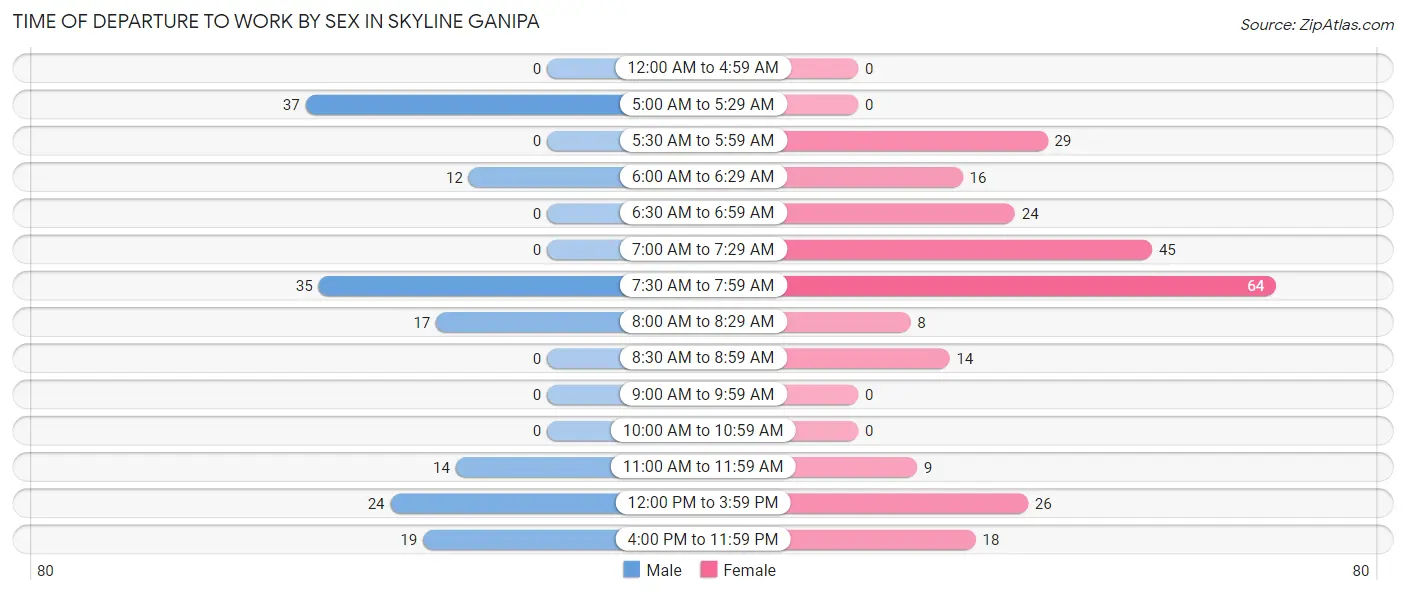
| Time of Departure | Male | Female |
| 12:00 AM to 4:59 AM | 0 (0.0%) | 0 (0.0%) |
| 5:00 AM to 5:29 AM | 37 (23.4%) | 0 (0.0%) |
| 5:30 AM to 5:59 AM | 0 (0.0%) | 29 (11.5%) |
| 6:00 AM to 6:29 AM | 12 (7.6%) | 16 (6.3%) |
| 6:30 AM to 6:59 AM | 0 (0.0%) | 24 (9.5%) |
| 7:00 AM to 7:29 AM | 0 (0.0%) | 45 (17.8%) |
| 7:30 AM to 7:59 AM | 35 (22.2%) | 64 (25.3%) |
| 8:00 AM to 8:29 AM | 17 (10.8%) | 8 (3.2%) |
| 8:30 AM to 8:59 AM | 0 (0.0%) | 14 (5.5%) |
| 9:00 AM to 9:59 AM | 0 (0.0%) | 0 (0.0%) |
| 10:00 AM to 10:59 AM | 0 (0.0%) | 0 (0.0%) |
| 11:00 AM to 11:59 AM | 14 (8.9%) | 9 (3.6%) |
| 12:00 PM to 3:59 PM | 24 (15.2%) | 26 (10.3%) |
| 4:00 PM to 11:59 PM | 19 (12.0%) | 18 (7.1%) |
| Total | 158 (100.0%) | 253 (100.0%) |
Housing Occupancy in Skyline Ganipa
Occupancy by Ownership in Skyline Ganipa
Of the total 266 dwellings in Skyline Ganipa, owner-occupied units account for 240 (90.2%), while renter-occupied units make up 26 (9.8%).
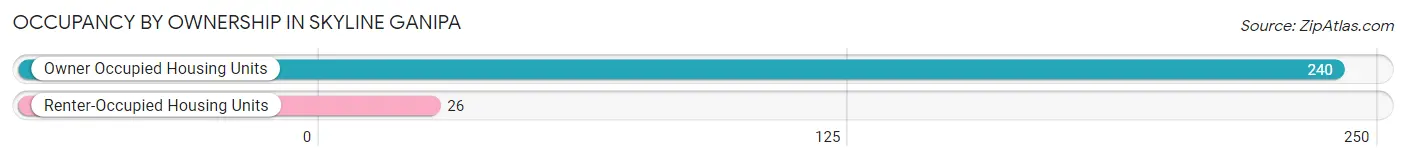
| Occupancy | # Housing Units | % Housing Units |
| Owner Occupied Housing Units | 240 | 90.2% |
| Renter-Occupied Housing Units | 26 | 9.8% |
| Total Occupied Housing Units | 266 | 100.0% |
Occupancy by Household Size in Skyline Ganipa
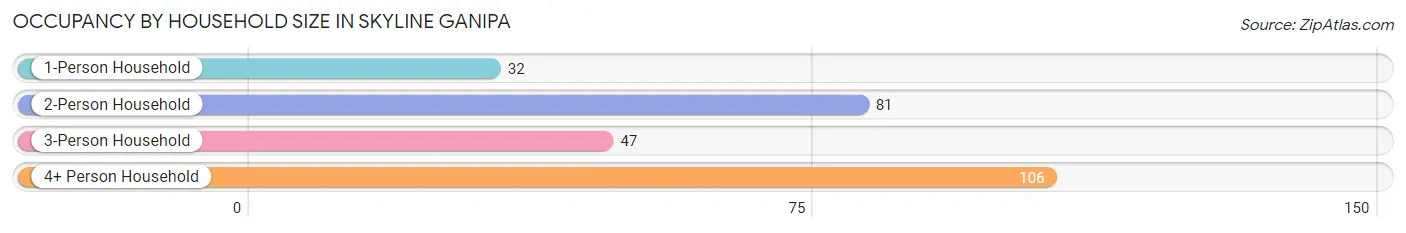
| Household Size | # Housing Units | % Housing Units |
| 1-Person Household | 32 | 12.0% |
| 2-Person Household | 81 | 30.4% |
| 3-Person Household | 47 | 17.7% |
| 4+ Person Household | 106 | 39.9% |
| Total Housing Units | 266 | 100.0% |
Occupancy by Ownership by Household Size in Skyline Ganipa
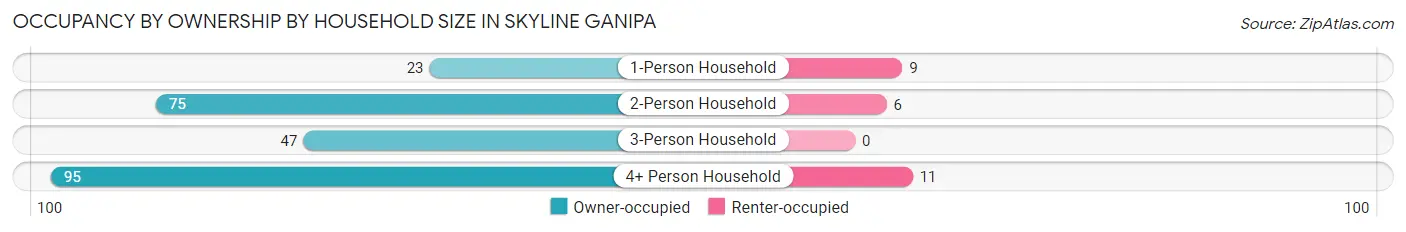
| Household Size | Owner-occupied | Renter-occupied |
| 1-Person Household | 23 (71.9%) | 9 (28.1%) |
| 2-Person Household | 75 (92.6%) | 6 (7.4%) |
| 3-Person Household | 47 (100.0%) | 0 (0.0%) |
| 4+ Person Household | 95 (89.6%) | 11 (10.4%) |
| Total Housing Units | 240 (90.2%) | 26 (9.8%) |
Occupancy by Educational Attainment in Skyline Ganipa
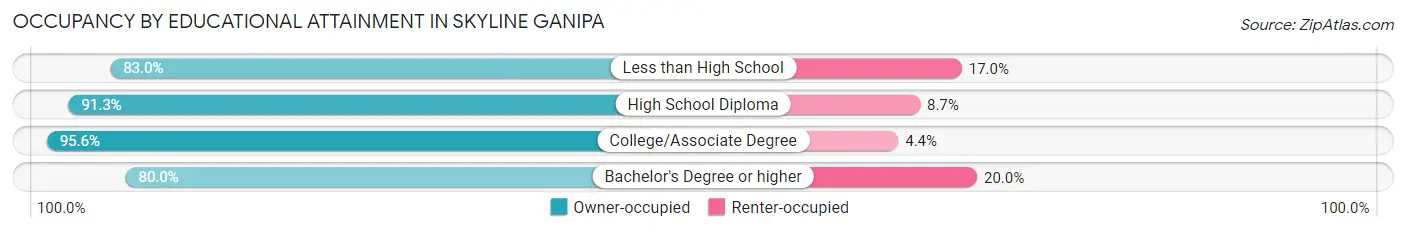
| Household Size | Owner-occupied | Renter-occupied |
| Less than High School | 44 (83.0%) | 9 (17.0%) |
| High School Diploma | 63 (91.3%) | 6 (8.7%) |
| College/Associate Degree | 109 (95.6%) | 5 (4.4%) |
| Bachelor's Degree or higher | 24 (80.0%) | 6 (20.0%) |
Occupancy by Age of Householder in Skyline Ganipa
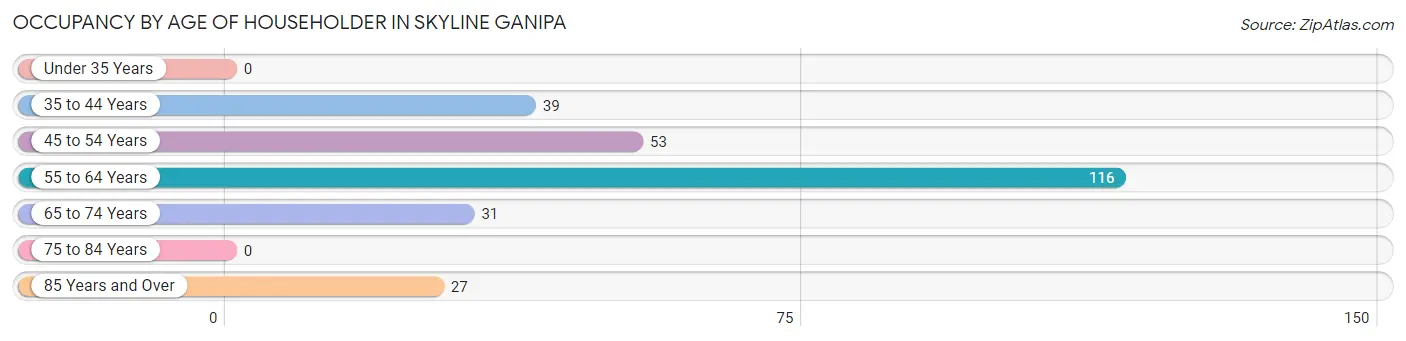
| Age Bracket | # Households | % Households |
| Under 35 Years | 0 | 0.0% |
| 35 to 44 Years | 39 | 14.7% |
| 45 to 54 Years | 53 | 19.9% |
| 55 to 64 Years | 116 | 43.6% |
| 65 to 74 Years | 31 | 11.7% |
| 75 to 84 Years | 0 | 0.0% |
| 85 Years and Over | 27 | 10.2% |
| Total | 266 | 100.0% |
Housing Finances in Skyline Ganipa
Median Income by Occupancy in Skyline Ganipa
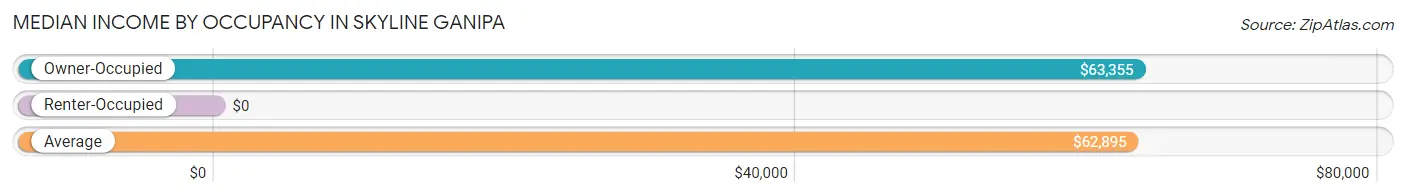
| Occupancy Type | # Households | Median Income |
| Owner-Occupied | 240 (90.2%) | $63,355 |
| Renter-Occupied | 26 (9.8%) | $0 |
| Average | 266 (100.0%) | $62,895 |
Occupancy by Householder Income Bracket in Skyline Ganipa
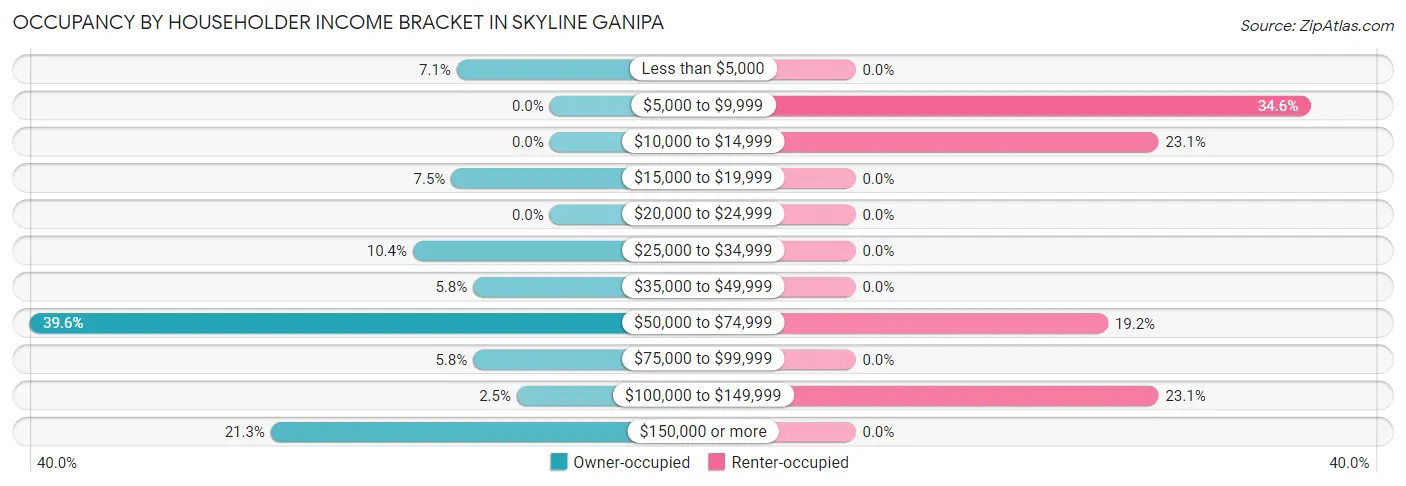
| Income Bracket | Owner-occupied | Renter-occupied |
| Less than $5,000 | 17 (7.1%) | 0 (0.0%) |
| $5,000 to $9,999 | 0 (0.0%) | 9 (34.6%) |
| $10,000 to $14,999 | 0 (0.0%) | 6 (23.1%) |
| $15,000 to $19,999 | 18 (7.5%) | 0 (0.0%) |
| $20,000 to $24,999 | 0 (0.0%) | 0 (0.0%) |
| $25,000 to $34,999 | 25 (10.4%) | 0 (0.0%) |
| $35,000 to $49,999 | 14 (5.8%) | 0 (0.0%) |
| $50,000 to $74,999 | 95 (39.6%) | 5 (19.2%) |
| $75,000 to $99,999 | 14 (5.8%) | 0 (0.0%) |
| $100,000 to $149,999 | 6 (2.5%) | 6 (23.1%) |
| $150,000 or more | 51 (21.2%) | 0 (0.0%) |
| Total | 240 (100.0%) | 26 (100.0%) |
Monthly Housing Cost Tiers in Skyline Ganipa
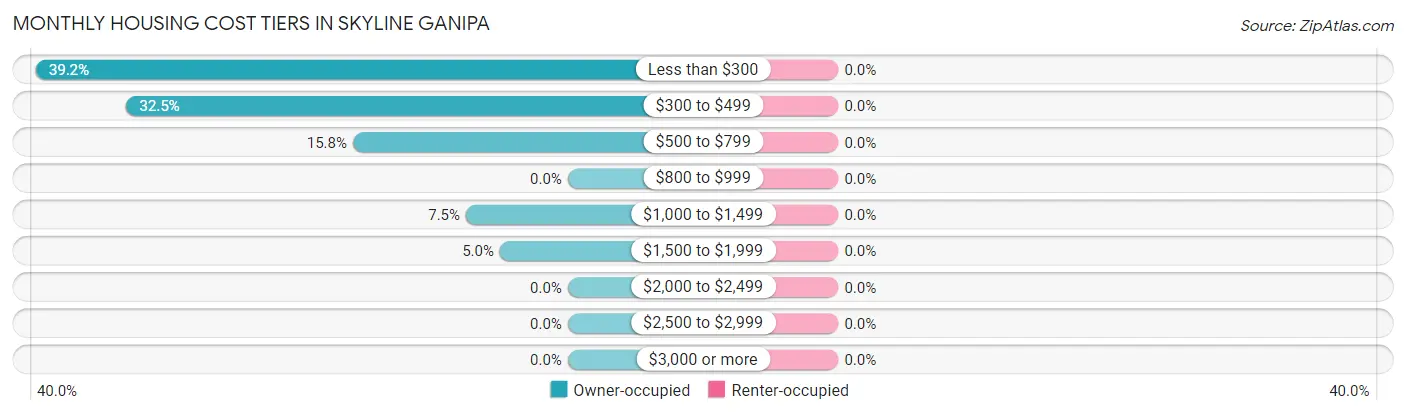
| Monthly Cost | Owner-occupied | Renter-occupied |
| Less than $300 | 94 (39.2%) | 0 (0.0%) |
| $300 to $499 | 78 (32.5%) | 0 (0.0%) |
| $500 to $799 | 38 (15.8%) | 0 (0.0%) |
| $800 to $999 | 0 (0.0%) | 0 (0.0%) |
| $1,000 to $1,499 | 18 (7.5%) | 0 (0.0%) |
| $1,500 to $1,999 | 12 (5.0%) | 0 (0.0%) |
| $2,000 to $2,499 | 0 (0.0%) | 0 (0.0%) |
| $2,500 to $2,999 | 0 (0.0%) | 0 (0.0%) |
| $3,000 or more | 0 (0.0%) | 0 (0.0%) |
| Total | 240 (100.0%) | 26 (100.0%) |
Physical Housing Characteristics in Skyline Ganipa
Housing Structures in Skyline Ganipa
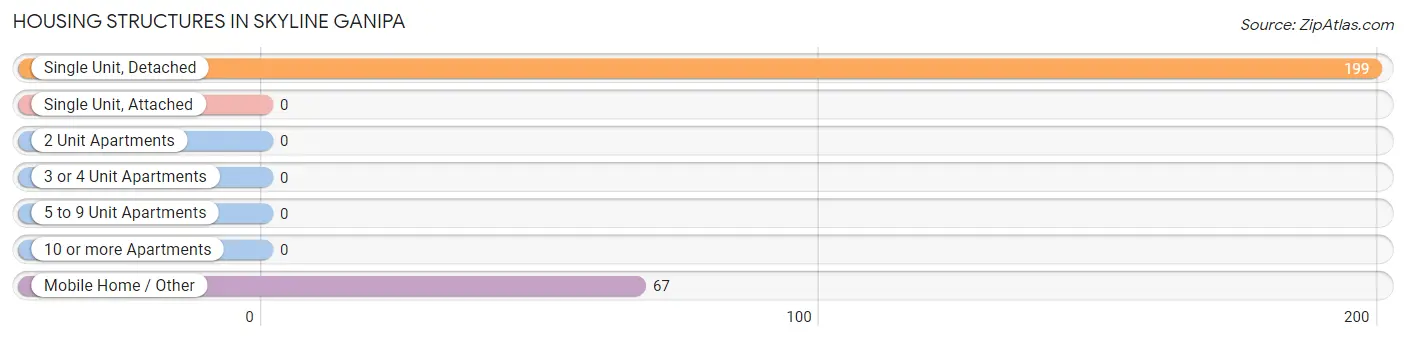
| Structure Type | # Housing Units | % Housing Units |
| Single Unit, Detached | 199 | 74.8% |
| Single Unit, Attached | 0 | 0.0% |
| 2 Unit Apartments | 0 | 0.0% |
| 3 or 4 Unit Apartments | 0 | 0.0% |
| 5 to 9 Unit Apartments | 0 | 0.0% |
| 10 or more Apartments | 0 | 0.0% |
| Mobile Home / Other | 67 | 25.2% |
| Total | 266 | 100.0% |
Housing Structures by Occupancy in Skyline Ganipa
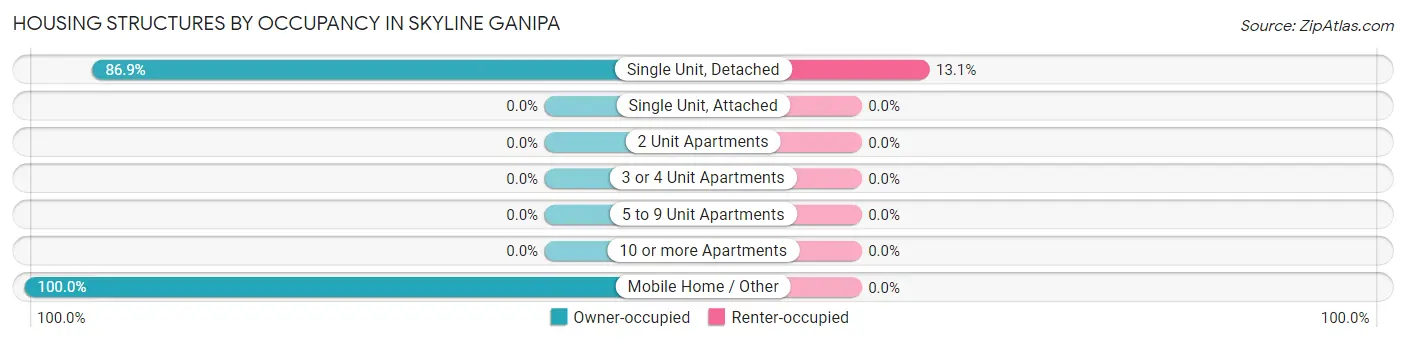
| Structure Type | Owner-occupied | Renter-occupied |
| Single Unit, Detached | 173 (86.9%) | 26 (13.1%) |
| Single Unit, Attached | 0 (0.0%) | 0 (0.0%) |
| 2 Unit Apartments | 0 (0.0%) | 0 (0.0%) |
| 3 or 4 Unit Apartments | 0 (0.0%) | 0 (0.0%) |
| 5 to 9 Unit Apartments | 0 (0.0%) | 0 (0.0%) |
| 10 or more Apartments | 0 (0.0%) | 0 (0.0%) |
| Mobile Home / Other | 67 (100.0%) | 0 (0.0%) |
| Total | 240 (90.2%) | 26 (9.8%) |
Housing Structures by Number of Rooms in Skyline Ganipa
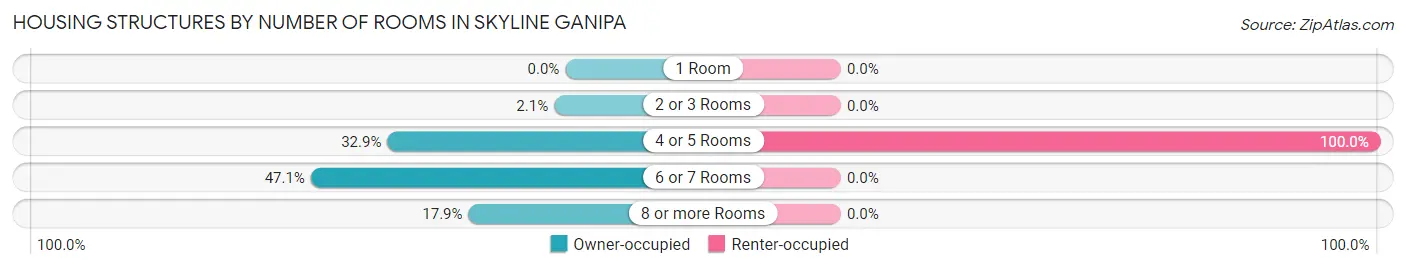
| Number of Rooms | Owner-occupied | Renter-occupied |
| 1 Room | 0 (0.0%) | 0 (0.0%) |
| 2 or 3 Rooms | 5 (2.1%) | 0 (0.0%) |
| 4 or 5 Rooms | 79 (32.9%) | 26 (100.0%) |
| 6 or 7 Rooms | 113 (47.1%) | 0 (0.0%) |
| 8 or more Rooms | 43 (17.9%) | 0 (0.0%) |
| Total | 240 (100.0%) | 26 (100.0%) |
Housing Structure by Heating Type in Skyline Ganipa
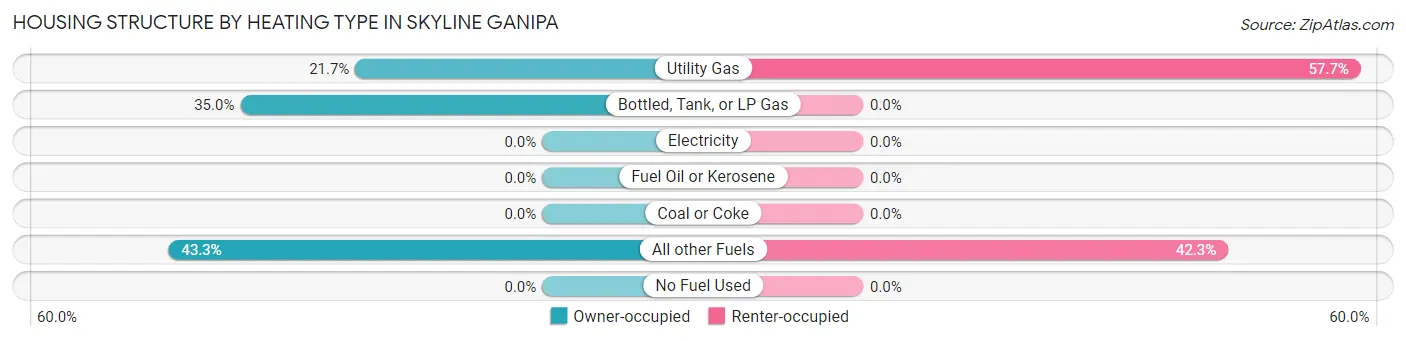
| Heating Type | Owner-occupied | Renter-occupied |
| Utility Gas | 52 (21.7%) | 15 (57.7%) |
| Bottled, Tank, or LP Gas | 84 (35.0%) | 0 (0.0%) |
| Electricity | 0 (0.0%) | 0 (0.0%) |
| Fuel Oil or Kerosene | 0 (0.0%) | 0 (0.0%) |
| Coal or Coke | 0 (0.0%) | 0 (0.0%) |
| All other Fuels | 104 (43.3%) | 11 (42.3%) |
| No Fuel Used | 0 (0.0%) | 0 (0.0%) |
| Total | 240 (100.0%) | 26 (100.0%) |
Household Vehicle Usage in Skyline Ganipa
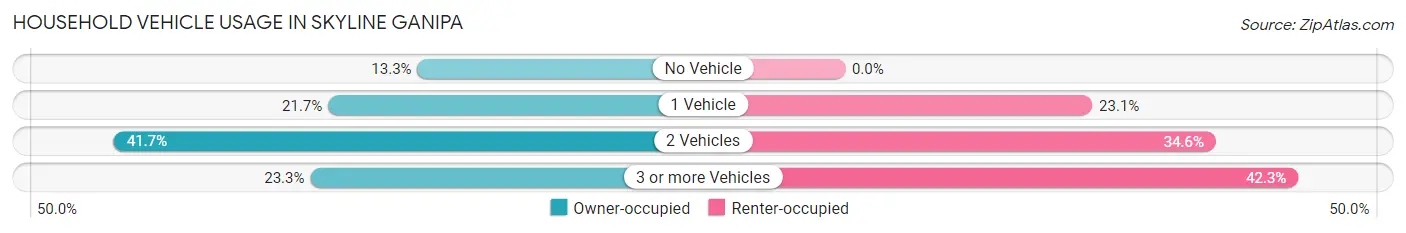
| Vehicles per Household | Owner-occupied | Renter-occupied |
| No Vehicle | 32 (13.3%) | 0 (0.0%) |
| 1 Vehicle | 52 (21.7%) | 6 (23.1%) |
| 2 Vehicles | 100 (41.7%) | 9 (34.6%) |
| 3 or more Vehicles | 56 (23.3%) | 11 (42.3%) |
| Total | 240 (100.0%) | 26 (100.0%) |
Real Estate & Mortgages in Skyline Ganipa
Real Estate and Mortgage Overview in Skyline Ganipa
| Characteristic | Without Mortgage | With Mortgage |
| Housing Units | 202 | 38 |
| Median Property Value | $59,000 | $112,500 |
| Median Household Income | $63,289 | $6 |
| Monthly Housing Costs | $307 | $0 |
| Real Estate Taxes | - | - |
Property Value by Mortgage Status in Skyline Ganipa
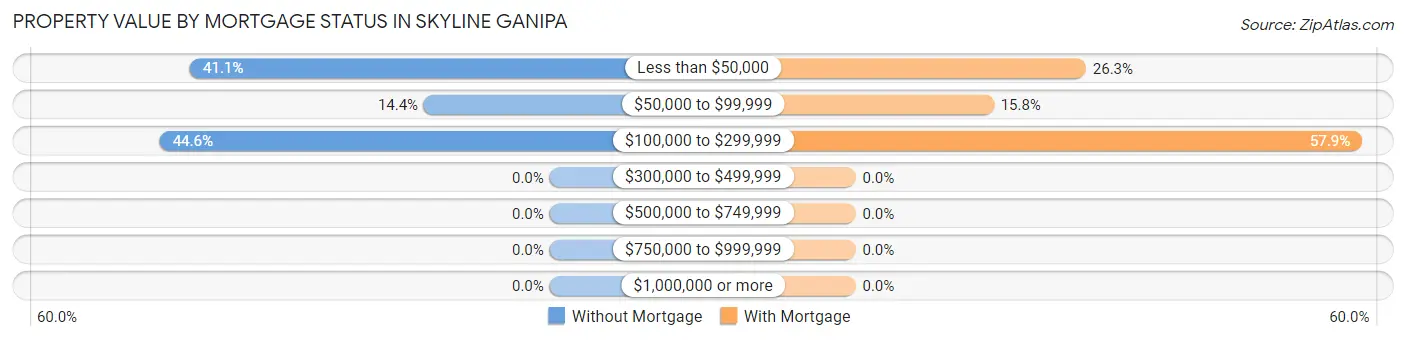
| Property Value | Without Mortgage | With Mortgage |
| Less than $50,000 | 83 (41.1%) | 10 (26.3%) |
| $50,000 to $99,999 | 29 (14.4%) | 6 (15.8%) |
| $100,000 to $299,999 | 90 (44.6%) | 22 (57.9%) |
| $300,000 to $499,999 | 0 (0.0%) | 0 (0.0%) |
| $500,000 to $749,999 | 0 (0.0%) | 0 (0.0%) |
| $750,000 to $999,999 | 0 (0.0%) | 0 (0.0%) |
| $1,000,000 or more | 0 (0.0%) | 0 (0.0%) |
| Total | 202 (100.0%) | 38 (100.0%) |
Household Income by Mortgage Status in Skyline Ganipa
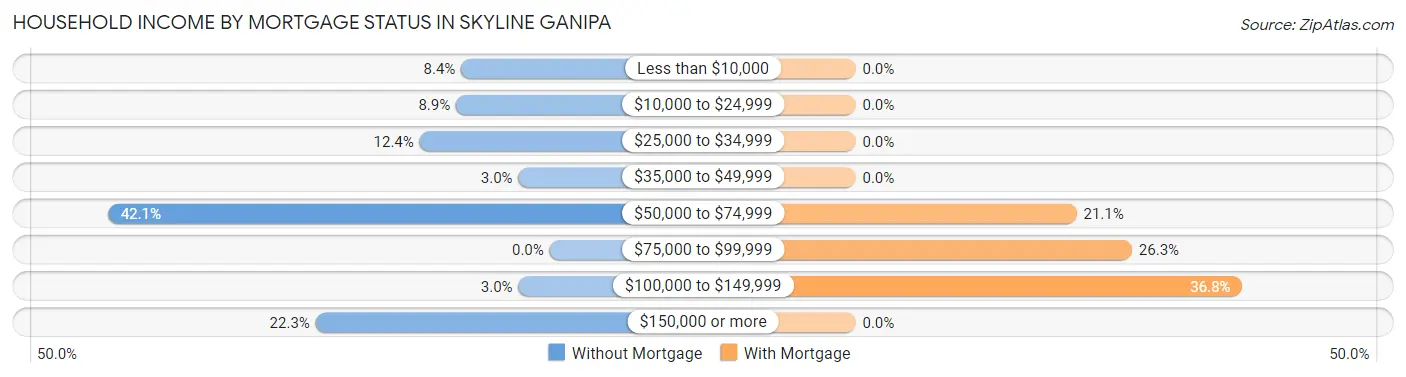
| Household Income | Without Mortgage | With Mortgage |
| Less than $10,000 | 17 (8.4%) | 0 (0.0%) |
| $10,000 to $24,999 | 18 (8.9%) | 0 (0.0%) |
| $25,000 to $34,999 | 25 (12.4%) | 0 (0.0%) |
| $35,000 to $49,999 | 6 (3.0%) | 0 (0.0%) |
| $50,000 to $74,999 | 85 (42.1%) | 8 (21.0%) |
| $75,000 to $99,999 | 0 (0.0%) | 10 (26.3%) |
| $100,000 to $149,999 | 6 (3.0%) | 14 (36.8%) |
| $150,000 or more | 45 (22.3%) | 0 (0.0%) |
| Total | 202 (100.0%) | 38 (100.0%) |
Property Value to Household Income Ratio in Skyline Ganipa
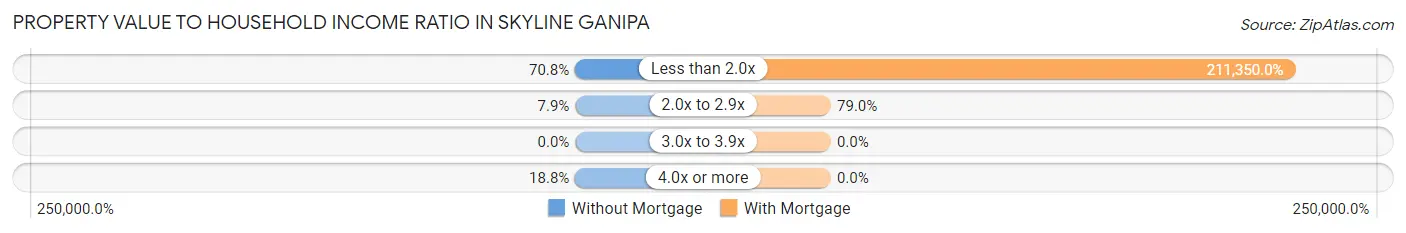
| Value-to-Income Ratio | Without Mortgage | With Mortgage |
| Less than 2.0x | 143 (70.8%) | 80,313 (211,350.0%) |
| 2.0x to 2.9x | 16 (7.9%) | 30 (78.9%) |
| 3.0x to 3.9x | 0 (0.0%) | 0 (0.0%) |
| 4.0x or more | 38 (18.8%) | 0 (0.0%) |
| Total | 202 (100.0%) | 38 (100.0%) |
Real Estate Taxes by Mortgage Status in Skyline Ganipa
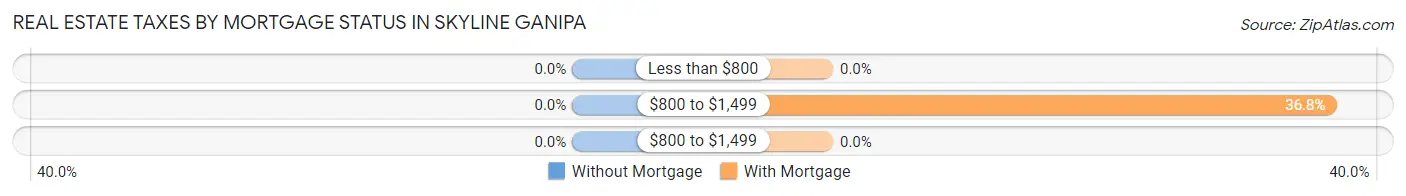
| Property Taxes | Without Mortgage | With Mortgage |
| Less than $800 | 0 (0.0%) | 0 (0.0%) |
| $800 to $1,499 | 0 (0.0%) | 14 (36.8%) |
| $800 to $1,499 | 0 (0.0%) | 0 (0.0%) |
| Total | 202 (100.0%) | 38 (100.0%) |
Health & Disability in Skyline Ganipa
Health Insurance Coverage by Age in Skyline Ganipa
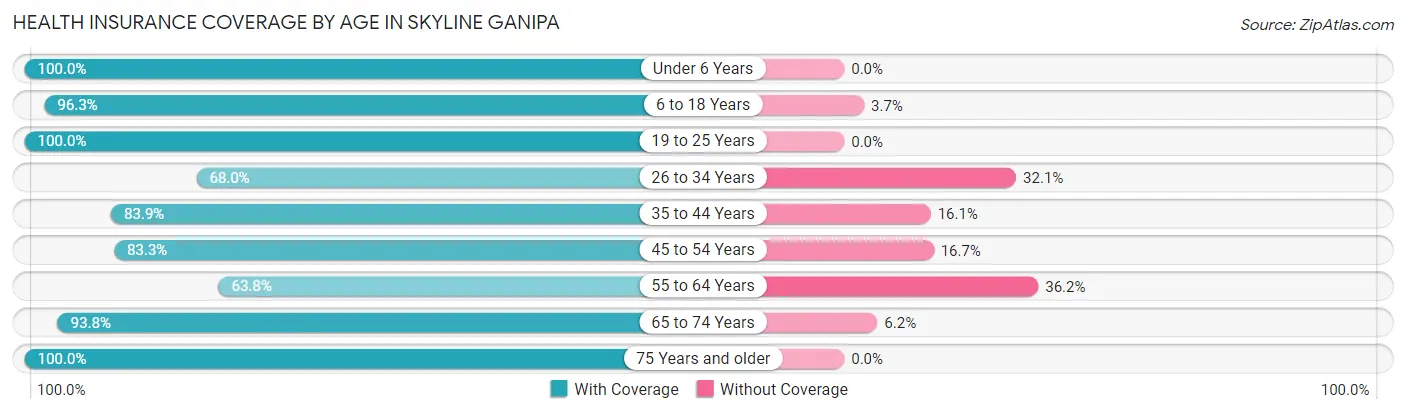
| Age Bracket | With Coverage | Without Coverage |
| Under 6 Years | 69 (100.0%) | 0 (0.0%) |
| 6 to 18 Years | 234 (96.3%) | 9 (3.7%) |
| 19 to 25 Years | 90 (100.0%) | 0 (0.0%) |
| 26 to 34 Years | 53 (67.9%) | 25 (32.1%) |
| 35 to 44 Years | 125 (83.9%) | 24 (16.1%) |
| 45 to 54 Years | 125 (83.3%) | 25 (16.7%) |
| 55 to 64 Years | 97 (63.8%) | 55 (36.2%) |
| 65 to 74 Years | 76 (93.8%) | 5 (6.2%) |
| 75 Years and older | 120 (100.0%) | 0 (0.0%) |
| Total | 989 (87.4%) | 143 (12.6%) |
Health Insurance Coverage by Citizenship Status in Skyline Ganipa
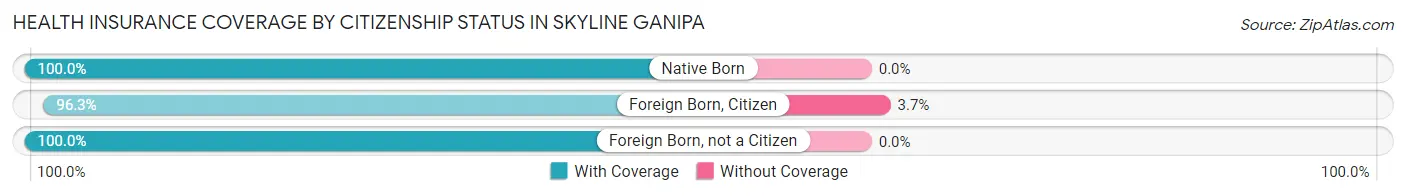
| Citizenship Status | With Coverage | Without Coverage |
| Native Born | 69 (100.0%) | 0 (0.0%) |
| Foreign Born, Citizen | 234 (96.3%) | 9 (3.7%) |
| Foreign Born, not a Citizen | 90 (100.0%) | 0 (0.0%) |
Health Insurance Coverage by Household Income in Skyline Ganipa
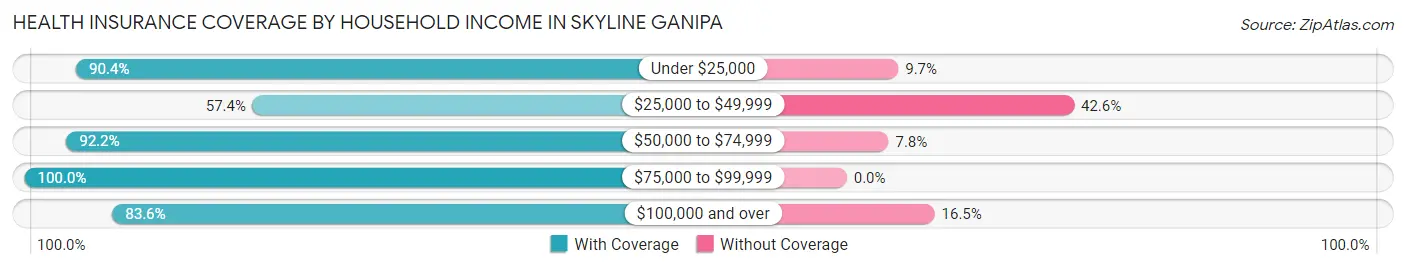
| Household Income | With Coverage | Without Coverage |
| Under $25,000 | 103 (90.3%) | 11 (9.7%) |
| $25,000 to $49,999 | 58 (57.4%) | 43 (42.6%) |
| $50,000 to $74,999 | 460 (92.2%) | 39 (7.8%) |
| $75,000 to $99,999 | 114 (100.0%) | 0 (0.0%) |
| $100,000 and over | 254 (83.6%) | 50 (16.5%) |
Public vs Private Health Insurance Coverage by Age in Skyline Ganipa
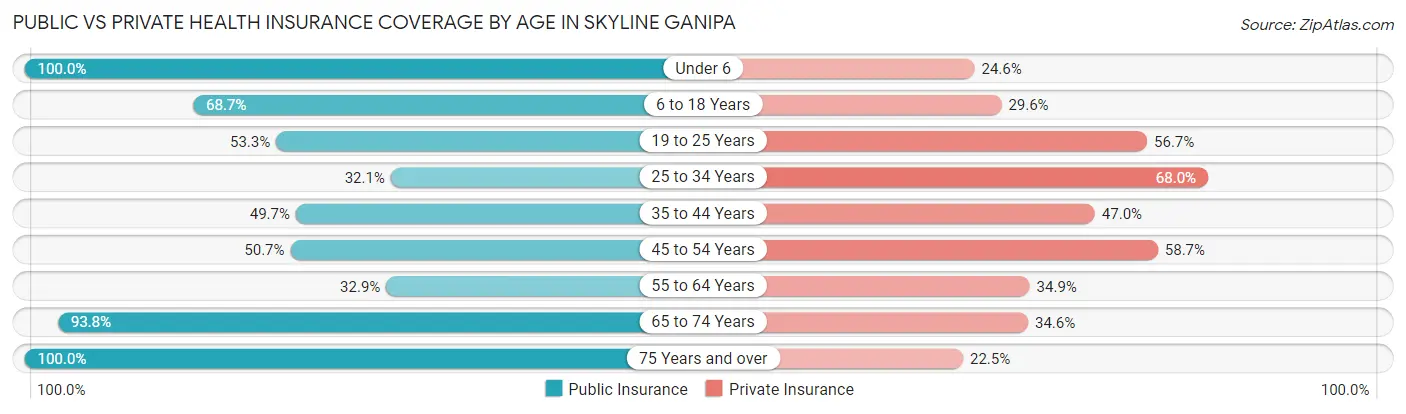
| Age Bracket | Public Insurance | Private Insurance |
| Under 6 | 69 (100.0%) | 17 (24.6%) |
| 6 to 18 Years | 167 (68.7%) | 72 (29.6%) |
| 19 to 25 Years | 48 (53.3%) | 51 (56.7%) |
| 25 to 34 Years | 25 (32.1%) | 53 (67.9%) |
| 35 to 44 Years | 74 (49.7%) | 70 (47.0%) |
| 45 to 54 Years | 76 (50.7%) | 88 (58.7%) |
| 55 to 64 Years | 50 (32.9%) | 53 (34.9%) |
| 65 to 74 Years | 76 (93.8%) | 28 (34.6%) |
| 75 Years and over | 120 (100.0%) | 27 (22.5%) |
| Total | 705 (62.3%) | 459 (40.6%) |
Disability Status by Sex by Age in Skyline Ganipa
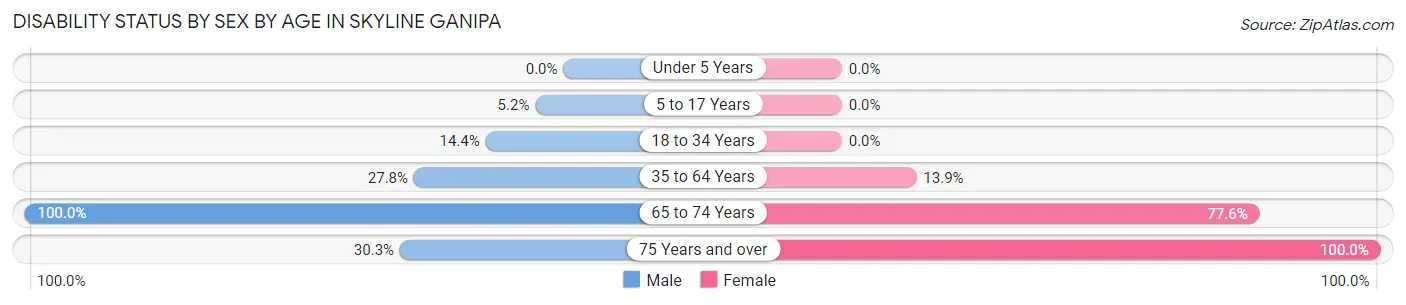
| Age Bracket | Male | Female |
| Under 5 Years | 0 (0.0%) | 0 (0.0%) |
| 5 to 17 Years | 6 (5.2%) | 0 (0.0%) |
| 18 to 34 Years | 13 (14.4%) | 0 (0.0%) |
| 35 to 64 Years | 53 (27.8%) | 36 (13.9%) |
| 65 to 74 Years | 32 (100.0%) | 38 (77.5%) |
| 75 Years and over | 27 (30.3%) | 31 (100.0%) |
Disability Class by Sex by Age in Skyline Ganipa
Disability Class: Hearing Difficulty
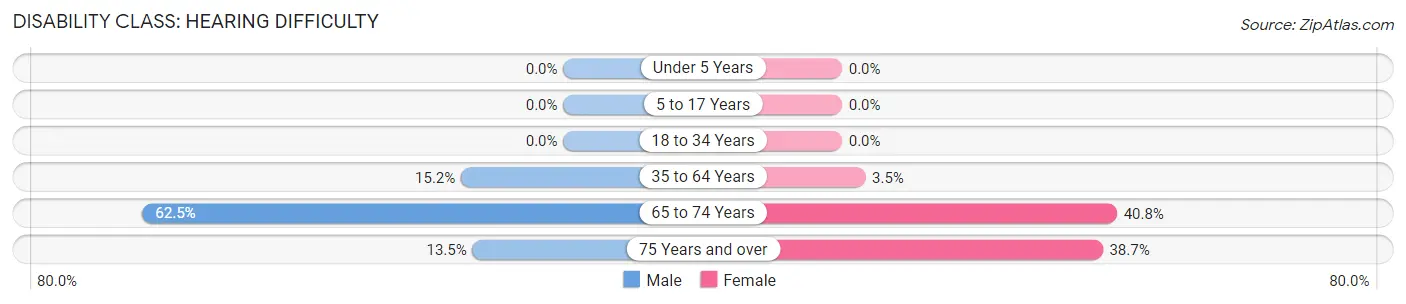
| Age Bracket | Male | Female |
| Under 5 Years | 0 (0.0%) | 0 (0.0%) |
| 5 to 17 Years | 0 (0.0%) | 0 (0.0%) |
| 18 to 34 Years | 0 (0.0%) | 0 (0.0%) |
| 35 to 64 Years | 29 (15.2%) | 9 (3.5%) |
| 65 to 74 Years | 20 (62.5%) | 20 (40.8%) |
| 75 Years and over | 12 (13.5%) | 12 (38.7%) |
Disability Class: Vision Difficulty
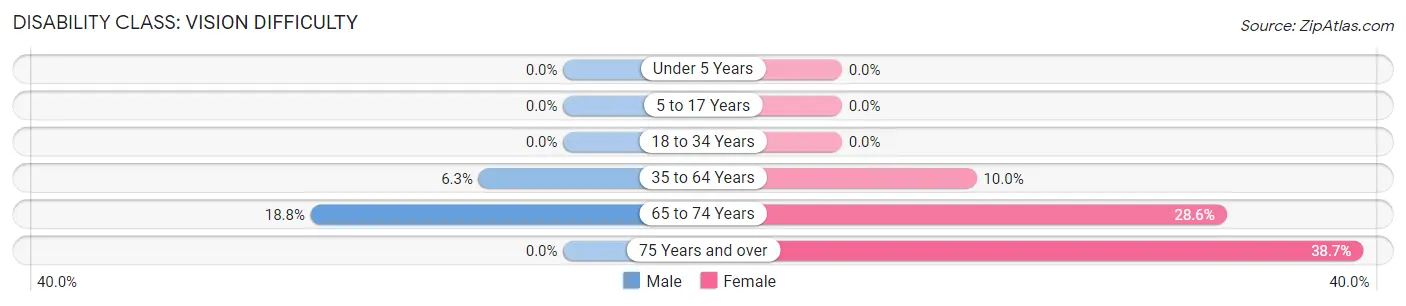
| Age Bracket | Male | Female |
| Under 5 Years | 0 (0.0%) | 0 (0.0%) |
| 5 to 17 Years | 0 (0.0%) | 0 (0.0%) |
| 18 to 34 Years | 0 (0.0%) | 0 (0.0%) |
| 35 to 64 Years | 12 (6.3%) | 26 (10.0%) |
| 65 to 74 Years | 6 (18.8%) | 14 (28.6%) |
| 75 Years and over | 0 (0.0%) | 12 (38.7%) |
Disability Class: Cognitive Difficulty
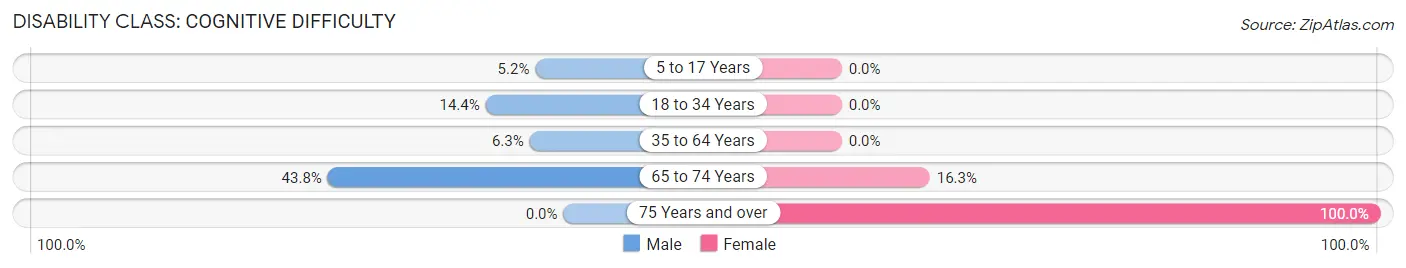
| Age Bracket | Male | Female |
| 5 to 17 Years | 6 (5.2%) | 0 (0.0%) |
| 18 to 34 Years | 13 (14.4%) | 0 (0.0%) |
| 35 to 64 Years | 12 (6.3%) | 0 (0.0%) |
| 65 to 74 Years | 14 (43.8%) | 8 (16.3%) |
| 75 Years and over | 0 (0.0%) | 31 (100.0%) |
Disability Class: Ambulatory Difficulty
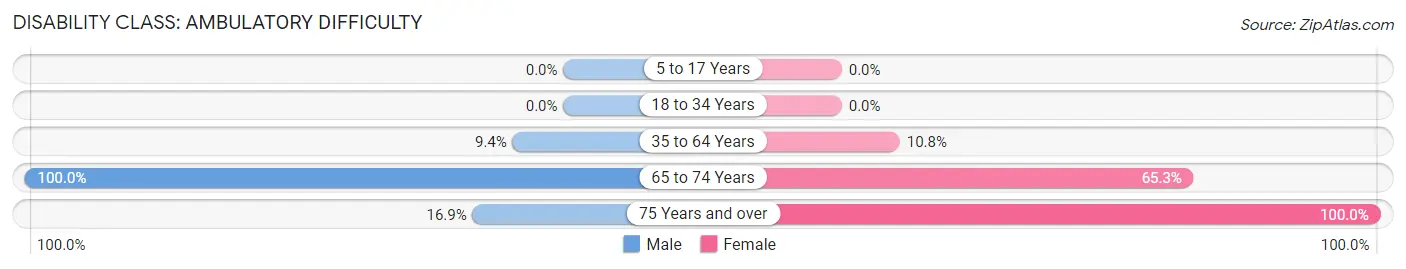
| Age Bracket | Male | Female |
| 5 to 17 Years | 0 (0.0%) | 0 (0.0%) |
| 18 to 34 Years | 0 (0.0%) | 0 (0.0%) |
| 35 to 64 Years | 18 (9.4%) | 28 (10.8%) |
| 65 to 74 Years | 32 (100.0%) | 32 (65.3%) |
| 75 Years and over | 15 (16.9%) | 31 (100.0%) |
Disability Class: Self-Care Difficulty
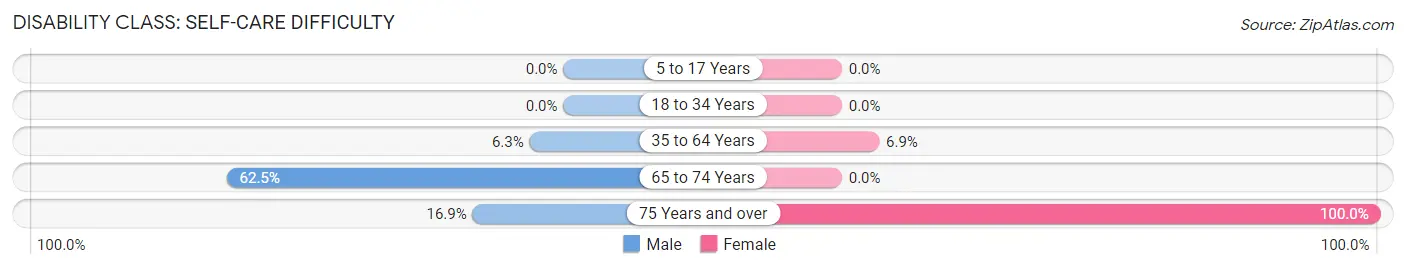
| Age Bracket | Male | Female |
| 5 to 17 Years | 0 (0.0%) | 0 (0.0%) |
| 18 to 34 Years | 0 (0.0%) | 0 (0.0%) |
| 35 to 64 Years | 12 (6.3%) | 18 (6.9%) |
| 65 to 74 Years | 20 (62.5%) | 0 (0.0%) |
| 75 Years and over | 15 (16.9%) | 31 (100.0%) |
Technology Access in Skyline Ganipa
Computing Device Access in Skyline Ganipa
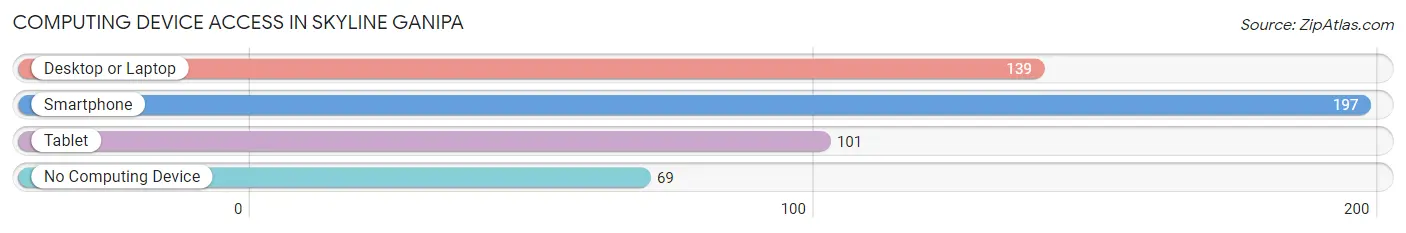
| Device Type | # Households | % Households |
| Desktop or Laptop | 139 | 52.3% |
| Smartphone | 197 | 74.1% |
| Tablet | 101 | 38.0% |
| No Computing Device | 69 | 25.9% |
| Total | 266 | 100.0% |
Internet Access in Skyline Ganipa
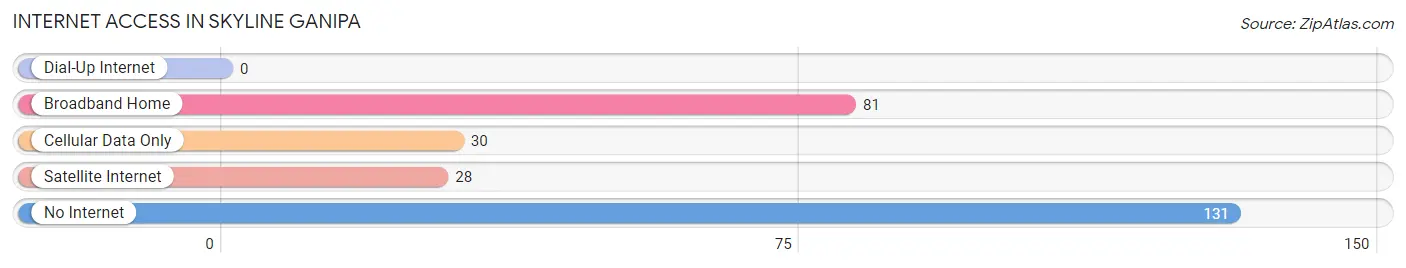
| Internet Type | # Households | % Households |
| Dial-Up Internet | 0 | 0.0% |
| Broadband Home | 81 | 30.4% |
| Cellular Data Only | 30 | 11.3% |
| Satellite Internet | 28 | 10.5% |
| No Internet | 131 | 49.2% |
| Total | 266 | 100.0% |
Skyline Ganipa Summary
Skyline Ganipa, New Mexico is a small town located in the northwest corner of the state, near the Arizona border. It is situated in the high desert of the Four Corners region, and is surrounded by the Navajo Nation, the Zuni Pueblo, and the Hopi Reservation. Skyline Ganipa is a rural community with a population of just over 1,000 people, and is the only incorporated town in the area.
History
Skyline Ganipa was founded in the late 1800s by a group of Navajo and Zuni people who were looking for a place to settle and raise their families. The town was originally called “Ganipa”, which means “place of the sun” in the Navajo language. The name was changed to Skyline Ganipa in the early 1900s when the town was incorporated.
The town was originally a farming and ranching community, and the local economy was largely based on the production of wool and other livestock products. In the early 1900s, the town began to grow as a trading center for the surrounding area. The town was also home to a number of small businesses, including a general store, a blacksmith, and a saloon.
Geography
Skyline Ganipa is located in the high desert of the Four Corners region, and is surrounded by the Navajo Nation, the Zuni Pueblo, and the Hopi Reservation. The town is situated at an elevation of 5,000 feet, and is surrounded by the Chuska Mountains to the east and the San Juan Mountains to the west. The town is located approximately 30 miles from Gallup, New Mexico, and is about a two-hour drive from Albuquerque.
Economy
The economy of Skyline Ganipa is largely based on agriculture and ranching. The town is home to a number of small farms and ranches, and the local economy is supported by the production of wool, beef, and other livestock products. The town is also home to a number of small businesses, including a general store, a blacksmith, and a saloon.
Demographics
As of the 2010 census, the population of Skyline Ganipa was 1,072. The town is predominantly Native American, with the majority of the population being Navajo (63.3%) and Zuni (25.2%). The town also has a small Hispanic population (7.2%), as well as a small population of White (2.7%) and African American (1.6%) residents. The median household income in Skyline Ganipa is $25,000, and the median age is 33.
Common Questions
What is Per Capita Income in Skyline Ganipa?
Per Capita income in Skyline Ganipa is $26,100.
What is the Median Family Income in Skyline Ganipa?
Median Family Income in Skyline Ganipa is $63,259.
What is the Median Household income in Skyline Ganipa?
Median Household Income in Skyline Ganipa is $62,895.
What is Income or Wage Gap in Skyline Ganipa?
Income or Wage Gap in Skyline Ganipa is 15.2%.
Women in Skyline Ganipa earn 84.8 cents for every dollar earned by a man.
What is Inequality or Gini Index in Skyline Ganipa?
Inequality or Gini Index in Skyline Ganipa is 0.46.
What is the Total Population of Skyline Ganipa?
Total Population of Skyline Ganipa is 1,132.
What is the Total Male Population of Skyline Ganipa?
Total Male Population of Skyline Ganipa is 543.
What is the Total Female Population of Skyline Ganipa?
Total Female Population of Skyline Ganipa is 589.
What is the Ratio of Males per 100 Females in Skyline Ganipa?
There are 92.19 Males per 100 Females in Skyline Ganipa.
What is the Ratio of Females per 100 Males in Skyline Ganipa?
There are 108.47 Females per 100 Males in Skyline Ganipa.
What is the Median Population Age in Skyline Ganipa?
Median Population Age in Skyline Ganipa is 39.3 Years.
What is the Average Family Size in Skyline Ganipa
Average Family Size in Skyline Ganipa is 4.7 People.
What is the Average Household Size in Skyline Ganipa
Average Household Size in Skyline Ganipa is 4.3 People.
How Large is the Labor Force in Skyline Ganipa?
There are 475 People in the Labor Forcein in Skyline Ganipa.
What is the Percentage of People in the Labor Force in Skyline Ganipa?
56.3% of People are in the Labor Force in Skyline Ganipa.
What is the Unemployment Rate in Skyline Ganipa?
Unemployment Rate in Skyline Ganipa is 5.3%.