Taos Pueblo, NM Map & Demographics
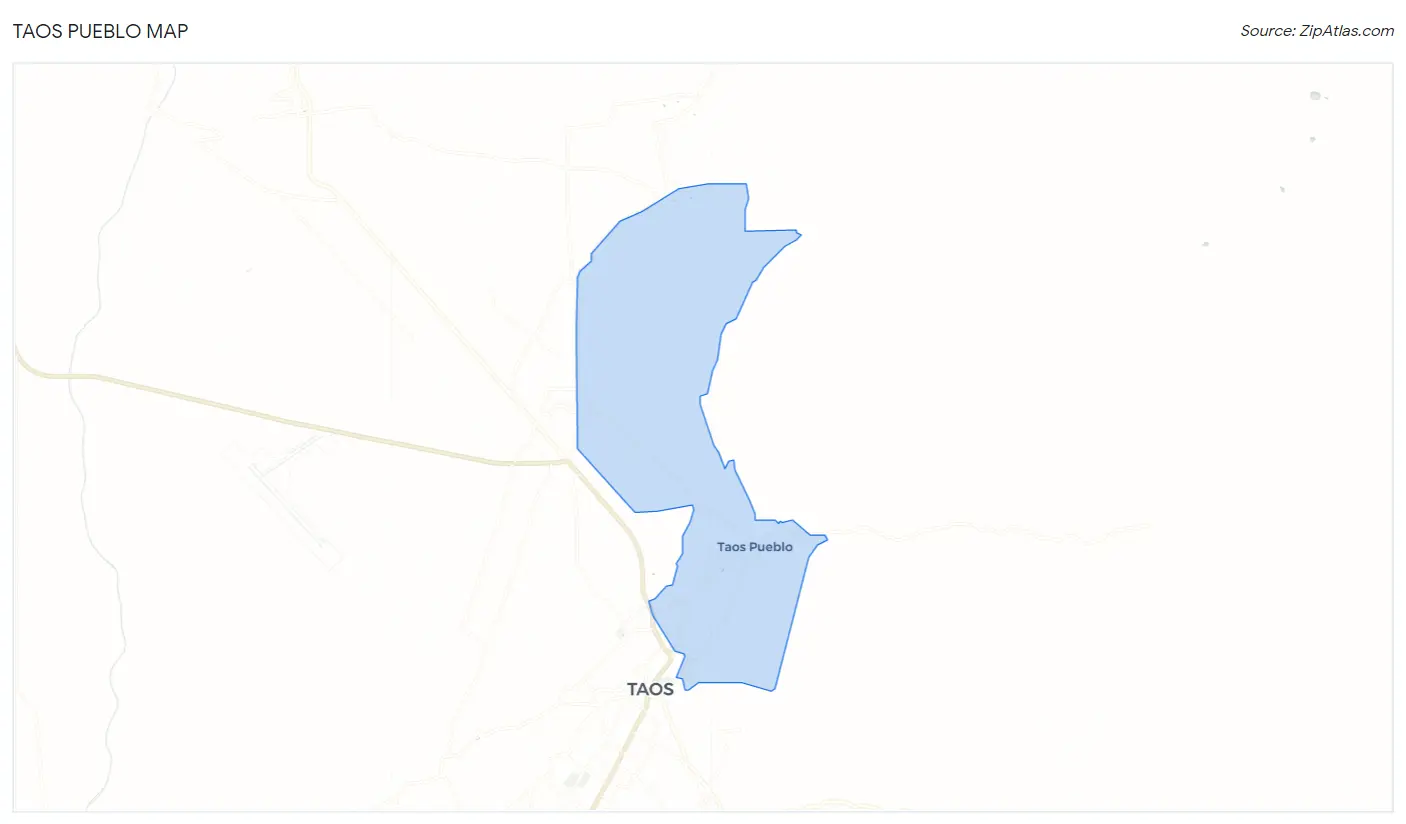
Taos Pueblo Map
Taos Pueblo Overview
$16,124
PER CAPITA INCOME
$46,719
AVG FAMILY INCOME
$36,597
AVG HOUSEHOLD INCOME
46.4%
WAGE / INCOME GAP [ % ]
53.6¢/ $1
WAGE / INCOME GAP [ $ ]
0.44
INEQUALITY / GINI INDEX
1,422
TOTAL POPULATION
725
MALE POPULATION
697
FEMALE POPULATION
104.02
MALES / 100 FEMALES
96.14
FEMALES / 100 MALES
42.3
MEDIAN AGE
5.2
AVG FAMILY SIZE
3.8
AVG HOUSEHOLD SIZE
629
LABOR FORCE [ PEOPLE ]
54.5%
PERCENT IN LABOR FORCE
14.1%
UNEMPLOYMENT RATE
Income in Taos Pueblo
Income Overview in Taos Pueblo
Per Capita Income in Taos Pueblo is $16,124, while median incomes of families and households are $46,719 and $36,597 respectively.
| Characteristic | Number | Measure |
| Per Capita Income | 1,422 | $16,124 |
| Median Family Income | 215 | $46,719 |
| Mean Family Income | 215 | $59,986 |
| Median Household Income | 379 | $36,597 |
| Mean Household Income | 379 | $45,726 |
| Income Deficit | 215 | $0 |
| Wage / Income Gap (%) | 1,422 | 46.42% |
| Wage / Income Gap ($) | 1,422 | 53.58¢ per $1 |
| Gini / Inequality Index | 1,422 | 0.44 |
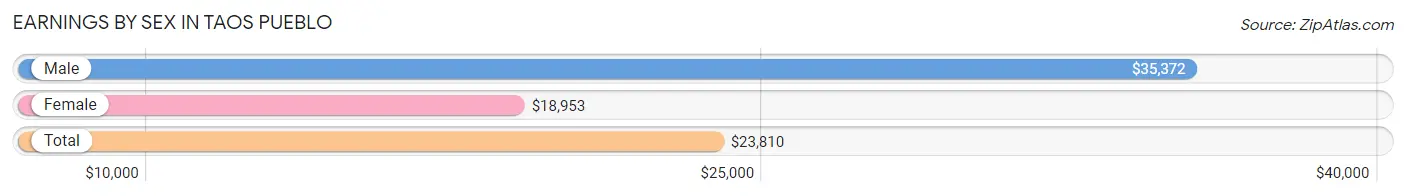
Earnings by Sex in Taos Pueblo
Average Earnings in Taos Pueblo are $23,810, $35,372 for men and $18,953 for women, a difference of 46.4%.
| Sex | Number | Average Earnings |
| Male | 279 (50.9%) | $35,372 |
| Female | 269 (49.1%) | $18,953 |
| Total | 548 (100.0%) | $23,810 |
Earnings by Sex by Income Bracket in Taos Pueblo
The most common earnings brackets in Taos Pueblo are $35,000 to $39,999 for men (37 | 13.3%) and $2,499 or less for women (47 | 17.5%).

| Income | Male | Female |
| $2,499 or less | 20 (7.2%) | 47 (17.5%) |
| $2,500 to $4,999 | 7 (2.5%) | 4 (1.5%) |
| $5,000 to $7,499 | 6 (2.1%) | 6 (2.2%) |
| $7,500 to $9,999 | 34 (12.2%) | 41 (15.2%) |
| $10,000 to $12,499 | 0 (0.0%) | 1 (0.4%) |
| $12,500 to $14,999 | 6 (2.1%) | 12 (4.5%) |
| $15,000 to $17,499 | 4 (1.4%) | 2 (0.7%) |
| $17,500 to $19,999 | 7 (2.5%) | 37 (13.8%) |
| $20,000 to $22,499 | 0 (0.0%) | 29 (10.8%) |
| $22,500 to $24,999 | 13 (4.7%) | 8 (3.0%) |
| $25,000 to $29,999 | 15 (5.4%) | 3 (1.1%) |
| $30,000 to $34,999 | 22 (7.9%) | 20 (7.4%) |
| $35,000 to $39,999 | 37 (13.3%) | 9 (3.4%) |
| $40,000 to $44,999 | 32 (11.5%) | 38 (14.1%) |
| $45,000 to $49,999 | 6 (2.1%) | 0 (0.0%) |
| $50,000 to $54,999 | 15 (5.4%) | 0 (0.0%) |
| $55,000 to $64,999 | 29 (10.4%) | 3 (1.1%) |
| $65,000 to $74,999 | 5 (1.8%) | 9 (3.4%) |
| $75,000 to $99,999 | 21 (7.5%) | 0 (0.0%) |
| $100,000+ | 0 (0.0%) | 0 (0.0%) |
| Total | 279 (100.0%) | 269 (100.0%) |
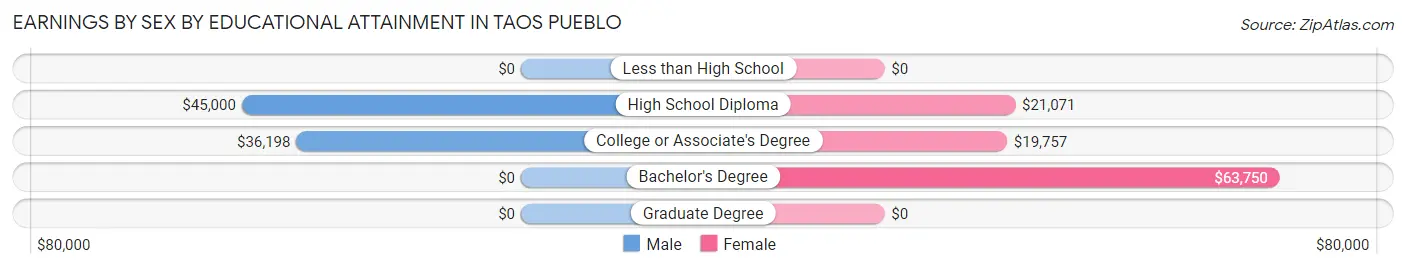
Earnings by Sex by Educational Attainment in Taos Pueblo
Average earnings in Taos Pueblo are $36,042 for men and $20,862 for women, a difference of 42.1%. Men with an educational attainment of high school diploma enjoy the highest average annual earnings of $45,000, while those with college or associate's degree education earn the least with $36,198. Women with an educational attainment of bachelor's degree earn the most with the average annual earnings of $63,750, while those with college or associate's degree education have the smallest earnings of $19,757.
| Educational Attainment | Male Income | Female Income |
| Less than High School | - | - |
| High School Diploma | $45,000 | $21,071 |
| College or Associate's Degree | $36,198 | $19,757 |
| Bachelor's Degree | - | - |
| Graduate Degree | - | - |
| Total | $36,042 | $20,862 |
Family Income in Taos Pueblo
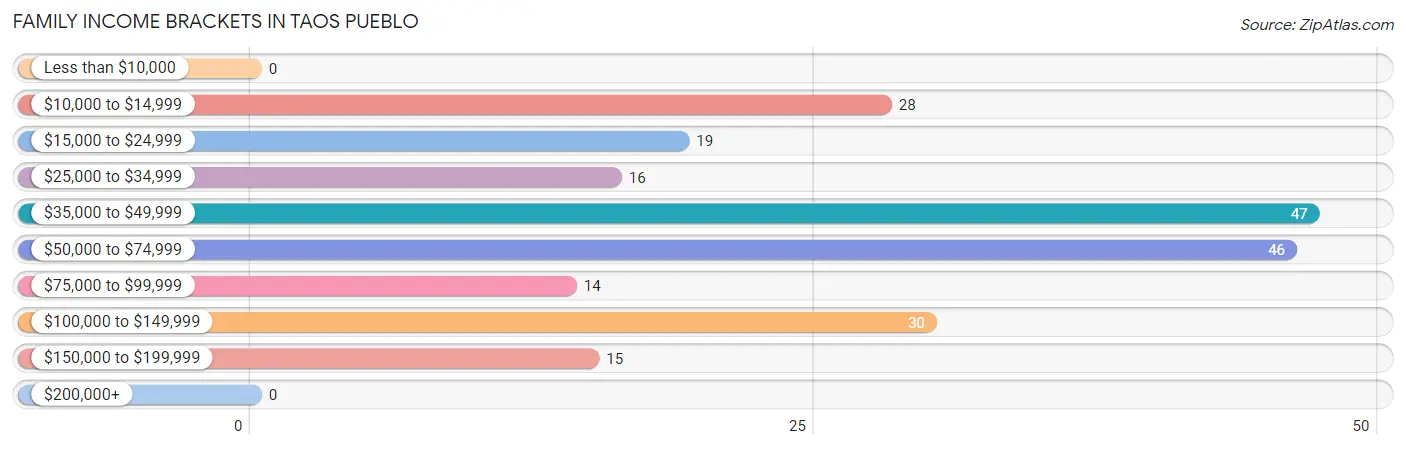
Family Income Brackets in Taos Pueblo
According to the Taos Pueblo family income data, there are 47 families falling into the $35,000 to $49,999 income range, which is the most common income bracket and makes up 21.9% of all families.
| Income Bracket | # Families | % Families |
| Less than $10,000 | 0 | 0.0% |
| $10,000 to $14,999 | 28 | 13.0% |
| $15,000 to $24,999 | 19 | 8.8% |
| $25,000 to $34,999 | 16 | 7.4% |
| $35,000 to $49,999 | 47 | 21.9% |
| $50,000 to $74,999 | 46 | 21.4% |
| $75,000 to $99,999 | 14 | 6.5% |
| $100,000 to $149,999 | 30 | 14.0% |
| $150,000 to $199,999 | 15 | 7.0% |
| $200,000+ | 0 | 0.0% |
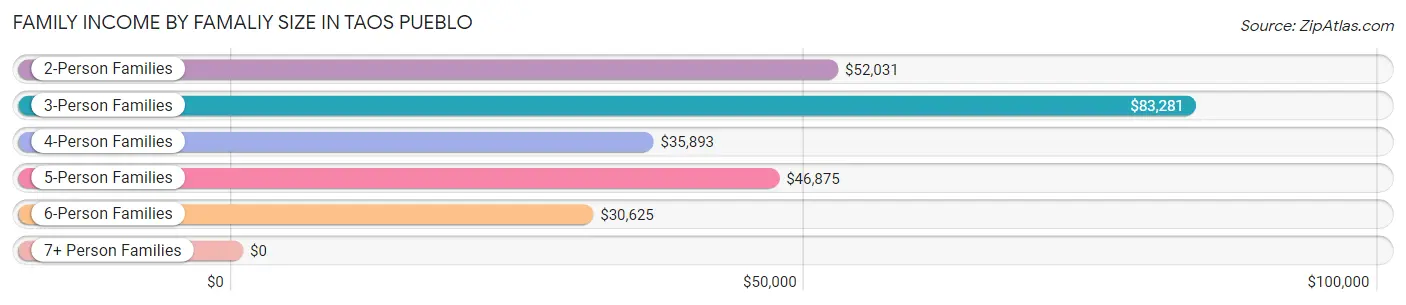
Family Income by Famaliy Size in Taos Pueblo
3-person families (61 | 28.4%) account for the highest median family income in Taos Pueblo with $83,281 per family, while 3-person families (61 | 28.4%) have the highest median income of $27,760 per family member.
| Income Bracket | # Families | Median Income |
| 2-Person Families | 83 (38.6%) | $52,031 |
| 3-Person Families | 61 (28.4%) | $83,281 |
| 4-Person Families | 21 (9.8%) | $35,893 |
| 5-Person Families | 14 (6.5%) | $46,875 |
| 6-Person Families | 17 (7.9%) | $30,625 |
| 7+ Person Families | 19 (8.8%) | $0 |
| Total | 215 (100.0%) | $46,719 |
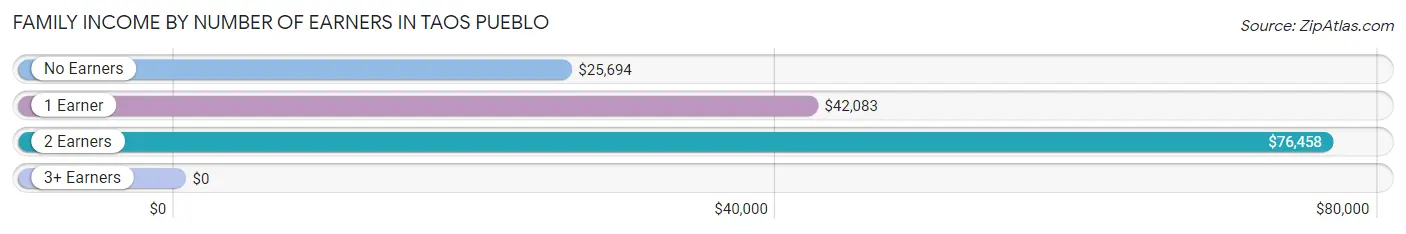
Family Income by Number of Earners in Taos Pueblo
| Number of Earners | # Families | Median Income |
| No Earners | 51 (23.7%) | $25,694 |
| 1 Earner | 79 (36.7%) | $42,083 |
| 2 Earners | 79 (36.7%) | $76,458 |
| 3+ Earners | 6 (2.8%) | $0 |
| Total | 215 (100.0%) | $46,719 |
Household Income in Taos Pueblo
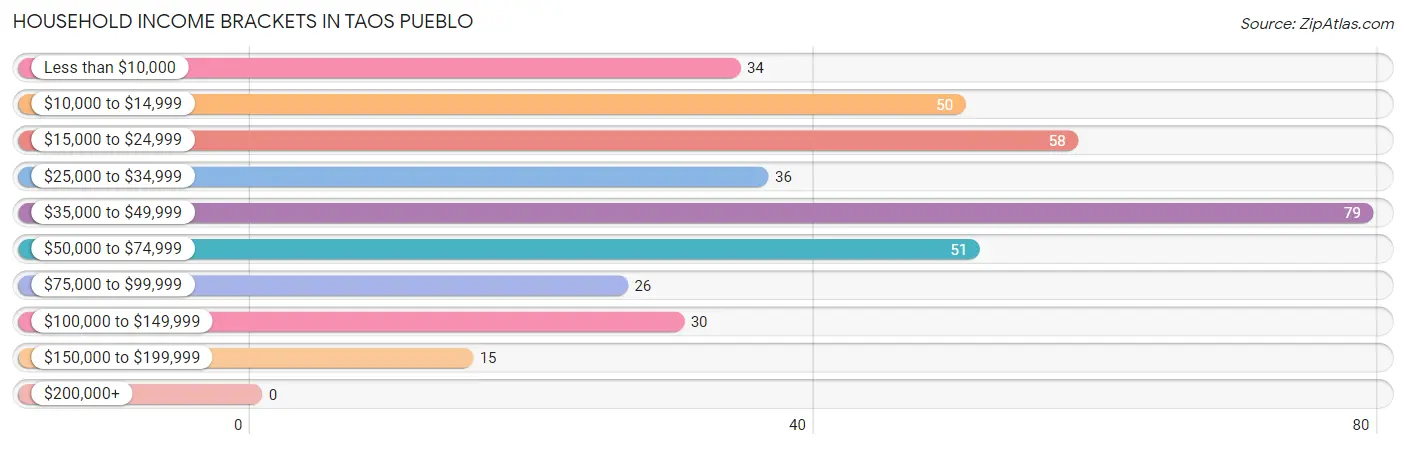
Household Income Brackets in Taos Pueblo
With 79 households falling in the category, the $35,000 to $49,999 income range is the most frequent in Taos Pueblo, accounting for 20.8% of all households.
| Income Bracket | # Households | % Households |
| Less than $10,000 | 34 | 9.0% |
| $10,000 to $14,999 | 50 | 13.2% |
| $15,000 to $24,999 | 58 | 15.3% |
| $25,000 to $34,999 | 36 | 9.5% |
| $35,000 to $49,999 | 79 | 20.8% |
| $50,000 to $74,999 | 51 | 13.5% |
| $75,000 to $99,999 | 26 | 6.9% |
| $100,000 to $149,999 | 30 | 7.9% |
| $150,000 to $199,999 | 15 | 4.0% |
| $200,000+ | 0 | 0.0% |
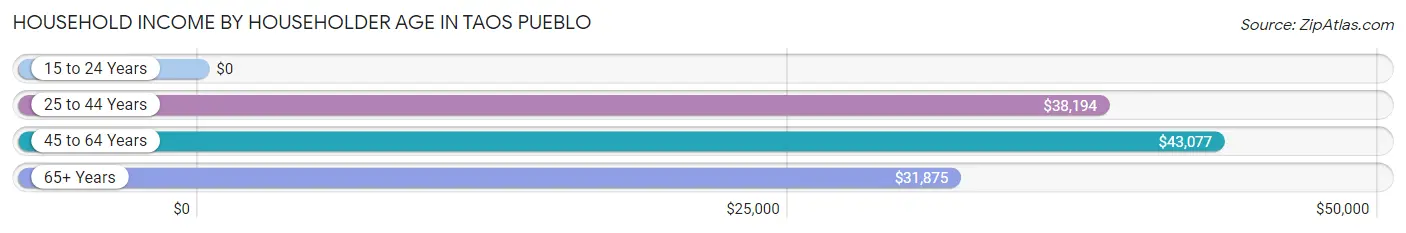
Household Income by Householder Age in Taos Pueblo
The median household income in Taos Pueblo is $36,597, with the highest median household income of $43,077 found in the 45 to 64 years age bracket for the primary householder. A total of 164 households (43.3%) fall into this category. Meanwhile, the 15 to 24 years age bracket for the primary householder has the lowest median household income of $0, with 13 households (3.4%) in this group.
| Income Bracket | # Households | Median Income |
| 15 to 24 Years | 13 (3.4%) | $0 |
| 25 to 44 Years | 43 (11.4%) | $38,194 |
| 45 to 64 Years | 164 (43.3%) | $43,077 |
| 65+ Years | 159 (41.9%) | $31,875 |
| Total | 379 (100.0%) | $36,597 |
Poverty in Taos Pueblo
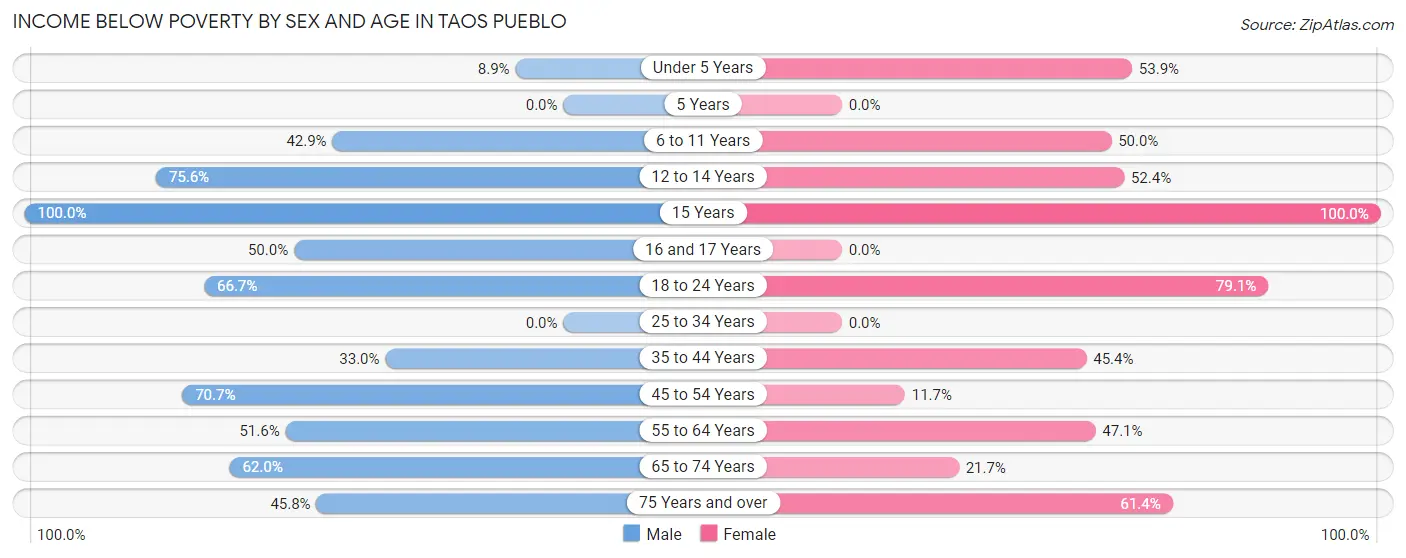
Income Below Poverty by Sex and Age in Taos Pueblo
With 41.7% poverty level for males and 44.5% for females among the residents of Taos Pueblo, 15 year old males and 15 year old females are the most vulnerable to poverty, with 3 males (100.0%) and 9 females (100.0%) in their respective age groups living below the poverty level.
| Age Bracket | Male | Female |
| Under 5 Years | 13 (8.9%) | 7 (53.8%) |
| 5 Years | 0 (0.0%) | 0 (0.0%) |
| 6 to 11 Years | 6 (42.9%) | 6 (50.0%) |
| 12 to 14 Years | 31 (75.6%) | 11 (52.4%) |
| 15 Years | 3 (100.0%) | 9 (100.0%) |
| 16 and 17 Years | 3 (50.0%) | 0 (0.0%) |
| 18 to 24 Years | 34 (66.7%) | 91 (79.1%) |
| 25 to 34 Years | 0 (0.0%) | 0 (0.0%) |
| 35 to 44 Years | 37 (33.0%) | 59 (45.4%) |
| 45 to 54 Years | 58 (70.7%) | 9 (11.7%) |
| 55 to 64 Years | 49 (51.6%) | 32 (47.1%) |
| 65 to 74 Years | 57 (62.0%) | 23 (21.7%) |
| 75 Years and over | 11 (45.8%) | 62 (61.4%) |
| Total | 302 (41.7%) | 309 (44.5%) |
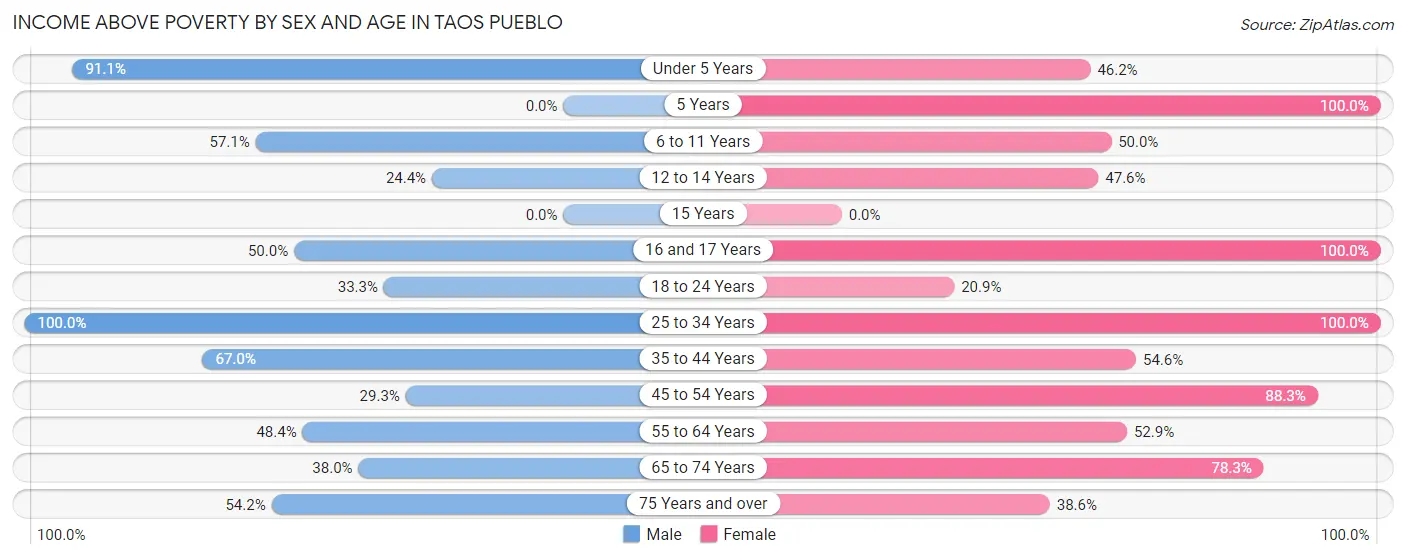
Income Above Poverty by Sex and Age in Taos Pueblo
According to the poverty statistics in Taos Pueblo, males aged 25 to 34 years and females aged 5 years are the age groups that are most secure financially, with 100.0% of males and 100.0% of females in these age groups living above the poverty line.
| Age Bracket | Male | Female |
| Under 5 Years | 133 (91.1%) | 6 (46.2%) |
| 5 Years | 0 (0.0%) | 6 (100.0%) |
| 6 to 11 Years | 8 (57.1%) | 6 (50.0%) |
| 12 to 14 Years | 10 (24.4%) | 10 (47.6%) |
| 15 Years | 0 (0.0%) | 0 (0.0%) |
| 16 and 17 Years | 3 (50.0%) | 3 (100.0%) |
| 18 to 24 Years | 17 (33.3%) | 24 (20.9%) |
| 25 to 34 Years | 59 (100.0%) | 34 (100.0%) |
| 35 to 44 Years | 75 (67.0%) | 71 (54.6%) |
| 45 to 54 Years | 24 (29.3%) | 68 (88.3%) |
| 55 to 64 Years | 46 (48.4%) | 36 (52.9%) |
| 65 to 74 Years | 35 (38.0%) | 83 (78.3%) |
| 75 Years and over | 13 (54.2%) | 39 (38.6%) |
| Total | 423 (58.3%) | 386 (55.5%) |
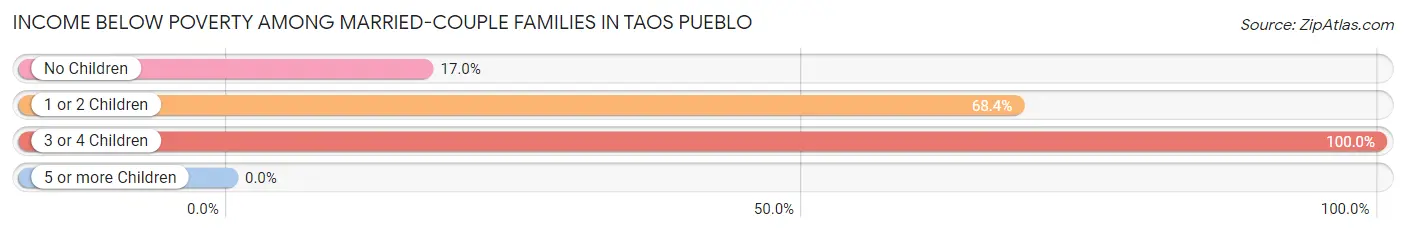
Income Below Poverty Among Married-Couple Families in Taos Pueblo
The poverty statistics for married-couple families in Taos Pueblo show that 44.0% or 40 of the total 91 families live below the poverty line. Families with 3 or 4 children have the highest poverty rate of 100.0%, comprising of 6 families. On the other hand, families with no children have the lowest poverty rate of 17.0%, which includes 8 families.
| Children | Above Poverty | Below Poverty |
| No Children | 39 (83.0%) | 8 (17.0%) |
| 1 or 2 Children | 12 (31.6%) | 26 (68.4%) |
| 3 or 4 Children | 0 (0.0%) | 6 (100.0%) |
| 5 or more Children | 0 (0.0%) | 0 (0.0%) |
| Total | 51 (56.0%) | 40 (44.0%) |
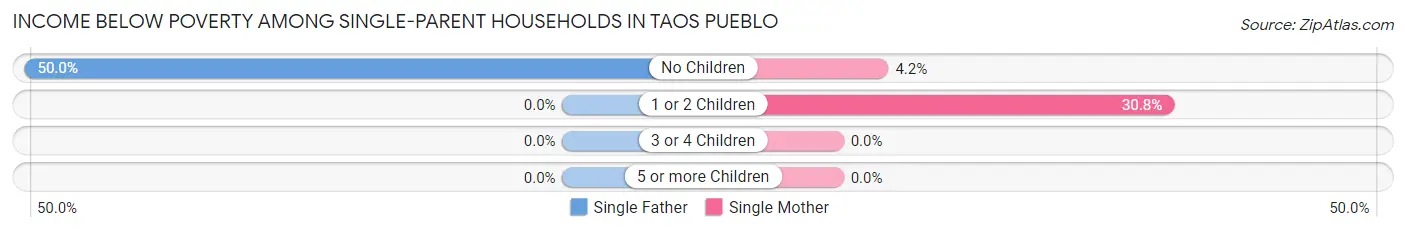
Income Below Poverty Among Single-Parent Households in Taos Pueblo
According to the poverty data in Taos Pueblo, 25.0% or 11 single-father households and 21.2% or 17 single-mother households are living below the poverty line. Among single-father households, those with no children have the highest poverty rate, with 11 households (50.0%) experiencing poverty. Likewise, among single-mother households, those with 1 or 2 children have the highest poverty rate, with 16 households (30.8%) falling below the poverty line.
| Children | Single Father | Single Mother |
| No Children | 11 (50.0%) | 1 (4.2%) |
| 1 or 2 Children | 0 (0.0%) | 16 (30.8%) |
| 3 or 4 Children | 0 (0.0%) | 0 (0.0%) |
| 5 or more Children | 0 (0.0%) | 0 (0.0%) |
| Total | 11 (25.0%) | 17 (21.2%) |
Income Below Poverty Among Married-Couple vs Single-Parent Households in Taos Pueblo
The poverty data for Taos Pueblo shows that 40 of the married-couple family households (44.0%) and 28 of the single-parent households (22.6%) are living below the poverty level. Within the married-couple family households, those with 3 or 4 children have the highest poverty rate, with 6 households (100.0%) falling below the poverty line. Among the single-parent households, those with no children have the highest poverty rate, with 12 household (26.1%) living below poverty.
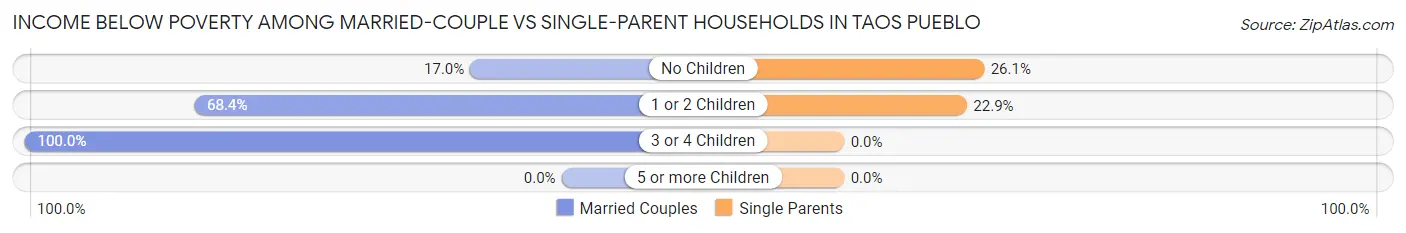
| Children | Married-Couple Families | Single-Parent Households |
| No Children | 8 (17.0%) | 12 (26.1%) |
| 1 or 2 Children | 26 (68.4%) | 16 (22.9%) |
| 3 or 4 Children | 6 (100.0%) | 0 (0.0%) |
| 5 or more Children | 0 (0.0%) | 0 (0.0%) |
| Total | 40 (44.0%) | 28 (22.6%) |
Race in Taos Pueblo
The most populous races in Taos Pueblo are Native / Alaskan (1,292 | 90.9%), Hispanic or Latino (165 | 11.6%), and Two or more Races (73 | 5.1%).
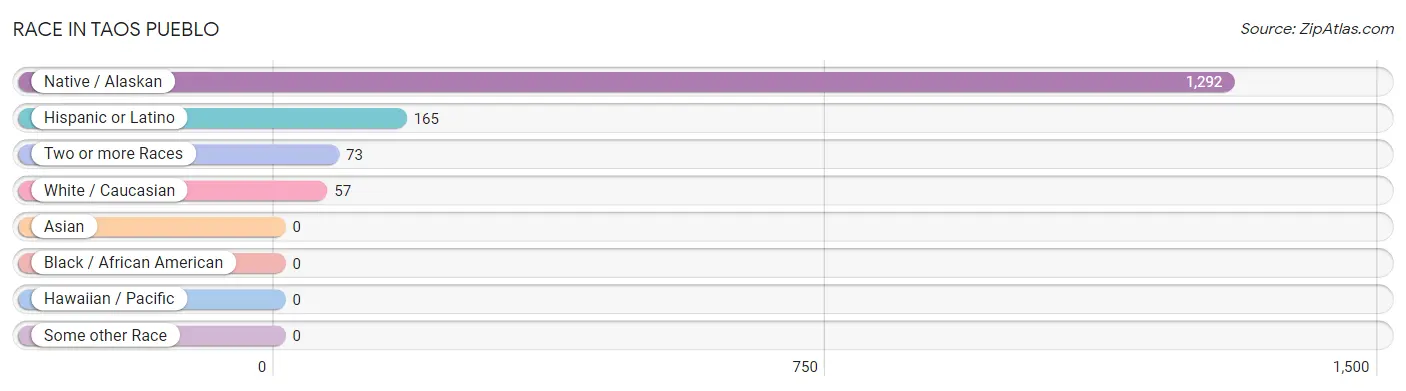
| Race | # Population | % Population |
| Asian | 0 | 0.0% |
| Black / African American | 0 | 0.0% |
| Hawaiian / Pacific | 0 | 0.0% |
| Hispanic or Latino | 165 | 11.6% |
| Native / Alaskan | 1,292 | 90.9% |
| White / Caucasian | 57 | 4.0% |
| Two or more Races | 73 | 5.1% |
| Some other Race | 0 | 0.0% |
| Total | 1,422 | 100.0% |
Ancestry in Taos Pueblo
The most populous ancestries reported in Taos Pueblo are Pueblo (965 | 67.9%), Mexican (112 | 7.9%), Spanish (31 | 2.2%), American (25 | 1.8%), and Navajo (22 | 1.5%), together accounting for 81.2% of all Taos Pueblo residents.
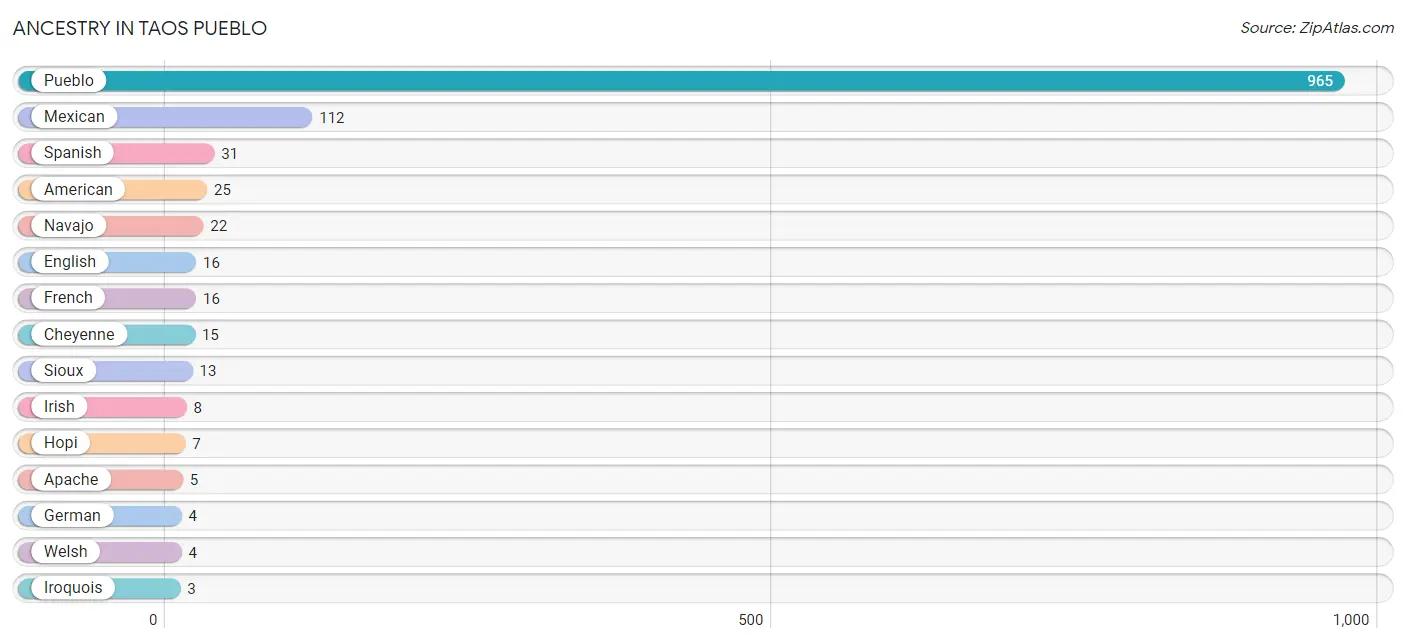
| Ancestry | # Population | % Population |
| American | 25 | 1.8% |
| Apache | 5 | 0.4% |
| Cheyenne | 15 | 1.1% |
| English | 16 | 1.1% |
| French | 16 | 1.1% |
| German | 4 | 0.3% |
| Hopi | 7 | 0.5% |
| Irish | 8 | 0.6% |
| Iroquois | 3 | 0.2% |
| Kiowa | 3 | 0.2% |
| Mexican | 112 | 7.9% |
| Navajo | 22 | 1.5% |
| Pueblo | 965 | 67.9% |
| Sioux | 13 | 0.9% |
| Spanish | 31 | 2.2% |
| Welsh | 4 | 0.3% | View All 16 Rows |
Immigrants in Taos Pueblo
The most numerous immigrant groups reported in Taos Pueblo came from Europe (22 | 1.5%), Germany (22 | 1.5%), Western Europe (22 | 1.5%), Micronesia (4 | 0.3%), and Oceania (4 | 0.3%), together accounting for 5.2% of all Taos Pueblo residents.
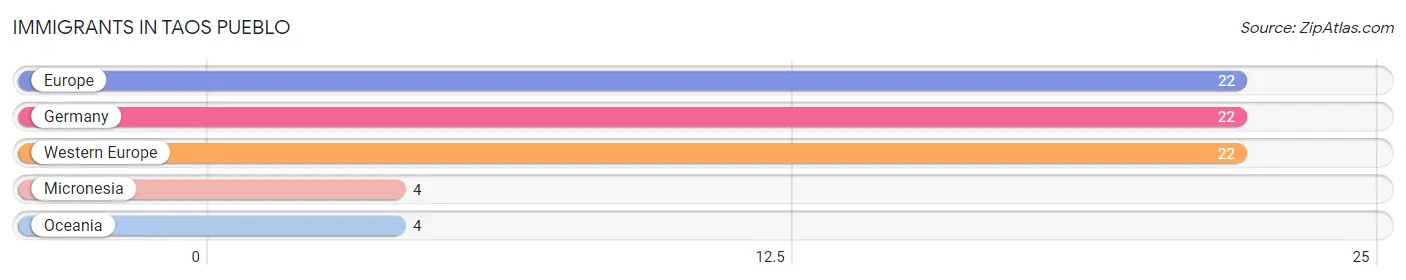
| Immigration Origin | # Population | % Population |
| Europe | 22 | 1.5% |
| Germany | 22 | 1.5% |
| Micronesia | 4 | 0.3% |
| Oceania | 4 | 0.3% |
| Western Europe | 22 | 1.5% | View All 5 Rows |
Sex and Age in Taos Pueblo
Sex and Age in Taos Pueblo
The most populous age groups in Taos Pueblo are Under 5 Years (146 | 20.1%) for men and 20 to 24 Years (115 | 16.5%) for women.
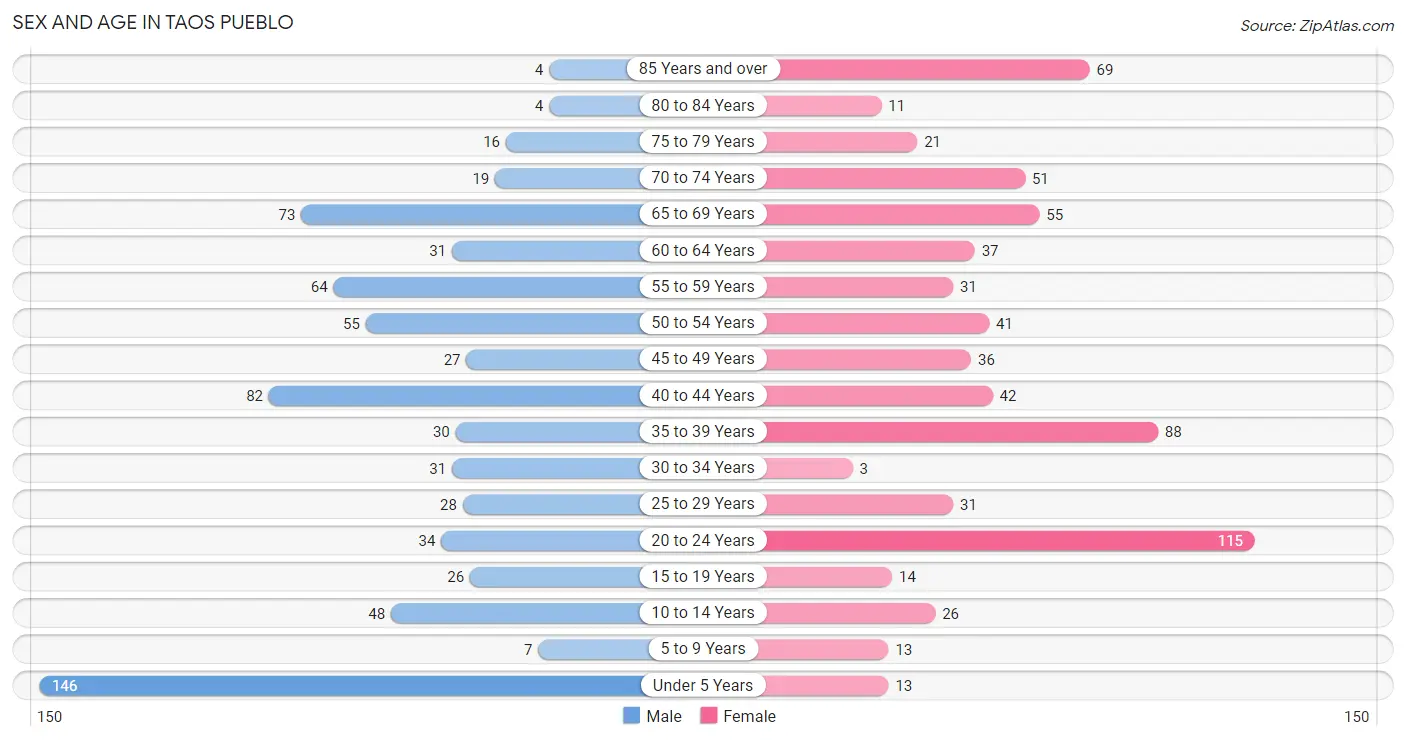
| Age Bracket | Male | Female |
| Under 5 Years | 146 (20.1%) | 13 (1.9%) |
| 5 to 9 Years | 7 (1.0%) | 13 (1.9%) |
| 10 to 14 Years | 48 (6.6%) | 26 (3.7%) |
| 15 to 19 Years | 26 (3.6%) | 14 (2.0%) |
| 20 to 24 Years | 34 (4.7%) | 115 (16.5%) |
| 25 to 29 Years | 28 (3.9%) | 31 (4.4%) |
| 30 to 34 Years | 31 (4.3%) | 3 (0.4%) |
| 35 to 39 Years | 30 (4.1%) | 88 (12.6%) |
| 40 to 44 Years | 82 (11.3%) | 42 (6.0%) |
| 45 to 49 Years | 27 (3.7%) | 36 (5.2%) |
| 50 to 54 Years | 55 (7.6%) | 41 (5.9%) |
| 55 to 59 Years | 64 (8.8%) | 31 (4.4%) |
| 60 to 64 Years | 31 (4.3%) | 37 (5.3%) |
| 65 to 69 Years | 73 (10.1%) | 55 (7.9%) |
| 70 to 74 Years | 19 (2.6%) | 51 (7.3%) |
| 75 to 79 Years | 16 (2.2%) | 21 (3.0%) |
| 80 to 84 Years | 4 (0.5%) | 11 (1.6%) |
| 85 Years and over | 4 (0.5%) | 69 (9.9%) |
| Total | 725 (100.0%) | 697 (100.0%) |
Families and Households in Taos Pueblo
Median Family Size in Taos Pueblo
The median family size in Taos Pueblo is 5.20 persons per family, with married-couple families (91 | 42.3%) accounting for the largest median family size of 5.26 persons per family. On the other hand, single female/mother families (80 | 37.2%) represent the smallest median family size with 5.11 persons per family.
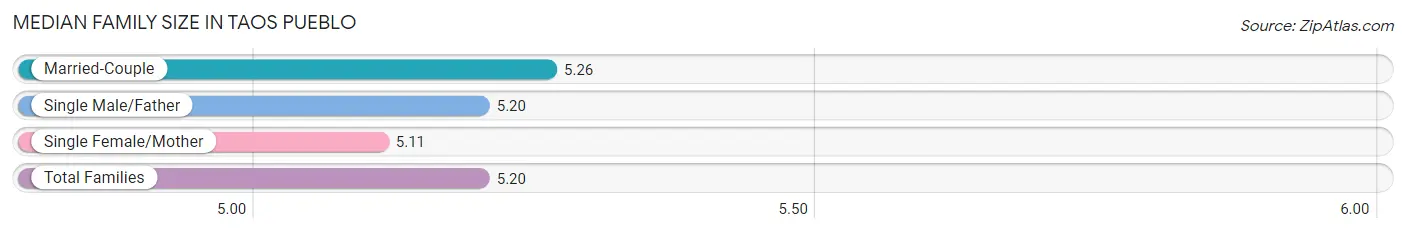
| Family Type | # Families | Family Size |
| Married-Couple | 91 (42.3%) | 5.26 |
| Single Male/Father | 44 (20.5%) | 5.20 |
| Single Female/Mother | 80 (37.2%) | 5.11 |
| Total Families | 215 (100.0%) | 5.20 |
Median Household Size in Taos Pueblo
The median household size in Taos Pueblo is 3.75 persons per household, with single female/mother households (80 | 21.1%) accounting for the largest median household size of 6.08 persons per household. non-family households (164 | 43.3%) represent the smallest median household size with 1.09 persons per household.
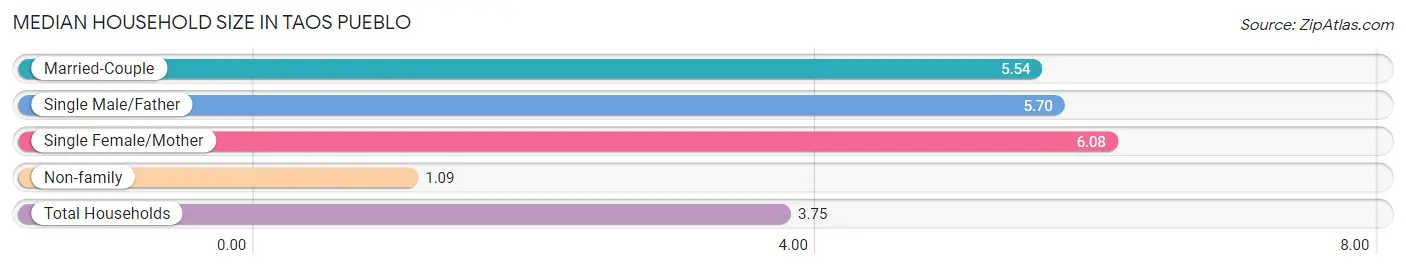
| Household Type | # Households | Household Size |
| Married-Couple | 91 (24.0%) | 5.54 |
| Single Male/Father | 44 (11.6%) | 5.70 |
| Single Female/Mother | 80 (21.1%) | 6.08 |
| Non-family | 164 (43.3%) | 1.09 |
| Total Households | 379 (100.0%) | 3.75 |
Household Size by Marriage Status in Taos Pueblo
Out of a total of 379 households in Taos Pueblo, 215 (56.7%) are family households, while 164 (43.3%) are nonfamily households. The most numerous type of family households are 2-person households, comprising 75, and the most common type of nonfamily households are 1-person households, comprising 155.
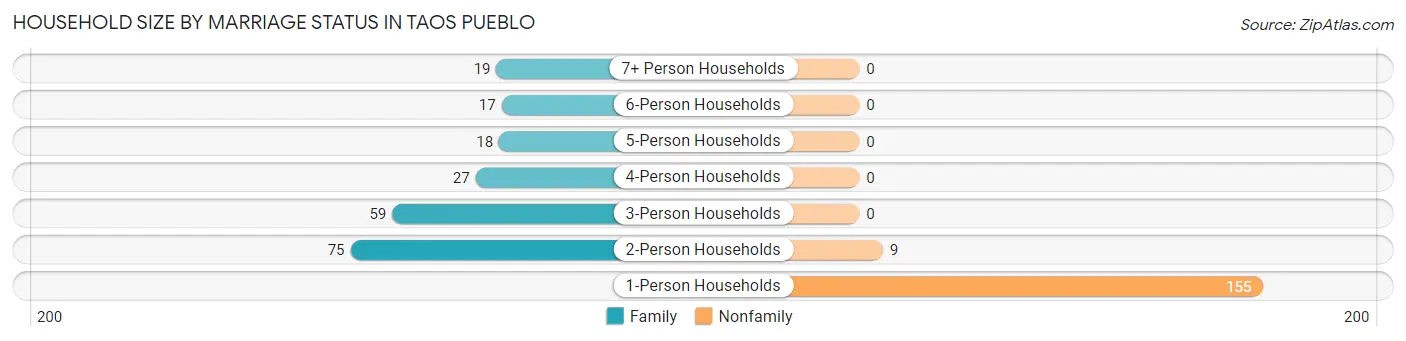
| Household Size | Family Households | Nonfamily Households |
| 1-Person Households | - | 155 (40.9%) |
| 2-Person Households | 75 (19.8%) | 9 (2.4%) |
| 3-Person Households | 59 (15.6%) | 0 (0.0%) |
| 4-Person Households | 27 (7.1%) | 0 (0.0%) |
| 5-Person Households | 18 (4.8%) | 0 (0.0%) |
| 6-Person Households | 17 (4.5%) | 0 (0.0%) |
| 7+ Person Households | 19 (5.0%) | 0 (0.0%) |
| Total | 215 (56.7%) | 164 (43.3%) |
Female Fertility in Taos Pueblo
Fertility by Age in Taos Pueblo
Average fertility rate in Taos Pueblo is 58.0 births per 1,000 women. Women in the age bracket of 20 to 34 years have the highest fertility rate with 141.0 births per 1,000 women. Women in the age bracket of 20 to 34 years acount for 100.0% of all women with births.
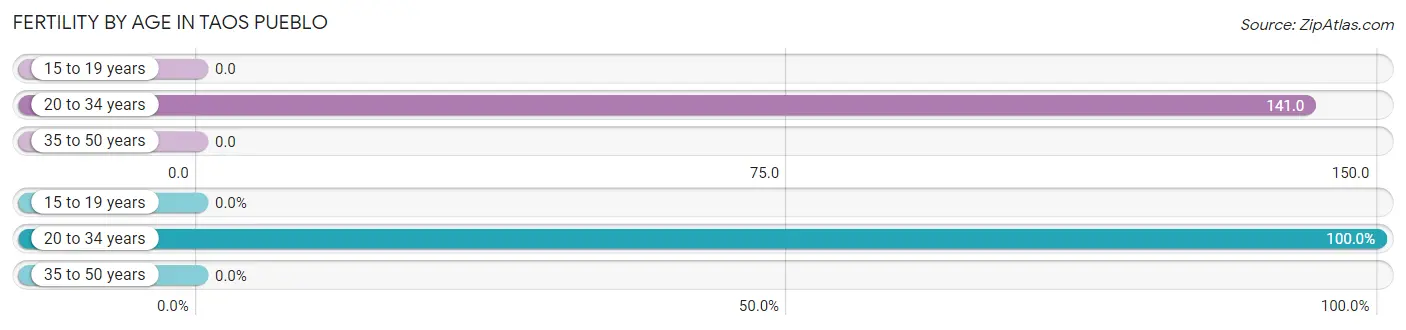
| Age Bracket | Women with Births | Births / 1,000 Women |
| 15 to 19 years | 0 (0.0%) | 0.0 |
| 20 to 34 years | 21 (100.0%) | 141.0 |
| 35 to 50 years | 0 (0.0%) | 0.0 |
| Total | 21 (100.0%) | 58.0 |
Fertility by Age by Marriage Status in Taos Pueblo
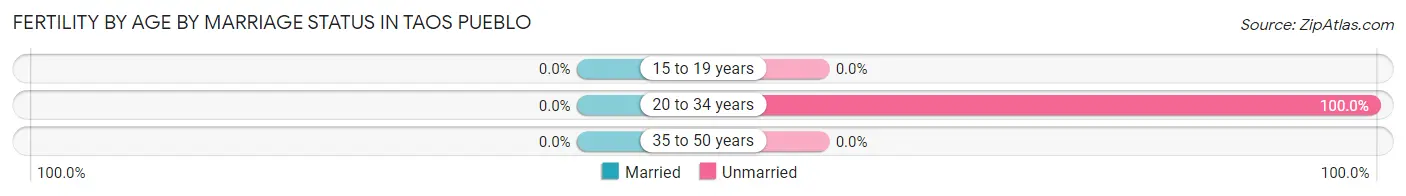
| Age Bracket | Married | Unmarried |
| 15 to 19 years | 0 (0.0%) | 0 (0.0%) |
| 20 to 34 years | 0 (0.0%) | 21 (100.0%) |
| 35 to 50 years | 0 (0.0%) | 0 (0.0%) |
| Total | 0 (0.0%) | 21 (100.0%) |
Fertility by Education in Taos Pueblo
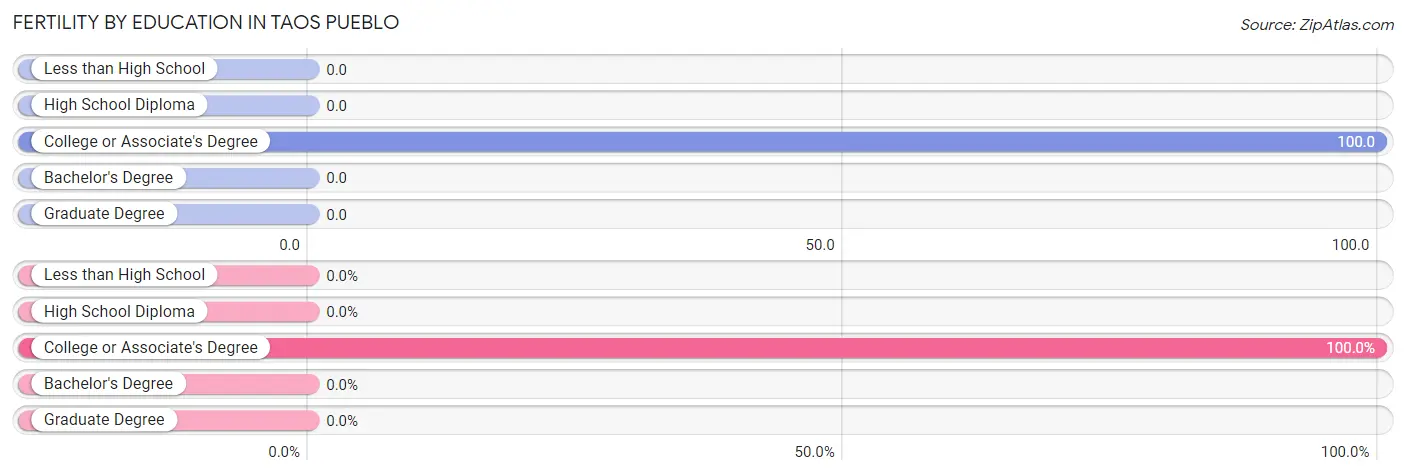
| Educational Attainment | Women with Births | Births / 1,000 Women |
| Less than High School | 0 (0.0%) | 0.0 |
| High School Diploma | 0 (0.0%) | 0.0 |
| College or Associate's Degree | 21 (100.0%) | 100.0 |
| Bachelor's Degree | 0 (0.0%) | 0.0 |
| Graduate Degree | 0 (0.0%) | 0.0 |
| Total | 21 (100.0%) | 58.0 |
Fertility by Education by Marriage Status in Taos Pueblo
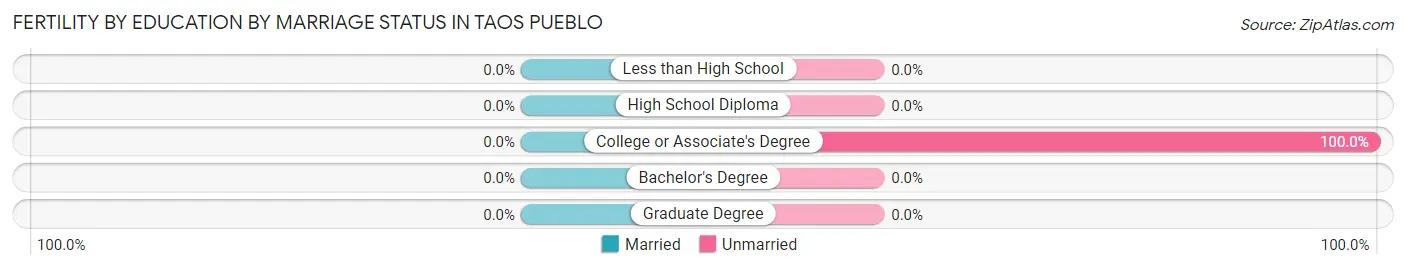
| Educational Attainment | Married | Unmarried |
| Less than High School | 0 (0.0%) | 0 (0.0%) |
| High School Diploma | 0 (0.0%) | 0 (0.0%) |
| College or Associate's Degree | 0 (0.0%) | 21 (100.0%) |
| Bachelor's Degree | 0 (0.0%) | 0 (0.0%) |
| Graduate Degree | 0 (0.0%) | 0 (0.0%) |
| Total | 0 (0.0%) | 21 (100.0%) |
Employment Characteristics in Taos Pueblo
Employment by Class of Employer in Taos Pueblo
Among the 542 employed individuals in Taos Pueblo, private company employees (216 | 39.9%), local government employees (127 | 23.4%), and federal government employees (110 | 20.3%) make up the most common classes of employment.
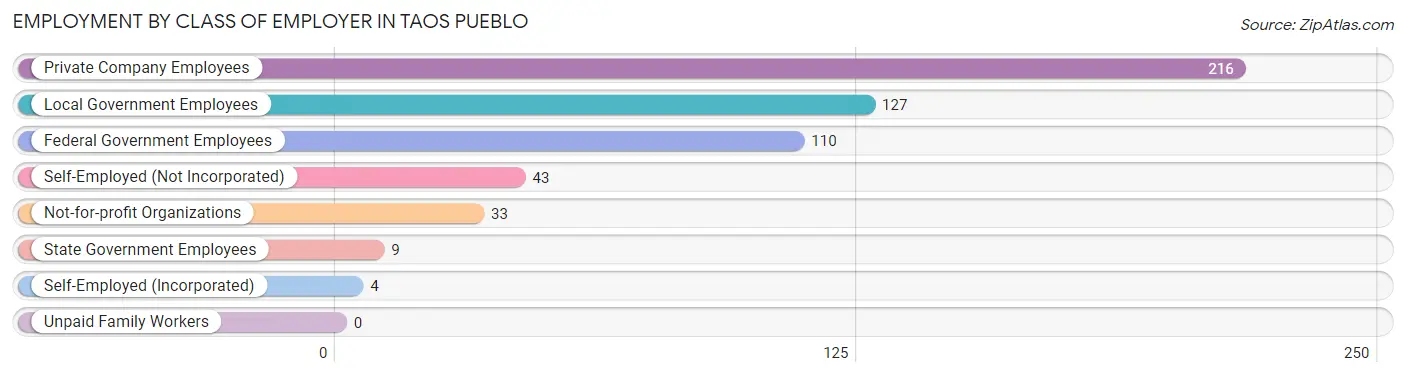
| Employer Class | # Employees | % Employees |
| Private Company Employees | 216 | 39.9% |
| Self-Employed (Incorporated) | 4 | 0.7% |
| Self-Employed (Not Incorporated) | 43 | 7.9% |
| Not-for-profit Organizations | 33 | 6.1% |
| Local Government Employees | 127 | 23.4% |
| State Government Employees | 9 | 1.7% |
| Federal Government Employees | 110 | 20.3% |
| Unpaid Family Workers | 0 | 0.0% |
| Total | 542 | 100.0% |
Employment Status by Age in Taos Pueblo
According to the labor force statistics for Taos Pueblo, out of the total population over 16 years of age (1,155), 54.5% or 629 individuals are in the labor force, with 14.1% or 89 of them unemployed. The age group with the highest labor force participation rate is 30 to 34 years, with 100.0% or 34 individuals in the labor force. Within the labor force, the 45 to 54 years age range has the highest percentage of unemployed individuals, with 26.6% or 29 of them being unemployed.
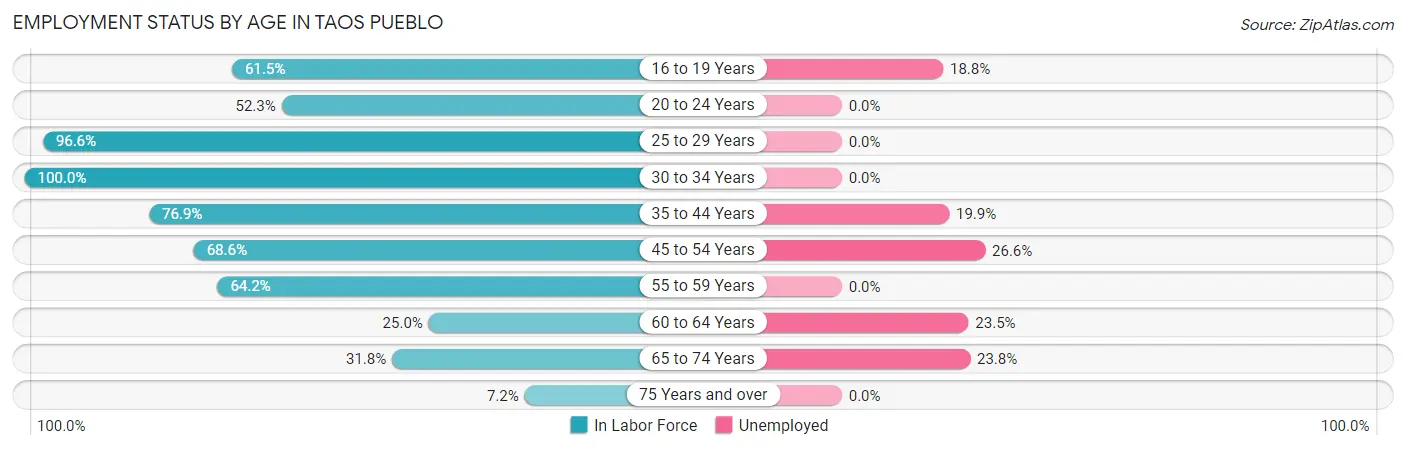
| Age Bracket | In Labor Force | Unemployed |
| 16 to 19 Years | 16 (61.5%) | 3 (18.8%) |
| 20 to 24 Years | 78 (52.3%) | 0 (0.0%) |
| 25 to 29 Years | 57 (96.6%) | 0 (0.0%) |
| 30 to 34 Years | 34 (100.0%) | 0 (0.0%) |
| 35 to 44 Years | 186 (76.9%) | 37 (19.9%) |
| 45 to 54 Years | 109 (68.6%) | 29 (26.6%) |
| 55 to 59 Years | 61 (64.2%) | 0 (0.0%) |
| 60 to 64 Years | 17 (25.0%) | 4 (23.5%) |
| 65 to 74 Years | 63 (31.8%) | 15 (23.8%) |
| 75 Years and over | 9 (7.2%) | 0 (0.0%) |
| Total | 629 (54.5%) | 89 (14.1%) |
Employment Status by Educational Attainment in Taos Pueblo
According to labor force statistics for Taos Pueblo, 70.6% of individuals (464) out of the total population between 25 and 64 years of age (657) are in the labor force, with 15.1% or 70 of them being unemployed. The group with the highest labor force participation rate are those with the educational attainment of less than high school, with 100.0% or 29 individuals in the labor force. Within the labor force, individuals with high school diploma education have the highest percentage of unemployment, with 47.9% or 56 of them being unemployed.
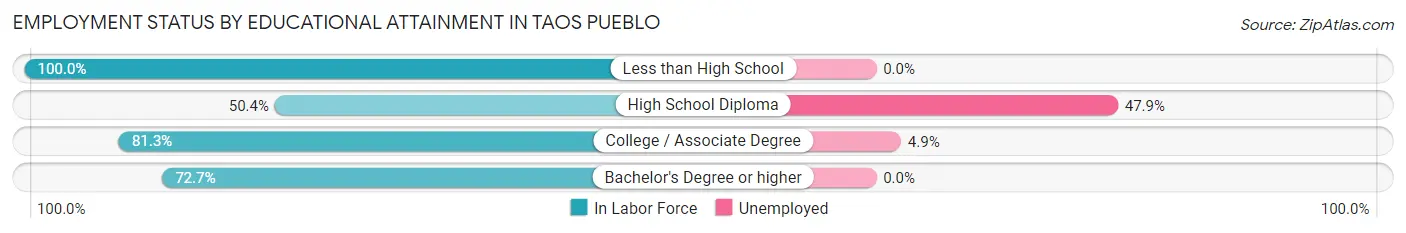
| Educational Attainment | In Labor Force | Unemployed |
| Less than High School | 29 (100.0%) | 0 (0.0%) |
| High School Diploma | 117 (50.4%) | 111 (47.9%) |
| College / Associate Degree | 286 (81.3%) | 17 (4.9%) |
| Bachelor's Degree or higher | 32 (72.7%) | 0 (0.0%) |
| Total | 464 (70.6%) | 99 (15.1%) |
Employment Occupations by Sex in Taos Pueblo
Management, Business, Science and Arts Occupations
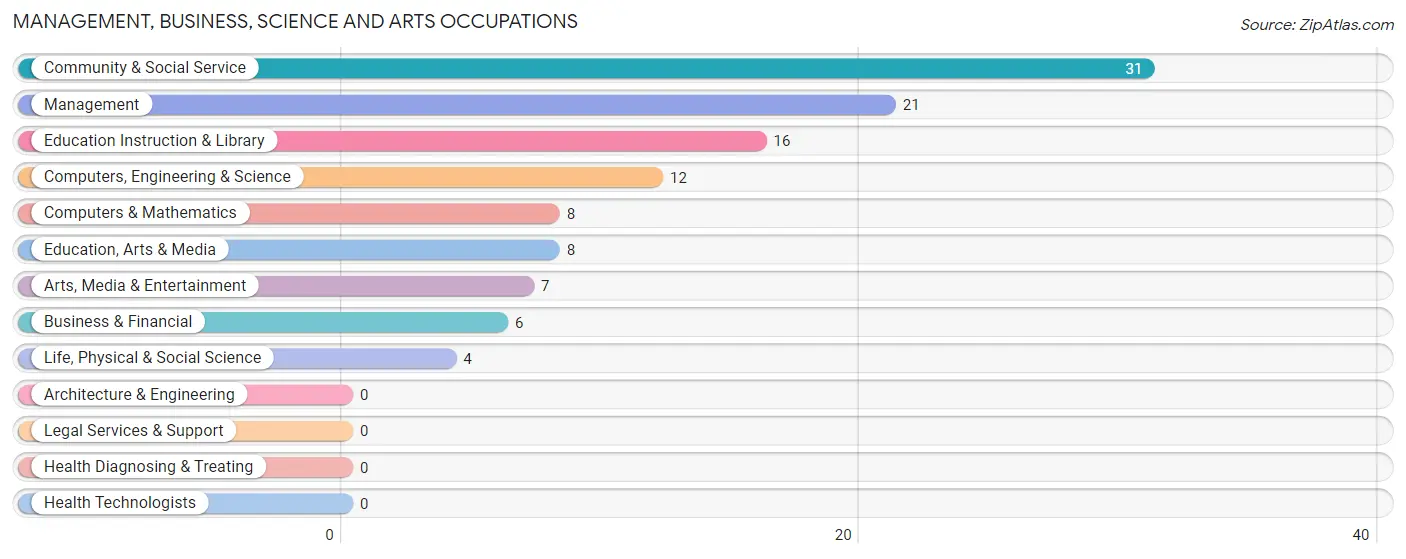
The most common Management, Business, Science and Arts occupations in Taos Pueblo are Community & Social Service (31 | 5.8%), Management (21 | 3.9%), Education Instruction & Library (16 | 3.0%), Computers, Engineering & Science (12 | 2.2%), and Computers & Mathematics (8 | 1.5%).
Management, Business, Science and Arts Occupations by Sex
Within the Management, Business, Science and Arts occupations in Taos Pueblo, the most male-oriented occupations are Business & Financial (100.0%), Arts, Media & Entertainment (100.0%), and Management (57.1%), while the most female-oriented occupations are Computers, Engineering & Science (100.0%), Computers & Mathematics (100.0%), and Life, Physical & Social Science (100.0%).
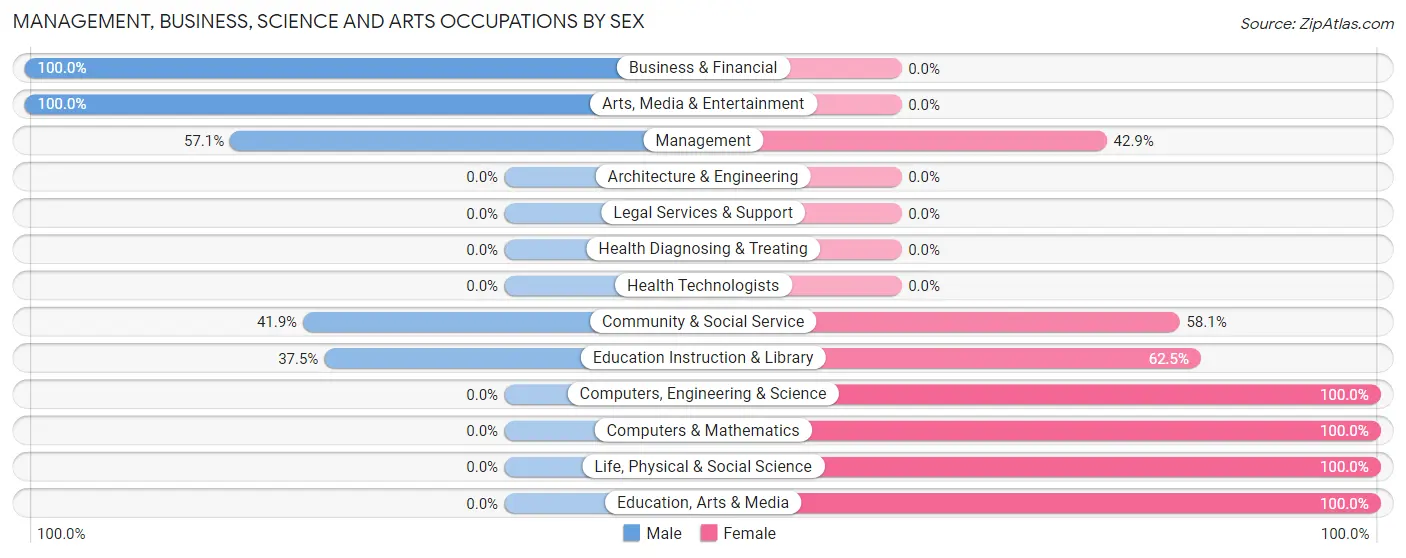
| Occupation | Male | Female |
| Management | 12 (57.1%) | 9 (42.9%) |
| Business & Financial | 6 (100.0%) | 0 (0.0%) |
| Computers, Engineering & Science | 0 (0.0%) | 12 (100.0%) |
| Computers & Mathematics | 0 (0.0%) | 8 (100.0%) |
| Architecture & Engineering | 0 (0.0%) | 0 (0.0%) |
| Life, Physical & Social Science | 0 (0.0%) | 4 (100.0%) |
| Community & Social Service | 13 (41.9%) | 18 (58.1%) |
| Education, Arts & Media | 0 (0.0%) | 8 (100.0%) |
| Legal Services & Support | 0 (0.0%) | 0 (0.0%) |
| Education Instruction & Library | 6 (37.5%) | 10 (62.5%) |
| Arts, Media & Entertainment | 7 (100.0%) | 0 (0.0%) |
| Health Diagnosing & Treating | 0 (0.0%) | 0 (0.0%) |
| Health Technologists | 0 (0.0%) | 0 (0.0%) |
| Total (Category) | 31 (44.3%) | 39 (55.7%) |
| Total (Overall) | 273 (50.9%) | 263 (49.1%) |
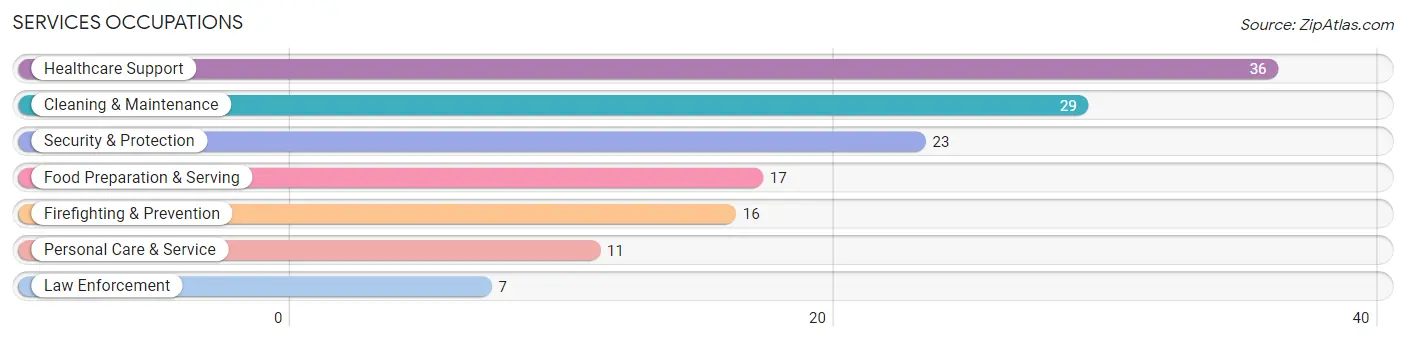
Services Occupations
The most common Services occupations in Taos Pueblo are Healthcare Support (36 | 6.7%), Cleaning & Maintenance (29 | 5.4%), Security & Protection (23 | 4.3%), Food Preparation & Serving (17 | 3.2%), and Firefighting & Prevention (16 | 3.0%).
Services Occupations by Sex
Within the Services occupations in Taos Pueblo, the most male-oriented occupations are Law Enforcement (100.0%), Security & Protection (87.0%), and Cleaning & Maintenance (86.2%), while the most female-oriented occupations are Healthcare Support (100.0%), Food Preparation & Serving (58.8%), and Personal Care & Service (54.5%).
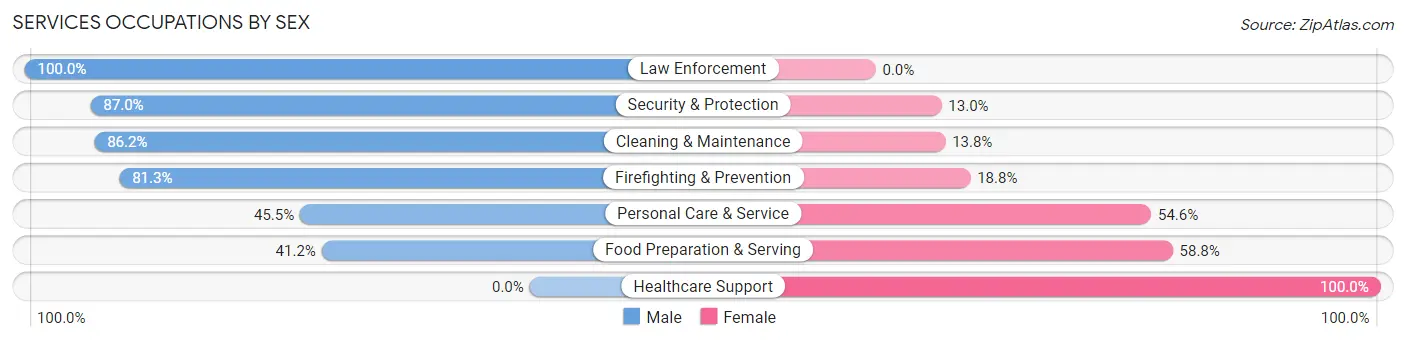
| Occupation | Male | Female |
| Healthcare Support | 0 (0.0%) | 36 (100.0%) |
| Security & Protection | 20 (87.0%) | 3 (13.0%) |
| Firefighting & Prevention | 13 (81.2%) | 3 (18.8%) |
| Law Enforcement | 7 (100.0%) | 0 (0.0%) |
| Food Preparation & Serving | 7 (41.2%) | 10 (58.8%) |
| Cleaning & Maintenance | 25 (86.2%) | 4 (13.8%) |
| Personal Care & Service | 5 (45.5%) | 6 (54.5%) |
| Total (Category) | 57 (49.1%) | 59 (50.9%) |
| Total (Overall) | 273 (50.9%) | 263 (49.1%) |
Sales and Office Occupations
The most common Sales and Office occupations in Taos Pueblo are Sales & Related (99 | 18.5%), and Office & Administration (54 | 10.1%).

Sales and Office Occupations by Sex

| Occupation | Male | Female |
| Sales & Related | 14 (14.1%) | 85 (85.9%) |
| Office & Administration | 18 (33.3%) | 36 (66.7%) |
| Total (Category) | 32 (20.9%) | 121 (79.1%) |
| Total (Overall) | 273 (50.9%) | 263 (49.1%) |
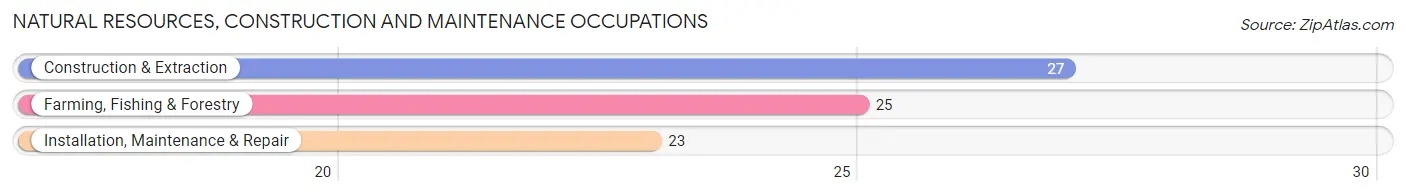
Natural Resources, Construction and Maintenance Occupations
The most common Natural Resources, Construction and Maintenance occupations in Taos Pueblo are Construction & Extraction (27 | 5.0%), Farming, Fishing & Forestry (25 | 4.7%), and Installation, Maintenance & Repair (23 | 4.3%).
Natural Resources, Construction and Maintenance Occupations by Sex
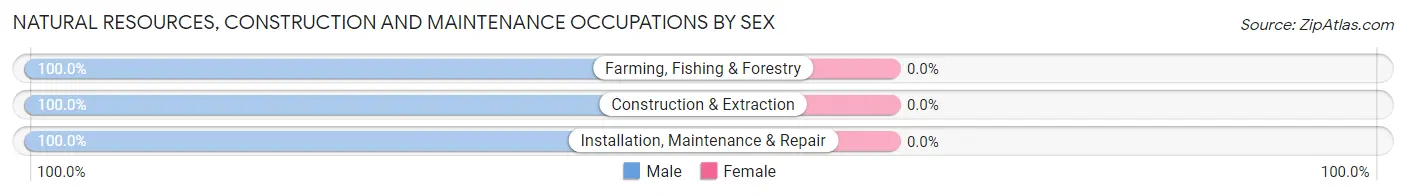
| Occupation | Male | Female |
| Farming, Fishing & Forestry | 25 (100.0%) | 0 (0.0%) |
| Construction & Extraction | 27 (100.0%) | 0 (0.0%) |
| Installation, Maintenance & Repair | 23 (100.0%) | 0 (0.0%) |
| Total (Category) | 75 (100.0%) | 0 (0.0%) |
| Total (Overall) | 273 (50.9%) | 263 (49.1%) |
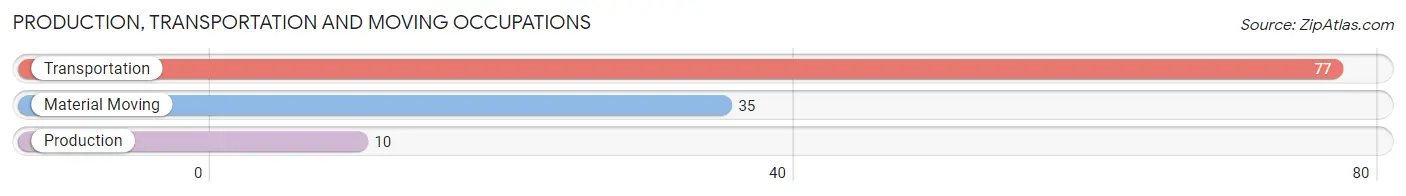
Production, Transportation and Moving Occupations
The most common Production, Transportation and Moving occupations in Taos Pueblo are Transportation (77 | 14.4%), Material Moving (35 | 6.5%), and Production (10 | 1.9%).
Production, Transportation and Moving Occupations by Sex
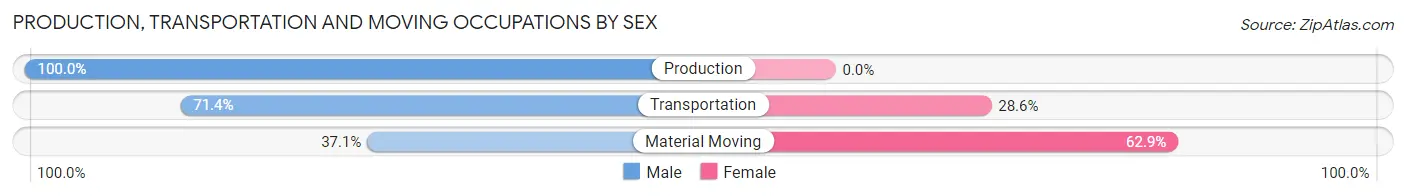
| Occupation | Male | Female |
| Production | 10 (100.0%) | 0 (0.0%) |
| Transportation | 55 (71.4%) | 22 (28.6%) |
| Material Moving | 13 (37.1%) | 22 (62.9%) |
| Total (Category) | 78 (63.9%) | 44 (36.1%) |
| Total (Overall) | 273 (50.9%) | 263 (49.1%) |
Employment Industries by Sex in Taos Pueblo
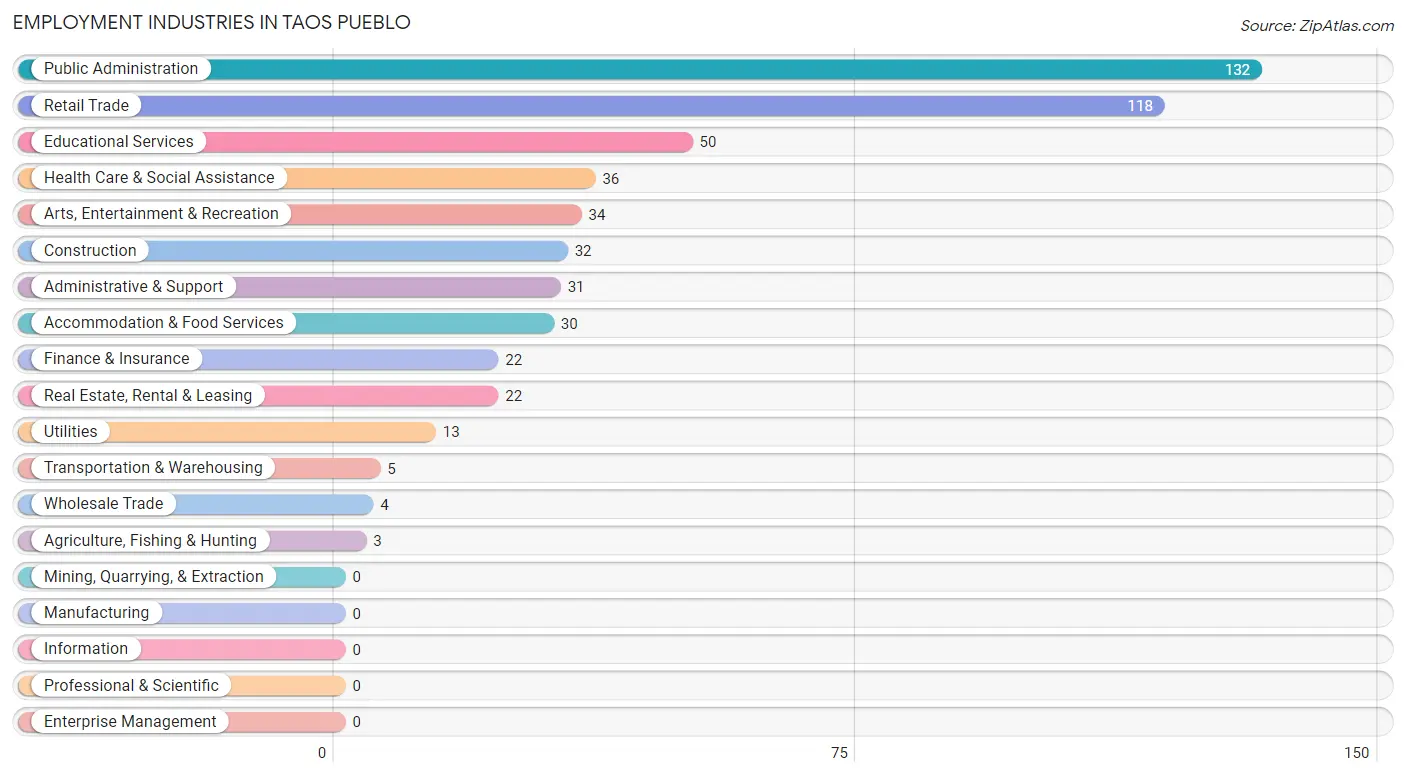
Employment Industries in Taos Pueblo
The major employment industries in Taos Pueblo include Public Administration (132 | 24.6%), Retail Trade (118 | 22.0%), Educational Services (50 | 9.3%), Health Care & Social Assistance (36 | 6.7%), and Arts, Entertainment & Recreation (34 | 6.3%).
Employment Industries by Sex in Taos Pueblo
The Taos Pueblo industries that see more men than women are Construction (100.0%), Wholesale Trade (100.0%), and Transportation & Warehousing (100.0%), whereas the industries that tend to have a higher number of women are Agriculture, Fishing & Hunting (100.0%), Finance & Insurance (100.0%), and Health Care & Social Assistance (100.0%).
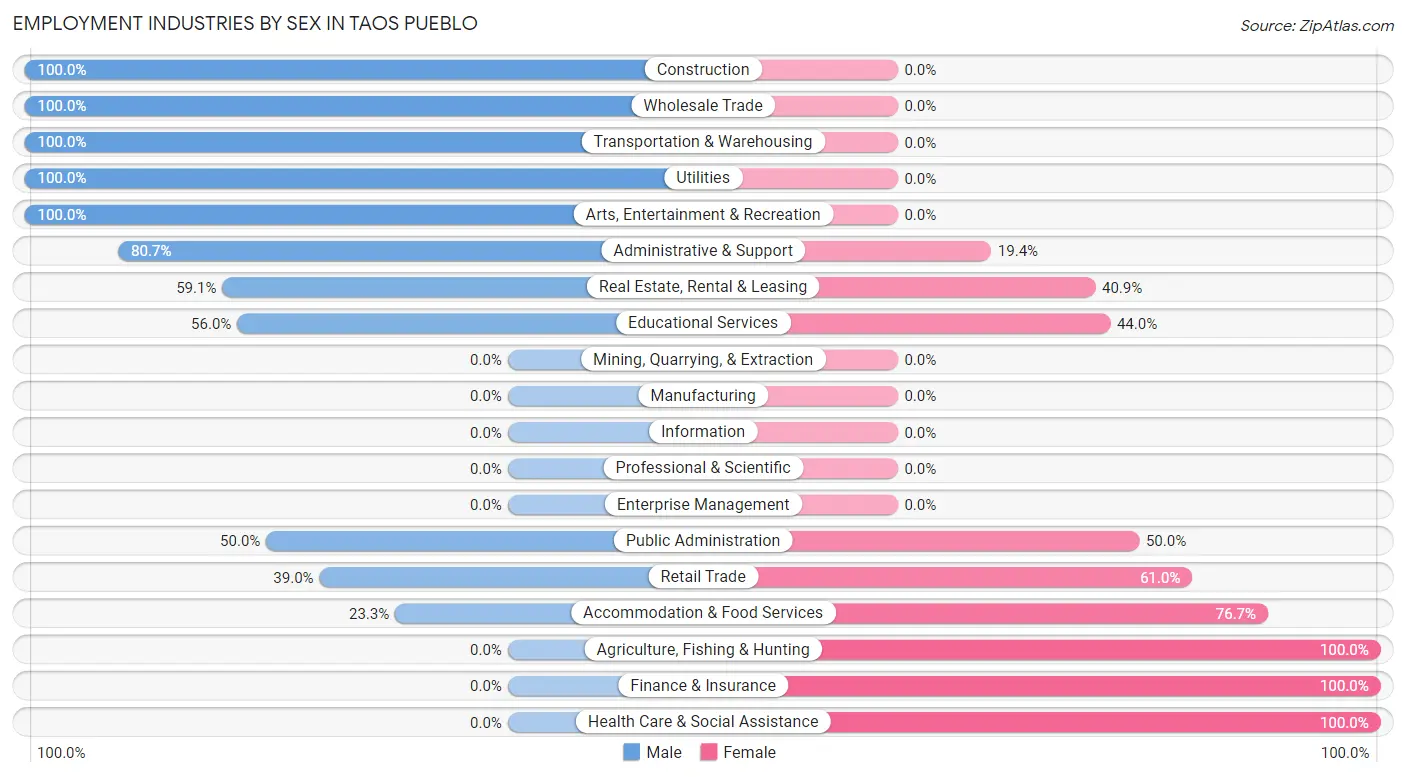
| Industry | Male | Female |
| Agriculture, Fishing & Hunting | 0 (0.0%) | 3 (100.0%) |
| Mining, Quarrying, & Extraction | 0 (0.0%) | 0 (0.0%) |
| Construction | 32 (100.0%) | 0 (0.0%) |
| Manufacturing | 0 (0.0%) | 0 (0.0%) |
| Wholesale Trade | 4 (100.0%) | 0 (0.0%) |
| Retail Trade | 46 (39.0%) | 72 (61.0%) |
| Transportation & Warehousing | 5 (100.0%) | 0 (0.0%) |
| Utilities | 13 (100.0%) | 0 (0.0%) |
| Information | 0 (0.0%) | 0 (0.0%) |
| Finance & Insurance | 0 (0.0%) | 22 (100.0%) |
| Real Estate, Rental & Leasing | 13 (59.1%) | 9 (40.9%) |
| Professional & Scientific | 0 (0.0%) | 0 (0.0%) |
| Enterprise Management | 0 (0.0%) | 0 (0.0%) |
| Administrative & Support | 25 (80.6%) | 6 (19.4%) |
| Educational Services | 28 (56.0%) | 22 (44.0%) |
| Health Care & Social Assistance | 0 (0.0%) | 36 (100.0%) |
| Arts, Entertainment & Recreation | 34 (100.0%) | 0 (0.0%) |
| Accommodation & Food Services | 7 (23.3%) | 23 (76.7%) |
| Public Administration | 66 (50.0%) | 66 (50.0%) |
| Total | 273 (50.9%) | 263 (49.1%) |
Education in Taos Pueblo
School Enrollment in Taos Pueblo
The most common levels of schooling among the 327 students in Taos Pueblo are nursery / preschool (118 | 36.1%), college / undergraduate (80 | 24.5%), and middle school (51 | 15.6%).
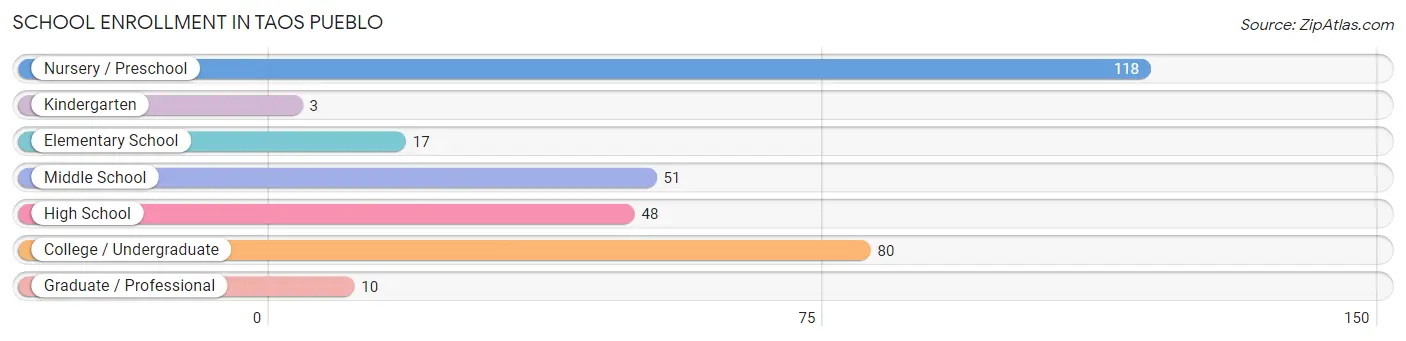
| School Level | # Students | % Students |
| Nursery / Preschool | 118 | 36.1% |
| Kindergarten | 3 | 0.9% |
| Elementary School | 17 | 5.2% |
| Middle School | 51 | 15.6% |
| High School | 48 | 14.7% |
| College / Undergraduate | 80 | 24.5% |
| Graduate / Professional | 10 | 3.1% |
| Total | 327 | 100.0% |
School Enrollment by Age by Funding Source in Taos Pueblo
Out of a total of 327 students who are enrolled in schools in Taos Pueblo, 41 (12.5%) attend a private institution, while the remaining 286 (87.5%) are enrolled in public schools. The age group of 10 to 14 year olds has the highest likelihood of being enrolled in private schools, with 31 (49.2% in the age bracket) enrolled. Conversely, the age group of 3 to 4 year olds has the lowest likelihood of being enrolled in a private school, with 118 (100.0% in the age bracket) attending a public institution.
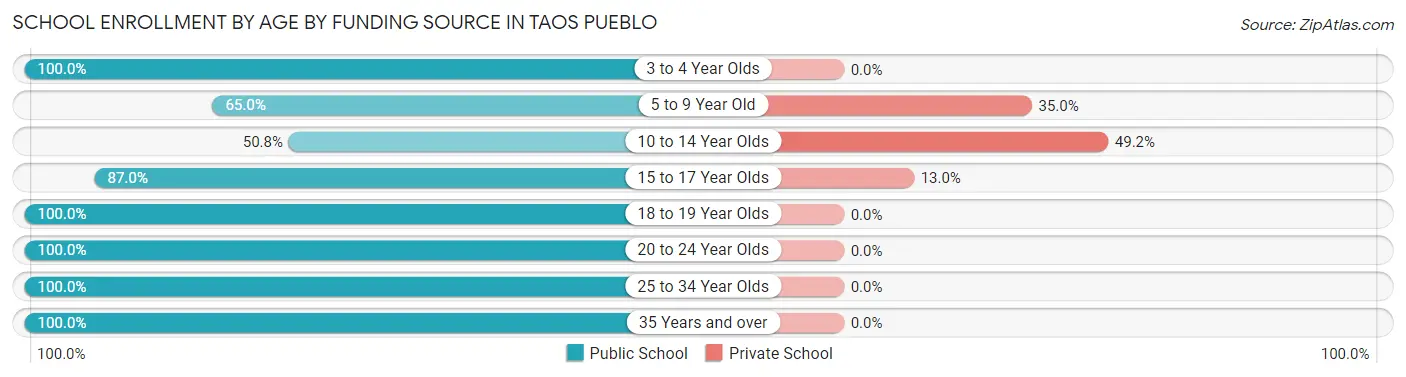
| Age Bracket | Public School | Private School |
| 3 to 4 Year Olds | 118 (100.0%) | 0 (0.0%) |
| 5 to 9 Year Old | 13 (65.0%) | 7 (35.0%) |
| 10 to 14 Year Olds | 32 (50.8%) | 31 (49.2%) |
| 15 to 17 Year Olds | 20 (87.0%) | 3 (13.0%) |
| 18 to 19 Year Olds | 17 (100.0%) | 0 (0.0%) |
| 20 to 24 Year Olds | 53 (100.0%) | 0 (0.0%) |
| 25 to 34 Year Olds | 22 (100.0%) | 0 (0.0%) |
| 35 Years and over | 11 (100.0%) | 0 (0.0%) |
| Total | 286 (87.5%) | 41 (12.5%) |
Educational Attainment by Field of Study in Taos Pueblo
Visual & performing arts (16 | 21.0%), science & technology (15 | 19.7%), engineering (9 | 11.8%), psychology (8 | 10.5%), and social sciences (8 | 10.5%) are the most common fields of study among 76 individuals in Taos Pueblo who have obtained a bachelor's degree or higher.
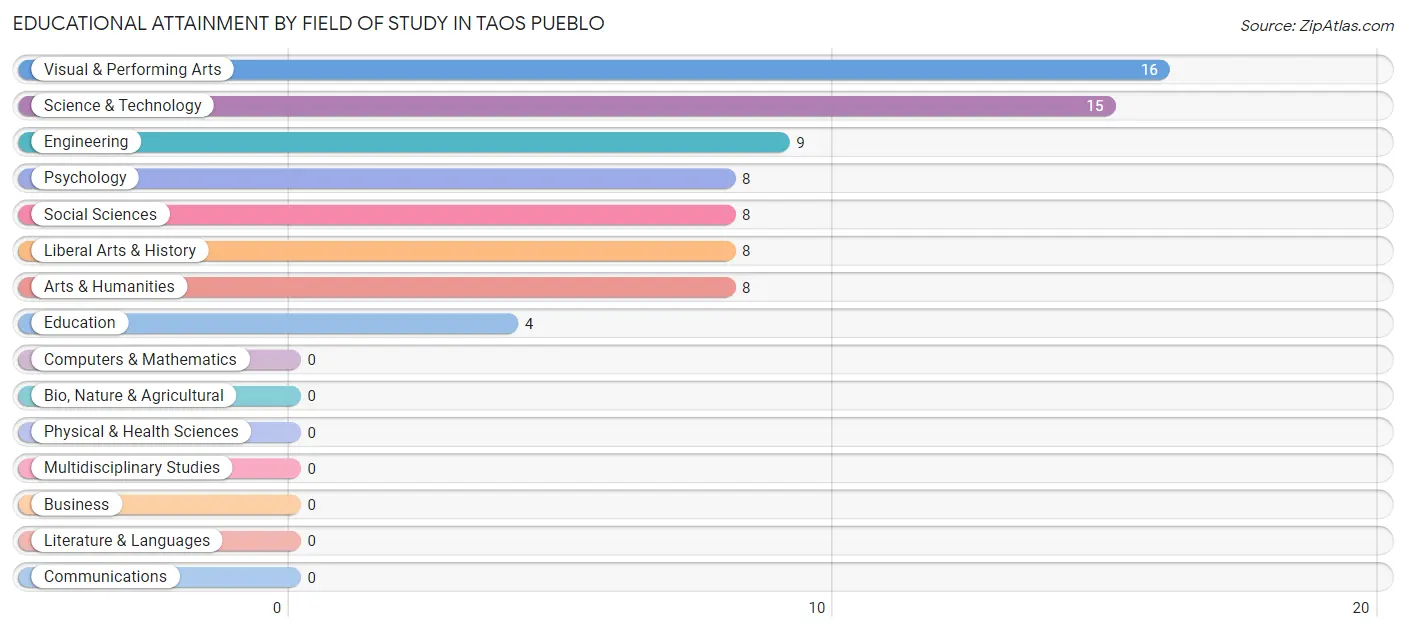
| Field of Study | # Graduates | % Graduates |
| Computers & Mathematics | 0 | 0.0% |
| Bio, Nature & Agricultural | 0 | 0.0% |
| Physical & Health Sciences | 0 | 0.0% |
| Psychology | 8 | 10.5% |
| Social Sciences | 8 | 10.5% |
| Engineering | 9 | 11.8% |
| Multidisciplinary Studies | 0 | 0.0% |
| Science & Technology | 15 | 19.7% |
| Business | 0 | 0.0% |
| Education | 4 | 5.3% |
| Literature & Languages | 0 | 0.0% |
| Liberal Arts & History | 8 | 10.5% |
| Visual & Performing Arts | 16 | 21.0% |
| Communications | 0 | 0.0% |
| Arts & Humanities | 8 | 10.5% |
| Total | 76 | 100.0% |
Transportation & Commute in Taos Pueblo
Vehicle Availability by Sex in Taos Pueblo
The most prevalent vehicle ownership categories in Taos Pueblo are males with 2 vehicles (76, accounting for 27.8%) and females with 2 vehicles (82, making up 28.2%).
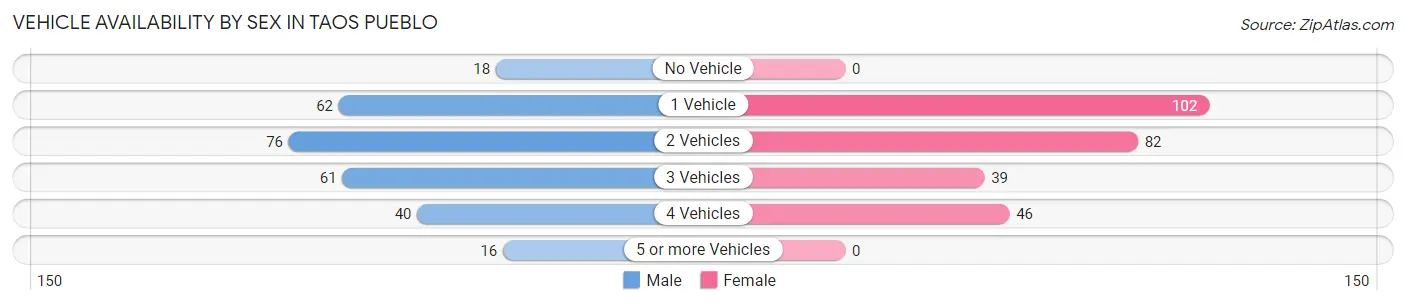
| Vehicles Available | Male | Female |
| No Vehicle | 18 (6.6%) | 0 (0.0%) |
| 1 Vehicle | 62 (22.7%) | 102 (37.9%) |
| 2 Vehicles | 76 (27.8%) | 82 (30.5%) |
| 3 Vehicles | 61 (22.3%) | 39 (14.5%) |
| 4 Vehicles | 40 (14.6%) | 46 (17.1%) |
| 5 or more Vehicles | 16 (5.9%) | 0 (0.0%) |
| Total | 273 (100.0%) | 269 (100.0%) |
Commute Time in Taos Pueblo
The most frequently occuring commute durations in Taos Pueblo are 15 to 19 minutes (144 commuters, 27.4%), 5 to 9 minutes (139 commuters, 26.4%), and 10 to 14 minutes (94 commuters, 17.9%).
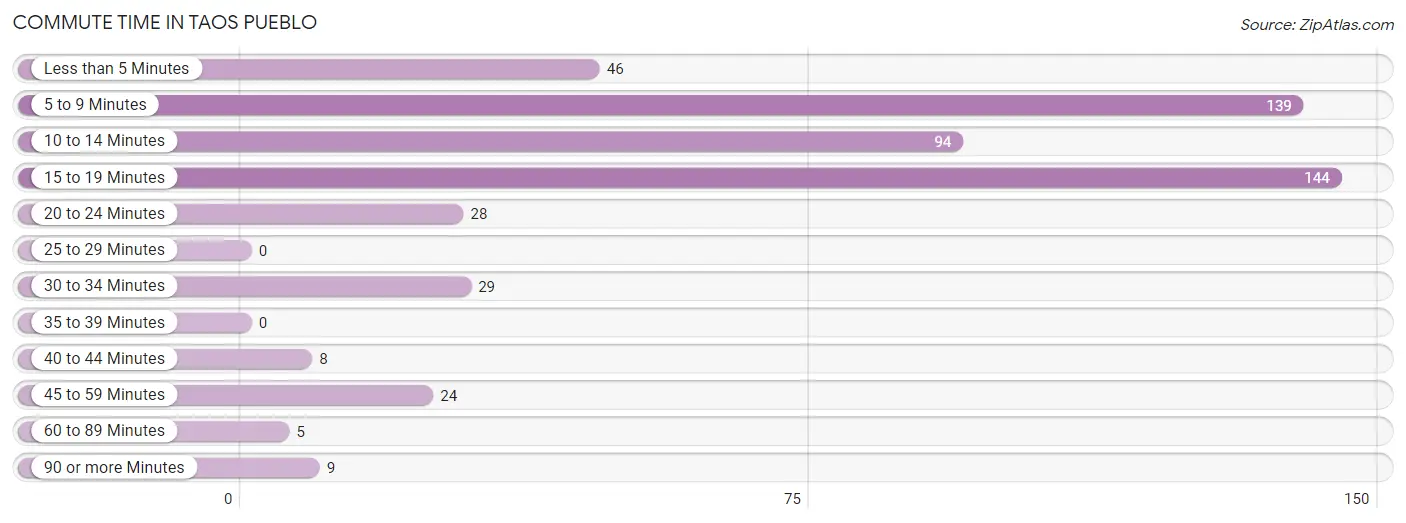
| Commute Time | # Commuters | % Commuters |
| Less than 5 Minutes | 46 | 8.7% |
| 5 to 9 Minutes | 139 | 26.4% |
| 10 to 14 Minutes | 94 | 17.9% |
| 15 to 19 Minutes | 144 | 27.4% |
| 20 to 24 Minutes | 28 | 5.3% |
| 25 to 29 Minutes | 0 | 0.0% |
| 30 to 34 Minutes | 29 | 5.5% |
| 35 to 39 Minutes | 0 | 0.0% |
| 40 to 44 Minutes | 8 | 1.5% |
| 45 to 59 Minutes | 24 | 4.6% |
| 60 to 89 Minutes | 5 | 0.9% |
| 90 or more Minutes | 9 | 1.7% |
Commute Time by Sex in Taos Pueblo
The most common commute times in Taos Pueblo are 5 to 9 minutes (69 commuters, 25.7%) for males and 15 to 19 minutes (102 commuters, 39.7%) for females.
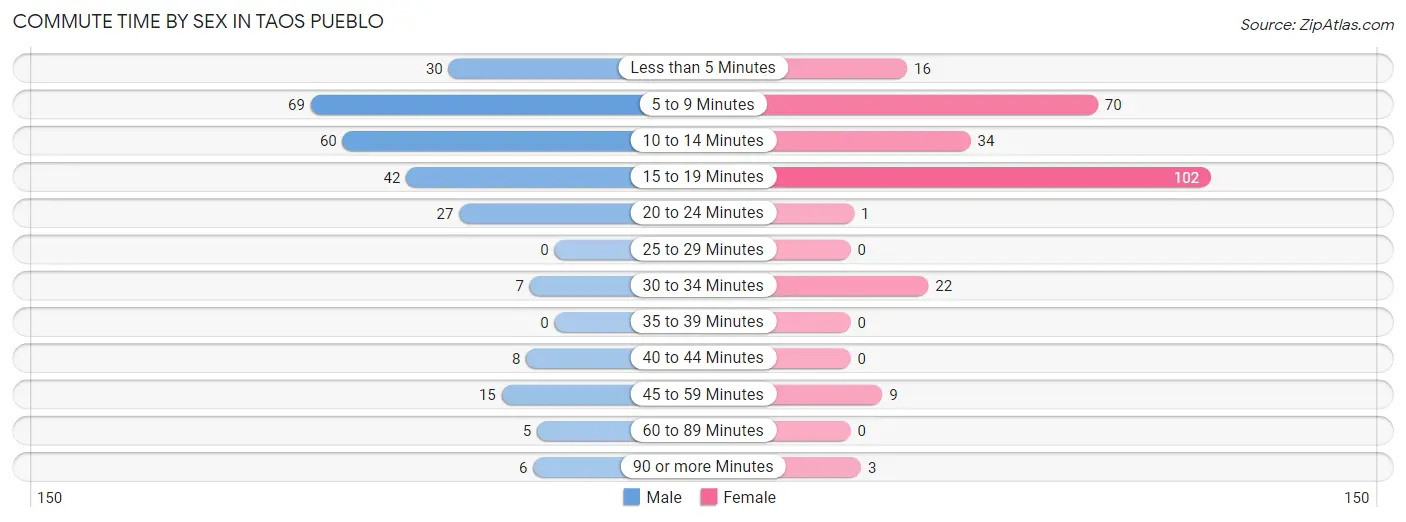
| Commute Time | Male | Female |
| Less than 5 Minutes | 30 (11.2%) | 16 (6.2%) |
| 5 to 9 Minutes | 69 (25.7%) | 70 (27.2%) |
| 10 to 14 Minutes | 60 (22.3%) | 34 (13.2%) |
| 15 to 19 Minutes | 42 (15.6%) | 102 (39.7%) |
| 20 to 24 Minutes | 27 (10.0%) | 1 (0.4%) |
| 25 to 29 Minutes | 0 (0.0%) | 0 (0.0%) |
| 30 to 34 Minutes | 7 (2.6%) | 22 (8.6%) |
| 35 to 39 Minutes | 0 (0.0%) | 0 (0.0%) |
| 40 to 44 Minutes | 8 (3.0%) | 0 (0.0%) |
| 45 to 59 Minutes | 15 (5.6%) | 9 (3.5%) |
| 60 to 89 Minutes | 5 (1.9%) | 0 (0.0%) |
| 90 or more Minutes | 6 (2.2%) | 3 (1.2%) |
Time of Departure to Work by Sex in Taos Pueblo
The most frequent times of departure to work in Taos Pueblo are 7:30 AM to 7:59 AM (75, 27.9%) for males and 7:30 AM to 7:59 AM (132, 51.4%) for females.
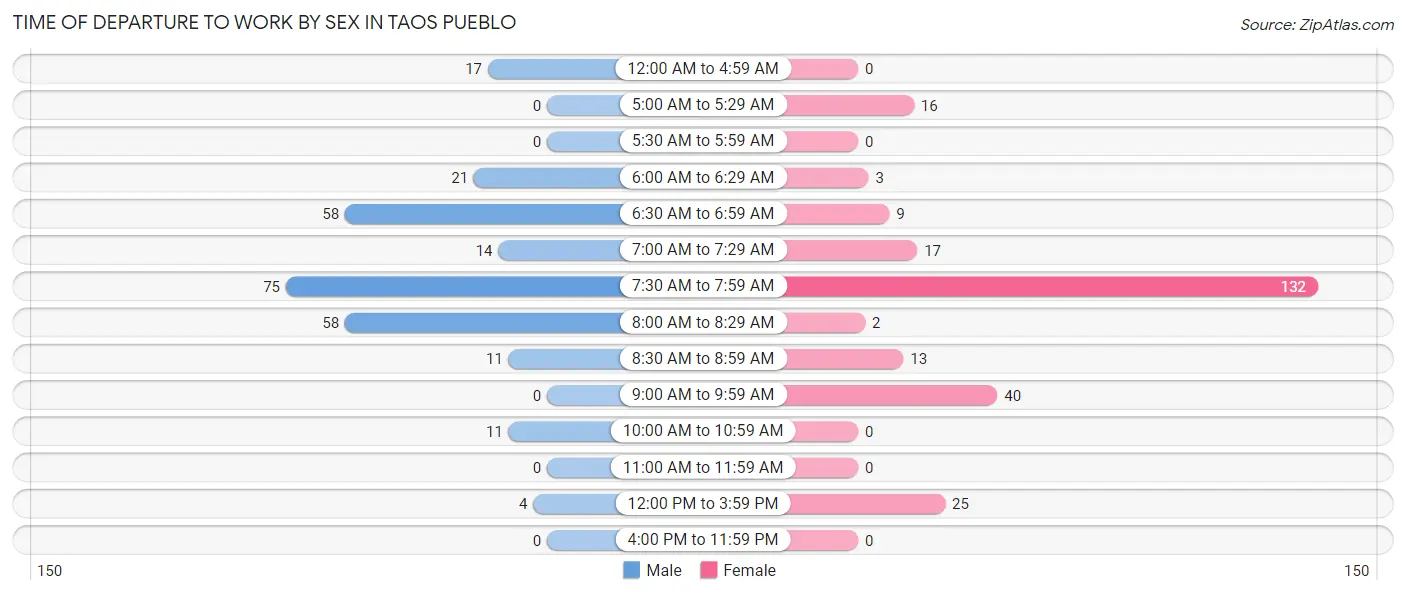
| Time of Departure | Male | Female |
| 12:00 AM to 4:59 AM | 17 (6.3%) | 0 (0.0%) |
| 5:00 AM to 5:29 AM | 0 (0.0%) | 16 (6.2%) |
| 5:30 AM to 5:59 AM | 0 (0.0%) | 0 (0.0%) |
| 6:00 AM to 6:29 AM | 21 (7.8%) | 3 (1.2%) |
| 6:30 AM to 6:59 AM | 58 (21.6%) | 9 (3.5%) |
| 7:00 AM to 7:29 AM | 14 (5.2%) | 17 (6.6%) |
| 7:30 AM to 7:59 AM | 75 (27.9%) | 132 (51.4%) |
| 8:00 AM to 8:29 AM | 58 (21.6%) | 2 (0.8%) |
| 8:30 AM to 8:59 AM | 11 (4.1%) | 13 (5.1%) |
| 9:00 AM to 9:59 AM | 0 (0.0%) | 40 (15.6%) |
| 10:00 AM to 10:59 AM | 11 (4.1%) | 0 (0.0%) |
| 11:00 AM to 11:59 AM | 0 (0.0%) | 0 (0.0%) |
| 12:00 PM to 3:59 PM | 4 (1.5%) | 25 (9.7%) |
| 4:00 PM to 11:59 PM | 0 (0.0%) | 0 (0.0%) |
| Total | 269 (100.0%) | 257 (100.0%) |
Housing Occupancy in Taos Pueblo
Occupancy by Ownership in Taos Pueblo
Of the total 379 dwellings in Taos Pueblo, owner-occupied units account for 303 (79.9%), while renter-occupied units make up 76 (20.1%).
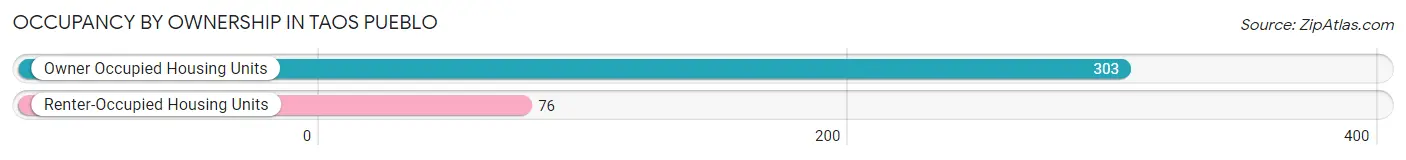
| Occupancy | # Housing Units | % Housing Units |
| Owner Occupied Housing Units | 303 | 79.9% |
| Renter-Occupied Housing Units | 76 | 20.1% |
| Total Occupied Housing Units | 379 | 100.0% |
Occupancy by Household Size in Taos Pueblo
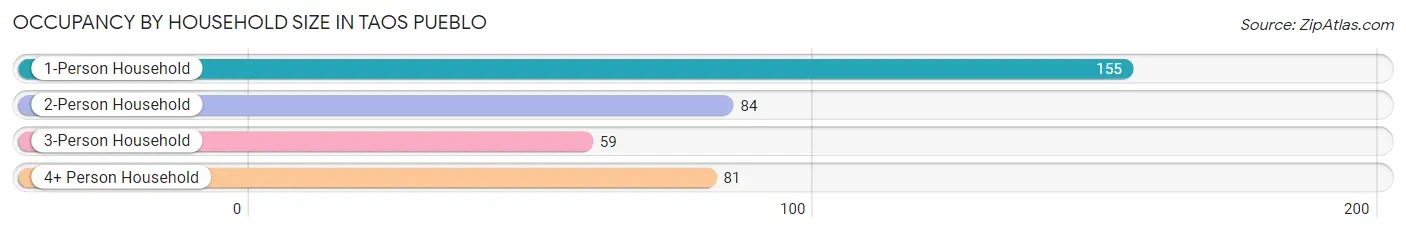
| Household Size | # Housing Units | % Housing Units |
| 1-Person Household | 155 | 40.9% |
| 2-Person Household | 84 | 22.2% |
| 3-Person Household | 59 | 15.6% |
| 4+ Person Household | 81 | 21.4% |
| Total Housing Units | 379 | 100.0% |
Occupancy by Ownership by Household Size in Taos Pueblo
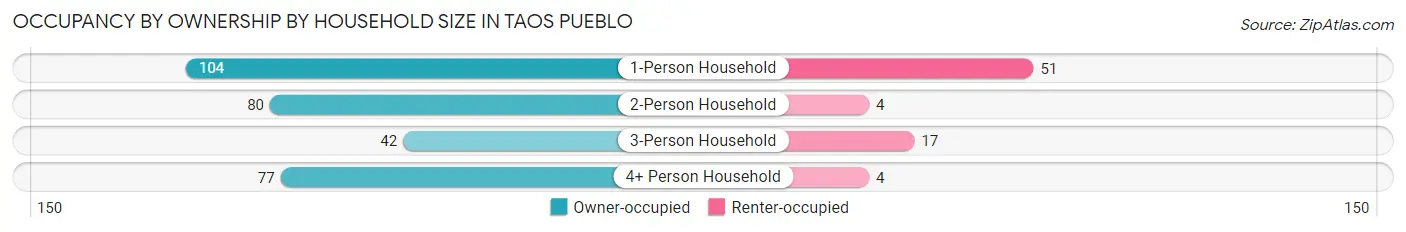
| Household Size | Owner-occupied | Renter-occupied |
| 1-Person Household | 104 (67.1%) | 51 (32.9%) |
| 2-Person Household | 80 (95.2%) | 4 (4.8%) |
| 3-Person Household | 42 (71.2%) | 17 (28.8%) |
| 4+ Person Household | 77 (95.1%) | 4 (4.9%) |
| Total Housing Units | 303 (79.9%) | 76 (20.1%) |
Occupancy by Educational Attainment in Taos Pueblo
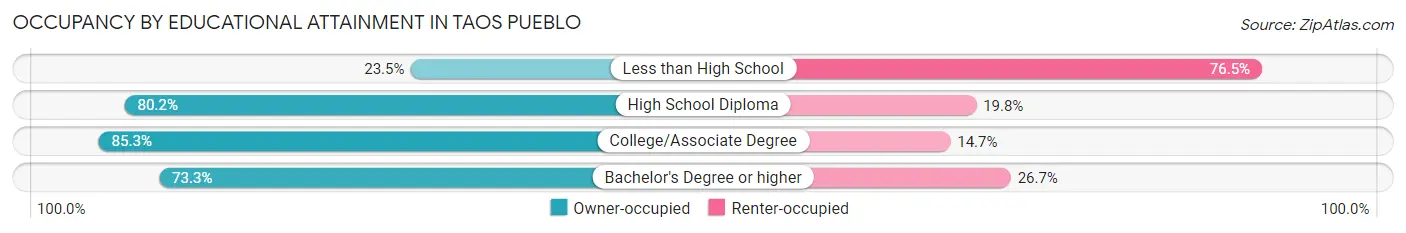
| Household Size | Owner-occupied | Renter-occupied |
| Less than High School | 4 (23.5%) | 13 (76.5%) |
| High School Diploma | 97 (80.2%) | 24 (19.8%) |
| College/Associate Degree | 180 (85.3%) | 31 (14.7%) |
| Bachelor's Degree or higher | 22 (73.3%) | 8 (26.7%) |
Occupancy by Age of Householder in Taos Pueblo
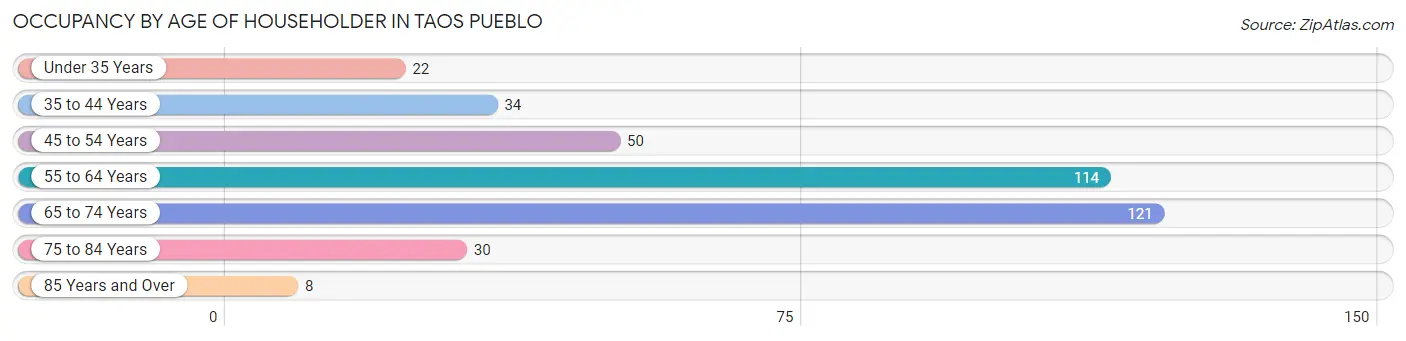
| Age Bracket | # Households | % Households |
| Under 35 Years | 22 | 5.8% |
| 35 to 44 Years | 34 | 9.0% |
| 45 to 54 Years | 50 | 13.2% |
| 55 to 64 Years | 114 | 30.1% |
| 65 to 74 Years | 121 | 31.9% |
| 75 to 84 Years | 30 | 7.9% |
| 85 Years and Over | 8 | 2.1% |
| Total | 379 | 100.0% |
Housing Finances in Taos Pueblo
Median Income by Occupancy in Taos Pueblo
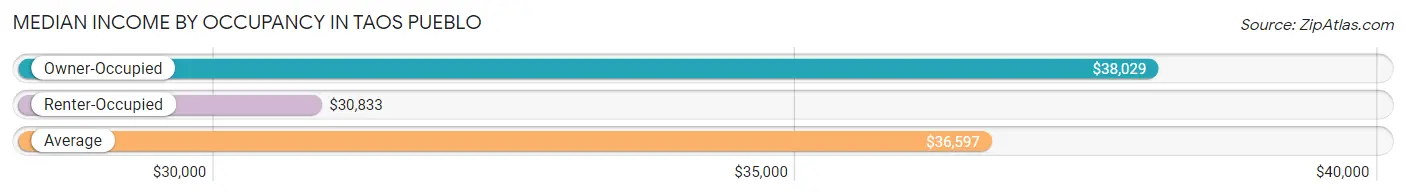
| Occupancy Type | # Households | Median Income |
| Owner-Occupied | 303 (79.9%) | $38,029 |
| Renter-Occupied | 76 (20.1%) | $30,833 |
| Average | 379 (100.0%) | $36,597 |
Occupancy by Householder Income Bracket in Taos Pueblo
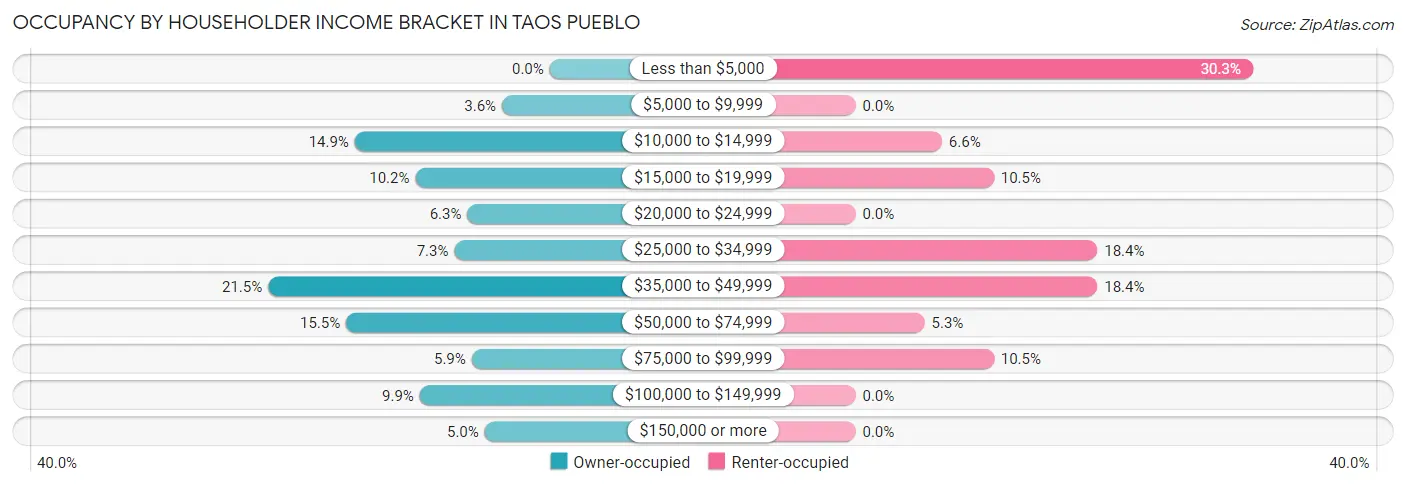
| Income Bracket | Owner-occupied | Renter-occupied |
| Less than $5,000 | 0 (0.0%) | 23 (30.3%) |
| $5,000 to $9,999 | 11 (3.6%) | 0 (0.0%) |
| $10,000 to $14,999 | 45 (14.8%) | 5 (6.6%) |
| $15,000 to $19,999 | 31 (10.2%) | 8 (10.5%) |
| $20,000 to $24,999 | 19 (6.3%) | 0 (0.0%) |
| $25,000 to $34,999 | 22 (7.3%) | 14 (18.4%) |
| $35,000 to $49,999 | 65 (21.4%) | 14 (18.4%) |
| $50,000 to $74,999 | 47 (15.5%) | 4 (5.3%) |
| $75,000 to $99,999 | 18 (5.9%) | 8 (10.5%) |
| $100,000 to $149,999 | 30 (9.9%) | 0 (0.0%) |
| $150,000 or more | 15 (5.0%) | 0 (0.0%) |
| Total | 303 (100.0%) | 76 (100.0%) |
Monthly Housing Cost Tiers in Taos Pueblo
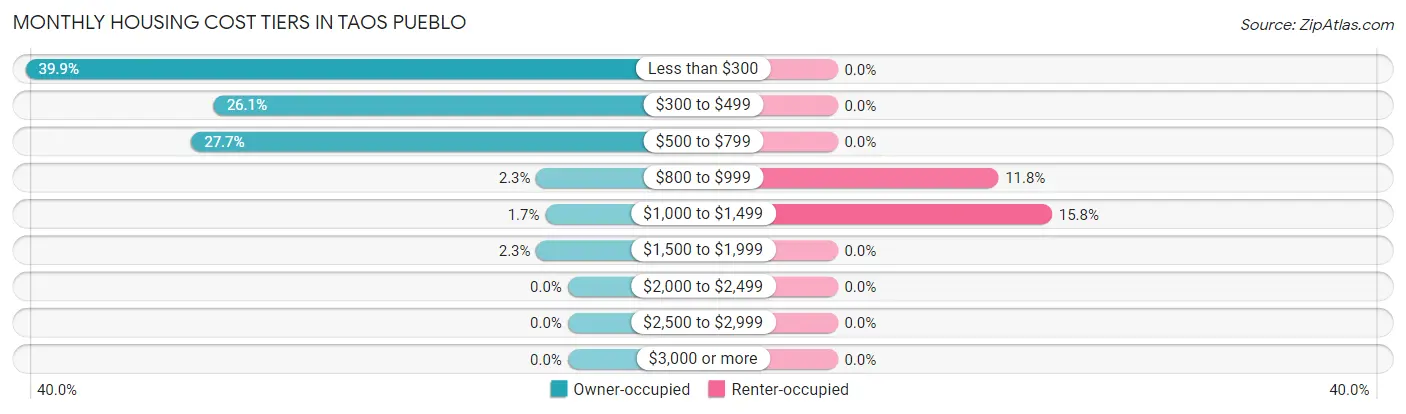
| Monthly Cost | Owner-occupied | Renter-occupied |
| Less than $300 | 121 (39.9%) | 0 (0.0%) |
| $300 to $499 | 79 (26.1%) | 0 (0.0%) |
| $500 to $799 | 84 (27.7%) | 0 (0.0%) |
| $800 to $999 | 7 (2.3%) | 9 (11.8%) |
| $1,000 to $1,499 | 5 (1.7%) | 12 (15.8%) |
| $1,500 to $1,999 | 7 (2.3%) | 0 (0.0%) |
| $2,000 to $2,499 | 0 (0.0%) | 0 (0.0%) |
| $2,500 to $2,999 | 0 (0.0%) | 0 (0.0%) |
| $3,000 or more | 0 (0.0%) | 0 (0.0%) |
| Total | 303 (100.0%) | 76 (100.0%) |
Physical Housing Characteristics in Taos Pueblo
Housing Structures in Taos Pueblo
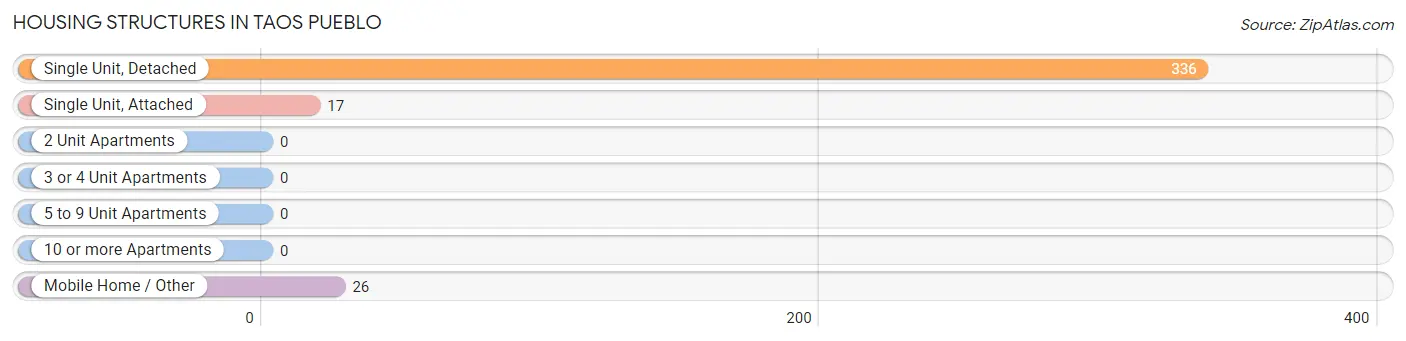
| Structure Type | # Housing Units | % Housing Units |
| Single Unit, Detached | 336 | 88.6% |
| Single Unit, Attached | 17 | 4.5% |
| 2 Unit Apartments | 0 | 0.0% |
| 3 or 4 Unit Apartments | 0 | 0.0% |
| 5 to 9 Unit Apartments | 0 | 0.0% |
| 10 or more Apartments | 0 | 0.0% |
| Mobile Home / Other | 26 | 6.9% |
| Total | 379 | 100.0% |
Housing Structures by Occupancy in Taos Pueblo
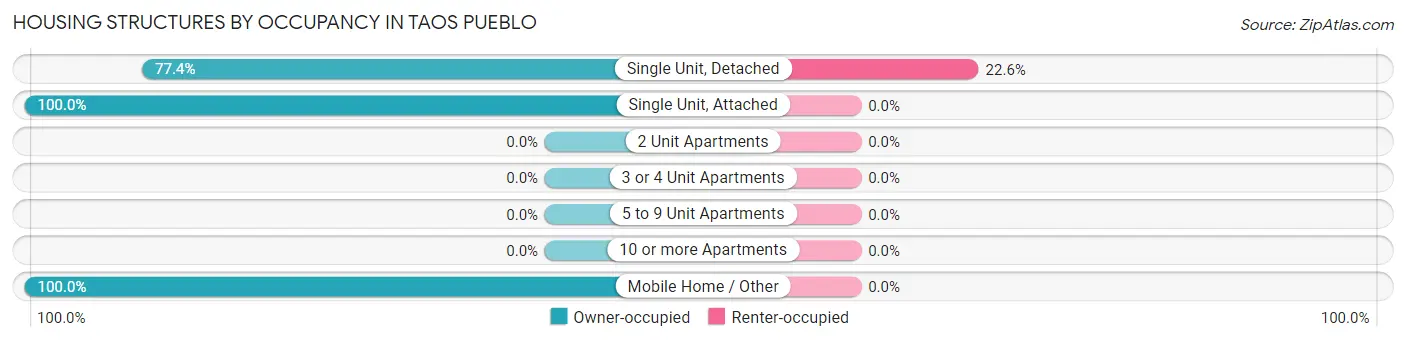
| Structure Type | Owner-occupied | Renter-occupied |
| Single Unit, Detached | 260 (77.4%) | 76 (22.6%) |
| Single Unit, Attached | 17 (100.0%) | 0 (0.0%) |
| 2 Unit Apartments | 0 (0.0%) | 0 (0.0%) |
| 3 or 4 Unit Apartments | 0 (0.0%) | 0 (0.0%) |
| 5 to 9 Unit Apartments | 0 (0.0%) | 0 (0.0%) |
| 10 or more Apartments | 0 (0.0%) | 0 (0.0%) |
| Mobile Home / Other | 26 (100.0%) | 0 (0.0%) |
| Total | 303 (79.9%) | 76 (20.1%) |
Housing Structures by Number of Rooms in Taos Pueblo
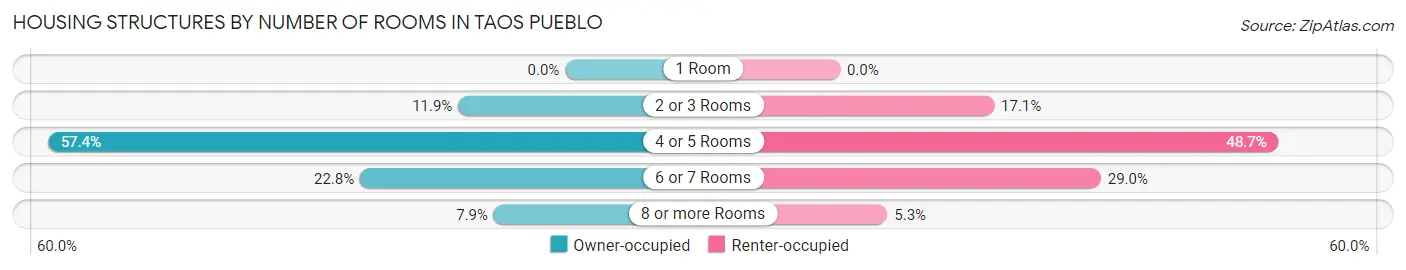
| Number of Rooms | Owner-occupied | Renter-occupied |
| 1 Room | 0 (0.0%) | 0 (0.0%) |
| 2 or 3 Rooms | 36 (11.9%) | 13 (17.1%) |
| 4 or 5 Rooms | 174 (57.4%) | 37 (48.7%) |
| 6 or 7 Rooms | 69 (22.8%) | 22 (28.9%) |
| 8 or more Rooms | 24 (7.9%) | 4 (5.3%) |
| Total | 303 (100.0%) | 76 (100.0%) |
Housing Structure by Heating Type in Taos Pueblo
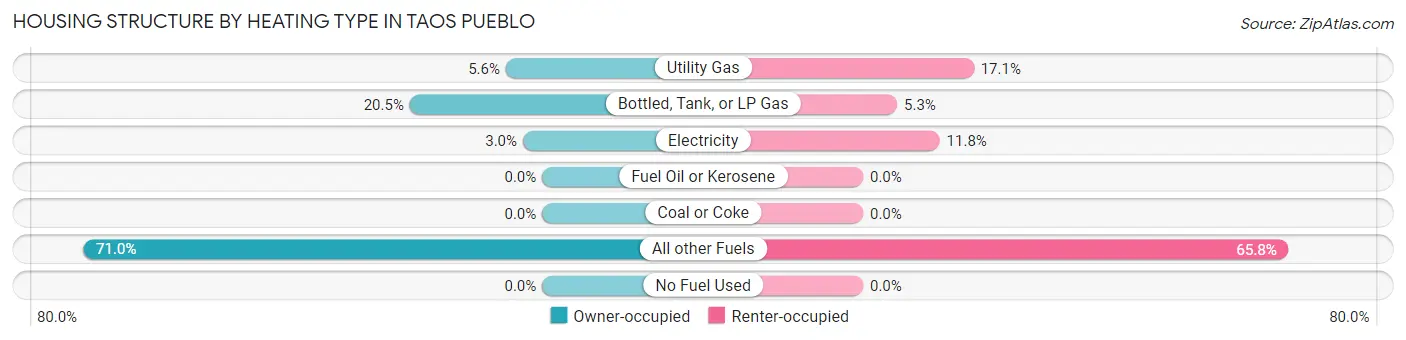
| Heating Type | Owner-occupied | Renter-occupied |
| Utility Gas | 17 (5.6%) | 13 (17.1%) |
| Bottled, Tank, or LP Gas | 62 (20.5%) | 4 (5.3%) |
| Electricity | 9 (3.0%) | 9 (11.8%) |
| Fuel Oil or Kerosene | 0 (0.0%) | 0 (0.0%) |
| Coal or Coke | 0 (0.0%) | 0 (0.0%) |
| All other Fuels | 215 (71.0%) | 50 (65.8%) |
| No Fuel Used | 0 (0.0%) | 0 (0.0%) |
| Total | 303 (100.0%) | 76 (100.0%) |
Household Vehicle Usage in Taos Pueblo
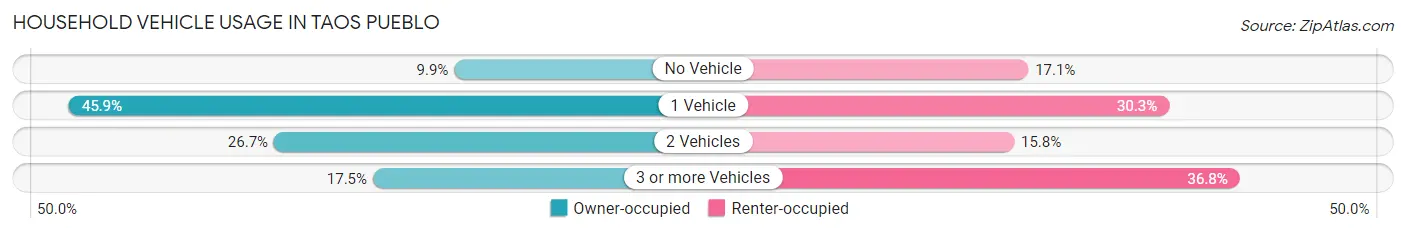
| Vehicles per Household | Owner-occupied | Renter-occupied |
| No Vehicle | 30 (9.9%) | 13 (17.1%) |
| 1 Vehicle | 139 (45.9%) | 23 (30.3%) |
| 2 Vehicles | 81 (26.7%) | 12 (15.8%) |
| 3 or more Vehicles | 53 (17.5%) | 28 (36.8%) |
| Total | 303 (100.0%) | 76 (100.0%) |
Real Estate & Mortgages in Taos Pueblo
Real Estate and Mortgage Overview in Taos Pueblo
| Characteristic | Without Mortgage | With Mortgage |
| Housing Units | 292 | 11 |
| Median Property Value | $327,600 | $0 |
| Median Household Income | $37,500 | $0 |
| Monthly Housing Costs | $343 | $0 |
| Real Estate Taxes | $1,577 | $4 |
Property Value by Mortgage Status in Taos Pueblo
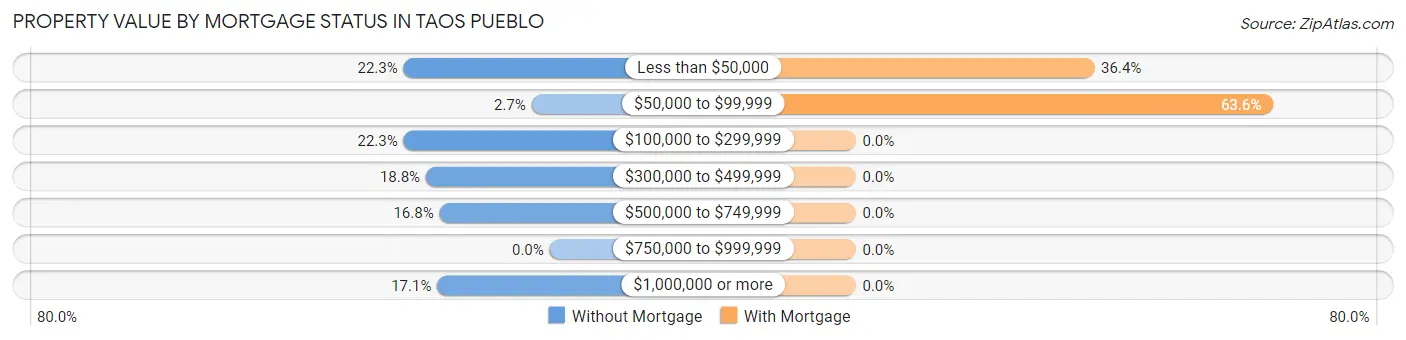
| Property Value | Without Mortgage | With Mortgage |
| Less than $50,000 | 65 (22.3%) | 4 (36.4%) |
| $50,000 to $99,999 | 8 (2.7%) | 7 (63.6%) |
| $100,000 to $299,999 | 65 (22.3%) | 0 (0.0%) |
| $300,000 to $499,999 | 55 (18.8%) | 0 (0.0%) |
| $500,000 to $749,999 | 49 (16.8%) | 0 (0.0%) |
| $750,000 to $999,999 | 0 (0.0%) | 0 (0.0%) |
| $1,000,000 or more | 50 (17.1%) | 0 (0.0%) |
| Total | 292 (100.0%) | 11 (100.0%) |
Household Income by Mortgage Status in Taos Pueblo
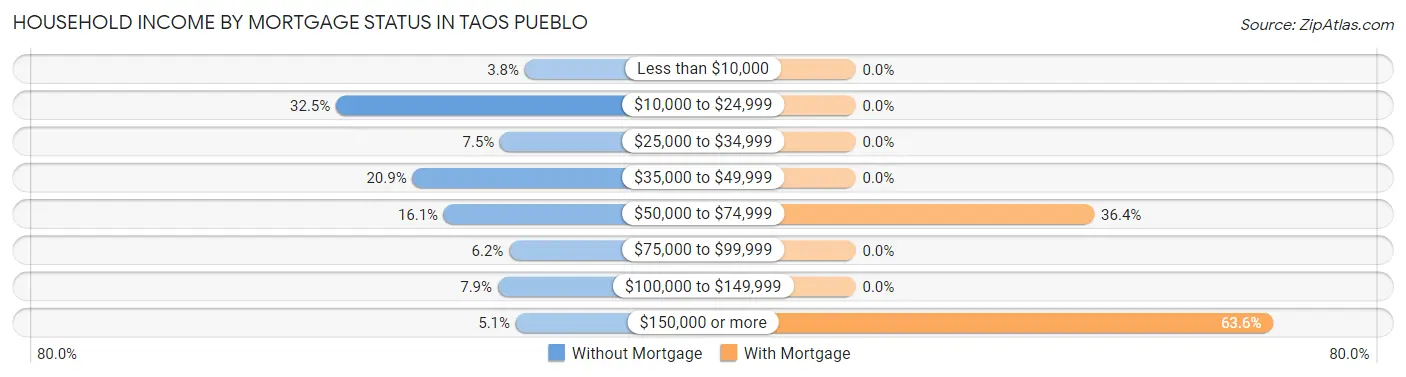
| Household Income | Without Mortgage | With Mortgage |
| Less than $10,000 | 11 (3.8%) | 0 (0.0%) |
| $10,000 to $24,999 | 95 (32.5%) | 0 (0.0%) |
| $25,000 to $34,999 | 22 (7.5%) | 0 (0.0%) |
| $35,000 to $49,999 | 61 (20.9%) | 0 (0.0%) |
| $50,000 to $74,999 | 47 (16.1%) | 4 (36.4%) |
| $75,000 to $99,999 | 18 (6.2%) | 0 (0.0%) |
| $100,000 to $149,999 | 23 (7.9%) | 0 (0.0%) |
| $150,000 or more | 15 (5.1%) | 7 (63.6%) |
| Total | 292 (100.0%) | 11 (100.0%) |
Property Value to Household Income Ratio in Taos Pueblo
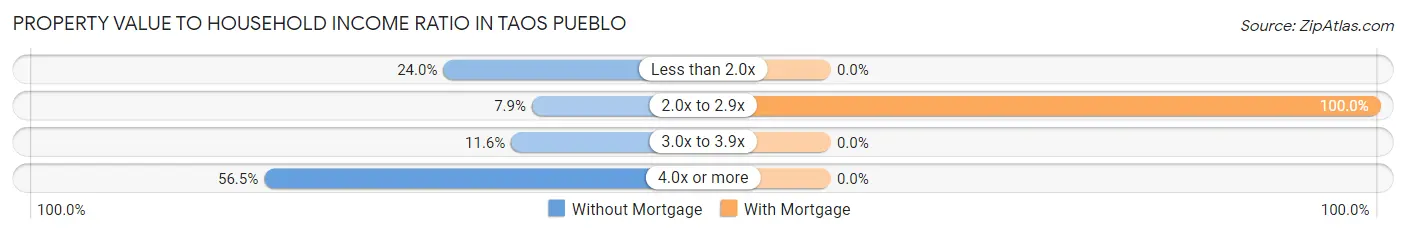
| Value-to-Income Ratio | Without Mortgage | With Mortgage |
| Less than 2.0x | 70 (24.0%) | 0 (0.0%) |
| 2.0x to 2.9x | 23 (7.9%) | 11 (100.0%) |
| 3.0x to 3.9x | 34 (11.6%) | 0 (0.0%) |
| 4.0x or more | 165 (56.5%) | 0 (0.0%) |
| Total | 292 (100.0%) | 11 (100.0%) |
Real Estate Taxes by Mortgage Status in Taos Pueblo
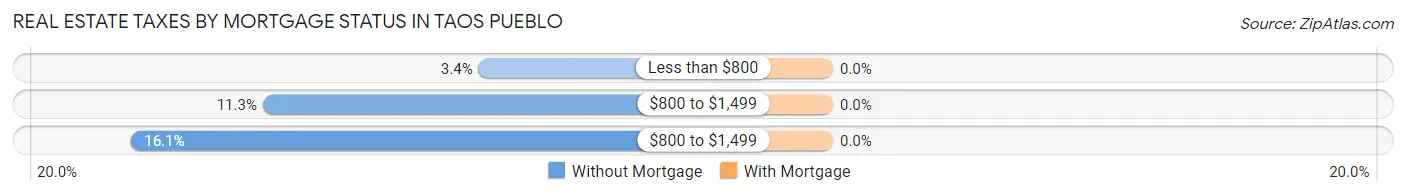
| Property Taxes | Without Mortgage | With Mortgage |
| Less than $800 | 10 (3.4%) | 0 (0.0%) |
| $800 to $1,499 | 33 (11.3%) | 0 (0.0%) |
| $800 to $1,499 | 47 (16.1%) | 0 (0.0%) |
| Total | 292 (100.0%) | 11 (100.0%) |
Health & Disability in Taos Pueblo
Health Insurance Coverage by Age in Taos Pueblo
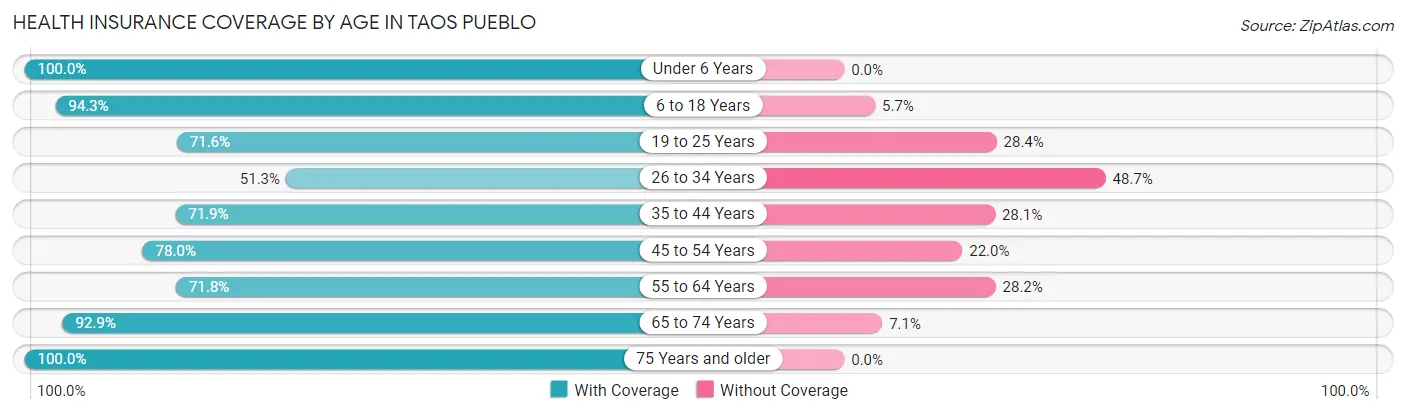
| Age Bracket | With Coverage | Without Coverage |
| Under 6 Years | 165 (100.0%) | 0 (0.0%) |
| 6 to 18 Years | 115 (94.3%) | 7 (5.7%) |
| 19 to 25 Years | 116 (71.6%) | 46 (28.4%) |
| 26 to 34 Years | 40 (51.3%) | 38 (48.7%) |
| 35 to 44 Years | 174 (71.9%) | 68 (28.1%) |
| 45 to 54 Years | 124 (78.0%) | 35 (22.0%) |
| 55 to 64 Years | 117 (71.8%) | 46 (28.2%) |
| 65 to 74 Years | 184 (92.9%) | 14 (7.1%) |
| 75 Years and older | 125 (100.0%) | 0 (0.0%) |
| Total | 1,160 (82.0%) | 254 (18.0%) |
Health Insurance Coverage by Citizenship Status in Taos Pueblo
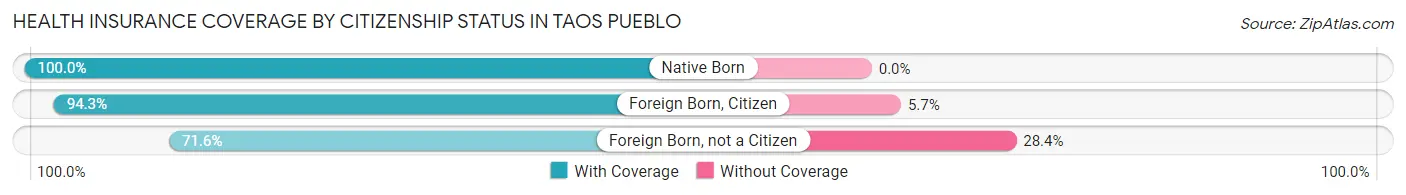
| Citizenship Status | With Coverage | Without Coverage |
| Native Born | 165 (100.0%) | 0 (0.0%) |
| Foreign Born, Citizen | 115 (94.3%) | 7 (5.7%) |
| Foreign Born, not a Citizen | 116 (71.6%) | 46 (28.4%) |
Health Insurance Coverage by Household Income in Taos Pueblo
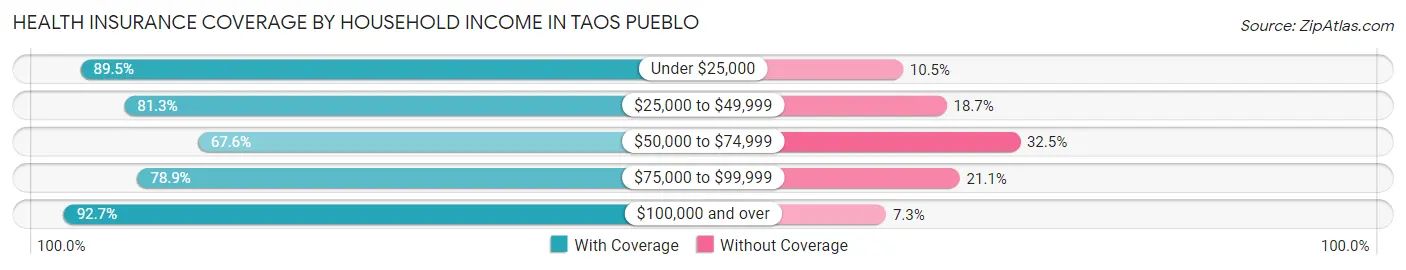
| Household Income | With Coverage | Without Coverage |
| Under $25,000 | 324 (89.5%) | 38 (10.5%) |
| $25,000 to $49,999 | 396 (81.3%) | 91 (18.7%) |
| $50,000 to $74,999 | 179 (67.5%) | 86 (32.5%) |
| $75,000 to $99,999 | 97 (78.9%) | 26 (21.1%) |
| $100,000 and over | 164 (92.7%) | 13 (7.3%) |
Public vs Private Health Insurance Coverage by Age in Taos Pueblo
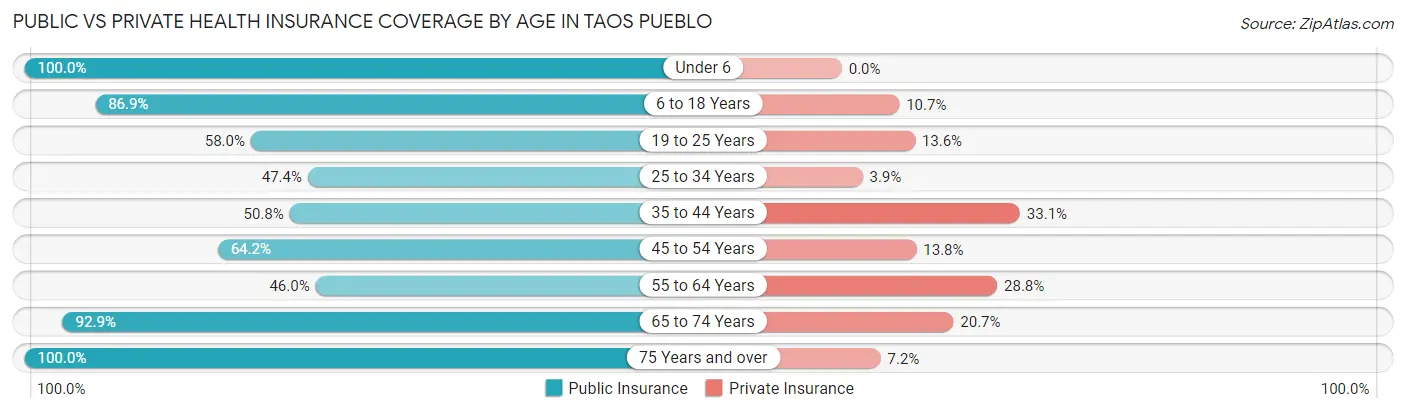
| Age Bracket | Public Insurance | Private Insurance |
| Under 6 | 165 (100.0%) | 0 (0.0%) |
| 6 to 18 Years | 106 (86.9%) | 13 (10.7%) |
| 19 to 25 Years | 94 (58.0%) | 22 (13.6%) |
| 25 to 34 Years | 37 (47.4%) | 3 (3.8%) |
| 35 to 44 Years | 123 (50.8%) | 80 (33.1%) |
| 45 to 54 Years | 102 (64.1%) | 22 (13.8%) |
| 55 to 64 Years | 75 (46.0%) | 47 (28.8%) |
| 65 to 74 Years | 184 (92.9%) | 41 (20.7%) |
| 75 Years and over | 125 (100.0%) | 9 (7.2%) |
| Total | 1,011 (71.5%) | 237 (16.8%) |
Disability Status by Sex by Age in Taos Pueblo
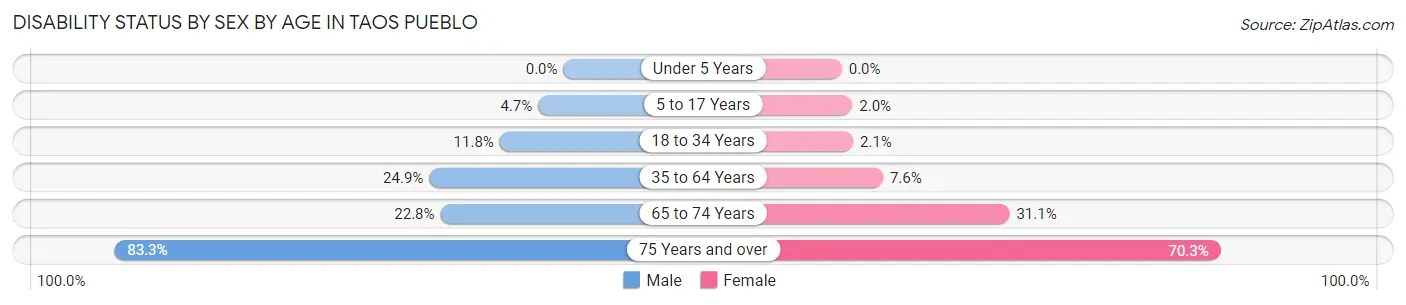
| Age Bracket | Male | Female |
| Under 5 Years | 0 (0.0%) | 0 (0.0%) |
| 5 to 17 Years | 3 (4.7%) | 1 (2.0%) |
| 18 to 34 Years | 13 (11.8%) | 3 (2.1%) |
| 35 to 64 Years | 72 (24.9%) | 21 (7.6%) |
| 65 to 74 Years | 21 (22.8%) | 33 (31.1%) |
| 75 Years and over | 20 (83.3%) | 71 (70.3%) |
Disability Class by Sex by Age in Taos Pueblo
Disability Class: Hearing Difficulty
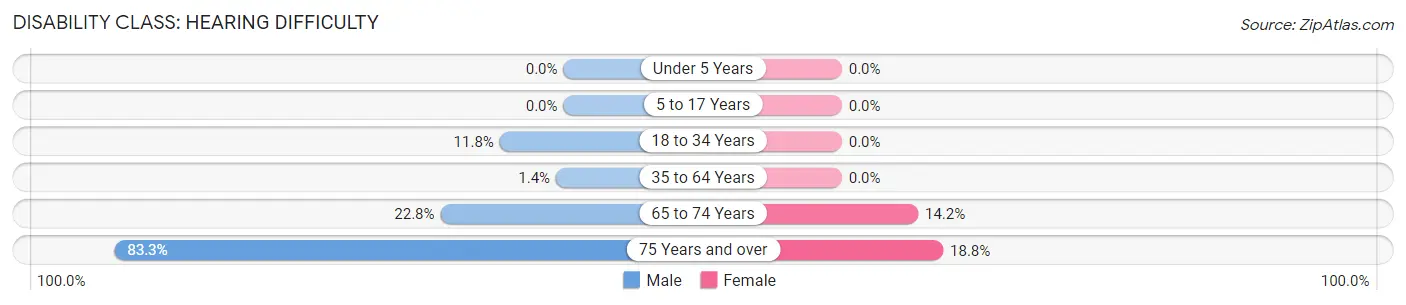
| Age Bracket | Male | Female |
| Under 5 Years | 0 (0.0%) | 0 (0.0%) |
| 5 to 17 Years | 0 (0.0%) | 0 (0.0%) |
| 18 to 34 Years | 13 (11.8%) | 0 (0.0%) |
| 35 to 64 Years | 4 (1.4%) | 0 (0.0%) |
| 65 to 74 Years | 21 (22.8%) | 15 (14.1%) |
| 75 Years and over | 20 (83.3%) | 19 (18.8%) |
Disability Class: Vision Difficulty
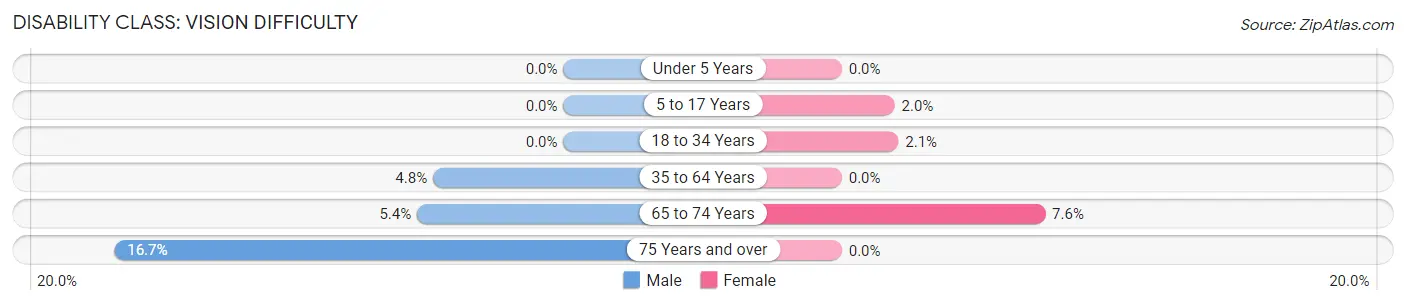
| Age Bracket | Male | Female |
| Under 5 Years | 0 (0.0%) | 0 (0.0%) |
| 5 to 17 Years | 0 (0.0%) | 1 (2.0%) |
| 18 to 34 Years | 0 (0.0%) | 3 (2.1%) |
| 35 to 64 Years | 14 (4.8%) | 0 (0.0%) |
| 65 to 74 Years | 5 (5.4%) | 8 (7.5%) |
| 75 Years and over | 4 (16.7%) | 0 (0.0%) |
Disability Class: Cognitive Difficulty
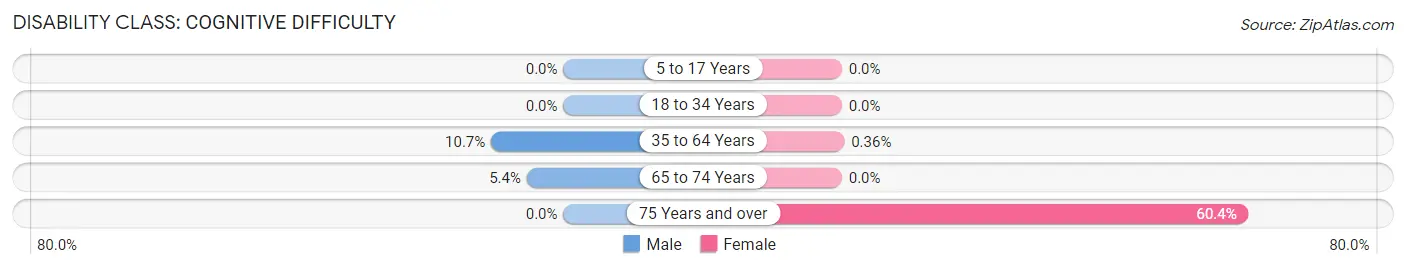
| Age Bracket | Male | Female |
| 5 to 17 Years | 0 (0.0%) | 0 (0.0%) |
| 18 to 34 Years | 0 (0.0%) | 0 (0.0%) |
| 35 to 64 Years | 31 (10.7%) | 1 (0.4%) |
| 65 to 74 Years | 5 (5.4%) | 0 (0.0%) |
| 75 Years and over | 0 (0.0%) | 61 (60.4%) |
Disability Class: Ambulatory Difficulty
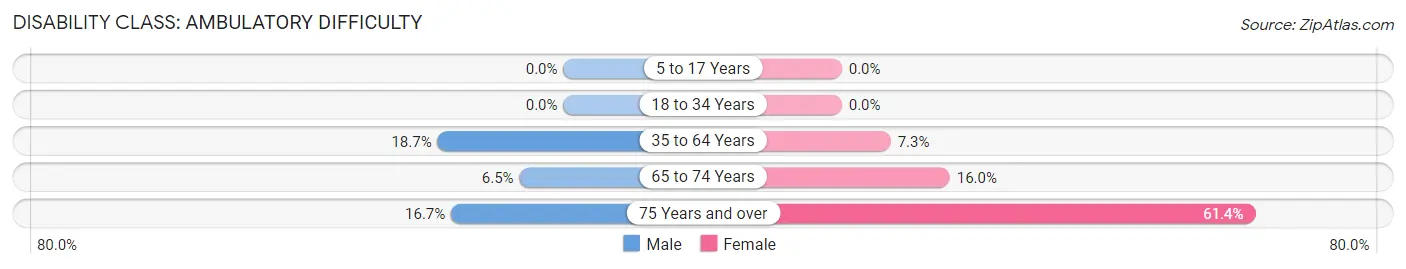
| Age Bracket | Male | Female |
| 5 to 17 Years | 0 (0.0%) | 0 (0.0%) |
| 18 to 34 Years | 0 (0.0%) | 0 (0.0%) |
| 35 to 64 Years | 54 (18.7%) | 20 (7.3%) |
| 65 to 74 Years | 6 (6.5%) | 17 (16.0%) |
| 75 Years and over | 4 (16.7%) | 62 (61.4%) |
Disability Class: Self-Care Difficulty
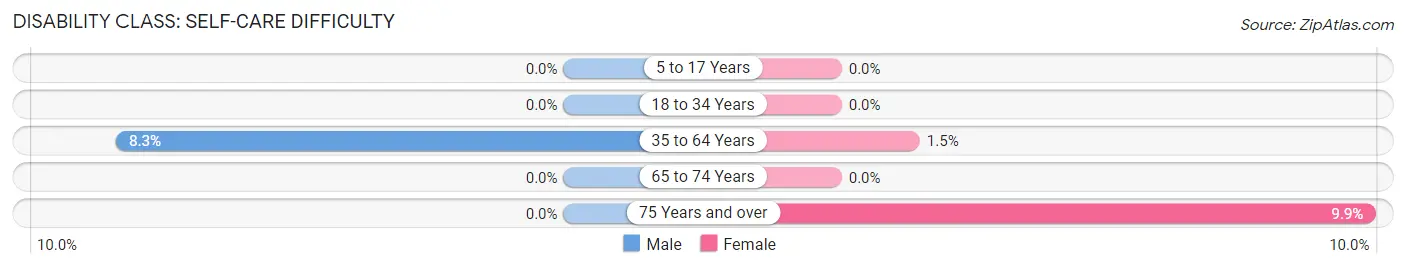
| Age Bracket | Male | Female |
| 5 to 17 Years | 0 (0.0%) | 0 (0.0%) |
| 18 to 34 Years | 0 (0.0%) | 0 (0.0%) |
| 35 to 64 Years | 24 (8.3%) | 4 (1.5%) |
| 65 to 74 Years | 0 (0.0%) | 0 (0.0%) |
| 75 Years and over | 0 (0.0%) | 10 (9.9%) |
Technology Access in Taos Pueblo
Computing Device Access in Taos Pueblo
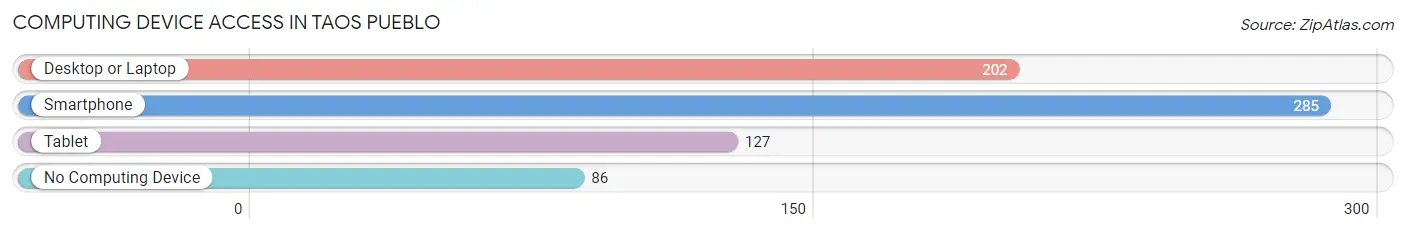
| Device Type | # Households | % Households |
| Desktop or Laptop | 202 | 53.3% |
| Smartphone | 285 | 75.2% |
| Tablet | 127 | 33.5% |
| No Computing Device | 86 | 22.7% |
| Total | 379 | 100.0% |
Internet Access in Taos Pueblo
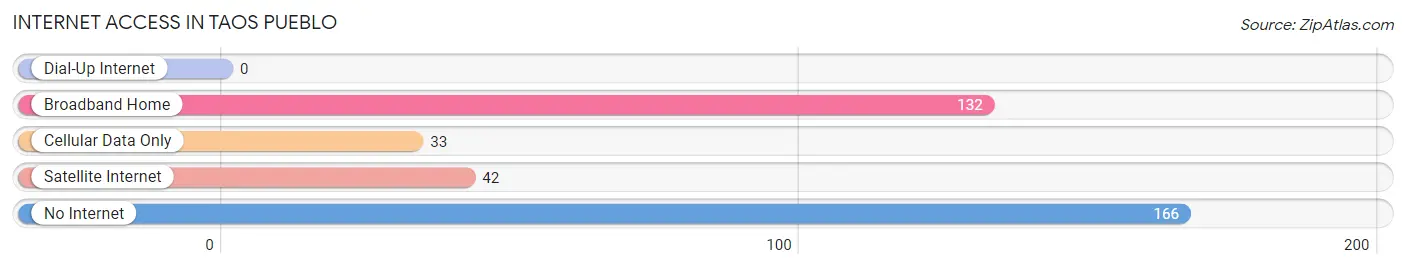
| Internet Type | # Households | % Households |
| Dial-Up Internet | 0 | 0.0% |
| Broadband Home | 132 | 34.8% |
| Cellular Data Only | 33 | 8.7% |
| Satellite Internet | 42 | 11.1% |
| No Internet | 166 | 43.8% |
| Total | 379 | 100.0% |
Taos Pueblo Summary
Taos Pueblo is a Native American community located in Taos County, New Mexico. It is the oldest continuously inhabited community in the United States, having been inhabited for over 1000 years. The community is home to the Taos people, a tribe of the Tiwa language group of the Pueblo people. The Taos Pueblo is a UNESCO World Heritage Site and is considered to be one of the most important cultural sites in the United States.
Geography
Taos Pueblo is located in the northern part of New Mexico, in the Sangre de Cristo Mountains. The community is situated at an elevation of 7,000 feet and is surrounded by the Carson National Forest. The Taos Pueblo is located approximately 60 miles north of Santa Fe and is accessible by car or by air.
The Taos Pueblo is composed of two villages, the North and South Villages. The North Village is the larger of the two and is home to the majority of the population. The South Village is smaller and is home to the Taos ceremonial grounds. The two villages are connected by a bridge over the Rio Grande.
The Taos Pueblo is located in a semi-arid climate, with hot summers and cold winters. The average annual temperature is approximately 50 degrees Fahrenheit. The average annual precipitation is approximately 12 inches.
History
The Taos Pueblo has been inhabited for over 1000 years, making it the oldest continuously inhabited community in the United States. The Taos people are believed to have migrated to the area from the Four Corners region of the United States. The Taos people are believed to have been part of the Ancestral Puebloans, a group of Native Americans who lived in the area from approximately 1000 AD to 1300 AD.
The Taos Pueblo was first encountered by Europeans in 1540, when the Spanish explorer Francisco Vásquez de Coronado arrived in the area. The Taos people were initially friendly to the Spanish, but eventually resisted their presence. In 1680, the Taos people joined forces with other Native American tribes to fight against the Spanish in the Pueblo Revolt. The revolt was successful and the Spanish were driven out of the area.
The Taos Pueblo was granted autonomy by the United States government in 1847. The Taos Pueblo is now a sovereign nation and is recognized as such by the United States government.
Economy
The Taos Pueblo is a self-sustaining community and is largely supported by its own economy. The primary sources of income for the Taos Pueblo are tourism, agriculture, and crafts.
Tourism is a major source of income for the Taos Pueblo. The community is a popular tourist destination and attracts visitors from all over the world. The Taos Pueblo is home to a number of cultural attractions, including the Taos Pueblo Museum, the Taos Pueblo Cultural Center, and the Taos Pueblo Powwow.
Agriculture is also an important part of the Taos Pueblo economy. The Taos people grow a variety of crops, including corn, beans, squash, and melons. The Taos people also raise livestock, including sheep, goats, and cattle.
Crafts are also an important part of the Taos Pueblo economy. The Taos people are renowned for their pottery, jewelry, and other crafts. These crafts are sold to tourists and are a major source of income for the Taos Pueblo.
Demographics
The Taos Pueblo is home to approximately 1,500 people. The majority of the population is Native American, with the Taos people making up the majority of the population. The Taos people are a tribe of the Tiwa language group of the Pueblo people.
The Taos Pueblo is a bilingual community, with both English and Tiwa being spoken. The majority of the population is Roman Catholic, with a small minority of Protestants.
Conclusion
Taos Pueblo is a Native American community located in Taos County, New Mexico. It is the oldest continuously inhabited community in the United States, having been inhabited for over 1000 years. The community is home to the Taos people, a tribe of the Tiwa language group of the Pueblo people. The Taos Pueblo is a UNESCO World Heritage Site and is considered to be one of the most important cultural sites in the United States. The Taos Pueblo is a self-sustaining community and is largely supported by its own economy. The primary sources of income for the Taos Pueblo are tourism, agriculture, and crafts. The Taos Pueblo is home to approximately 1,500 people, with the majority of the population being Native American. The Taos Pueblo is a bilingual community, with both English and Tiwa being spoken. The majority of the population is Roman Catholic, with a small minority of Protestants.
Common Questions
What is Per Capita Income in Taos Pueblo?
Per Capita income in Taos Pueblo is $16,124.
What is the Median Family Income in Taos Pueblo?
Median Family Income in Taos Pueblo is $46,719.
What is the Median Household income in Taos Pueblo?
Median Household Income in Taos Pueblo is $36,597.
What is Income or Wage Gap in Taos Pueblo?
Income or Wage Gap in Taos Pueblo is 46.4%.
Women in Taos Pueblo earn 53.6 cents for every dollar earned by a man.
What is Inequality or Gini Index in Taos Pueblo?
Inequality or Gini Index in Taos Pueblo is 0.44.
What is the Total Population of Taos Pueblo?
Total Population of Taos Pueblo is 1,422.
What is the Total Male Population of Taos Pueblo?
Total Male Population of Taos Pueblo is 725.
What is the Total Female Population of Taos Pueblo?
Total Female Population of Taos Pueblo is 697.
What is the Ratio of Males per 100 Females in Taos Pueblo?
There are 104.02 Males per 100 Females in Taos Pueblo.
What is the Ratio of Females per 100 Males in Taos Pueblo?
There are 96.14 Females per 100 Males in Taos Pueblo.
What is the Median Population Age in Taos Pueblo?
Median Population Age in Taos Pueblo is 42.3 Years.
What is the Average Family Size in Taos Pueblo
Average Family Size in Taos Pueblo is 5.2 People.
What is the Average Household Size in Taos Pueblo
Average Household Size in Taos Pueblo is 3.8 People.
How Large is the Labor Force in Taos Pueblo?
There are 629 People in the Labor Forcein in Taos Pueblo.
What is the Percentage of People in the Labor Force in Taos Pueblo?
54.5% of People are in the Labor Force in Taos Pueblo.
What is the Unemployment Rate in Taos Pueblo?
Unemployment Rate in Taos Pueblo is 14.1%.