Jemez Pueblo, NM Map & Demographics
Jemez Pueblo Map
Jemez Pueblo Overview
$23,437
PER CAPITA INCOME
$57,000
AVG FAMILY INCOME
$56,116
AVG HOUSEHOLD INCOME
5.5%
WAGE / INCOME GAP [ % ]
94.5¢/ $1
WAGE / INCOME GAP [ $ ]
$16,113
FAMILY INCOME DEFICIT
0.49
INEQUALITY / GINI INDEX
2,070
TOTAL POPULATION
850
MALE POPULATION
1,220
FEMALE POPULATION
69.67
MALES / 100 FEMALES
143.53
FEMALES / 100 MALES
31.0
MEDIAN AGE
4.4
AVG FAMILY SIZE
4.1
AVG HOUSEHOLD SIZE
900
LABOR FORCE [ PEOPLE ]
67.0%
PERCENT IN LABOR FORCE
3.7%
UNEMPLOYMENT RATE
Jemez Pueblo Zip Codes
Jemez Pueblo Area Codes
Income in Jemez Pueblo
Income Overview in Jemez Pueblo
Per Capita Income in Jemez Pueblo is $23,437, while median incomes of families and households are $57,000 and $56,116 respectively.
| Characteristic | Number | Measure |
| Per Capita Income | 2,070 | $23,437 |
| Median Family Income | 430 | $57,000 |
| Mean Family Income | 430 | $90,787 |
| Median Household Income | 501 | $56,116 |
| Mean Household Income | 501 | $84,265 |
| Income Deficit | 430 | $16,113 |
| Wage / Income Gap (%) | 2,070 | 5.45% |
| Wage / Income Gap ($) | 2,070 | 94.55¢ per $1 |
| Gini / Inequality Index | 2,070 | 0.49 |
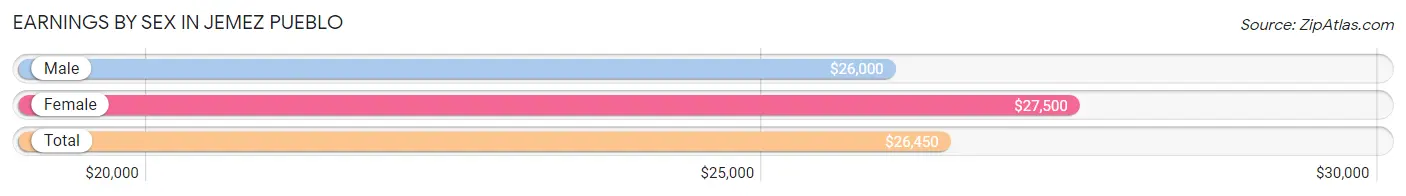
Earnings by Sex in Jemez Pueblo
Average Earnings in Jemez Pueblo are $26,450, $26,000 for men and $27,500 for women, a difference of 5.4%.
| Sex | Number | Average Earnings |
| Male | 432 (46.3%) | $26,000 |
| Female | 502 (53.7%) | $27,500 |
| Total | 934 (100.0%) | $26,450 |
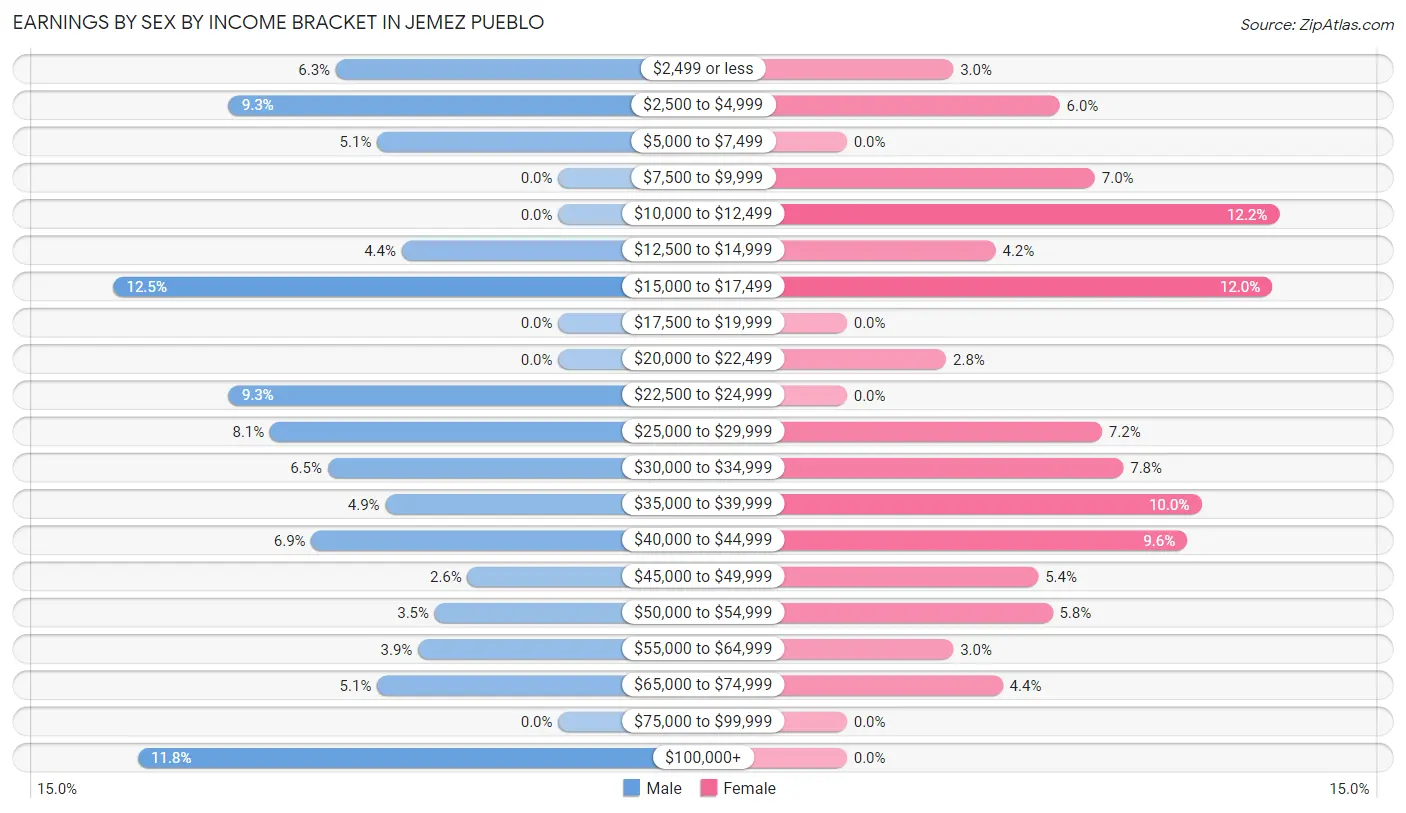
Earnings by Sex by Income Bracket in Jemez Pueblo
The most common earnings brackets in Jemez Pueblo are $15,000 to $17,499 for men (54 | 12.5%) and $10,000 to $12,499 for women (61 | 12.1%).
| Income | Male | Female |
| $2,499 or less | 27 (6.2%) | 15 (3.0%) |
| $2,500 to $4,999 | 40 (9.3%) | 30 (6.0%) |
| $5,000 to $7,499 | 22 (5.1%) | 0 (0.0%) |
| $7,500 to $9,999 | 0 (0.0%) | 35 (7.0%) |
| $10,000 to $12,499 | 0 (0.0%) | 61 (12.1%) |
| $12,500 to $14,999 | 19 (4.4%) | 21 (4.2%) |
| $15,000 to $17,499 | 54 (12.5%) | 60 (11.9%) |
| $17,500 to $19,999 | 0 (0.0%) | 0 (0.0%) |
| $20,000 to $22,499 | 0 (0.0%) | 14 (2.8%) |
| $22,500 to $24,999 | 40 (9.3%) | 0 (0.0%) |
| $25,000 to $29,999 | 35 (8.1%) | 36 (7.2%) |
| $30,000 to $34,999 | 28 (6.5%) | 39 (7.8%) |
| $35,000 to $39,999 | 21 (4.9%) | 50 (10.0%) |
| $40,000 to $44,999 | 30 (6.9%) | 48 (9.6%) |
| $45,000 to $49,999 | 11 (2.5%) | 27 (5.4%) |
| $50,000 to $54,999 | 15 (3.5%) | 29 (5.8%) |
| $55,000 to $64,999 | 17 (3.9%) | 15 (3.0%) |
| $65,000 to $74,999 | 22 (5.1%) | 22 (4.4%) |
| $75,000 to $99,999 | 0 (0.0%) | 0 (0.0%) |
| $100,000+ | 51 (11.8%) | 0 (0.0%) |
| Total | 432 (100.0%) | 502 (100.0%) |
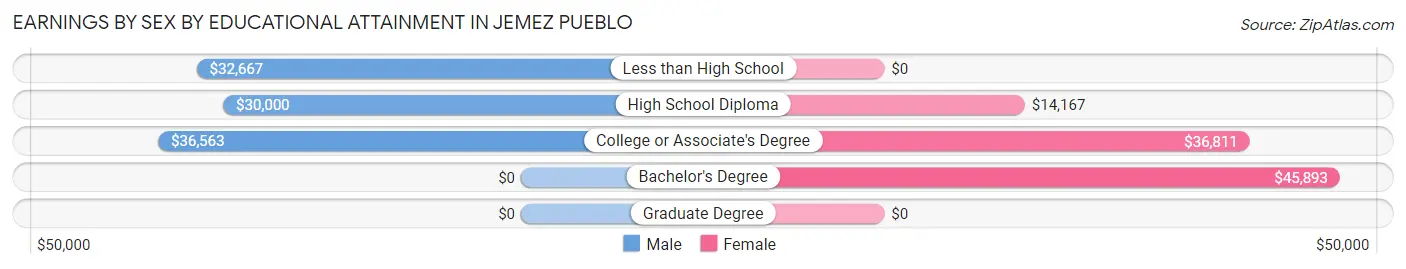
Earnings by Sex by Educational Attainment in Jemez Pueblo
Average earnings in Jemez Pueblo are $32,589 for men and $29,000 for women, a difference of 11.0%. Men with an educational attainment of college or associate's degree enjoy the highest average annual earnings of $36,563, while those with high school diploma education earn the least with $30,000. Women with an educational attainment of bachelor's degree earn the most with the average annual earnings of $45,893, while those with high school diploma education have the smallest earnings of $14,167.
| Educational Attainment | Male Income | Female Income |
| Less than High School | $32,667 | $0 |
| High School Diploma | $30,000 | $14,167 |
| College or Associate's Degree | $36,563 | $36,811 |
| Bachelor's Degree | - | - |
| Graduate Degree | - | - |
| Total | $32,589 | $29,000 |
Family Income in Jemez Pueblo
Family Income Brackets in Jemez Pueblo
According to the Jemez Pueblo family income data, there are 94 families falling into the $50,000 to $74,999 income range, which is the most common income bracket and makes up 21.9% of all families.
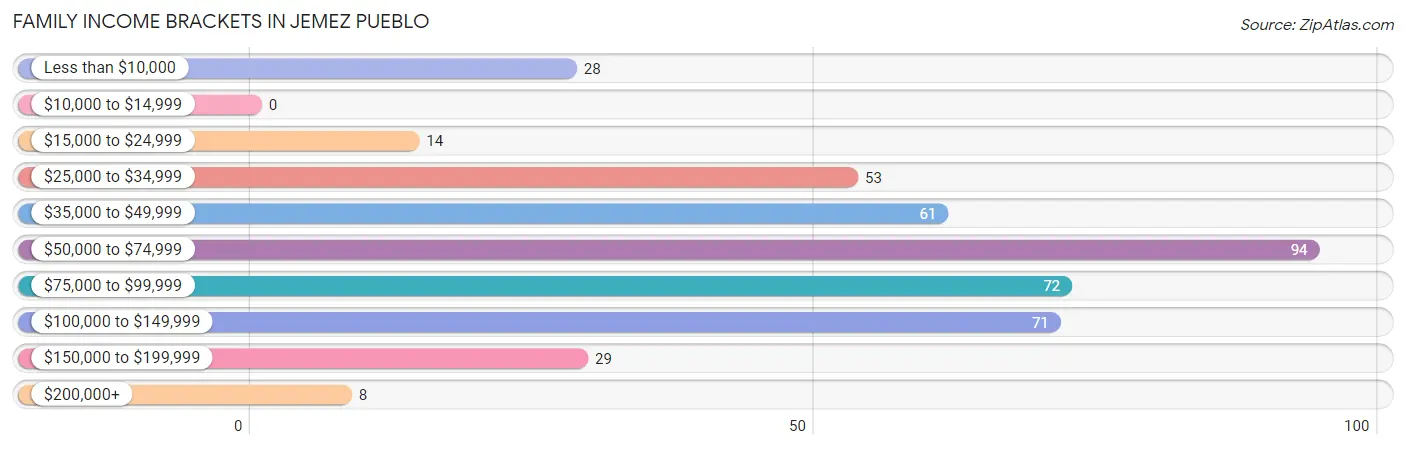
| Income Bracket | # Families | % Families |
| Less than $10,000 | 28 | 6.5% |
| $10,000 to $14,999 | 0 | 0.0% |
| $15,000 to $24,999 | 14 | 3.3% |
| $25,000 to $34,999 | 53 | 12.3% |
| $35,000 to $49,999 | 61 | 14.2% |
| $50,000 to $74,999 | 94 | 21.9% |
| $75,000 to $99,999 | 72 | 16.7% |
| $100,000 to $149,999 | 71 | 16.5% |
| $150,000 to $199,999 | 29 | 6.7% |
| $200,000+ | 8 | 1.9% |
Family Income by Famaliy Size in Jemez Pueblo
4-person families (52 | 12.1%) account for the highest median family income in Jemez Pueblo with $138,088 per family, while 4-person families (52 | 12.1%) have the highest median income of $34,522 per family member.
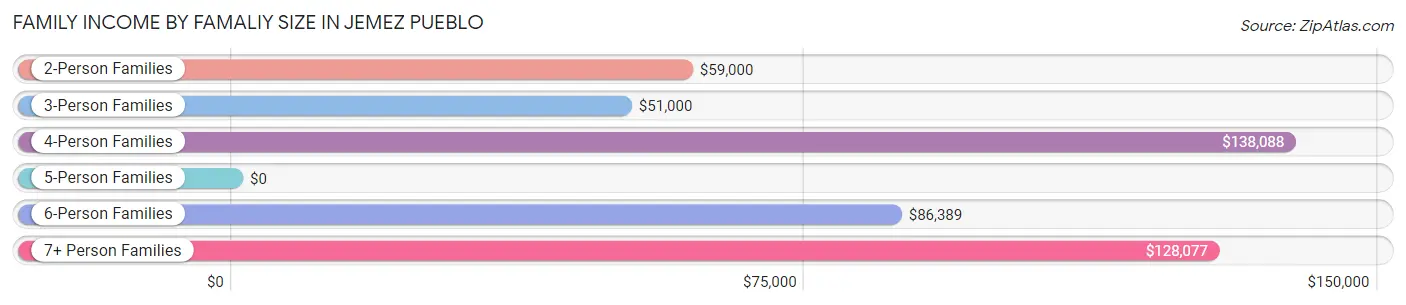
| Income Bracket | # Families | Median Income |
| 2-Person Families | 134 (31.2%) | $59,000 |
| 3-Person Families | 112 (26.1%) | $51,000 |
| 4-Person Families | 52 (12.1%) | $138,088 |
| 5-Person Families | 46 (10.7%) | $0 |
| 6-Person Families | 40 (9.3%) | $86,389 |
| 7+ Person Families | 46 (10.7%) | $128,077 |
| Total | 430 (100.0%) | $57,000 |
Family Income by Number of Earners in Jemez Pueblo
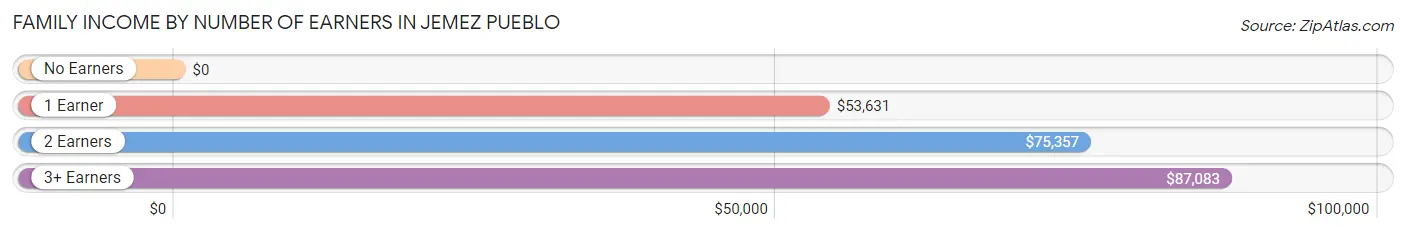
| Number of Earners | # Families | Median Income |
| No Earners | 39 (9.1%) | $0 |
| 1 Earner | 141 (32.8%) | $53,631 |
| 2 Earners | 180 (41.9%) | $75,357 |
| 3+ Earners | 70 (16.3%) | $87,083 |
| Total | 430 (100.0%) | $57,000 |
Household Income in Jemez Pueblo
Household Income Brackets in Jemez Pueblo
With 102 households falling in the category, the $50,000 to $74,999 income range is the most frequent in Jemez Pueblo, accounting for 20.4% of all households. In contrast, only 5 households (1.0%) fall into the $10,000 to $14,999 income bracket, making it the least populous group.
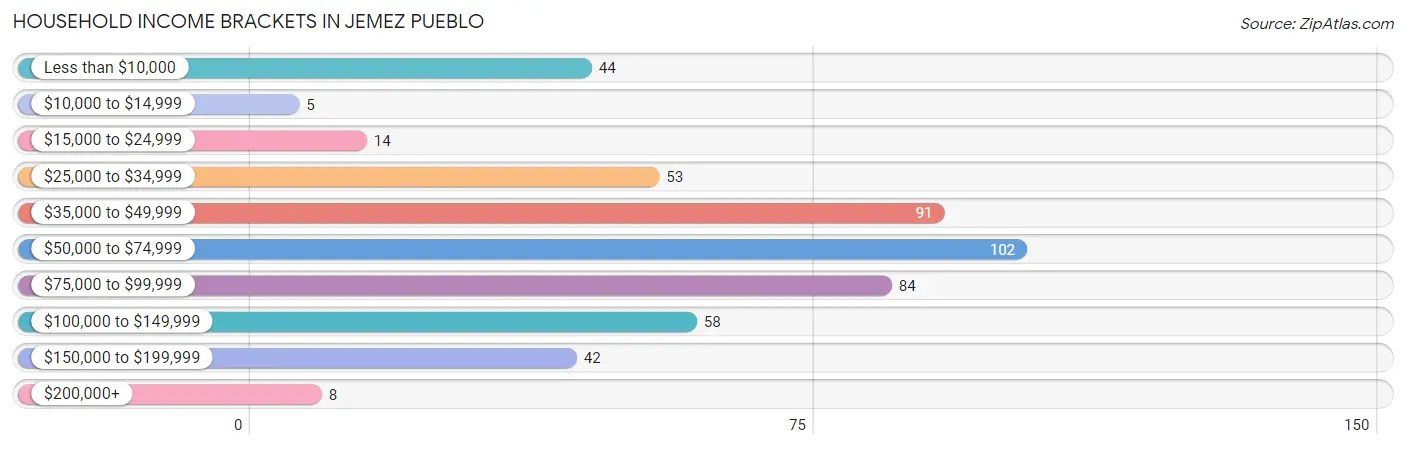
| Income Bracket | # Households | % Households |
| Less than $10,000 | 44 | 8.8% |
| $10,000 to $14,999 | 5 | 1.0% |
| $15,000 to $24,999 | 14 | 2.8% |
| $25,000 to $34,999 | 53 | 10.6% |
| $35,000 to $49,999 | 91 | 18.2% |
| $50,000 to $74,999 | 102 | 20.4% |
| $75,000 to $99,999 | 84 | 16.8% |
| $100,000 to $149,999 | 58 | 11.6% |
| $150,000 to $199,999 | 42 | 8.4% |
| $200,000+ | 8 | 1.6% |
Household Income by Householder Age in Jemez Pueblo
The median household income in Jemez Pueblo is $56,116, with the highest median household income of $80,234 found in the 45 to 64 years age bracket for the primary householder. A total of 217 households (43.3%) fall into this category.
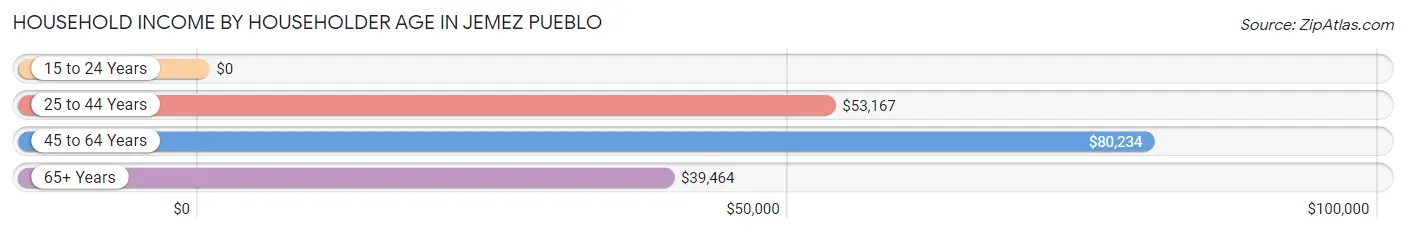
| Income Bracket | # Households | Median Income |
| 15 to 24 Years | 0 (0.0%) | $0 |
| 25 to 44 Years | 112 (22.4%) | $53,167 |
| 45 to 64 Years | 217 (43.3%) | $80,234 |
| 65+ Years | 172 (34.3%) | $39,464 |
| Total | 501 (100.0%) | $56,116 |
Poverty in Jemez Pueblo
Income Below Poverty by Sex and Age in Jemez Pueblo
With 19.1% poverty level for males and 23.3% for females among the residents of Jemez Pueblo, under 5 year old males and under 5 year old females are the most vulnerable to poverty, with 37 males (50.0%) and 41 females (52.6%) in their respective age groups living below the poverty level.
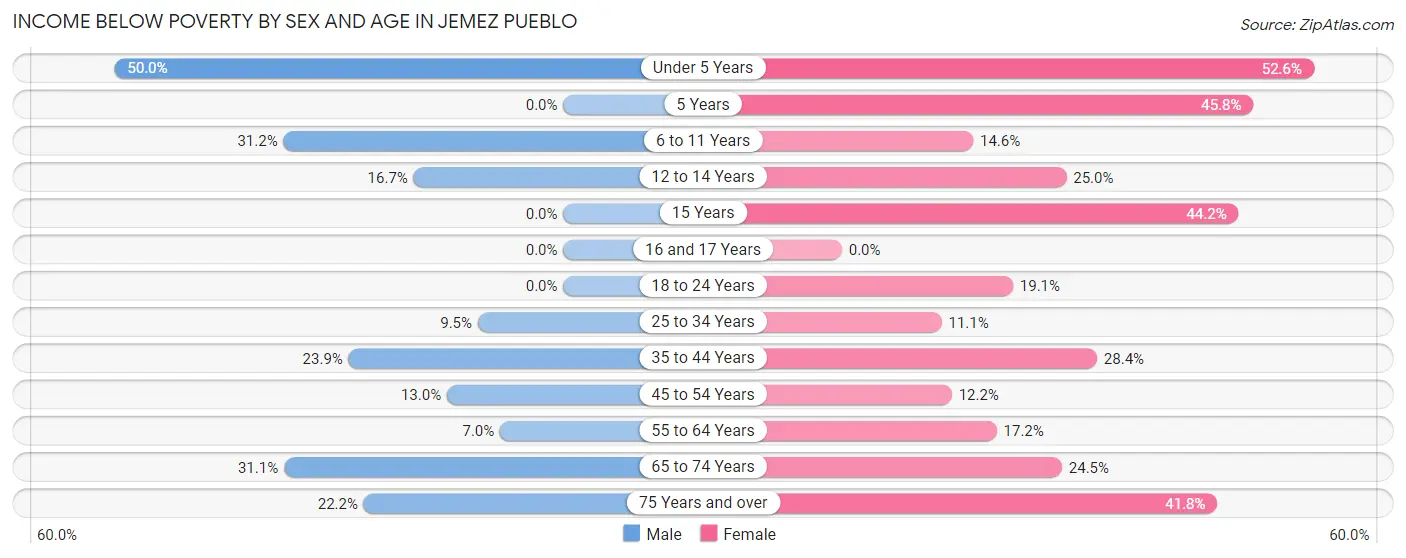
| Age Bracket | Male | Female |
| Under 5 Years | 37 (50.0%) | 41 (52.6%) |
| 5 Years | 0 (0.0%) | 11 (45.8%) |
| 6 to 11 Years | 24 (31.2%) | 37 (14.6%) |
| 12 to 14 Years | 17 (16.7%) | 13 (25.0%) |
| 15 Years | 0 (0.0%) | 19 (44.2%) |
| 16 and 17 Years | 0 (0.0%) | 0 (0.0%) |
| 18 to 24 Years | 0 (0.0%) | 12 (19.1%) |
| 25 to 34 Years | 14 (9.5%) | 13 (11.1%) |
| 35 to 44 Years | 22 (23.9%) | 50 (28.4%) |
| 45 to 54 Years | 7 (13.0%) | 12 (12.2%) |
| 55 to 64 Years | 10 (7.0%) | 25 (17.2%) |
| 65 to 74 Years | 28 (31.1%) | 25 (24.5%) |
| 75 Years and over | 2 (22.2%) | 23 (41.8%) |
| Total | 161 (19.1%) | 281 (23.3%) |
Income Above Poverty by Sex and Age in Jemez Pueblo
According to the poverty statistics in Jemez Pueblo, males aged 18 to 24 years and females aged 25 to 34 years are the age groups that are most secure financially, with 100.0% of males and 88.9% of females in these age groups living above the poverty line.
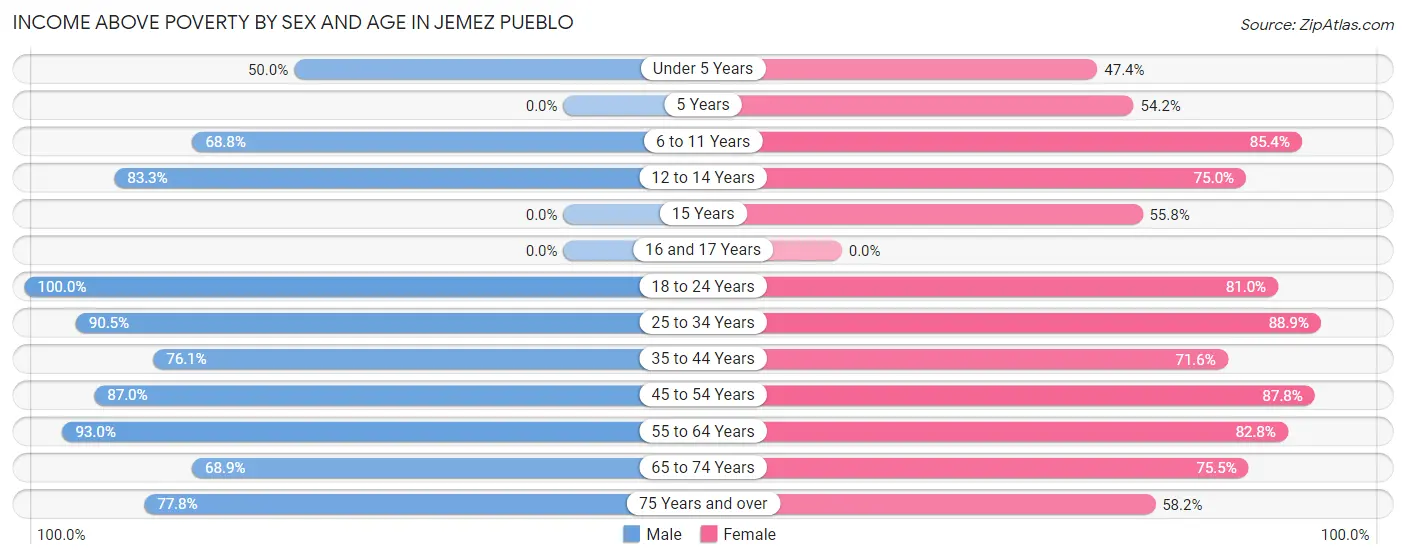
| Age Bracket | Male | Female |
| Under 5 Years | 37 (50.0%) | 37 (47.4%) |
| 5 Years | 0 (0.0%) | 13 (54.2%) |
| 6 to 11 Years | 53 (68.8%) | 216 (85.4%) |
| 12 to 14 Years | 85 (83.3%) | 39 (75.0%) |
| 15 Years | 0 (0.0%) | 24 (55.8%) |
| 16 and 17 Years | 0 (0.0%) | 0 (0.0%) |
| 18 to 24 Years | 54 (100.0%) | 51 (80.9%) |
| 25 to 34 Years | 133 (90.5%) | 104 (88.9%) |
| 35 to 44 Years | 70 (76.1%) | 126 (71.6%) |
| 45 to 54 Years | 47 (87.0%) | 86 (87.8%) |
| 55 to 64 Years | 132 (93.0%) | 120 (82.8%) |
| 65 to 74 Years | 62 (68.9%) | 77 (75.5%) |
| 75 Years and over | 7 (77.8%) | 32 (58.2%) |
| Total | 680 (80.9%) | 925 (76.7%) |
Income Below Poverty Among Married-Couple Families in Jemez Pueblo
The poverty statistics for married-couple families in Jemez Pueblo show that 9.0% or 15 of the total 167 families live below the poverty line. Families with 3 or 4 children have the highest poverty rate of 28.0%, comprising of 7 families. On the other hand, families with 1 or 2 children have the lowest poverty rate of 0.0%, which includes 0 families.
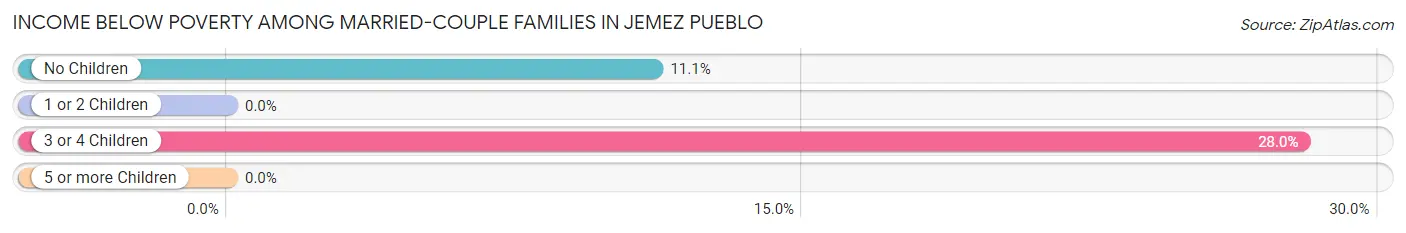
| Children | Above Poverty | Below Poverty |
| No Children | 64 (88.9%) | 8 (11.1%) |
| 1 or 2 Children | 70 (100.0%) | 0 (0.0%) |
| 3 or 4 Children | 18 (72.0%) | 7 (28.0%) |
| 5 or more Children | 0 (0.0%) | 0 (0.0%) |
| Total | 152 (91.0%) | 15 (9.0%) |
Income Below Poverty Among Single-Parent Households in Jemez Pueblo
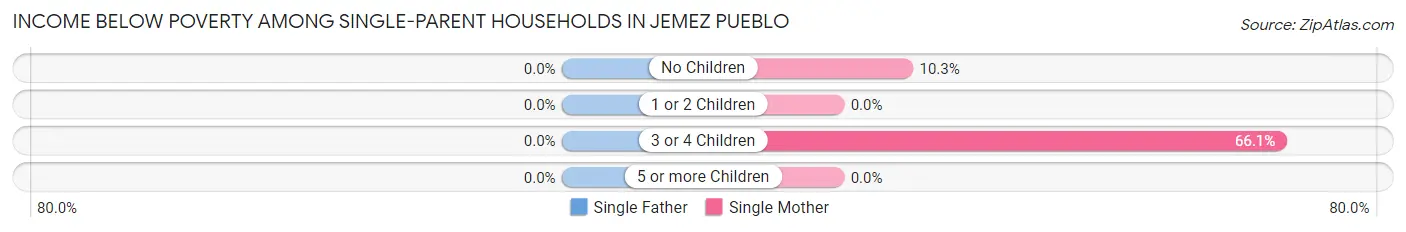
| Children | Single Father | Single Mother |
| No Children | 0 (0.0%) | 8 (10.3%) |
| 1 or 2 Children | 0 (0.0%) | 0 (0.0%) |
| 3 or 4 Children | 0 (0.0%) | 37 (66.1%) |
| 5 or more Children | 0 (0.0%) | 0 (0.0%) |
| Total | 0 (0.0%) | 45 (22.6%) |
Income Below Poverty Among Married-Couple vs Single-Parent Households in Jemez Pueblo
The poverty data for Jemez Pueblo shows that 15 of the married-couple family households (9.0%) and 45 of the single-parent households (17.1%) are living below the poverty level. Within the married-couple family households, those with 3 or 4 children have the highest poverty rate, with 7 households (28.0%) falling below the poverty line. Among the single-parent households, those with 3 or 4 children have the highest poverty rate, with 37 household (66.1%) living below poverty.
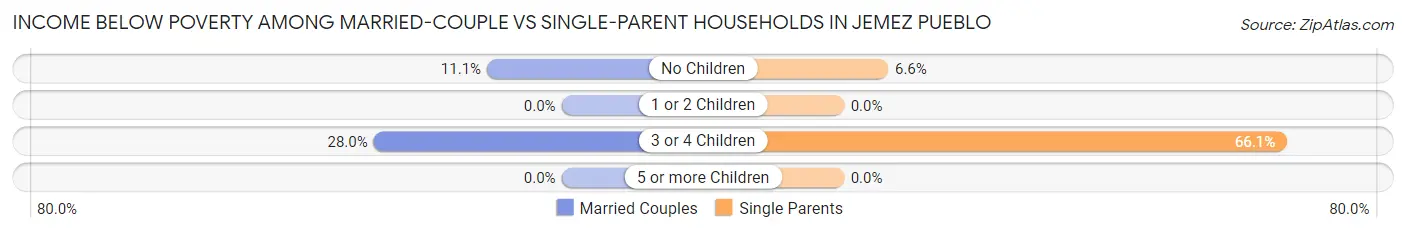
| Children | Married-Couple Families | Single-Parent Households |
| No Children | 8 (11.1%) | 8 (6.6%) |
| 1 or 2 Children | 0 (0.0%) | 0 (0.0%) |
| 3 or 4 Children | 7 (28.0%) | 37 (66.1%) |
| 5 or more Children | 0 (0.0%) | 0 (0.0%) |
| Total | 15 (9.0%) | 45 (17.1%) |
Race in Jemez Pueblo
The most populous races in Jemez Pueblo are Native / Alaskan (2,054 | 99.2%), White / Caucasian (10 | 0.5%), and Two or more Races (6 | 0.3%).
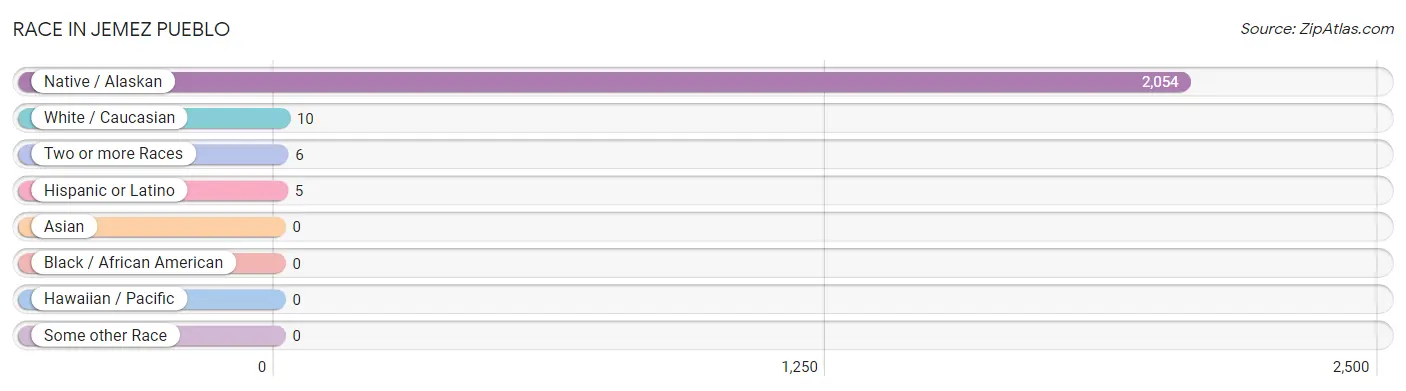
| Race | # Population | % Population |
| Asian | 0 | 0.0% |
| Black / African American | 0 | 0.0% |
| Hawaiian / Pacific | 0 | 0.0% |
| Hispanic or Latino | 5 | 0.2% |
| Native / Alaskan | 2,054 | 99.2% |
| White / Caucasian | 10 | 0.5% |
| Two or more Races | 6 | 0.3% |
| Some other Race | 0 | 0.0% |
| Total | 2,070 | 100.0% |
Ancestry in Jemez Pueblo
The most populous ancestries reported in Jemez Pueblo are Pueblo (1,850 | 89.4%), American (455 | 22.0%), Sioux (31 | 1.5%), Irish (16 | 0.8%), and Hopi (11 | 0.5%), together accounting for 114.2% of all Jemez Pueblo residents.
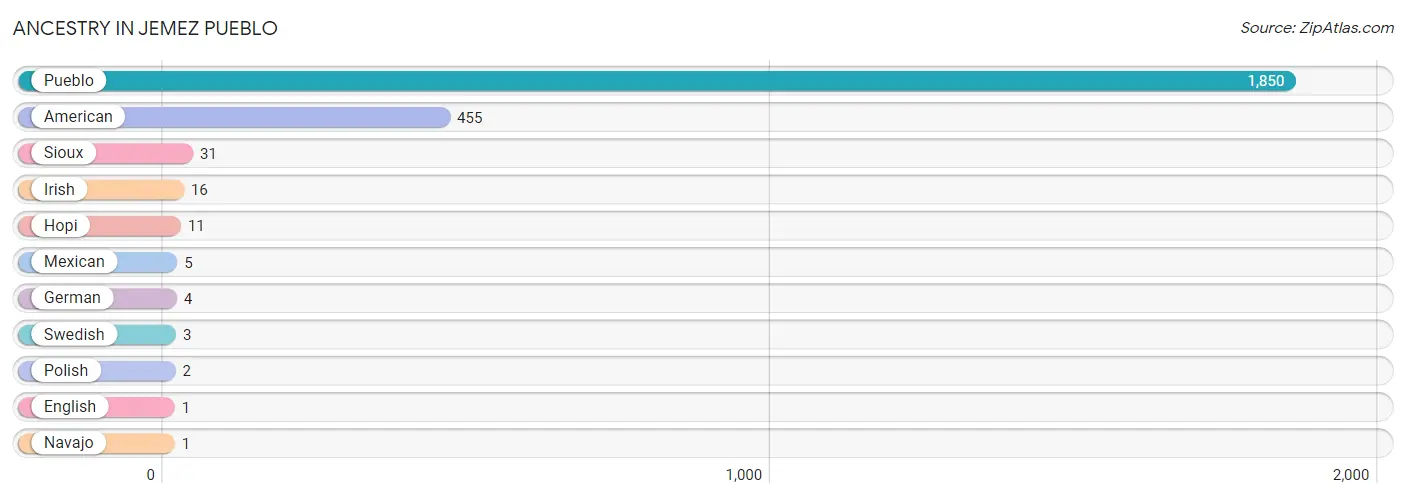
| Ancestry | # Population | % Population |
| American | 455 | 22.0% |
| English | 1 | 0.1% |
| German | 4 | 0.2% |
| Hopi | 11 | 0.5% |
| Irish | 16 | 0.8% |
| Mexican | 5 | 0.2% |
| Navajo | 1 | 0.1% |
| Polish | 2 | 0.1% |
| Pueblo | 1,850 | 89.4% |
| Sioux | 31 | 1.5% |
| Swedish | 3 | 0.1% | View All 11 Rows |
Immigrants in Jemez Pueblo

| Immigration Origin | # Population | % Population | View All 0 Rows |
Sex and Age in Jemez Pueblo
Sex and Age in Jemez Pueblo
The most populous age groups in Jemez Pueblo are 10 to 14 Years (125 | 14.7%) for men and 10 to 14 Years (245 | 20.1%) for women.
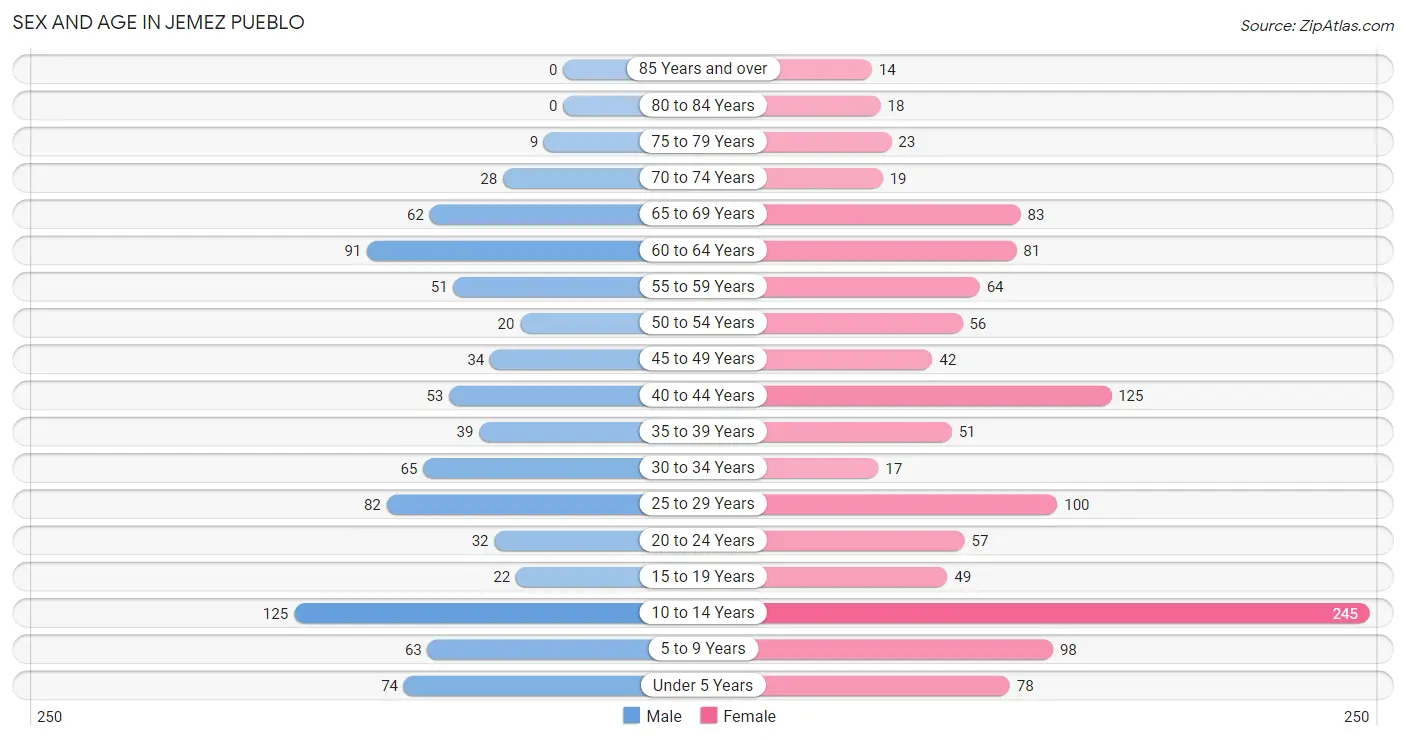
| Age Bracket | Male | Female |
| Under 5 Years | 74 (8.7%) | 78 (6.4%) |
| 5 to 9 Years | 63 (7.4%) | 98 (8.0%) |
| 10 to 14 Years | 125 (14.7%) | 245 (20.1%) |
| 15 to 19 Years | 22 (2.6%) | 49 (4.0%) |
| 20 to 24 Years | 32 (3.8%) | 57 (4.7%) |
| 25 to 29 Years | 82 (9.7%) | 100 (8.2%) |
| 30 to 34 Years | 65 (7.6%) | 17 (1.4%) |
| 35 to 39 Years | 39 (4.6%) | 51 (4.2%) |
| 40 to 44 Years | 53 (6.2%) | 125 (10.2%) |
| 45 to 49 Years | 34 (4.0%) | 42 (3.4%) |
| 50 to 54 Years | 20 (2.4%) | 56 (4.6%) |
| 55 to 59 Years | 51 (6.0%) | 64 (5.2%) |
| 60 to 64 Years | 91 (10.7%) | 81 (6.6%) |
| 65 to 69 Years | 62 (7.3%) | 83 (6.8%) |
| 70 to 74 Years | 28 (3.3%) | 19 (1.6%) |
| 75 to 79 Years | 9 (1.1%) | 23 (1.9%) |
| 80 to 84 Years | 0 (0.0%) | 18 (1.5%) |
| 85 Years and over | 0 (0.0%) | 14 (1.1%) |
| Total | 850 (100.0%) | 1,220 (100.0%) |
Families and Households in Jemez Pueblo
Median Family Size in Jemez Pueblo
The median family size in Jemez Pueblo is 4.43 persons per family, with single female/mother families (199 | 46.3%) accounting for the largest median family size of 5.02 persons per family. On the other hand, single male/father families (64 | 14.9%) represent the smallest median family size with 3.41 persons per family.
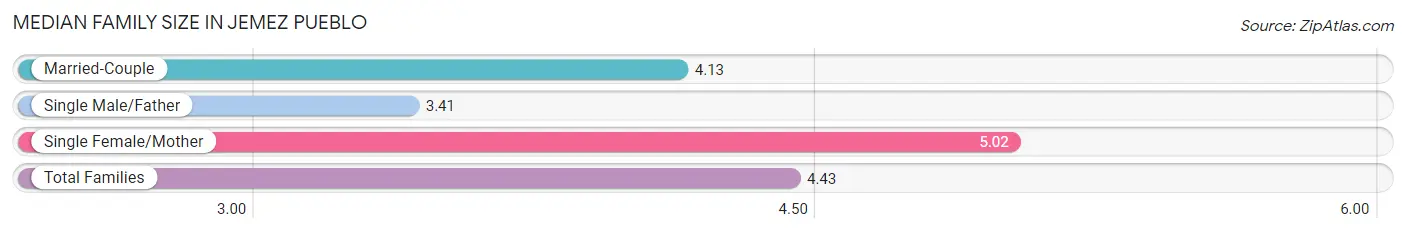
| Family Type | # Families | Family Size |
| Married-Couple | 167 (38.8%) | 4.13 |
| Single Male/Father | 64 (14.9%) | 3.41 |
| Single Female/Mother | 199 (46.3%) | 5.02 |
| Total Families | 430 (100.0%) | 4.43 |
Median Household Size in Jemez Pueblo
The median household size in Jemez Pueblo is 4.12 persons per household, with single female/mother households (199 | 39.7%) accounting for the largest median household size of 5.12 persons per household. non-family households (71 | 14.2%) represent the smallest median household size with 1.55 persons per household.
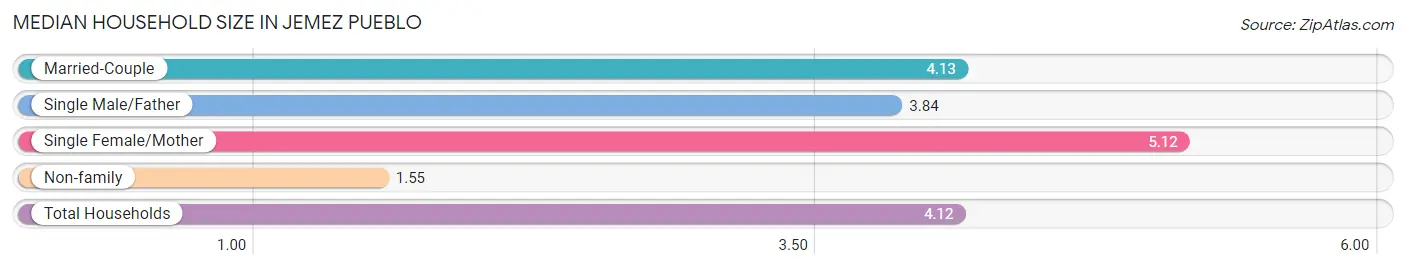
| Household Type | # Households | Household Size |
| Married-Couple | 167 (33.3%) | 4.13 |
| Single Male/Father | 64 (12.8%) | 3.84 |
| Single Female/Mother | 199 (39.7%) | 5.12 |
| Non-family | 71 (14.2%) | 1.55 |
| Total Households | 501 (100.0%) | 4.12 |
Household Size by Marriage Status in Jemez Pueblo
Out of a total of 501 households in Jemez Pueblo, 430 (85.8%) are family households, while 71 (14.2%) are nonfamily households. The most numerous type of family households are 2-person households, comprising 120, and the most common type of nonfamily households are 1-person households, comprising 36.
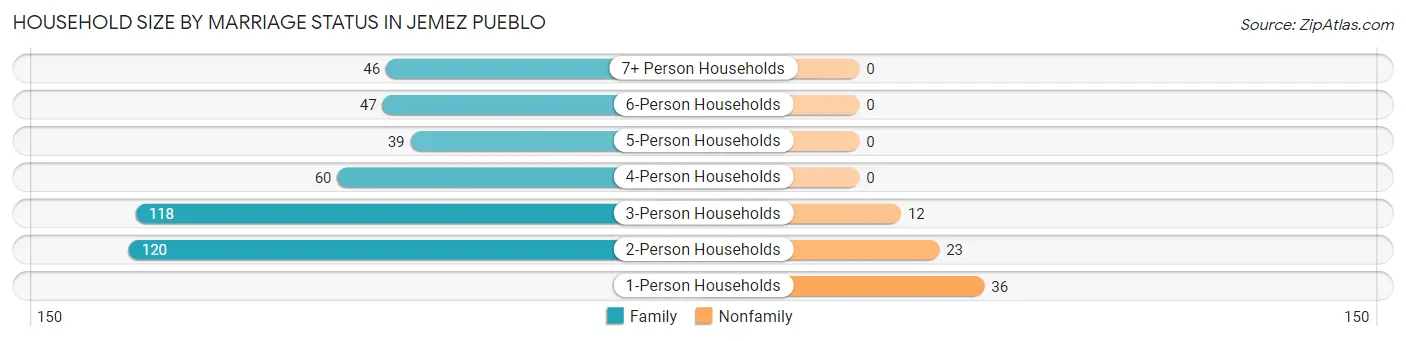
| Household Size | Family Households | Nonfamily Households |
| 1-Person Households | - | 36 (7.2%) |
| 2-Person Households | 120 (23.9%) | 23 (4.6%) |
| 3-Person Households | 118 (23.5%) | 12 (2.4%) |
| 4-Person Households | 60 (12.0%) | 0 (0.0%) |
| 5-Person Households | 39 (7.8%) | 0 (0.0%) |
| 6-Person Households | 47 (9.4%) | 0 (0.0%) |
| 7+ Person Households | 46 (9.2%) | 0 (0.0%) |
| Total | 430 (85.8%) | 71 (14.2%) |
Female Fertility in Jemez Pueblo
Fertility by Age in Jemez Pueblo
Average fertility rate in Jemez Pueblo is 92.0 births per 1,000 women. Women in the age bracket of 20 to 34 years have the highest fertility rate with 178.0 births per 1,000 women. Women in the age bracket of 20 to 34 years acount for 75.6% of all women with births.
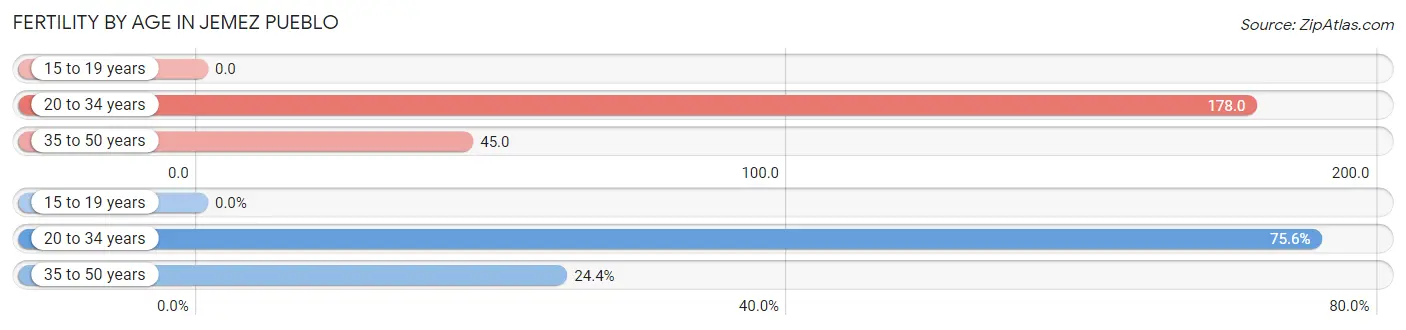
| Age Bracket | Women with Births | Births / 1,000 Women |
| 15 to 19 years | 0 (0.0%) | 0.0 |
| 20 to 34 years | 31 (75.6%) | 178.0 |
| 35 to 50 years | 10 (24.4%) | 45.0 |
| Total | 41 (100.0%) | 92.0 |
Fertility by Age by Marriage Status in Jemez Pueblo
29.3% of women with births (41) in Jemez Pueblo are married. The highest percentage of unmarried women with births falls into 35 to 50 years age bracket with 100.0% of them unmarried at the time of birth, while the lowest percentage of unmarried women with births belong to 20 to 34 years age bracket with 61.3% of them unmarried.
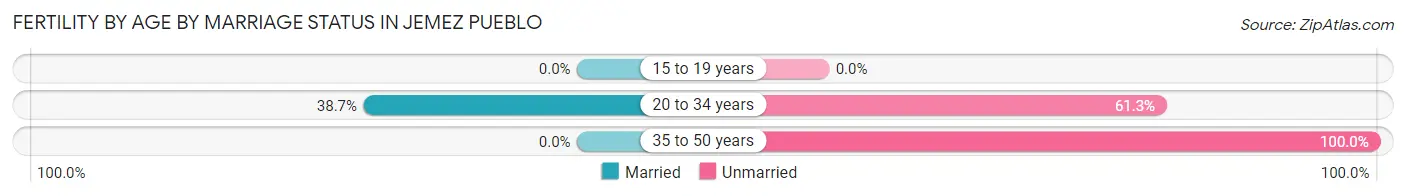
| Age Bracket | Married | Unmarried |
| 15 to 19 years | 0 (0.0%) | 0 (0.0%) |
| 20 to 34 years | 12 (38.7%) | 19 (61.3%) |
| 35 to 50 years | 0 (0.0%) | 10 (100.0%) |
| Total | 12 (29.3%) | 29 (70.7%) |
Fertility by Education in Jemez Pueblo
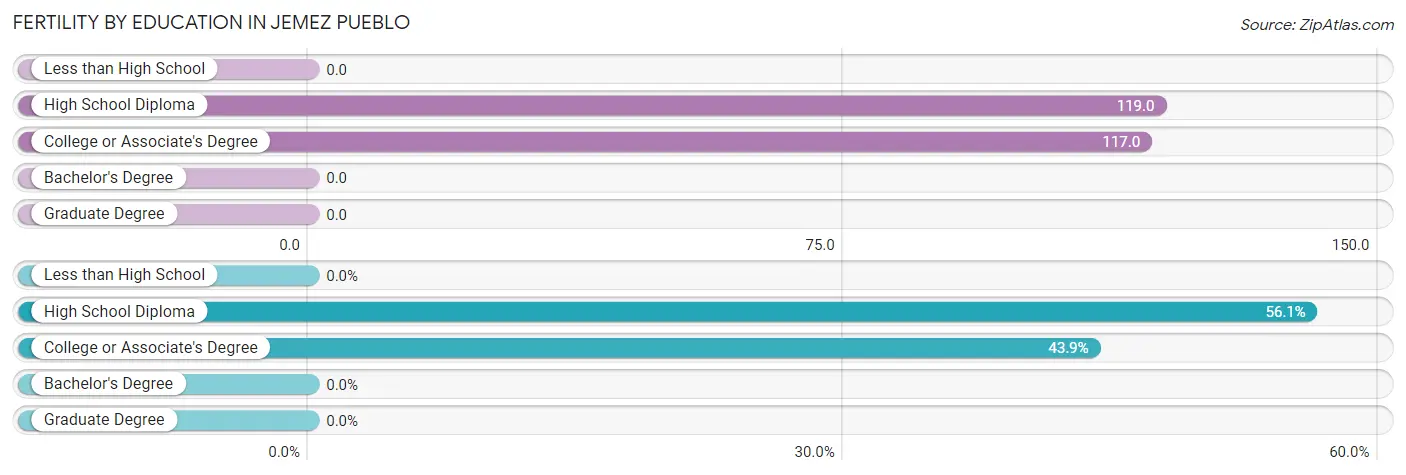
| Educational Attainment | Women with Births | Births / 1,000 Women |
| Less than High School | 0 (0.0%) | 0.0 |
| High School Diploma | 23 (56.1%) | 119.0 |
| College or Associate's Degree | 18 (43.9%) | 117.0 |
| Bachelor's Degree | 0 (0.0%) | 0.0 |
| Graduate Degree | 0 (0.0%) | 0.0 |
| Total | 41 (100.0%) | 92.0 |
Fertility by Education by Marriage Status in Jemez Pueblo
70.7% of women with births in Jemez Pueblo are unmarried. Women with the educational attainment of college or associate's degree are most likely to be married with 66.7% of them married at childbirth, while women with the educational attainment of high school diploma are least likely to be married with 100.0% of them unmarried at childbirth.
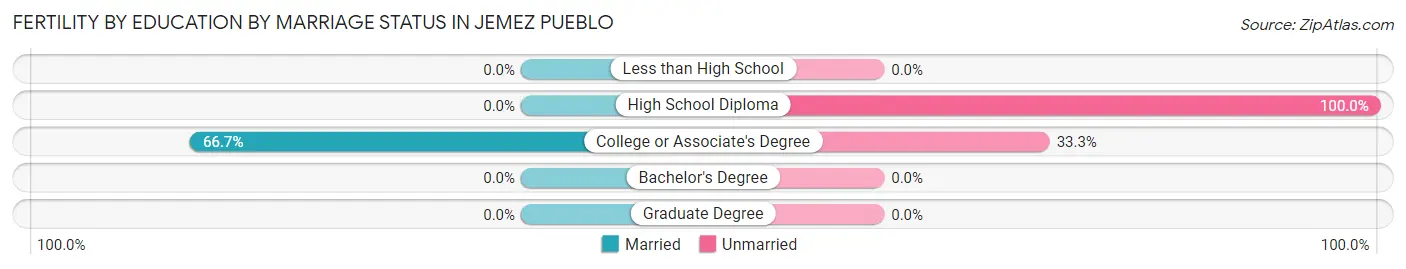
| Educational Attainment | Married | Unmarried |
| Less than High School | 0 (0.0%) | 0 (0.0%) |
| High School Diploma | 0 (0.0%) | 23 (100.0%) |
| College or Associate's Degree | 12 (66.7%) | 6 (33.3%) |
| Bachelor's Degree | 0 (0.0%) | 0 (0.0%) |
| Graduate Degree | 0 (0.0%) | 0 (0.0%) |
| Total | 12 (29.3%) | 29 (70.7%) |
Employment Characteristics in Jemez Pueblo
Employment by Class of Employer in Jemez Pueblo
Among the 863 employed individuals in Jemez Pueblo, private company employees (364 | 42.2%), local government employees (281 | 32.6%), and federal government employees (128 | 14.8%) make up the most common classes of employment.
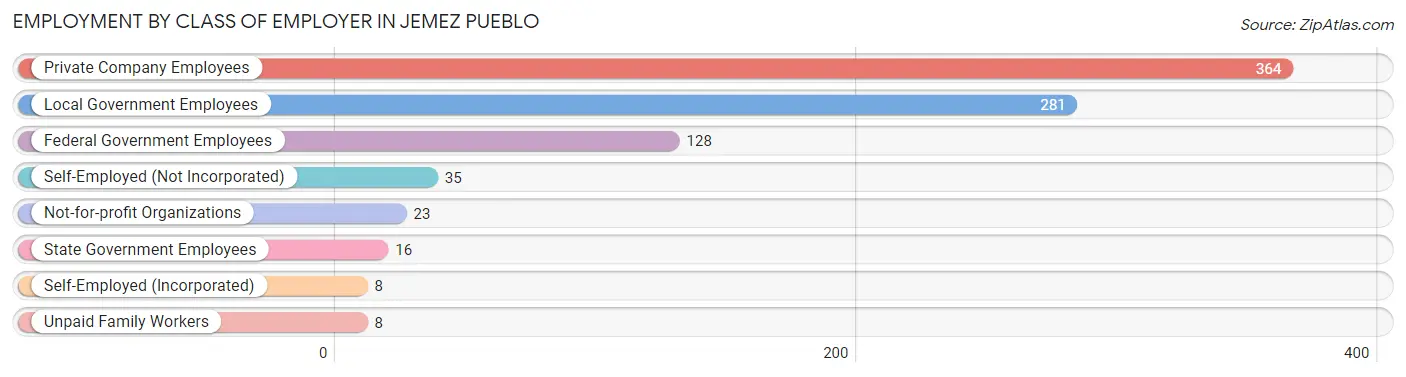
| Employer Class | # Employees | % Employees |
| Private Company Employees | 364 | 42.2% |
| Self-Employed (Incorporated) | 8 | 0.9% |
| Self-Employed (Not Incorporated) | 35 | 4.1% |
| Not-for-profit Organizations | 23 | 2.7% |
| Local Government Employees | 281 | 32.6% |
| State Government Employees | 16 | 1.8% |
| Federal Government Employees | 128 | 14.8% |
| Unpaid Family Workers | 8 | 0.9% |
| Total | 863 | 100.0% |
Employment Status by Age in Jemez Pueblo
According to the labor force statistics for Jemez Pueblo, out of the total population over 16 years of age (1,344), 67.0% or 900 individuals are in the labor force, with 3.7% or 33 of them unemployed. The age group with the highest labor force participation rate is 30 to 34 years, with 100.0% or 82 individuals in the labor force. Within the labor force, the 20 to 24 years age range has the highest percentage of unemployed individuals, with 17.1% or 12 of them being unemployed.
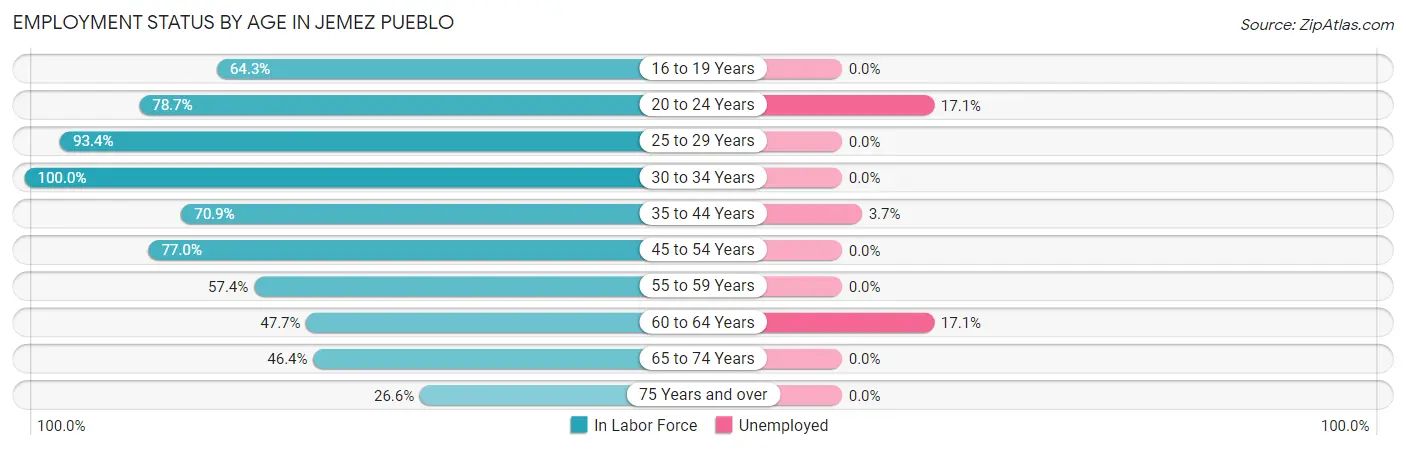
| Age Bracket | In Labor Force | Unemployed |
| 16 to 19 Years | 18 (64.3%) | 0 (0.0%) |
| 20 to 24 Years | 70 (78.7%) | 12 (17.1%) |
| 25 to 29 Years | 170 (93.4%) | 0 (0.0%) |
| 30 to 34 Years | 82 (100.0%) | 0 (0.0%) |
| 35 to 44 Years | 190 (70.9%) | 7 (3.7%) |
| 45 to 54 Years | 117 (77.0%) | 0 (0.0%) |
| 55 to 59 Years | 66 (57.4%) | 0 (0.0%) |
| 60 to 64 Years | 82 (47.7%) | 14 (17.1%) |
| 65 to 74 Years | 89 (46.4%) | 0 (0.0%) |
| 75 Years and over | 17 (26.6%) | 0 (0.0%) |
| Total | 900 (67.0%) | 33 (3.7%) |
Employment Status by Educational Attainment in Jemez Pueblo
According to labor force statistics for Jemez Pueblo, 72.8% of individuals (707) out of the total population between 25 and 64 years of age (971) are in the labor force, with 3.0% or 21 of them being unemployed. The group with the highest labor force participation rate are those with the educational attainment of bachelor's degree or higher, with 87.6% or 85 individuals in the labor force. Within the labor force, individuals with less than high school education have the highest percentage of unemployment, with 43.8% or 21 of them being unemployed.
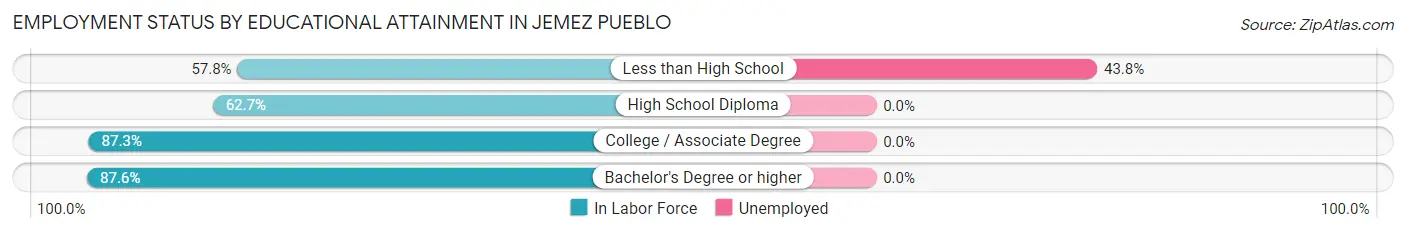
| Educational Attainment | In Labor Force | Unemployed |
| Less than High School | 48 (57.8%) | 36 (43.8%) |
| High School Diploma | 298 (62.7%) | 0 (0.0%) |
| College / Associate Degree | 276 (87.3%) | 0 (0.0%) |
| Bachelor's Degree or higher | 85 (87.6%) | 0 (0.0%) |
| Total | 707 (72.8%) | 29 (3.0%) |
Employment Occupations by Sex in Jemez Pueblo
Management, Business, Science and Arts Occupations
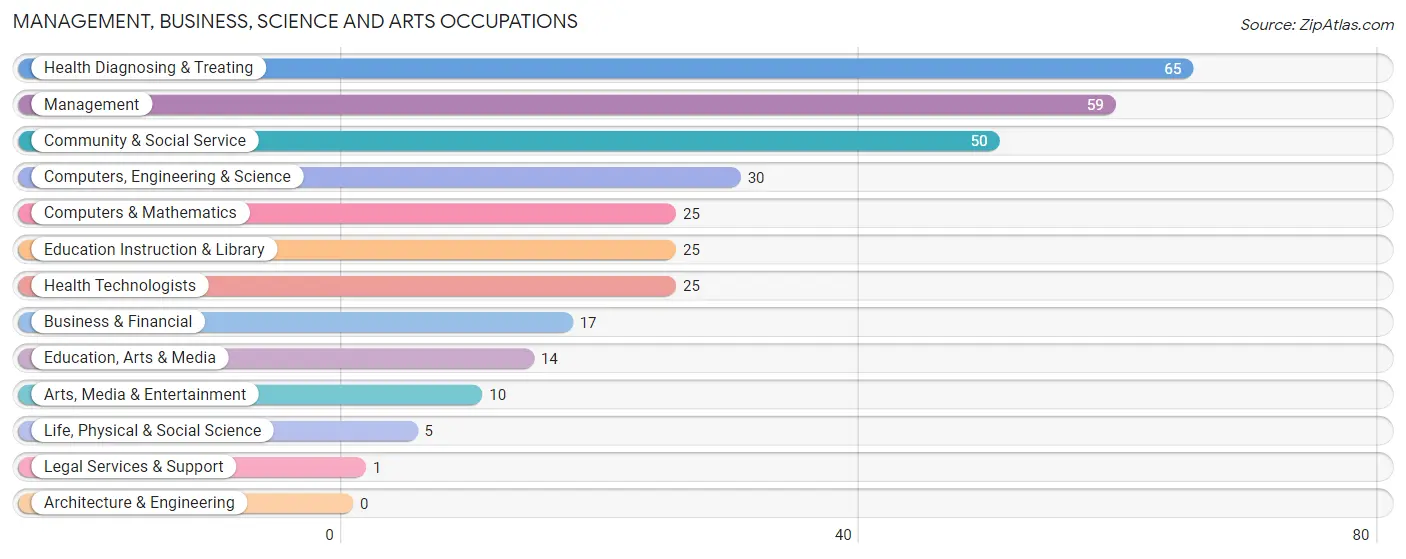
The most common Management, Business, Science and Arts occupations in Jemez Pueblo are Health Diagnosing & Treating (65 | 7.5%), Management (59 | 6.8%), Community & Social Service (50 | 5.8%), Computers, Engineering & Science (30 | 3.5%), and Computers & Mathematics (25 | 2.9%).
Management, Business, Science and Arts Occupations by Sex
Within the Management, Business, Science and Arts occupations in Jemez Pueblo, the most male-oriented occupations are Computers & Mathematics (100.0%), Computers, Engineering & Science (83.3%), and Health Diagnosing & Treating (56.9%), while the most female-oriented occupations are Business & Financial (100.0%), Life, Physical & Social Science (100.0%), and Legal Services & Support (100.0%).
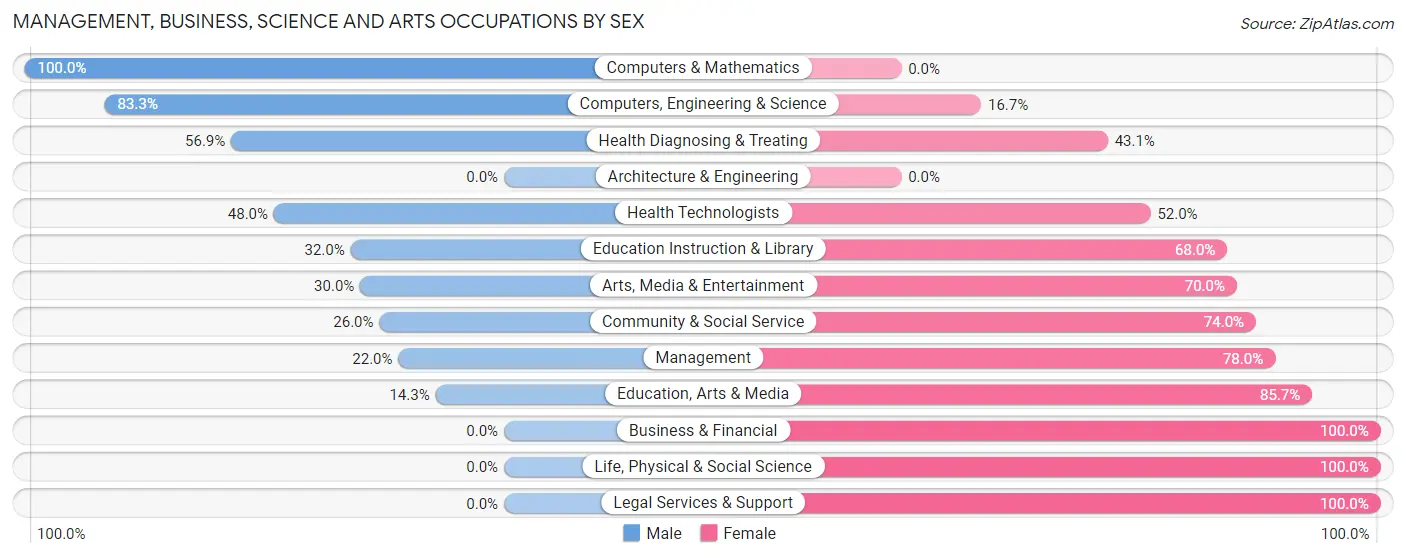
| Occupation | Male | Female |
| Management | 13 (22.0%) | 46 (78.0%) |
| Business & Financial | 0 (0.0%) | 17 (100.0%) |
| Computers, Engineering & Science | 25 (83.3%) | 5 (16.7%) |
| Computers & Mathematics | 25 (100.0%) | 0 (0.0%) |
| Architecture & Engineering | 0 (0.0%) | 0 (0.0%) |
| Life, Physical & Social Science | 0 (0.0%) | 5 (100.0%) |
| Community & Social Service | 13 (26.0%) | 37 (74.0%) |
| Education, Arts & Media | 2 (14.3%) | 12 (85.7%) |
| Legal Services & Support | 0 (0.0%) | 1 (100.0%) |
| Education Instruction & Library | 8 (32.0%) | 17 (68.0%) |
| Arts, Media & Entertainment | 3 (30.0%) | 7 (70.0%) |
| Health Diagnosing & Treating | 37 (56.9%) | 28 (43.1%) |
| Health Technologists | 12 (48.0%) | 13 (52.0%) |
| Total (Category) | 88 (39.8%) | 133 (60.2%) |
| Total (Overall) | 385 (44.4%) | 483 (55.6%) |
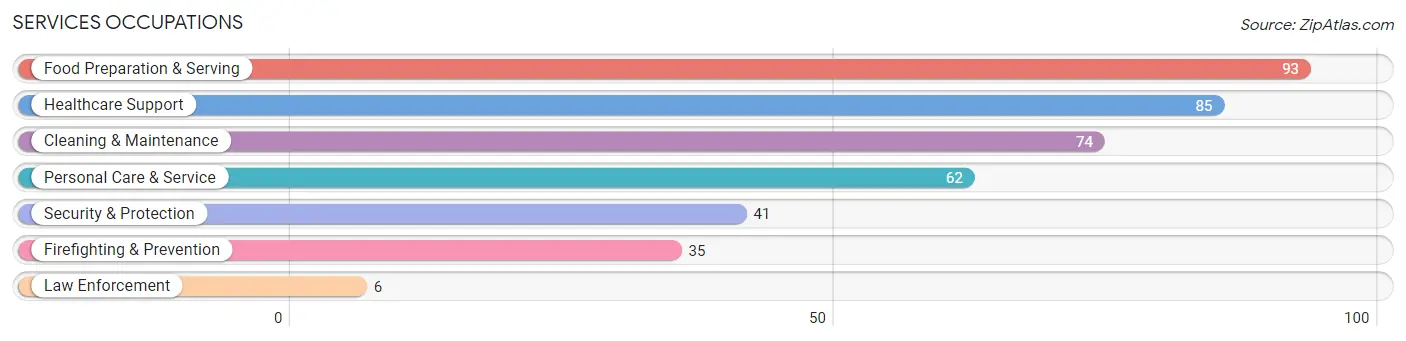
Services Occupations
The most common Services occupations in Jemez Pueblo are Food Preparation & Serving (93 | 10.7%), Healthcare Support (85 | 9.8%), Cleaning & Maintenance (74 | 8.5%), Personal Care & Service (62 | 7.1%), and Security & Protection (41 | 4.7%).
Services Occupations by Sex
Within the Services occupations in Jemez Pueblo, the most male-oriented occupations are Law Enforcement (100.0%), Cleaning & Maintenance (73.0%), and Personal Care & Service (64.5%), while the most female-oriented occupations are Healthcare Support (100.0%), Firefighting & Prevention (65.7%), and Security & Protection (56.1%).
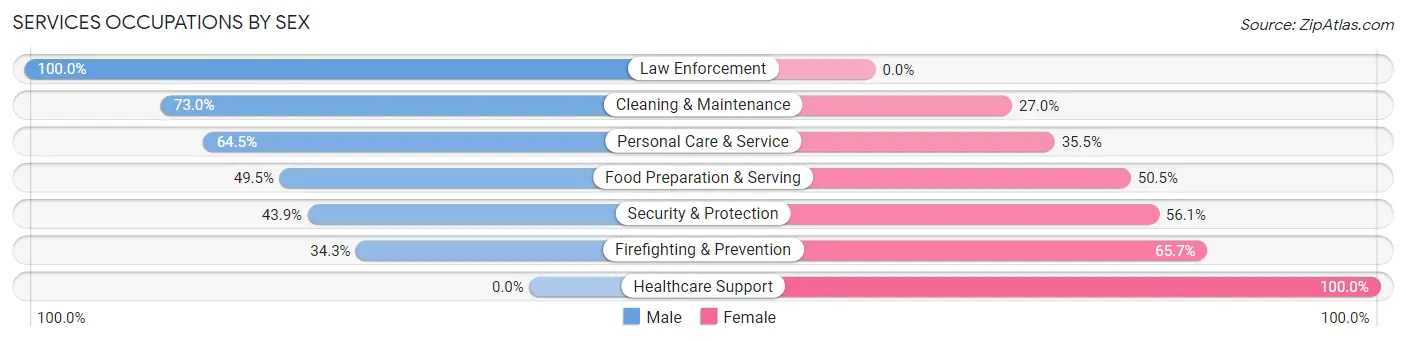
| Occupation | Male | Female |
| Healthcare Support | 0 (0.0%) | 85 (100.0%) |
| Security & Protection | 18 (43.9%) | 23 (56.1%) |
| Firefighting & Prevention | 12 (34.3%) | 23 (65.7%) |
| Law Enforcement | 6 (100.0%) | 0 (0.0%) |
| Food Preparation & Serving | 46 (49.5%) | 47 (50.5%) |
| Cleaning & Maintenance | 54 (73.0%) | 20 (27.0%) |
| Personal Care & Service | 40 (64.5%) | 22 (35.5%) |
| Total (Category) | 158 (44.5%) | 197 (55.5%) |
| Total (Overall) | 385 (44.4%) | 483 (55.6%) |
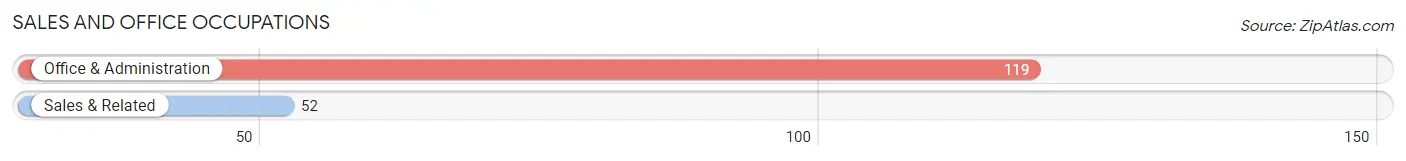
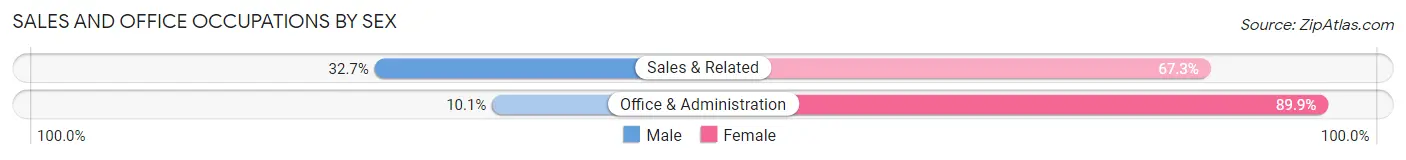
Sales and Office Occupations
The most common Sales and Office occupations in Jemez Pueblo are Office & Administration (119 | 13.7%), and Sales & Related (52 | 6.0%).
Sales and Office Occupations by Sex
| Occupation | Male | Female |
| Sales & Related | 17 (32.7%) | 35 (67.3%) |
| Office & Administration | 12 (10.1%) | 107 (89.9%) |
| Total (Category) | 29 (17.0%) | 142 (83.0%) |
| Total (Overall) | 385 (44.4%) | 483 (55.6%) |
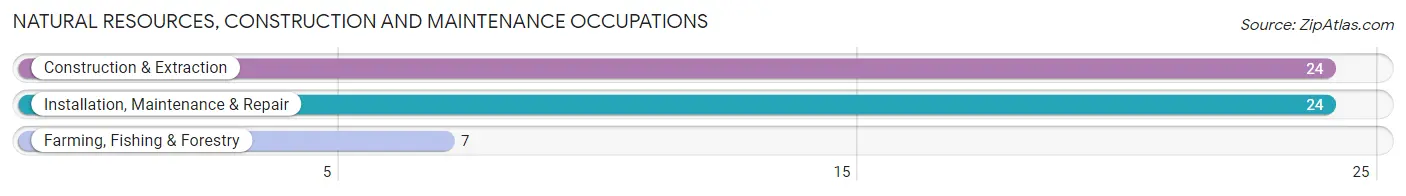
Natural Resources, Construction and Maintenance Occupations
The most common Natural Resources, Construction and Maintenance occupations in Jemez Pueblo are Construction & Extraction (24 | 2.8%), Installation, Maintenance & Repair (24 | 2.8%), and Farming, Fishing & Forestry (7 | 0.8%).
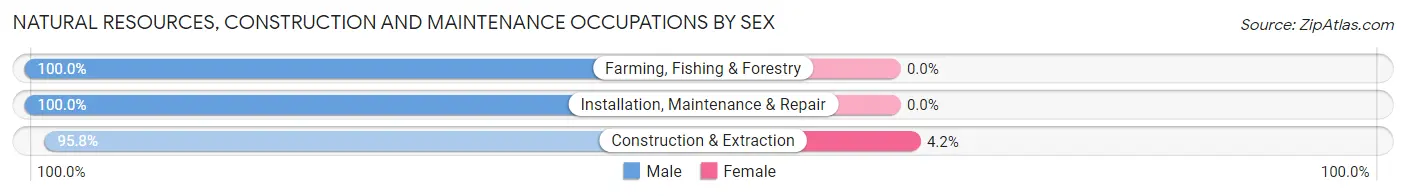
Natural Resources, Construction and Maintenance Occupations by Sex
| Occupation | Male | Female |
| Farming, Fishing & Forestry | 7 (100.0%) | 0 (0.0%) |
| Construction & Extraction | 23 (95.8%) | 1 (4.2%) |
| Installation, Maintenance & Repair | 24 (100.0%) | 0 (0.0%) |
| Total (Category) | 54 (98.2%) | 1 (1.8%) |
| Total (Overall) | 385 (44.4%) | 483 (55.6%) |
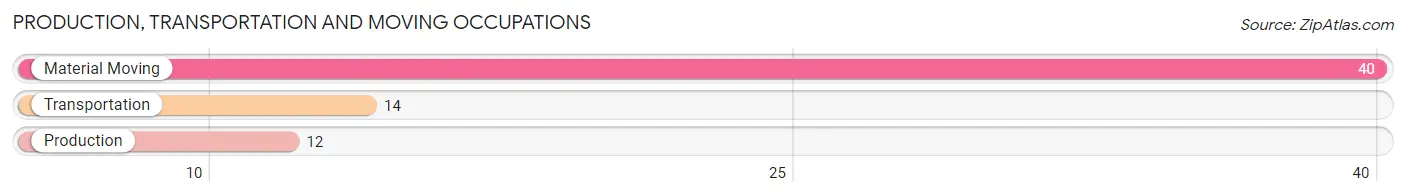
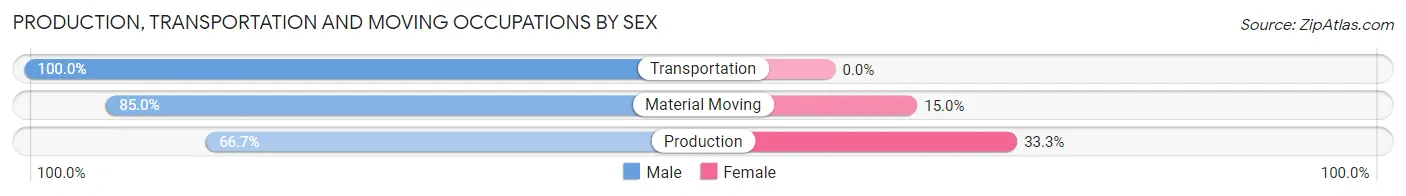
Production, Transportation and Moving Occupations
The most common Production, Transportation and Moving occupations in Jemez Pueblo are Material Moving (40 | 4.6%), Transportation (14 | 1.6%), and Production (12 | 1.4%).
Production, Transportation and Moving Occupations by Sex
| Occupation | Male | Female |
| Production | 8 (66.7%) | 4 (33.3%) |
| Transportation | 14 (100.0%) | 0 (0.0%) |
| Material Moving | 34 (85.0%) | 6 (15.0%) |
| Total (Category) | 56 (84.9%) | 10 (15.1%) |
| Total (Overall) | 385 (44.4%) | 483 (55.6%) |
Employment Industries by Sex in Jemez Pueblo
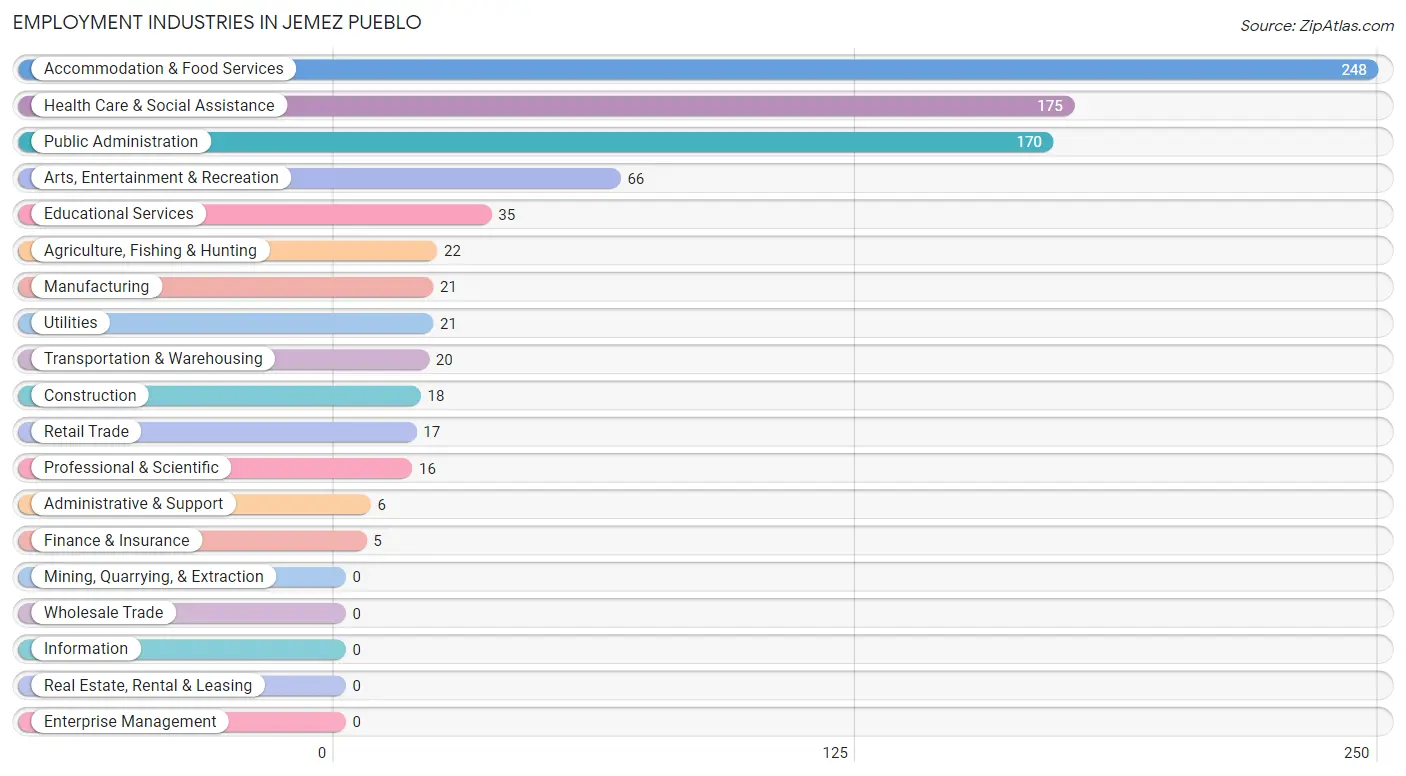
Employment Industries in Jemez Pueblo
The major employment industries in Jemez Pueblo include Accommodation & Food Services (248 | 28.6%), Health Care & Social Assistance (175 | 20.2%), Public Administration (170 | 19.6%), Arts, Entertainment & Recreation (66 | 7.6%), and Educational Services (35 | 4.0%).
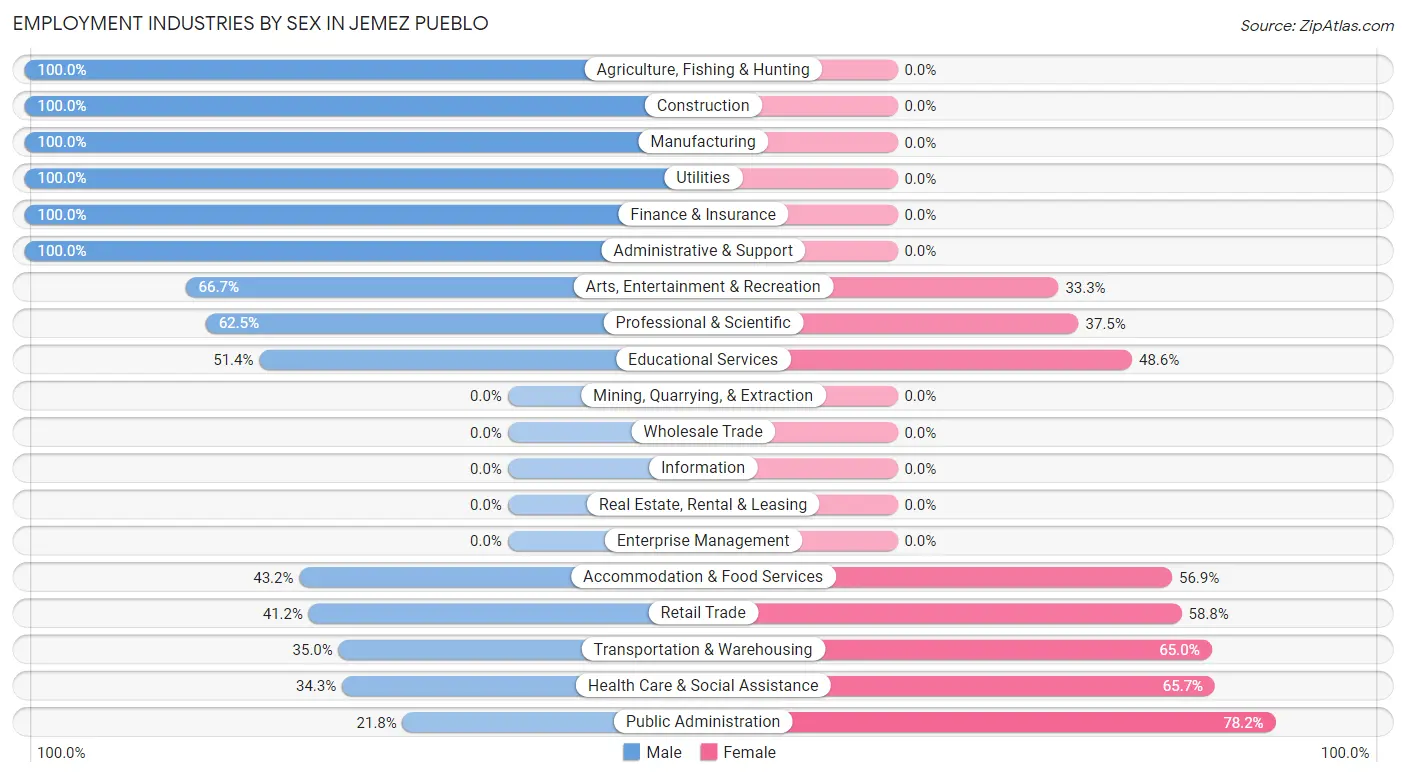
Employment Industries by Sex in Jemez Pueblo
The Jemez Pueblo industries that see more men than women are Agriculture, Fishing & Hunting (100.0%), Construction (100.0%), and Manufacturing (100.0%), whereas the industries that tend to have a higher number of women are Public Administration (78.2%), Health Care & Social Assistance (65.7%), and Transportation & Warehousing (65.0%).
| Industry | Male | Female |
| Agriculture, Fishing & Hunting | 22 (100.0%) | 0 (0.0%) |
| Mining, Quarrying, & Extraction | 0 (0.0%) | 0 (0.0%) |
| Construction | 18 (100.0%) | 0 (0.0%) |
| Manufacturing | 21 (100.0%) | 0 (0.0%) |
| Wholesale Trade | 0 (0.0%) | 0 (0.0%) |
| Retail Trade | 7 (41.2%) | 10 (58.8%) |
| Transportation & Warehousing | 7 (35.0%) | 13 (65.0%) |
| Utilities | 21 (100.0%) | 0 (0.0%) |
| Information | 0 (0.0%) | 0 (0.0%) |
| Finance & Insurance | 5 (100.0%) | 0 (0.0%) |
| Real Estate, Rental & Leasing | 0 (0.0%) | 0 (0.0%) |
| Professional & Scientific | 10 (62.5%) | 6 (37.5%) |
| Enterprise Management | 0 (0.0%) | 0 (0.0%) |
| Administrative & Support | 6 (100.0%) | 0 (0.0%) |
| Educational Services | 18 (51.4%) | 17 (48.6%) |
| Health Care & Social Assistance | 60 (34.3%) | 115 (65.7%) |
| Arts, Entertainment & Recreation | 44 (66.7%) | 22 (33.3%) |
| Accommodation & Food Services | 107 (43.1%) | 141 (56.9%) |
| Public Administration | 37 (21.8%) | 133 (78.2%) |
| Total | 385 (44.4%) | 483 (55.6%) |
Education in Jemez Pueblo
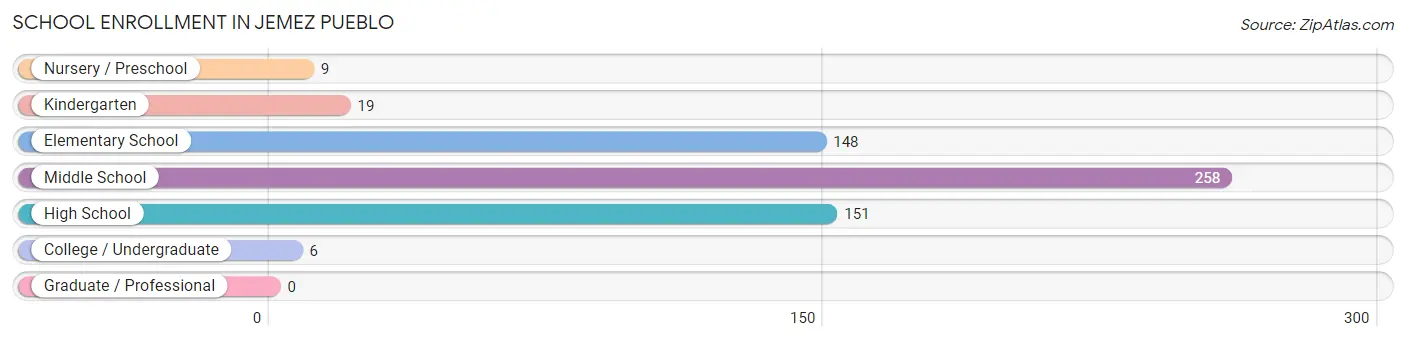
School Enrollment in Jemez Pueblo
The most common levels of schooling among the 591 students in Jemez Pueblo are middle school (258 | 43.6%), high school (151 | 25.6%), and elementary school (148 | 25.0%).
| School Level | # Students | % Students |
| Nursery / Preschool | 9 | 1.5% |
| Kindergarten | 19 | 3.2% |
| Elementary School | 148 | 25.0% |
| Middle School | 258 | 43.6% |
| High School | 151 | 25.6% |
| College / Undergraduate | 6 | 1.0% |
| Graduate / Professional | 0 | 0.0% |
| Total | 591 | 100.0% |
School Enrollment by Age by Funding Source in Jemez Pueblo
Out of a total of 591 students who are enrolled in schools in Jemez Pueblo, 86 (14.6%) attend a private institution, while the remaining 505 (85.4%) are enrolled in public schools. The age group of 3 to 4 year olds has the highest likelihood of being enrolled in private schools, with 9 (100.0% in the age bracket) enrolled. Conversely, the age group of 15 to 17 year olds has the lowest likelihood of being enrolled in a private school, with 43 (100.0% in the age bracket) attending a public institution.
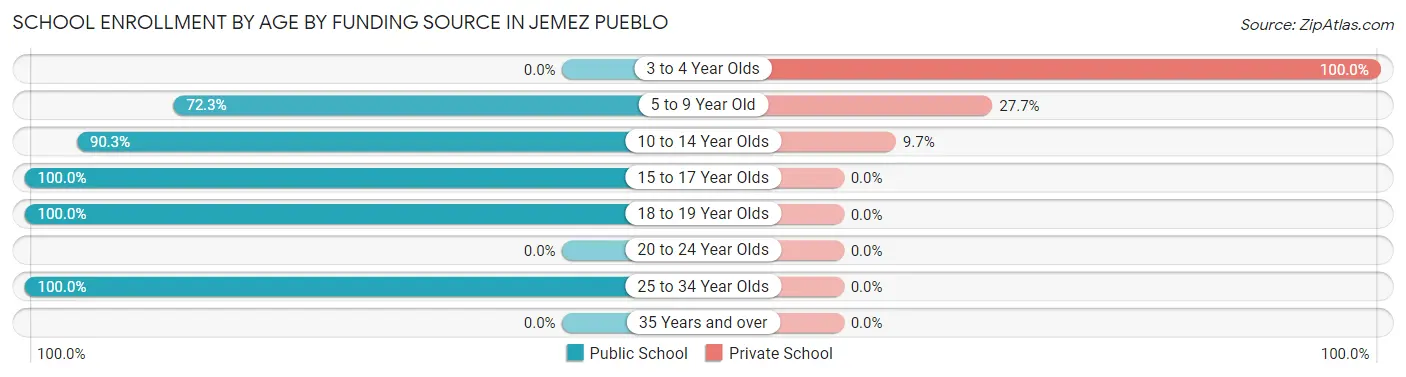
| Age Bracket | Public School | Private School |
| 3 to 4 Year Olds | 0 (0.0%) | 9 (100.0%) |
| 5 to 9 Year Old | 107 (72.3%) | 41 (27.7%) |
| 10 to 14 Year Olds | 334 (90.3%) | 36 (9.7%) |
| 15 to 17 Year Olds | 43 (100.0%) | 0 (0.0%) |
| 18 to 19 Year Olds | 16 (100.0%) | 0 (0.0%) |
| 20 to 24 Year Olds | 0 (0.0%) | 0 (0.0%) |
| 25 to 34 Year Olds | 5 (100.0%) | 0 (0.0%) |
| 35 Years and over | 0 (0.0%) | 0 (0.0%) |
| Total | 505 (85.4%) | 86 (14.6%) |
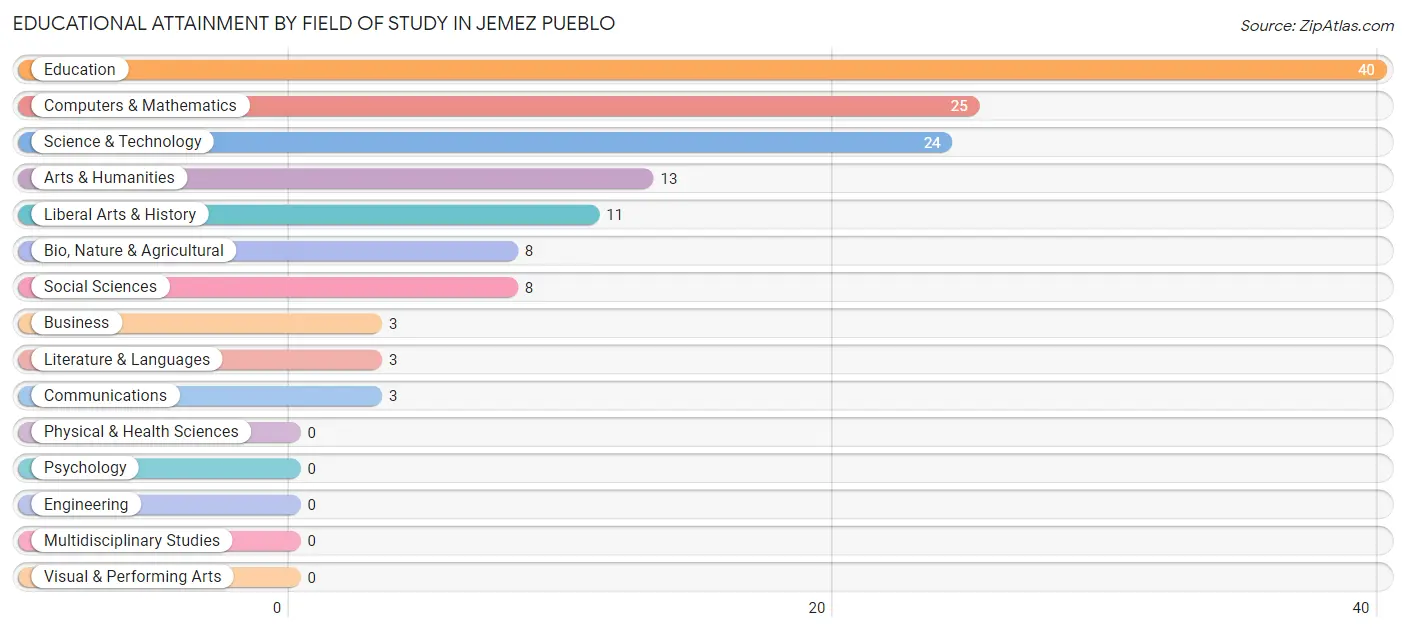
Educational Attainment by Field of Study in Jemez Pueblo
Education (40 | 29.0%), computers & mathematics (25 | 18.1%), science & technology (24 | 17.4%), arts & humanities (13 | 9.4%), and liberal arts & history (11 | 8.0%) are the most common fields of study among 138 individuals in Jemez Pueblo who have obtained a bachelor's degree or higher.
| Field of Study | # Graduates | % Graduates |
| Computers & Mathematics | 25 | 18.1% |
| Bio, Nature & Agricultural | 8 | 5.8% |
| Physical & Health Sciences | 0 | 0.0% |
| Psychology | 0 | 0.0% |
| Social Sciences | 8 | 5.8% |
| Engineering | 0 | 0.0% |
| Multidisciplinary Studies | 0 | 0.0% |
| Science & Technology | 24 | 17.4% |
| Business | 3 | 2.2% |
| Education | 40 | 29.0% |
| Literature & Languages | 3 | 2.2% |
| Liberal Arts & History | 11 | 8.0% |
| Visual & Performing Arts | 0 | 0.0% |
| Communications | 3 | 2.2% |
| Arts & Humanities | 13 | 9.4% |
| Total | 138 | 100.0% |
Transportation & Commute in Jemez Pueblo
Vehicle Availability by Sex in Jemez Pueblo
The most prevalent vehicle ownership categories in Jemez Pueblo are males with 2 vehicles (148, accounting for 38.6%) and females with 2 vehicles (176, making up 31.1%).
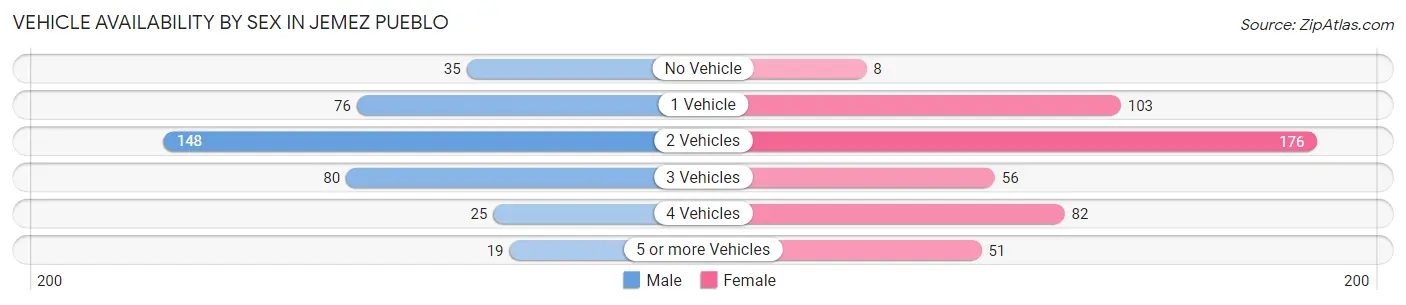
| Vehicles Available | Male | Female |
| No Vehicle | 35 (9.1%) | 8 (1.7%) |
| 1 Vehicle | 76 (19.8%) | 103 (21.6%) |
| 2 Vehicles | 148 (38.6%) | 176 (37.0%) |
| 3 Vehicles | 80 (20.9%) | 56 (11.8%) |
| 4 Vehicles | 25 (6.5%) | 82 (17.2%) |
| 5 or more Vehicles | 19 (5.0%) | 51 (10.7%) |
| Total | 383 (100.0%) | 476 (100.0%) |
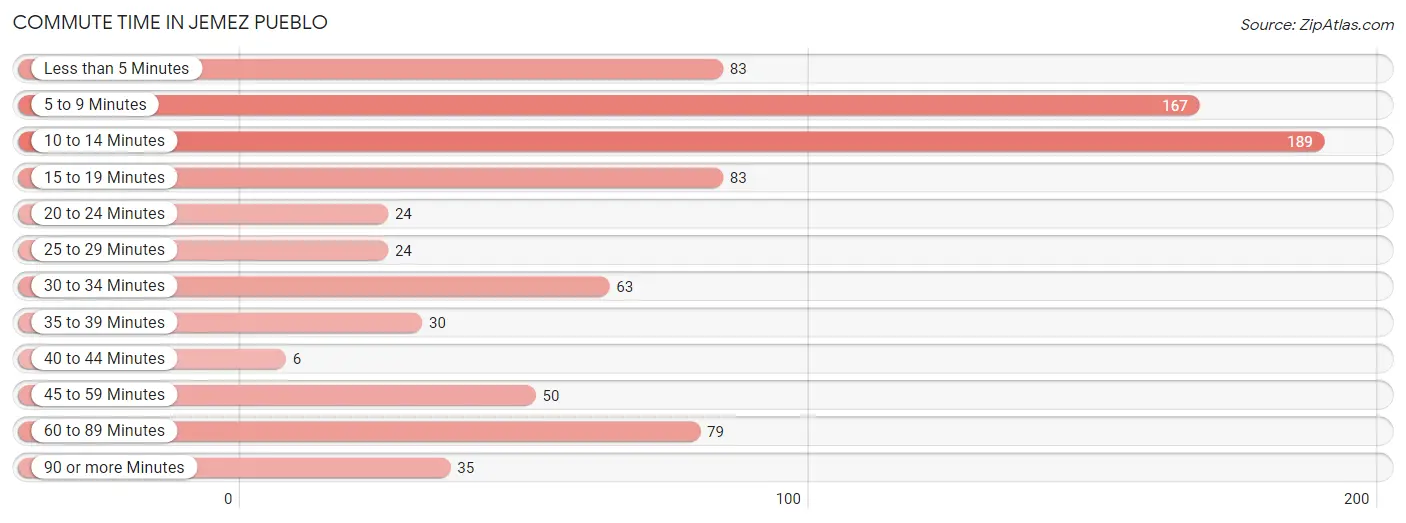
Commute Time in Jemez Pueblo
The most frequently occuring commute durations in Jemez Pueblo are 10 to 14 minutes (189 commuters, 22.7%), 5 to 9 minutes (167 commuters, 20.1%), and less than 5 minutes (83 commuters, 10.0%).
| Commute Time | # Commuters | % Commuters |
| Less than 5 Minutes | 83 | 10.0% |
| 5 to 9 Minutes | 167 | 20.1% |
| 10 to 14 Minutes | 189 | 22.7% |
| 15 to 19 Minutes | 83 | 10.0% |
| 20 to 24 Minutes | 24 | 2.9% |
| 25 to 29 Minutes | 24 | 2.9% |
| 30 to 34 Minutes | 63 | 7.6% |
| 35 to 39 Minutes | 30 | 3.6% |
| 40 to 44 Minutes | 6 | 0.7% |
| 45 to 59 Minutes | 50 | 6.0% |
| 60 to 89 Minutes | 79 | 9.5% |
| 90 or more Minutes | 35 | 4.2% |
Commute Time by Sex in Jemez Pueblo
The most common commute times in Jemez Pueblo are 5 to 9 minutes (106 commuters, 27.9%) for males and 10 to 14 minutes (123 commuters, 27.2%) for females.
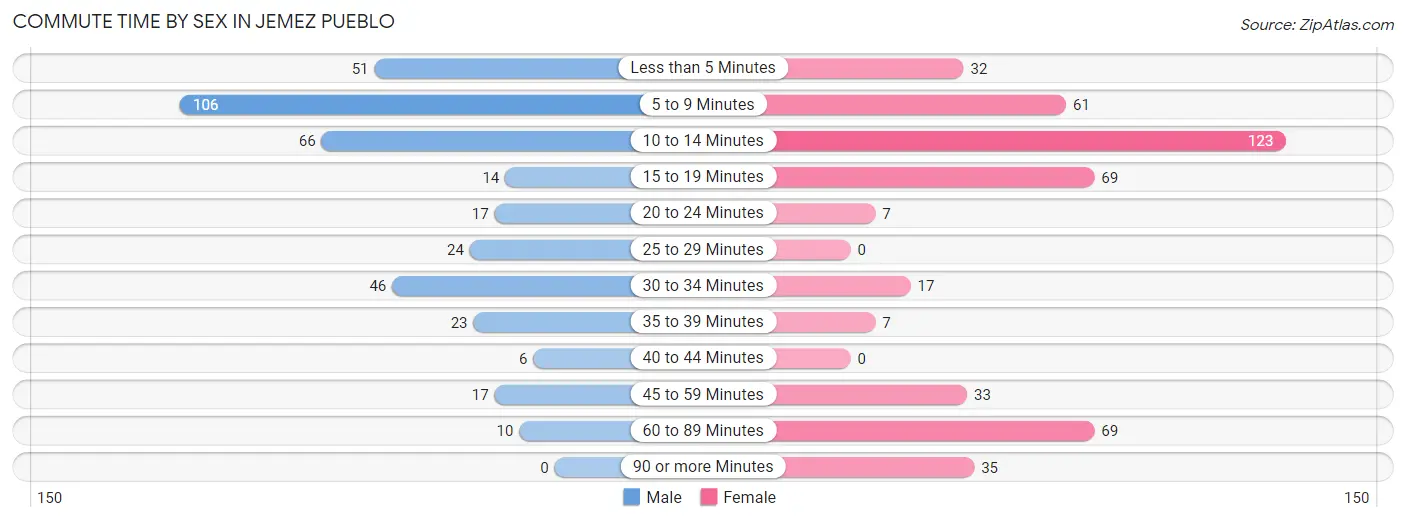
| Commute Time | Male | Female |
| Less than 5 Minutes | 51 (13.4%) | 32 (7.1%) |
| 5 to 9 Minutes | 106 (27.9%) | 61 (13.5%) |
| 10 to 14 Minutes | 66 (17.4%) | 123 (27.2%) |
| 15 to 19 Minutes | 14 (3.7%) | 69 (15.2%) |
| 20 to 24 Minutes | 17 (4.5%) | 7 (1.5%) |
| 25 to 29 Minutes | 24 (6.3%) | 0 (0.0%) |
| 30 to 34 Minutes | 46 (12.1%) | 17 (3.7%) |
| 35 to 39 Minutes | 23 (6.0%) | 7 (1.5%) |
| 40 to 44 Minutes | 6 (1.6%) | 0 (0.0%) |
| 45 to 59 Minutes | 17 (4.5%) | 33 (7.3%) |
| 60 to 89 Minutes | 10 (2.6%) | 69 (15.2%) |
| 90 or more Minutes | 0 (0.0%) | 35 (7.7%) |
Time of Departure to Work by Sex in Jemez Pueblo
The most frequent times of departure to work in Jemez Pueblo are 7:00 AM to 7:29 AM (113, 29.7%) for males and 7:30 AM to 7:59 AM (154, 34.0%) for females.
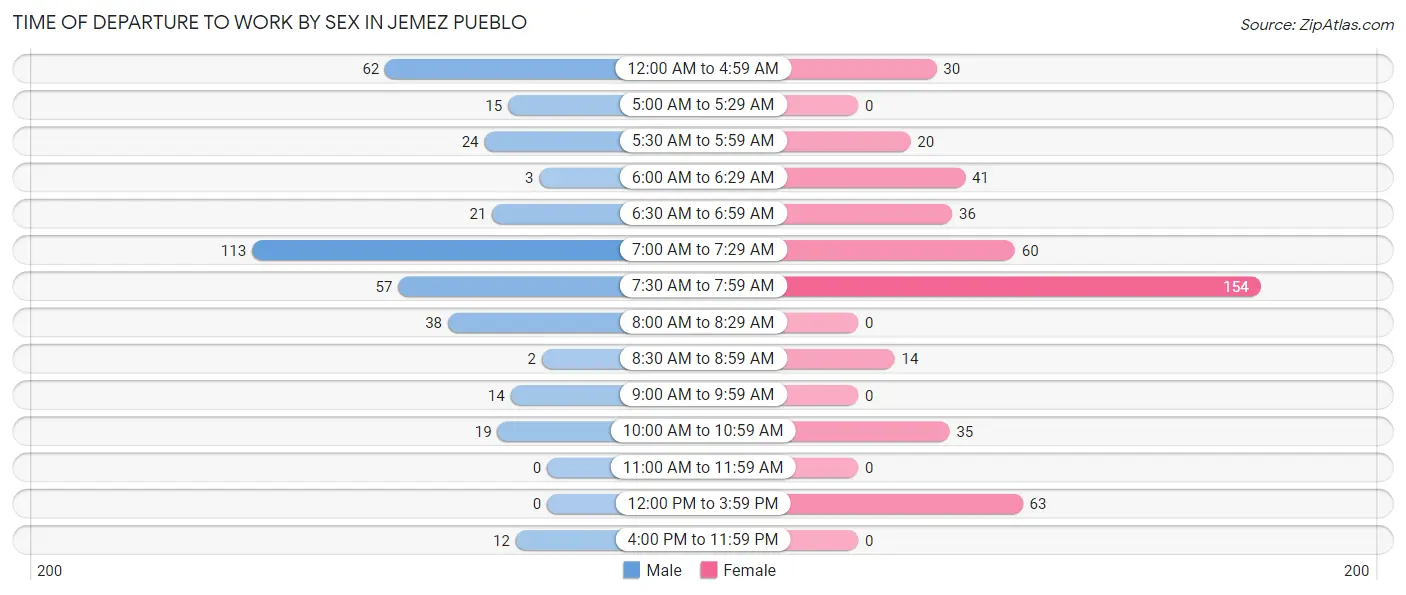
| Time of Departure | Male | Female |
| 12:00 AM to 4:59 AM | 62 (16.3%) | 30 (6.6%) |
| 5:00 AM to 5:29 AM | 15 (4.0%) | 0 (0.0%) |
| 5:30 AM to 5:59 AM | 24 (6.3%) | 20 (4.4%) |
| 6:00 AM to 6:29 AM | 3 (0.8%) | 41 (9.0%) |
| 6:30 AM to 6:59 AM | 21 (5.5%) | 36 (8.0%) |
| 7:00 AM to 7:29 AM | 113 (29.7%) | 60 (13.3%) |
| 7:30 AM to 7:59 AM | 57 (15.0%) | 154 (34.0%) |
| 8:00 AM to 8:29 AM | 38 (10.0%) | 0 (0.0%) |
| 8:30 AM to 8:59 AM | 2 (0.5%) | 14 (3.1%) |
| 9:00 AM to 9:59 AM | 14 (3.7%) | 0 (0.0%) |
| 10:00 AM to 10:59 AM | 19 (5.0%) | 35 (7.7%) |
| 11:00 AM to 11:59 AM | 0 (0.0%) | 0 (0.0%) |
| 12:00 PM to 3:59 PM | 0 (0.0%) | 63 (13.9%) |
| 4:00 PM to 11:59 PM | 12 (3.2%) | 0 (0.0%) |
| Total | 380 (100.0%) | 453 (100.0%) |
Housing Occupancy in Jemez Pueblo
Occupancy by Ownership in Jemez Pueblo
Of the total 501 dwellings in Jemez Pueblo, owner-occupied units account for 370 (73.9%), while renter-occupied units make up 131 (26.2%).
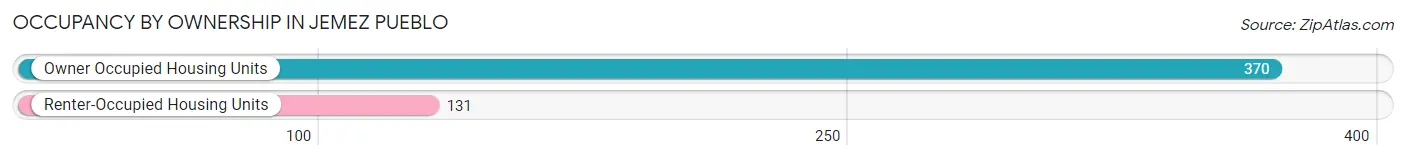
| Occupancy | # Housing Units | % Housing Units |
| Owner Occupied Housing Units | 370 | 73.9% |
| Renter-Occupied Housing Units | 131 | 26.2% |
| Total Occupied Housing Units | 501 | 100.0% |
Occupancy by Household Size in Jemez Pueblo
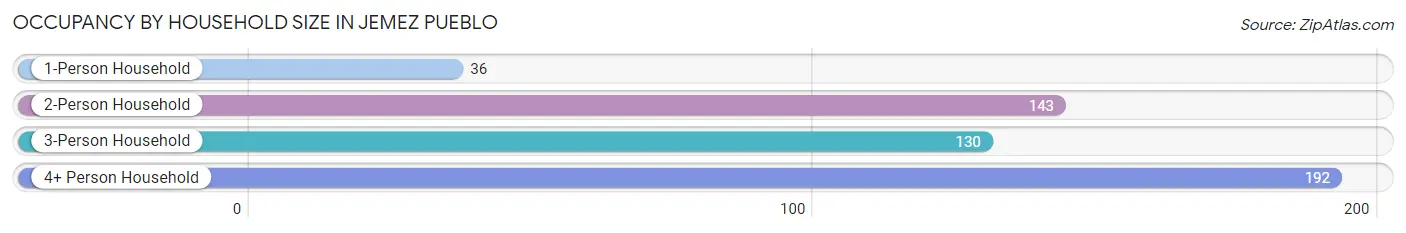
| Household Size | # Housing Units | % Housing Units |
| 1-Person Household | 36 | 7.2% |
| 2-Person Household | 143 | 28.5% |
| 3-Person Household | 130 | 26.0% |
| 4+ Person Household | 192 | 38.3% |
| Total Housing Units | 501 | 100.0% |
Occupancy by Ownership by Household Size in Jemez Pueblo
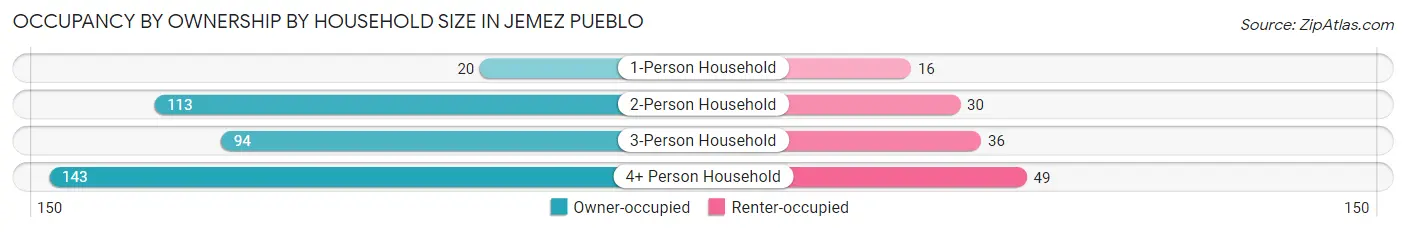
| Household Size | Owner-occupied | Renter-occupied |
| 1-Person Household | 20 (55.6%) | 16 (44.4%) |
| 2-Person Household | 113 (79.0%) | 30 (21.0%) |
| 3-Person Household | 94 (72.3%) | 36 (27.7%) |
| 4+ Person Household | 143 (74.5%) | 49 (25.5%) |
| Total Housing Units | 370 (73.9%) | 131 (26.2%) |
Occupancy by Educational Attainment in Jemez Pueblo
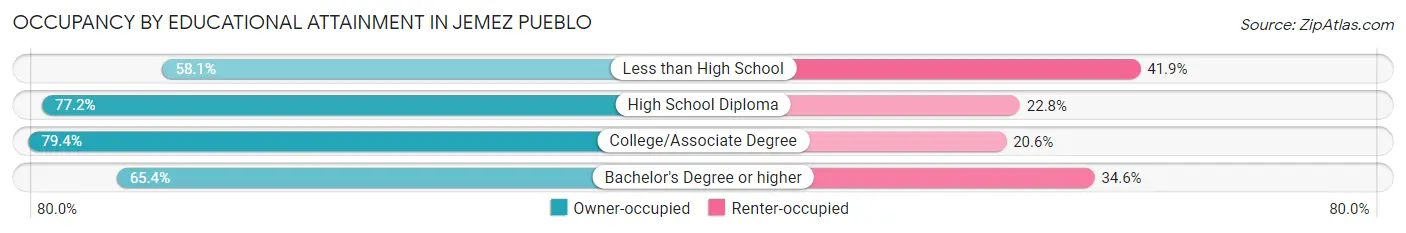
| Household Size | Owner-occupied | Renter-occupied |
| Less than High School | 43 (58.1%) | 31 (41.9%) |
| High School Diploma | 166 (77.2%) | 49 (22.8%) |
| College/Associate Degree | 127 (79.4%) | 33 (20.6%) |
| Bachelor's Degree or higher | 34 (65.4%) | 18 (34.6%) |
Occupancy by Age of Householder in Jemez Pueblo
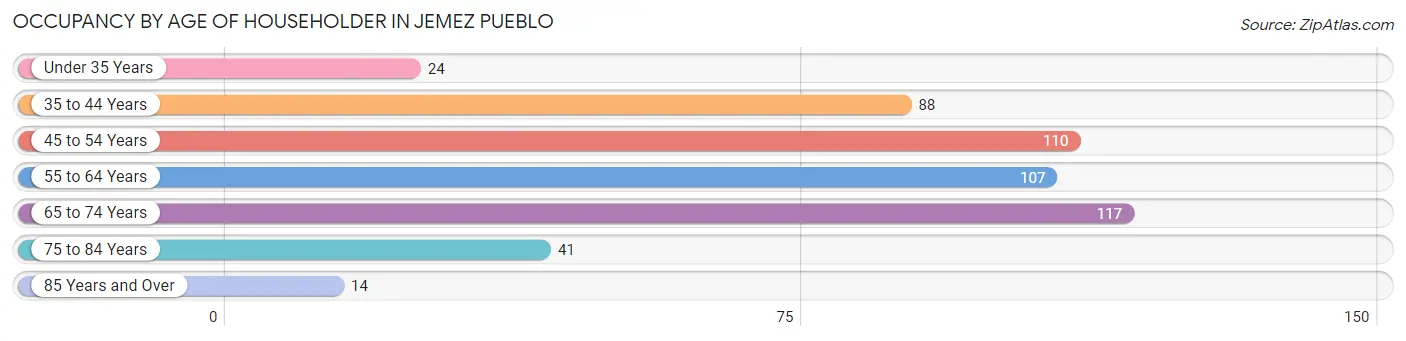
| Age Bracket | # Households | % Households |
| Under 35 Years | 24 | 4.8% |
| 35 to 44 Years | 88 | 17.6% |
| 45 to 54 Years | 110 | 22.0% |
| 55 to 64 Years | 107 | 21.4% |
| 65 to 74 Years | 117 | 23.4% |
| 75 to 84 Years | 41 | 8.2% |
| 85 Years and Over | 14 | 2.8% |
| Total | 501 | 100.0% |
Housing Finances in Jemez Pueblo
Median Income by Occupancy in Jemez Pueblo
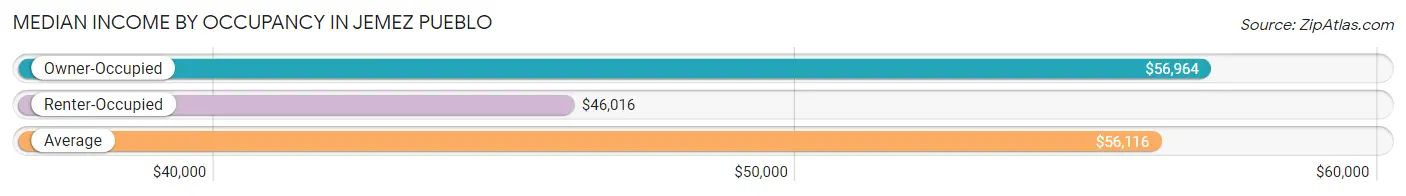
| Occupancy Type | # Households | Median Income |
| Owner-Occupied | 370 (73.9%) | $56,964 |
| Renter-Occupied | 131 (26.2%) | $46,016 |
| Average | 501 (100.0%) | $56,116 |
Occupancy by Householder Income Bracket in Jemez Pueblo
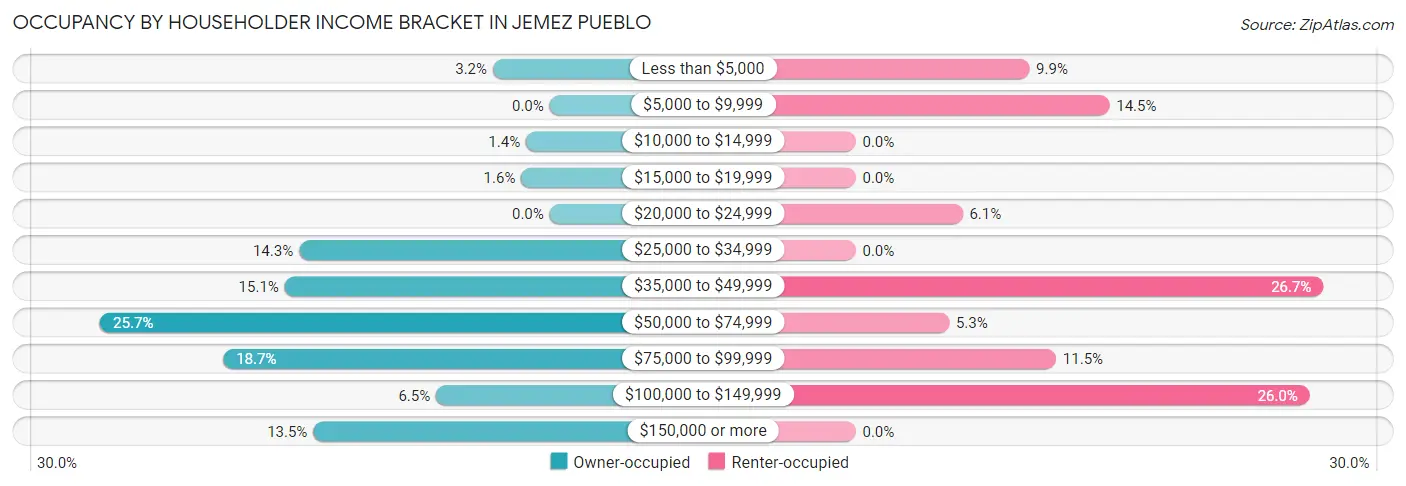
| Income Bracket | Owner-occupied | Renter-occupied |
| Less than $5,000 | 12 (3.2%) | 13 (9.9%) |
| $5,000 to $9,999 | 0 (0.0%) | 19 (14.5%) |
| $10,000 to $14,999 | 5 (1.3%) | 0 (0.0%) |
| $15,000 to $19,999 | 6 (1.6%) | 0 (0.0%) |
| $20,000 to $24,999 | 0 (0.0%) | 8 (6.1%) |
| $25,000 to $34,999 | 53 (14.3%) | 0 (0.0%) |
| $35,000 to $49,999 | 56 (15.1%) | 35 (26.7%) |
| $50,000 to $74,999 | 95 (25.7%) | 7 (5.3%) |
| $75,000 to $99,999 | 69 (18.6%) | 15 (11.5%) |
| $100,000 to $149,999 | 24 (6.5%) | 34 (26.0%) |
| $150,000 or more | 50 (13.5%) | 0 (0.0%) |
| Total | 370 (100.0%) | 131 (100.0%) |
Monthly Housing Cost Tiers in Jemez Pueblo
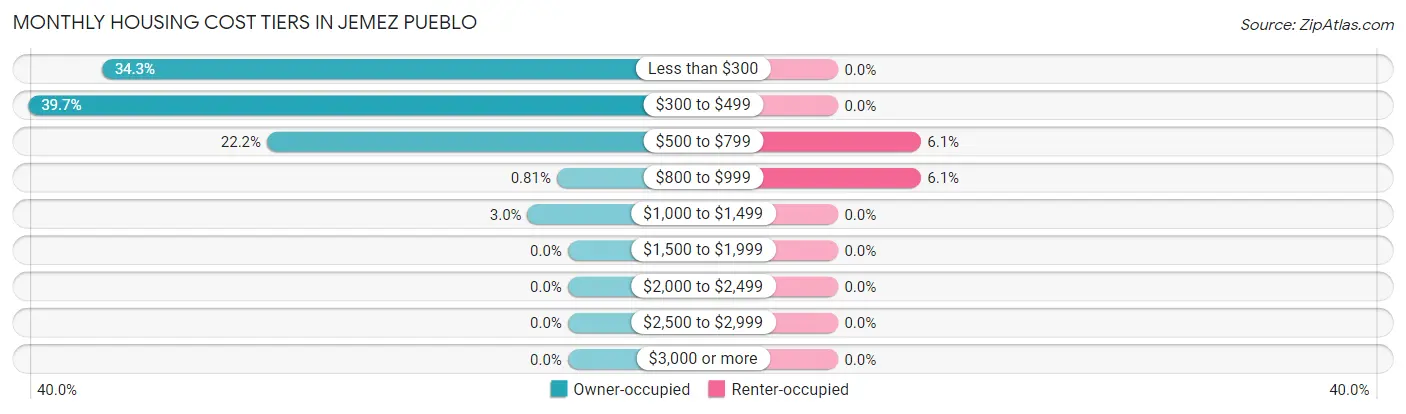
| Monthly Cost | Owner-occupied | Renter-occupied |
| Less than $300 | 127 (34.3%) | 0 (0.0%) |
| $300 to $499 | 147 (39.7%) | 0 (0.0%) |
| $500 to $799 | 82 (22.2%) | 8 (6.1%) |
| $800 to $999 | 3 (0.8%) | 8 (6.1%) |
| $1,000 to $1,499 | 11 (3.0%) | 0 (0.0%) |
| $1,500 to $1,999 | 0 (0.0%) | 0 (0.0%) |
| $2,000 to $2,499 | 0 (0.0%) | 0 (0.0%) |
| $2,500 to $2,999 | 0 (0.0%) | 0 (0.0%) |
| $3,000 or more | 0 (0.0%) | 0 (0.0%) |
| Total | 370 (100.0%) | 131 (100.0%) |
Physical Housing Characteristics in Jemez Pueblo
Housing Structures in Jemez Pueblo
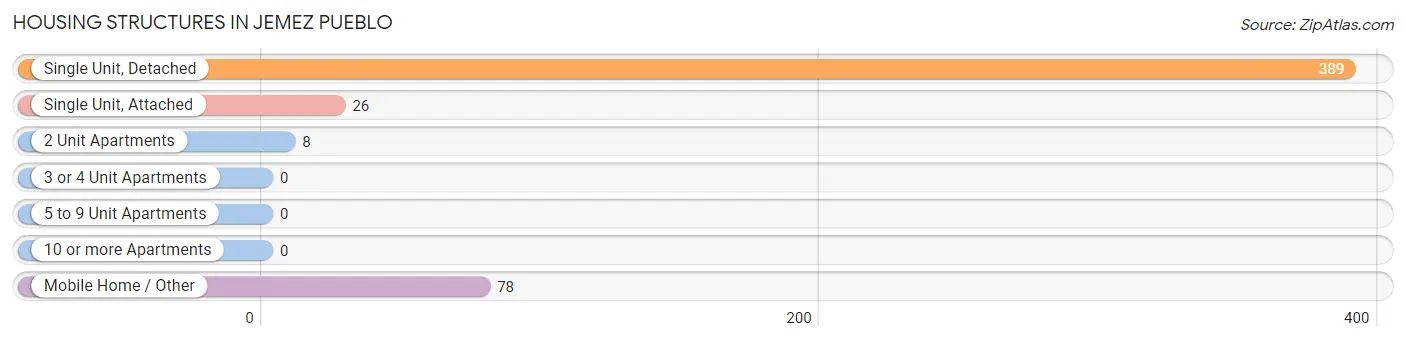
| Structure Type | # Housing Units | % Housing Units |
| Single Unit, Detached | 389 | 77.6% |
| Single Unit, Attached | 26 | 5.2% |
| 2 Unit Apartments | 8 | 1.6% |
| 3 or 4 Unit Apartments | 0 | 0.0% |
| 5 to 9 Unit Apartments | 0 | 0.0% |
| 10 or more Apartments | 0 | 0.0% |
| Mobile Home / Other | 78 | 15.6% |
| Total | 501 | 100.0% |
Housing Structures by Occupancy in Jemez Pueblo
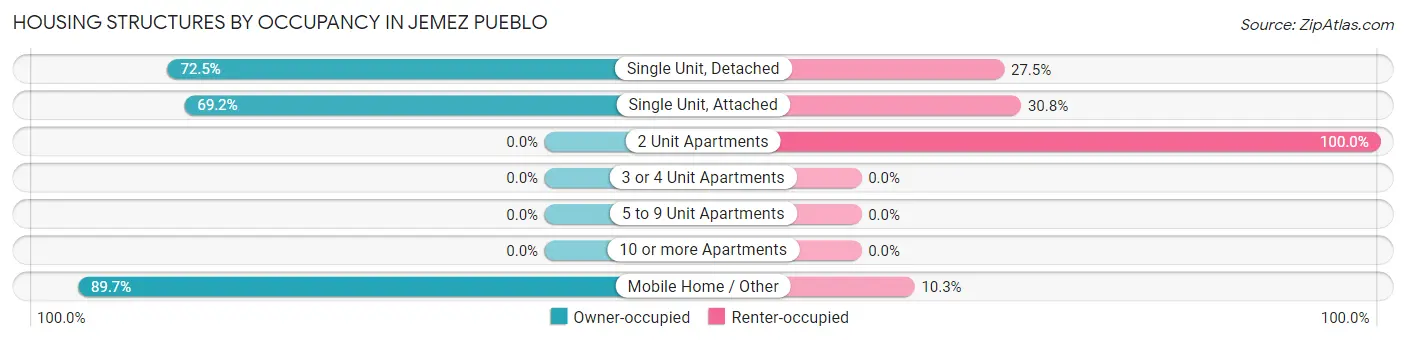
| Structure Type | Owner-occupied | Renter-occupied |
| Single Unit, Detached | 282 (72.5%) | 107 (27.5%) |
| Single Unit, Attached | 18 (69.2%) | 8 (30.8%) |
| 2 Unit Apartments | 0 (0.0%) | 8 (100.0%) |
| 3 or 4 Unit Apartments | 0 (0.0%) | 0 (0.0%) |
| 5 to 9 Unit Apartments | 0 (0.0%) | 0 (0.0%) |
| 10 or more Apartments | 0 (0.0%) | 0 (0.0%) |
| Mobile Home / Other | 70 (89.7%) | 8 (10.3%) |
| Total | 370 (73.9%) | 131 (26.2%) |
Housing Structures by Number of Rooms in Jemez Pueblo
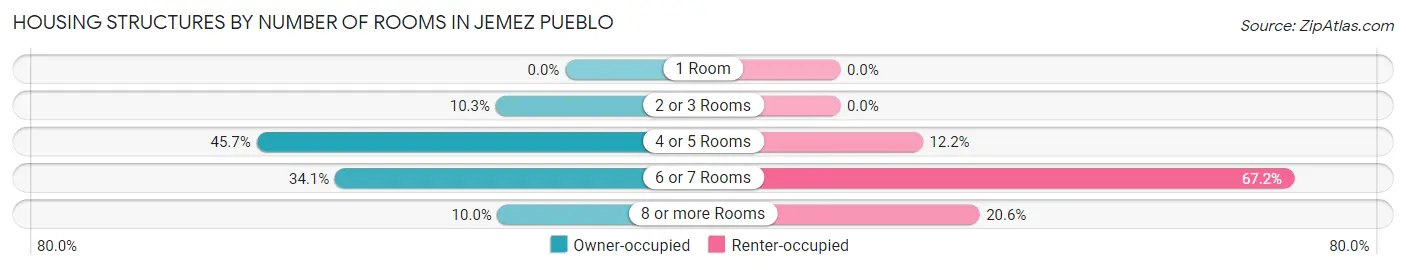
| Number of Rooms | Owner-occupied | Renter-occupied |
| 1 Room | 0 (0.0%) | 0 (0.0%) |
| 2 or 3 Rooms | 38 (10.3%) | 0 (0.0%) |
| 4 or 5 Rooms | 169 (45.7%) | 16 (12.2%) |
| 6 or 7 Rooms | 126 (34.1%) | 88 (67.2%) |
| 8 or more Rooms | 37 (10.0%) | 27 (20.6%) |
| Total | 370 (100.0%) | 131 (100.0%) |
Housing Structure by Heating Type in Jemez Pueblo
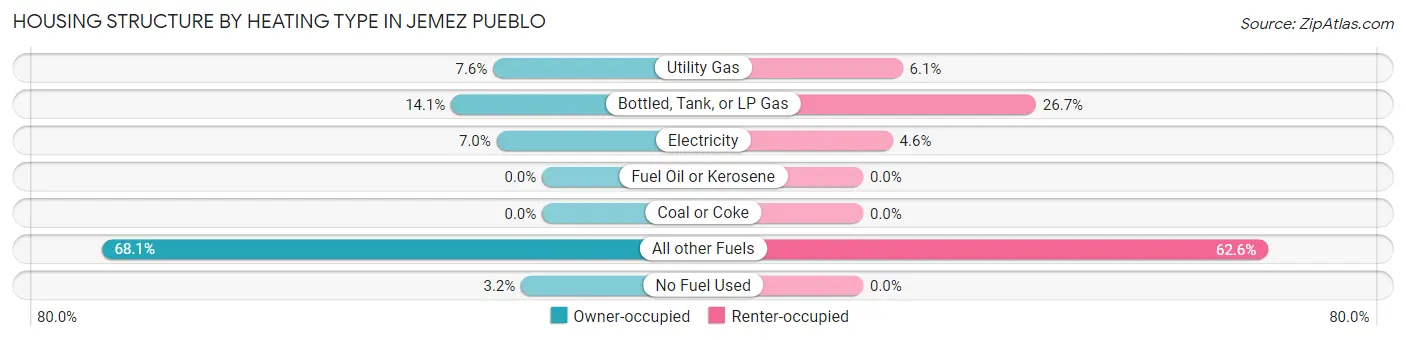
| Heating Type | Owner-occupied | Renter-occupied |
| Utility Gas | 28 (7.6%) | 8 (6.1%) |
| Bottled, Tank, or LP Gas | 52 (14.1%) | 35 (26.7%) |
| Electricity | 26 (7.0%) | 6 (4.6%) |
| Fuel Oil or Kerosene | 0 (0.0%) | 0 (0.0%) |
| Coal or Coke | 0 (0.0%) | 0 (0.0%) |
| All other Fuels | 252 (68.1%) | 82 (62.6%) |
| No Fuel Used | 12 (3.2%) | 0 (0.0%) |
| Total | 370 (100.0%) | 131 (100.0%) |
Household Vehicle Usage in Jemez Pueblo
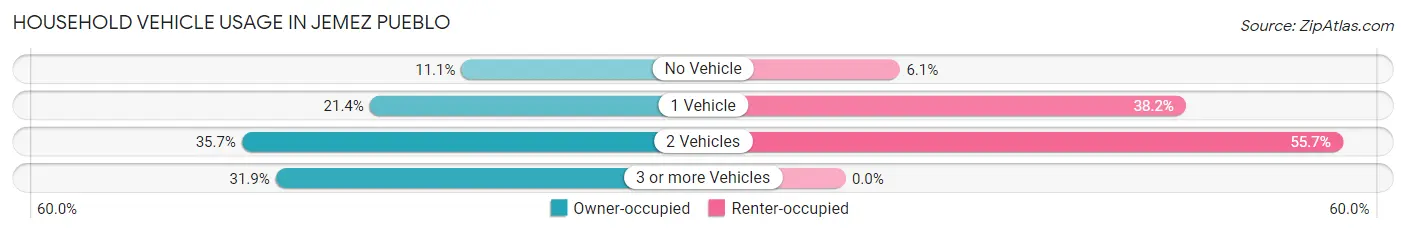
| Vehicles per Household | Owner-occupied | Renter-occupied |
| No Vehicle | 41 (11.1%) | 8 (6.1%) |
| 1 Vehicle | 79 (21.3%) | 50 (38.2%) |
| 2 Vehicles | 132 (35.7%) | 73 (55.7%) |
| 3 or more Vehicles | 118 (31.9%) | 0 (0.0%) |
| Total | 370 (100.0%) | 131 (100.0%) |
Real Estate & Mortgages in Jemez Pueblo
Real Estate and Mortgage Overview in Jemez Pueblo
| Characteristic | Without Mortgage | With Mortgage |
| Housing Units | 364 | 6 |
| Median Property Value | $221,200 | $0 |
| Median Household Income | $56,696 | $0 |
| Monthly Housing Costs | $389 | $0 |
| Real Estate Taxes | - | - |
Property Value by Mortgage Status in Jemez Pueblo
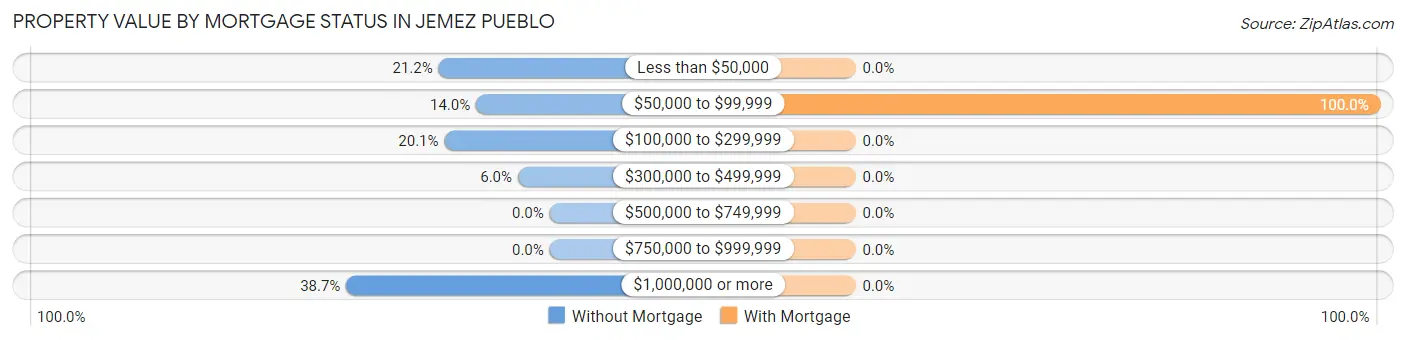
| Property Value | Without Mortgage | With Mortgage |
| Less than $50,000 | 77 (21.1%) | 0 (0.0%) |
| $50,000 to $99,999 | 51 (14.0%) | 6 (100.0%) |
| $100,000 to $299,999 | 73 (20.1%) | 0 (0.0%) |
| $300,000 to $499,999 | 22 (6.0%) | 0 (0.0%) |
| $500,000 to $749,999 | 0 (0.0%) | 0 (0.0%) |
| $750,000 to $999,999 | 0 (0.0%) | 0 (0.0%) |
| $1,000,000 or more | 141 (38.7%) | 0 (0.0%) |
| Total | 364 (100.0%) | 6 (100.0%) |
Household Income by Mortgage Status in Jemez Pueblo
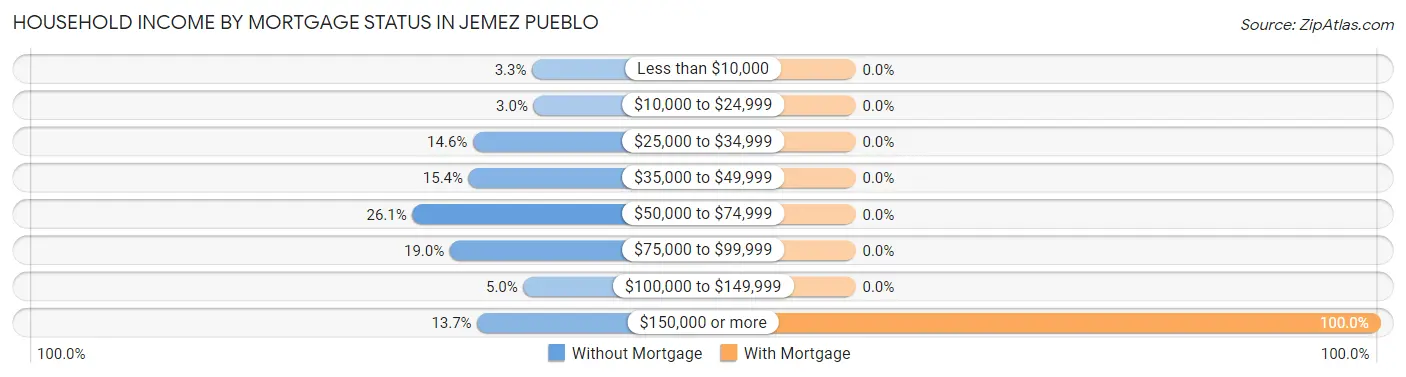
| Household Income | Without Mortgage | With Mortgage |
| Less than $10,000 | 12 (3.3%) | 0 (0.0%) |
| $10,000 to $24,999 | 11 (3.0%) | 0 (0.0%) |
| $25,000 to $34,999 | 53 (14.6%) | 0 (0.0%) |
| $35,000 to $49,999 | 56 (15.4%) | 0 (0.0%) |
| $50,000 to $74,999 | 95 (26.1%) | 0 (0.0%) |
| $75,000 to $99,999 | 69 (19.0%) | 0 (0.0%) |
| $100,000 to $149,999 | 18 (5.0%) | 0 (0.0%) |
| $150,000 or more | 50 (13.7%) | 6 (100.0%) |
| Total | 364 (100.0%) | 6 (100.0%) |
Property Value to Household Income Ratio in Jemez Pueblo
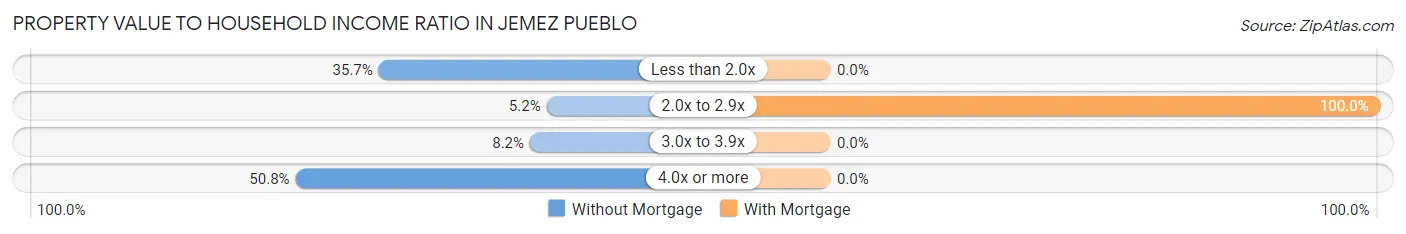
| Value-to-Income Ratio | Without Mortgage | With Mortgage |
| Less than 2.0x | 130 (35.7%) | 0 (0.0%) |
| 2.0x to 2.9x | 19 (5.2%) | 6 (100.0%) |
| 3.0x to 3.9x | 30 (8.2%) | 0 (0.0%) |
| 4.0x or more | 185 (50.8%) | 0 (0.0%) |
| Total | 364 (100.0%) | 6 (100.0%) |
Real Estate Taxes by Mortgage Status in Jemez Pueblo
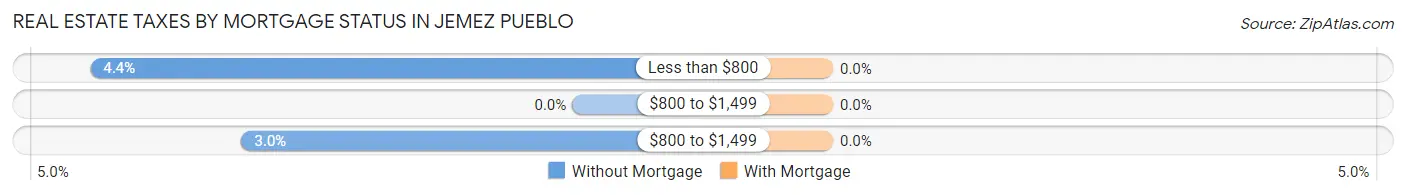
| Property Taxes | Without Mortgage | With Mortgage |
| Less than $800 | 16 (4.4%) | 0 (0.0%) |
| $800 to $1,499 | 0 (0.0%) | 0 (0.0%) |
| $800 to $1,499 | 11 (3.0%) | 0 (0.0%) |
| Total | 364 (100.0%) | 6 (100.0%) |
Health & Disability in Jemez Pueblo
Health Insurance Coverage by Age in Jemez Pueblo
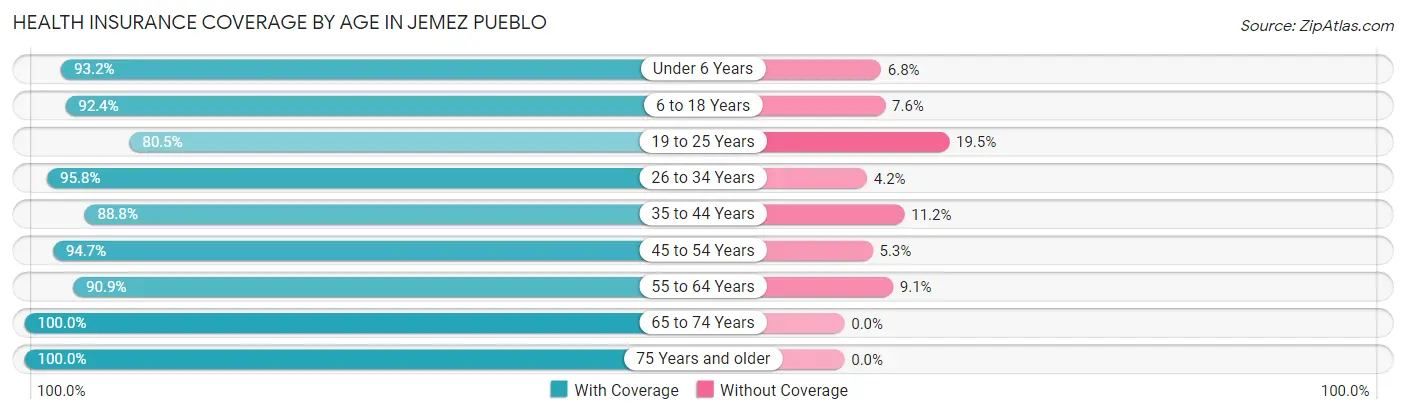
| Age Bracket | With Coverage | Without Coverage |
| Under 6 Years | 164 (93.2%) | 12 (6.8%) |
| 6 to 18 Years | 522 (92.4%) | 43 (7.6%) |
| 19 to 25 Years | 103 (80.5%) | 25 (19.5%) |
| 26 to 34 Years | 228 (95.8%) | 10 (4.2%) |
| 35 to 44 Years | 238 (88.8%) | 30 (11.2%) |
| 45 to 54 Years | 144 (94.7%) | 8 (5.3%) |
| 55 to 64 Years | 261 (90.9%) | 26 (9.1%) |
| 65 to 74 Years | 192 (100.0%) | 0 (0.0%) |
| 75 Years and older | 64 (100.0%) | 0 (0.0%) |
| Total | 1,916 (92.6%) | 154 (7.4%) |
Health Insurance Coverage by Citizenship Status in Jemez Pueblo
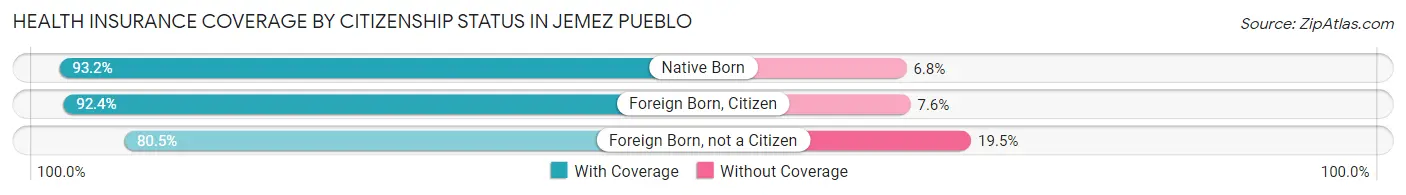
| Citizenship Status | With Coverage | Without Coverage |
| Native Born | 164 (93.2%) | 12 (6.8%) |
| Foreign Born, Citizen | 522 (92.4%) | 43 (7.6%) |
| Foreign Born, not a Citizen | 103 (80.5%) | 25 (19.5%) |
Health Insurance Coverage by Household Income in Jemez Pueblo
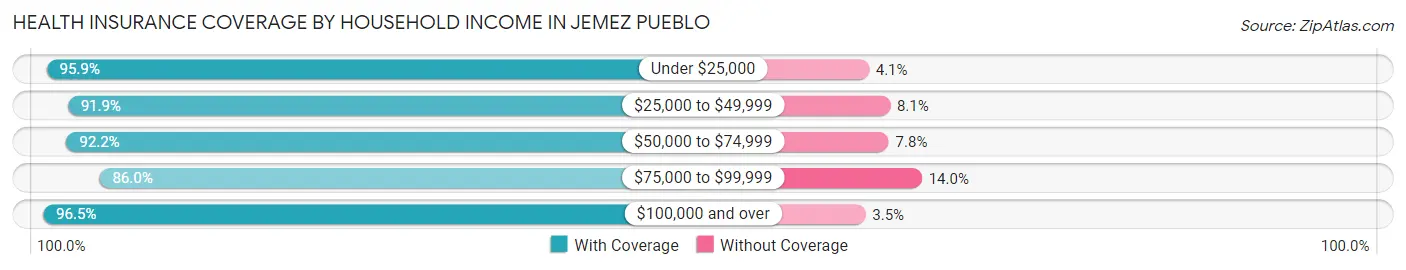
| Household Income | With Coverage | Without Coverage |
| Under $25,000 | 163 (95.9%) | 7 (4.1%) |
| $25,000 to $49,999 | 683 (91.9%) | 60 (8.1%) |
| $50,000 to $74,999 | 341 (92.2%) | 29 (7.8%) |
| $75,000 to $99,999 | 251 (86.0%) | 41 (14.0%) |
| $100,000 and over | 472 (96.5%) | 17 (3.5%) |
Public vs Private Health Insurance Coverage by Age in Jemez Pueblo
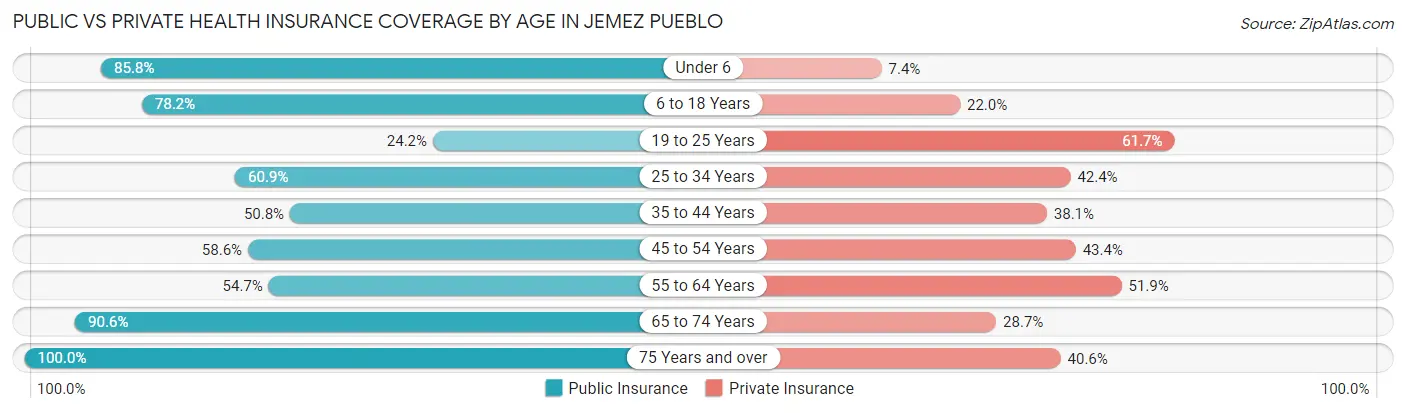
| Age Bracket | Public Insurance | Private Insurance |
| Under 6 | 151 (85.8%) | 13 (7.4%) |
| 6 to 18 Years | 442 (78.2%) | 124 (22.0%) |
| 19 to 25 Years | 31 (24.2%) | 79 (61.7%) |
| 25 to 34 Years | 145 (60.9%) | 101 (42.4%) |
| 35 to 44 Years | 136 (50.7%) | 102 (38.1%) |
| 45 to 54 Years | 89 (58.6%) | 66 (43.4%) |
| 55 to 64 Years | 157 (54.7%) | 149 (51.9%) |
| 65 to 74 Years | 174 (90.6%) | 55 (28.6%) |
| 75 Years and over | 64 (100.0%) | 26 (40.6%) |
| Total | 1,389 (67.1%) | 715 (34.5%) |
Disability Status by Sex by Age in Jemez Pueblo
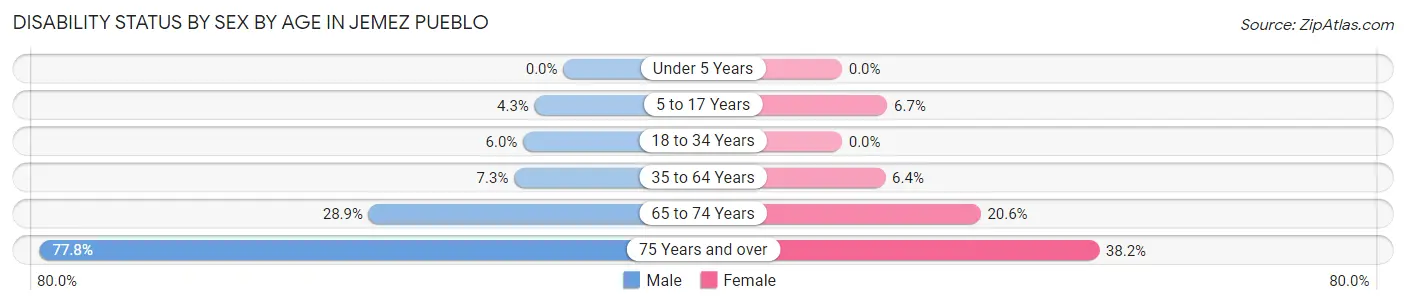
| Age Bracket | Male | Female |
| Under 5 Years | 0 (0.0%) | 0 (0.0%) |
| 5 to 17 Years | 8 (4.3%) | 26 (6.7%) |
| 18 to 34 Years | 12 (6.0%) | 0 (0.0%) |
| 35 to 64 Years | 21 (7.3%) | 27 (6.4%) |
| 65 to 74 Years | 26 (28.9%) | 21 (20.6%) |
| 75 Years and over | 7 (77.8%) | 21 (38.2%) |
Disability Class by Sex by Age in Jemez Pueblo
Disability Class: Hearing Difficulty
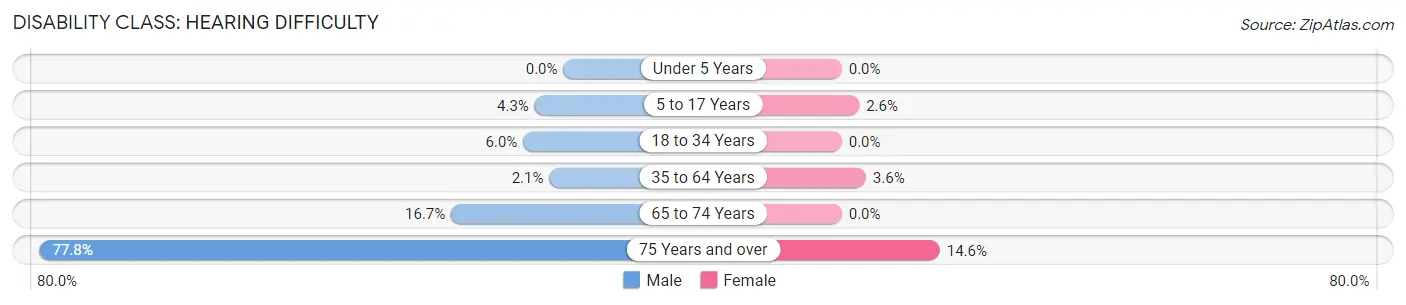
| Age Bracket | Male | Female |
| Under 5 Years | 0 (0.0%) | 0 (0.0%) |
| 5 to 17 Years | 8 (4.3%) | 10 (2.6%) |
| 18 to 34 Years | 12 (6.0%) | 0 (0.0%) |
| 35 to 64 Years | 6 (2.1%) | 15 (3.6%) |
| 65 to 74 Years | 15 (16.7%) | 0 (0.0%) |
| 75 Years and over | 7 (77.8%) | 8 (14.5%) |
Disability Class: Vision Difficulty
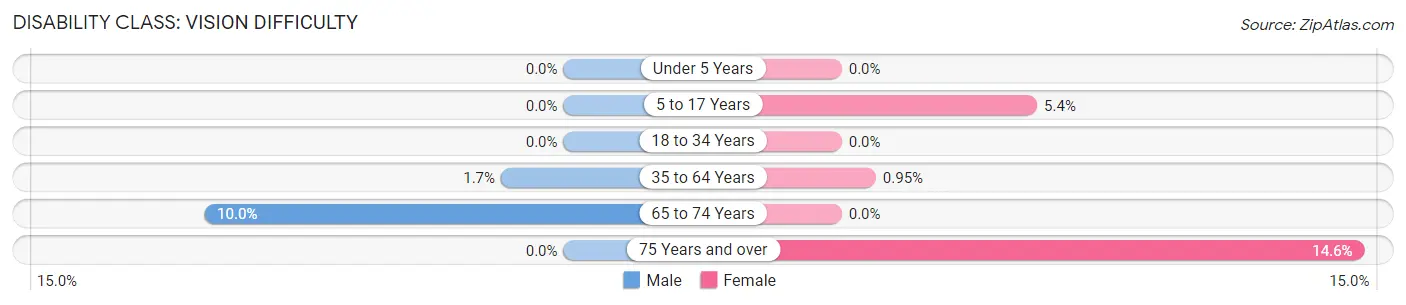
| Age Bracket | Male | Female |
| Under 5 Years | 0 (0.0%) | 0 (0.0%) |
| 5 to 17 Years | 0 (0.0%) | 21 (5.4%) |
| 18 to 34 Years | 0 (0.0%) | 0 (0.0%) |
| 35 to 64 Years | 5 (1.7%) | 4 (0.9%) |
| 65 to 74 Years | 9 (10.0%) | 0 (0.0%) |
| 75 Years and over | 0 (0.0%) | 8 (14.5%) |
Disability Class: Cognitive Difficulty
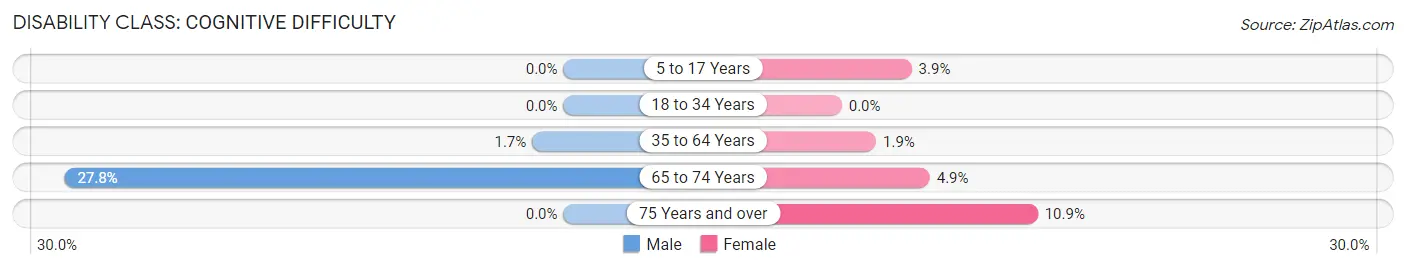
| Age Bracket | Male | Female |
| 5 to 17 Years | 0 (0.0%) | 15 (3.9%) |
| 18 to 34 Years | 0 (0.0%) | 0 (0.0%) |
| 35 to 64 Years | 5 (1.7%) | 8 (1.9%) |
| 65 to 74 Years | 25 (27.8%) | 5 (4.9%) |
| 75 Years and over | 0 (0.0%) | 6 (10.9%) |
Disability Class: Ambulatory Difficulty
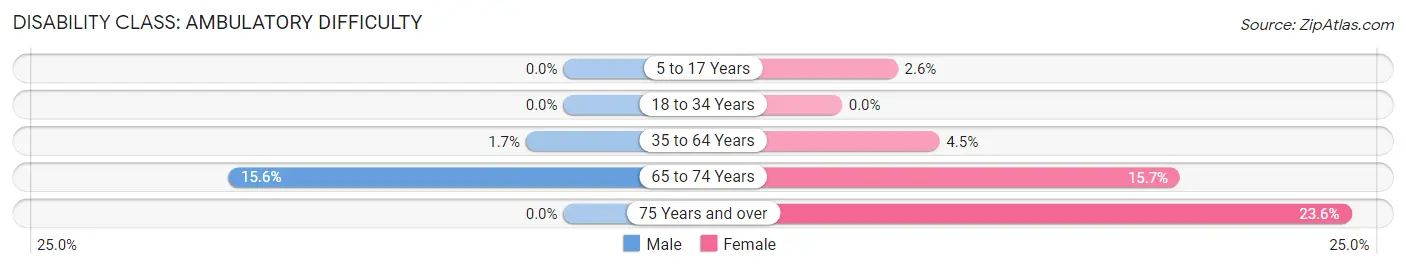
| Age Bracket | Male | Female |
| 5 to 17 Years | 0 (0.0%) | 10 (2.6%) |
| 18 to 34 Years | 0 (0.0%) | 0 (0.0%) |
| 35 to 64 Years | 5 (1.7%) | 19 (4.5%) |
| 65 to 74 Years | 14 (15.6%) | 16 (15.7%) |
| 75 Years and over | 0 (0.0%) | 13 (23.6%) |
Disability Class: Self-Care Difficulty
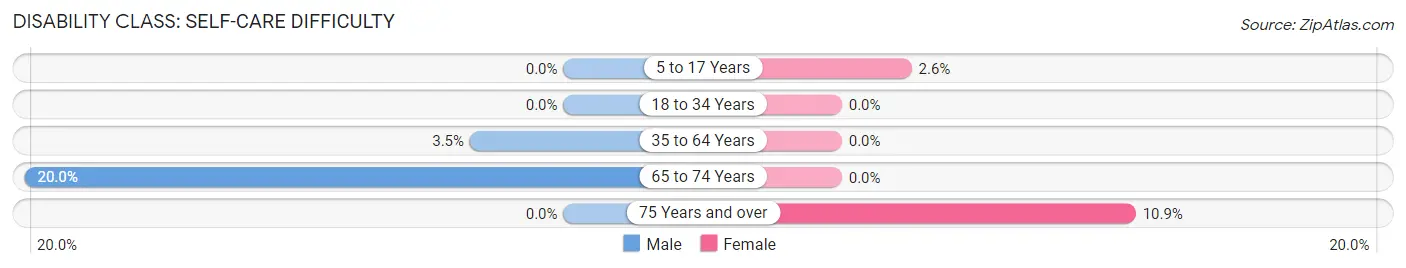
| Age Bracket | Male | Female |
| 5 to 17 Years | 0 (0.0%) | 10 (2.6%) |
| 18 to 34 Years | 0 (0.0%) | 0 (0.0%) |
| 35 to 64 Years | 10 (3.5%) | 0 (0.0%) |
| 65 to 74 Years | 18 (20.0%) | 0 (0.0%) |
| 75 Years and over | 0 (0.0%) | 6 (10.9%) |
Technology Access in Jemez Pueblo
Computing Device Access in Jemez Pueblo
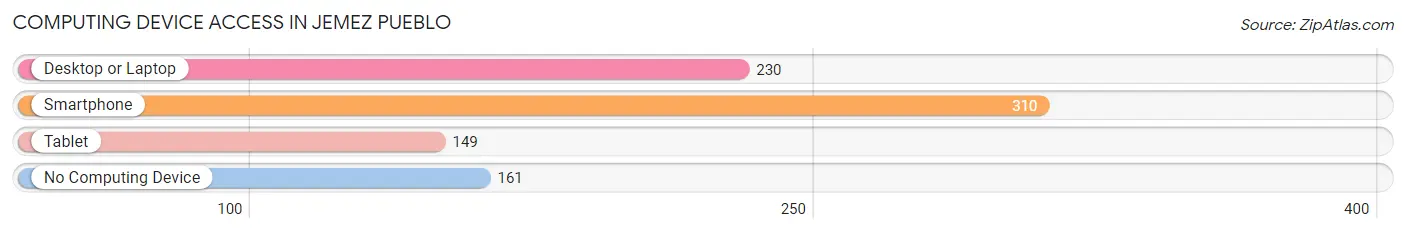
| Device Type | # Households | % Households |
| Desktop or Laptop | 230 | 45.9% |
| Smartphone | 310 | 61.9% |
| Tablet | 149 | 29.7% |
| No Computing Device | 161 | 32.1% |
| Total | 501 | 100.0% |
Internet Access in Jemez Pueblo
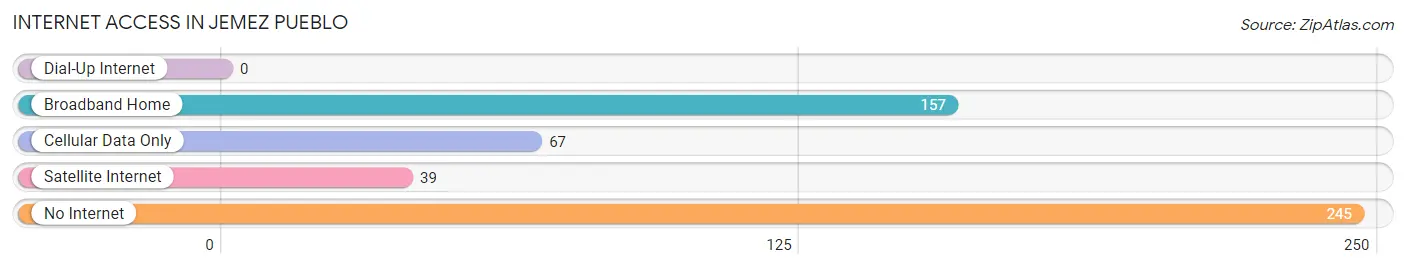
| Internet Type | # Households | % Households |
| Dial-Up Internet | 0 | 0.0% |
| Broadband Home | 157 | 31.3% |
| Cellular Data Only | 67 | 13.4% |
| Satellite Internet | 39 | 7.8% |
| No Internet | 245 | 48.9% |
| Total | 501 | 100.0% |
Jemez Pueblo Summary
Jemez Pueblo is a Native American Pueblo located in the Jemez Mountains of New Mexico. It is one of the 19 Pueblos of New Mexico and is home to the Jemez people, who are part of the Towa-speaking Puebloans. The Pueblo is located in Sandoval County, about 60 miles northwest of Albuquerque.
Geography
Jemez Pueblo is located in the Jemez Mountains of New Mexico, about 60 miles northwest of Albuquerque. The Pueblo is situated at an elevation of 6,000 feet and is surrounded by the Jemez National Forest. The area is characterized by rolling hills, deep canyons, and mesas. The Pueblo is located on the Jemez River, which is a tributary of the Rio Grande.
The climate of Jemez Pueblo is semi-arid, with hot summers and cold winters. The average annual temperature is around 50°F, with temperatures ranging from the low 30s in the winter to the high 90s in the summer. The average annual precipitation is around 12 inches, with most of it falling in the summer months.
History
The Jemez people have lived in the Jemez Mountains for centuries. The Pueblo was first established in the late 1500s, when the Spanish arrived in the area. The Pueblo was initially part of the Spanish mission system, but the Jemez people eventually regained their independence in the late 1700s.
The Jemez people have a long history of resistance to outside forces. In the late 1800s, the US government attempted to forcibly relocate the Jemez people to a reservation in Arizona. The Jemez people resisted this relocation and eventually won the right to remain in their ancestral homeland.
Economy
The economy of Jemez Pueblo is largely based on agriculture and tourism. The Pueblo is home to several farms, which produce a variety of crops, including corn, beans, squash, and melons. The Pueblo also has a number of tourist attractions, including the Jemez Historic Site, which is a National Historic Landmark.
The Pueblo also has a number of businesses, including a casino, a gas station, and a grocery store. The Pueblo also has a number of art galleries and craft stores, which sell traditional Jemez pottery and jewelry.
Demographics
As of the 2010 census, the population of Jemez Pueblo was 1,953. The population is predominantly Native American, with the majority of the population being of Jemez descent. The Pueblo also has a small Hispanic population, as well as a small number of non-Hispanic whites.
The median household income in Jemez Pueblo is $30,000, which is significantly lower than the national median of $50,000. The poverty rate in Jemez Pueblo is also higher than the national average, with nearly 40% of the population living below the poverty line.
Conclusion
Jemez Pueblo is a Native American Pueblo located in the Jemez Mountains of New Mexico. It is home to the Jemez people, who have lived in the area for centuries. The Pueblo is characterized by rolling hills, deep canyons, and mesas, and has a semi-arid climate. The economy of Jemez Pueblo is largely based on agriculture and tourism, and the population is predominantly Native American. The median household income in Jemez Pueblo is significantly lower than the national median, and the poverty rate is also higher than the national average.
Common Questions
What is Per Capita Income in Jemez Pueblo?
Per Capita income in Jemez Pueblo is $23,437.
What is the Median Family Income in Jemez Pueblo?
Median Family Income in Jemez Pueblo is $57,000.
What is the Median Household income in Jemez Pueblo?
Median Household Income in Jemez Pueblo is $56,116.
What is Income or Wage Gap in Jemez Pueblo?
Income or Wage Gap in Jemez Pueblo is 5.5%.
Women in Jemez Pueblo earn 94.5 cents for every dollar earned by a man.
What is Family Income Deficit in Jemez Pueblo?
Family Income Deficit in Jemez Pueblo is $16,113.
Families that are below poverty line in Jemez Pueblo earn $16,113 less on average than the poverty threshold level.
What is Inequality or Gini Index in Jemez Pueblo?
Inequality or Gini Index in Jemez Pueblo is 0.49.
What is the Total Population of Jemez Pueblo?
Total Population of Jemez Pueblo is 2,070.
What is the Total Male Population of Jemez Pueblo?
Total Male Population of Jemez Pueblo is 850.
What is the Total Female Population of Jemez Pueblo?
Total Female Population of Jemez Pueblo is 1,220.
What is the Ratio of Males per 100 Females in Jemez Pueblo?
There are 69.67 Males per 100 Females in Jemez Pueblo.
What is the Ratio of Females per 100 Males in Jemez Pueblo?
There are 143.53 Females per 100 Males in Jemez Pueblo.
What is the Median Population Age in Jemez Pueblo?
Median Population Age in Jemez Pueblo is 31.0 Years.
What is the Average Family Size in Jemez Pueblo
Average Family Size in Jemez Pueblo is 4.4 People.
What is the Average Household Size in Jemez Pueblo
Average Household Size in Jemez Pueblo is 4.1 People.
How Large is the Labor Force in Jemez Pueblo?
There are 900 People in the Labor Forcein in Jemez Pueblo.
What is the Percentage of People in the Labor Force in Jemez Pueblo?
67.0% of People are in the Labor Force in Jemez Pueblo.
What is the Unemployment Rate in Jemez Pueblo?
Unemployment Rate in Jemez Pueblo is 3.7%.